the Creative Commons Attribution 4.0 License.
the Creative Commons Attribution 4.0 License.
 | 30 Oct 2023
Effects of simulated secondary organic aerosol water on PM1 levels and composition over the US
Stylianos Kakavas
Spyros N. Pandis
Athanasios Nenes
Water is a key component of atmospheric aerosol, affecting many aerosol processes including gas-to-particle partitioning of semi-volatile compounds. Water related to secondary organic aerosol (SOAW) is often neglected in atmospheric chemical transport models and is not considered in gas-to-particle partitioning calculations for inorganic species. We use a new inorganic aerosol thermodynamics model, ISORROPIA-lite, which considers the effects of SOAW, to perform chemical transport model simulations for 1 year over the continental United States to quantify its effects on aerosol mass concentration and composition. SOAW can increase average fine aerosol water levels by up to a factor of 2 when secondary organic aerosol (SOA) is a major PM1 component. This is often the case in the south-eastern US, where SOA concentrations are higher. Although the annual average impact of this added water on total dry PM1 concentrations due to increased partitioning of nitrate and ammonium is small (up to 0.1 µg m−3), total dry PM1 increases of up to 2 µg m−3 (with nitrate levels increases of up to 200 %) can occur when RH levels and PM1 concentrations are high.
- Article
(8173 KB) - Full-text XML
-
Supplement
(1707 KB) - BibTeX
- EndNote


Atmospheric particulate matter with aerodynamic diameters smaller than 1 µm (PM1) has adverse effects on public health, climate, and ecosystem productivity (Pye et al., 2020; Baker et al., 2021; Guo et al., 2021). PM1 is composed of thousands of organic compounds, black carbon (BC), and inorganic components such as sulfate (SO, nitrate (NO, ammonium (NH, and chloride (Cl−; Seinfeld and Pandis, 2006). Ambient aerosol is mostly composed of water which is determined by the chemical equilibrium of water vapor with aerosol constituents (Liao and Seinfeld, 2005; Carlton and Turpin, 2013; Bian et al., 2014; Guo et al., 2015, 2017; Bougiatioti et al., 2016; Nguyen et al., 2016; Deetz et al., 2018; Kuang et al., 2018; Song et al., 2018; Wu et al., 2018; Pye et al., 2020; Gopinath et al., 2022). Aerosol liquid water directly affects PM sensitivity and dry deposition rates, with direct implications for emissions control policy (Nenes et al., 2020, 2021; Sun et al., 2021).
The hygroscopicity parameter (κ), which expresses the ability of a PM component to absorb water, is an effective approach for the parameterization of the water uptake of atmospheric PM that is a mixture of organic and inorganic species (Petters and Kreidenweis, 2007). Although organic aerosol (OA) is less hygroscopic than inorganic salts, it can still contribute significantly to total aerosol water (Guo et al., 2015; Bougiatioti et al., 2016; Jathar et al., 2016; Li et al., 2019) or can even become the dominant contributor at lower ambient relative humidity (Jin et al., 2020). Previous studies have demonstrated that secondary organic aerosol (SOA) is much more hygroscopic (0.1 ) than primary organic aerosol (POA; κ≤0.01) and is mainly responsible for the corresponding OA water (Petters et al., 2006; Koehler et al., 2009; Chang et al., 2010; Jathar et al., 2016; Kuang et al., 2020; Li et al., 2020).
SOAW can enhance secondary inorganic aerosol concentrations, assisting in their partitioning in the particulate phase to satisfy equilibrium. However, such effects are not considered in thermodynamic modules used for the simulation of gas-to-particle partitioning of inorganic species in chemical transport models. Evidence exists however that fine aerosol nitrate and ammonium concentrations can increase in areas with high organic aerosol and RH levels (Kakavas et al., 2022). The importance of these SOAW impacts on secondary aerosol formations has not been systematically studied and is the focus of this work.
We use a new aerosol thermodynamics model, ISORROPIA-lite (Kakavas et al., 2022), to simulate SOAW effects on the partitioning of the inorganic components for 1 year over the continental United States. The model performance has been evaluated for fine PM and its components for the examined period by Skyllakou et al. (2021). It is considered good for total PM2.5 concentration and for most of the components. The aim of our work is to quantify the SOAW contribution to the total fine PM water and to study its effects on inorganic aerosol thermodynamics and total dry fine PM levels and composition.
2.1 ISORROPIA-lite
ISORROPIA-lite is a lean and accelerated version of the widely used ISORROPIA-II (Fountoukis and Nenes, 2007) aerosol thermodynamics model and it focuses on the simulation of the composition of the inorganic fraction of the atmospheric aerosol that is in equilibrium with the gas phase. It assumes that the aerosol exists only in the metastable state at low RH, and the activity coefficients of ionic pairs are always obtained from precalculated look-up tables. It estimates aerosol water associated with each one of the aerosol components. Furthermore, ISORROPIA-lite has an important additional feature compared to ISORROPIA-II, as it considers the effects of SOAW on inorganic aerosol thermodynamics. The resulting increase in the total water mass drives more of the water-soluble gaseous species to the particle phase to satisfy equilibrium. SOAW, WSOA in ISORROPIA-lite, is calculated using the well-established κ-Köhler theory of Petters and Kreidenweis (2007):
where ρw is the density of water, ρSOA the SOA density, CSOA the SOA concentration, κ the SOA hygroscopicity parameter, and RH the relative humidity on a 0–1 scale. More details about the ISORROPIA-lite can be found in Kakavas et al. (2022).
2.2 PMCAMx description and application
PMCAMx (Karydis et al., 2010; Tsimpidi et al., 2010) is a three-dimensional chemical transport model based on CAMx (Environ, 2006), which simulates horizontal and vertical advection and dispersion, dry and wet deposition, and aqueous, gas, and aerosol chemistry. The mechanism used in this work for gas-phase chemistry simulations is the Carbon Bond 5 chemistry scheme (CB05; Yarwood et al., 2005), which includes 190 reactions of 79 gas species. To describe the aerosol size and composition distribution, 10 size sections (from 40 nm to 40 µm) are used, assuming that all particles in each size bin have the same composition. Therefore, PMCAMx predicts PMx concentrations where x can be, among other choices, 1, 2.5, and 10 µm. Equilibrium is always assumed between the bulk aerosol and gas phases. The partitioning of semi-volatile inorganic species between the gas and particulate phases is simulated by ISORROPIA-lite. Weighting factors based on the effective surface area of each size bin are used to distribute to the various size bins the mass transferred between the two phases in each time step (Pandis et al., 1993). For the simulation of organic aerosols, the volatility basis set (VBS) approach (Donahue et al., 2006) is used. POA is simulated using eight volatility bins (from 10−1 to 106 µg m−3) at 298 K, while for SOA four volatility bins (1, 10, 102, and 103 µg m−3) at 298 K are used (Murphy and Pandis, 2009). An organic aerosol phase is assumed with its components forming a pseudo-ideal solution and being in equilibrium with the gas phase (Strader et al., 1998). The influence of water on the partitioning of the organic components of the particulate matter between the gas and aerosol phases is assumed to be negligible in this version of PMCAMx (Koo et al., 2003). Low-volatility organic compounds (LVOCs) and extremely LVOCs are implicitly included in the lowest volatility bin of this version of the VBS used in PMCAMx. These compounds are always in the particulate phase in these simulations, and therefore the addition of lower bins increases the computational cost without changing the predicted organic aerosol concentration. For the major point sources, the NOx plumes are simulated using the plume-in-grid (PiG) approach (Karamchandani et al., 2011; Zakoura and Pandis, 2019). The variable size resolution model (VSRM) of Fahey and Pandis (2001) is used for the simulation of the aqueous phase. The model is based on the chemical mechanism of Pandis and Seinfeld (1989) with the addition of Ca2+ to the list of particle components as well as H2SO4 in the gas phase (Fahey and Pandis, 2001).
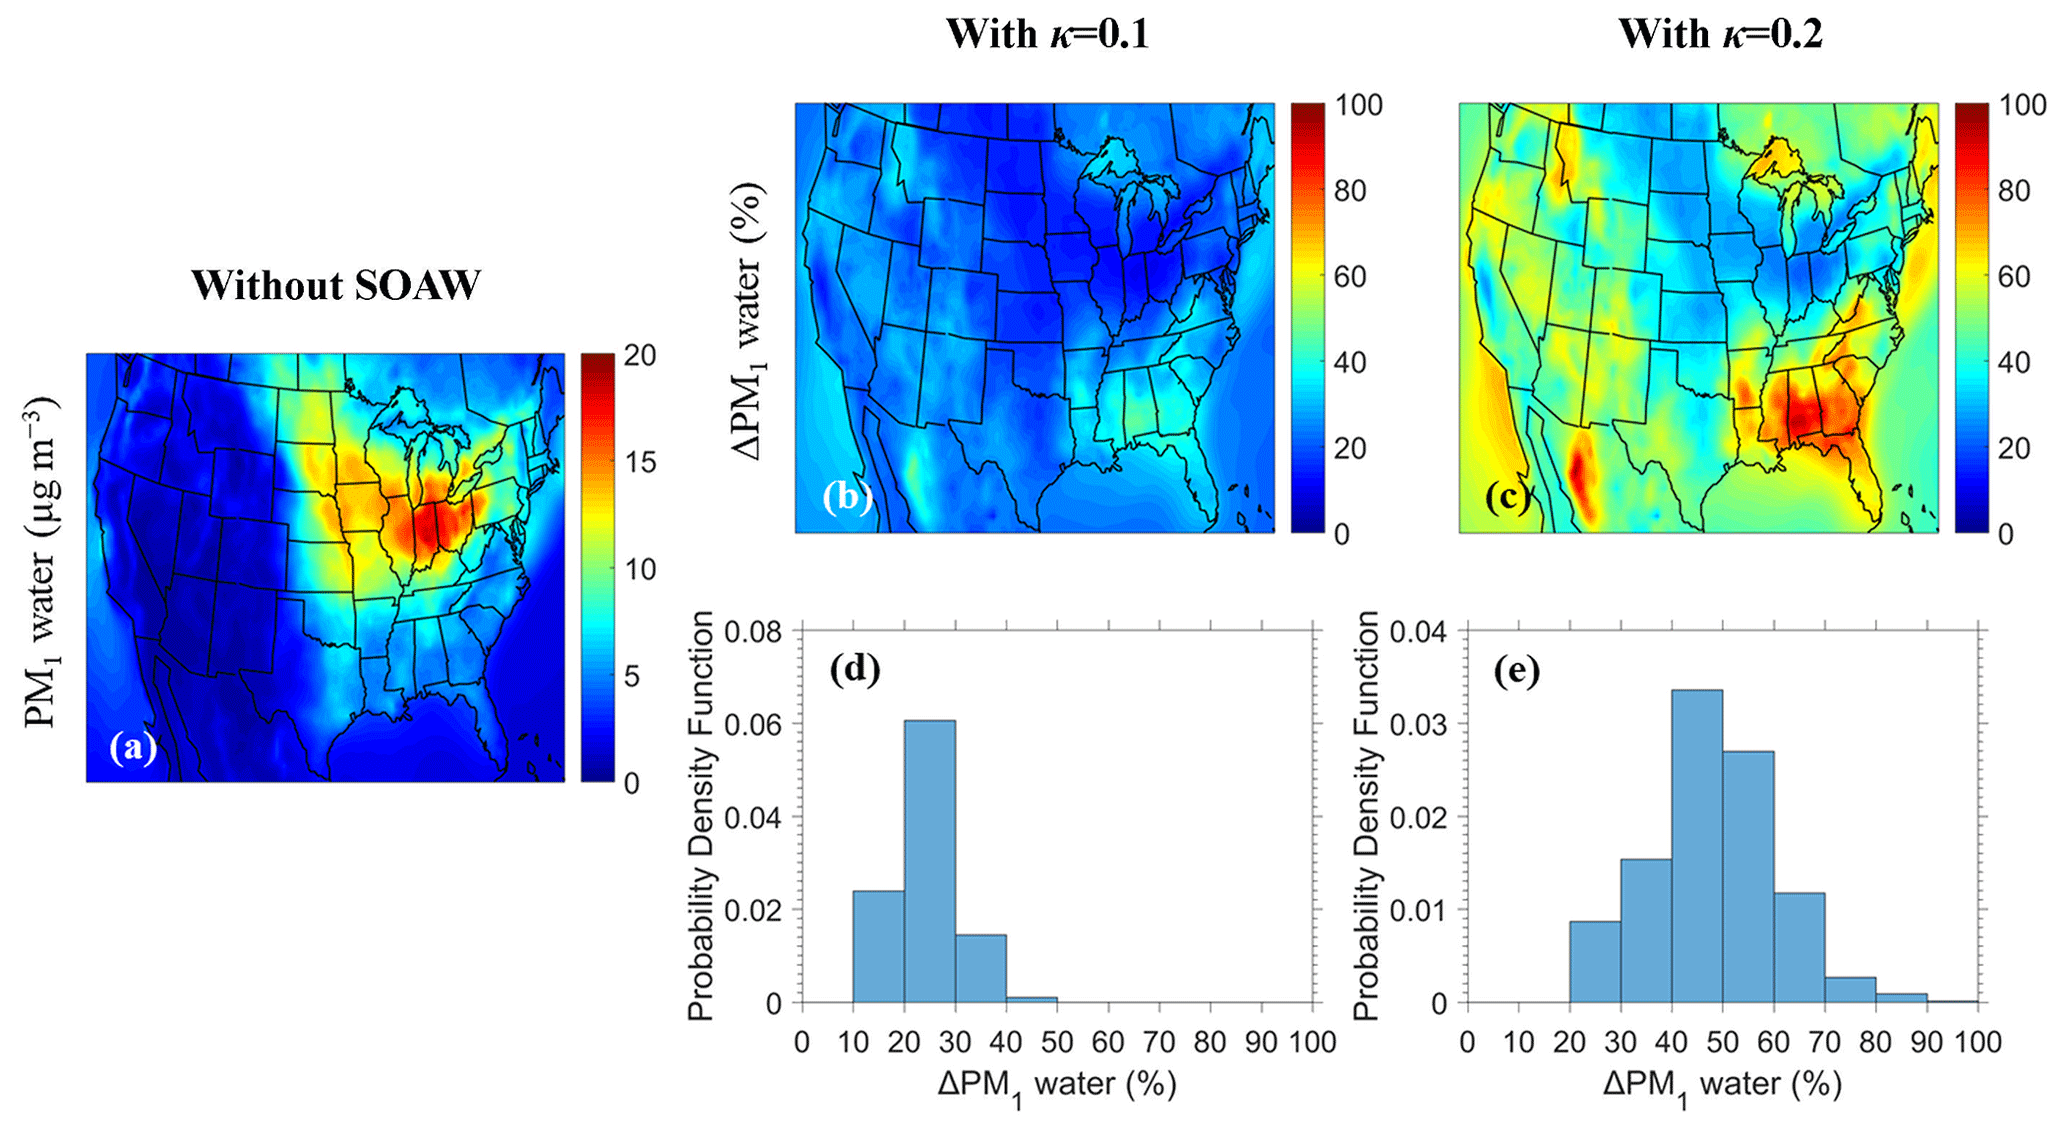
Figure 1Maps of (a) annual average PM1 water ground-level concentrations without SOAW and annual average fractional increase in PM1 water when SOAW is present in the simulations when (b) κ=0.1 and (c) κ=0.2 during 2010. The probability density as a function of fractional increase in the annual PM1 water concentrations due to SOAW when (d) κ=0.1 and (e) κ=0.2 is shown.
We applied PMCAMx over the continental United States during 2010. The modelling domain includes northern Mexico and southern Canada and covers a 4752×2952 km region (Fig. S1 in the Supplement). The model grid consists of 10 824 cells with horizontal dimensions of 36×36 km. The meteorological inputs were provided by the Weather Research Forecasting model (WRF v3.6.1) using a horizontal resolution of 12×12 km. RH levels above 95 % were rare; therefore, there was no need to screen the few high-RH values outside clouds. The gaseous and primary particle emissions were developed by Xing et al. (2013). More details about the meteorological inputs and the emissions can be found in Skyllakou et al. (2021).
To quantify the SOAW effects on inorganic aerosol thermodynamics, three simulations were performed. The first was a simulation neglecting SOAW and including only inorganic aerosol water. Two additional simulations were performed: one where κ of SOA was assumed to be equal to 0.1 and one with κ=0.2 (Kuang et al., 2020) to examine how SOA hygroscopicity affects total fine aerosol water content and PM levels and composition. Even if greater values of the hygroscopicity parameter (e.g. κ=0.3) are possible (Kuang et al., 2020), these represent rather extreme cases for the simulation of average effects over the US. Therefore, the two simulations used in this study provide a good estimate of the corresponding uncertainty. Previous studies have estimated secondary organic aerosol density values of 1–1.4 g cm−3 (Turpin and Lim, 2001; Kostenidou et al., 2007). An SOA density of 1 g cm−3 was assumed in the simulations. SOA exists mostly in submicrometer particles, so our subsequent study focuses on PM1.
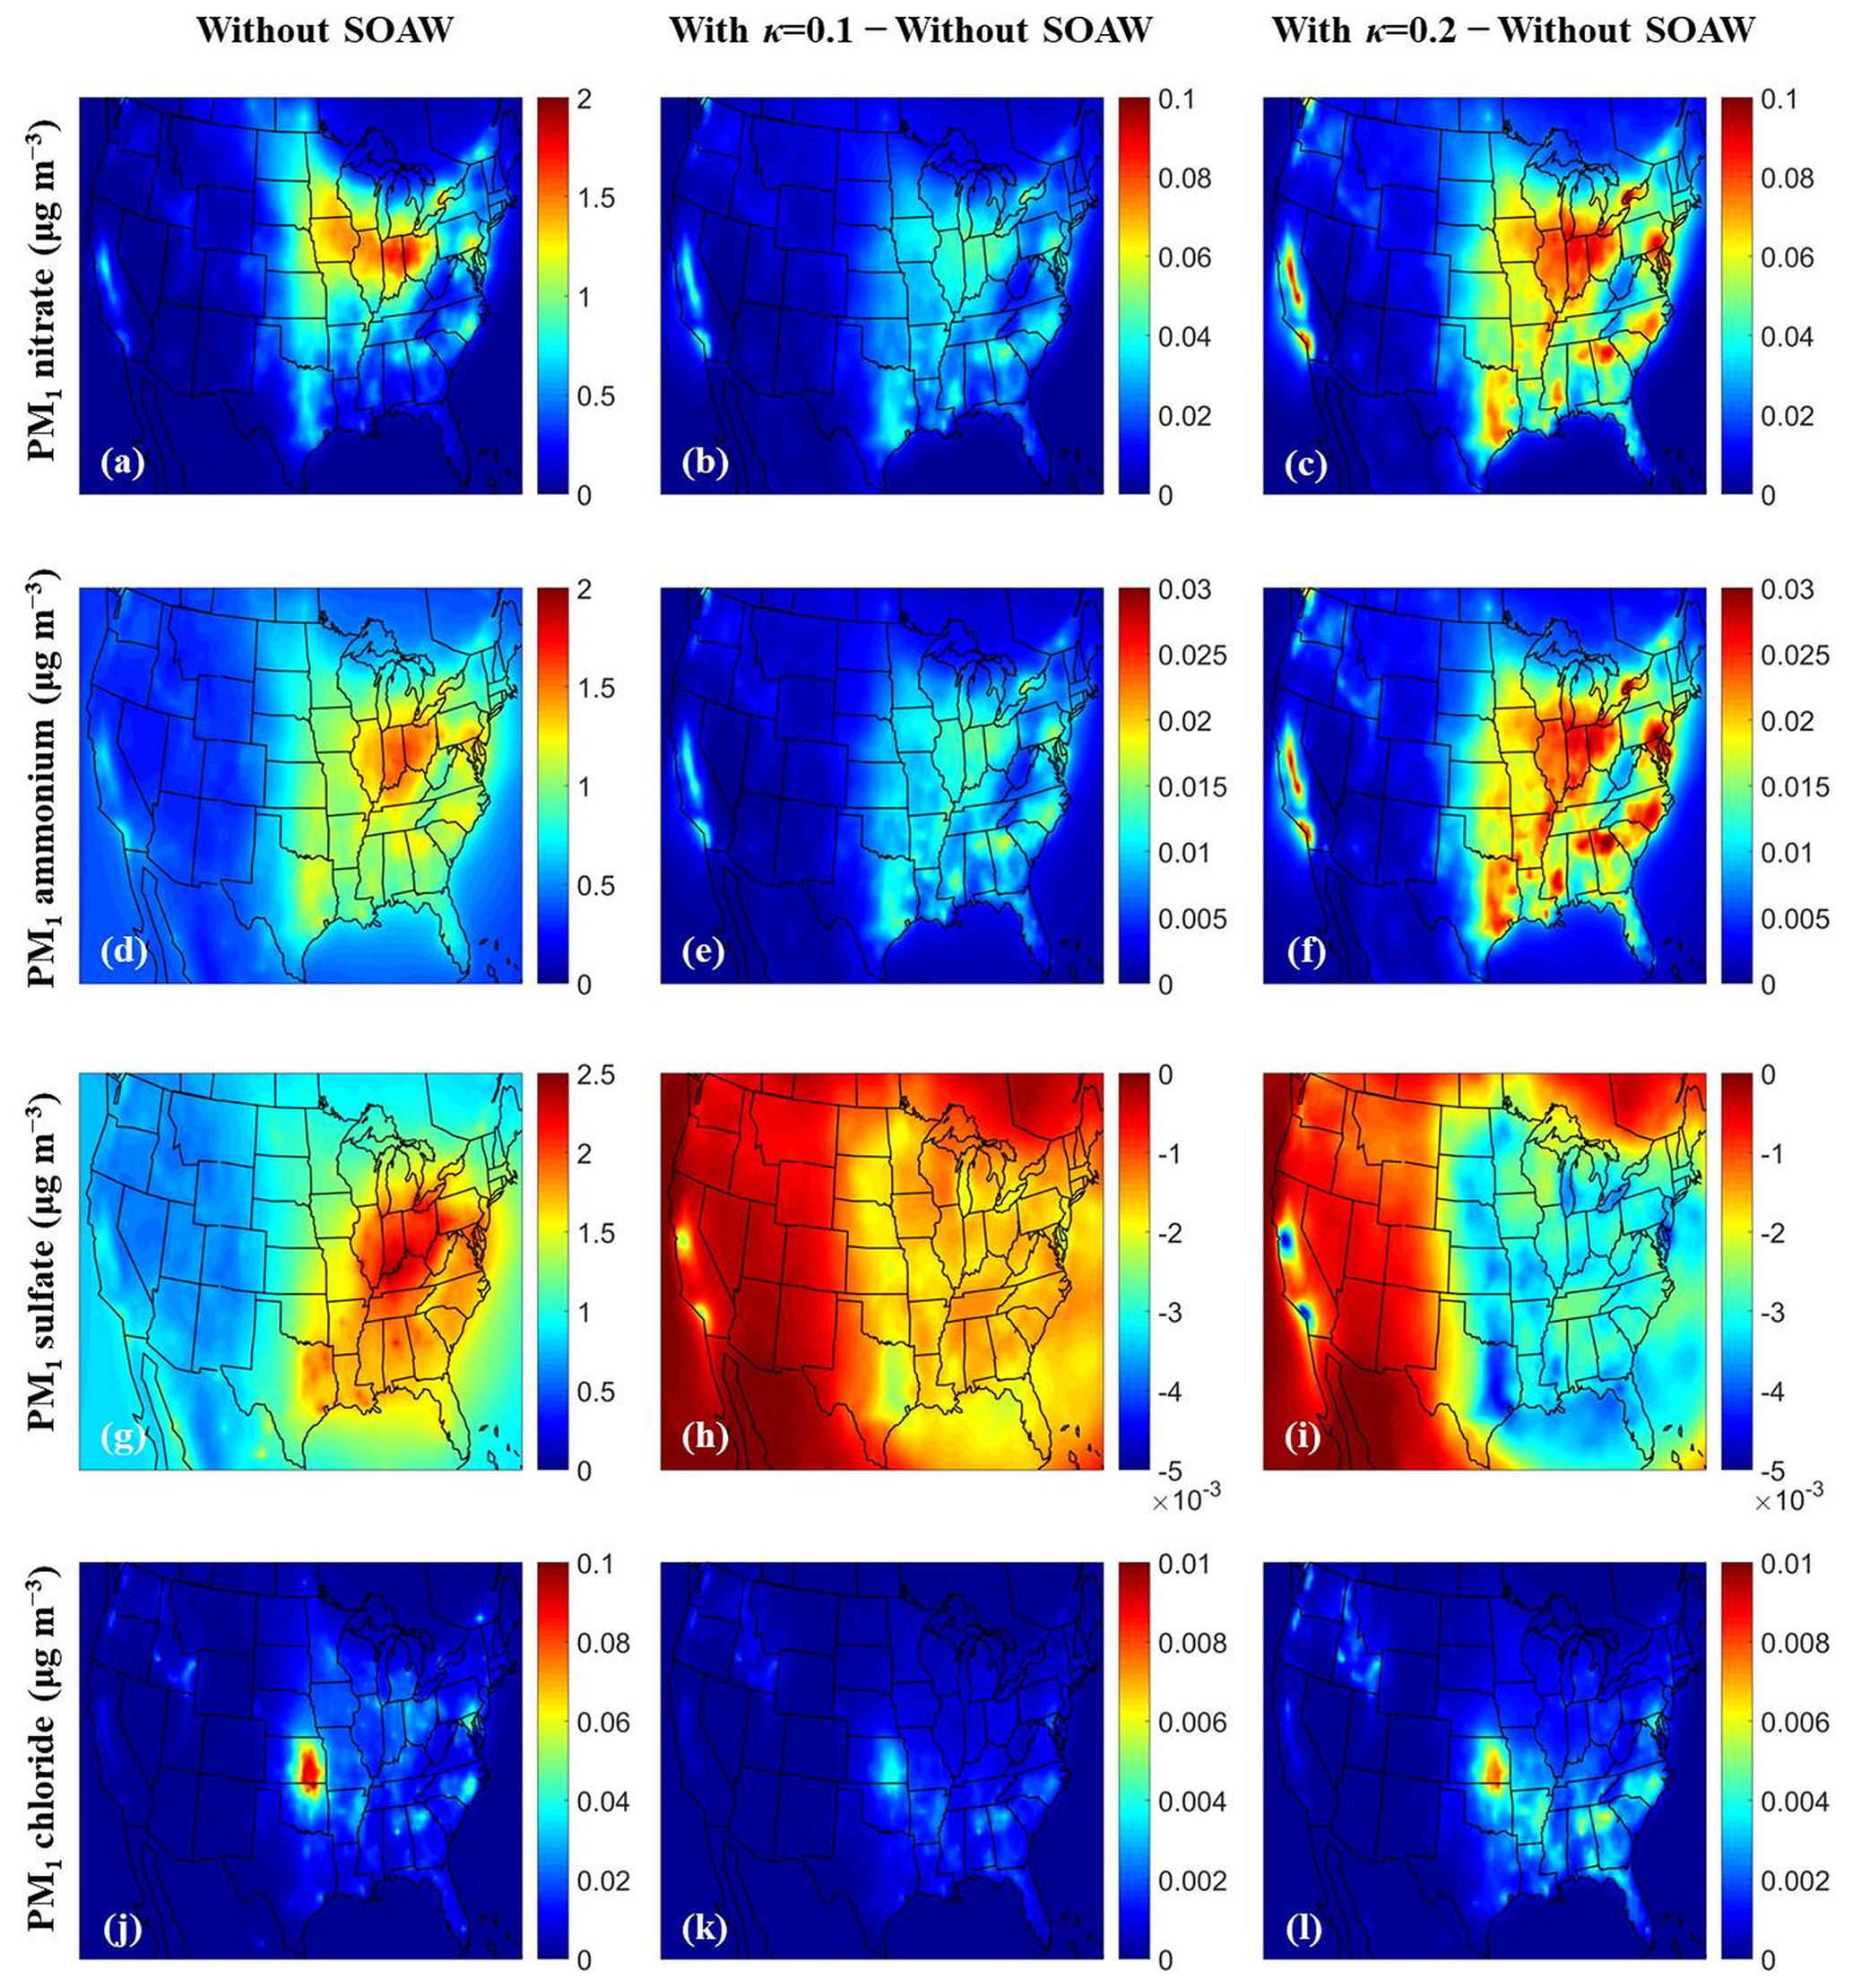
Figure 2Annual average ground-level concentrations (in µg m−3) of PM1: (a), (b), (c) nitrate; (d), (e), (f) ammonium; (g), (h), (i) sulfate; and (j), (k), (l) chloride neglecting SOAW and the annual concentration changes when SOAW is present in the simulations when κ=0.1 and κ=0.2. A positive change corresponds to an increase. A negative change corresponds to a decrease.
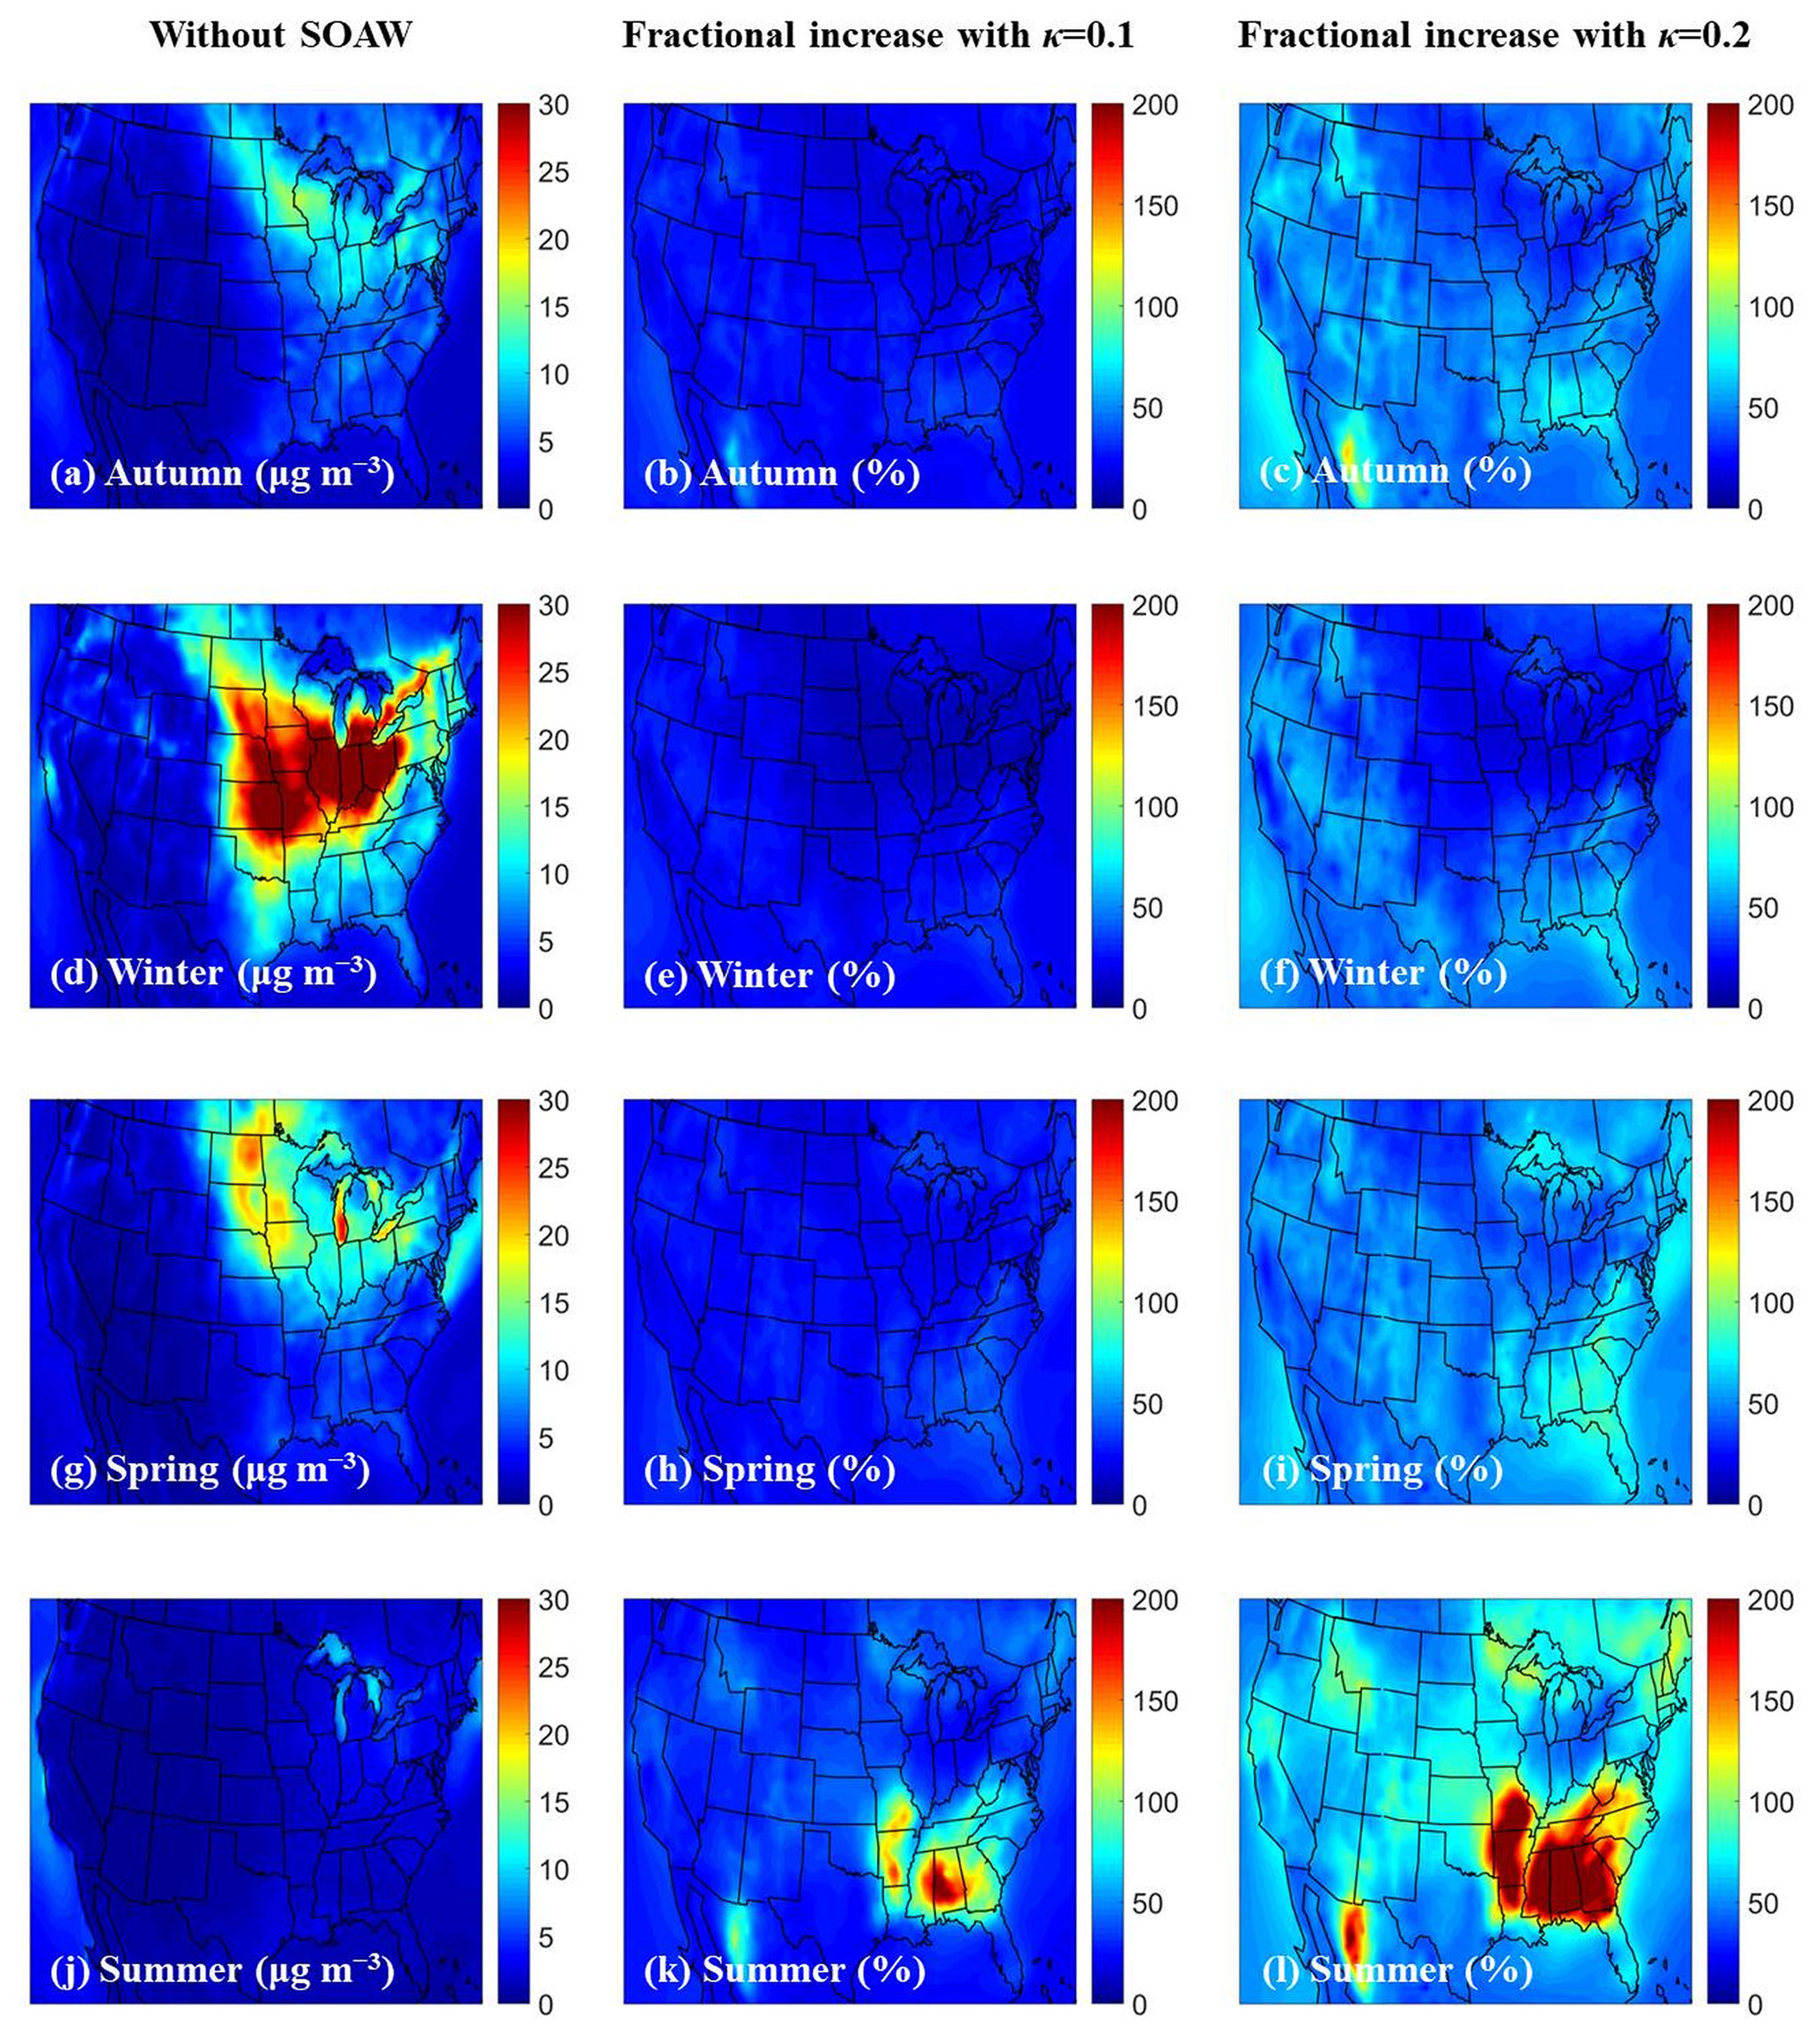
Figure 3Average ground-level concentrations of PM1 water neglecting SOAW (in µg m−3) and the fractional increase when SOAW is present in the simulations when κ=0.1 and κ=0.2 during (a), (b), (c) autumn (SON); (d), (e), (f) winter (DJF); (g), (h), (i) spring (MAM); and (j), (k), (l) summer (JJA) of 2010.
3.1 Effects of SOAW on PM1 water levels
The annual average PM1 water ground-level concentrations neglecting SOAW are shown in Fig. 1. Higher PM1 water concentrations from 8 to 18 µg m−3 are predicted in the north-eastern part of the US due to the higher inorganic PM1 concentrations (Fig. 2) and RH levels in that area. When SOAW is present in the simulations, total PM1 water levels increase everywhere, with greater fractional increases in the south-eastern US (by up to 50 % when κ=0.1 and by up to 100 % when κ=0.2 in Alabama and north-western Mexico) due to higher SOA levels (Fig. S2). In the north-eastern US, lower fractional increases are predicted (10 %–15 % when κ=0.1 and 20 %–30 % when κ=0.2). In general, assuming a κ of SOA equal to 0.2 instead of 0.1 increases the corresponding amount of SOAW by about a factor of 2. Figure 1 shows the distributions of fractional increase change in the annual PM1 water levels at ground level from SOAW. Total PM1 water average concentrations increase from 20 % to 30 % in about 60 % of the modelling domain when κ=0.1. For κ=0.2, the corresponding increase is from 40 % to 60 %.
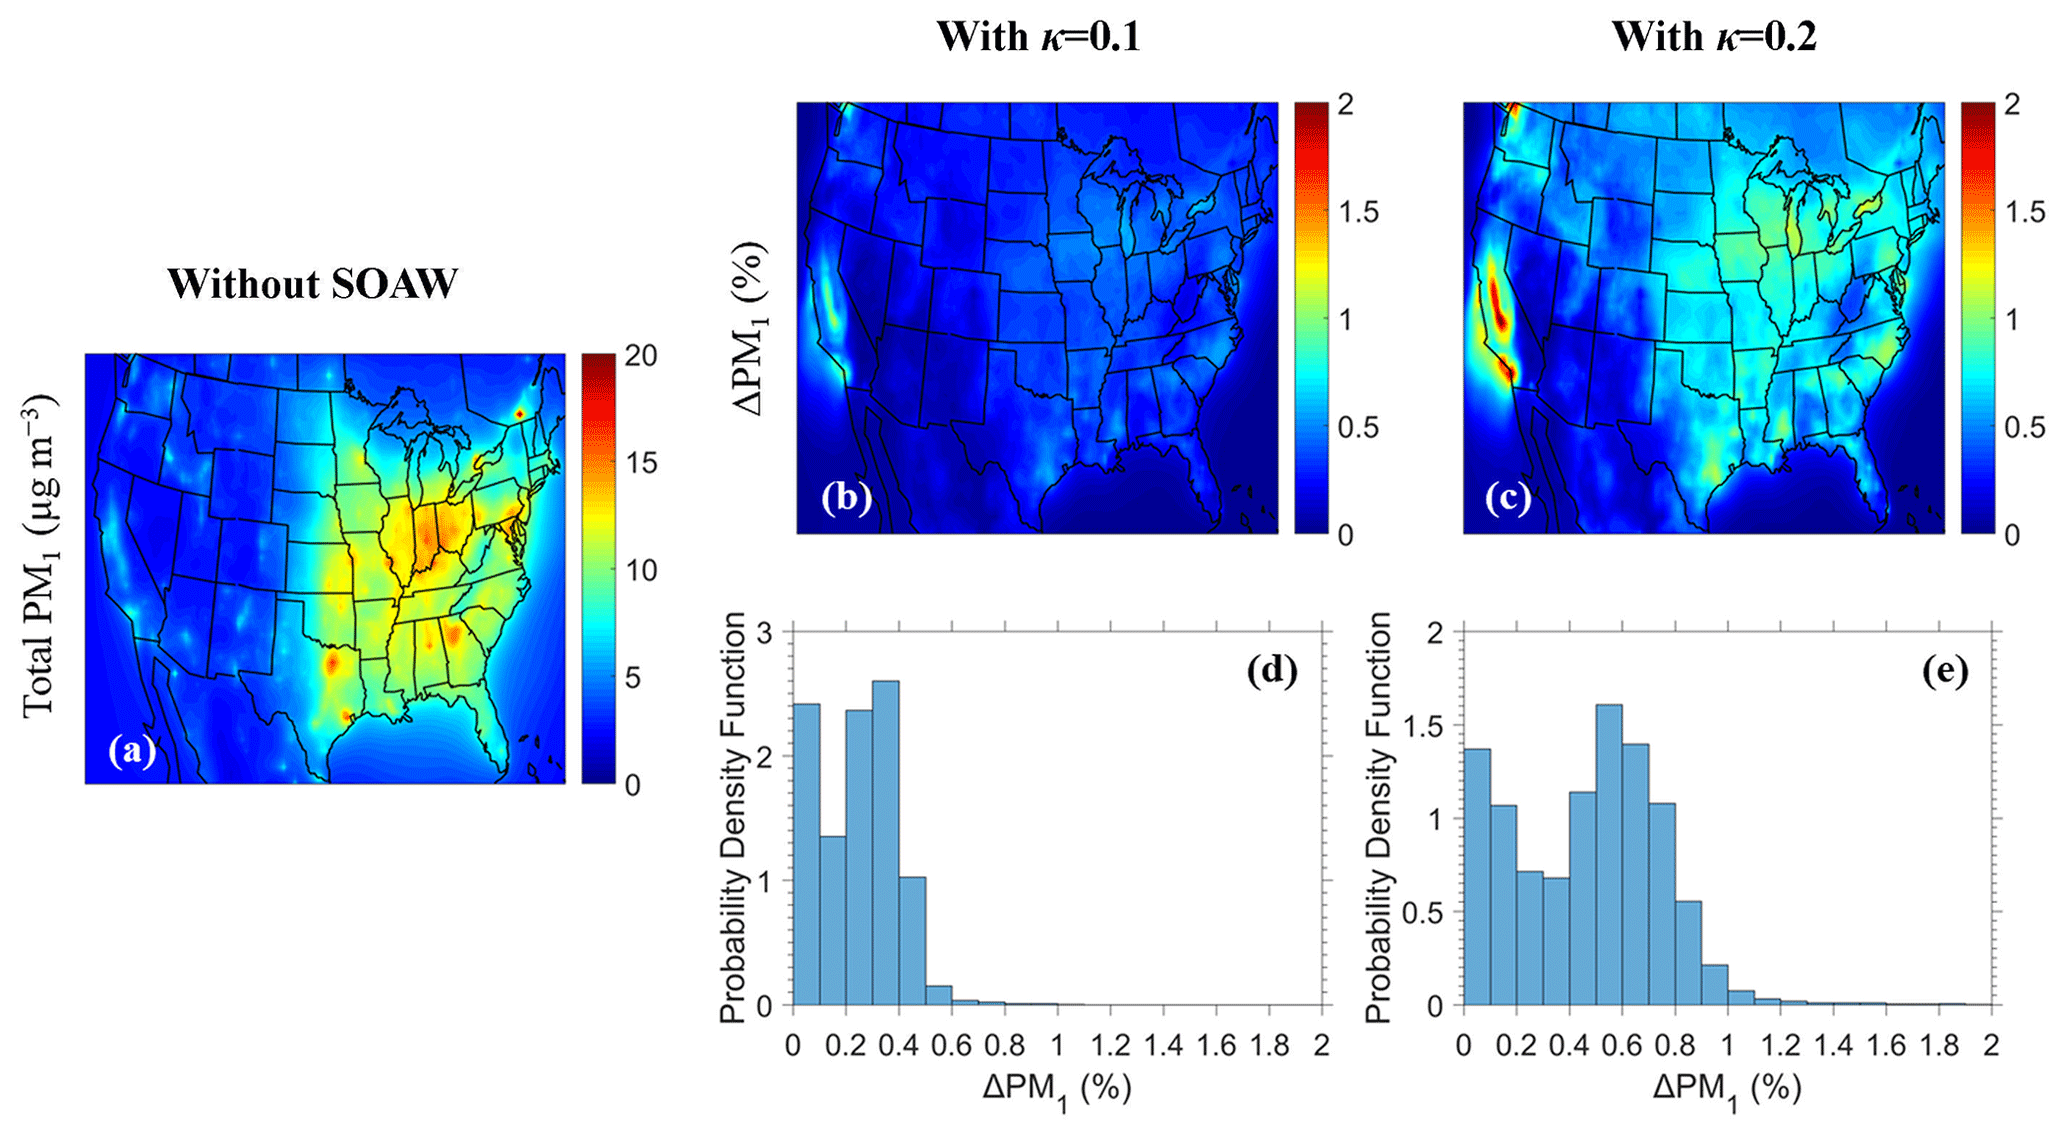
Figure 4Maps of (a) annual average total dry PM1 ground-level concentrations neglecting SOAW and annual average fractional increase in total dry PM1 when SOAW is present in the simulations where (b) κ=0.1 and (c) κ=0.2 during 2010. The probability density as a function of fractional increase in the annual total dry PM1 concentrations due to SOAW when (d) κ=0.1 and (e) κ=0.2 is shown.
Predicted SOA levels are higher during summertime (Fig. S2) since the emissions and oxidation rates of volatile organic compounds (VOCs) are higher (Zhang et al., 2013; Freney et al., 2014; Skyllakou et al., 2014; Fountoukis et al., 2016). However, even during wintertime, fresh biomass burning emissions exposed to NO2 and O3 can form significant amounts of SOA in periods with low OH levels (Kodros et al., 2020). Higher total PM1 water concentrations are predicted during winter (Fig. 3) since the RH levels and inorganic fine aerosol concentrations are higher, especially nitrate and chloride, which increasingly partition to the aerosol phase as temperature decreases (Guo et al., 2017). However, PM1 chloride concentrations are low (less than 0.1 µg m−3) with higher concentrations in Kansas because of biomass burning episodes. Higher fractional increases in fine aerosol water levels (up to 5 times) due to SOAW are predicted during summer in the south-eastern part of US, where SOA concentrations are higher. This corresponds to increases in average fine aerosol water concentrations of up to 8 µg m−3.
Ammonium nitrate and ammonium sulfate are the inorganic salts that contribute the most to the total PM1 water levels (Fig. S3). SOAW also contributes significantly to total PM1 water levels, especially in the south-eastern US (about 30 % and 50 % of total PM1 water when κ=0.1 and κ=0.2 respectively), when the mass fraction of SOA in dry PM1 exceeds 30 %.
3.2 Effects of SOAW on total dry PM1 levels
Higher dry PM1 concentrations are predicted for the eastern part of the US (up to 15 µg m−3) in the base case (Fig. 4). These dry PM1 levels increase slightly by up to 0.6 % and 1.2 % due to SOAW when κ=0.1 and κ=0.2 for SOA is assumed respectively. The greatest annual average fractional increase in total dry PM1 levels is predicted in California (1 % when κ=0.1 and 2 % when κ=0.2). The probability density (Fig. 4) indicates that in about 60 % of the modelling domain, total dry fine aerosol concentrations increase of up to 0.3 % when κ=0.1. For κ=0.2, the corresponding increase is from 0.4 % to 2 %. The areas of the greatest PM1 increase correspond to regions where aerosol pH tends to be relatively high (Pye et al., 2020). In these areas, nitric acid and ammonia can condense and increase aerosol mass because of the increase in water from the SOA. Because of this partitioning change, the predicted gas-phase concentrations of semi-volatile inorganic components decreased on average when SOAW was considered (Fig. S4). SOAW had a negligible absolute impact on the low fine chloride concentrations in this period (Fig. 2). However, in periods during which chloride salts and SOA contribute significantly (e.g. during intense biomass burning periods), fine chloride concentrations could also change (Metzger et al., 2006; Fountoukis et al., 2009; Gunthe et al., 2021).
Skyllakou et al. (2021) found that PMCAMx had a small fractional bias (5 %) and a fractional error (25 %) for the annual average PM2.5 concentrations of 1067 measurements stations in the US. The performance of PMCAMx regarding annual average OA is considered good in these simulations, with a fractional bias of 5 % and a fractional error of 26 % in the 306 stations in the US. For daily average concentrations, the performance is also quite encouraging, with a fractional bias of 15 % and a fractional error of 56 %. Given that the effect of the extension of the model on the total fine PM mass is small (of the order of 1 %), this does not result in any noticeable change in its already very good performance for dry fine PM. Therefore, the major change in the model predictions is in the aerosol water concentrations.
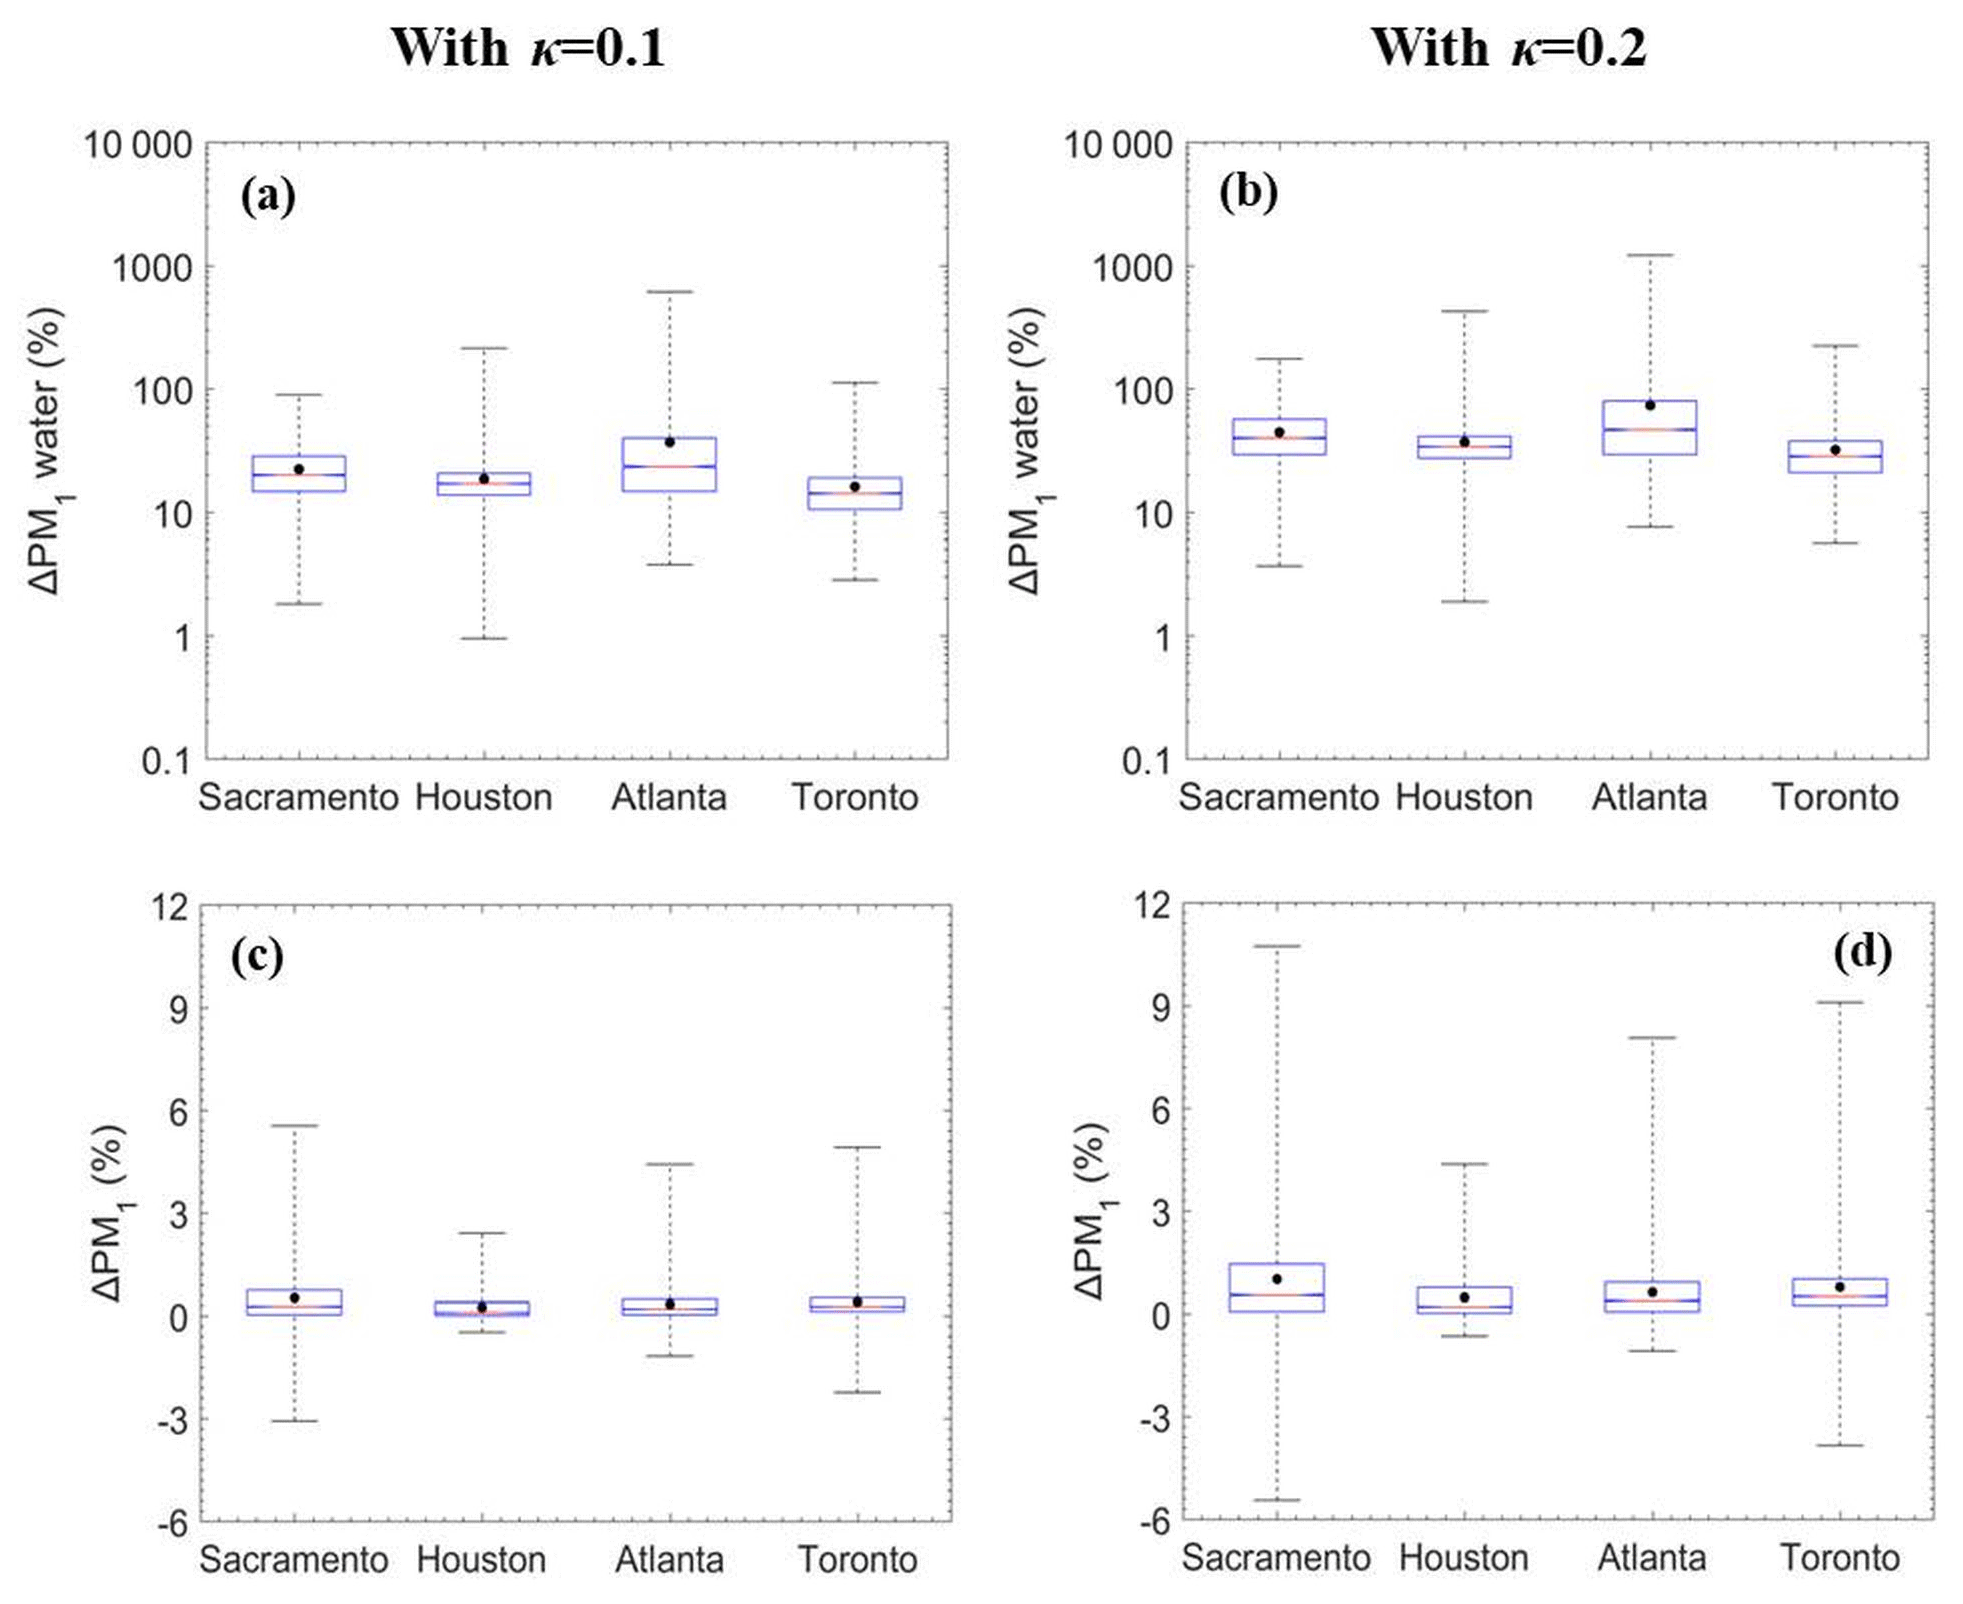
Figure 5Box plots for fractional change in the hourly (a), (b) PM1 water and (c), (d) total dry PM1 due to SOAW when κ=0.1 and κ=0.2 for Sacramento, California; Houston, Texas; Atlanta, Georgia; and Toronto, Canada, during 2010. The red line represents the median, the black dot is the mean value, the upper box line is the upper quartile (75 %), and the lower box line is the lower quartile (25 %) of the distribution. A negative change corresponds to a decrease.
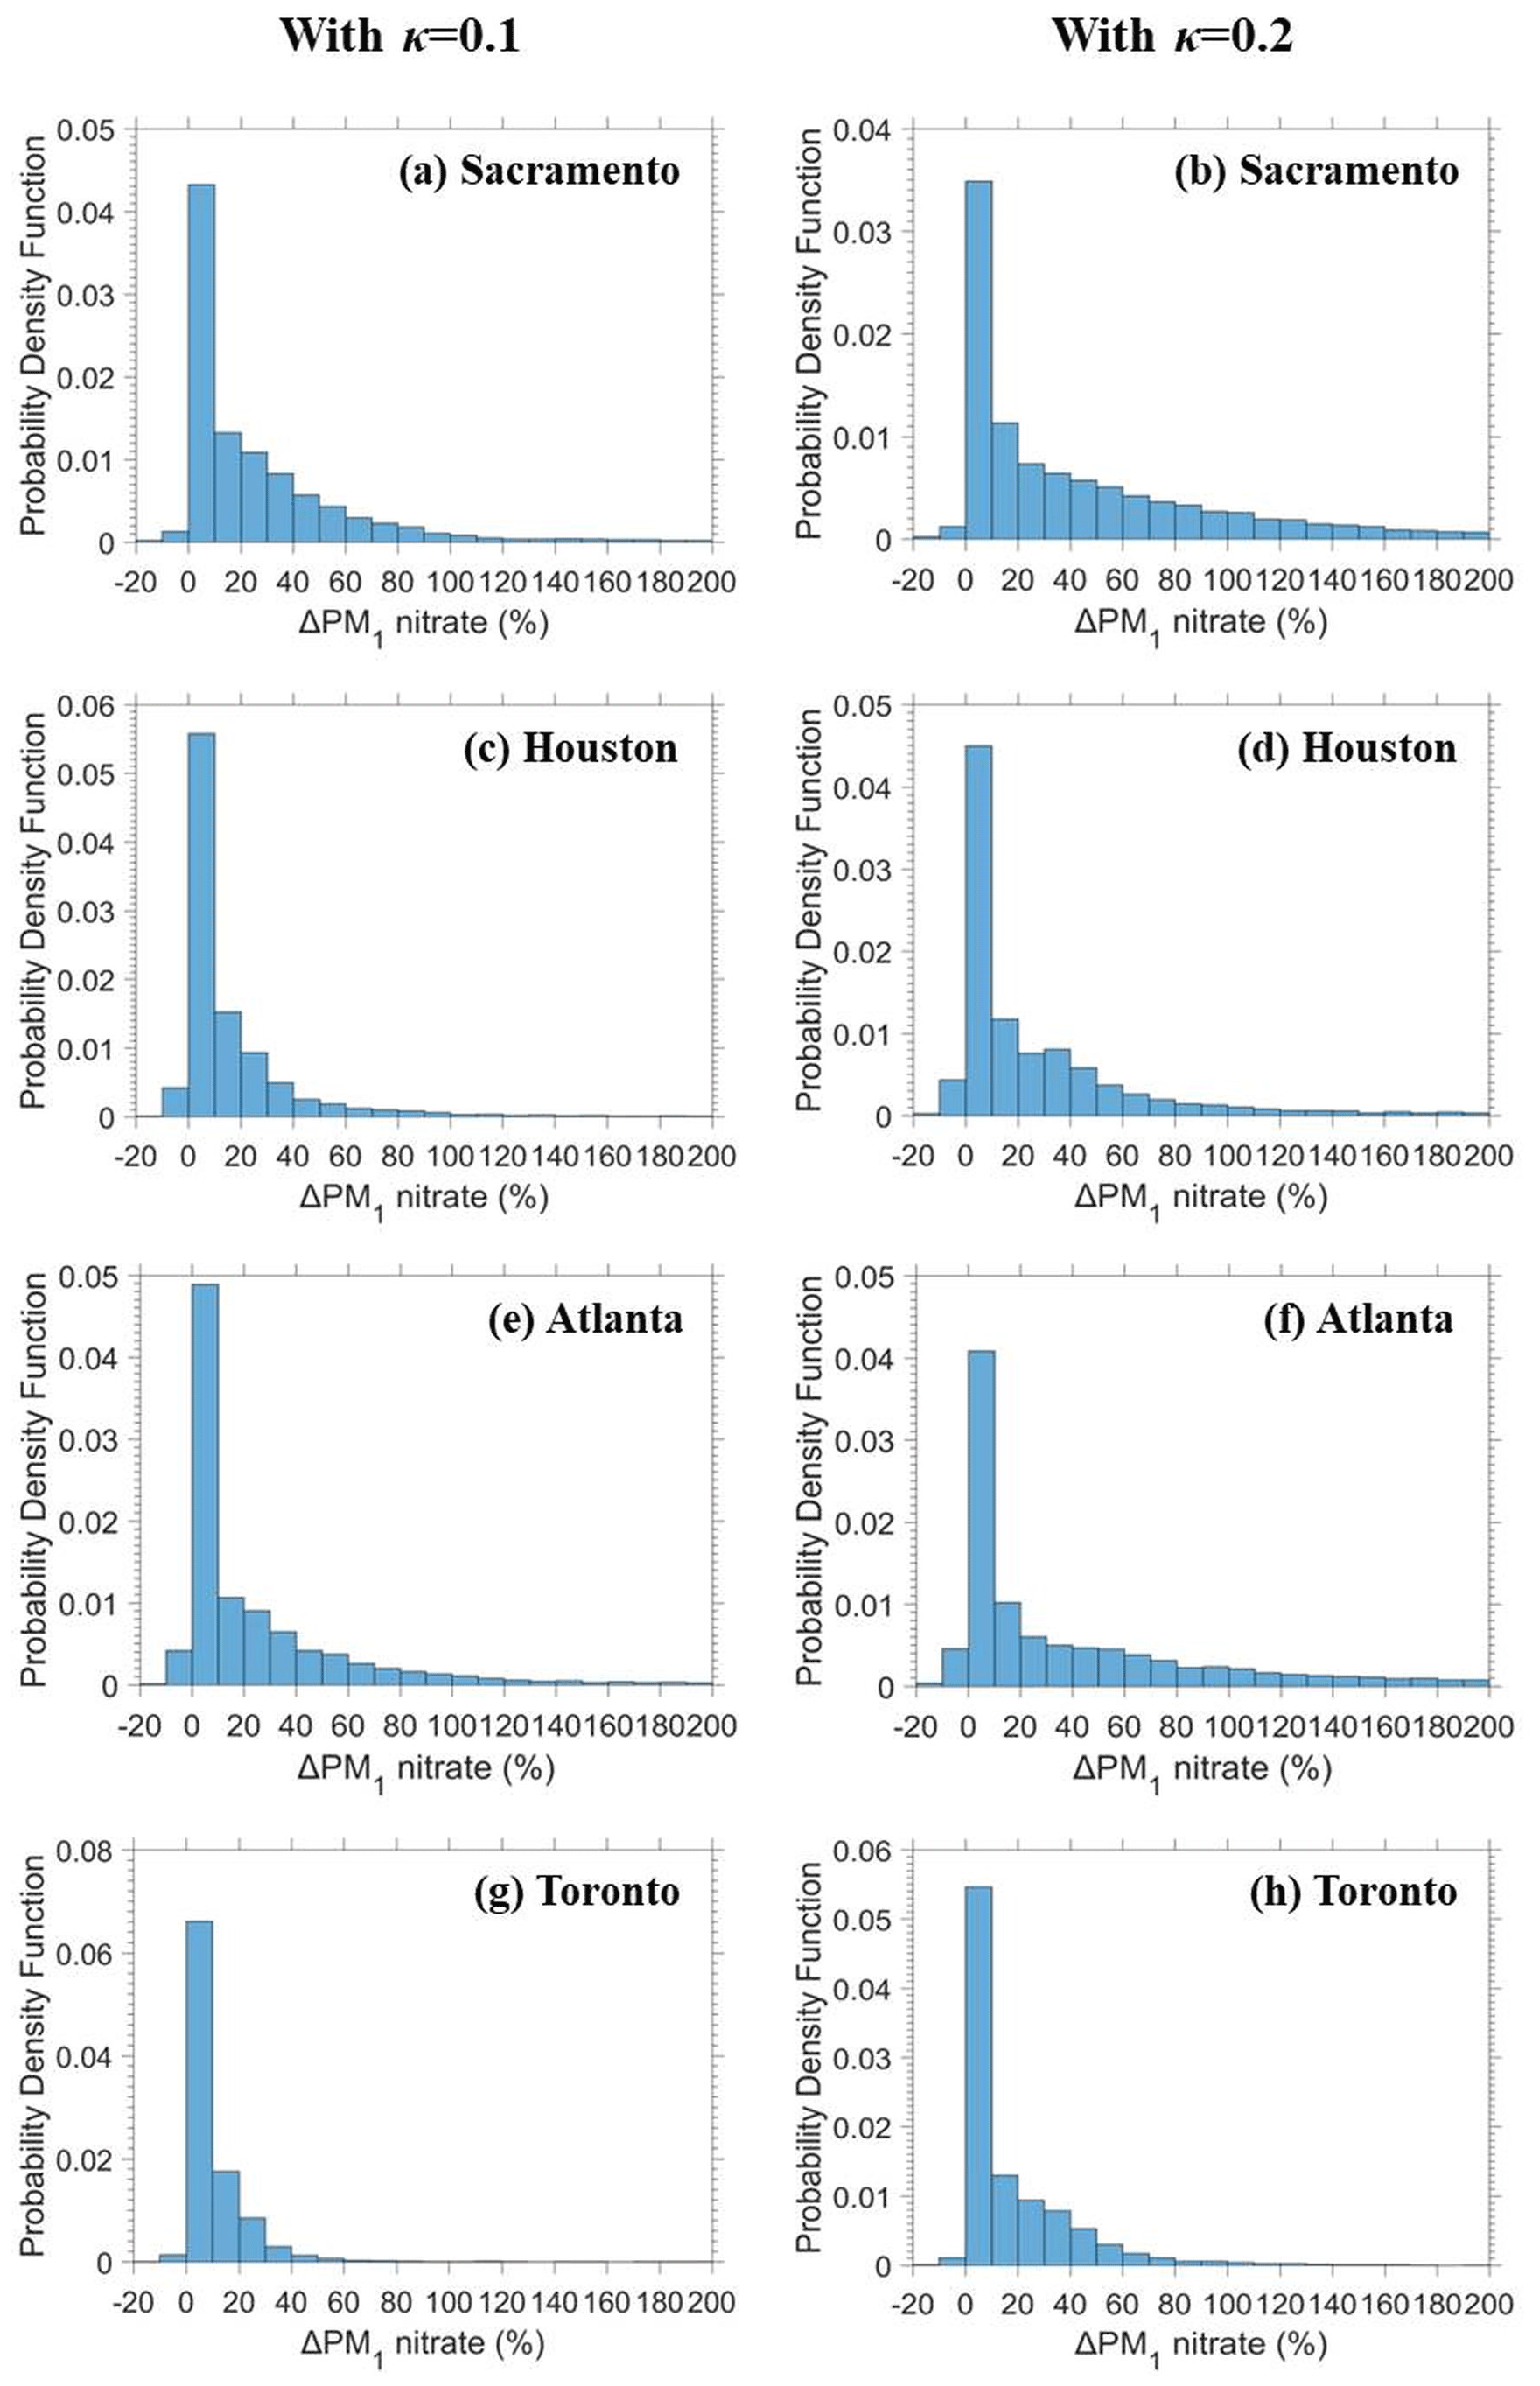
Figure 6The probability density as a function of fractional increase in the hourly PM1 nitrate due to SOAW when κ=0.1 and κ=0.2 for (a), (b) Sacramento, California; (c), (d) Houston, Texas; (e), (f) Atlanta, Georgia; and (g), (h) Toronto, Canada, during 2010.
3.3 Effects of SOAW on PM1 components
The annual average results indicate that SOAW mainly affects fine aerosol water levels. To better analyze the effects of SOAW, we focus on the temporal evolution of the predicted levels of PM1 components at four sites (Fig. S1) with different characteristics (Table S1). We have chosen one city from the west, one from the south, one from south-east, and one from the north-east. They are all in different environments with different major sources and climatological conditions. The presence of SOAW increased PM1 water concentrations at all sites from 1 % by almost 1 order of magnitude (Fig. 5). However, these fractional increases correspond most of the time to PM1 water concentration increases of a few µg m−3 (Fig. S5) because they occur under low RH levels. During periods of higher RH (80 % to 100 %), the PM1 water levels are predicted to increase by up to 100 µg m−3 (e.g. in Toronto).
Total dry PM1 concentrations during most of the simulated period increase on average by less than 1 % in all sites (Fig. 5) due to SOAW. There are periods, however, with greater fractional increases (by up to 10 %) and even small decreases (by up to 5 %) in total dry fine aerosol levels in the examined sites. The decreases can be explained by SOAW increasing the size of particles and therefore their dry deposition rate (Nenes et al., 2020). Depending on SOA hygroscopicity, increases by up to 1.5 µg m−3 for nitrate and 0.5 µg m−3 for ammonium are predicted (Fig. S5). Fine nitrate increases of 10 % were more frequent in the examined sites; however, greater increases, by up to 200 %, are predicted during the simulated period (Fig. 6). As expected, greater increases can occur more often with greater assumed SOA hygroscopicity.
Aerosol liquid water has a profound impact on aerosol processes, chemical composition, and their impacts. By including the effects of organic water on inorganics' thermodynamic equilibrium, we show that SOAW can substantially increase aerosol water levels by on average up to 60 % over the majority of the domain. As a consequence, total dry PM1 levels can also increase but the changes are small (by up to 2 % on an annual average basis). Locally these effects can be much more significant during periods of high RH and SOA levels (fine nitrate fractional increases can be as high as 200 %).
The effects vary with season. During summer, RH is lower and SOA levels are higher, leading to greater fractional increases in aerosol water (Fig. 3) but smaller absolute mass changes. During summer the fractional increases in total dry fine aerosol concentrations are lower than in wintertime (Fig. S6). Nitrate and ammonium are responsible for the total dry fine aerosol concentration increases (Fig. 2). These compounds partition together (as deliquesced ammonium nitrate) to the particulate phase to satisfy equilibrium due to the additional water mass of SOA.
The increases in total dry PM1 and fine aerosol water levels depend on SOA concentrations, hygroscopicity value, RH levels, and the particle-phase fractions of inorganic species. The SOAW effect on aerosol water is approximately proportional to the assumed hygroscopicity parameter κ. Given that our work investigates the potential significance of this effect we have chosen to provide the results of two simulations: one with relatively low SOA hygroscopicity and one with relatively high SOA hygroscopicity. A more detailed treatment of the hygroscopicity parameter (e.g. assigning a different value to each OA component) will be a topic of future work.
The present work thoroughly analyses organic water uptake impacts over 1 simulated year (not just 1 month as done in Kakavas et al., 2022) and in quite a different geographical area (US here versus Europe in Kakavas et al., 2022). There are significant differences but also similarities in the predicted changes and effects of SOA water. Both studies indicate that SOAW can contribute highly to the total PM1 water and increase particulate nitrate concentrations, especially in areas with high total nitrate concentrations. Pilinis et al. (1995) have argued that the single most important parameter in determining direct aerosol forcing is RH, and the most important process is the increase in the aerosol mass as a result of water uptake. They estimated that on average an increase of the RH from 40 % to 80 % for global mean aerosol more than doubles the corresponding radiative forcing. As a result, the inclusion of SOAW in future studies is highly recommended. ISORROPIA-lite provides a simple and computationally effective approach for the simulation of this SOAW.
The model code and data used in this study are available from the authors upon request (spyros@chemeng.upatras.gr and athanasios.nenes@epfl.ch).
The supplement related to this article is available online at: https://doi.org/10.5194/acp-23-13555-2023-supplement.
SK incorporated ISORROPIA-lite in PMCAMx, carried out the simulations, analyzed the results, and wrote the article. SN and AN conceived and led the study and helped in the writing of the article. All authors contributed to the reviewer responses and article revisions.
The contact author has declared that none of the authors has any competing interests.
Publisher’s note: Copernicus Publications remains neutral with regard to jurisdictional claims in published maps and institutional affiliations.
This work was supported by the project FORCeS funded from the European Union's Horizon 2020 research and innovation programme under grant agreement no. 821205, and project PyroTRACH (ERC-2016-COG) funded from H2020-EU.1.1. – Excellent Science – European Research Council (ERC), project ID no. 726165.
This research has been supported by the Horizon 2020 (grant no. 821205) and the H2020 European Research Council (grant no. 726165).
This paper was edited by Qi Chen and reviewed by Tengyu Liu and three anonymous referees.
Baker, A., Kanakidou, M., Nenes, A., Myriokefalitakis, S., Croot, P.L., Duce, A. D., Gao, Y., Guieu, C., Ito, A., Jickells, T. D., Mahowald, N. M., Middag, R., Perron, M. M. G., Sarin, M. M., Shelley, R., and Turner, D. R.: Changing atmospheric acidity as a modulator of nutrient deposition and ocean biogeochemistry, Sci. Adv., 7, 1–9, https://doi.org/10.1126/sciadv.abd8800, 2021.
Bian, Y. X., Zhao, C. S., Ma, N., Chen, J., and Xu, W. Y.: A study of aerosol liquid water content based on hygroscopicity measurements at high relative humidity in the North China Plain, Atmos. Chem. Phys., 14, 6417–6426, https://doi.org/10.5194/acp-14-6417-2014, 2014.
Bougiatioti, A., Nikolaou, P., Stavroulas, I., Kouvarakis, G., Weber, R., Nenes, A., Kanakidou, M., and Mihalopoulos, N.: Particle water and pH in the eastern Mediterranean: source variability and implications for nutrient availability, Atmos. Chem. Phys., 16, 4579–4591, https://doi.org/10.5194/acp-16-4579-2016, 2016.
Carlton, A. G. and Turpin, B. J.: Particle partitioning potential of organic compounds is highest in the Eastern US and driven by anthropogenic water, Atmos. Chem. Phys., 13, 10203–10214, https://doi.org/10.5194/acp-13-10203-2013, 2013.
Chang, R. Y.-W., Slowik, J. G., Shantz, N. C., Vlasenko, A., Liggio, J., Sjostedt, S. J., Leaitch, W. R., and Abbatt, J. P. D.: The hygroscopicity parameter (κ) of ambient organic aerosol at a field site subject to biogenic and anthropogenic influences: relationship to degree of aerosol oxidation, Atmos. Chem. Phys., 10, 5047–5064, https://doi.org/10.5194/acp-10-5047-2010, 2010.
Deetz, K., Vogel, H., Haslett, S., Knippertz, P., Coe, H., and Vogel, B.: Aerosol liquid water content in the moist southern West African monsoon layer and its radiative impact, Atmos. Chem. Phys., 18, 14271–14295, https://doi.org/10.5194/acp-18-14271-2018, 2018.
Donahue, N. M., Robinson, A. L., Stanier, C. O., and Pandis, S. N.: Coupled partitioning, dilution, and chemical aging of semivolatile organics, Environ. Sci. Technol., 40, 2635–2643, 2006.
Environ: Comprehensive Air Quality Model with Extensions Version 4.40, Users Guide, ENVIRON Int. Corp., Novato, CA, http://www.camx.com (last access: November 2020), 2006.
Fahey, K. and Pandis, S. N.: Optimizing model performance: variable size resolution in cloud chemistry modeling, Atmos. Environ., 35, 4471–4478, 2001.
Fountoukis, C. and Nenes, A.: ISORROPIA II: a computationally efficient thermodynamic equilibrium model for K+–Ca2+–Mg2+–NH4+–Na+–SO−–NO3−–Cl−–H2O aerosols, Atmos. Chem. Phys., 7, 4639–4659, https://doi.org/10.5194/acp-7-4639-2007, 2007.
Fountoukis, C., Nenes, A., Sullivan, A., Weber, R., Van Reken, T., Fischer, M., Matías, E., Moya, M., Farmer, D., and Cohen, R. C.: Thermodynamic characterization of Mexico City aerosol during MILAGRO 2006, Atmos. Chem. Phys., 9, 2141–2156, https://doi.org/10.5194/acp-9-2141-2009, 2009.
Fountoukis, C., Megaritis, A. G., Skyllakou, K., Charalampidis, P. E., Denier van der Gon, H. A. C., Crippa, M., Prévôt, A. S. H., Fachinger, F., Wiedensohler, A., Pilinis, C., and Pandis, S. N.: Simulating the formation of carbonaceous aerosol in a European Megacity (Paris) during the MEGAPOLI summer and winter campaigns, Atmos. Chem. Phys., 16, 3727–3741, https://doi.org/10.5194/acp-16-3727-2016, 2016.
Freney, E. J., Sellegri, K., Canonaco, F., Colomb, A., Borbon, A., Michoud, V., Doussin, J.-F., Crumeyrolle, S., Amarouche, N., Pichon, J.-M., Bourianne, T., Gomes, L., Prevot, A. S. H., Beekmann, M., and Schwarzenböeck, A.: Characterizing the impact of urban emissions on regional aerosol particles: airborne measurements during the MEGAPOLI experiment, Atmos. Chem. Phys., 14, 1397–1412, https://doi.org/10.5194/acp-14-1397-2014, 2014.
Gopinath, A. K., Raj, S. S., Kommula, S. M., Jose, C., Panda, U., Bishambu, Y., Ojha, N., Ravikrishna, R., Liu, P., and Gunthe, S. S.: Complex interplay between organic and secondary inorganic aerosols with ambient relative humidity implicates the aerosol liquid water content over India during wintertime, J. Geophys. Res., 127, e2021JD036430, https://doi.org/10.1029/2021JD036430, 2022.
Gunthe, S. S., Liu, P., Panda, U., Raj, S. S., Sharma, A., Derbyshire, E., Reyes-Villegas E., Allan, J., Chen, Y., Wang, X., Song, S., Pöhlker, M. L., Shi, L., Wang, Y., Kommula, S. M., Liu, T., Ravikrishna, R., McFiggans, G., Mickey, L. J., Martin, S. T., Pöschl, U., Andreae, M. O., and Coe, H.: Enhanced aerosol particle growth sustained by high continental chlorine emission in India., Nat. Geosci., 14, 77–84, 2021.
Guo, H., Xu, L., Bougiatioti, A., Cerully, K. M., Capps, S. L., Hite Jr., J. R., Carlton, A. G., Lee, S.-H., Bergin, M. H., Ng, N. L., Nenes, A., and Weber, R. J.: Fine-particle water and pH in the southeastern United States, Atmos. Chem. Phys., 15, 5211–5228, https://doi.org/10.5194/acp-15-5211-2015, 2015.
Guo, H., Liu, J., Froyd, K. D., Roberts, J. M., Veres, P. R., Hayes, P. L., Jimenez, J. L., Nenes, A., and Weber, R. J.: Fine particle pH and gas–particle phase partitioning of inorganic species in Pasadena, California, during the 2010 CalNex campaign, Atmos. Chem. Phys., 17, 5703–5719, https://doi.org/10.5194/acp-17-5703-2017, 2017.
Guo, H., Li, X., Li, W., Wu, J., Wang, S., and Wei, J.: Climatic modification effects on the association between PM1 and lung cancer incidence in China, BMC public health, 21, 880, 2021.
Jathar, S.H., Mahmud, A., Barsanti, K.C., Asher, W. E., Pankow, J. F., and Kleeman M. J.: Water uptake by organic aerosol and its influence on gas/particle partitioning of secondary organic aerosol in the United States, Atmos. Environ., 129, 142–154, 2016.
Jin, X., Wang, Y., Li, Z., Zhang, F., Xu, W., Sun, Y., Fan, X., Chen, G., Wu, H., Ren, J., Wang, Q., and Cribb, M.: Significant contribution of organics to aerosol liquid water content in winter in Beijing, China, Atmos. Chem. Phys., 20, 901–914, https://doi.org/10.5194/acp-20-901-2020, 2020.
Kakavas, S., Pandis, S. N., and Nenes, A.: ISORROPIA-lite: A comprehensive atmospheric aerosol thermodynamics module for Earth System Models, Tellus B, 74, 1–23, 2022.
Karamchandani, P., Vijayaraghavan, K., and Yarwood, G.: Sub-grid scale plume modeling, Atmosphere, 2, 389–406, 2011.
Karydis, V. A., Tsimpidi, A. P., Fountoukis, C., Nenes, A., Zavala, M., Lei, W., Molina, L. T., and Pandis, S. N.: Simulating the fine and coarse inorganic particulate matter concentrations in a polluted megacity, Atmos. Environ., 44, 608–620, 2010.
Kodros, J. K., Papanastasiou, D. K., Paglione, M., Masiol, M., Squizzato, S., Florou, K., Skyllakou, K., Kaltsonoudis, C., Nenes, A., and Pandis, S. N.: Rapid dark aging of biomass burning as an overlooked source of oxidized organic aerosol., P. Natl. Acad. Sci. USA, 117, 33028–33033, 2020.
Koehler, K. A., Kreidenweis, S. M., DeMott, P. J., Petters, M. D., Prenni, A. J., and Carrico, C. M.: Hygroscopicity and cloud droplet activation of mineral dust aerosol, Geophys. Res. Let., 36, L08805, https://doi.org/10.1029/2009GL037348, 2009.
Koo, B., Pandis, S. N., and Ansari, A.: Integrated approaches to modeling the organic and inorganic atmospheric aerosol components, Atmos. Environ., 37, 4757–4768, 2003.
Kostenidou, E., Pathak, R. K., and Pandis, S. N.: An algorithm for the calculation of secondary organic aerosol density combining AMS and SMPS data, Aerosol Sci. Technol., 41, 1002–1010, 2007.
Kuang, Y., Zhao, C. S., Zhao, G., Tao, J. C., Xu, W., Ma, N., and Bian, Y. X.: A novel method for calculating ambient aerosol liquid water content based on measurements of a humidified nephelometer system, Atmospheric Measurement Techniques, 11, 2967–2982, 2018.
Kuang, Y., Xu, W., Tao, J., Ma, N., Zhao, C., and Shao, M.: A review on laboratory studies and field measurements of atmospheric organic aerosol hygroscopicity and its parameterization based on oxidation levels, Current Pollut. Rep., https://doi.org/10.1007/s40726-020-00164-2, 2020.
Li, X., Song, S., Zhou, W., Hao, J., Worsnop, D. R., and Jiang, J.: Interactions between aerosol organic components and liquid water content during haze episodes in Beijing, Atmos. Chem. Phys., 19, 12163–12174, https://doi.org/10.5194/acp-19-12163-2019, 2019.
Li, J., Zhang, H., Ying, Q., Wu, Z., Zhang, Y., Wang, X., Li, X., Sun, Y., Hu, M., Zhang, Y., and Hu, J.: Impacts of water partitioning and polarity of organic compounds on secondary organic aerosol over eastern China, Atmos. Chem. Phys., 20, 7291–7306, https://doi.org/10.5194/acp-20-7291-2020, 2020.
Liao, H. and Seinfeld, J. H.: Global impacts of gas-phase chemistry aerosol interactions on direct radiative forcing by anthropogenic aerosols and ozone, J. Geophys. Res., 110, D18208, https://doi.org/10.1029/2005JD005907, 2005.
Metzger, S., Mihalopoulos, N., and Lelieveld, J.: Importance of mineral cations and organics in gas-aerosol partitioning of reactive nitrogen compounds: case study based on MINOS results, Atmos. Chem. Phys., 6, 2549–2567, https://doi.org/10.5194/acp-6-2549-2006, 2006.
Murphy, B. N. and Pandis, S. N.: Simulating the formation of semivolatile primary and secondary organic aerosol in a regional chemical transport model, Environ. Sci. Technol., 43, 4722–4728, 2009.
Nenes, A., Pandis, S. N., Weber, R. J., and Russell, A.: Aerosol pH and liquid water content determine when particulate matter is sensitive to ammonia and nitrate availability, Atmos. Chem. Phys., 20, 3249–3258, https://doi.org/10.5194/acp-20-3249-2020, 2020.
Nenes, A., Pandis, S. N., Kanakidou, M., Russell, A. G., Song, S., Vasilakos, P., and Weber, R. J.: Aerosol acidity and liquid water content regulate the dry deposition of inorganic reactive nitrogen, Atmos. Chem. Phys., 21, 6023–6033, 2021.
Nguyen, T. K. V., Zhang, Q., Jimenez, J. L., Pike, M., and Carlton, A. G.: Liquid water: ubiquitous contributor to aerosol mass, Environ. Sci. Tech. Let., 3, 257–263, 2016.
Pandis, S. N. and Seinfeld, J. H.: Sensitivity analysis of a chemical mechanism for aqueous-phase atmospheric chemistry, J. Geophys. Res., 94, 1105–1126, 1989.
Pandis, S. N., Wexler, A. S., and Seinfeld, J. H.: Secondary organic aerosol formation and transport – II. Predicting the ambient secondary organic aerosol size distribution, Atmos. Environ., 27, 2403–2416, 1993.
Petters, M. D., Prenni, A. J., Kreidenweis, S. M., DeMott, P. J., Matsunaga, A., Lim, Y. B., and Ziemann, P. J.: Chemical aging and the hydrophobic-to-hydrophilic conversion of carbonaceous aerosol, Geophys. Res. Lett., 33, L24806, https://doi.org/10.1029/2006GL027249, 2006.
Petters, M. D. and Kreidenweis, S. M.: A single parameter representation of hygroscopic growth and cloud condensation nucleus activity, Atmos. Chem. Phys., 7, 1961–1971, https://doi.org/10.5194/acp-7-1961-2007, 2007.
Pilinis, C., Pandis, S. N., and Seinfeld, J. H.: Sensitivity of direct climate forcing by atmospheric aerosols to aerosol size and composition, J. Geophys. Res., 100, 18739, https://doi.org/10.1029/95JD02119, 1995.
Pye, H. O. T., Nenes, A., Alexander, B., Ault, A. P., Barth, M. C., Clegg, S. L., Collett Jr., J. L., Fahey, K. M., Hennigan, C. J., Herrmann, H., Kanakidou, M., Kelly, J. T., Ku, I.-T., McNeill, V. F., Riemer, N., Schaefer, T., Shi, G., Tilgner, A., Walker, J. T., Wang, T., Weber, R., Xing, J., Zaveri, R. A., and Zuend, A.: The acidity of atmospheric particles and clouds, Atmos. Chem. Phys., 20, 4809–4888, https://doi.org/10.5194/acp-20-4809-2020, 2020.
Seinfeld, J. H. and Pandis, S. N.: Atmospheric chemistry and physics: From air pollution to climate change, Wiley: New York, ISBN 9780471720188, 1–232, 2006.
Skyllakou, K., Murphy, B. N., Megaritis, A. G., Fountoukis, C., and Pandis, S. N.: Contributions of local and regional sources to fine PM in the megacity of Paris, Atmos. Chem. Phys., 14, 2343–2352, https://doi.org/10.5194/acp-14-2343-2014, 2014.
Skyllakou, K., Rivera, P. G., Dinkelacker, B., Karnezi, E., Kioutsioukis, I., Hernandez, C., Adams, P. J., and Pandis, S. N.: Changes in PM2.5 concentrations and their sources in the US from 1990 to 2010, Atmos. Chem. Phys., 21, 17115–17132, https://doi.org/10.5194/acp-21-17115-2021, 2021.
Song, S., Gao, M., Xu, W., Shao, J., Shi, G., Wang, S., Wang, Y., Sun, Y., and McElroy, M. B.: Fine-particle pH for Beijing winter haze as inferred from different thermodynamic equilibrium models, Atmos. Chem. Phys., 18, 7423–7438, https://doi.org/10.5194/acp-18-7423-2018, 2018.
Strader, R., Gurciullo, C., Pandis, S. N., Kumar, N., and Lurmann, F. W.: Development of gas-phase chemistry, secondary organic aerosol, and aqueous-phase chemistry modules for PM modeling, Final report for CRC Project A21-1 prepared for the Coordinating Research Council, Atlanta, GA by Sonoma Technology, Inc., Petaluma, CA, OSTI 339500, 1–132, 1998.
Sun, X., Ivey, C. E., Baker, K. R., Nenes, A., Lareau, N. P., and Holmes, H. A.: Confronting Uncertainties of Simulated Air Pollution Concentrations during Persistent Cold Air Pool Events in the Salt Lake Valley, Utah, Environ. Sci. Technol., 55, 15072–15081, 2021.
Tsimpidi, A. P., Karydis, V. A., Zavala, M., Lei, W., Molina, L., Ulbrich, I. M., Jimenez, J. L., and Pandis, S. N.: Evaluation of the volatility basis-set approach for the simulation of organic aerosol formation in the Mexico City metropolitan area, Atmos. Chem. Phys., 10, 525–546, https://doi.org/10.5194/acp-10-525-2010, 2010.
Turpin, B. J. and Lim, H. J.: Species Contributions to PM2.5 Mass Concentrations: Revisiting Common Assumptions for Estimating Organic Mass, Aerosol Sci. Technol., 35, 602–610, 2001.
Wu, Z., Wang, Y., Tan, T., Zhu, Y., Li, M., Shang, D., Wang, H., Lu, K., Guo, S., Zeng, L., and Zhang, Y.: Aerosol liquid water driven by anthropogenic inorganic salts: Implying its key role in haze formation over the North China Plain, Environ. Sci. Technol. Lett., 5, 160–166, https://doi.org/10.1021/acs.estlett.8b00021, 2018.
Xing, J., Pleim, J., Mathur, R., Pouliot, G., Hogrefe, C., Gan, C.-M., and Wei, C.: Historical gaseous and primary aerosol emissions in the United States from 1990 to 2010, Atmos. Chem. Phys., 13, 7531–7549, https://doi.org/10.5194/acp-13-7531-2013, 2013.
Yarwood, G., Rao, S., Yocke, M., and Whitten, G. Z.: Updates to the Carbon Bond Chemical Mechanism: CB05, Research Triangle Park, https://camx-wp.azurewebsites.net/Files/CB05_Final_Report_120805.pdf (last access: November 2022), 2005.
Zakoura, M. and Pandis, S. N.: Improving fine aerosol nitrate predictions using a Plume-in-Grid modeling approach, Atmos. Environ., 215, 116887, https://doi.org/10.1016/j.atmosenv.2019.116887, 2019.
Zhang, Q. J., Beekmann, M., Drewnick, F., Freutel, F., Schneider, J., Crippa, M., Prevot, A. S. H., Baltensperger, U., Poulain, L., Wiedensohler, A., Sciare, J., Gros, V., Borbon, A., Colomb, A., Michoud, V., Doussin, J.-F., Denier van der Gon, H. A. C., Haeffelin, M., Dupont, J.-C., Siour, G., Petetin, H., Bessagnet, B., Pandis, S. N., Hodzic, A., Sanchez, O., Honoré, C., and Perrussel, O.: Formation of organic aerosol in the Paris region during the MEGAPOLI summer campaign: evaluation of the volatility-basis-set approach within the CHIMERE model, Atmos. Chem. Phys., 13, 5767–5790, https://doi.org/10.5194/acp-13-5767-2013, 2013.