the Creative Commons Attribution 4.0 License.
the Creative Commons Attribution 4.0 License.
 | 25 Oct 2023
Reactive organic carbon air emissions from mobile sources in the United States
Darrell Sonntag
Karl M. Seltzer
Havala O. T. Pye
Christine Allen
Evan Murray
Claudia Toro
Drew R. Gentner
Cheng Huang
Shantanu Jathar
Li Li
Andrew A. May
Allen L. Robinson
Mobile sources are responsible for a substantial controllable portion of the reactive organic carbon (ROC) emitted to the atmosphere, especially in urban environments of the United States. We update existing methods for calculating mobile source organic particle and vapor emissions in the United States with over a decade of laboratory data that parameterize the volatility and organic aerosol (OA) potential of emissions from on-road vehicles, nonroad engines, aircraft, marine vessels, and locomotives. We find that existing emission factor information from Teflon filters combined with quartz filters collapses into simple relationships and can be used to reconstruct the complete volatility distribution of ROC emissions. This new approach consists of source-specific filter artifact corrections and state-of-the-science speciation including explicit intermediate-volatility organic compounds (IVOCs), yielding the first bottom-up volatility-resolved inventory of US mobile source emissions. Using the Community Multiscale Air Quality model, we estimate mobile sources account for 20 %–25 % of the IVOC concentrations and 4.4 %–21.4 % of ambient OA. The updated emissions and air quality model reduce biases in predicting fine-particle organic carbon in winter, spring, and autumn throughout the United States (4.3 %–11.3 % reduction in normalized bias). We identify key uncertain parameters that align with current state-of-the-art research measurement challenges.
- Article
(4890 KB) - Full-text XML
-
Supplement
(3675 KB) - BibTeX
- EndNote


Ambient particulate matter (PM) and ozone (O3) have detrimental impacts on human health and the environment (U.S. EPA, 2019, 2020c; Pye et al., 2021) with disparate impacts across societal groups (Tessum et al., 2021). Non-methane organic gases (NMOGs) are precursors to PM and O3, and reducing NMOGs could reduce criteria pollutants and their associated mortality throughout the United States (Pye et al., 2022). Mobile source emissions continue to be a major contributor to modern anthropogenic NMOG emissions. In contrast to other NMOG sources such as vegetation, mobile emissions have been reduced through successful regulatory policy and the introduction of cleaner engine and control technologies (Lurmann et al., 2015; Gentner et al., 2017; Winkler et al., 2018; Bessagnet et al., 2022). Yet, effective management of urban and regional air quality still depends on accurate and detailed characterization of the carbon-containing compounds emitted by mobile sources.
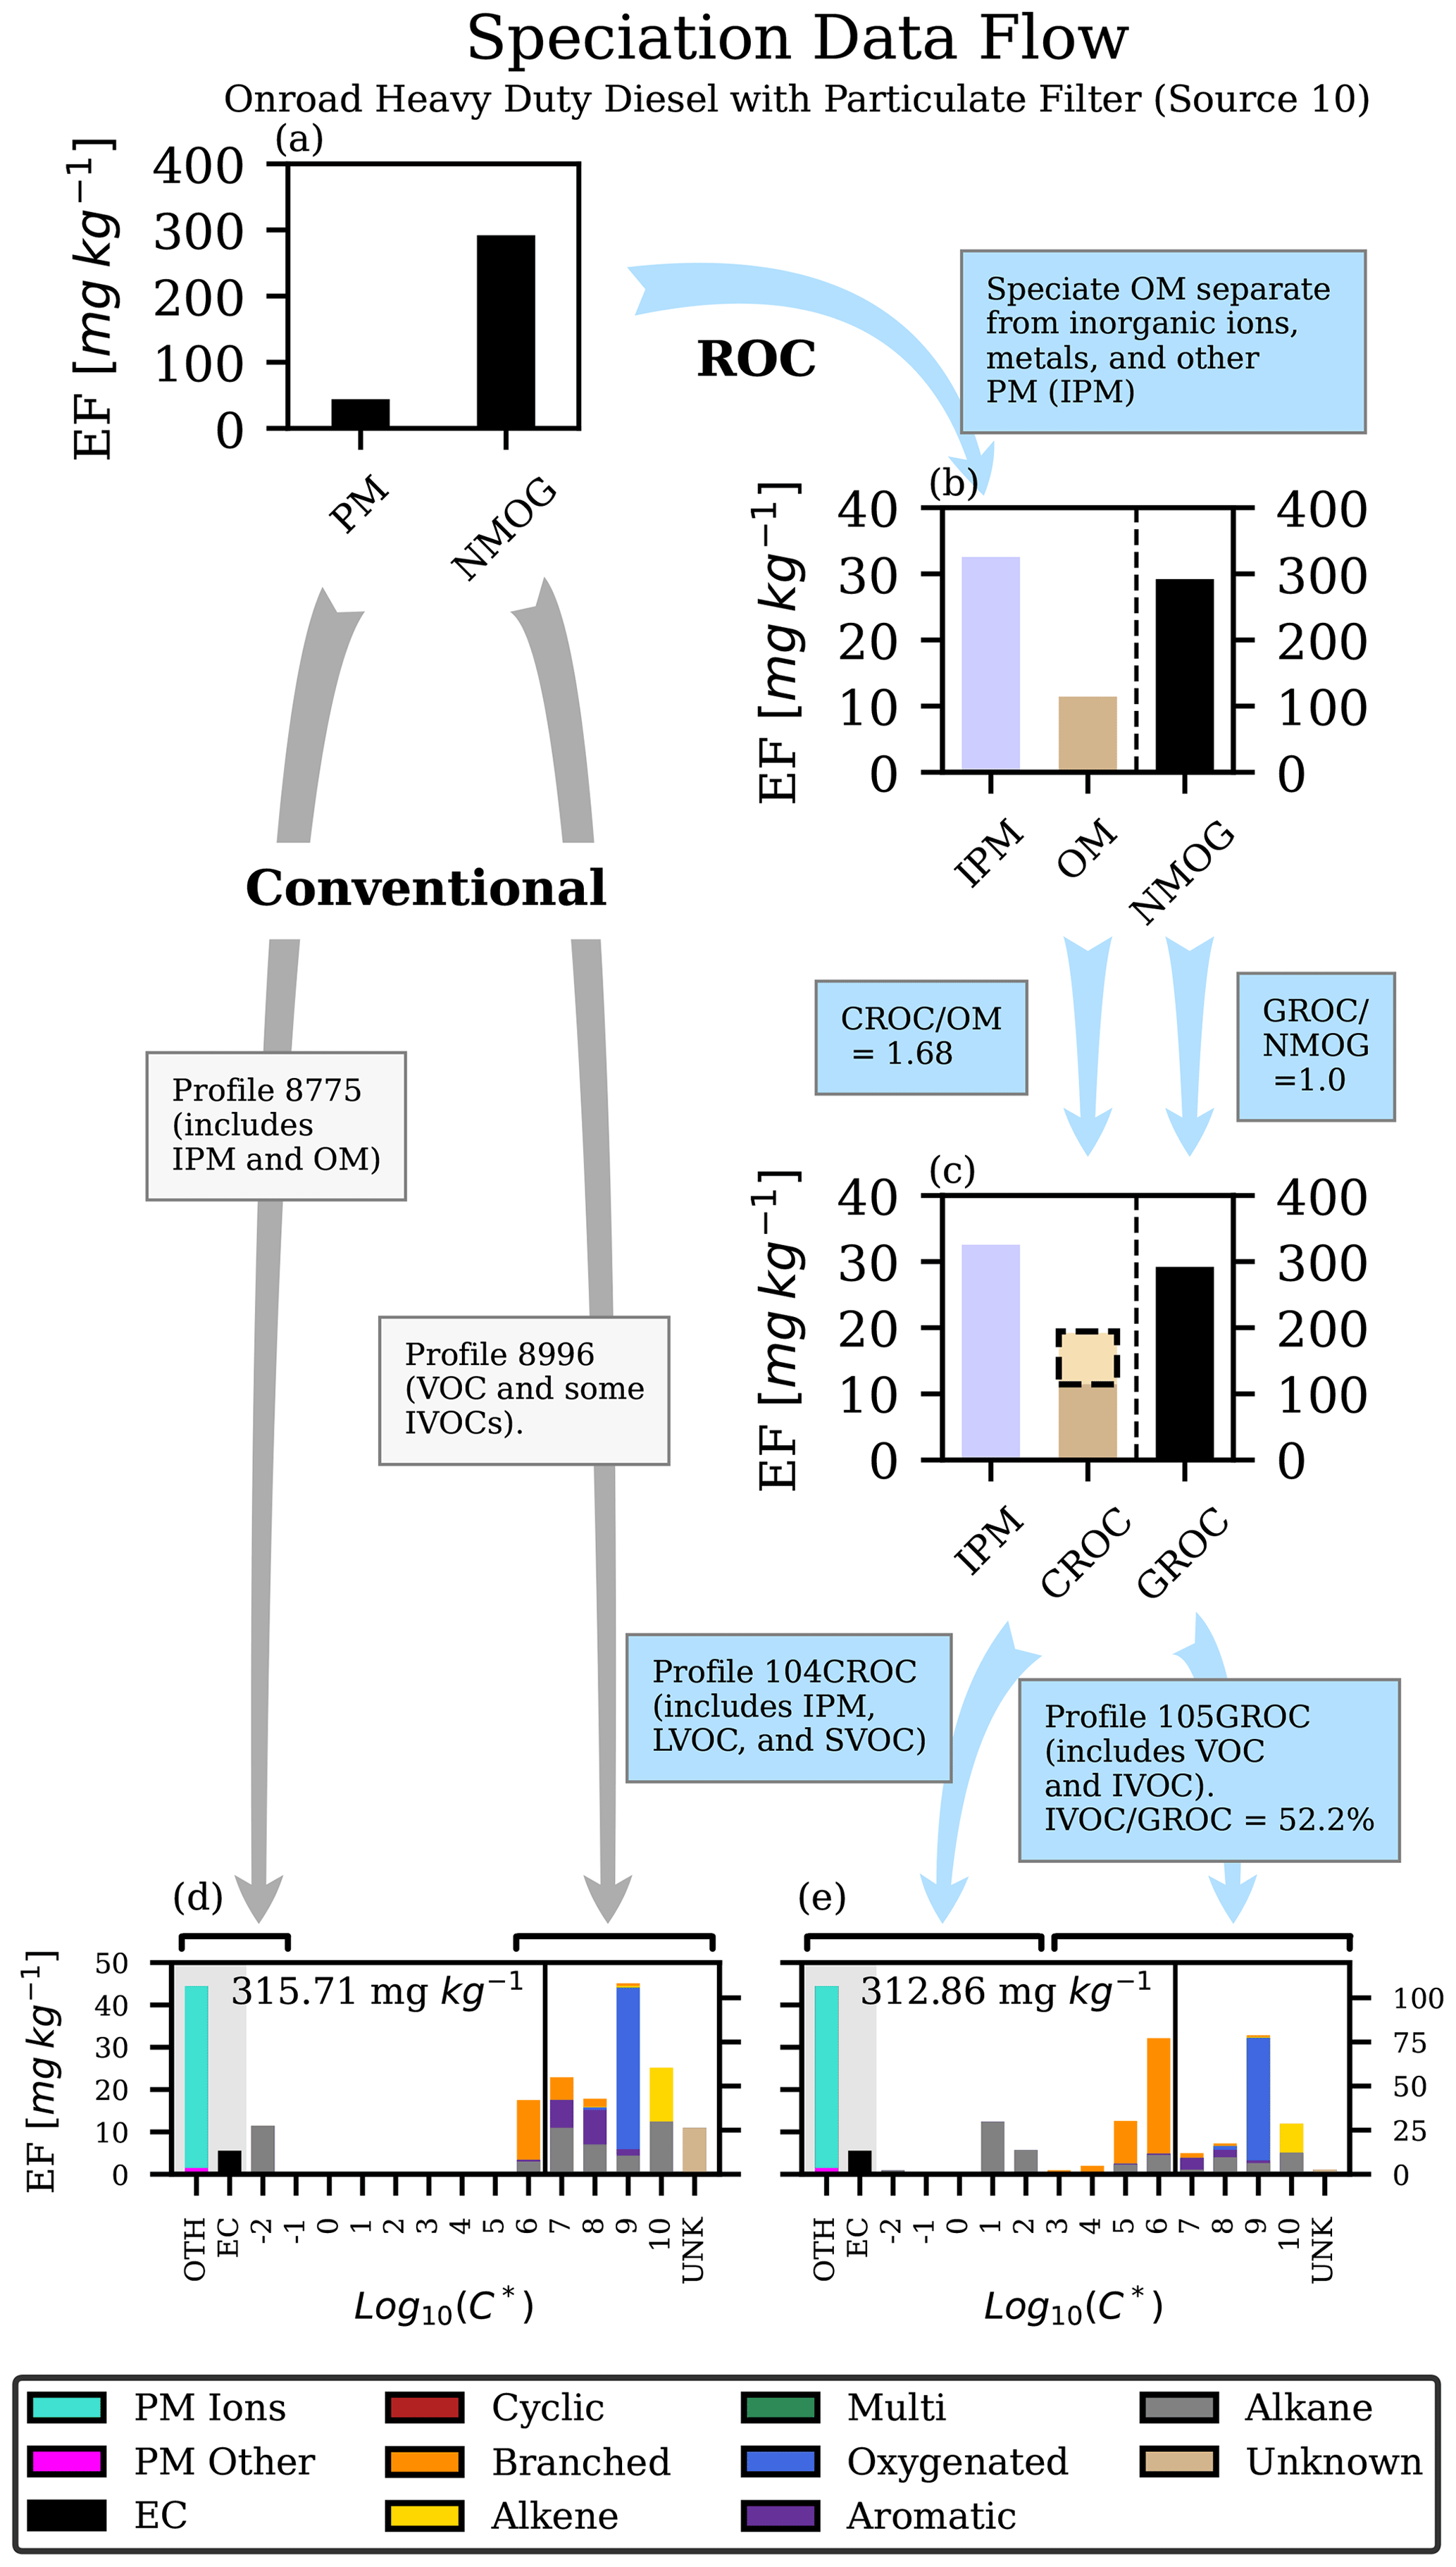
Figure 1Depiction of calculation steps for the conventional and ROC approaches to speciation of PM and NMOG emissions. Panel (a) shows the reported fuel-based emission factors based on MOVES predictions for 2016. Panel (b) shows the inorganic ions, metals, and other nonorganic matter (IPM) separated from organic matter (OM). The beige area inside the dashed box in panel (c) indicates emissions that are added in the conversion of OM to CROC to account for underrepresented SVOCs from the filter measurement. Panels (d) and (e) show the comprehensive emission factors for the conventional and ROC approaches, respectively, with data arranged by volatility while indicating non-organic PM emissions as well. In panels (d) and (e), bars to the left and right of the vertical line at Log are quantified by the left and right y axes, respectively. The number within panels (d) and (e) indicates the total ROC emission factor excluding EC and other PM for on-road heavy-duty diesel sources. “Alkane” refers to only linear alkanes, while “cyclic” and “branched” are cyclic alkanes and branched alkanes. “Multi” indicates multifunctional organics. The bars in the gray shaded regions are not included in the organic volatility distribution but are included in the CROC-compatible SPECIATE profiles (e.g., 104CROC).
Fossil-fuel combustion emissions comprise thousands of organic compounds with widely varying volatility, depending on source type (Drozd et al., 2018; Lu et al., 2018). The lowest-volatility compounds are emitted principally in the particle phase and are typically classified as primary organic aerosol (POA). Conventionally this portion of emissions is sampled using filters which are weighed or processed offline with thermal–optical techniques, solvent extraction, and other methodologies (Chow et al., 1993; Birch and Cary, 1996; CFR, 2023). The highest-volatility NMOGs are emitted in the gas phase and enhance O3 formation when oxidized in the atmosphere, a process that also enhances PM mass via secondary organic aerosol (SOA) formation. U.S. EPA emission tools like the MOtor Vehicle Emission Simulator (MOVES) (U.S. EPA, 2020b) and the SPECIATE database (U.S. EPA, 2020a) provide emission estimates and speciation for POA (assumed to be nonvolatile) and NMOGs. The “conventional” path in Fig. 1 depicts this process.
However, laboratory and field measurement campaigns have demonstrated that much of the mobile source POA is subject to gas-particle partitioning and filter-sampling artifacts. These artifacts may bias the interpretation of filter-based measurements by yielding higher POA emission factors due to the presence of these adsorbed vapors (Turpin et al., 1994; Robinson et al., 2010; Bessagnet et al., 2022). These compounds principally include (Table 1) semivolatile organic compounds (SVOCs) and intermediate-volatility organic compounds (IVOCs) (May et al., 2013b, a). Accurately representing SVOCs and IVOCs is important because they are SOA precursors and are underestimated in contemporary models and emission databases (Gentner et al., 2012; Tkacik et al., 2012; Y. Zhao et al., 2014, 2015, 2016).
Some air quality models (AQMs) have incorporated SVOCs and IVOCs by scaling these emissions to sector-wide POA or NMOG inputs during a data pre-processing step or the AQM runtime (Murphy and Pandis, 2009; Shrivastava et al., 2011; Ahmadov et al., 2012; Bergström et al., 2012; Koo et al., 2014; Woody et al., 2015; B. Zhao et al., 2016; Woody et al., 2016; Jathar et al., 2017b; Murphy et al., 2017). However, these approaches rely on broad application of assumptions that may not be appropriate for specific source types since sampling artifacts will bias low-emitting and high-emitting sources differently (Robinson et al., 2010). As emissions from individual combustion sources are continually reduced in response to tightening regulations, accounting for these potential biases becomes important. Manavi and Pandis (2022) and Sarica et al. (2023) implemented emission factors and speciation of SVOCs and IVOCs specific for mobile sources in Europe, while Morino et al. (2022) explored revisions to stationary source organic emissions in Japan. Chang et al. (2022) implemented a more detailed bottom-up inventory of organic emissions across all sectors in China with emission factors specified at the volatility bin level rather than for bulk PM and NMOGs. Additional bottom-up approaches are needed that revise emission factors and speciation profiles for all relevant individual source types and regions.
This paper documents the transition of U.S. EPA mobile emission tools from the conventional paradigm that considers operationally defined particulate organic matter (OM) and NMOG emission factors and speciation to one that accommodates the full complexity of atmospheric carbon-containing trace pollutants. To accomplish this, we consider total reactive organic carbon (ROC), defined by Saffediene et al. (2017) and Heald and Kroll (2020) as all reactive organic compound mass across gas and particle phases excluding methane. We catalogue updates to 51 diverse mobile source categories across multiple categories and engine, fuel, and control types. Further, we demonstrate procedures for integrating existing inventory emission factors with state-of-the-art chemical composition measurements, pointing out where critical uncertainties could be further resolved in the future. Finally, we document the impact the updates have on source-specific and sector-wide emissions as well as regional-scale pollutant formation and transport predicted by an updated version (2020) of the Community Multiscale Air Quality (CMAQ) regional-scale AQM.
2.1 Mobile emission modeling
To develop the new framework and estimate potential impacts from speciation updates, we used existing estimates for 2016 annual mobile emissions for the contiguous United States. We considered five categories including on-road, nonroad, air, rail, and marine. The MOVES3 model predicted emissions for on-road and nonroad sources using county-level fleet properties and activity data. The dominant US on-road vehicle sources were light-duty gasoline cars and trucks and heavy-duty diesel trucks. Nonroad emission sources included construction, agricultural, and lawn equipment as well as nonroad recreational vehicles. The Aviation Environmental Design Tool (AEDT), maintained by the Federal Aviation Administration, predicted landing, taxi, and take-off emissions for aircraft and emissions from ground support equipment (FAA, 2020). Rail emissions were calculated using confidential line-haul activity data that were summarized at the county level, while rail-yard emissions were based on supply fuel use and yard switcher counts provided by companies (U.S. EPA, 2021b). Marine emissions included both port and underway conditions for large, generally international ships, vessels, and smaller boats operating near the shore (U.S. EPA, 2021b). The MOVES3 model predicted emissions from recreational boats as part of the nonroad recreational equipment category.
We also collected national total annual fuel usage data for each source from the models to calculate an effective fuel-based OM emission factor (see Sect. S1 in the Supplement). These effective emission factors ranged from 1–20 mg (kg fuel)−1 for the newest gasoline, diesel, and compressed natural gas (CNG) vehicles to over 6000 mg (kg fuel)−1 for nonroad gasoline two-stroke engines. In the process of reviewing each mobile source OM emission rate, we discovered and corrected several minor errors and limitations to compressed natural gas sources and uncontrolled nonroad diesel exhaust (see Sect. S2).
2.2 Reactive organic carbon (ROC)
To accurately simulate the behavior of mobile emissions, we considered total ROC, which includes organic carbon (OC) and non-carbon mass from the most-volatile compounds like ethane and formaldehyde to chemically complex, high-molecular-weight, low-volatility compounds (e.g., oligomers) (Heald and Kroll, 2020). Conventional metrics for reporting OM and NMOGs are operationally defined based on measurement methods and conditions; therefore, they are difficult to compare across tests and among other ROC sources. Furthermore, uncertainties are introduced when they are speciated with profiles measured at different conditions. To improve standardization, we introduced two new metrics: CROC (condensable reactive organic carbon) and GROC (gaseous reactive organic carbon). CROC was defined as compounds with saturation concentration (C∗) less than 320 µg m−3 (Table 1), with this boundary corresponding to n-alkanes with 20 ± 1 carbon atoms. CROC included SVOCs (0.32 < C∗ ≤ 320 µg m−3) and low-volatility organic compounds (LVOCs; C∗ ≤ 0.32 µg m−3), whereas GROC was defined as the sum of compounds with C∗ greater than 320 µg m−3 corresponding to IVOCs (320 < C∗ ≤ 3.2 × 10⁶ µg m−3) and volatile organic compounds (VOCs; C∗ > 3.2 × 10⁶ µg m−3) (Donahue et al., 2009; Murphy et al., 2014). CROC and GROC aligned with well-known categories in the volatility basis set (VBS) space, so they could be applied straightforwardly to speciation profiles in the recent literature containing both explicit compounds and lumped groups.
We applied a two-step methodology to process gas- and particle-phase emissions (“ROC” path in Fig. 1). First, we estimated total GROC and CROC emissions from existing NMOG and OM emission factors, respectively, while considering measurement uncertainties like sampling setup losses (e.g., tubing) and filter artifacts. We then speciated GROC and CROC using state-of-the-science profiles. For GROC, these included explicit IVOC compounds, where available, and lumped IVOC groups distinguished by their saturation concentration and functionality. The methodology for processing CROC emissions similarly used volatility profiles from the recent literature.
2.2.1 GROC emissions and speciation
Total NMOG emissions are measured from mobile emissions by combining total hydrocarbons (THCs) with carbonyl compounds and subtracting methane (see Sect. S3) (Kishan et al., 2008; May et al., 2014). Lu et al. (2018) compiled measurements for on-road vehicles, nonroad equipment, and an aircraft turbine engine. That study concluded that methods using heated sampling and a heated flame-ionization detector (FID) captured both IVOCs and VOCs but that speciation methods like canister or Tedlar bag sampling analyzed with gas-chromatography–FID missed essentially all IVOCs due to wall losses to the sampling materials. Assuming that NMOG emission rates are based on heated FID sampling, we set GROC emission rates equal to total NMOG emission rates across all sources, and we speciated GROC emissions using profiles that include VOCs and IVOCs.
Many studies have reported speciated organic gases normalized to total IVOC or VOC (Lu et al., 2018; Jathar et al., 2017a; Y. Zhao et al., 2015, 2016; Huang et al., 2018; Drozd et al., 2018). A key parameter used to integrate these data is the IVOC NMOG ratio (see Sect. S4), which ranges from ∼ 4.6 % for gasoline vehicle cold-start exhaust to 67 % for marine residual oil. Gasoline fuel evaporation profiles of GROC were assumed to be the same as NMOGs since IVOCs are not expected to contribute substantially to those emissions (Gentner et al., 2012). The profile for whole diesel fuel evaporation was updated to be consistent with fuel characterization in Gentner et al. (2012) (see Sect. S1c). SPECIATEv5.1 contains thousands of explicit species and many mixtures of compounds (e.g., oils, unspeciated terpenes) reported by previous studies. Recent studies have constrained the unknown portion of IVOCs and VOCs with lumped groups resolved by volatility and often by structure/functionality features (e.g., branched, cyclic, oxygenated). We leveraged the representative compound structures in SPECIATE developed by Pye et al. (2023) to classify these emissions by functional groups and their subsequent atmospheric chemistry. Table S2 summarizes the new IVOC profiles. Species-based ozone and OA potential were calculated for each emission source using relationships from Seltzer et al. (2021), which were expanded by Pye et al. (2023).
2.2.2 CROC emissions and speciation
We estimated effective OM emission factors using the MOVES-predicted national total OM emissions normalized to the total fuel usage for each source (see Sect. S1). The MOVES model relied on conventional measurements of total PM emissions sampled and weighed on Teflon filters. The profiles available in the SPECIATE database, meanwhile, provide the weight percent of OC measured by thermal–optical techniques from samples collected on quartz filters (CFR, 2023) normalized by coincident bulk PM measurements from the Teflon filter (see Sect. S5). SPECIATE profiles also include a source-dependent OM/OC factor to adjust for non-carbon organic mass (i.e., hydrogen, oxygen), which represents OM once added to OC (Table S1a) (Reff et al., 2009; Simon et al., 2011). Previous studies have demonstrated that OM emission factors vary with changing temperature and OM loading (Lipsky and Robinson, 2006; Robinson et al., 2010; May et al., 2013a, b; Jathar et al., 2020). AQMs that have taken this behavior into account typically distributed OM emissions among volatility bins using reference distributions. May et al. (2013a, b) constrained parameters for calculating volatility-resolved emissions assuming OC is measured on a quartz filter. Although this approach performs well for average cases, it is less accurate when applied to sources that are low or high emitting, for which absorptive partitioning biases are more substantial (Fig. 2). For an exceedingly low-emitting source (low OM loading), SVOC emissions that would normally partition to the particle phase under ambient conditions could go undetected as they pass through the filter.
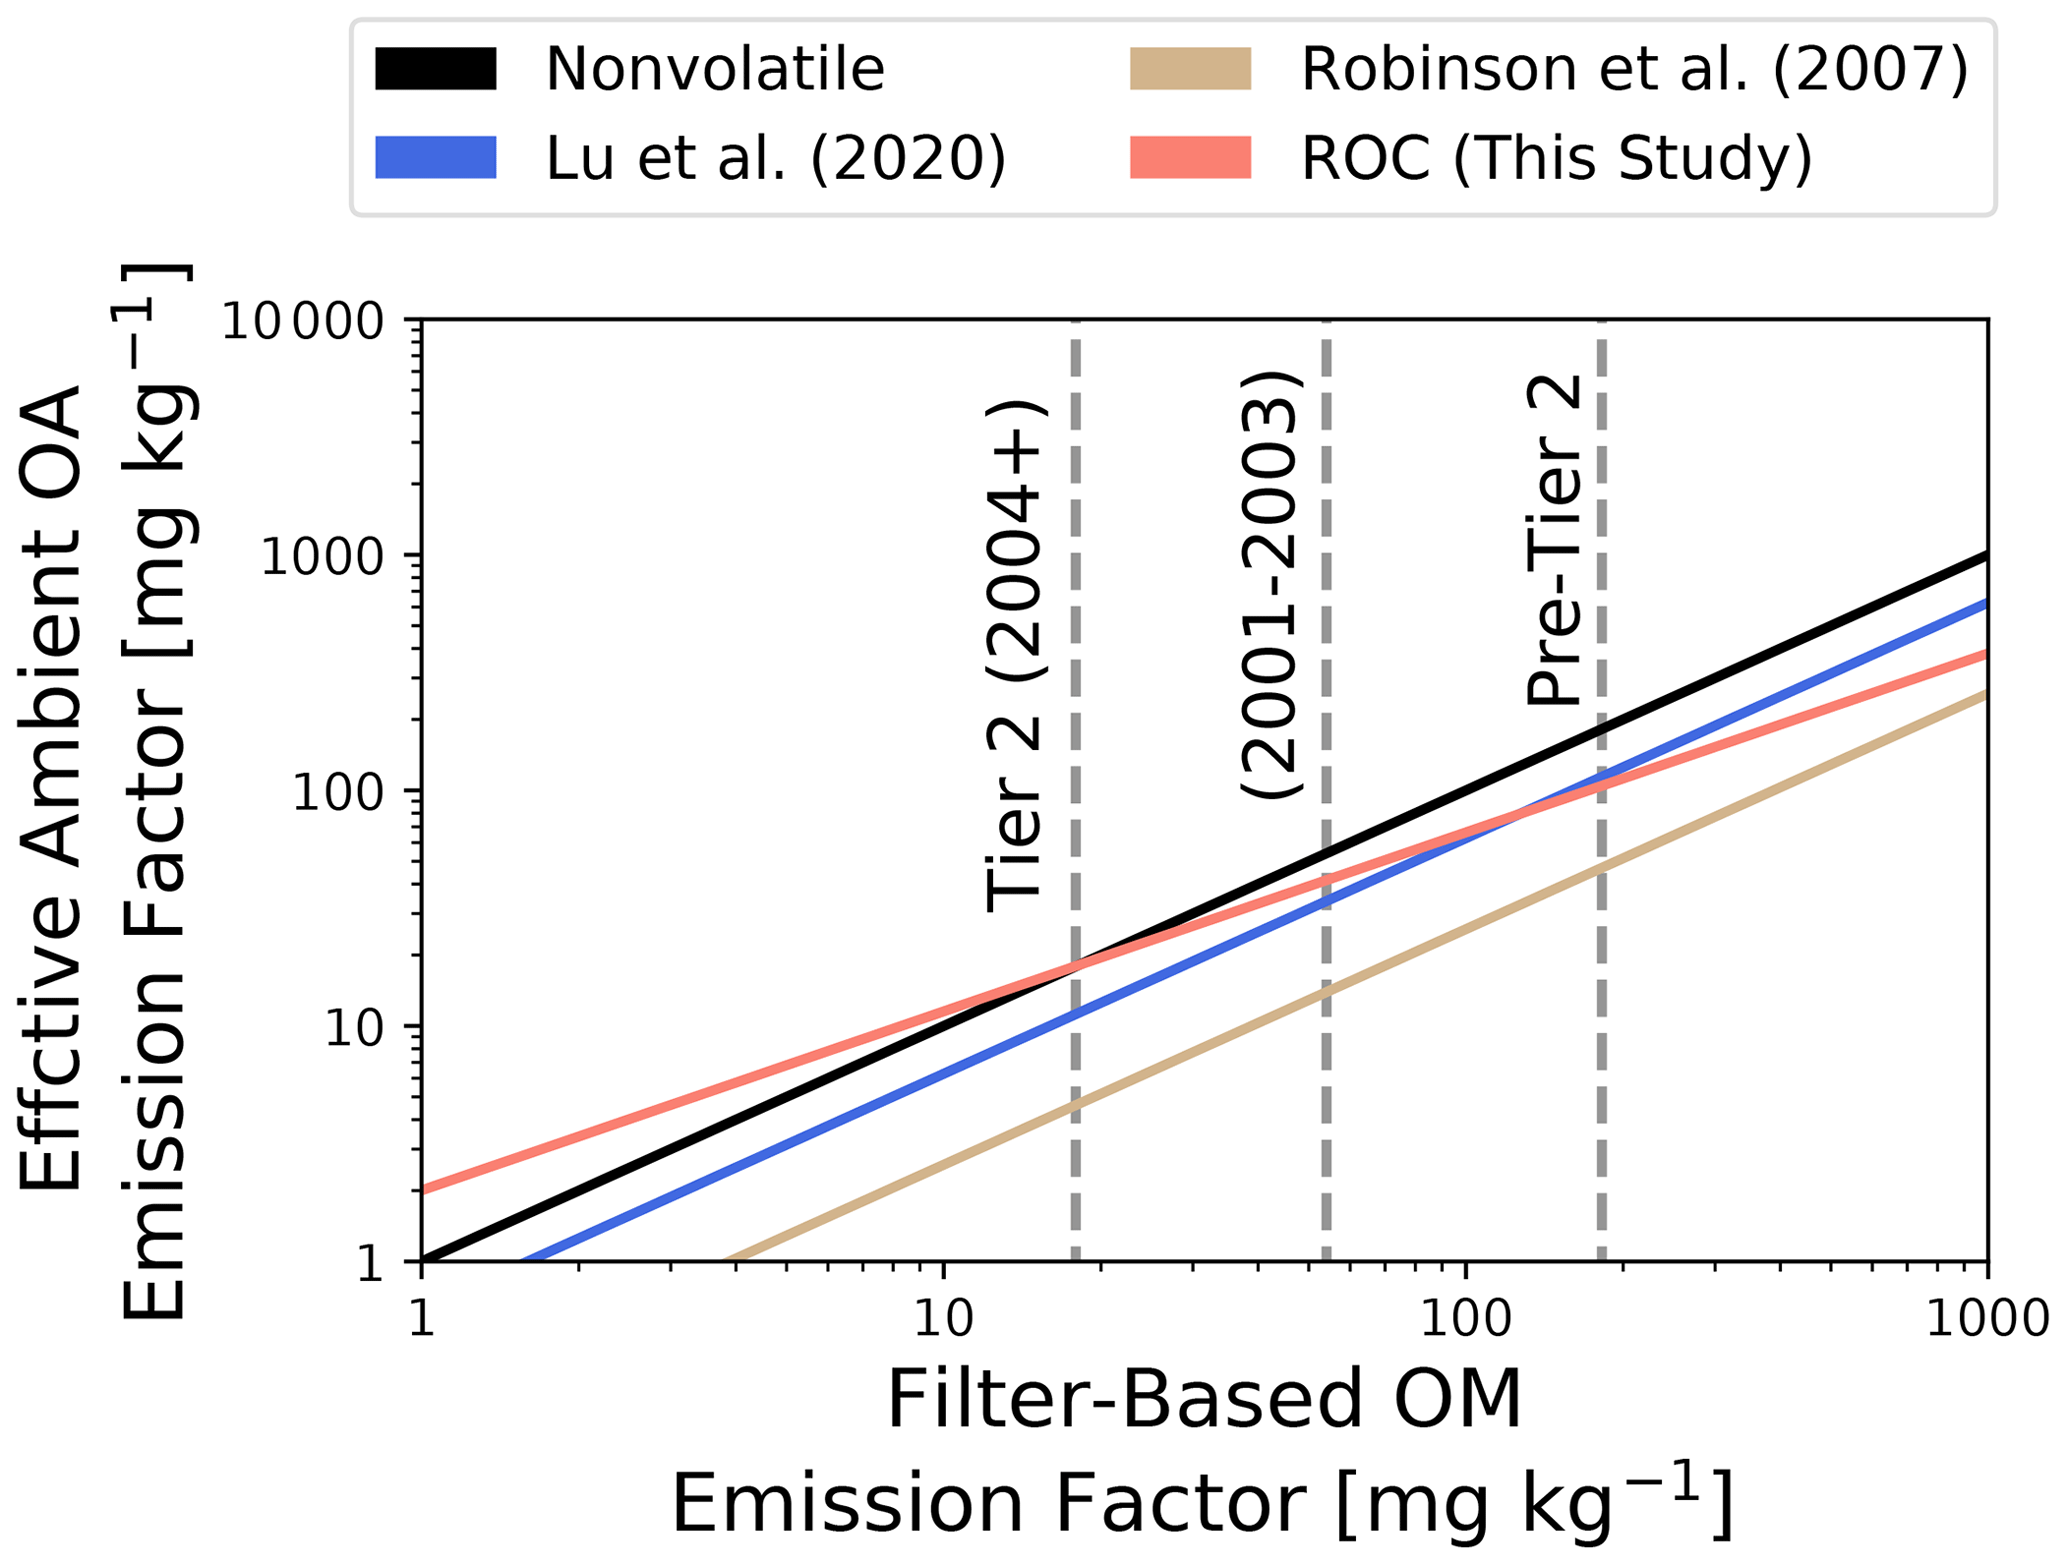
Figure 2Effective ambient primary organic aerosol emission factor estimated at 298 K and 10 µg m−3 as a function of the OM emission factor for on-road gasoline-fueled vehicles.
Additionally, reported OM emissions are sometimes artifact-corrected using a secondary quartz filter behind the Teflon filter sample, which allows for adsorbed SVOCs and IVOCs to be neglected. Because these corrections are not uniformly applied across all studies, May et al. (2013a, b) reported reference volatility profiles assuming OM emission factors had not been adsorptive-artifact corrected. Yet this is not always applicable for the emission rates informing MOVES and must be resolved at the source level based on the underlying emission data. To address both adsorptive and absorptive partitioning biases, we applied CROC OM parameterizations developed from detailed measurement data and informed by filter-based OM emission factors (see Sect. S6) (May et al., 2013a, b; Huang et al., 2018; Jathar et al., 2020). The method accounted for filter artifact corrections by adding missing SVOC emissions for low OM-loading tests and neglecting IVOCs and higher-volatility SVOCs that would be captured on the front filter during high OM-loading tests. The CROC OM parameterization for on-road gasoline was based on data from 64 vehicles and so was more robust than the parameterization for on-road heavy-duty diesel with particulate filters (DPFs), which was based on 3 vehicles (Sect. S7), or the aircraft engine parameterization, which was based on one sample. These datasets showed that it was possible to represent the relationship between OM emission factor and CROC emission factor without explicitly considering variations in temperature and OM concentration. This simplified approach was limited to mobile sources because temperature was tightly controlled by test method requirements (i.e., 47 ∘C). We used temperature to calculate C∗ of partitioning components and then calculate total CROC (e.g., Fig. S4). Because the resulting CROC emission factor was highly correlated with OM emission factor, the simplified functions associating them accounted for variations due to the underlying volatility distribution and increases in concentration with emission factor. More work is needed to better constrain the CROC OM parameters.
The impact of this new approach for translating inventory OM emissions is shown in Fig. 2. We used the on-road gasoline light-duty cold-start volatility profile in Table S5 to estimate the effective ambient organic aerosol emission factor at 298 K and COA equal to 10 µg m−3 given a filter-based OM emission factor in mg kg−1 fuel. Also shown are trends using parameters reported by Robinson et al. (2007) and Lu et al. (2020), which have been used in contemporary air quality models. The filter-based OM emission factor (EFOM) was multiplied by the volatility distribution, and VBS partitioning theory (Eq. 1) was used to calculate the effective ambient OA emission factor (EFOM,Amb):
where ntot was the number of volatility parameters in the vector α, and ambient conditions were defined to be 298 K and 10 µg m−3. The Lu et al. (2020) and Robinson et al. (2007) trends are directly proportional to the nonvolatile emission factor because they do not consider nonlinear dependence on the filter-based OM emission factor. Meanwhile, the ROC approach enhances emissions at low emission factors (to correct for SVOC breakthrough) and reduces them at high emission factors (to remove IVOCs partitioning to the filter). Also shown in Fig. 2 are representative filter-based OM emission factors for pre-Tier 2, Tier 2 (2001–2004), and Tier 2 (2004+) vehicles, which together exhibit emissions reductions with newer standards. For the older vehicles, the Lu et al. (2020) and Robinson et al. (2007) approaches give similar estimates for effective ambient OM as the new approach, but as emission factors decrease, those methods may overpredict evaporation and underpredict the particle emission factors. At the lowest OM emission factors, even using the nonvolatile approach may underpredict effective ambient OA emission factors because significant SVOCs could have broken through the filter and should be considered for ambient partitioning.
We did not adjust GROC emissions in response to CROC OM conversion, but the sum of total ROC emissions for each source did not change substantially from the sum of NMOGs and OM (Fig. S22). We updated existing SPECIATE profiles with volatility distributions of LVOCs and SVOCs normalized to CROC (Table S5a). Because data on the functionality of these low-volatility emissions are lacking, we assumed they share similar chemical properties (i.e., reactivity) to linear alkanes as a proxy for more complex mixtures of aliphatics and other compounds.
2.3 Air quality model configuration
We used an updated version of the Community Multiscale Air Quality (CMAQ) model v5.4 to quantify the impact of the new mobile emissions on regional-scale air quality (U.S. EPA, 2022; Appel et al., 2021). Hourly ambient air concentrations of OA and O3 were simulated for the entire year 2017 at 12 km horizontal resolution with inputs from EPA's air QUAlity TimE Series (EQUATES) project (U.S. EPA, 2021a; Foley et al., 2023). Meteorology was simulated with WRFv4.1.1. The Biogenic Emission Inventory System (BEIS) predicted biogenic gas emissions online in CMAQv5.4. Gas- and aerosol-phase chemistry were modeled with the Carbon Bond 6 mechanism (CB6r3_AE7) with updates for production of SOA from mobile IVOCs implemented by Lu et al. (2020). Anthropogenic emissions are described in the U.S. EPA 2017 emission platform technical science document and EQUATES documentation (U.S. EPA, 2021b, a). Mobile emissions for 2017 were recalculated in order to update speciation and apply both IVOC NMOG and CROC OM adjustments. The CMAQ–ROC simulation implemented all revisions to mobile elemental carbon (EC) speciation described in Sect. S2 and the methods described in Sect. 2.2.1 and 2.2.2. The EC speciation updates resulted in substantial changes to nonroad diesel, aircraft, marine, and rail sources (Table S9). Because MOVES used source- and species-specific emission rates for hazardous air pollutants (HAPs) rather than relying on generic speciation of NMOGs, ROC updates for HAPs were not propagated to the air quality model simulations, although Fig. S25 shows potential changes to national-scale HAP emissions from updates to VOC speciation. Volatile chemical product (VCP) emissions were simulated for 2017 with the VCPy tool (Seltzer et al., 2021). Nonoxygenated and oxygenated IVOC emissions from VCPs were represented with the IVOC chemistry from Lu et al. (2020), which resulted in an average SOA yield of approximately 30 % at ambient conditions across all IVOCs. However, Pennington et al. (2021) found the oxygenated IVOC SOA yield to be 6.28 %, though this yield warrants re-evaluation with better speciation and yield data given the diverse mix of oxygenated IVOCs with varying molecule functionalities that can influence SOA production (Humes et al., 2022). Based on available information, we reduced the CMAQ-predicted VCP SOA concentrations by 33.8 % to account for the overrepresentation of SOA from VCP oxygenated IVOCs (see Sect. S7).
We assessed model performance for O3 and OC during the 2017 model year with daily-averaged measurements at routine monitoring sites. We also performed a separate CMAQ simulation for comparison that is consistent with the EQUATES project, which assumed the speciation of OM emissions from all sources was consistent with the volatility distribution of a small diesel generator (Robinson et al., 2007). This EQUATES simulation also utilized the simplified potential-combustion SOA (pcSOA) approach used in publicly available versions of CMAQ (Murphy et al., 2017). The CMAQ–ROC simulation neglected pcSOA since the role of mobile and VCP IVOC SOA formation were explicitly accounted for. Finally, we analyzed two sensitivity simulations with mobile and VCP SOA precursors each set to zero to quantify direct sector contributions to total OA. This approach did not account for the contributions these sectors make to the atmospheric oxidant capacity through emissions of low-molecular-weight VOCs and nitrogen oxides.
3.1 Volatility-resolved mobile source ROC emissions
Using the 2016 annual predictions from MOVES and the other mobile emission models processed and speciated with the ROC approach, we explore for the first time a complete bottom-up inventory of organic carbon emissions from mobile sources in the United States. Figure 1 shows the results of the ROC and conventional approaches for one example source: on-road heavy-duty diesel equipped with particulate filters. Non-organic particulate matter species such as ions and other PM are equivalent in both approaches. Nonvolatile OM emissions in the conventional approach are distributed in the ROC approach to a range of SVOCs and IVOCs, which are predominantly alkanes and branched compounds for diesel sources. The magnitude of emission factors for compounds in the VOC volatility range from on-road diesel sources is reduced by 47.8 % due to the introduction of IVOCs (IVOC GROC = 52.2 %), and the distribution of VOC functionality is changed substantially due to adoption of VOC speciation profiles from Lu et al. (2018). Unknown ROC mass is also reduced from 7 % of total emissions to 0.7 % after introducing IVOCs. Emission factors vary by orders of magnitude across mobile sources, motivating careful accounting of sampling biases (Figs. S18–S21), which requires the ROC approach in the emission modeling workflow to be complex and involve multiple tools and intermediate steps (Fig. S1).
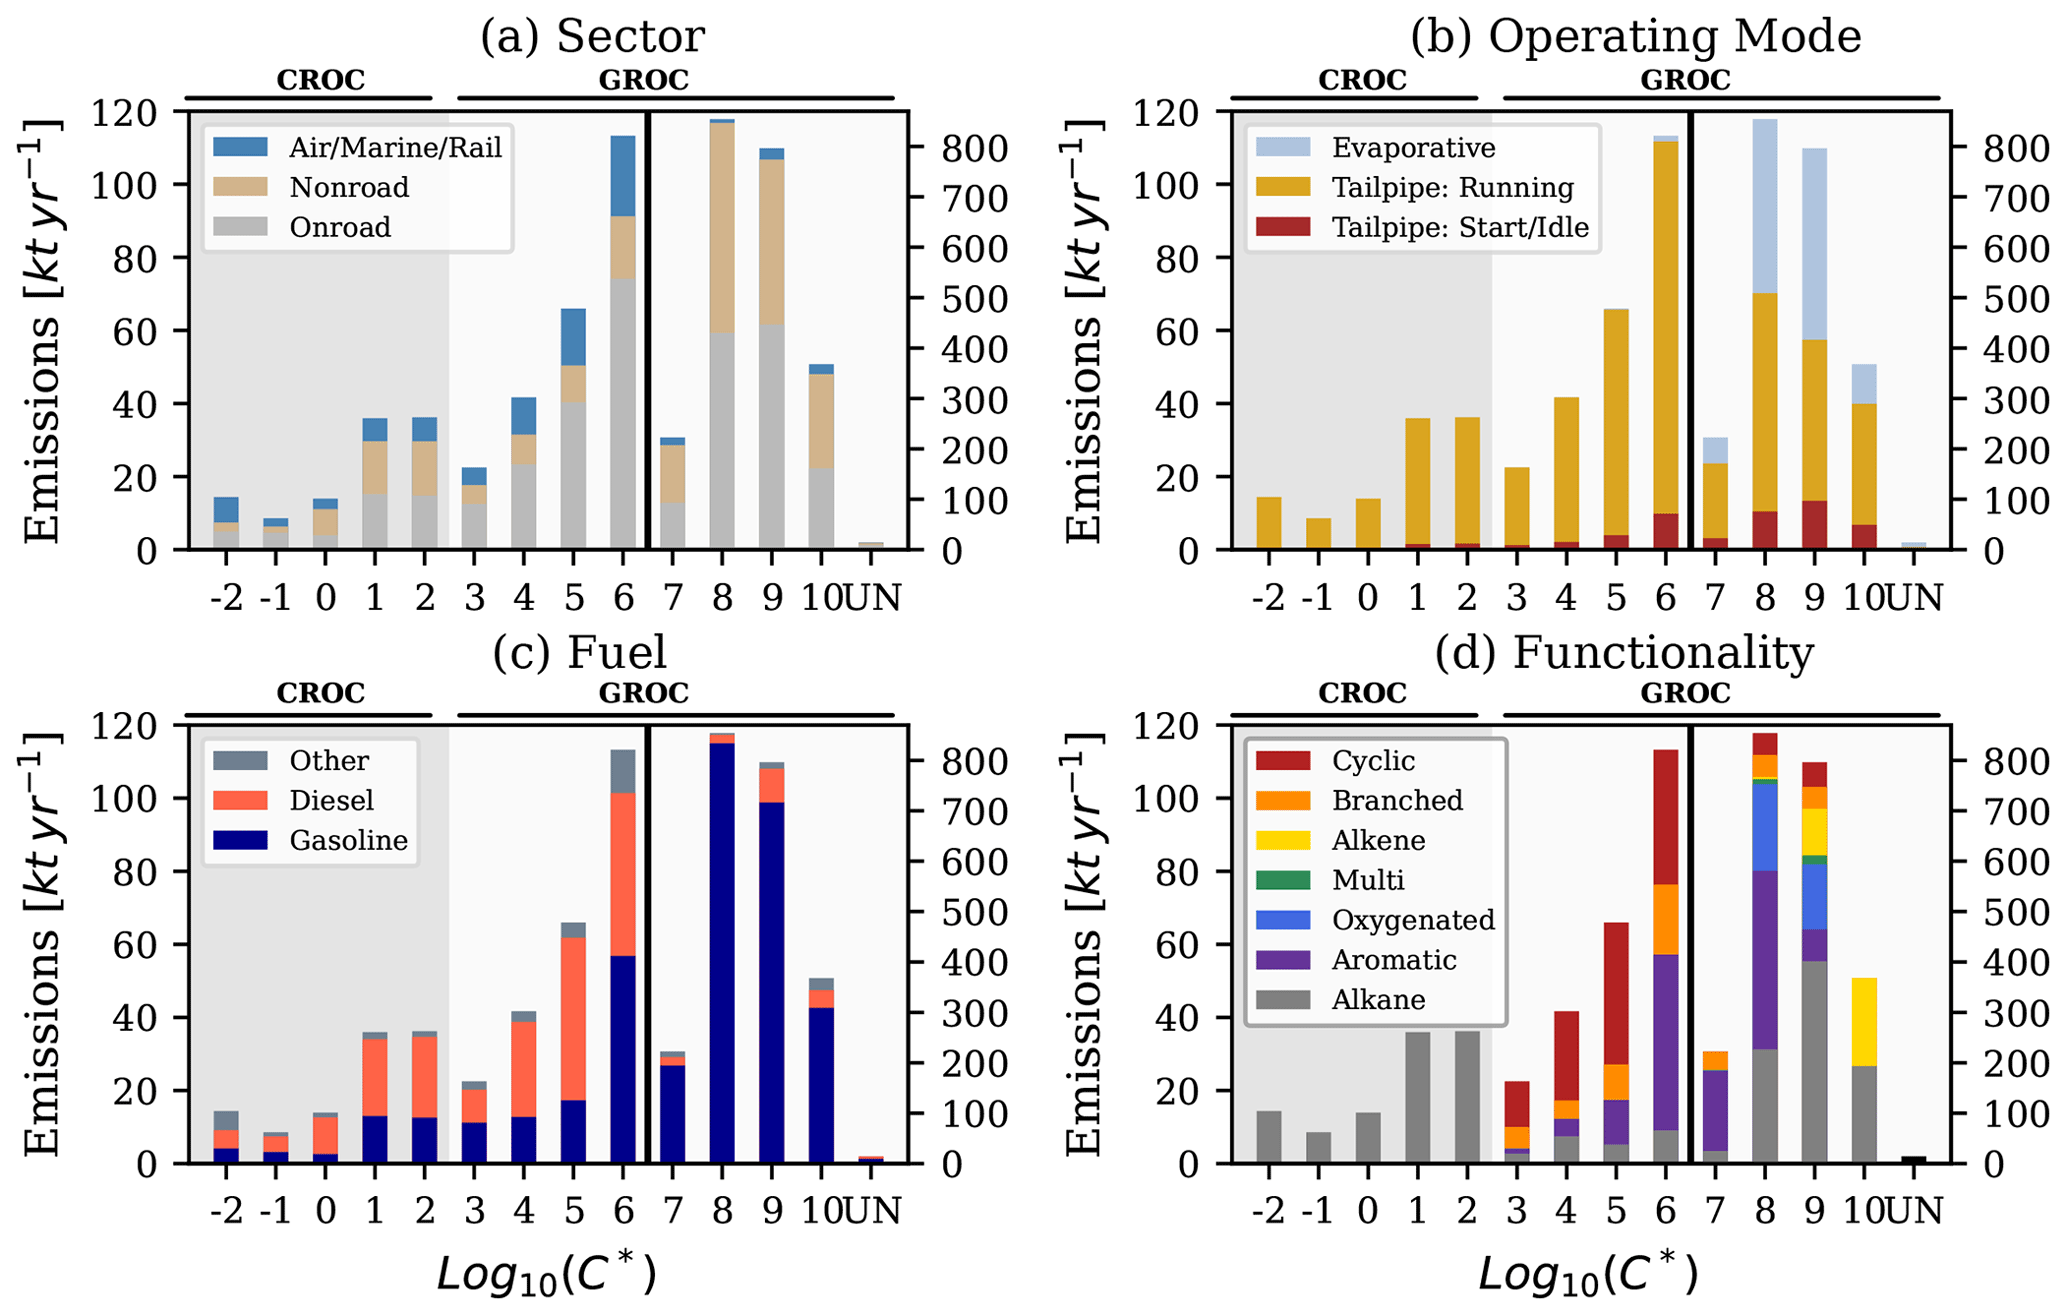
Figure 3Volatility-resolved mobile source ROC emissions for the contiguous United States during 2016 stratified along several dimensions including category (a), operating mode (b), fuel (c), and chemical functionality (d). The “multi”-functionality series corresponds to compounds that are both oxygenated and have double carbon bonds. Bins to the left of the solid black line are quantified by the left y axis and those to the right by the right y axis. The unknown emissions (UN) are not assigned to a volatility bin and do not contribute to OA or O3 formation.
Figure 3 shows the predicted contributions of source types and functional groups across the volatility spectrum for 2016 ROC inventory. The VOC emissions are roughly evenly distributed between on-road and nonroad sources (1130 and 1045 kt yr−1, respectively), IVOCs are weighted towards on-road (62 %), and CROC (i.e., SVOCs and larger compounds) is roughly split among on-road, nonroad, and others. Tailpipe (i.e., exhaust) emissions while running represent the majority across all volatility categories (56 % of total ROC), although evaporative sources are important in the VOC range (38 %) and similar to prior estimates (Gentner et al., 2009). It could be counter-intuitive, given laboratory data on start and idle emission factors, that the start/idle operating mode does not contribute more to total ROC emissions. This result could be due in part to substantially more time spent by sources in the running mode during normal operation, but it could also be partly due to MOVES neglecting start modes for nonroad sources. Drozd et al. (2018) found that cold-start IVOC fuel-based emission factors are about 6 times larger than those from hot-running-start emissions for newer vehicles, which is consistent with the post-Tier 2 gasoline vehicles in this work. For older vehicles though, the ROC inventory predicts greater IVOC emissions factors for hot-running modes than cold-start modes for older vehicles (Tables S1a and 2). Further research is needed to constrain NMOG emission factors and IVOC NMOG ratios for older (pre-2004) vehicles that are expected to have contributed approximately 72 % of on-road gasoline ROC emissions during 2017 (see Fig. S24 and Table S1a).
Emissions from gasoline-fueled sources dominate the VOC range in Fig. 3, but diesel-fueled sources, of which there are far fewer in the United States, dominate the IVOC range, whereas sources using both fuels are important for CROC emissions. Mobile source VOCs comprise many functionalities, and aromatics make a substantial contribution. The higher-volatility IVOCs have mass associated with aromatics from gasoline sources, but cyclic hydrocarbon compounds contribute to IVOCs across all volatilities, a feature reported by Zhao et al. (2015). We currently lack data to specify CROC functionality across all mobile categories, so we have labeled them alkane-like based on observations of motor vehicle POA emissions (Worton et al., 2014). Improved CROC speciation is needed, especially given the importance of functionality to SOA formation (Lim and Ziemann, 2009; Yee et al., 2013).
3.2 Impact of filter artifacts
Transitioning from the conventional approach to the ROC approach has implications for near-source particle concentrations and prompt SOA production. Figure 4 shows the contributions of mobile categories with results using approaches from previous work (Murphy et al., 2017; Lu et al., 2020). The conventional approach assumes all OM stays in the particle phase, which has been shown to lead to poor AQM performance (Murphy et al., 2017). The Robinson et al. (2007) case, which is consistent with CMAQv5.4, applies the volatility distribution for a small nonroad diesel engine, where half the OM mass is assumed to be IVOCs adsorbed to filters and is thus volatilized. As seen in Fig. 4, only 25 % of the OM persists in the particle after evaporation in the Robinson et al. (2007) approach. Lu et al. (2020) applied gasoline and diesel-specific volatility profiles parameterized for emissions from in-use vehicles to the entire mobile category, leading to less evaporation of OM than the Robinson et al. (2007) approach. Lu et al. (2020) also applied a conversion factor of 1.4 to all mobile gasoline-fueled sources to account for missing SVOCs.
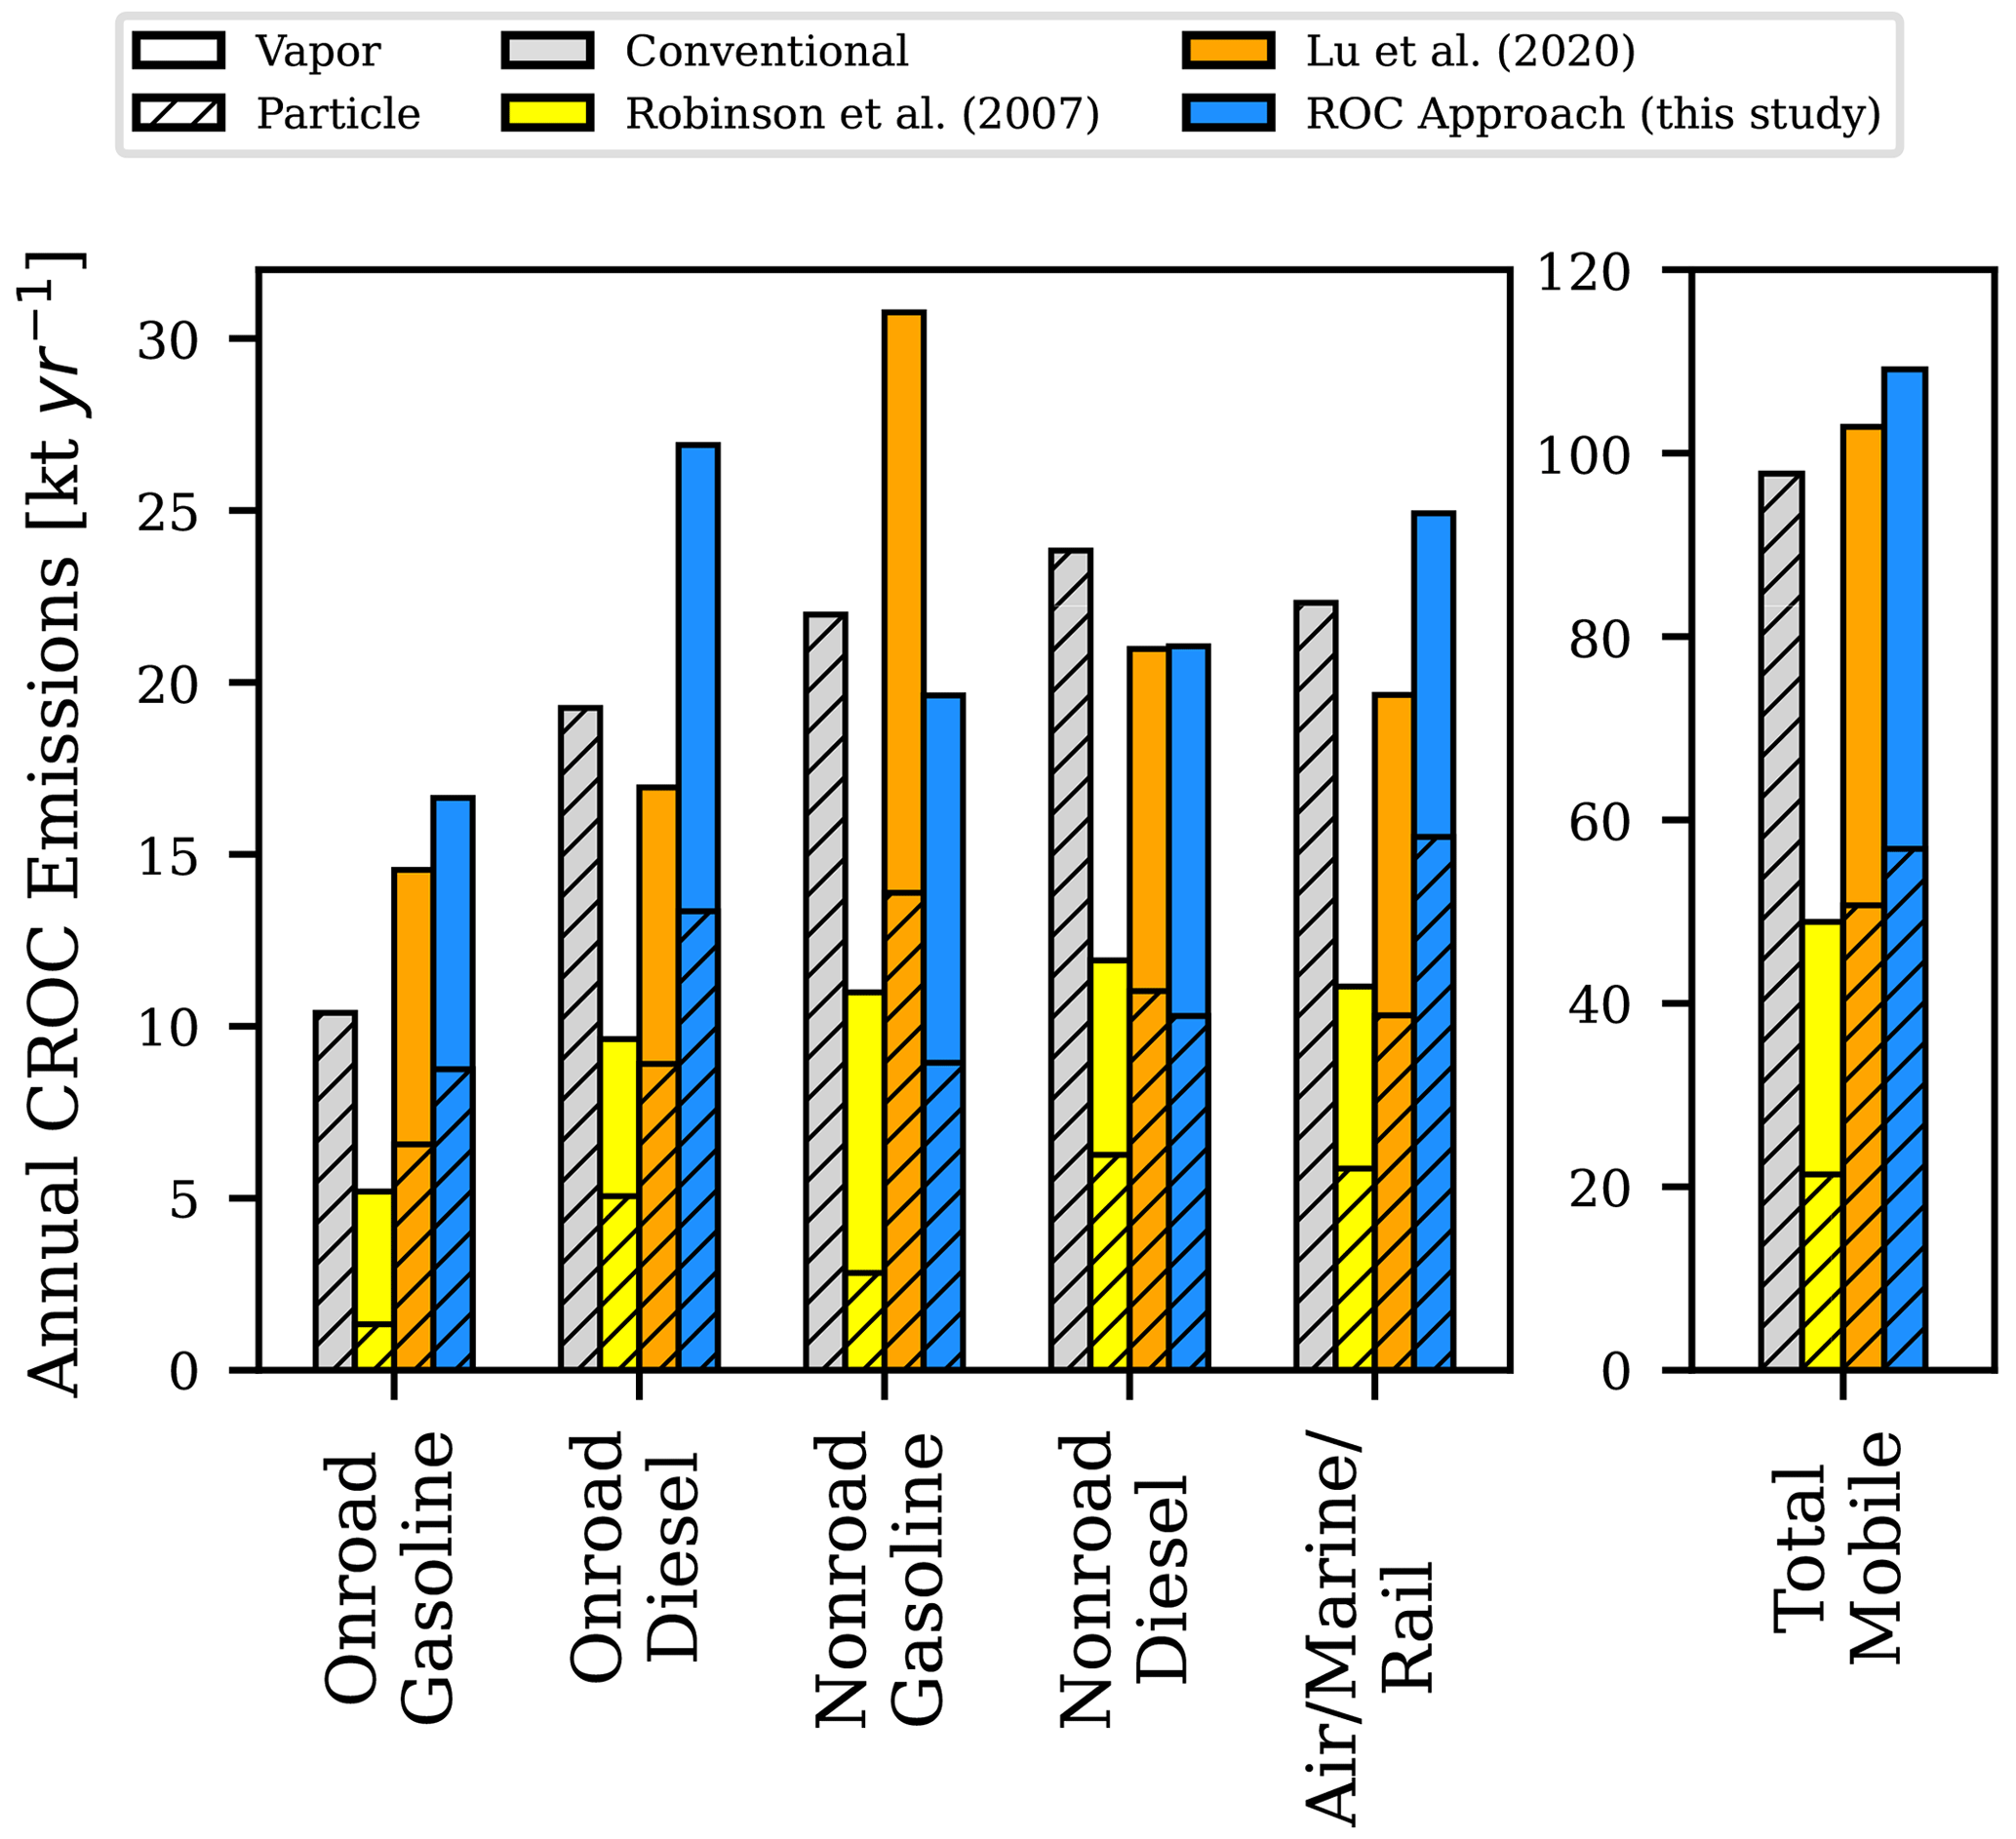
Figure 4Bottom-up predictions of 2016 annual mobile CROC (i.e., SVOC, LVOC, and lower-volatility compound) emissions classified by category, model approach, and equilibrium phase distribution. The full height of each bar corresponds to total CROC emissions. Gas-particle partitioning is calculated for atmospherically relevant conditions at 298 K and organic aerosol loading of 10 µg m−3.
In the ROC approach here, we apply source-specific adjustment factors (Table S6) and volatility profiles (Table S5) and find similar results for on-road gasoline and nonroad diesel compared to Lu et al. (2020). However, on-road diesel CROC emissions are increased by 60 % relative to the CROC emissions from the Lu et al. (2020) approach, driven by the inclusion of missing SVOCs from clean test conditions for diesel engines with DPFs. Conventional OM emissions from nonroad sources are greater than those from on-road for both gasoline- and diesel-fueled sources. Nonroad gasoline emissions reduced by 36 % relative to Lu et al. (2020) where emission factors are large, and CROC OM is much less than 1.0 (Table S6), indicating the presence of IVOCs on the filter. Predicted conventional OM emissions from air, rail, and marine sources are also important, and CROC emissions are slightly larger than OM. Across the mobile sector, total CROC emissions increased by 12 % relative to OM, and 42 % of the CROC emissions are predicted to be in the particle phase at 298 K and 10 µg m−3 organic aerosol (OA) loading.
3.3 National-scale impact on PM, O3 and HAPs
When aggregated across all mobile sources, total ROC emissions are nearly identical between the conventional approach and ROC approach (Fig. 5). Total IVOC emissions represent only 10.2 % of total GROC due to the substantial role of VOCs from gasoline sources to ROC emissions in the United States. The spatial distribution of IVOC and CROC emissions highlight the key role of cities, highways, and shipping lanes (Fig. S26). We calculate the OA potential as the sum of particle-phase mass (calculated at 298 K and 10 µg m−3) for each species and the SOA yield of the vapor-phase component of each species. Mobile source OA potential has contributions from all ROC volatility classes with 6.8 % from LVOCs, 25.4 % from SVOCs, 19.1 % from IVOCs, and 48.7 % from VOCs (Fig. 5). The estimated VOC OA potential is mainly driven by adjusted yields of aromatic VOCs, which are enhanced over previous work due to corrections for vapor wall losses of single-ring aromatic yields (Zhang et al., 2014). These metrics possibly reflect an upper bound on VOC and IVOC contribution as they apply SOA yields to the precursor emission without consideration of reaction rates, timescales, or competitive losses of precursors and intermediates to deposition. Potential OA relative contributions from air, marine, and rail (12 %) and on-road diesel (16 %) sources play a larger role in OA potential when emissions are estimated with the ROC approach, while nonroad gasoline and diesel (38 %) and on-road gasoline potential OA (34 %) decrease (Fig. 6). While aromatic species dominate OA potential in the VOC precursor range, in the IVOC range OA potential has larger contributions from cyclic alkane compounds from on-road diesel sources (Fig. S23). In the LVOC range and below, the ROC approach assumes only alkane-like species; improvements to the SPECIATE database and emissions modeling tools will support increased detail on compound functionality when provided by future studies.
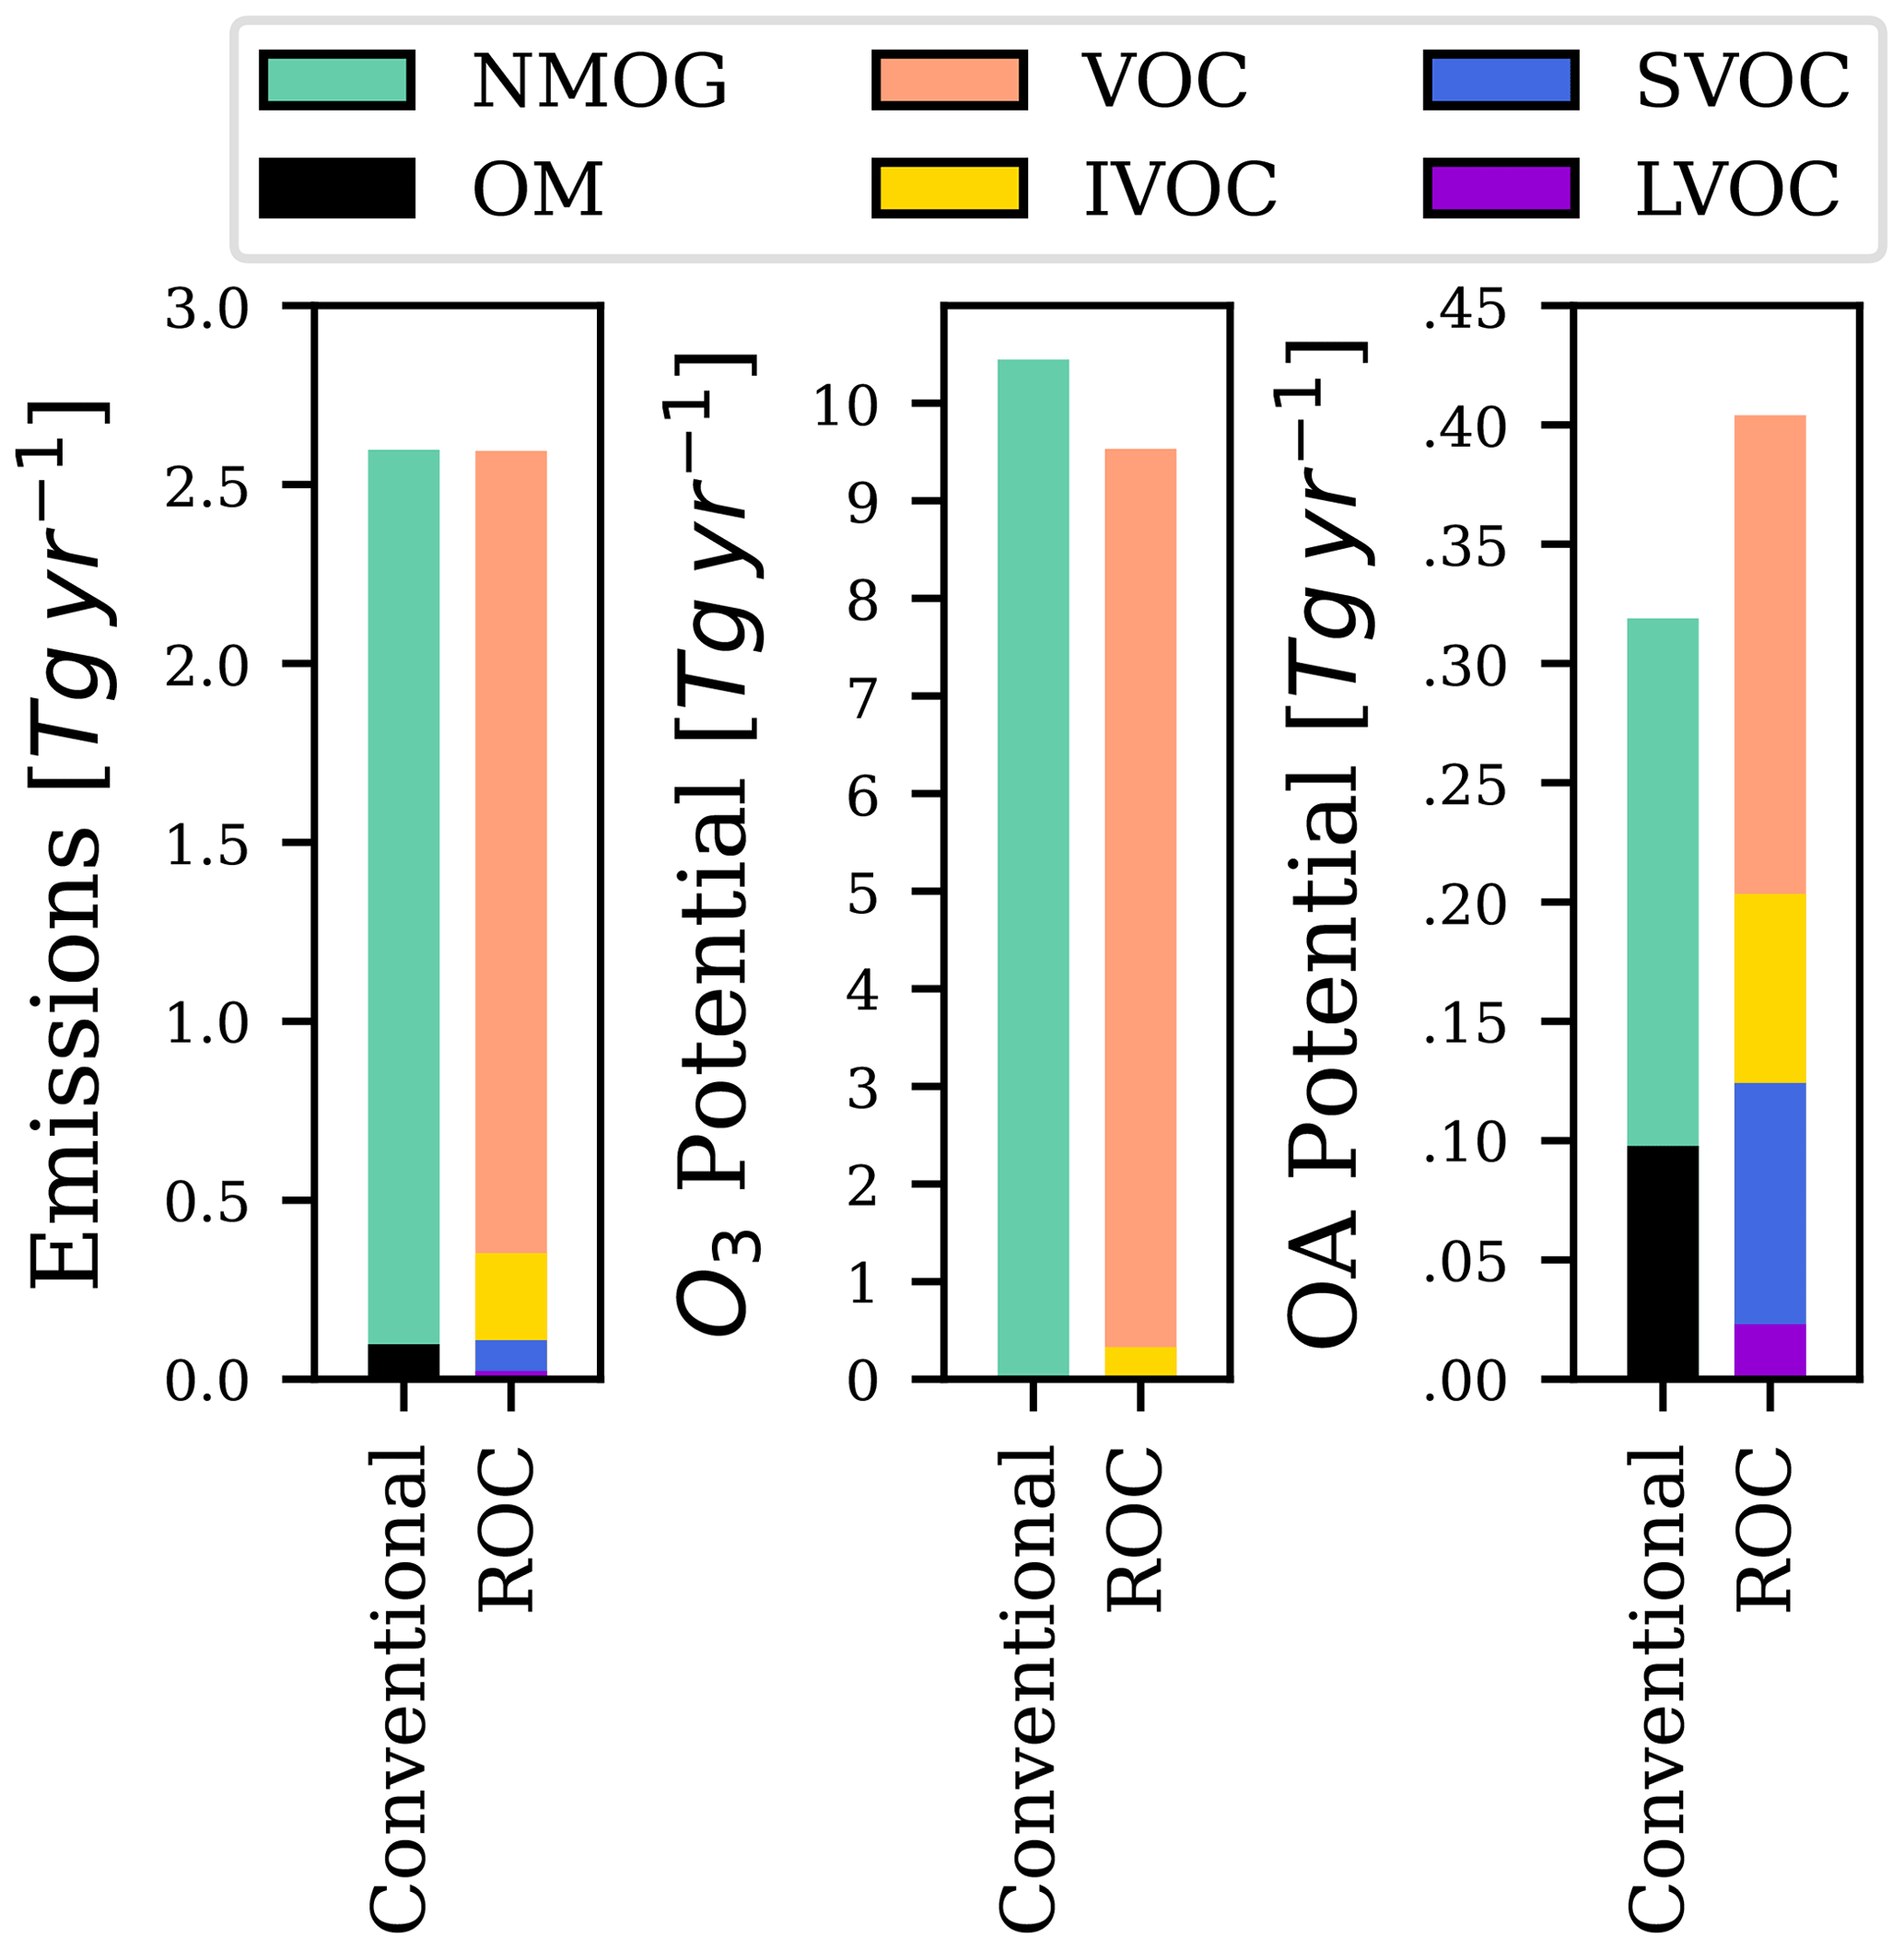
Figure 5Total US mobile source emissions for 2016 with aggregate O3 and OA potential calculated at the species level.
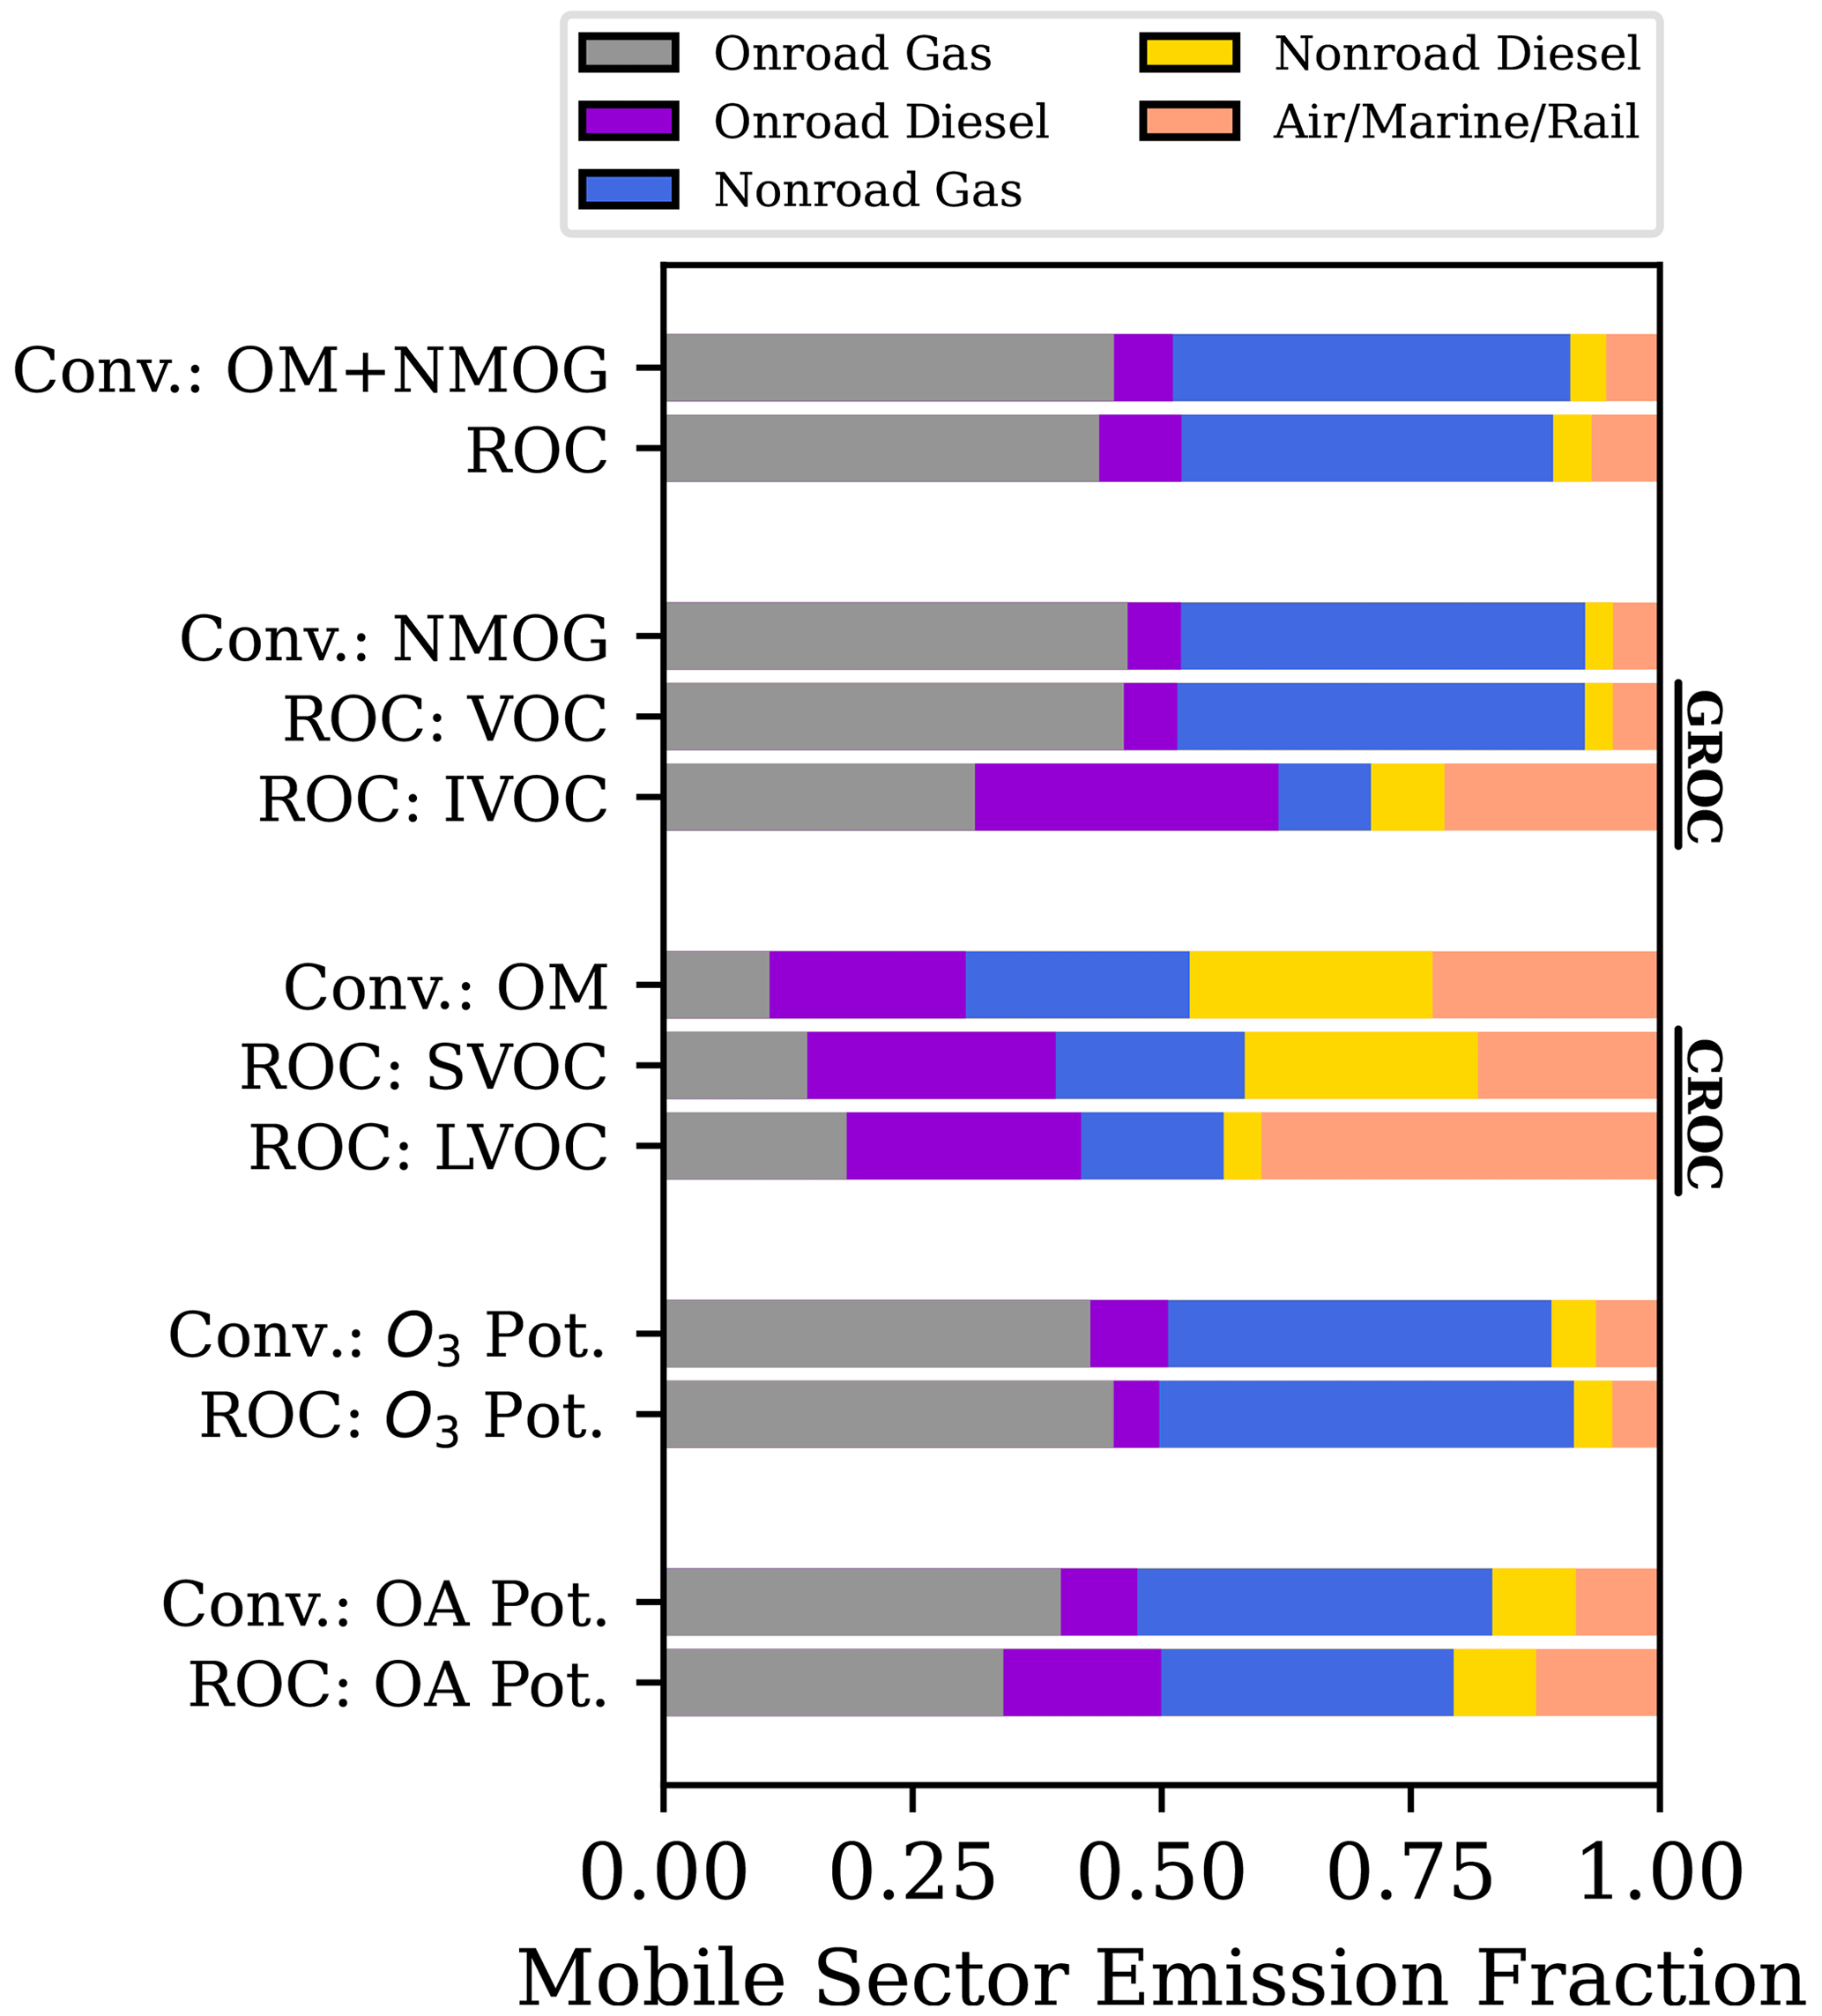
Figure 6Mobile sector contributions to ROC classes and derived quantities like O3 and OA potential. Values are presented for the conventional and ROC-based approaches.
VOCs account for 97 % of the ozone potential approximated by maximum incremental reactivity (MIR), and the total ozone potential decreases by 8.9 % due to the shift in mass from VOC to IVOC. The national-scale source distribution of O3 potential changes little between the conventional and ROC approaches (Fig. 6). Ozone potential is dominated by on-road and nonroad gasoline sources in the highest ROC volatility bins, driven by alkane, aromatic, and oxygenated species, as expected (Fig. S23). Among on-road light duty gasoline vehicles, 72 % of ROC emissions, 68 % of O3 potential, and 79 % of OA potential are predicted to come from pre-Tier 2 vehicles, while these vehicles account for 19 % of the fuel used in 2017 (Fig. S25). Heavy-duty diesel vehicles without particulate filters or selective catalytic reduction systems contribute 87 % of ROC emissions, 85 % of O3 potential, and 91 % of OA potential while using 31 % of the fuel for the heavy-duty diesel on-road category.
National-scale HAP emissions changed substantially with updates in VOC speciation and introduction of IVOCs with many species decreasing by nearly 20 % or more including toluene (−19 %), hexane (−22 %), 1,3-butadiene (−34 %), and ethylbenzene (−29 %) and others increasing substantially including formaldehyde (+22 %), acrolein (+20 %), and acetaldehyde (+19 %) (Fig. S25). These results emphasize the need for more research on HAP emission factors, but we keep them constant for the CMAQ simulations to focus on OA and O3 changes.
3.4 Air quality model results
Mobile ROC emissions were generated for the year 2017 to be comparable with the EQUATES 2017 emission inputs. Differences between the EQUATES mobile inputs and those for the CMAQ–ROC simulation (Table S9) are consistent with the changes in the 2016 emission results depicted in Fig. 4. The CMAQ–ROC simulation predicts lower OC concentrations throughout the domain due to elimination of pcSOA. CMAQ–ROC predictions compared well against both O3 and OC measurements at air quality system (AQS) sites in 2017 (Figs. S28, S29 and Table S10). Normalized mean biases for OC improved (in absolute terms and on average) by 11.3 % in spring, 4.3 % in autumn, and 7.6 % in winter. In summer, the OC underprediction increased by 12 %. Overprediction in the northeast, Ohio Valley, Upper Midwest, and northwest in winter is consistent with timing and geography of residential wood combustion emissions, which may be overrepresented in both simulations. Root mean square error and correlation coefficient differences between the EQUATES and CMAQ–ROC simulations are small. CMAQ predicts both the annual mean and variability of OC concentrations well at selected US cities (Figs. S34, S35), with the exception of New York City where the model overpredicted OC by more than a factor of 2.
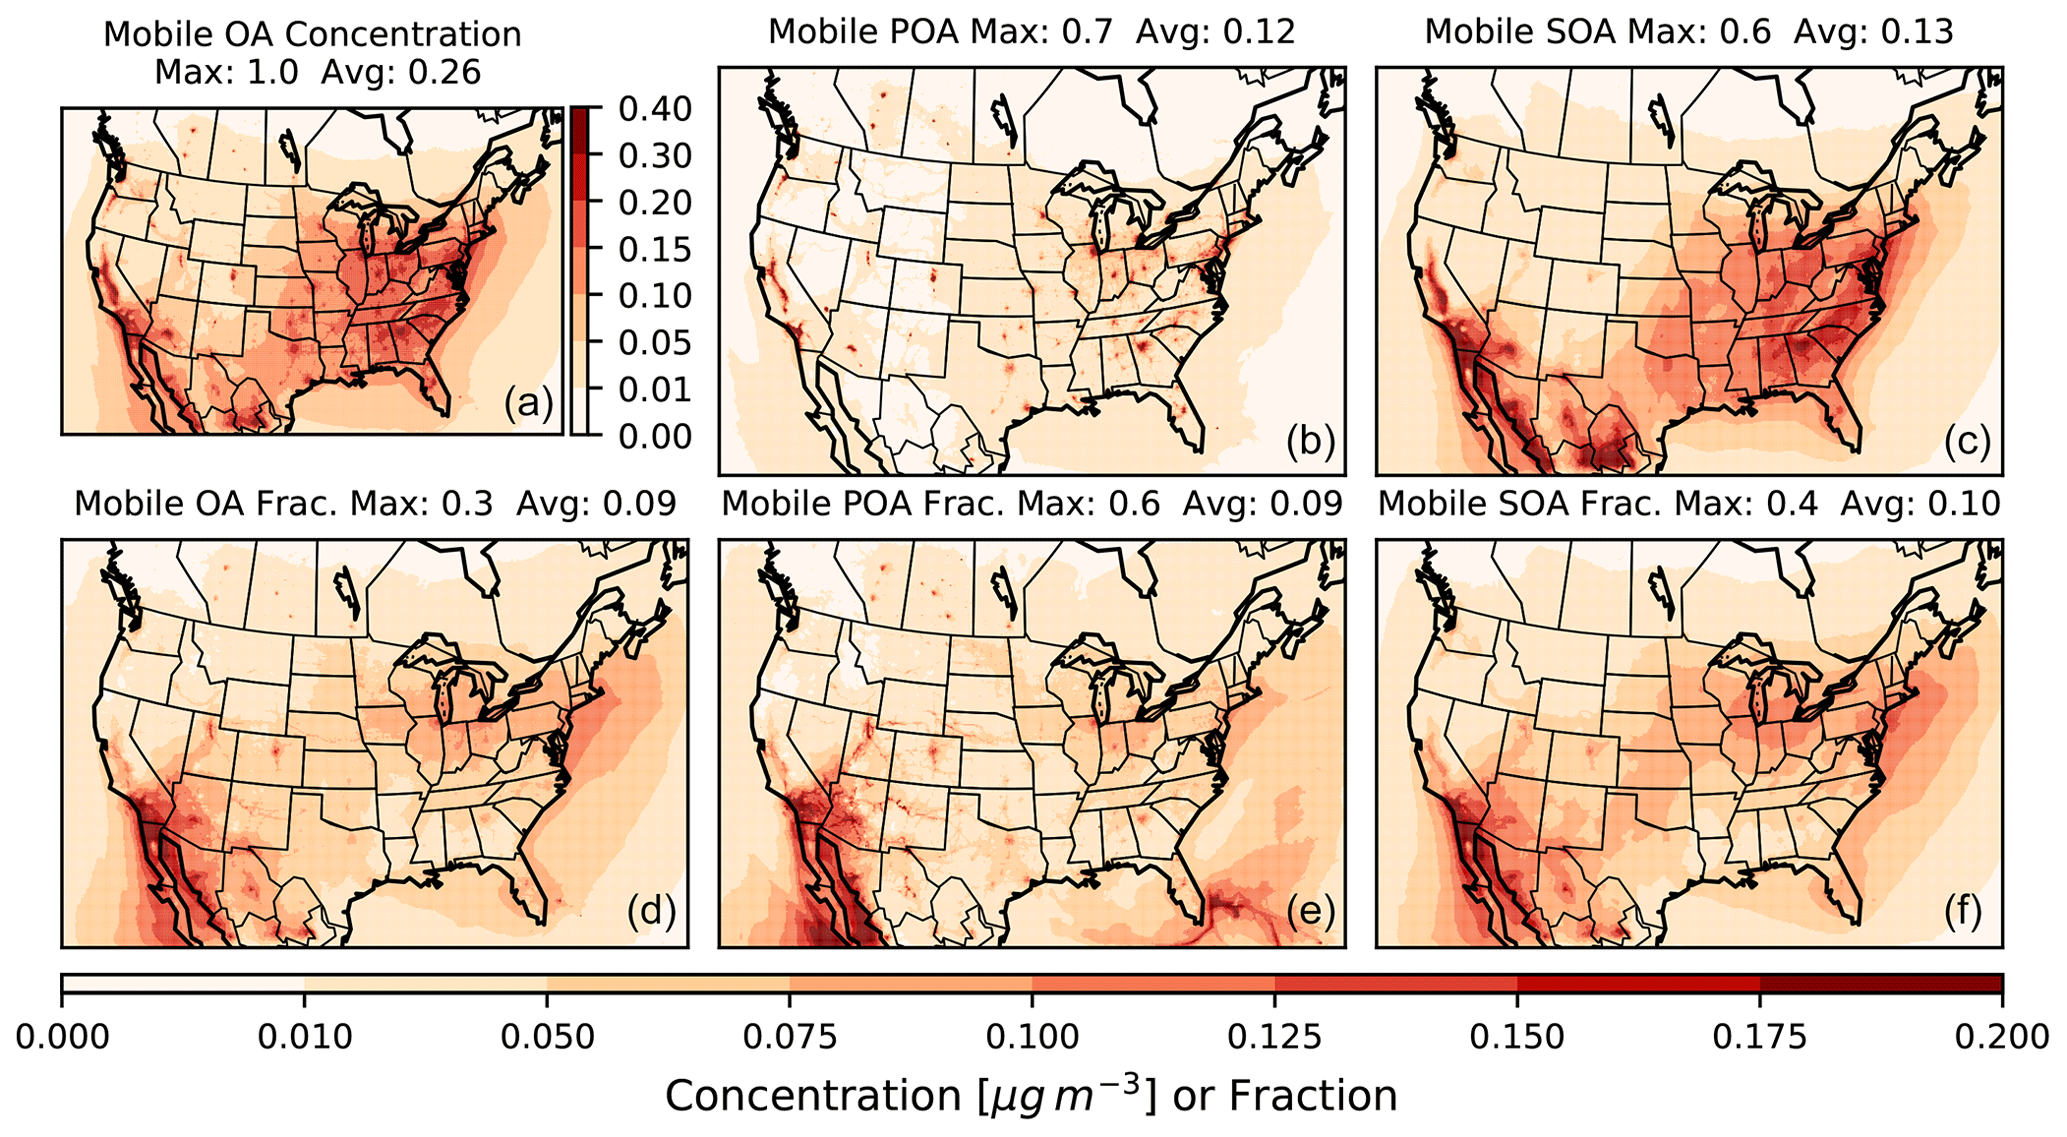
Figure 7Annual average concentration (a–c) of total OA (a, d), POA (b, e), and SOA (c, f) from mobile sources predicted by CMAQ for 2017 with the ROC mobile emission inventory. The fractional contributions of mobile sources to the total of each pollutant category from all sources are in panels (d)–(f). In all panel subtitles, “Max” refers to the spatial maximum of the annual average spatial field, while “Avg” refers to the population-weighted average of the annual average spatial field.
The predicted annual population-weighted average OA attributable to mobile sources is 0.26 µg m−3, or 9 % of the OA from all anthropogenic and biogenic sources. Mobile source contributions to POA and SOA are similar on average, with apparent spatial differences (Fig. 7). Average total mobile source OA appears stable between winter and summer seasons (Fig. S30), and this is a result of trade-offs between higher POA concentrations in winter and higher SOA in summer (Figs. S31, S32). In rural areas, model-predicted mobile OA contributions asymptote at 4.5 % of total OA, and in some urban areas they can exceed 23 % (annual averages; Fig. S33). The ratio of SOA to OA is equal to 70 % in rural areas and decreases with increasing population to 20 %–40 %. Diurnal profiles at select cities indicate SOA formation peaks at noon in Los Angeles, Denver, Chicago, and New York, but that feature is not reproduced on average in Houston and Raleigh (Figs. S34, S35).
CMAQ–ROC mobile and VCP IVOC concentrations are enhanced in urban areas with minimal seasonal differences predicted (Figs. S36, S37). Mobile sources are predicted to contribute 20 %–25 % to total IVOCs depending on location and time of year, while VCP sources contribute 59 %–66 % (Fig. S36), although IVOCs from other sources are underrepresented. The composition of ambient IVOCs predicted by CMAQ–ROC and the speciation of IVOC emissions from mobile and VCP emissions are consistent with results from Zhao et al. (2022) (Fig. S38). Since ambient IVOC concentration measurements for 2017 are lacking, we extrapolated concentrations to the CalNex campaign in 2010 and find acceptable agreement with campaign-average hydrocarbon and oxygenated IVOC observations (Sect. S8, Fig. S39a, b). Extrapolation of CMAQ–ROC SOA to 2010 underpredicts mean CalNex SOA observations by 46 % (Fig. S39c, d). Potential explanations include underestimated emissions from other sources (e.g., cooking), mischaracterized chemical processing (e.g., SOA yields), or errors in modeling regional pollution in Southern California (Lu et al., 2020).
The US annual GROC emission rate for mobile (2.49 Tg yr−1) is 20 % less than that of VCPs (3.09 Tg yr−1), but the mobile IVOC emissions (0.25 Tg yr−1) are only one-third those of VCPs (0.77 Tg yr−1). Gas-phase oxidation is responsible for less than half (42 % and 44 %) of the loss of mobile and VCP SOA-forming GROC but 88 %–90 % of the IVOC loss (Fig. 8). The annual production and loss of total OA from mobile and VCPs is similar, and loss is distributed evenly across deposition processes and transport out of the model domain. The annual rate of OA production (emission plus chemical production) estimated by CMAQ and normalized to total ROC emissions (i.e., the sum of NMOGs plus conventional OM) is 0.16 g OA (g ROC)−1, which is approximately equal to that estimated from the data in Fig. 5. This agreement is surprising considering that the latter calculation does not account for variations in OA partitioning, NOx effects on SOA yields, or competitive losses from wet scavenging and dry deposition. Seasonal trends for OA, SOA and POA production rates and ambient concentrations normalized to OM and NMOG emissions are tabulated in Table S11 and discussed in Sect. S9. These data may inform simple (e.g., screening) models of the impact of anthropogenic emissions on human exposure.
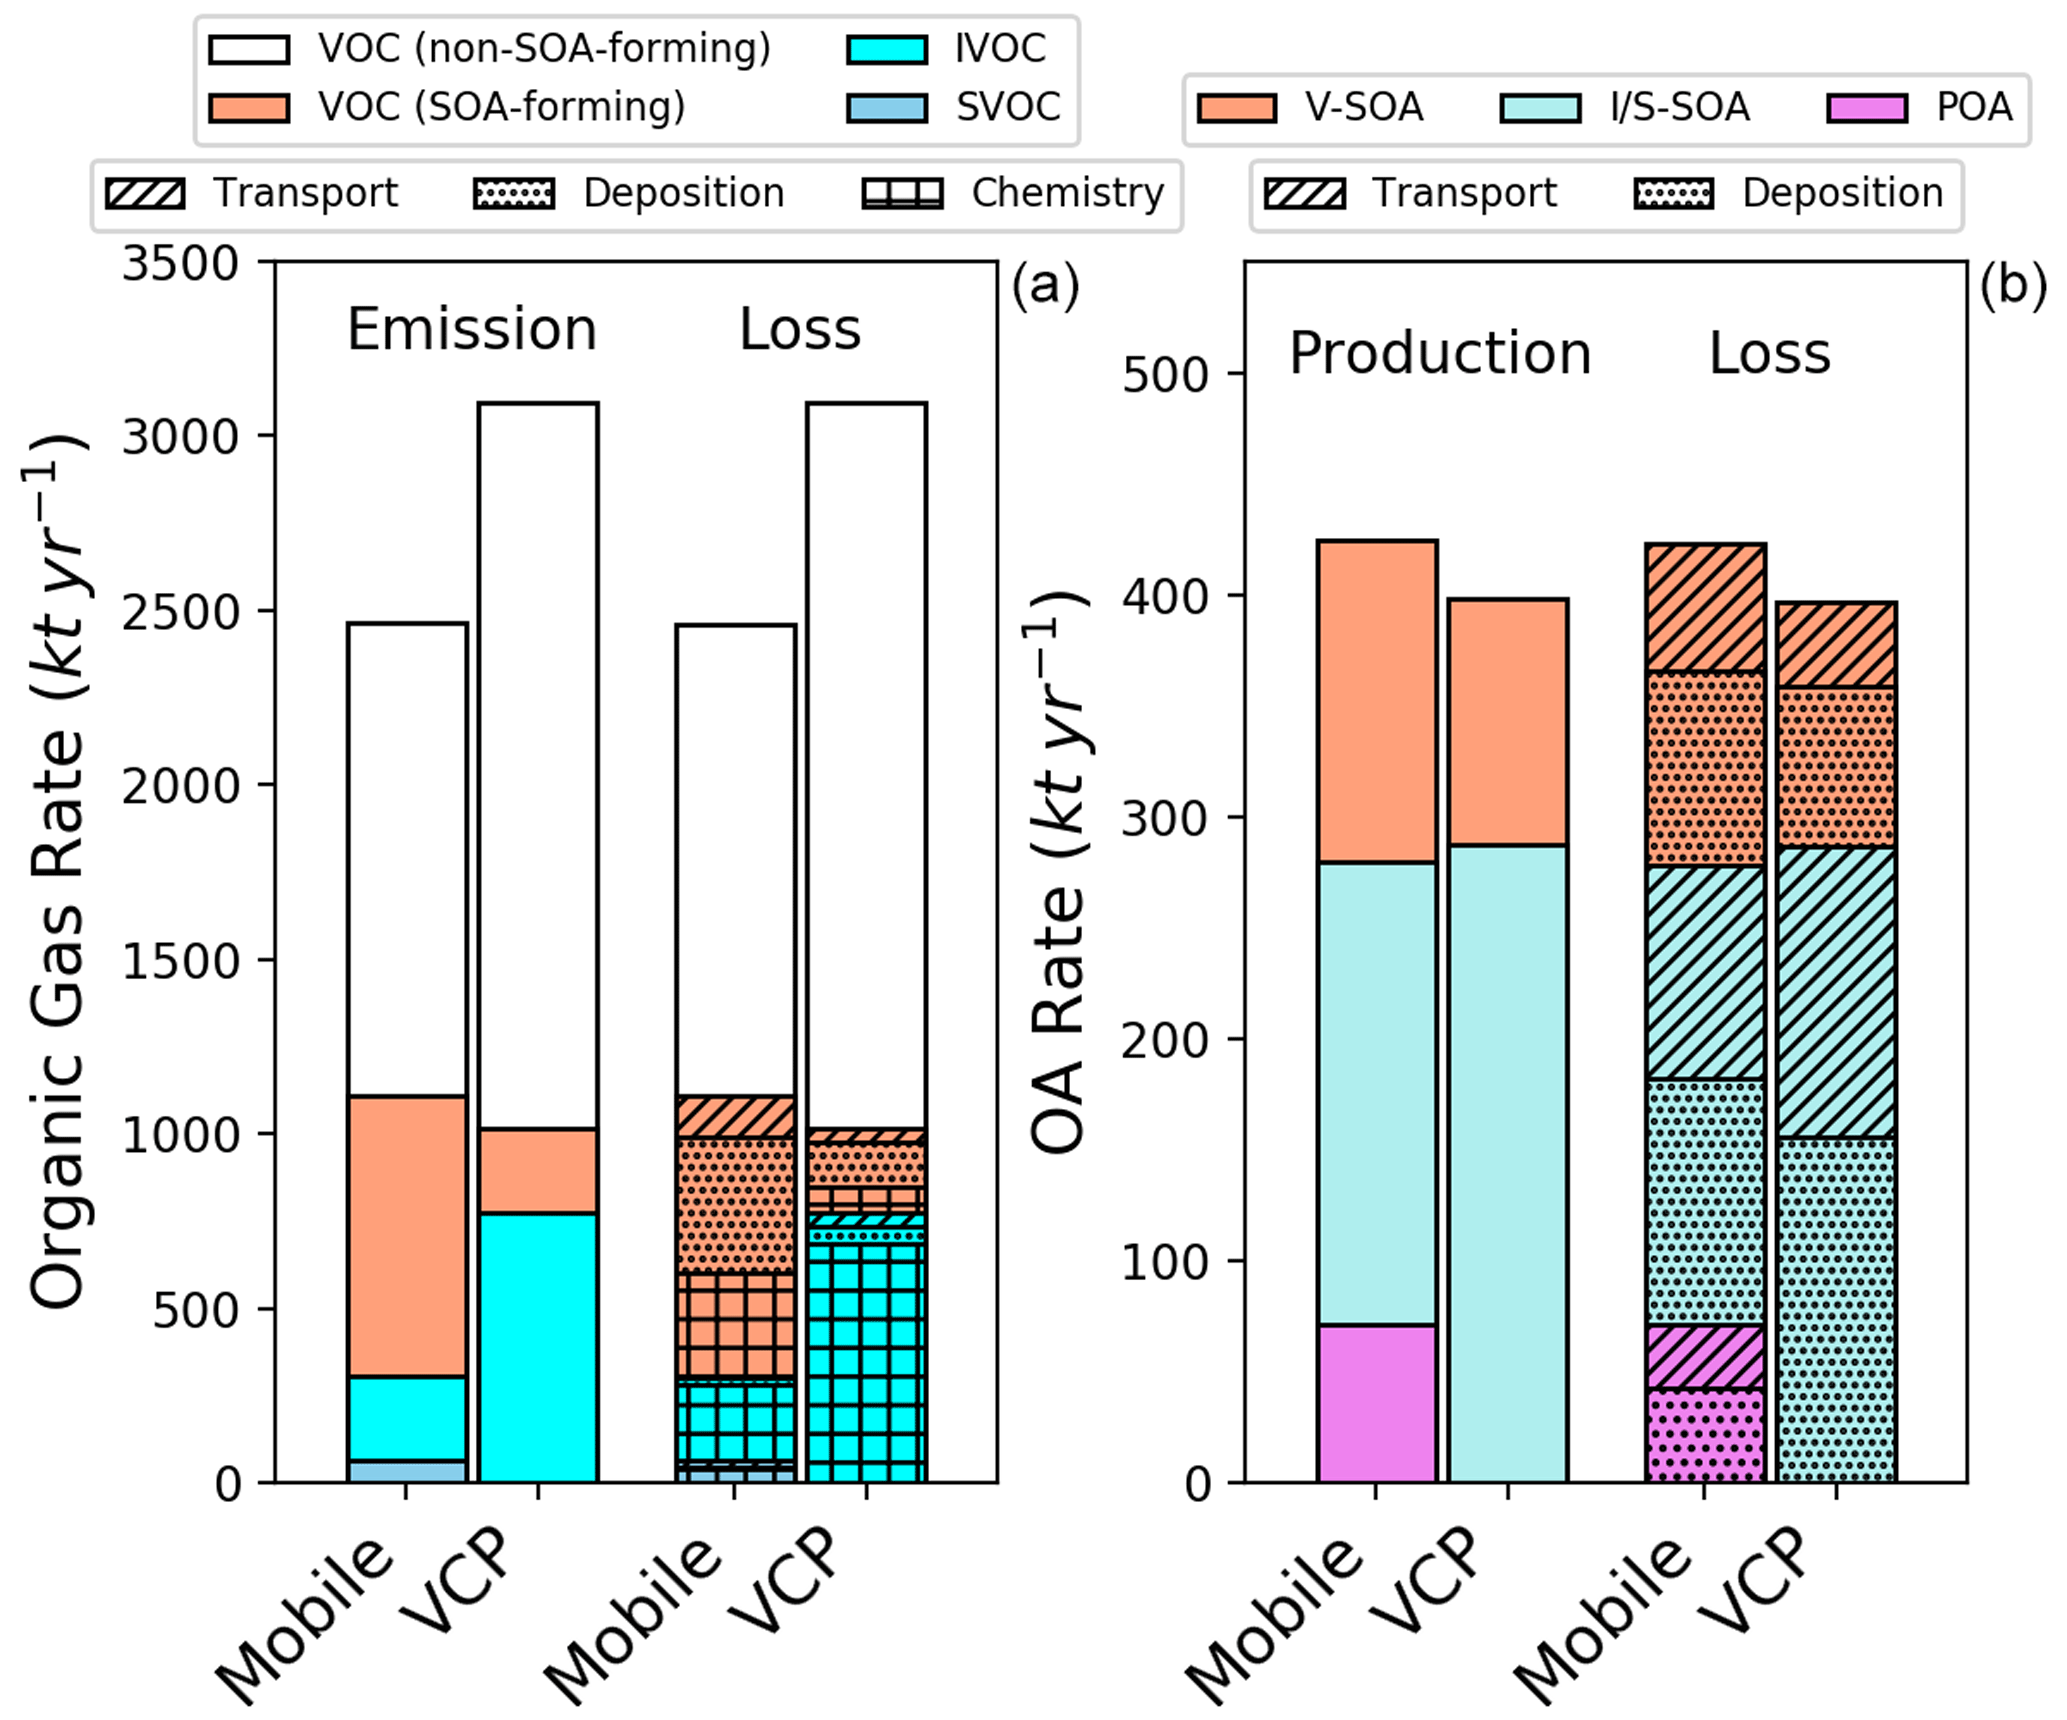
Figure 8Domain-wide predicted budget of (a) mobile and volatile chemical product (VCP) gas-phase emissions and loss due to chemistry, deposition, or transport and (b) OA production and losses for 2017. In panel (a), loss terms are only depicted for categories of compounds that lead to organic particle formation.
This study implements a detailed source- and species-level procedure for converting conventional OM and NMOG mobile emissions to metrics compatible with the most recent science and speciation developed for atmospheric ROC. Although many AQMs have implemented online or pre-processing emission adjustments to account for these phenomena (Koo et al., 2014; Murphy et al., 2017), the procedure should be embedded within emission models and databases for several reasons. Most importantly, this detailed approach considers a more diverse population of sources of different ages, fuels, and control technologies that are typically averaged together before they are passed to the AQM. Additionally, the new procedure enables near-explicit speciation of each emission source before mapping to model species used in a particular chemical mechanism. Having a detailed speciation of major emission sources is critical for assessing and revising chemical mechanisms (Pye et al., 2023). Finally, operationalizing conversions from OM to CROC and NMOGs to GROC alleviates AQM users from the burden of interrogating their emissions files to determine whether complex scaling operations are needed. From the broader perspective of facilitating transfer of knowledge between the scientific and regulatory communities, the SPECIATE database is now capable of ingesting speciation profiles with factors aligned with the most recent research studies and has enhanced flexibility to accommodate future updates. Nonetheless, for model applications seeking to scale legacy emission inputs, we provide updated factors normalized to several levels of source aggregation in Table S12 and discuss the uncertainty introduced with this approach in Sect. S10.
The 2016 ROC emissions suggest slight decreases to total O3 formation due to reapportionment of VOC to IVOC in this approach, but 2017 CMAQ–ROC predictions do not meaningfully change when evaluated at AQS sites. Meanwhile, mobile SVOC and IVOC emissions enhance OA formation by an additional 79 kt yr−1 compared to estimates from the EQUATES configuration (319 kt yr−1). Gaps between total OA measurements and CMAQ–ROC predictions will be addressed through improved modeling of other sources of ROC (e.g., VCPs, wildfires, residential wood combustion, and cooking). Within the mobile sector, results indicate substantial contributions from on-road (46 %) and nonroad (41 %) gasoline and somewhat less from on-road (5 %) and nonroad (3 %) diesel air, marine, and rail sources (4.7 %; Fig. 6). The vast majority of ROC emissions and impacts are attributable to older (pre-Tier 2 light duty gasoline and non-DPF heavy duty diesel) vehicles and nonroad gasoline engines. On-road pollution will continue to decrease as these vehicles are phased out, increasing the importance of other mobile source categories and other sources.
This study suggests several specific uncertainties pertaining to mobile source emissions need further laboratory and field investigation. Developing complete ROC volatility distributions for specific source classes and control types is critical, especially within the nonroad category where fewer experimental data were available for this study. The CROC OM factors are uncertain across all mobile sources. Ideally, IVOC and CROC emissions should be sampled by a filter and a broad-spectrum adsorbent tube in series to avoid filter artifacts (Khare et al., 2019). If filter-based methods alone are used to inform organic aerosol emission inventories, then reducing the uncertainty in the relationship between particle emission factor and total CROC will strengthen our confidence in estimating organic aerosol emissions, particularly for lower-emitting technologies. Some CROC OM ratios derived for this work are between 0.85 and 1.15, indicating a limited role for partitioning bias during source testing in those cases, but many are greater than 1.30, especially the lower-emitting sources. Lastly, more research is needed to determine the extent to which NMOG measurements capture IVOCs (quantified by the IVOC NMOG or IVOC GROC ratios). These parameters are especially important to understand for older vehicles and equipment which drive historical and contemporary emissions. We recommend that emissions tests specifically measure and report CROC and GROC to facilitate comparison among datasets and implementation in emission models. Currently, these measurements are beyond the scope of typical regulatory requirements, and future progress requires research beyond regulatory methods.
| Abbreviation | Definition |
| OM | organic matter component of primary particle emissions as measured on a filter |
| NMOGs | non-methane organic gas emissions |
| POA | primary organic aerosol: particle-phase emissions after equilibrium is reached with ambient conditions. |
| OA | particle-phase organic material at ambient conditions |
| LVOC | low-volatility organic compounds (C∗ ≤ 0.32 µg m−3) |
| SVOC | semivolatile organic compounds (0.32 < C∗ ≤ 320 µg m−3) |
| IVOC | intermediate-volatility organic compounds (320 < C∗ ≤ 3.2 × 10⁶ µg m−3) |
| VOC | volatile organic compounds (3.2 × 10⁶ µg m−3 < C∗) |
| CROC | condensable reactive organic carbon: particle- and gas-phase LVOC + SVOC (carbon and noncarbon mass are included) |
| GROC | gaseous reactive organic carbon: particle- and gas-phase IVOC + VOC (carbon and noncarbon mass are included) |
| ROC | reactive organic carbon – all particle and gas organic compounds mass except methane. (carbon and noncarbon mass are included) |
The CMAQ model source code used is available via Zenodo (https://doi.org/10.5281/zenodo.7869142, Murphy and Pye, 2023). MOVESv3.1, used for this work, is available from the U.S. EPA at https://www.epa.gov/moves (U.S. EPA, 2020b). The functions to estimate OA and O3 potential are available as part of a public repository archived at https://doi.org/10.23719/1527956 (Pye, 2022).
Data that document emission factors and mobile source speciation updates are available in the tables in the Supplement. Preexisting data for speciation of mobile sources are available from the SPECIATE database (https://www.epa.gov/air-emissions-modeling/speciate; U.S. EPA, 2020a). Specific data and results used to generate figures are archived at https://doi.org/10.23719/1529789 (Murphy, 2023).
The supplement related to this article is available online at: https://doi.org/10.5194/acp-23-13469-2023-supplement.
BNM managed and carried out all aspects of the study. Coauthors contributed as follows: conceptualization – DS, KMS, HOTP, and ALR; data curation and investigation – all coauthors; formal analysis – DS; methodology and software development – DS, HOTP, EM, and CT; writing – original draft preparation – DS; and writing – review and editing – all coauthors. All authors have given approval to the final version of the paper. DS made contributions to the study primarily when employed by U.S. EPA.
At least one of the (co-)authors is a member of the editorial board of Atmospheric Chemistry and Physics. The peer-review process was guided by an independent editor, and the authors also have no other competing interests to declare.
The views expressed in this article are those of the author(s) and do not necessarily represent the views or the policies of the U.S. Environmental Protection Agency
Publisher's note: Copernicus Publications remains neutral with regard to jurisdictional claims made in the text, published maps, institutional affiliations, or any other geographical representation in this paper. While Copernicus Publications makes every effort to include appropriate place names, the final responsibility lies with the authors.
The authors gratefully acknowledge contributions from U.S. EPA staff, including Kristen Foley and George Pouliot for emissions inputs and Chad Bailey, Michael Hays, and Sergey Napelenok for internal technical reviews. We also acknowledge Yunliang Zhao of the California Air Resources Board for valuable insights and consultation.
This paper was edited by Kelley Barsanti and reviewed by two anonymous referees.
Ahmadov, R., McKeen, S. A., Robinson, A. L., Bahreini, R., Middlebrook, A. M., de Gouw, J. A., Meagher, J., Hsie, E. Y., Edgerton, E., Shaw, S., and Trainer, M.: A volatility basis set model for summertime secondary organic aerosols over the eastern united states in 2006, J. Geophys. Res.-Atmos., 117, D06301, https://doi.org/10.1029/2011jd016831, 2012.
Appel, K. W., Bash, J. O., Fahey, K. M., Foley, K. M., Gilliam, R. C., Hogrefe, C., Hutzell, W. T., Kang, D., Mathur, R., Murphy, B. N., Napelenok, S. L., Nolte, C. G., Pleim, J. E., Pouliot, G. A., Pye, H. O. T., Ran, L., Roselle, S. J., Sarwar, G., Schwede, D. B., Sidi, F. I., Spero, T. L., and Wong, D. C.: The Community Multiscale Air Quality (CMAQ) model versions 5.3 and 5.3.1: system updates and evaluation, Geosci. Model Dev., 14, 2867–2897, https://doi.org/10.5194/gmd-14-2867-2021, 2021.
Bergström, R., Denier van der Gon, H. A. C., Prévôt, A. S. H., Yttri, K. E., and Simpson, D.: Modelling of organic aerosols over Europe (2002–2007) using a volatility basis set (VBS) framework: application of different assumptions regarding the formation of secondary organic aerosol, Atmos. Chem. Phys., 12, 8499–8527, https://doi.org/10.5194/acp-12-8499-2012, 2012.
Bessagnet, B., Allemand, N., Putaud, J. P., Couvidat, F., Andre, J. M., Simpson, D., Pisoni, E., Murphy, B. N., and Thunis, P.: Emissions of carbonaceous particulate matter and ultrafine particles from vehicles-a scientific review in a cross-cutting context of air pollution and climate change, Appl. Sci.-Basel, 12, 1–52, https://doi.org/10.3390/app12073623, 2022.
Birch, M. and Cary, R.: Elemental carbon-based method for monitoring occupational exposures to particulate diesel exhaust, Aerosol Sci. Tech., 25, 221–241, https://doi.org/10.1080/02786829608965393, 1996.
CFR: Protection of the environment, U.S. Code of Federal Regulations, Title 40, Part 1065, http://www.ecfr.gov/cgi-bin/text-idx?c=ecfr&tpl=/ecfrbrowse/Title40/40cfr1065_main_02.tpl (last access: January 2022), 2023.
Chang, X., Zhao, B., Zheng, H. T., Wang, S. X., Cai, S. Y., Guo, F. Q., Gui, P., Huang, G. H., Wu, D., Han, L. C., Xing, J., Man, H. Y., Hu, R. L., Liang, C. R., Xu, Q. C., Qiu, X. H., Ding, D., Liu, K. Y., Han, R., Robinson, A. L., and Donahue, N. M.: Full-volatility emission framework corrects missing and underestimated secondary organic aerosol sources, One Earth, 5, 403–412, https://doi.org/10.1016/j.oneear.2022.03.015, 2022.
Chow, J. C., Watson, J. G., Pritchett, L. C., Pierson, W. R., Frazier, C. A., and Purcell, R. G.: The DRI thermal/optical reflectance carbon analysis system: Description, evaluation and applications in us air quality studies, Atmos. Environ. A-Gen., 27, 1185–1201, https://doi.org/10.1016/0960-1686(93)90245-T, 1993.
Donahue, N. M., Robinson, A. L., and Pandis, S. N.: Atmospheric organic particulate matter: From smoke to secondary organic aerosol, Atmos. Environ., 43, 94–106, https://doi.org/10.1016/j.atmosenv.2008.09.055, 2009.
Drozd, G. T., Zhao, Y., Saliba, G., Frodin, B., Maddox, C., Oliver Chang, M.-C., Maldonado, H., Sardar, S., Weber, R. J., and Robinson, A. L.: Detailed speciation of intermediate volatility and semivolatile organic compound emissions from gasoline vehicles: Effects of cold-starts and implications for secondary organic aerosol formation, Environ. Sci. Technol., 53, 1706–1714, https://doi.org/10.1021/acs.est.8b05600, 2018.
FAA: Aviation environmental design tool (AEDT) version 3, U.S Department of Transportation [code], https://aedt.faa.gov/ (last access: January 2021), 2020.
Foley, K. M., Pouliot, G. A., Eyth, A., Aldridge, M. F., Allen, C., Appel, K. W., Bash, J. O., Beardsley, M., Beidler, J., and Choi, D.: 2002–2017 anthropogenic emissions data for air quality modeling over the United States, Data in Brief, 47, 109022, https://doi.org/10.1016/j.dib.2023.109022, 2023.
Gentner, D. R., Harley, R. A., Miller, A. M., and Goldstein, A. H.: Diurnal and seasonal variability of gasoline-related volatile organic compound emissions in Riverside, California, Environ. Sci. Technol., 43, 4247–4252, https://doi.org/10.1021/es9006228, 2009.
Gentner, D. R., Isaacman, G., Worton, D. R., Chan, A. W., Dallmann, T. R., Davis, L., Liu, S., Day, D. A., Russell, L. M., Wilson, K. R., Weber, R., Guha, A., Harley, R. A., and Goldstein, A. H.: Elucidating secondary organic aerosol from diesel and gasoline vehicles through detailed characterization of organic carbon emissions, P. Natl. Acad. Sci. USA, 109, 18318–18323, https://doi.org/10.1073/pnas.1212272109, 2012.
Gentner, D. R., Jathar, S. H., Gordon, T. D., Bahreini, R., Day, D. A., El Haddad, I., Hayes, P. L., Pieber, S. M., Platt, S. M., de Gouw, J., Goldstein, A. H., Harley, R. A., Jimenez, J. L., Prevot, A. S., and Robinson, A. L.: Review of urban secondary organic aerosol formation from gasoline and diesel motor vehicle emissions, Environ. Sci. Technol., 51, 1074–1093, https://doi.org/10.1021/acs.est.6b04509, 2017.
Heald, C. L. and Kroll, J. H.: The fuel of atmospheric chemistry: Toward a complete description of reactive organic carbon, Sci. Adv., 6, eaay8967, https://doi.org/10.1126/sciadv.aay8967, 2020.
Huang, C., Hu, Q., Li, Y., Tian, J., Ma, Y., Zhao, Y., Feng, J., An, J., Qiao, L., Wang, H., Jing, S., Huang, D., Lou, S., Zhou, M., Zhu, S., Tao, S., and Li, L.: Intermediate volatility organic compound emissions from a large cargo vessel operated under real-world conditions, Environ. Sci. Technol., 52, 12934–12942, https://doi.org/10.1021/acs.est.8b04418, 2018.
Humes, M. B., Wang, M., Kim, S., Machesky, J. E., Gentner, D. R., Robinson, A. L., Donahue, N. M., and Presto, A. A.: Limited secondary organic aerosol production from acyclic oxygenated volatile chemical products, Environ. Sci. Technol., 56, 4806–4815, https://doi.org/10.1021/acs.est.1c07354, 2022.
Jathar, S. H., Woody, M., Pye, H. O. T., Baker, K. R., and Robinson, A. L.: Chemical transport model simulations of organic aerosol in southern California: model evaluation and gasoline and diesel source contributions, Atmos. Chem. Phys., 17, 4305–4318, https://doi.org/10.5194/acp-17-4305-2017, 2017a.
Jathar, S. H., Friedman, B., Galang, A. A., Link, M. F., Brophy, P., Volckens, J., Eluri, S., and Farmer, D. K.: Linking load, fuel, and emission controls to photochemical production of secondary organic aerosol from a diesel engine, Environ. Sci. Technol., 51, 1377–1386, https://doi.org/10.1021/acs.est.6b04602, 2017b.
Jathar, S. H., Sharma, N., Galang, A., Vanderheyden, C., Takhar, M., Chan, A. W. H., Pierce, J. R., and Volckens, J.: Measuring and modeling the primary organic aerosol volatility from a modern non-road diesel engine, Atmos. Environ., 223, 117221, https://doi.org/10.1016/j.atmosenv.2019.117221, 2020.
Khare, P., Marcotte, A., Sheu, R., Walsh, A. N., Ditto, J. C., and Gentner, D. R.: Advances in offline approaches for trace measurements of complex organic compound mixtures via soft ionization and high-resolution tandem mass spectrometry, J. Chromatogr. A, 1598, 163–174, https://doi.org/10.1016/j.chroma.2018.09.014, 2019.
Kishan, S., Burnette, A., Funcher, S., Sabisch, M., Crews, E., Snow, R., Zmud, M., Santos, R., Bricka, S., Fujita, E., Campbell, D., and Arnott, P.: Kansas City PM characterization study – Final report, U.S EPA, Washington, DC, USA, Report No. EPA-420-R-08-009, 2008.
Koo, B., Knipping, E., and Yarwood, G.: 1.5-dimensional volatility basis set approach for modeling organic aerosol in CAMX and CMAQ, Atmos. Environ., 95, 158–164, https://doi.org/10.1016/j.atmosenv.2014.06.031, 2014.
Lim, Y. B. and Ziemann, P. J.: Chemistry of secondary organic aerosol formation from OH radical-initiated reactions of linear, branched, and cyclic alkanes in the presence of NOx, Aerosol Sci. Tech., 43, 604–619, https://doi.org/10.1080/02786820902802567, 2009.
Lipsky, E. M. and Robinson, A. L.: Effects of dilution on fine particle mass and partitioning of semivolatile organics in diesel exhaust and wood smoke, Environ. Sci. Technol., 40, 155–162, https://doi.org/10.1021/es050319p, 2006.
Lu, Q., Zhao, Y., and Robinson, A. L.: Comprehensive organic emission profiles for gasoline, diesel, and gas-turbine engines including intermediate and semi-volatile organic compound emissions, Atmos. Chem. Phys., 18, 17637–17654, https://doi.org/10.5194/acp-18-17637-2018, 2018.
Lu, Q., Murphy, B. N., Qin, M., Adams, P. J., Zhao, Y., Pye, H. O. T., Efstathiou, C., Allen, C., and Robinson, A. L.: Simulation of organic aerosol formation during the CalNex study: updated mobile emissions and secondary organic aerosol parameterization for intermediate-volatility organic compounds, Atmos. Chem. Phys., 20, 4313–4332, https://doi.org/10.5194/acp-20-4313-2020, 2020.
Lurmann, F., Avol, E., and Gilliland, F.: Emissions reduction policies and recent trends in southern California's ambient air quality, J. Air Waste Manag. Assoc., 65, 324–335, https://doi.org/10.1080/10962247.2014.991856, 2015.
Manavi, S. E. I. and Pandis, S. N.: A lumped species approach for the simulation of secondary organic aerosol production from intermediate-volatility organic compounds (IVOCs): application to road transport in PMCAMx-iv (v1.0), Geosci. Model Dev., 15, 7731–7749, https://doi.org/10.5194/gmd-15-7731-2022, 2022.
May, A. A., Presto, A. A., Hennigan, C. J., Nguyen, N. T., Gordon, T. D., and Robinson, A. L.: Gas-particle partitioning of primary organic aerosol emissions: (2) diesel vehicles, Environ. Sci. Technol., 47, 8288–8296, https://doi.org/10.1021/es400782j, 2013a.
May, A. A., Presto, A. A., Hennigan, C. J., Nguyen, N. T., Gordon, T. D., and Robinson, A. L.: Gas-particle partitioning of primary organic aerosol emissions: (1) gasoline vehicle exhaust, Atmos. Environ., 77, 128–139, https://doi.org/10.1016/j.atmosenv.2013.04.060, 2013b.
May, A. A., Nguyen, N. T., Presto, A. A., Gordon, T. D., Lipsky, E. M., Karve, M., Gutierrez, A., Robertson, W. H., Zhang, M., Brandow, C., Chang, O., Chen, S. Y., Cicero-Fernandez, P., Dinkins, L., Fuentes, M., Huang, S. M., Ling, R., Long, J., Maddox, C., Massetti, J., McCauley, E., Miguel, A., Na, K., Ong, R., Pang, Y. B., Rieger, P., Sax, T., Truong, T., Vo, T., Chattopadhyay, S., Maldonado, H., Maricq, M. M., and Robinson, A. L.: Gas- and particle-phase primary emissions from in-use, on-road gasoline and diesel vehicles, Atmos. Environ., 88, 247–260, https://doi.org/10.1016/j.atmosenv.2014.01.046, 2014.
Morino, Y., Chatani, S., Fujitani, Y., Tanabe, K., Murphy, B. N., Jathar, S. H., Takahashi, K., Sato, K., Kumagai, K., and Saito, S.: Emissions of condensable organic aerosols from stationary combustion sources over Japan, Atmos. Environ., 289, 119319, https://doi.org/10.1016/j.atmosenv.2022.119319, 2022.
Murphy, B. and Pye, H. O. T.: Model Code for Reactive Organic Carbon Air Emissions from Mobile Sources in the United States, in: Atmospheric Chemistry and Physics (Built on CMAQv5.4), Zenodo [code], https://doi.org/10.5281/zenodo.7869142, 2023.
Murphy, B. N.: Data to support Reactive organic carbon air emissions from mobile sources in the United States, U.S. EPA [data set], https://doi.org/10.23719/1529789, 2023.
Murphy, B. N. and Pandis, S. N.: Simulating the formation of semivolatile primary and secondary organic aerosol in a regional chemical transport model, Environ. Sci. Technol., 43, 4722–4728, https://doi.org/10.1021/es803168a, 2009.
Murphy, B. N., Donahue, N. M., Robinson, A. L., and Pandis, S. N.: A naming convention for atmospheric organic aerosol, Atmos. Chem. Phys., 14, 5825–5839, https://doi.org/10.5194/acp-14-5825-2014, 2014.
Murphy, B. N., Woody, M. C., Jimenez, J. L., Carlton, A. M. G., Hayes, P. L., Liu, S., Ng, N. L., Russell, L. M., Setyan, A., Xu, L., Young, J., Zaveri, R. A., Zhang, Q., and Pye, H. O. T.: Semivolatile POA and parameterized total combustion SOA in CMAQv5.2: impacts on source strength and partitioning, Atmos. Chem. Phys., 17, 11107–11133, https://doi.org/10.5194/acp-17-11107-2017, 2017.
Pennington, E. A., Seltzer, K. M., Murphy, B. N., Qin, M., Seinfeld, J. H., and Pye, H. O. T.: Modeling secondary organic aerosol formation from volatile chemical products, Atmos. Chem. Phys., 21, 18247–18261, https://doi.org/10.5194/acp-21-18247-2021, 2021.
Pye, H. O. T.: Data for the Community Regional Atmospheric Chemistry Multiphase Mechanism (CRACMM) version 1.0, U.S. EPA [code], https://doi.org/10.23719/1527956, 2022.
Pye, H. O. T., Ward-Caviness, C. K., Murphy, B. N., Appel, K. W., and Seltzer, K. M.: Secondary organic aerosol association with cardiorespiratory disease mortality in the united states, Nat. Commun., 12, 7215, https://doi.org/10.1038/s41467-021-27484-1, 2021.
Pye, H. O. T., Appel, K. W., Seltzer, K. M., Ward-Caviness, C. K., and Murphy, B. N.: Human-health impacts of controlling secondary air pollution precursors, Environ. Sci. Technol. Lett., 9, 96–101, https://doi.org/10.1021/acs.estlett.1c00798, 2022.
Pye, H. O. T., Place, B. K., Murphy, B. N., Seltzer, K. M., D'Ambro, E. L., Allen, C., Piletic, I. R., Farrell, S., Schwantes, R. H., Coggon, M. M., Saunders, E., Xu, L., Sarwar, G., Hutzell, W. T., Foley, K. M., Pouliot, G., Bash, J., and Stockwell, W. R.: Linking gas, particulate, and toxic endpoints to air emissions in the Community Regional Atmospheric Chemistry Multiphase Mechanism (CRACMM), Atmos. Chem. Phys., 23, 5043–5099, https://doi.org/10.5194/acp-23-5043-2023, 2023.
Reff, A., Bhave, P. V., Simon, H., Pace, T. G., Pouliot, G. A., Mobley, J. D., and Houyoux, M.: Emissions inventory of PM2.5 trace elements across the United States, Environ. Sci. Technol., 43, 5790–5796, https://doi.org/10.1021/es802930x, 2009.
Robinson, A. L., Donahue, N. M., Shrivastava, M. K., Weitkamp, E. A., Sage, A. M., Grieshop, A. P., Lane, T. E., Pierce, J. R., and Pandis, S. N.: Rethinking organic aerosols: Semivolatile emissions and photochemical aging, Science, 315, 1259–1262, https://doi.org/10.1126/science.1133061, 2007.
Robinson, A. L., Grieshop, A. P., Donahue, N. M., and Hunt, S. W.: Updating the conceptual model for fine particle mass emissions from combustion systems, J. Air Waste Manag. Assoc., 60, 1204–1222, https://doi.org/10.3155/1047-3289.60.10.1204, 2010.
Safieddine, S. A., Heald, C. L., and Henderson, B. H.: The global nonmethane reactive organic carbon budget: A modeling perspective, Geophys. Res. Lett., 44, 3897–3906, https://doi.org/10.1002/2017gl072602, 2017.
Sarica, T., Sartelet, K., Roustan, Y., Kim, Y., Lugon, L., Marques, B., D'Anna, B., Chaillou, C., and Larrieu, C.: Sensitivity of pollutant concentrations in urban streets to asphalt and traffic-related emissions, Environ. Pollut., 332, 121955, https://doi.org/10.1016/j.envpol.2023.121955, 2023.
Seltzer, K. M., Pennington, E., Rao, V., Murphy, B. N., Strum, M., Isaacs, K. K., and Pye, H. O. T.: Reactive organic carbon emissions from volatile chemical products, Atmos. Chem. Phys., 21, 5079–5100, https://doi.org/10.5194/acp-21-5079-2021, 2021.
Shrivastava, M., Fast, J., Easter, R., Gustafson Jr., W. I., Zaveri, R. A., Jimenez, J. L., Saide, P., and Hodzic, A.: Modeling organic aerosols in a megacity: comparison of simple and complex representations of the volatility basis set approach, Atmos. Chem. Phys., 11, 6639–6662, https://doi.org/10.5194/acp-11-6639-2011, 2011.
Simon, H., Bhave, P. V., Swall, J. L., Frank, N. H., and Malm, W. C.: Determining the spatial and seasonal variability in OM OC ratios across the US using multiple regression, Atmos. Chem. Phys., 11, 2933–2949, https://doi.org/10.5194/acp-11-2933-2011, 2011.
Tessum, C. W., Paolella, D. A., Chambliss, S. E., Apte, J. S., Hill, J. D., and Marshall, J. D.: PM2.5 polluters disproportionately and systemically affect people of color in the United States, Sci. Adv., 7, eabf4491, https://doi.org/10.1126/sciadv.abf4491, 2021.
Tkacik, D. S., Presto, A. A., Donahue, N. M., and Robinson, A. L.: Secondary organic aerosol formation from intermediate-volatility organic compounds: Cyclic, linear, and branched alkanes, Environ. Sci. Technol., 46, 8773–8781, https://doi.org/10.1021/es301112c, 2012.
Turpin, B. J., Huntzicker, J. J., and Hering, S. V.: Investigation of organic aerosol sampling artifacts in the Los-Angeles basin, Atmos. Environ., 28, 3061–3071, https://doi.org/10.1016/1352-2310(94)00133-6, 1994.
U.S. EPA: Integrated science assessment (ISA) for particulate matter, Final Report, December 2019, U.S. Environmental Protection Agency, Washington, DC, EPA/600/R-19/188, 2019.
U.S. EPA: Speciatev5.1, U.S. EPA [data set], https://www.epa.gov/air-emissions-modeling/speciate (last access: January 2023), 2020a.
U.S. EPA: Motor vehicle emission simulator: MOVES3, Office of Transportation and Air Quality, U.S. EPA [code], https://www.epa.gov/moves (last access: July 2021), 2020b.
U.S. EPA: Integrated science assessment (ISA) for ozone and related photochemical oxidants, Final Report, April 2020, U.S. Environmental Protection Agency, Washington, DC, EPA/600/R-20/012, 2020c.
U.S. EPA: EQUATESv1.0: Emissions, WRF/MCIP, CMAQv5.3.2 Data – 2002–2019 US_12km and NHEMI_108km, UNC Dataverse, V5 [data set], https://doi.org/10.15139/S3/F2KJSK, 2021a.
U.S. EPA: Technical support document (TSD) preparation of emissions inventories for the 2017 North American emissions modeling platform, U.S. EPA, Research Triangle Park, NC, Report No. EPA-454-R-21-001, 2021b.
U.S. EPA: Community Multiscale Air Quality (CMAQ) model v5.4, Office of Research and Development, U.S. EPA, https://github.com/USEPA/CMAQ/tree/5.4 (last access: January 2023), 2022.
Winkler, S., Anderson, J., Garza, L., Ruona, W., Vogt, R., and Wallington, T.: Vehicle criteria pollutant (PM, NOx, CO, HCs) emissions: How low should we go?, NPJ Climate and Atmospheric Science, 1, 1–5, https://doi.org/10.1038/s41612-018-0037-5, 2018.
Woody, M. C., West, J. J., Jathar, S. H., Robinson, A. L., and Arunachalam, S.: Estimates of non-traditional secondary organic aerosols from aircraft SVOC and IVOC emissions using CMAQ, Atmos. Chem. Phys., 15, 6929–6942, https://doi.org/10.5194/acp-15-6929-2015, 2015.
Woody, M. C., Baker, K. R., Hayes, P. L., Jimenez, J. L., Koo, B., and Pye, H. O. T.: Understanding sources of organic aerosol during CalNex-2010 using the CMAQ-VBS, Atmos. Chem. Phys., 16, 4081–4100, https://doi.org/10.5194/acp-16-4081-2016, 2016.
Worton, D. R., Isaacman, G., Gentner, D. R., Dallmann, T. R., Chan, A. W., Ruehl, C., Kirchstetter, T. W., Wilson, K. R., Harley, R. A., and Goldstein, A. H.: Lubricating oil dominates primary organic aerosol emissions from motor vehicles, Environ. Sci. Technol., 48, 3698–3706, https://doi.org/10.1021/es405375j, 2014.
Yee, L. D., Craven, J. S., Loza, C. L., Schilling, K. A., Ng, N. L., Canagaratna, M. R., Ziemann, P. J., Flagan, R. C., and Seinfeld, J. H.: Effect of chemical structure on secondary organic aerosol formation from C12 alkanes, Atmos. Chem. Phys., 13, 11121–11140, https://doi.org/10.5194/acp-13-11121-2013, 2013.
Zhang, X., Cappa, C. D., Jathar, S. H., McVay, R. C., Ensberg, J. J., Kleeman, M. J., and Seinfeld, J. H.: Influence of vapor wall loss in laboratory chambers on yields of secondary organic aerosol, P. Natl. Acad. Sci. USA, 111, 5802–5807, https://doi.org/10.1073/pnas.1404727111, 2014.
Zhao, B., Wang, S., Donahue, N. M., Jathar, S. H., Huang, X., Wu, W., Hao, J., and Robinson, A. L.: Quantifying the effect of organic aerosol aging and intermediate-volatility emissions on regional-scale aerosol pollution in China, Sci. Rep., 6, 28815, https://doi.org/10.1038/srep28815, 2016.
Zhao, Y., Hennigan, C. J., May, A. A., Tkacik, D. S., de Gouw, J. A., Gilman, J. B., Kuster, W. C., Borbon, A., and Robinson, A. L.: Intermediate-volatility organic compounds: A large source of secondary organic aerosol, Environ. Sci. Technol., 48, 13743–13750, https://doi.org/10.1021/es5035188, 2014.
Zhao, Y., Nguyen, N. T., Presto, A. A., Hennigan, C. J., May, A. A., and Robinson, A. L.: Intermediate volatility organic compound emissions from on-road diesel vehicles: Chemical composition, emission factors, and estimated secondary organic aerosol production, Environ. Sci. Technol., 49, 11516–11526, https://doi.org/10.1021/acs.est.5b02841, 2015.
Zhao, Y., Nguyen, N. T., Presto, A. A., Hennigan, C. J., May, A. A., and Robinson, A. L.: Intermediate volatility organic compound emissions from on-road gasoline vehicles and small off-road gasoline engines, Environ. Sci. Technol., 50, 4554–4563, https://doi.org/10.1021/acs.est.5b06247, 2016.
Zhao, Y., Tkacik, D. S., May, A. A., Donahue, N. M., and Robinson, A. L.: Mobile sources are still an important source of secondary organic aerosol and fine particulate matter in the Los Angeles region, Environ. Sci. Technol., 56, 15328–15336, https://doi.org/10.1021/acs.est.2c03317, 2022.