the Creative Commons Attribution 4.0 License.
the Creative Commons Attribution 4.0 License.
 | 23 Oct 2023
The impact of aerosols on stratiform clouds over southern West Africa: a large-eddy-simulation study
Lambert Delbeke
Pierre Tulet
Cyrielle Denjean
Maurin Zouzoua
Nicolas Maury
Adrien Deroubaix
Low-level stratiform clouds (LLSCs) covering a large area appear frequently during the wet monsoon season in southern West Africa. This region is also a place where different types of aerosols coexist, including biomass burning aerosols coming from central and southern Africa and aerosols emitted by local anthropogenic activities. We investigate the indirect and semi-direct effects of these aerosols on the life cycle of LLSCs by conducting a case study based on airborne and ground-based observations from the field campaign of Dynamic-Aerosol-Chemistry-Cloud-Interaction in West Africa (DACCIWA). This case is modeled using a large-eddy-simulation (LES) model with fine resolution and in situ aerosol measurements, including size distribution and chemical composition. The model has successfully reproduced the observed life cycle of the LLSC, from stratus formation to stabilization during the night and to upward development after sunrise until break-up of the cloud deck in the late afternoon. Additional sensitivity simulations using different measured aerosol profiles also suggest that aerosols can affect the cloud life cycle through both the indirect and semi-direct effects. As expected, modeled cloud microphysical features, including cloud droplet number concentration, mean radius, and thus cloud reflectivity, are all controlled by aerosol concentration. However, it is found that the variation in cloud reflectivity induced by different aerosol profiles is not always the only factor in determining the incoming solar radiation at the ground and thus for the cloud life cycle after sunrise. Instead, the difference in cloud fraction brought by dry-air entrainment from above and thus the speed of consequent evaporation – also influenced by aerosol concentration – is another important factor to consider. Clouds influenced by higher aerosol concentrations and thus with a higher number concentration and smaller sizes of cloud droplets are found to evaporate more easily and thus impose a lower cloud fraction. In addition, our sensitivity runs including versus excluding aerosol direct radiative effects have also demonstrated the impacts specifically of solar absorption by black carbon on the cloud life cycle. The semi-direct effect resulting from an excessive atmospheric heating of up to 12 K d−1 by black carbon in our modeled cases is found to lower the cloud top as well as the liquid water path, reducing surface incoming solar radiation and dry entrainment and increasing the cloud fraction.
- Article
(16301 KB) - Full-text XML
- BibTeX
- EndNote


Low-level stratiform clouds (LLSCs) have a higher albedo and a larger cloud cover than many other types of clouds (Hartmann et al., 1992; Chen et al., 2000; Eastman and Warren, 2014). Their reflection of solar radiation is important to Earth's radiative budget. LLSCs often occupy the upper few hundred meters in the planetary boundary layer (PBL). Their appearance can be persistent when associated with a high-pressure system with a large-scale subsidence that stabilizes the PBL. LLSCs are often formed over cooler subtropical and mid-latitude oceans, constantly covering more than 50 % of these areas (Wood, 2012). During the West African monsoon season, LLSCs can also form frequently over continental southern West Africa (SWA) in the night and then usually break up in the early afternoon of the following day (Schrage and Fink, 2012; Schuster et al., 2013). Under a polluted condition, LLSCs are characterized by numerous and small cloud droplets, increasing the cloud albedo, suppressing drizzle, and extending the cloud lifetime (Twomey, 1957; Haywood and Boucher, 2000; Liu et al., 2014; Carslaw et al., 2017). The presence of LLSCs impacts the radiative budget of the atmosphere, surface fluxes, the diurnal cycle of the convective boundary layer, and thus the regional climate (Knippertz et al., 2011; Hannak et al., 2017). However, the processes behind the life cycle of LLSCs, particularly over SWA, remain elusive; hence, the representation of these clouds in weather and climate models is still poor (Knippertz et al., 2011; Hannak et al., 2017; Hill et al., 2018).
Stratiform clouds are sensitive to aerosol concentration, chemical composition, and vertical distribution. This is because that aerosol can directly scatter or absorb solar radiation (the direct effect or aerosol radiation effect) or serve as cloud nuclei and influence cloud microphysical structure and thus reflectance or lifetime (the indirect aerosol effects or the radiative effect of aerosol–cloud interaction plus cloud adjustment) (Boucher et al., 2013). Specifically, the heating associated with aerosol absorption of solar radiation would be able to perturb the thermodynamic stability and thus dynamical processes in the atmosphere (the semi-direct effect) (Hansen et al., 1998) and serve as a positive or negative addition to the indirect effect, depending on the relative distribution of the aerosol with respect to clouds (e.g., Johnson et al., 2004; Feingold et al., 2005). All these effects can modify the energy budget and thus the status of the planetary boundary layer, where the stratiform clouds form and evolve. Aerosols inside stratiform clouds can also be modified by aqueous physiochemical processes, further altering the forcing strength of the aerosol population, whether remaining inside droplets or being released through evaporation, due to their modified morphology and chemical composition (Wood, 2012). Interactions between aerosols and clouds, together with their effects on radiation, precipitation, and regional circulations, remain one of the largest uncertainties in understanding and projecting climate change. Indeed, it is still difficult to estimate the indirect effect of aerosols and thus to minimize the uncertainty associated with this effect in the climate models (Boucher et al., 2013; Li et al., 2022). Previous studies investigated aerosol–cloud interactions in LLSCs using high-resolution large-eddy-simulation (LES) models. Many of these studies were on the cases over the ocean (e.g., Ackerman et al., 2004; Sandu et al., 2008; Twohy et al., 2013; Flossmann and Wobrock, 2019), where latent heat flux at the surface plays a more important role in the life cycle of LLSCs than sensible heat, while the latter dominates in the cases over land (Wood, 2012; Ghonima et al., 2016).
During the West African monsoon (WAM), aerosols can come from both local and remote sources to SWA. A large number of biomass burning aerosols (BBAs) can be transported from southern and central African towards SWA during the summer monsoon (Haslett et al., 2019). The air masses transporting BBAs are also loaded with additional aerosols from anthropogenic emissions upon reaching the highly urbanized regions near the coast (Chatfield et al., 1998; Sauvage et al., 2005; Mari et al., 2008; Murphy et al., 2010; Reeves et al., 2010; Menut et al., 2018; Haslett et al., 2019). A significant quantity of mineral dust aerosols emitted from the Sahara and Sahel throughout the year with a peak in springtime (Marticorena and Bergametti, 1996) can also reach SWA, often in June (Knippertz et al., 2017). Local aerosol sources in SWA are related to anthropogenic activities near the coast (projected to increase with growing population, Liousse et al., 2014), from where polluted plumes will be transported inland (Deroubaix et al., 2019). These different emission sources lead to a complex mix of aerosol constituents in the air, with a serious impact on human health (Bauer et al., 2019) and possibly complicating the aerosol impacts on the life cycle of LLSCs as well as precipitation over SWA (Taylor et al., 2019).
The Dynamic-Aerosol-Chemistry-Cloud-Interaction in West Africa (DACCIWA) project was designed to better characterize cloud–aerosol–precipitation interactions in SWA (Knippertz et al., 2015). The measurement campaign conducted in June–July 2016 has provided a comprehensive set of ground-based and airborne measurements of clouds and aerosols (Knippertz et al., 2017; Kalthoff et al., 2018; Flamant et al., 2018). The measurements were conducted at three supersites, Savè (Benin), Kumasi (Ghana), and Ile-Ife (Nigeria) (Fig. 1), and coordinated with three research aircraft: the French ATR-42 operated by SAFIRE (Service des Avions Français Instrumentés pour la Recherche en Environnement), the British Twin Otter operated by the British Antarctic Survey, and the German Falcon aircraft operated by the DLR (Deutsches Zentrum für Luft und Raumfahrt). Additional radiosoundings were launched from Savè with high temporal frequency, which specifically benefits the monitoring of the LLSC evolution.
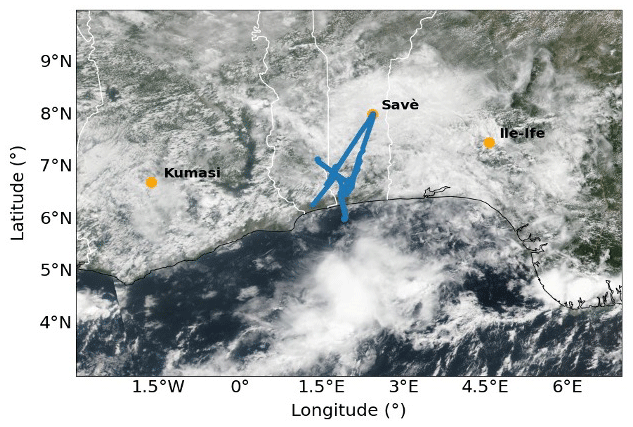
Figure 1Map of southern West Africa with the Savè, Kumasi, and Ile-Ife locations and the flight track (blue line) of the ATR-42 on 3 July 2016 with NASA Suomi National Polar-Orbiting Partnership/Visible Infrared Imaging Radiometer Suite (NPP/VIIRS) true-color-corrected reflectance (https://worldview.earthdata.nasa.gov/, last access: 17 October 2023).
The DACCIWA campaign has also inspired many modeling studies. Based on the observations from DACCIWA and a parcel model, Taylor et al. (2019) and Denjean et al. (2020a) showed that most cloud condensation nuclei and absorbing aerosols observed during the DACCIWA campaign were from ubiquitous long-range-transported BBAs, causing a polluted background which limits the effect of local pollution on cloud properties and aerosol radiative effects. Using the COSMO-ART model in a simulation of the 2–3 July 2016 case, Deetz et al. (2018) found that, under the influence of the cold air brought by maritime inflow (MI) from the Gulf of Guinea, stratus–stratocumulus transition is susceptible to the aerosol direct effect, resulting in a spatial shift in the MI front and a temporal shift in the cloud transition. Influenced by anthropogenic emission sources, the break-up time of LLSCs over SWA can be delayed by 1 h, and the daily precipitation rate can decrease by 7.5 % according to Deroubaix et al. (2022). Moreover, the joint rather than separate impacts of the semi-direct and indirect effects of aerosol were also studied with varying magnitudes of anthropogenic aerosol emissions by Haslett et al. (2019) using the COSMO-ART model. The study indicated that cloud droplet number concentration could increase up to 27 % due to transported BBAs, making cloud and rain less sensitive to a further increase in regional anthropogenic emissions. The impact of sedimentation on LLSCs was indicated by previous studies (e.g., Bretherton et al., 2007). This issue has also been addressed in a model of the DACCIWA case by Dearden et al. (2018) using the Met Office NERC Cloud model (MONC), which demonstrated that sedimentation of cloud droplets, determined by droplet size, could affect the liquid water path by removing droplets from the entrainment zone or by lowering the cloud base and creating a more heterogeneous cloud structure. Menut et al. (2019) showed in a WRF-CHIMERE simulation that a decrease in anthropogenic emissions along the SWA coast could lead to a northward shift in the monsoonal precipitation and an increase in surface wind speed over an arid region in the Sahel, resulting in an increase in mineral dust emission. Pedruzo-Bagazgoitia et al. (2020) analyzed the stratocumulus–cumulus transition at a fine scale (12 km sidelong) using a LES at high resolution (50×50 m2), though aerosol effects were not taken into consideration. These previous modeling studies were all highlighted on a regional scale. The majority of them, however, only addressed the response of LLSCs to the aerosol abundance rather than aerosol effects associated with different chemical compositions (such as the semi-direct effect of black carbon) by taking advantage of the measurement data obtained during the field campaign.
The aim of this study is to improve our understanding of the impacts associated with both local and transported aerosols on the life cycle of LLSCs during the monsoon period over SWA. In doing so, observational data obtained from the well-documented DACCIWA field campaign have been used to constrain a high-resolution LES model incorporated with an interactive aerosol module that is able to represent the complex aerosol compositions besides size distributions. This modeling effort is also among a few studies that model and analyze the stratiform cloud nocturnal–diurnal life cycle over land rather than the ocean. A description of observations, data, and the model as well as configurations of different simulations is presented in the Methods section after the Introduction section. Then, the results of an analysis aiming to understand and evaluate the modeled reference case against measurements are discussed. Thereafter, the results from several sensitivity simulations are presented. These sensitivity simulations use various observed aerosol profiles with different size distributions and chemical compositions and are designed to examine the indirect and semi-direct effects of aerosols on the life cycle of modeled LLSCs, making this study the first such modeling attempt within the framework of the DACCIWA campaign. The last section of the paper summarizes the major research findings of this study.
2.1 Observational data
We have used certain measurements of the DACCIWA field campaign to configure the model simulations to our LLSC case. These data are described as follows.
- i.
Radiosonde data. During the DACCIWA campaign, radiosondes were launched with the MODEM system every 1 to 1.5 h between 17:00 and 11:00 UTC (the local time of Benin is UTC+1) at the supersite of Savè in Benin. This site is located 185 km from the coast and 166 m above sea level. The area is rather flat, and the vegetation is mainly composed of small trees and shrubs. Vertical profiles from the ground to 1500 m altitude of temperature, pressure, relative humidity, and wind were measured with a 1 s temporal interval (4–5 m of vertical resolution). These sondes were obtained using two balloons of different volumes to reach a preset time of ascent, and after the cutting of the larger balloon, the second one was used to retrieve the sonde for further use (Legain et al., 2013).
- ii.
Ground-based measurements. At the supersite of Savè, a CHM15k ceilometer was deployed by the Karlsruher Institut für Technologie (KIT) to measure the cloud base height continuously with a 1 min interval and a 15 m vertical resolution, based on the backscatter profiles produced by the lidar with a wavelength of 1064 nm and a 5–7 kHz rate. The cloud cover was monitored every day using a MOBOTIX S15 cloud camera installed by the Université Paul Sabatier (UPS) team to obtain pictures in the visible and IR spectra every 2 min. The aperture angles for the IR channel correspond to a 158 m × 114 m area at a height of 200 m, and the pictures are coded in RGB components. A microwave radiometer (the humidity and temperature profiler HATPRO-G4 from Radiometer Physics GmbH) was installed by KIT to measure the brightness temperature to retrieve the absolute humidity, liquid water path, and air temperature. The surface heat and radiation fluxes were measured with an energy balance station deployed over grass and bushes. Additional measurements include soil heat flux, air density, and turbulence parameters.
- iii.
Airborne measurements. The aircraft campaign took place from 29 June to 16 July 2016, conducted collaboratively by three research aircraft (see the Introduction section). In this study, only data from the ATR-42 were used as it flew around Savè between 10:00 and 11:00 UTC and probed the cloud layer. The cloud droplet size distribution was measured with a cloud droplet probe (CDP) (Taylor et al., 2019). The chemical composition for non-refractive compounds was measured with an Aerodyne compact Time-of-Flight Aerosol Mass Spectrometer (HR-ToF-AMS) (Brito et al., 2018). The black carbon (BC) mass concentration was measured with a single-particle soot photometer (SP2) (Denjean et al., 2020b). The aerosol size distribution was measured with a custom-built scanning mobility sizer spectrometer (SMPS, 20–485 nm), an ultra-high-sensitivity aerosol spectrometer (UHSAS, 0.04–1 µm), and an optical particle counter (OPC GRIMM model 1.109, 0.3–32 µm) corrected for the complex refractive index provided in Denjean et al. (2020a). The total number concentration of particles larger than 10 nm was measured by a condensation particle counter (CPC, model MARIE). Meteorological variables such as temperature, humidity, pressure, and wind speed and direction were also measured by a suite of airborne instruments. A gas concentration analyzer was used to measure certain chemical gases, including CO2, CH4, and CO.
2.2 Description of the studied case
Our study analyzes the life cycle of LLSCs based on the observed case of 3 July 2016 at the Savè supersite (Fig. 2). The cloud deck formed during the night, at around 02:00 UTC, close to the appearance of the core nocturnal low-level jet (NLLJ), which could have a maximum speed around 6 m s−1 (Kalthoff et al., 2018) associated with a maximum cooling (Lohou et al., 2020). At formation, the cloud had its base and top located around 310±30 and 640±100 m, respectively, and was maintained by the cloud top radiative cooling and cold advection (Dione et al., 2019).
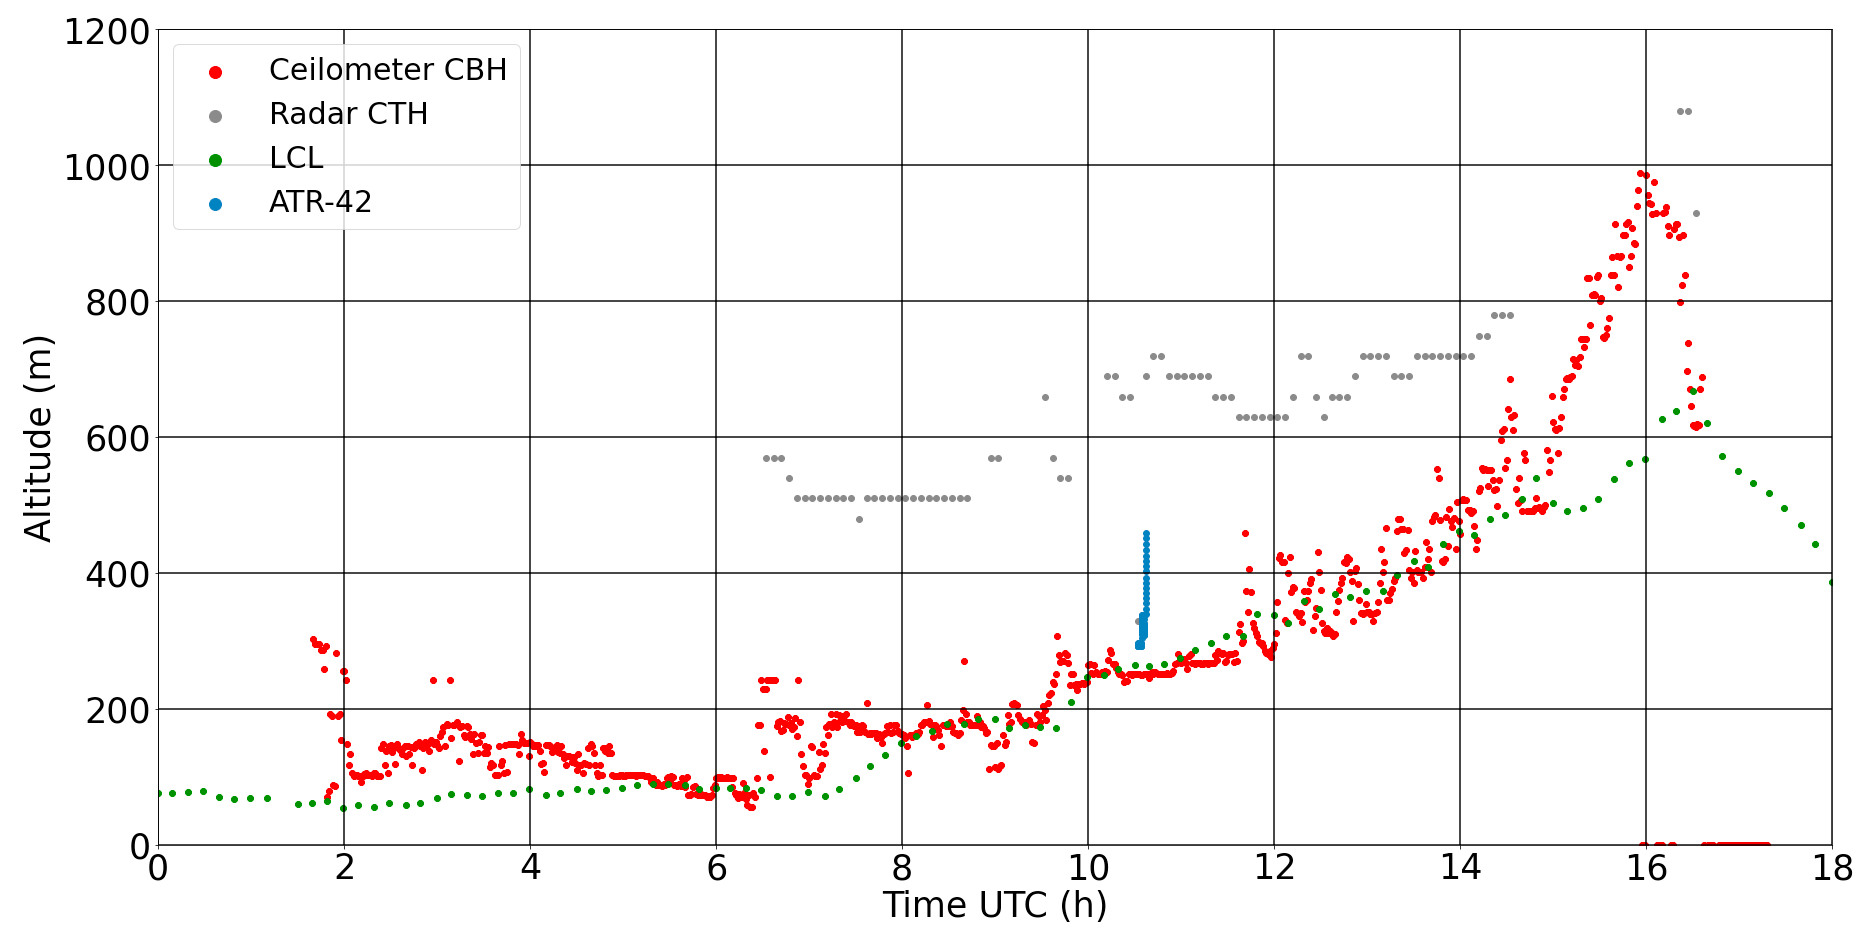
Figure 2The 3 July cloud evolution with the representation of the cloud base height (CBH), the cloud top height (CTH), LCL, and ATR-42 flight track near Savè.
The life cycles of LLSCs over SWA typically involve four phases: the stable phase, jet phase, stratus phase, and convective phase (Dione et al., 2019; Lohou et al., 2020). The stable phase begins just after sunset and is characterized by a weak monsoon flow and the cessation of buoyancy-driven turbulence within the PBL generated by surface heating (Zouzoua et al., 2021). The jet phase corresponds to the settlement of key drivers of cooler air advection. MI, a cold and slightly humid air mass from the Guinean coast, often reaches Savè at the end of the afternoon (between 16:00 and 20:00 UTC) and then is followed by the NLLJ formation (Adler et al., 2019). The stratus phase begins with LLSC formation when advective cooling continuously increases the relative humidity (RH) until air reaches saturation between 22:00 and 06:00 UTC. The turbulent mixing beneath the NLLJ alongside a strong radiative cooling at the cloud top leads to the persistence of a thick stratus layer (Schuster et al., 2013; Babić et al., 2019). The LLSC life cycle ends during the final convective phase, which begins when the PBL develops vertically due to solar heating at the surface alongside a weak radiative cooling at the cloud top (e.g., Ghonima et al., 2016). By using the dataset from the Savè supersite, Zouzoua et al. (2021) identified three scenarios of evolution depending on the LLSC coupling to the surface at sunrise. The coupling was assessed by the departure between the cloud base height (CBH) and the lifting condensation level (LCL).
The LLSCs observed on 3 July 2016 follow the four aforementioned phases and evolve by scenario C as described by Zouzoua et al. (2021) and as seen in Fig. 2. The cloud is coupled to the surface at sunrise (06:30 UTC); its base rises with a growing PBL until break-up occurs in the late afternoon around 16:00 UTC. The cloud deck of the 3 July case lasts longer (2–3 h more) compared to the other LLSCs observed during the campaign. The co-located Ka-band mobile, dual-polarization Doppler radar (8.5 mm, 35.5 MHz) at the Savè supersite detected light drizzle precipitation from higher clouds in a rather short period during the first hours of the convective phase, while no precipitation was detected by the surface rain gauge. Thus, the late LLSC break-up could be explained hypothetically by the cooling alongside moistening brought by the evaporation of this light precipitation, which could enhance the liquid water path of the lower LLSC (Zouzoua et al., 2021). Nevertheless, our focus of this study is on the life cycles of LLSCs as influenced by aerosols alongside planetary boundary layer dynamics rather than on examining the above hypothesis, which is likely related to a process beyond the local scale. Therefore, our model setting is made to specifically eliminate the influence of a mid-cloud layer for this purpose.
On 3 July 2016, the ATR-42 flew around the Savè supersite and probed the boundary layer around 10:00 UTC. The airborne instruments detected aerosol size distributions with a maximum number concentration around 3500 cm−3, mainly in the Aitken mode. The ATR-42 also detected export of polluted air masses from Lomé (a coastal city), which could explain the measured high aerosol concentration in the Aitken mode (Denjean et al., 2020a). The measured aerosol chemical composition was mainly dominated by organics (55.3 %), followed by sulfates (24.5 %), ammoniac (11.2 %), and nitrates (6.2 %), while only a small amount of black carbon (BC) mass was detected around Savè (2.8 %). However, the measured aerosol size distributions were found to need a correction based on the aerosol refractive index to avoid bias. For this purpose, Denjean et al. (2020a) provided corrected profiles for various types of aerosol populations measured during the DACCIWA campaign. Our modeling has thus used corrected rather than “raw” measurements.
2.3 Meso-NH model
In this study, we have simulated the observed case using the Meso-NH model (Lac et al., 2018). Meso-NH is a non-hydrostatic atmospheric research model that has been applied to studies on different scales ranging from synoptic to turbulent. Deployed in a limited area, the model uses advanced numerical techniques like monotonic advection schemes for scalar transport and a fourth-order advection scheme for momentum (Jiang and Shu, 1996). Subgrid turbulence is parameterized using turbulence kinetic energy (TKE) based on Deardorff turbulent mixing length. In this study, a fourth-order advection scheme, CEN4TH, centered on space and time, is applied with a Runge–Kutta-centered fourth-order temporal scheme for momentum advection (Lunet et al., 2017). Aerosol and chemistry are also well represented. Here, Meso-NH version 5.4.2 is used, and the relevant component modules and parameterizations for this study are described as follows.
The aerosol–cloud framework of the Meso-NH version used in this study is LIMA (Liquid Ice Multiple Aerosol). LIMA includes a complete two-moment scheme predicting both the mass mixing ratio and the number concentration of aerosol species (Vié et al., 2016) using a superimposition of several aerosol modes, with each mode defined by its chemical composition and size distribution. Aerosols can act as either cloud condensation nuclei (CCN) or ice-forming nuclei (IFN). Based on the ICE3–ICE4 ice microphysics schemes (Caniaux et al., 1994; Pinty and Jabouille, 1998; Lascaux et al., 2006) and the two-moment warm microphysical scheme C2R2 (Cohard and Pinty, 2000), LIMA also predicts the mass and number concentration of cloud droplets, raindrops, and pristine ice crystals. To model the boundary layer cloud in the LES mode, a pseudo-prognostic approach for correcting the diagnostically derived supersaturation was developed (Thouron et al., 2012) to limit the droplet concentration production and to better represent cloud top supersaturation. A variant of C2R2, called KHKO, was developed by Geoffroy et al. (2008) for clouds producing drizzle (differentiated from cloud droplets with a radius larger than 25 µm) following the Khairoutdinov and Kogan (2000) parameterization. Only the sedimentation of drizzle is calculated in the scheme. KHKO alongside necessary modifications has been brought in the LIMA warm-phase framework in order to better represent drizzle in thin and low-precipitating warm clouds. Therefore, we have adopted this version of LIMA in our modeling.
To better represent aerosols, we have used the aerosol module ORILAM (Organic Inorganic Lognormal Aerosols Model) in this study and coupled it to Meso-NH to interconnect the cloud microphysics module with LIMA (Tulet et al., 2005). ORILAM describes the size distribution and chemical composition of aerosols using two lognormal functions for the Aitken and accumulation modes. These modes are internally mixed. For each of them, the model computes the evolution of the primary species (black carbon and primary organic carbon), three inorganic ions (NO, NH, and SO), and condensed water. ORILAM includes a secondary organic aerosol (SOA) module (Tulet et al., 2006) that is, however, not included in this study. Three moments (the zeroth, third, and sixth) are considered for each mode to compute the evolution of the total number, median diameter, and geometric standard deviation. Note that the choice of the sixth moment is numerical since it allows one to calculate the coagulation coefficients explicitly and to facilitate the integration of the aerosol solver. The size distribution can evolve through both intramodal and intermodal particle coagulation. It can also evolve through condensation and merging between modes. ORILAM includes the CCN activation scheme of Abdul-Razzak and Ghan (2004) (though without the correction of Thouron et al., 2012) in order to replace the one of LIMA to calculate the number of activated CCN. The use of ORILAM needs to activate the gas-phase chemistry scheme of Meso-NH (Tulet et al., 2003; Mari et al., 2004) using the EXQSSA solver. ORILAM has a module for gas-particle thermodynamic equilibrium (EQSAM for inorganics and MPMPO for organics) that allows the model to calculate the contents of inorganic and organic compositions, including water within aerosols (e.g., Metzger et al., 2002; Griffin et al., 2003). The solver combines moments 0 (integrated number) and 3 (the integrated new volume resulted from the hygroscopic growth) to calculate the new dimensional distribution (Tulet et al., 2005, 2006). ORILAM directly computes the evolution of the aerosol extinction, single-scattering albedo (SSA), and asymmetry factor that are coupled online to the radiation scheme of Meso-NH for the six short wavelengths from the aerosol chemical composition and the size parameters (Aouizerats et al., 2010).
The ECMWF radiation module is adopted in this study. Based on the two-stream method, this module calculates the atmospheric heating rate and then net surface radiative forcing. The longwave radiation scheme used is the Rapid Radiation Transfer Model (RRTM; Mlawer et al., 1997) based on the correlated k-distribution method. It integrates 16 bands and 140 g points (Morcrette, 2002). The shortwave scheme uses the photon path distribution method (Fouquart and Bonnel, 1980) in six spectral bands. Fluxes are calculated independently in clear and cloudy portions before being aggregated. The liquid cloud effective radius is computed from the liquid water content and droplet number concentration with the Martin et al. (1994) parameterization for continental conditions.
The surface model used in our modeling is Surface Externalisée (SURFEX), which is a standardized surface module containing surface schemes externalized by Meso-NH (Masson et al., 2013). With SURFEX, each grid point can be split into four tiles: land, town, sea, and inland water (lakes, rivers). In the case of a shrub surface, the interactions between soil, biological processes, and the atmosphere are calculated by the Interaction Sol-Biosphère-Atmosphère (ISBA) parameterization (Noilhan and Planton, 1989). Several evapotranspiration formulations are available for simulating plant and CO2 fluxes. Soil is represented as a bucket of two or three layers. The land tile can be separated into as many as 19 sub-tiles following the type of vegetation.
2.4 Model settings
Based on the observations and the capability of the model, a reference case (REF) was first designed to simulate using the LES. The reference case serves as a base for the model to reproduce the major features of the observed LLSC life cycle, particularly when using an observed aerosol profile. It also serves as a comparison base for further sensitivity simulations with different aerosol configurations to study the impacts of aerosol composition and abundance on LLSCs.
The model domain is a 3D box 9.6 km × 9.6 km × 2 km in size, with a horizontal resolution of 40 m × 40 m. Note that the radiation module still proceeds with its calculations above 2 km using prescribed profiles. The vertical resolution is 10 m between 0 and 1200 m and then 40 m above to explicitly resolve the important turbulent eddies. A periodic boundary condition on the horizontal directions is applied, and a “sponge layer” is set between 1.8 and 2 km height to absorb wave reflection. A thermodynamic perturbation is deployed to activate turbulence at the beginning of the simulation at 23:00 UTC on 2 July, and the spin-up is 1 h (though observed clouds formed around 02:00 UTC). A subsidence profile is applied following the Bellon and Stevens (2013) scheme: , with w0= 15 mm s−1 and zw= 250 m. This subsidence profile is applied during the entire simulation to keep a nearly constant cloud top height during the stratus phase and to better control the convective phase. The surface energy and water fluxes are simulated by the SURFEX ISBA scheme parameterized using data from the Savè supersite, with the typical vegetation consisting of shrubs, crops, or taller trees, assuming a flat surface in the area around Savè. A time step of 2 s is used, which appears to be adequate based on testing runs to study the LLSC nocturnal–diurnal variations, particularly involving aerosol and cloud microphysics. The radiation scheme is called every 10 min. Note that previous studies regarding nocturnal stratus and stratocumulus suggested that a vertical resolution as fine as 5 m near the cloud top would be necessary for reproducing the cloud top entrainment and thus cloud macrophysical structures (Stevens et al., 2005). However, the nocturnal–diurnal life cycle in our case involves a dynamically evolving cloud top from 400 to 1200 m, particularly in the daytime, making it a difficult task to prescribe a highlighted zone for finer resolution. Our fast-testing results, on the other hand, did not suggest any significant difference between the run with 10 and 5 m vertical resolution (not shown). Therefore, the current vertical resolution and the time step are selected to cover all possible cloud tops during the simulation well and to provide the best economic computational performance for modeling aerosol–cloud interaction with a fully coupled chemistry model.
The REF case is configured using the radiosondes of 2 July at 23:00 UTC for temperature, humidity, and horizontal wind components (U, V). The simulation is then forced by tendency profiles of temperature, humidity, and horizontal wind applied homogeneously to the domain each hour. These tendency profiles are based on the hourly radiosondes launched on 3 July between 00:00 and 11:00 UTC. After 11:00 UTC, the next tendency profiles were derived based on the measurements of the microwave radiometer, the analysis of surface incoming solar radiative flux, and the cloud thickness and cover. Note that, despite these best possible efforts in configuring a set of observation-constrained tendency profiles to reproduce the observed cloud field, it is difficult to eliminate the possibility that such profiles could reflect certain local thermodynamic effects however small they are. In practice, our main goal is to make the profiles able to force the model to reproduce observed quantities of major features such as the cloud top, base, liquid water path (LWP), or surface incoming solar radiation in the REF case. This would serve the best purpose for us to address the major issue of this study, i.e., the role of different aerosol profiles in the life cycles of modeled LLSCs.
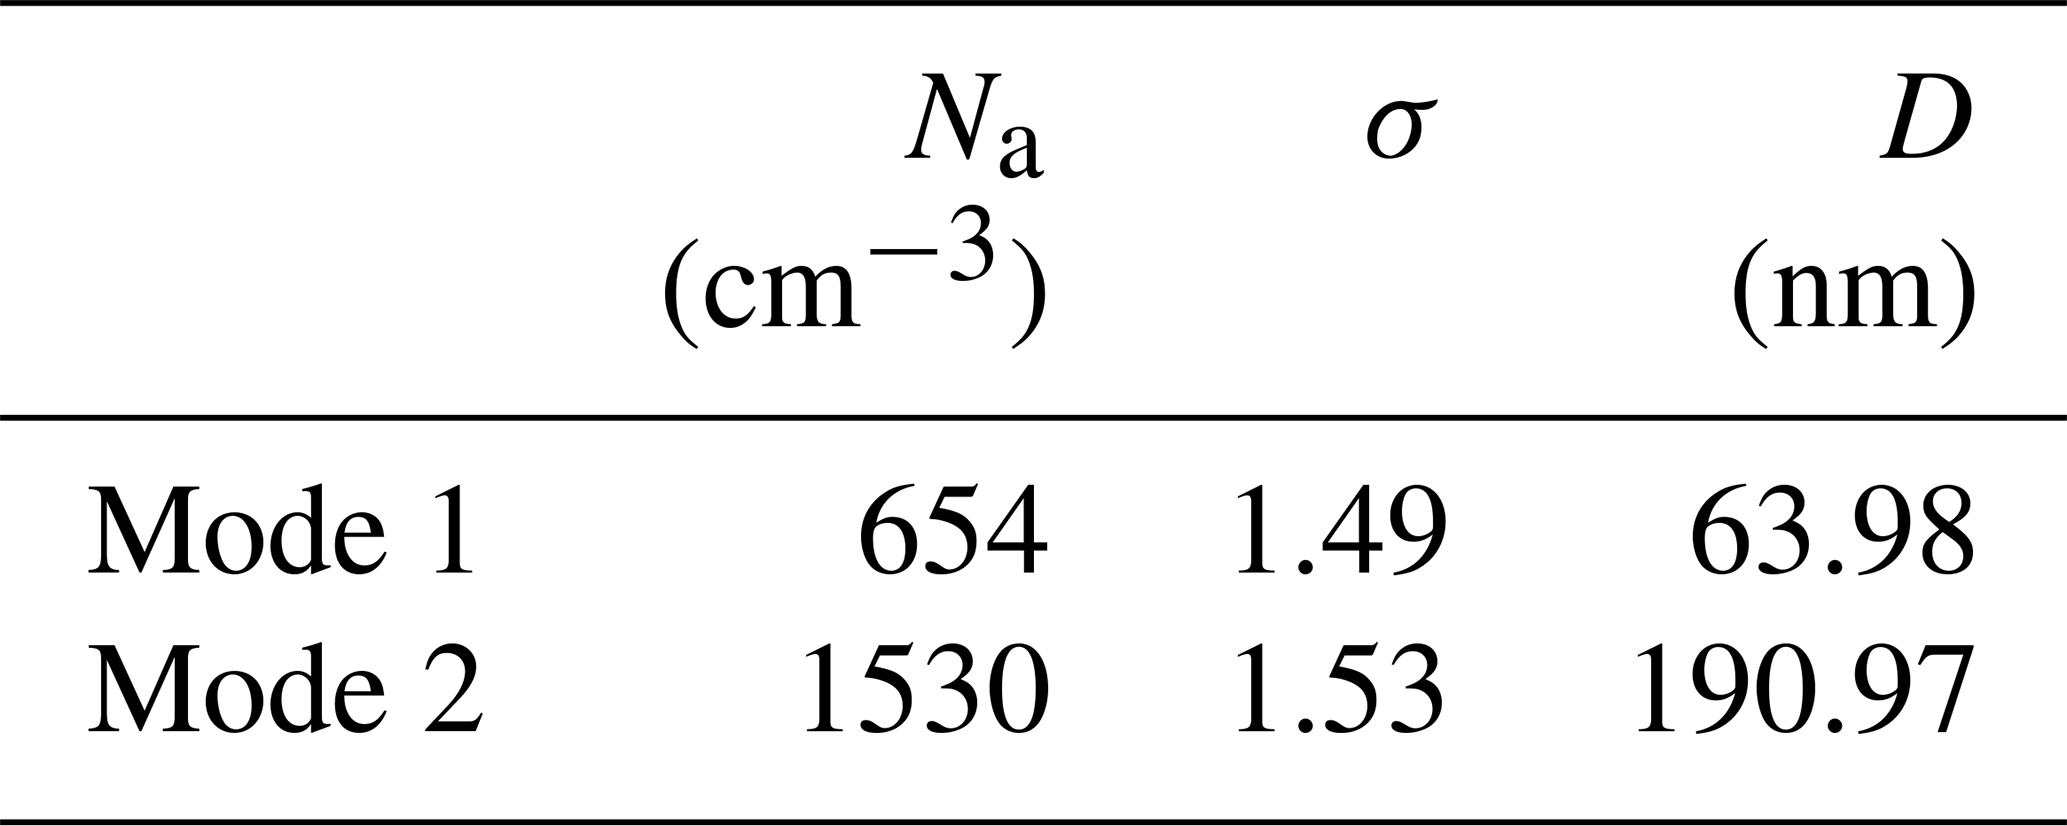
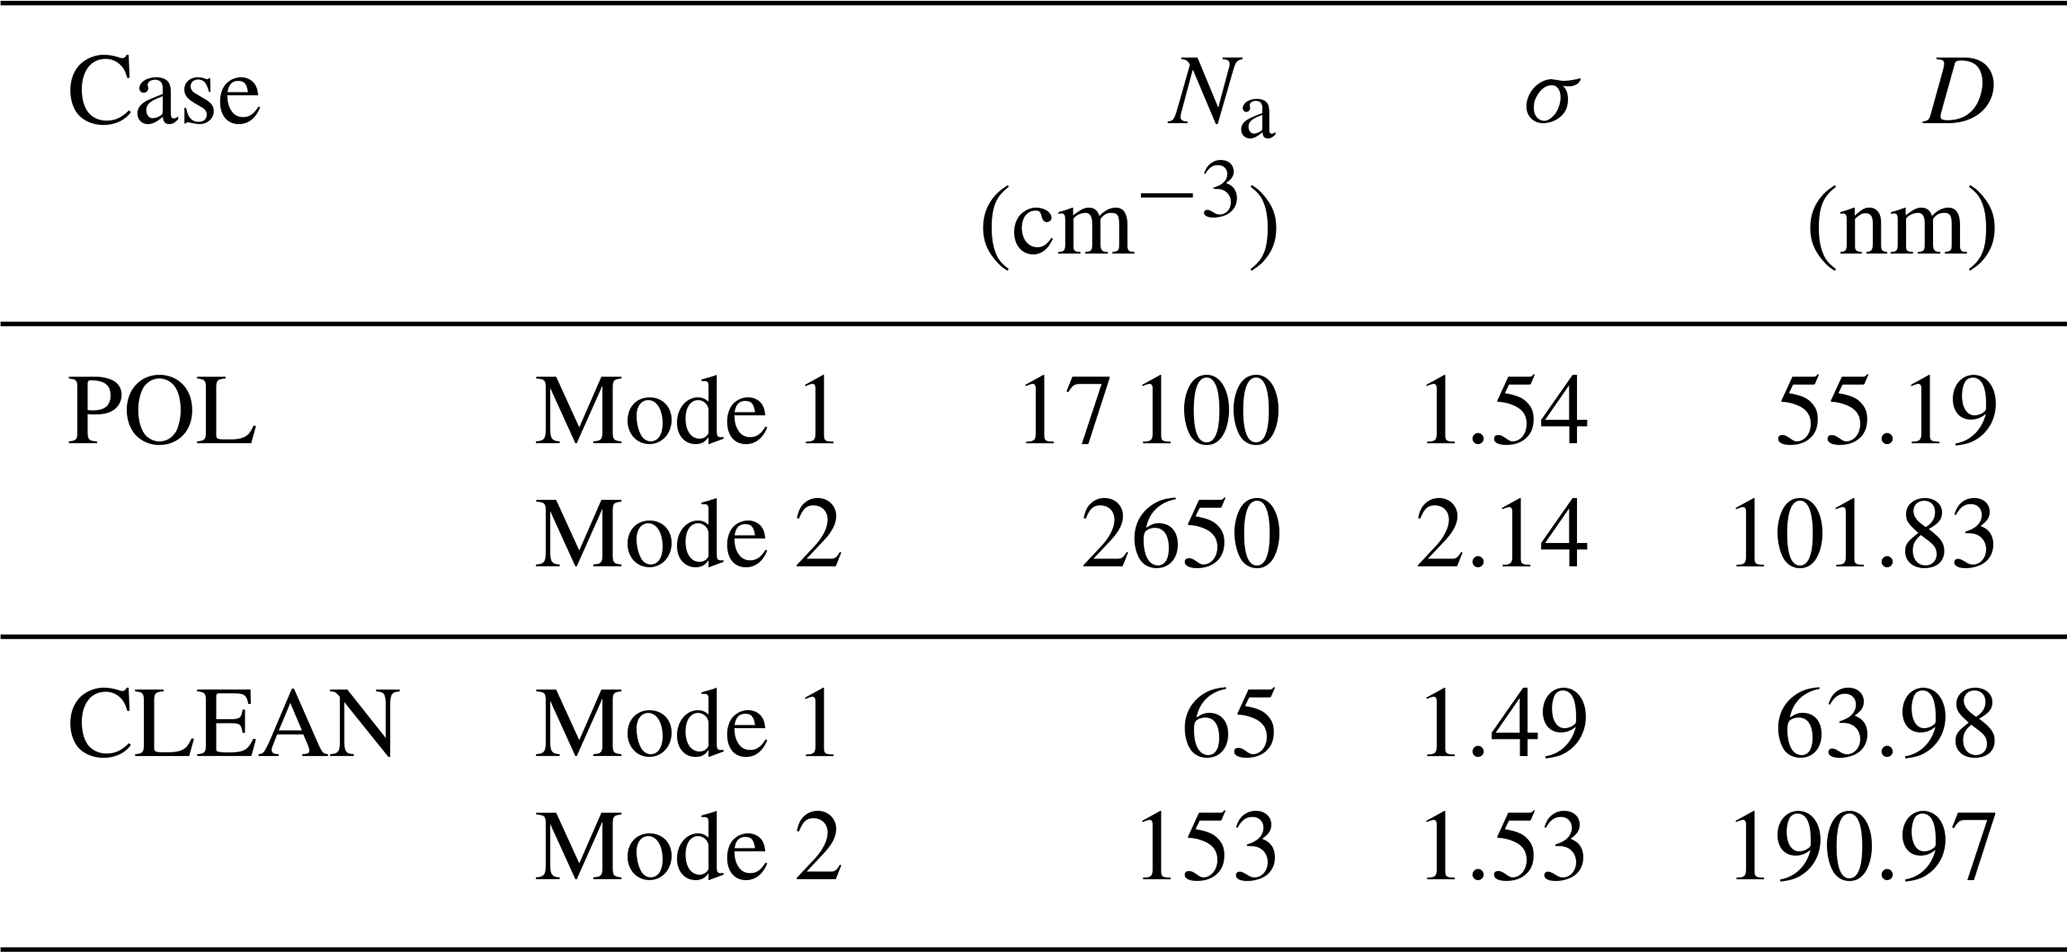
We use a “background” distribution as the aerosol profile for REF simulation. This profile, derived from the corrected original measurements as described in Denjean et al. (2020a), reflects the influence of aged BBAs on clouds with a minor influence from local anthropogenic sources. The aerosol size distribution is dominated by a particle accumulation mode centered at 190 nm and a smaller Aitken mode centered at 64 nm (Fig. 3b). This profile exhibits a high loading of aerosols with a maximum of 1400 cm−3 in the accumulation mode. The aerosol chemical composition is dominated by organics (52.2 %), followed by sulfates (25.3 %), ammonium (8.9 %), BC (10.7 %), and nitrates (2.8 %). The configuration of ORILAM has been initialized using the REF aerosol chemical composition and size distribution given in Table 1 and Fig. 3b by fitting the scanning mobility sizer spectrometer (SMPS) profiles into two lognormal modes using the py-smps package (Hagan et al., 2022), with each mode having the same chemical composition.
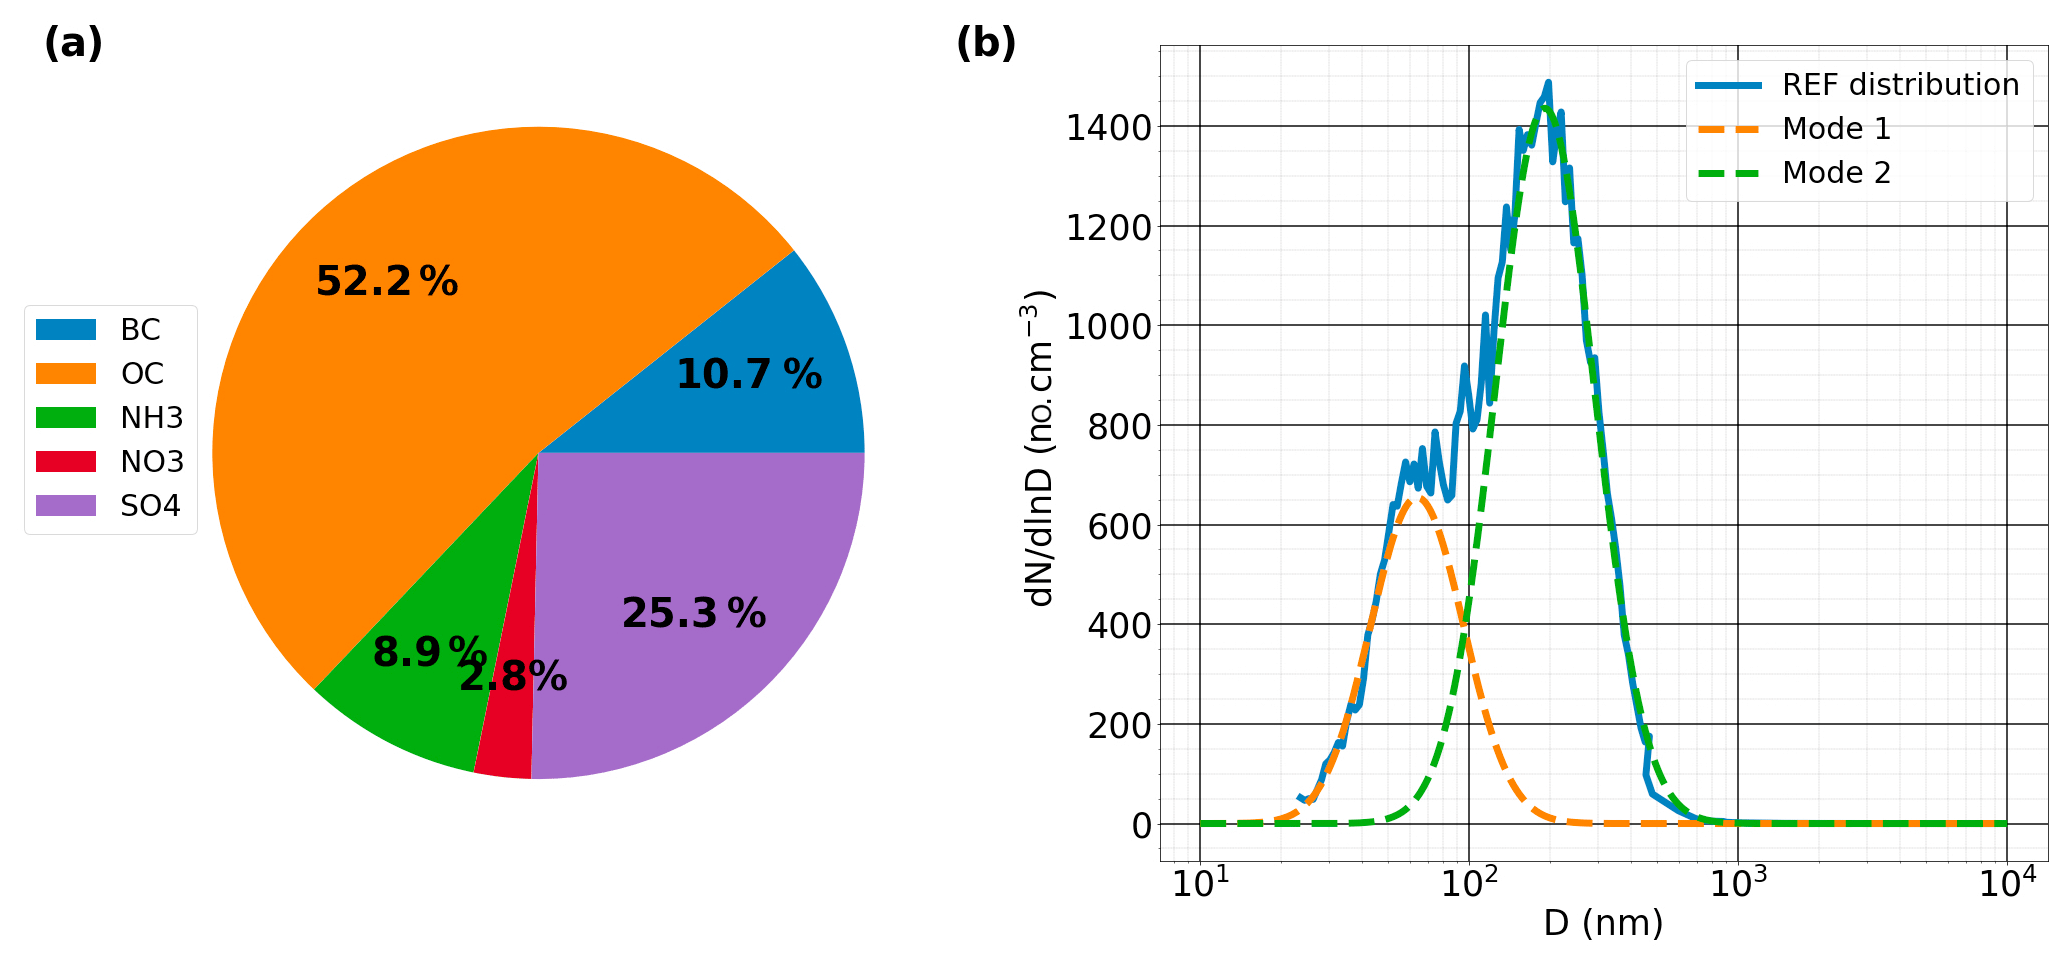
Figure 3(a) Aerosol chemical mass compositions and size distributions fitted into the two modes described in Table 1 and (b) used in REF.
Table 1REF aerosol size distribution described by two modes configured by three parameters (number concentration Na, standard deviation σ, and diameter D).
3.1 Simulating the life cycles of LLSCs
The simulation of the REF scenario reproduces the formation of the observed LLSCs on 3 July 2016 as shown in Fig. 4. The formation of clouds leads to, as described in Sect. 2.2, the end of the jet phase. The domain-mean CBH, derived from the modeled mixing ratio of cloud droplets, follows the ceilometer's measurements during the stratus phase between 02:00 and 10:00 UTC, varying between 100 and 300 m altitude. The simulated domain-mean CTH evolves from 400 to 650 m altitude during the same period, well within the range from 500 to 580 m detected by the radar. The modeled domain-mean CBH and CTH, however, overestimate the measurements of the ceilometer and radar, respectively, during some periods in the late morning and afternoon. The difference between the simulated and ceilometer-detected CBH can be as large as 150 m, e.g., at 11:00 UTC, while the modeled CTH is often higher than radar measurements by 100 m. Between 15:00 and 16:00 UTC, the simulated domain-mean CBH again approaches the ceilometer readings from 600 to 950 m (no radar values are available to evaluate the simulated CTH). As mentioned in Sect. 2.1, the ceilometer is a vertically pointing lidar, and its detected values come from the vertical profiles of reflectivity with 30 m resolution. The differences between the model and the observation could come from the different representations between the simulated result (a domain average) and the ceilometer detection (limited to only vertical direction), in addition to the vertical resolution of the observed profiles. The same could also apply to the difference between modeled and radar-detected CTH, in addition to the limitation of radar in detecting hydrometeors. Nevertheless, certain model weaknesses likely associated with a lack of hourly radiosondes during the afternoon period as an observational constraint would contribute to these discrepancies as well.
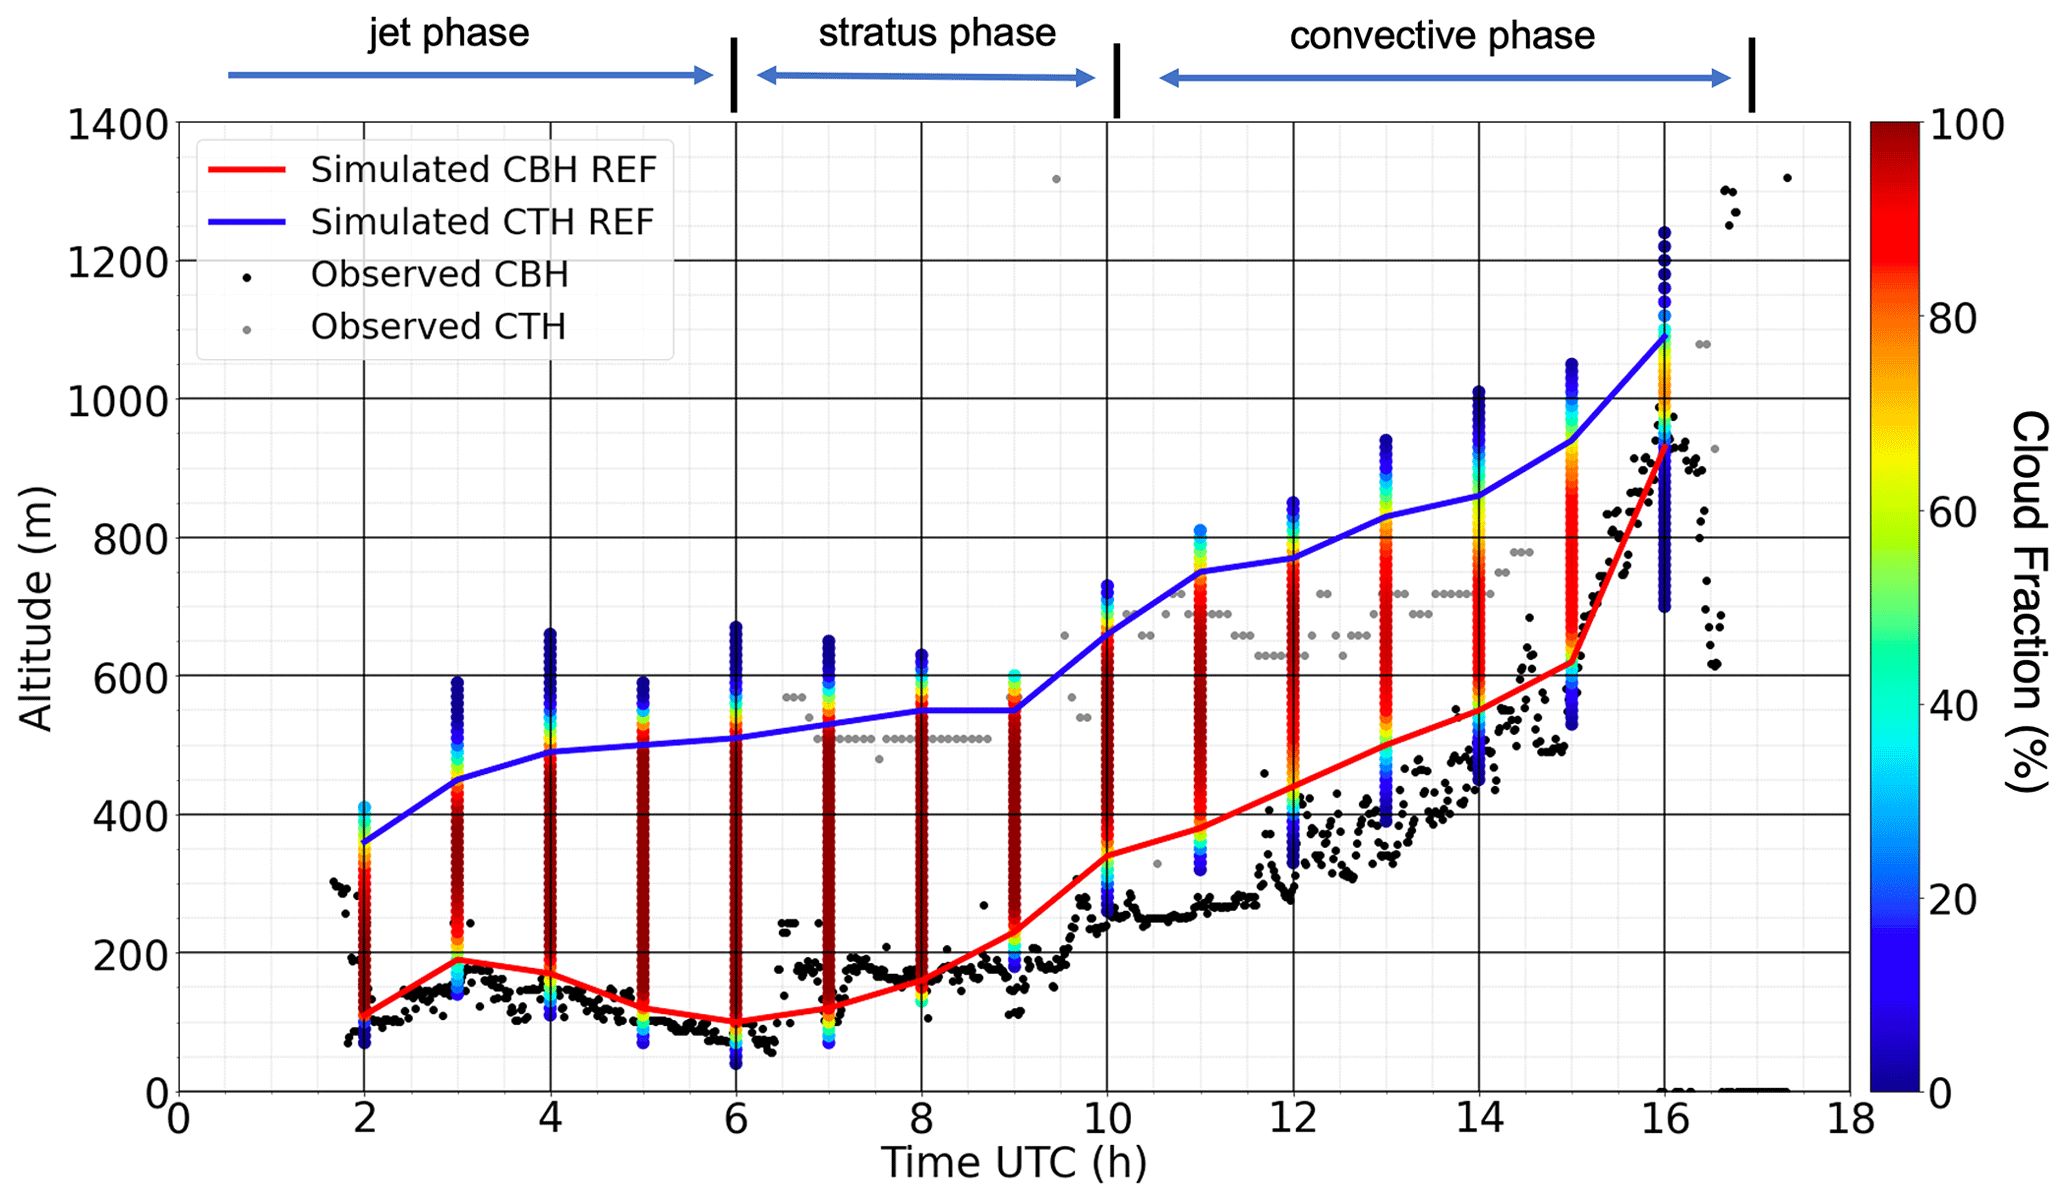
Figure 4Simulated LLSC deck evolution compared to Savè ceilometer and radar measurements. Vertical color bars attribute the cloud fraction in percentage at each altitude level. Here, simulated CBH and CTH represent the domain-averaged cloud base and cloud top height, respectively. Different phases might have overlaps; therefore, their marks only serve a reference purpose here.
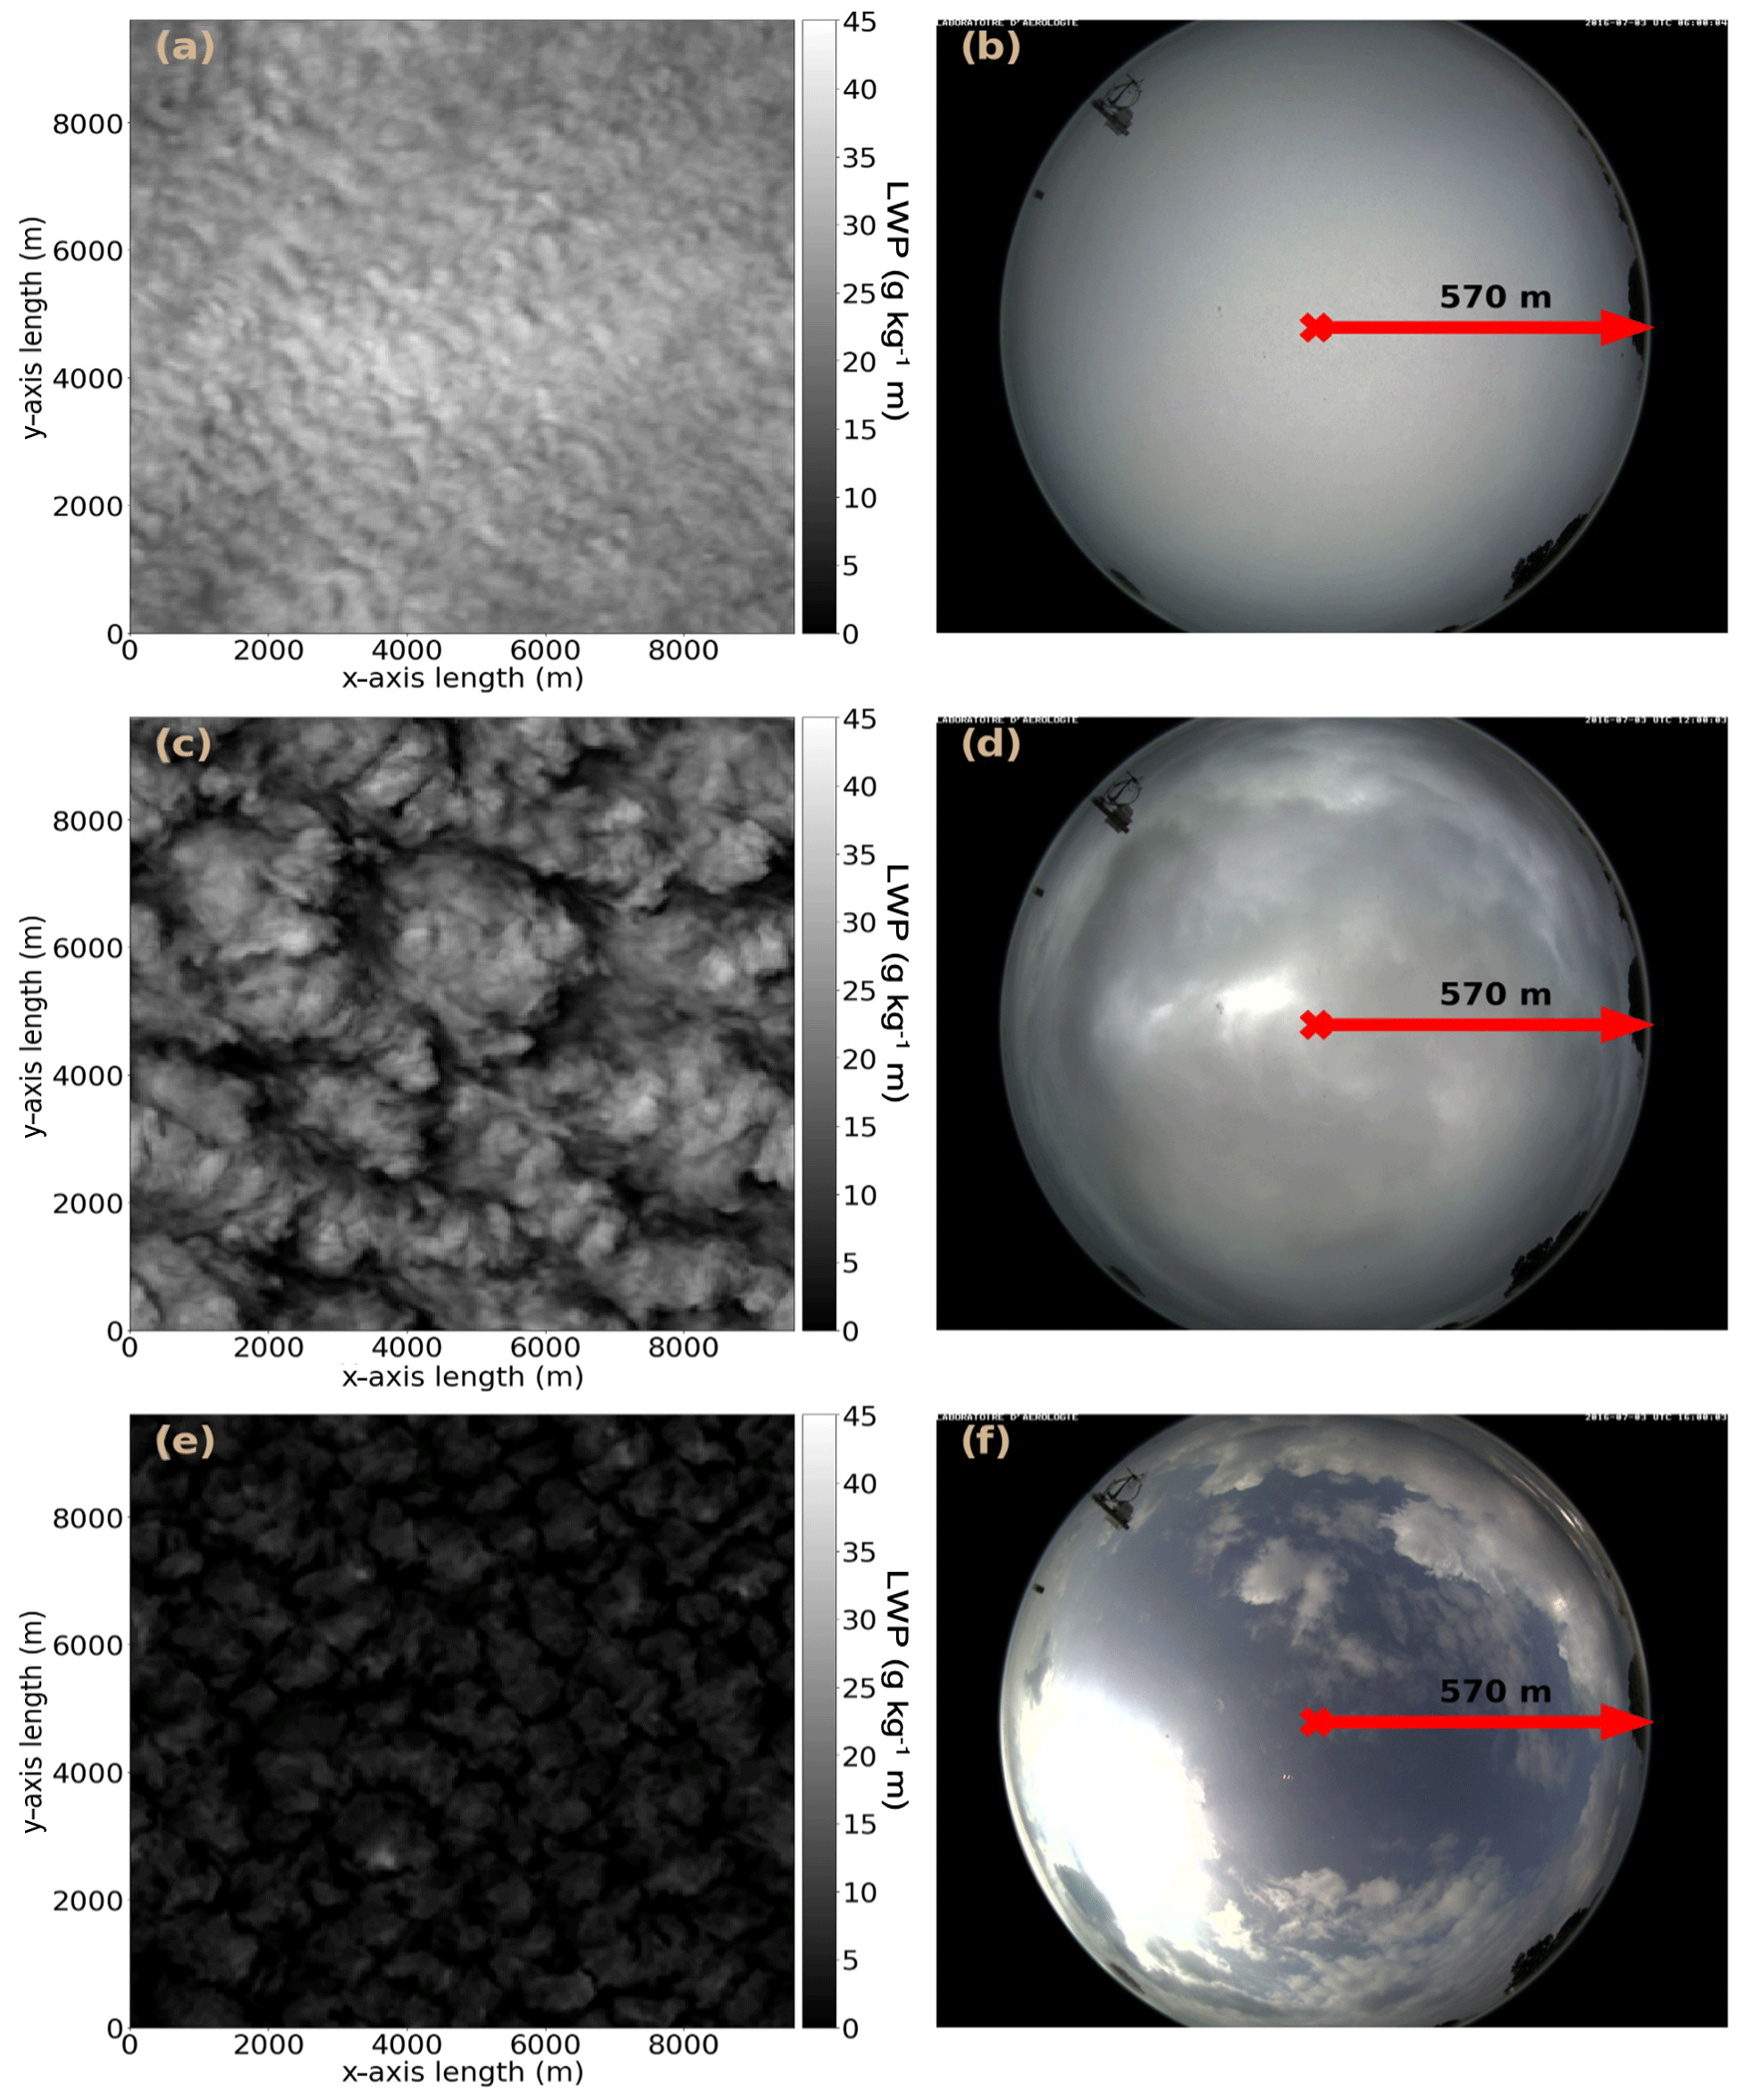
Figure 5Comparison between the modeled liquid water path (LWP, g kg−1 m) and the images from the Savè cloud camera at 06:00 (a, b), 12:00 (c, d), and 16:00 UTC (e, f).
To analyze the cloud cover profile over the domain, the cloud fraction (CF) at each model layer is calculated as the occupation percentage of the cloud pixels with a total condensed water mixing ratio exceeding 0.05 g kg−1 at that given layer (Fig. 4). Note that this cloud fraction differs from the cloud fraction defined as a column metric. In addition, the LWP in each column (Fig. 5), calculated based on the column-integrated cloud water mixing ratio, brings a view of the horizontal organization and the homogeneity of the cloud deck. During the stratus phase, the CF is nearly equal to 100 % between CBH and CTH (Fig. 4), suggesting a more homogeneous cloud deck consistent with cloud observations with a sky camera (visible range) (Fig. 5a and b). Notably, the peak LWP values between 06:00 and 12:00 UTC are quite close, while the domain-mean values differ (Fig. 5). In comparison, both the peak and domain-mean LWPs are sharply lower at 16:00 UTC due to cloud break-up and dissipation. Between 10:00 and 13:00 UTC, the CF of the layers between domain-mean CBH and CTH starts to decrease from near 100 % to 90 %, while the CF at CBH and CTH decreases more substantially to reach near 60 % and 80 %, respectively. This leads to a less homogeneous cloud deck confirmed by the LWP map and the observation of the sky camera at 12:00 UTC (Fig. 5c and d). Indeed, more cloud-free pixels begin to appear, and hence sunlight is seen through the cloud deck by the cloud camera. Finally, the CF continues to decrease until the end of the convective phase, with a maximum barely reaching 80 %, and the values around the domain-mean CBH and CTH level are as low as 20 % and 40 %, respectively (Fig. 4). This demonstrates the break-up of the cloud deck during convection and the cloud thinning. Figure 5e and f clearly show the dissipation of many cloud blocks alongside substantial thinning of the remaining ones at 16:00 UTC.
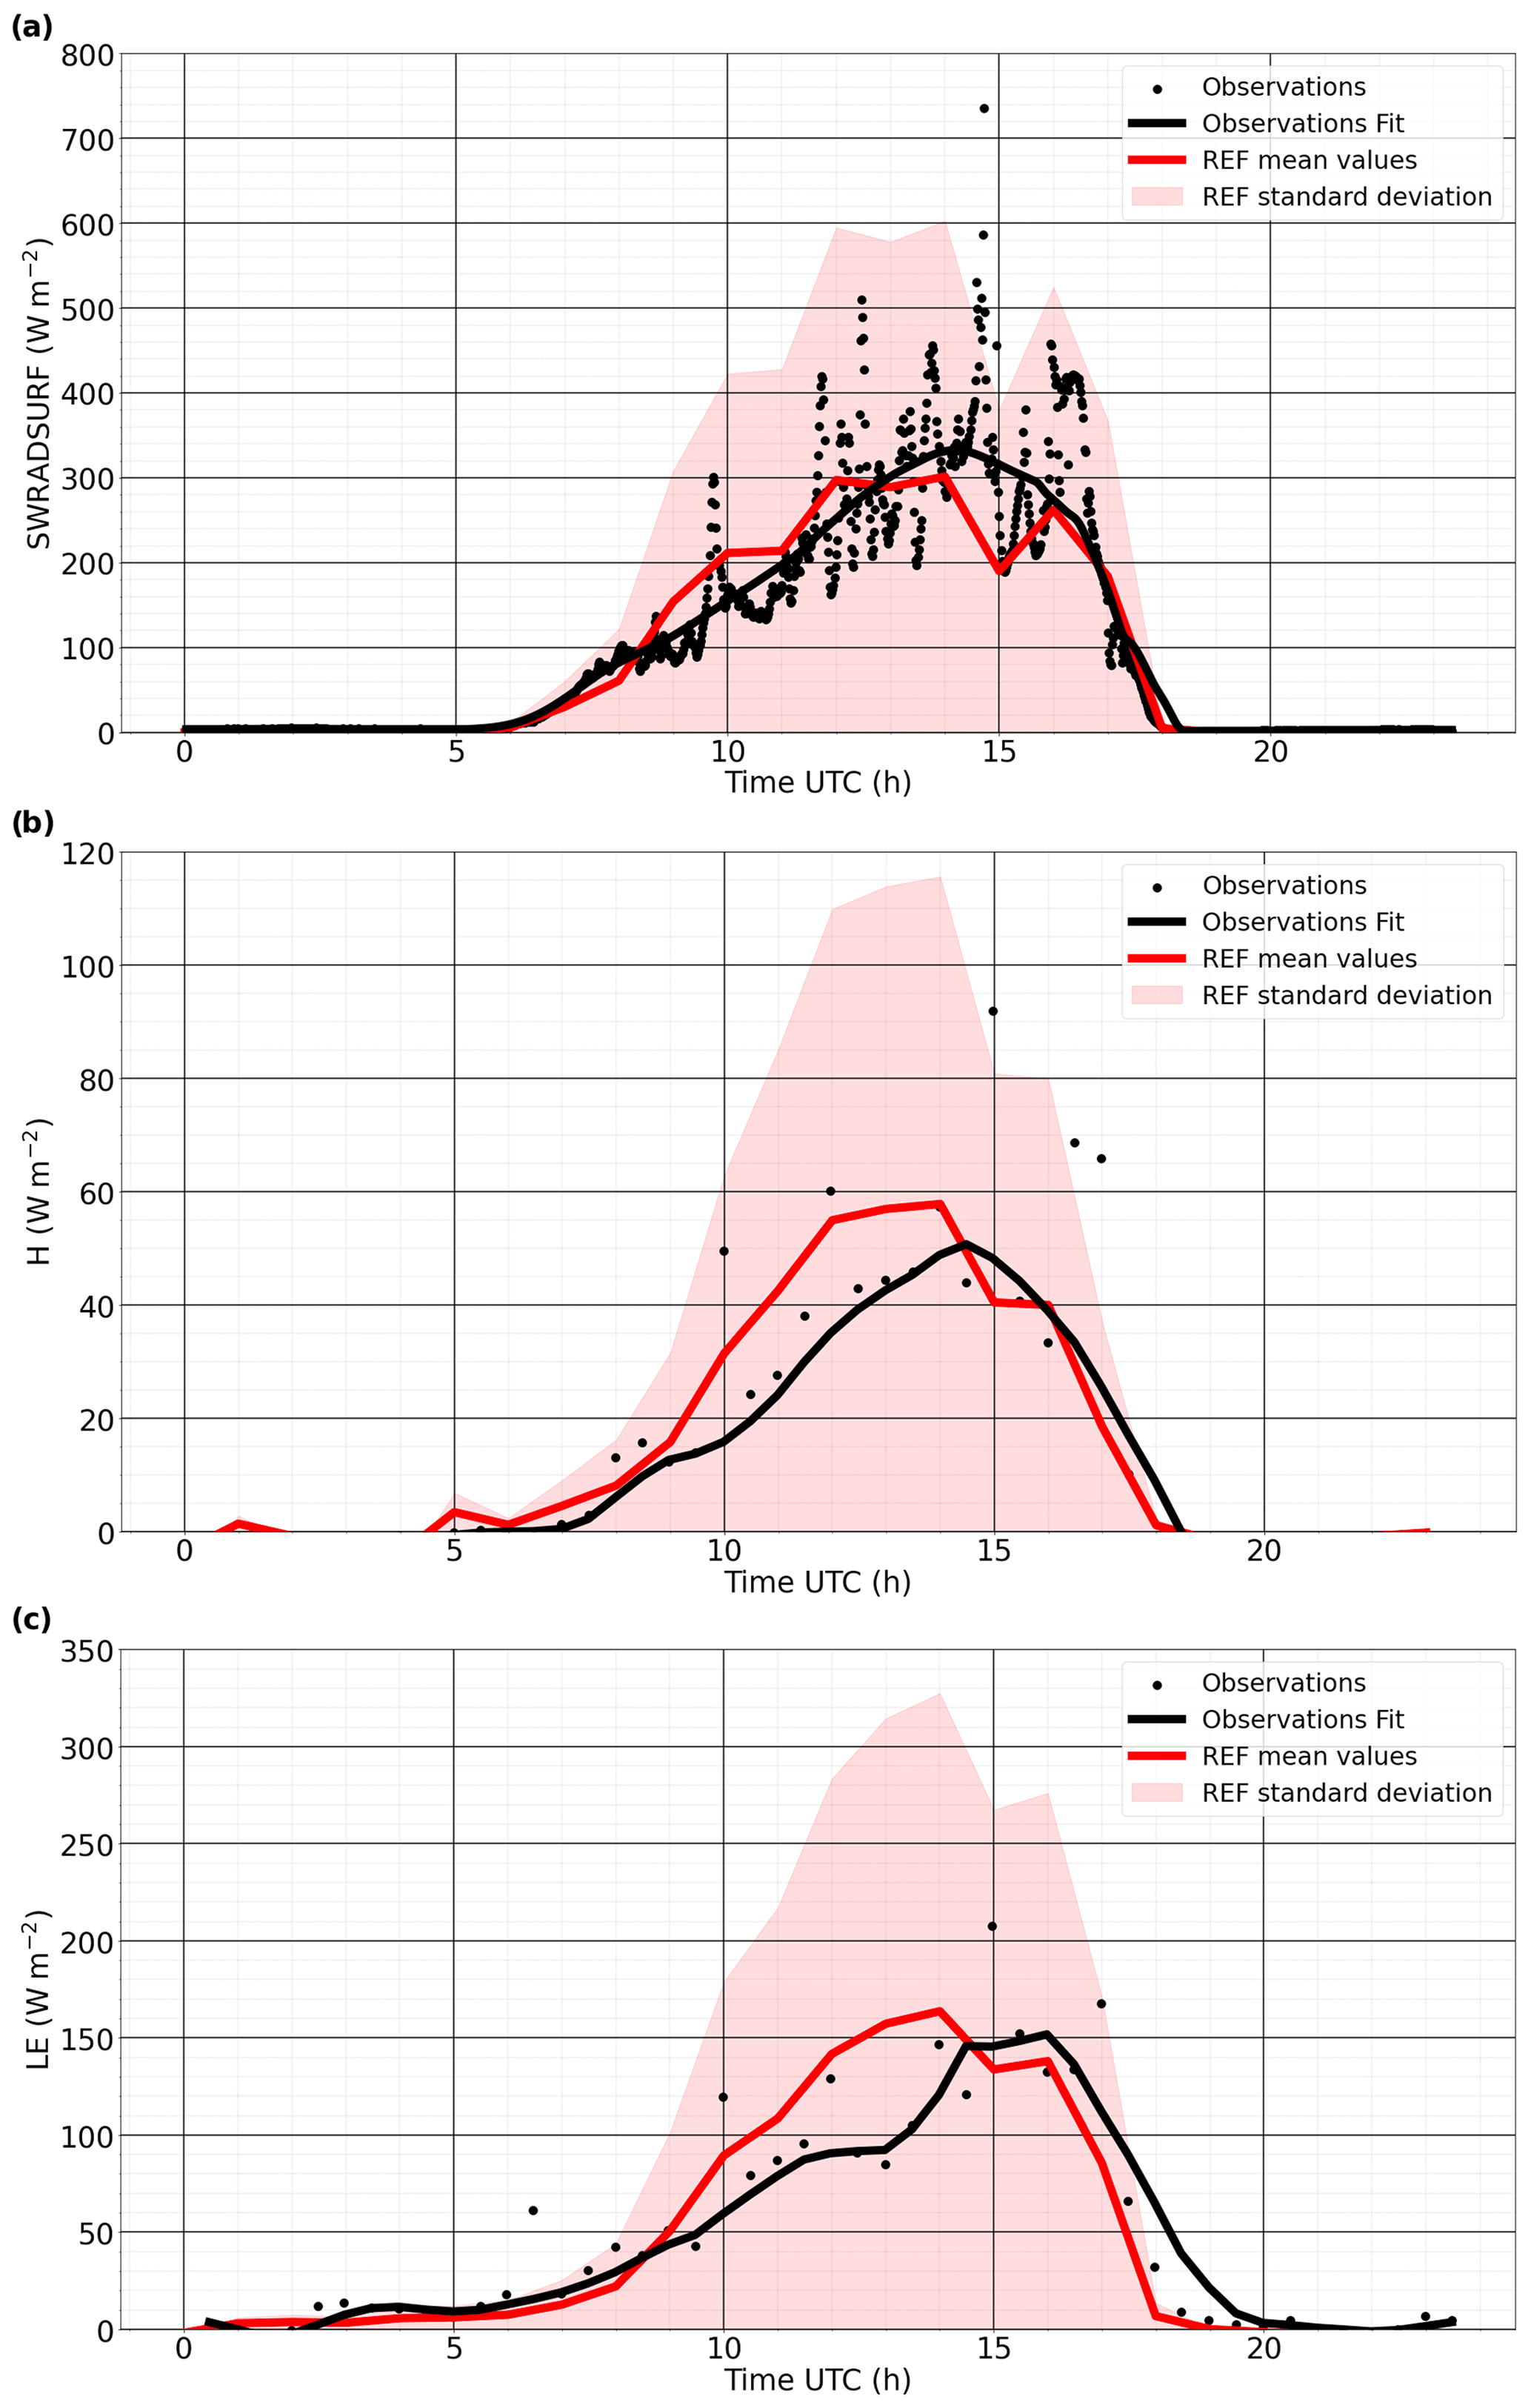
Figure 6Comparison between Savè surface observation and REF simulation for SW radiation flux at the surface (SWRADSURF, a), sensible heat flux (H, b), and latent heat flux (LE, c), all expressed (W m−2) at the surface. The variation of REF for each parameter indicates the range of possible values these parameters can take.
Figure 6a shows the comparison between the modeled domain-averaged shortwave (SW) radiation flux at the surface (SWRADSURF) and the corresponding measurements performed by the energy balance station. Observed values are fitted following the locally weighted scatterplot smoothing (LOWESS) method (Cleveland, 1979). The temporal evolution of the modeled SWRADSURF follows the observations rather well despite some biases. The solar radiation reaches the ground around 06:00 UTC and increases gradually thereafter by reaching near 200 W m−2 at the end of the stratus phase (10:00 UTC). As the cloud deck becomes inhomogeneous during the convective phase (10:00 to 16:00 UTC), the modeled surface solar flux reaches a maximum of 300 W m−2, which is a bit lower than the fitted 350 W m−2 value from measurements. When the clouds break up further, more solar radiation can reach the surface, and the model and observation agree well thereafter with an exception at 15:00 UTC, where the mean modeled curve decreases to 200 W m−2, while the fitted observation curve is near 320 W m−2 due to an overestimation of the cloud thickness by the model. At 16:00 UTC, both modeled and measurement values are very close around 280 W m−2. Generally, the modeled maximum values are higher than the ones detected by the Savè ground instrument.
Figure 6b and c show that the evolutions of the modeled domain-mean latent and sensible heat fluxes reproduce those measured by the instrument rather well. During the night, the sensible heat flux is negative and then increases to 0 W m−2 close to the sunrise time (06:00 UTC), indicating a reduction in the cooling close to the ground (Dione et al., 2019). Between 09:00 and 14:00 UTC, the modeled sensible and latent heat fluxes follow the measured trends though with a clear temporal offset, leading to overestimations of almost 70 and 18 W m−2, respectively. Then the modeled curves go below the fitted observations at 15:00 UTC until after 18:00 UTC. The differences between modeled and observed heat fluxes may again be due to the different representations, as modeled quantities are domain-mean values, while measurements were made at a single point.
In summary, the REF simulation has reproduced all the major observations at Savè on 3 July 2016 reasonably well. For example, the modeled cloud thickness and coverage reflect the measured cloud macrophysical status despite some discrepancies, likely due to a lack of hourly radiosonde data to constrain the tendency profiles, particularly in the afternoon hours. The modeled solar radiation at the ground also follows the measurements very well, except for certain overestimates. In addition, the sensible and latent heat fluxes measured at Savè have also been captured well by the model despite certain temporal offsets.
3.2 Thermodynamic, dynamical, cloud microphysical, and radiative analyses
Thermodynamic, dynamical, and radiative processes and their interaction with cloud microphysics are among the key factors in determining the life cycles of LLSCs. Here we discuss the evolutions of these processes simulated by the model in the REF case to better understand the reasons behind model–observation consistency or discrepancy. The discussion will be emphasized on three periods: the transition between the jet and stratus phases when cloud forms (between 00:00 and 04:00 UTC), the stratus phase between 06:00 and 10:00 UTC, and the convective phase between 12:00 and 17:00 UTC corresponding to the break-up stages of LLSCs.
3.2.1 Transition: jet to stratus phases
Figure 7 displays the modeled domain-averaged profiles of selected macrophysical and microphysical features for the transition of the jet to stratus phases when maritime inflow had already reached the site. As expected, the advection of cold and slightly humid air leads to an increase in RH to reach 100 % at 02:00 UTC at 100 m above the ground. After this time, RH exceeds saturation between 100 and 500 m altitude. The inversion occurs around 325 and 500 m, respectively, at 02:00 and 04:00 UTC. The NLLJ is well represented in modeled results as the mean wind speed (ws) before cloud formation is greater than 7 m s−1. After cloud formation, the NLLJ core nearly corresponds to the mean cloud base height (Adler et al., 2019; Babić et al., 2019; Lohou et al., 2020). The turbulence during this period is shear-driven due to this NLLJ, yielding a well-mixed sub-cloud layer. The TKE is high above the ground (0.05 to 0.1 m2 s−2) and then decreases to near zero above roughly 200 m at 00:00 UTC. At 02:00 and 04:00 UTC, TKE increases at the level of CTH (350 and 500 m, respectively) and decreases at the centers of clouds (near zero and 0.04 m2 s−2), indicating that this area is less turbulent than the extremities of the cloud layer.
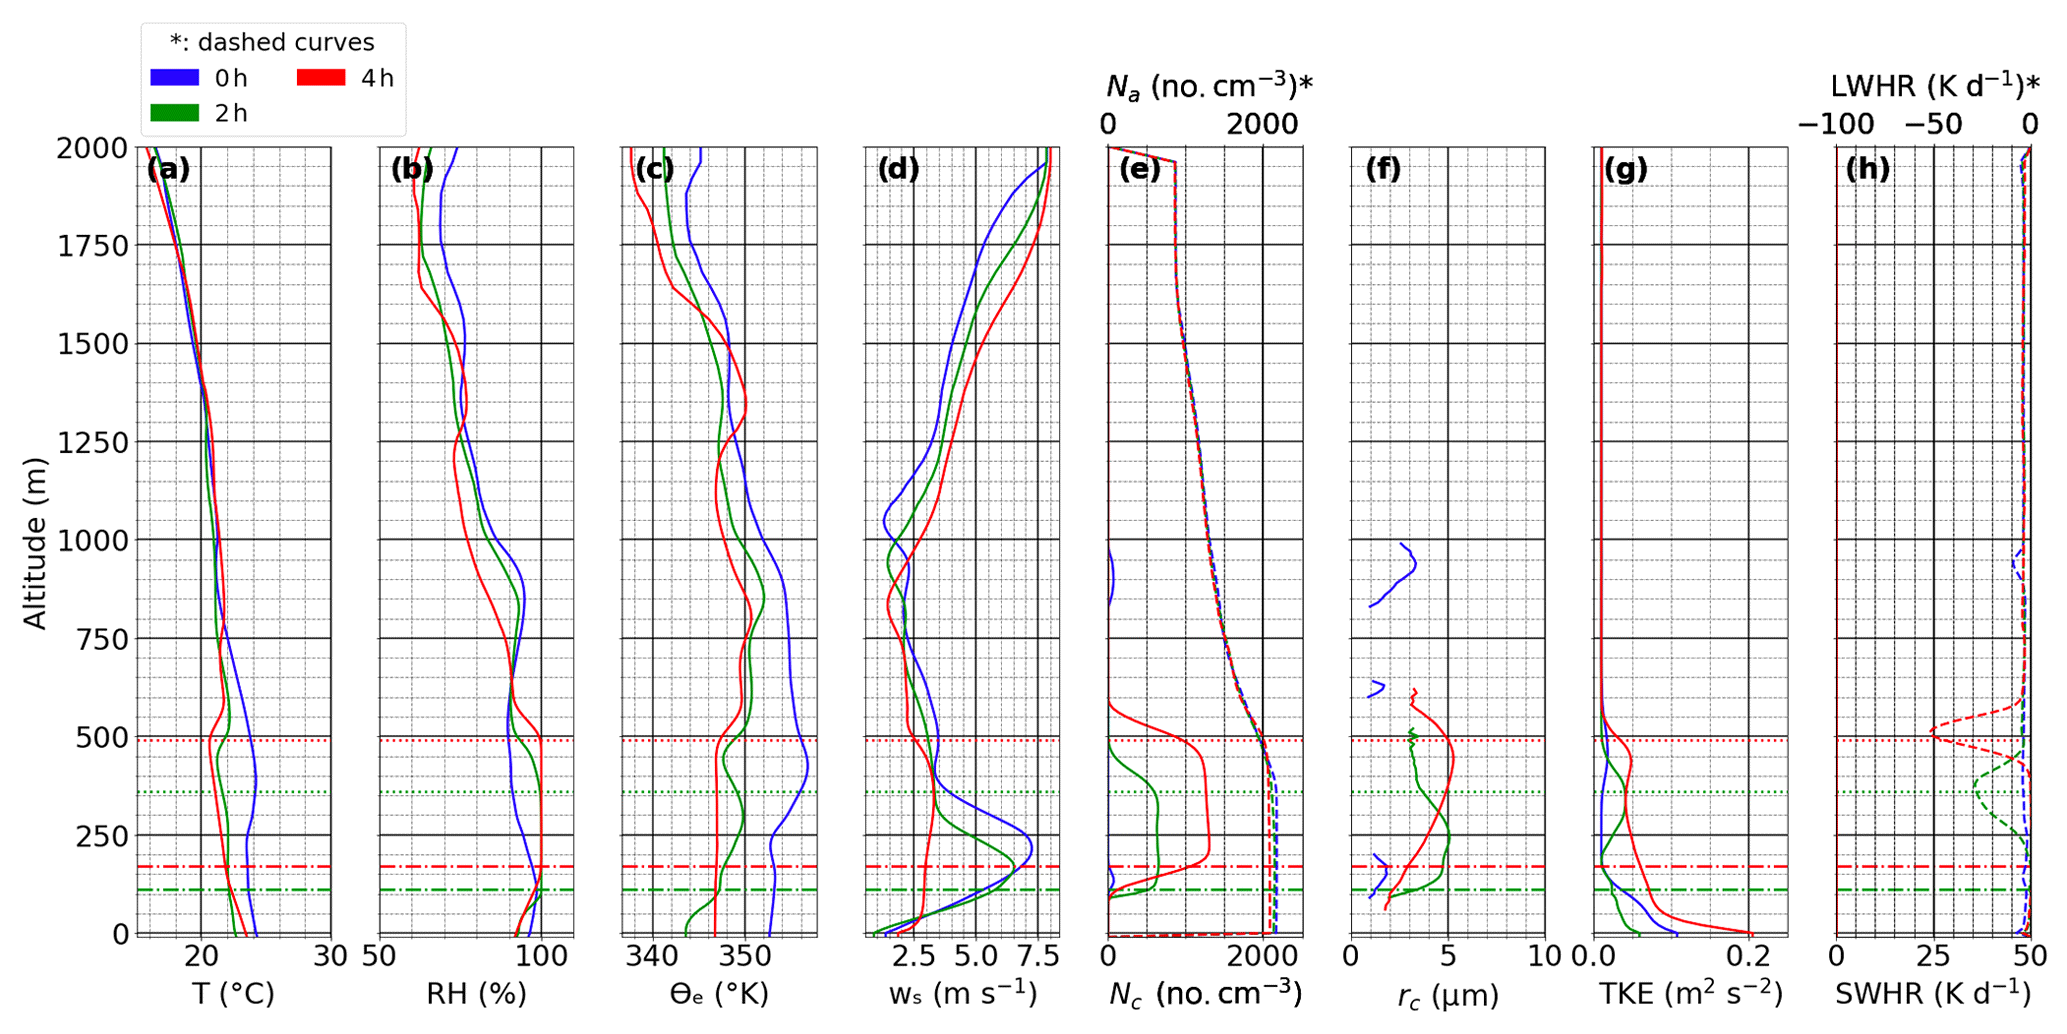
Figure 7Profiles from left to right of temperature (T, a), relative humidity (RH, b), equivalent potential temperature (θe, c), horizontal wind speed (ws, d), aerosol number concentration (Na, dashed curve, e), cloud droplet number concentration (Nc, plain curve, e), mean cloud droplet radius (rc, f), turbulent kinetic energy (TKE, g), longwave heating rate (LWHR, dashed curve, h), and shortwave heating rate (SWHR, plain curve, h) at 00:00, 02:00, and 04:00 UTC. The horizontal dashed-dot lines represent the mean CBH and the dotted horizontal lines the mean CTH.
Cloud droplet number concentration or CDNC (Nc) is determined by the supersaturation in an updraft and the number of aerosols that can activate at this supersaturation. In Fig. 7e, the simulated aerosol concentration is highest close to the ground and then decreases with altitude up to around 2 km, similar to the airborne measurements during DACCIWA (Taylor et al., 2019; Denjean et al., 2020a; Deroubaix et al., 2019; Flamant et al., 2018). The simulated cloud microphysical features reflect a polluted condition as Nc reaches above 1200 droplet cm−3 and a mean cloud droplet radius rc around 5 µm that is not enough to form drizzle (larger than 25 µm as defined in the model: the typical size reaching the ground can be between 0.2 and 0.5 mm; Pruppacher et al., 1998; Sandu et al., 2008). These modeled values are in the range of corresponding measurements at the same altitude by Taylor et al. (2019).
The emission of thermal radiation by the clouds during the stratus phase creates a cooling at the cloud top as demonstrated by the evolution of modeled longwave heating rate (LWHR) profiles in Fig. 7h. For LLSCs at this stage with many low LWP columns (e.g., with LWP < 25 g m−2; Petters et al., 2012), the more numerous the cloud droplets are, the stronger the cooling is, as shown in Fig. 7h, where the LWHR can reach −50 K d−1. This strong longwave emission can reduce the thermal production of turbulence above the cloud top, deepening the temperature inversion. A stabilized cloud top layer by radiative cooling and a NLLJ core contributing to the shear-driven turbulence below the cloud base lead to a well-mixed cloud layer, making the LCL correspond to the LLCS base as seen in Fig. 2 (Adler et al., 2019; Lohou et al., 2020).
3.2.2 Stratus phase
The stratus phase starts just after the sunrise. Maintaining stratus in almost the same state throughout this phase needs a stable ground temperature and moisture supply. As shown in Fig. 8, between 06:00 and 08:00 UTC the ground temperature varies little around 23 ∘C, supersaturation still exists between CBH and CTH, and air masses are quite well mixed within the boundary layer as θe is near constant at 347 K (Fig. 8c). The horizontal wind speed between the ground and the cloud base decreases from the magnitude in the previous transition phase (Fig. 8d), indicating a weakening NLLJ core (nearly 2 m s−1). The TKE value between the ground and cloud center decreases from its previous magnitude to 0.03 m2 s−2 but increases slightly to 0.04 m2 s−2 at the mean CTH. At 08:00 UTC, the TKE reaches 0.05 m2 s−2 in the cloud layer, owing to an increase in surface solar heating (Fig. 8g).
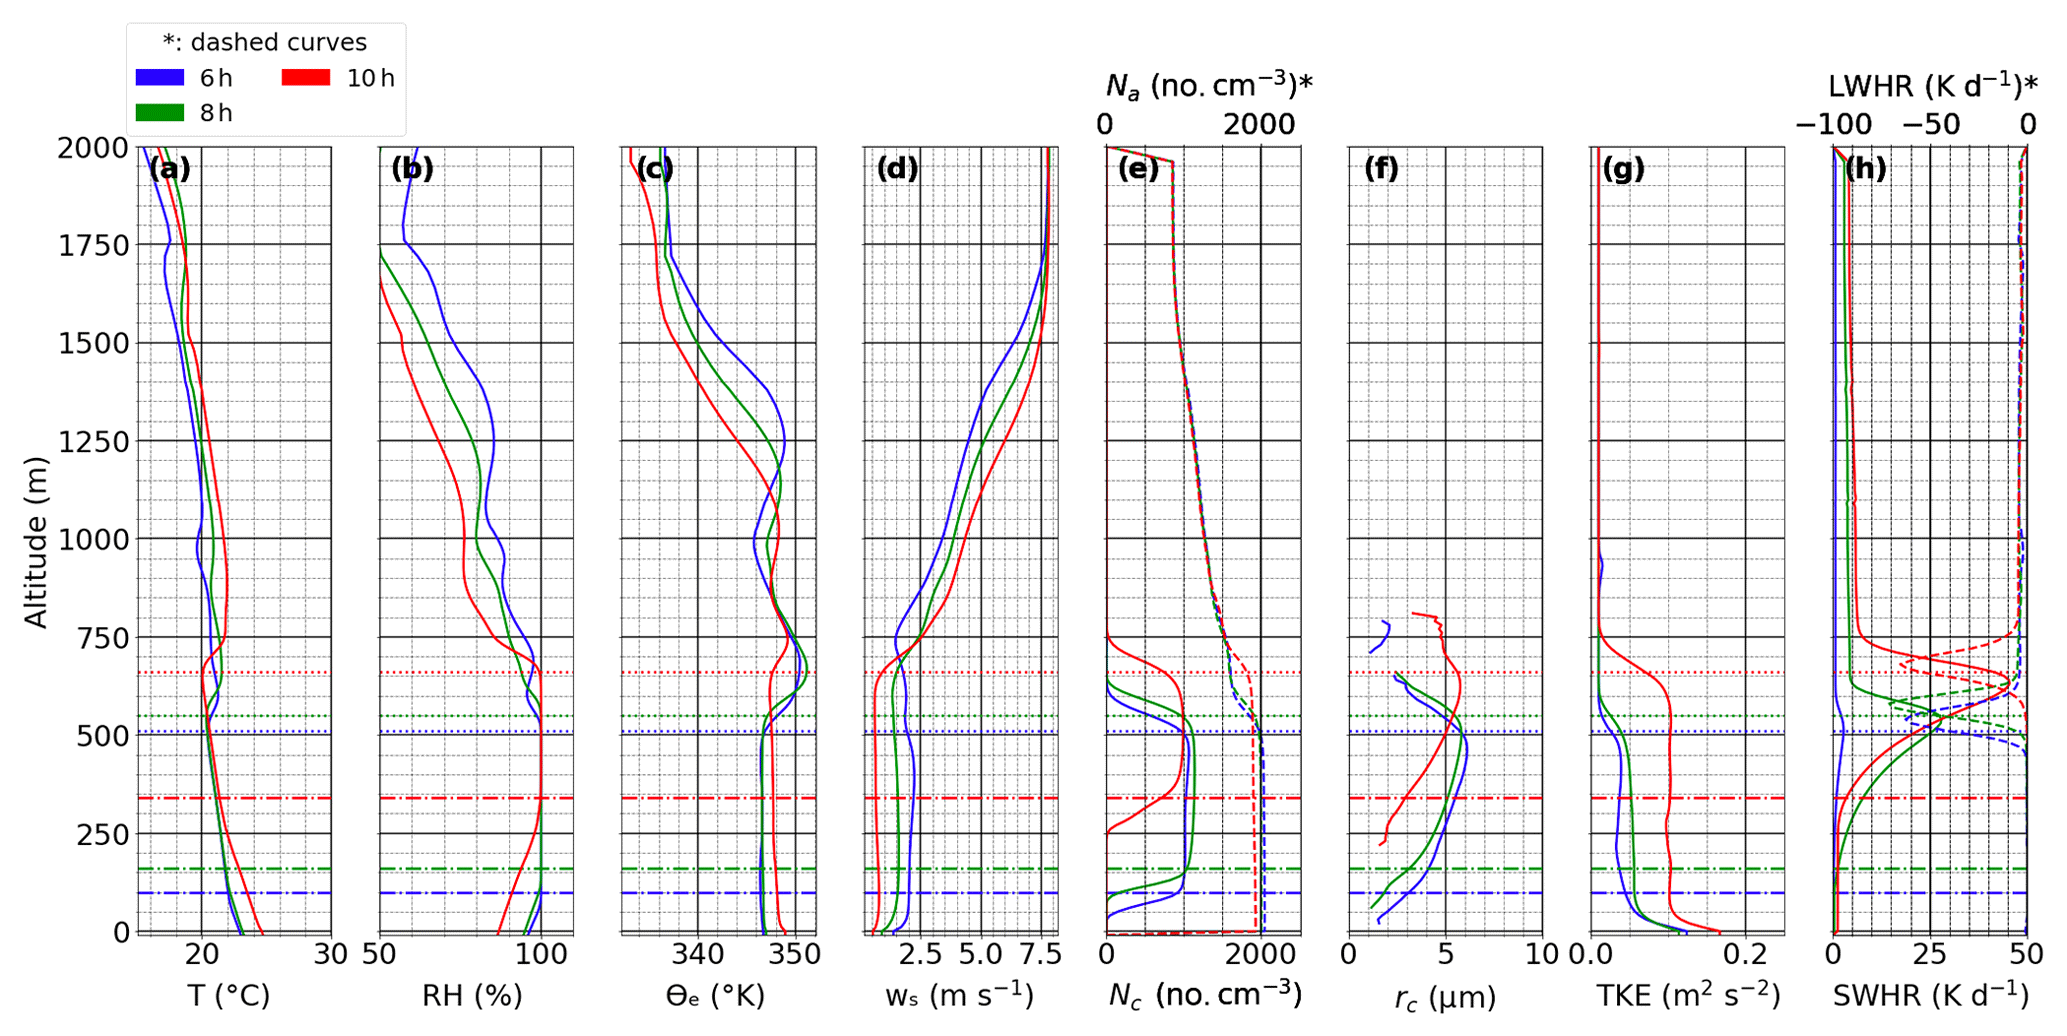
Figure 8Profiles from left to right of T (a), RH (b), θe (c), ws (d), Na (dashed curve, e), Nc (plain curve, e), rc (f), TKE (g), LWHR (dashed curve, h), and SWHR (plain curve, h) at 06:00, 08:00, and 10:00 UTC. Dashed-dot horizontal lines represent the CBH and dotted horizontal lines the mean CTH.
The aerosol concentration from 06:00 and 08:00 UTC is around 2000 cm−3 below 500 m altitude and then decreases along altitude, which is high enough to sustain a CDNC of 1100–1200 droplets per cubic centimeter between CBH and CTH as shown in Fig. 8e. The maximum layer-mean droplet radius is about 6 µm, which is still not enough to form significant drizzle. The cloud layer has an albedo close to 1 due to the high CDNC. The presence of light-absorbing aerosol amplifies the shortwave heating rate (SWHR) at the cloud top. At 08:00 UTC, the maximum SWHR and LWHR are about 25 K d−1 and −60 K d−1, respectively (Fig. 8h).
At 10:00 UTC, the cloud layer starts to rise significantly, with CBH and CTH reaching 340 and 660 m, respectively (Fig. 8). Moreover, stronger solar irradiance reaches the ground (220 W m−2), leading to the heating of the surface and the increase in the sensible and latent heat fluxes as seen in Fig. 6. It also increases the surface temperature to 24 ∘C and the cloud top temperature to 20 ∘C (Fig. 8a). The NLLJ core is no longer present at this moment. The TKE increases to 0.1 m2 s−2 throughout the vertical layer from 50 m above the ground to a level just below the cloud top (Fig. 8g). This enhancement of turbulence is expected to increase entrainment entering the cloud from above as well. The SWHR increases to 45 K d−1 and almost compensates for the LWHR cooling of 62 K d−1.
3.2.3 Convective phase
This phase extends from 12:00 to 17:00 UTC on 3 July 2016. During this period, surface SW radiation flux is maximized at 300 W m−2 (Fig. 6), leading to the highest surface heating of the day and an increase in the ground temperature from 25 to 27 ∘C (Fig. 9a). Convection of humid air masses causes the CBH and CTH to rise from 450 to 925 m and from 760 to 1100 m, respectively. Moreover, at 16:00 UTC, the equivalent potential temperature decreases above 450 m altitude, indicating an unstable air mass there. The horizontal wind speed is weak at the beginning of the phase, with 0.5 m s−1 at ground level, but increases along time to reach 1 m s−1 and from 1 to 3 m s−1 around 700 m altitude. This increase coincides with the dissipation of the LLSCs and indicates the arrival of the marine inflow.
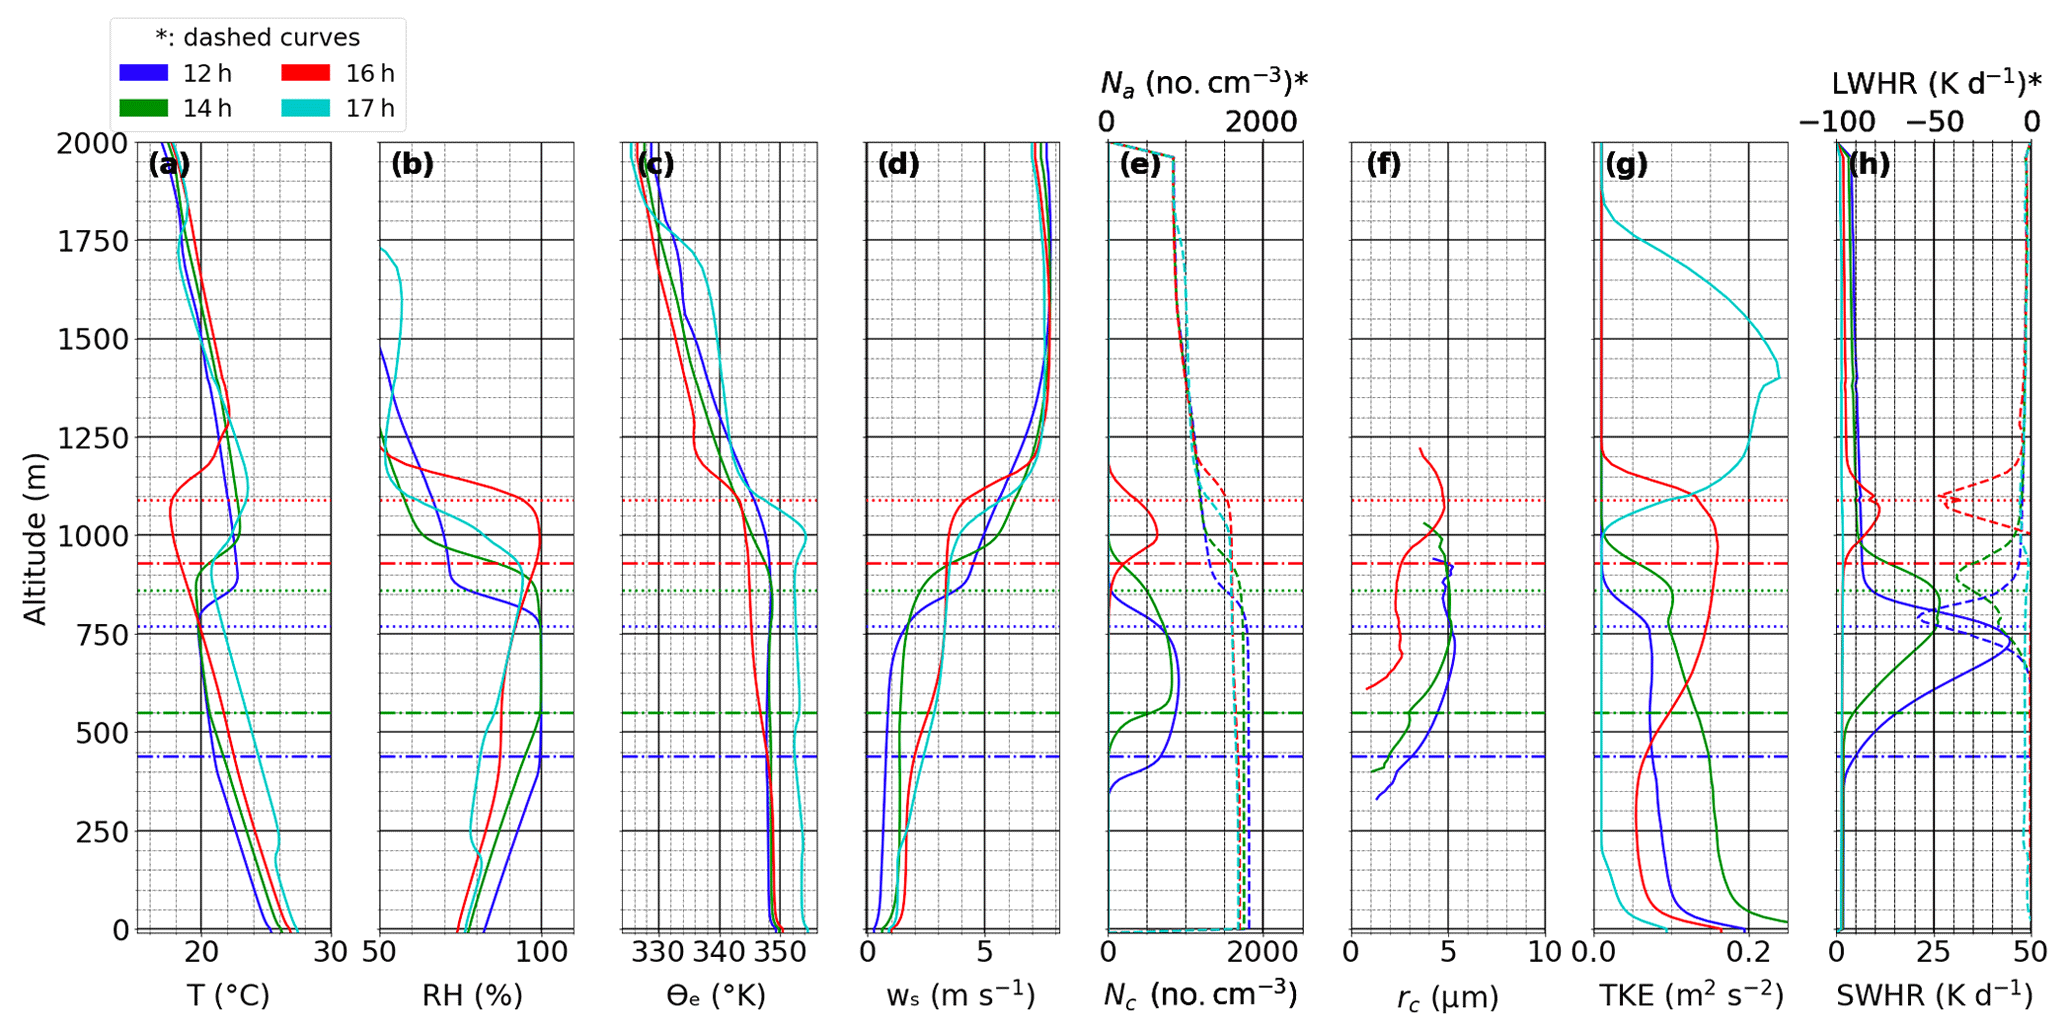
Figure 9Profiles from left to right of T (a), RH (b), θe (c), ws (d), Na (dashed curve, e), Nc (plain curve, e), rc (f), TKE (g), LWHR (dashed curve, h), and SWHR (plain curve, h) at 12:00, 14:00, 16:00, and 17:00 UTC. Dash-dotted horizontal lines represent the mean CBH and dotted horizontal lines the mean CTH.
The TKE value below the cloud base is higher than or similar to that inside the cloud from 12:00 to 14:00 UTC, showing a well-mixed PBL (Fig. 9g). From 16:00 UTC, the TKE decreases near the ground but increases at cloud level to a value of 0.15 m2 s−2, showing a strong turbulence layer within the vertically lifted but thinner cloud due to enhanced convection.
The aerosol distribution varies along with the dynamical situation, with a maximum concentration reaching 1700 cm−3 within the PBL. The domain-mean CDNC has a maximum value of 900 droplets per cubic centimeter at 12:00 UTC. This value then decreases along time as more clouds dissipate (Fig. 9e). After clouds become thinner and start to break, a reduced CF allows more solar radiation to reach the ground. The maximum value of SWHR changes from 45 K d−1 at 12:00 UTC (almost compensating for the longwave (LW) cooling at the cloud top) to about 10 K d−1 at 16:00 UTC. The cloud top LW cooling is near constant at the end of the convective phase, with −45 K d−1 (Fig. 9h).
Previous studies have indicated that the life cycle of stratus or stratocumulus within the planetary boundary layer depends on a subtle balance between several critical but interconnected forcings, including surface heat fluxes, cloud top and base radiative profiles, and thus turbulent mixing (e.g., Stevens et al., 2005; Van der Dussen et al., 2014; Ghonima et al., 2016). Our simulation results of the REF case support previous findings, particularly for the cases over land, where the surface-sensible heat plays a significant role. Nevertheless, the role of aerosols in such a life cycle has rarely been examined in depth. Given the critical role of aerosols in determining cloud macrophysical and microphysical features and thus radiation, this is an important issue to address to advance our understanding of the LLSC life cycle. A unique component of our study is the deployment of an interactive aerosol and atmospheric chemistry module in the observation-constrained LES modeling framework. The REF simulation has demonstrated that this model is capable of reproducing many observed dynamical, thermodynamic, and aerosol features of the 3 July LLSC case despite certain biases. Thus, we have designed additional sensitivity simulations and use the results of the REF run as a basis for further isolating the aerosol impacts on the LLSC life cycle through (1) the difference in cloud droplet number concentrations resulting from aerosol profiles that differ in both number concentration and chemical composition and (2) the semi-direct effects from absorption of black carbon aerosols. In the following sections, we discuss the modeling configurations alongside outcomes of these two sets of simulations.
4.1 Impact of different aerosol profiles on microphysical and macrophysical properties of LLSCs
We first configured two sensitivity simulations with observation-based aerosol profiles differing from the one used in the REF run (Appendix Fig. A1 and Table 2). The first simulation uses an aerosol profile that reflects an influence of heavy anthropogenic pollution, obtained based on the aerosol chemical composition and size distribution observed by Brito et al. (2018) and Denjean et al. (2020a) within urban plumes originating from the cities of Lomé, Accra, and Abidjan, hereafter referred to as POL. The second is a simulation that uses a clean aerosol profile derived by dividing the REF aerosol concentration by 10 (called CLEAN). These two sensitivity simulations are otherwise configured the same as the REF simulation. Compared to the REF case, the aerosol profile of POL has a slightly higher peak number concentration but in a different mode. In addition, the sulfate mass ratio in the POL aerosol profile is much higher than that in the REF profile, while organic carbon mass ratios are quite close in both profiles. The REF, POL, and CLEAN runs simulate the 3 July case with different aerosol number concentrations and chemical compositions, as reflected in their size distributions. Therefore, these simulations are expected to produce different CDNCs alongside dynamical consequences. Comparison between their results could provide us with information about the aerosol impacts on the LLSC life cycle through abundance.
Indeed, POL and REF have produced clearly different cloud microphysical features, including droplet number concentrations alongside mean radius throughout the lifetimes of modeled clouds (Fig. 10a and b). At the time of cloud formation (02:00 UTC), despite having a similar liquid water content (LWC) of around 0.35 g m−3 at 250 m in both cases, reaches 333 droplets per cubic centimeter and 6.45 µm instead of 653 droplets per cubic centimeter and 5.1 µm for the REF case, indicating a result of differences mainly in Mode-2 aerosol numbers between the two scenarios (at 02:00 UTC, the updraft near the cloud base is rather weak, at less than 0.30 m s−1 in both cases). This trend is about to reverse at 06:00 UTC, when the CDNC and radius are equal to 1208 droplets per cubic centimeter and 6.43 µm in POL and 1305 droplets per cubic centimeter and 6.12 µm in REF, respectively. After 08:00 UTC and until the cloud break-up, is much higher than , with a maximum difference of 1425 droplets per cubic centimeter at 14:00 UTC. Their respective radii are 4.42 and 5.18 µm, while the liquid water content profiles are similar near 0.47 g m−3 at 750 m. The difference between POL and REF in CDNC after sunrise suggests that the activation favors the POL profile with a higher sulfate content when updraft is strengthened. The above results of CDNC are in good agreement with the Aerosol-Cloud and Precipitation Interactions Model (ACPIM) parcel model simulation done by Taylor et al. (2019), where CDNC varies in a range of 500–1400 droplets per cubic centimeter depending on the inland or offshore (offshore + local emissions) aerosol origin.
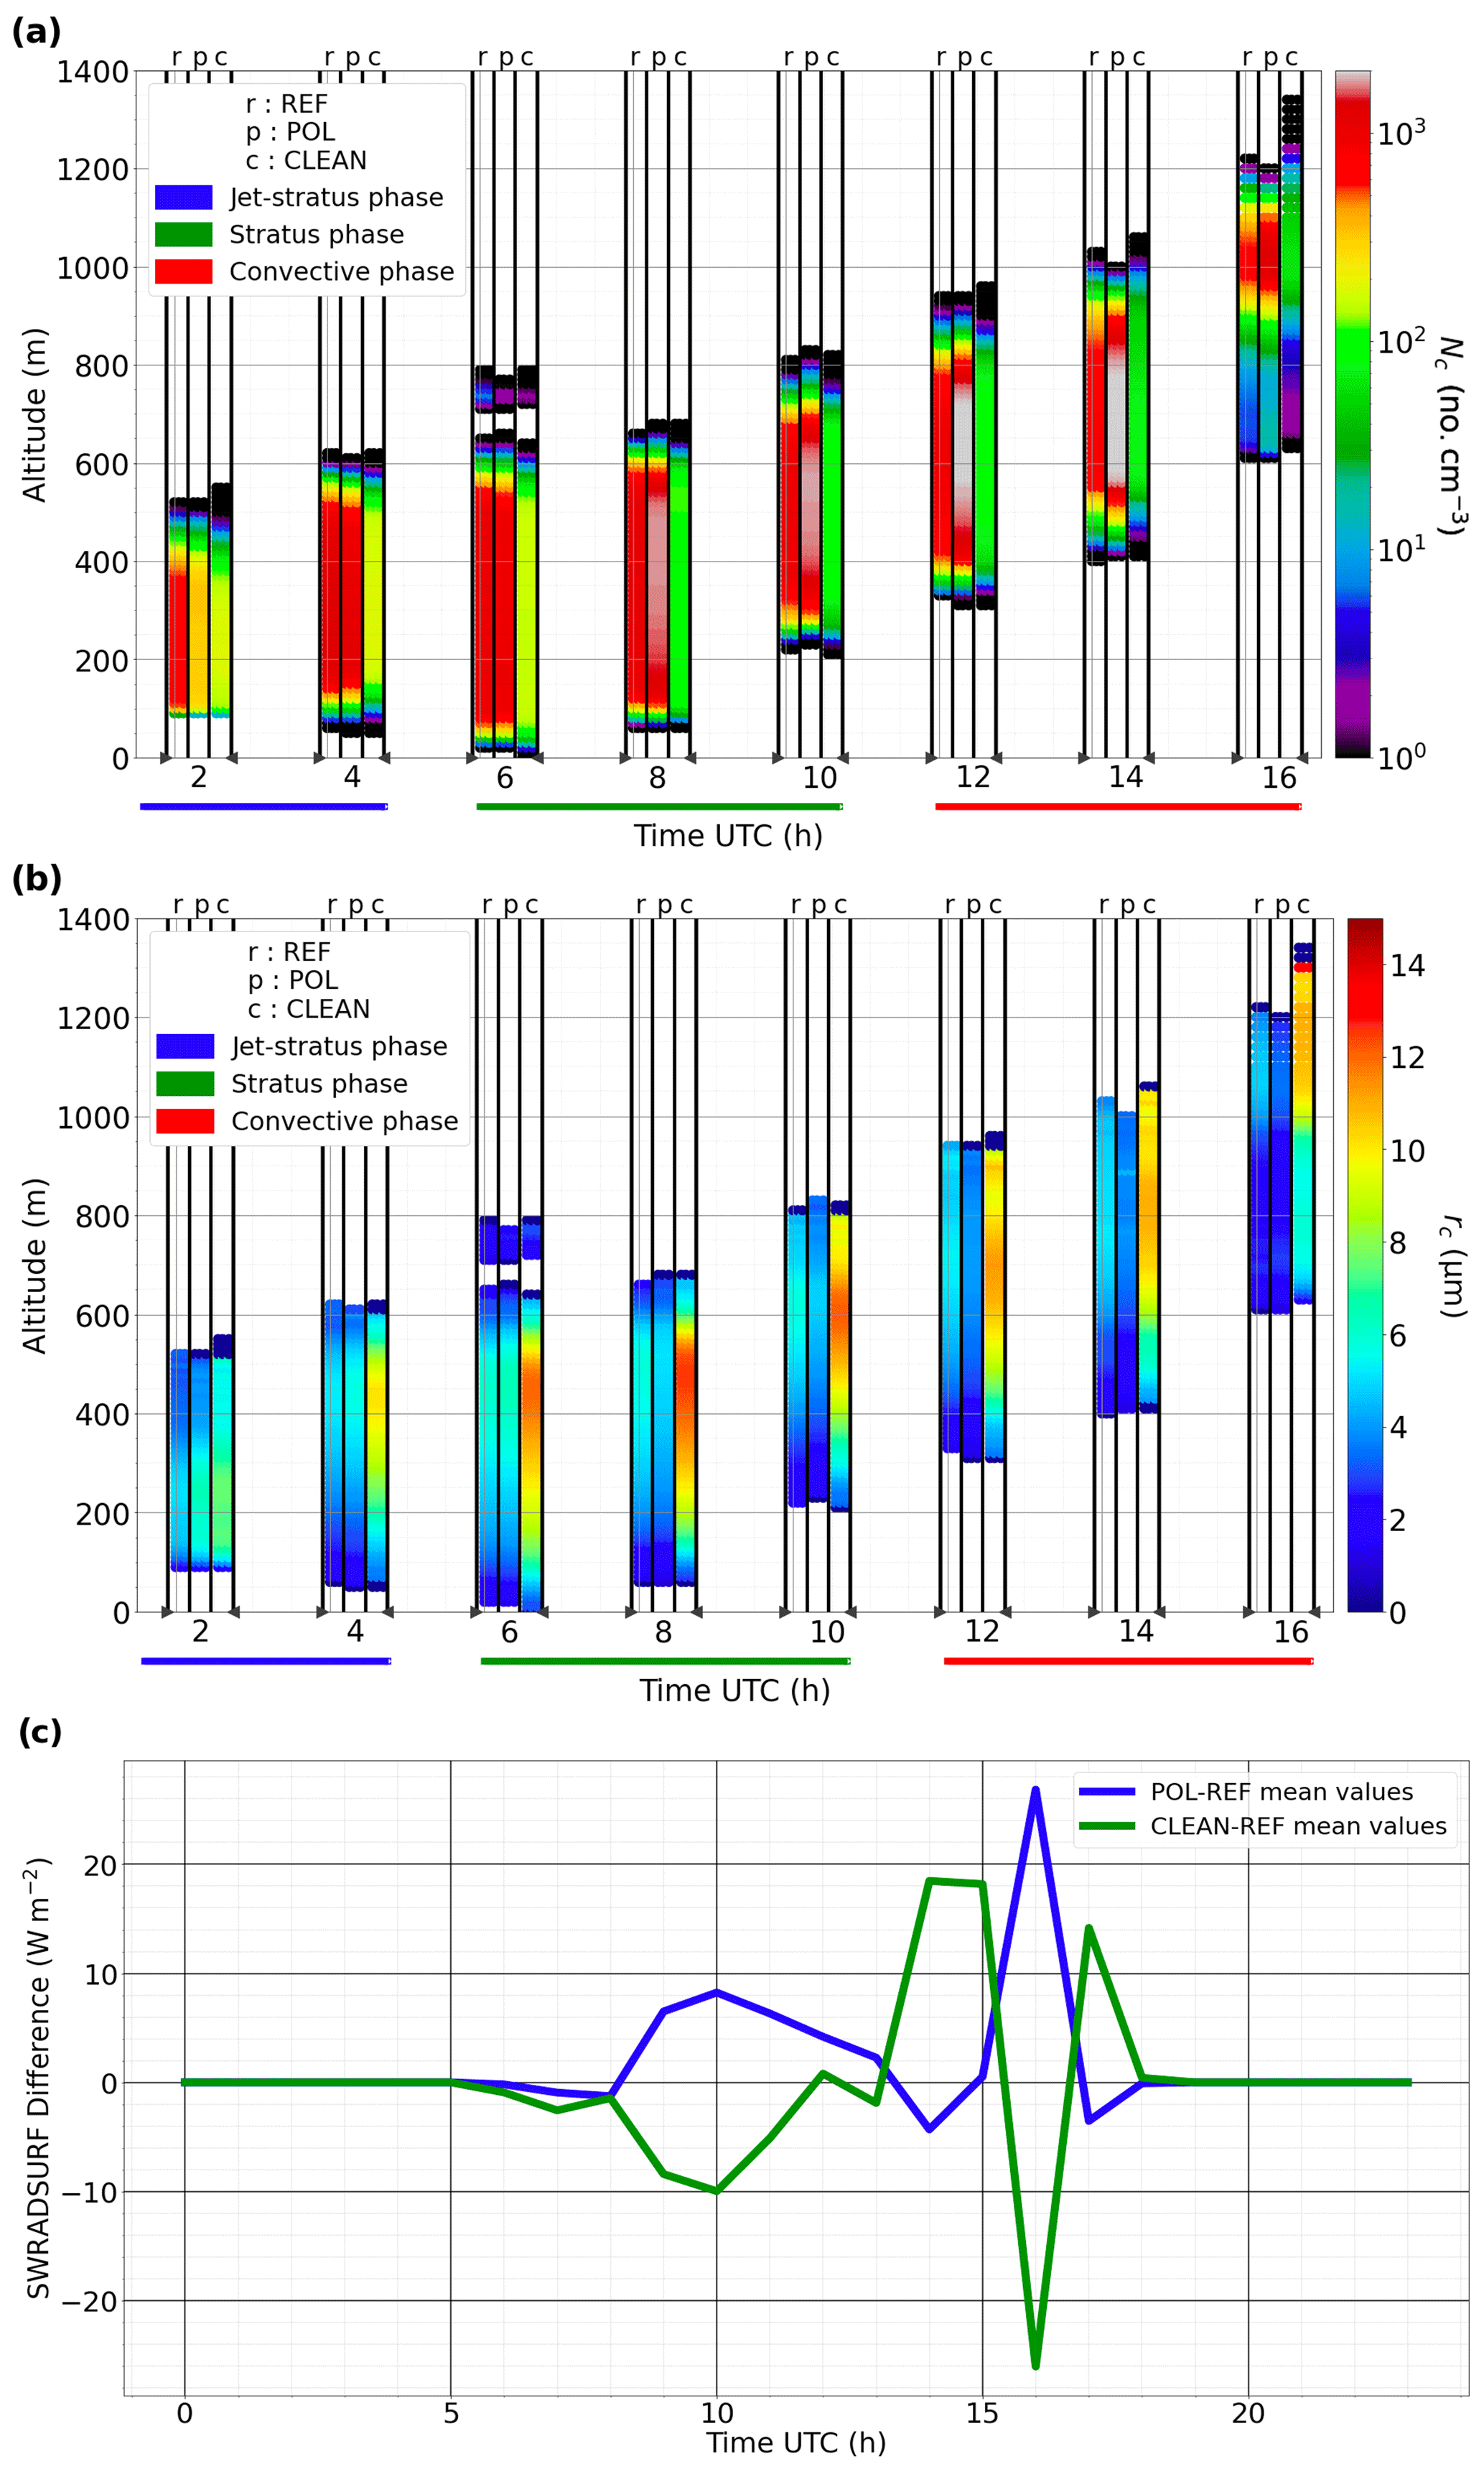
Figure 10Evolution of cloud droplet concentration Nc (a) and cloud droplet radius rc (b) with the scenarios given and designated by a REF, b POL, and c CLEAN. Panel (c) gives the evolution of mean domain SWRADSURF differences between POL, CLEAN, or REF.
Table 2Aerosol size distribution parameters for the POL and CLEAN runs, including the number concentration, standard deviation, and diameter for two aerosol modes.
The differences between CLEAN and REF in cloud microphysical features are also significant. As expected, from formation to break-up of the clouds, is lower than and is higher than . At 02:00 UTC, has a maximum value of 181 droplets per cubic centimeter and a of 7.58 µm, in comparison to 653 droplets per cubic centimeter and 5.1 µm for and , respectively, with the same liquid water content value (0.35 g m−3). further increases to 12.55 µm at 08:00 UTC and then decreases slowly to a maximum value of 10.97 µm at 14:00 UTC, with LWCCLEAN reaching near 0.45 g m−3 instead of 0.49 g m−3 for LWCREF, likely due to an increased activation ratio of aerosols after sunrise. Despite a relatively larger droplet size in the CLEAN case than the POL and REF cases, there is no clear sign of significant drizzle, even during the convection stage (Fig. 10). Note that sedimentation and thus evaporation of larger droplets (smaller than drizzle though) from the entrainment zone and cloud base could likely create a thermodynamic perturbation as well (e.g., Stevens et al., 1998; Jiang et al., 2002). Consistent with certain previous findings (e.g., Bretherton et al., 2007), in LES using a passive aerosol profile for the 4–5 July DACCIWA case, Dearden et al. (2018) found that the sedimentation would remove larger cloud droplets from the entrainment zone and thus, through feedback, lead to a cloud deck with a higher LWP but smaller CF than the case where such a sedimentation is completely excluded. Since the sedimentation of non-drizzle droplets is not included in our model, our results cannot be used to directly address this issue.
As demonstrated from the above discussions, modeled cloud microphysical features generally respond to the variation in aerosol number concentration, as expected; i.e., a higher aerosol concentration leads to a higher cloud droplet number concentration (POL > REF > CLEAN) but a smaller mean droplet radius (POL < REF < CLEAN) and hence a higher cloud reflectivity (POL > REF > CLEAN). However, exceptions do exist. For example, differences in the aerosol size distribution and chemical composition between REF and POL could lead to an outcome opposite to the general expectation, particularly under a weak updraft. As shown in Fig. 10c, the response of the incoming solar radiation at the ground (SWRADSURF) does not always follow such an expectation in cloud microphysics and thus reflectivity in responding to aerosol variation. In fact, SWRADSURF appears to be higher in POL than REF from sunrise to 13:00 UTC, and the values in both runs are also clearly higher than that in CLEAN. This tendency is only reversed after 13:00 UTC, when solar flux reaches its peak until the break-up stage.
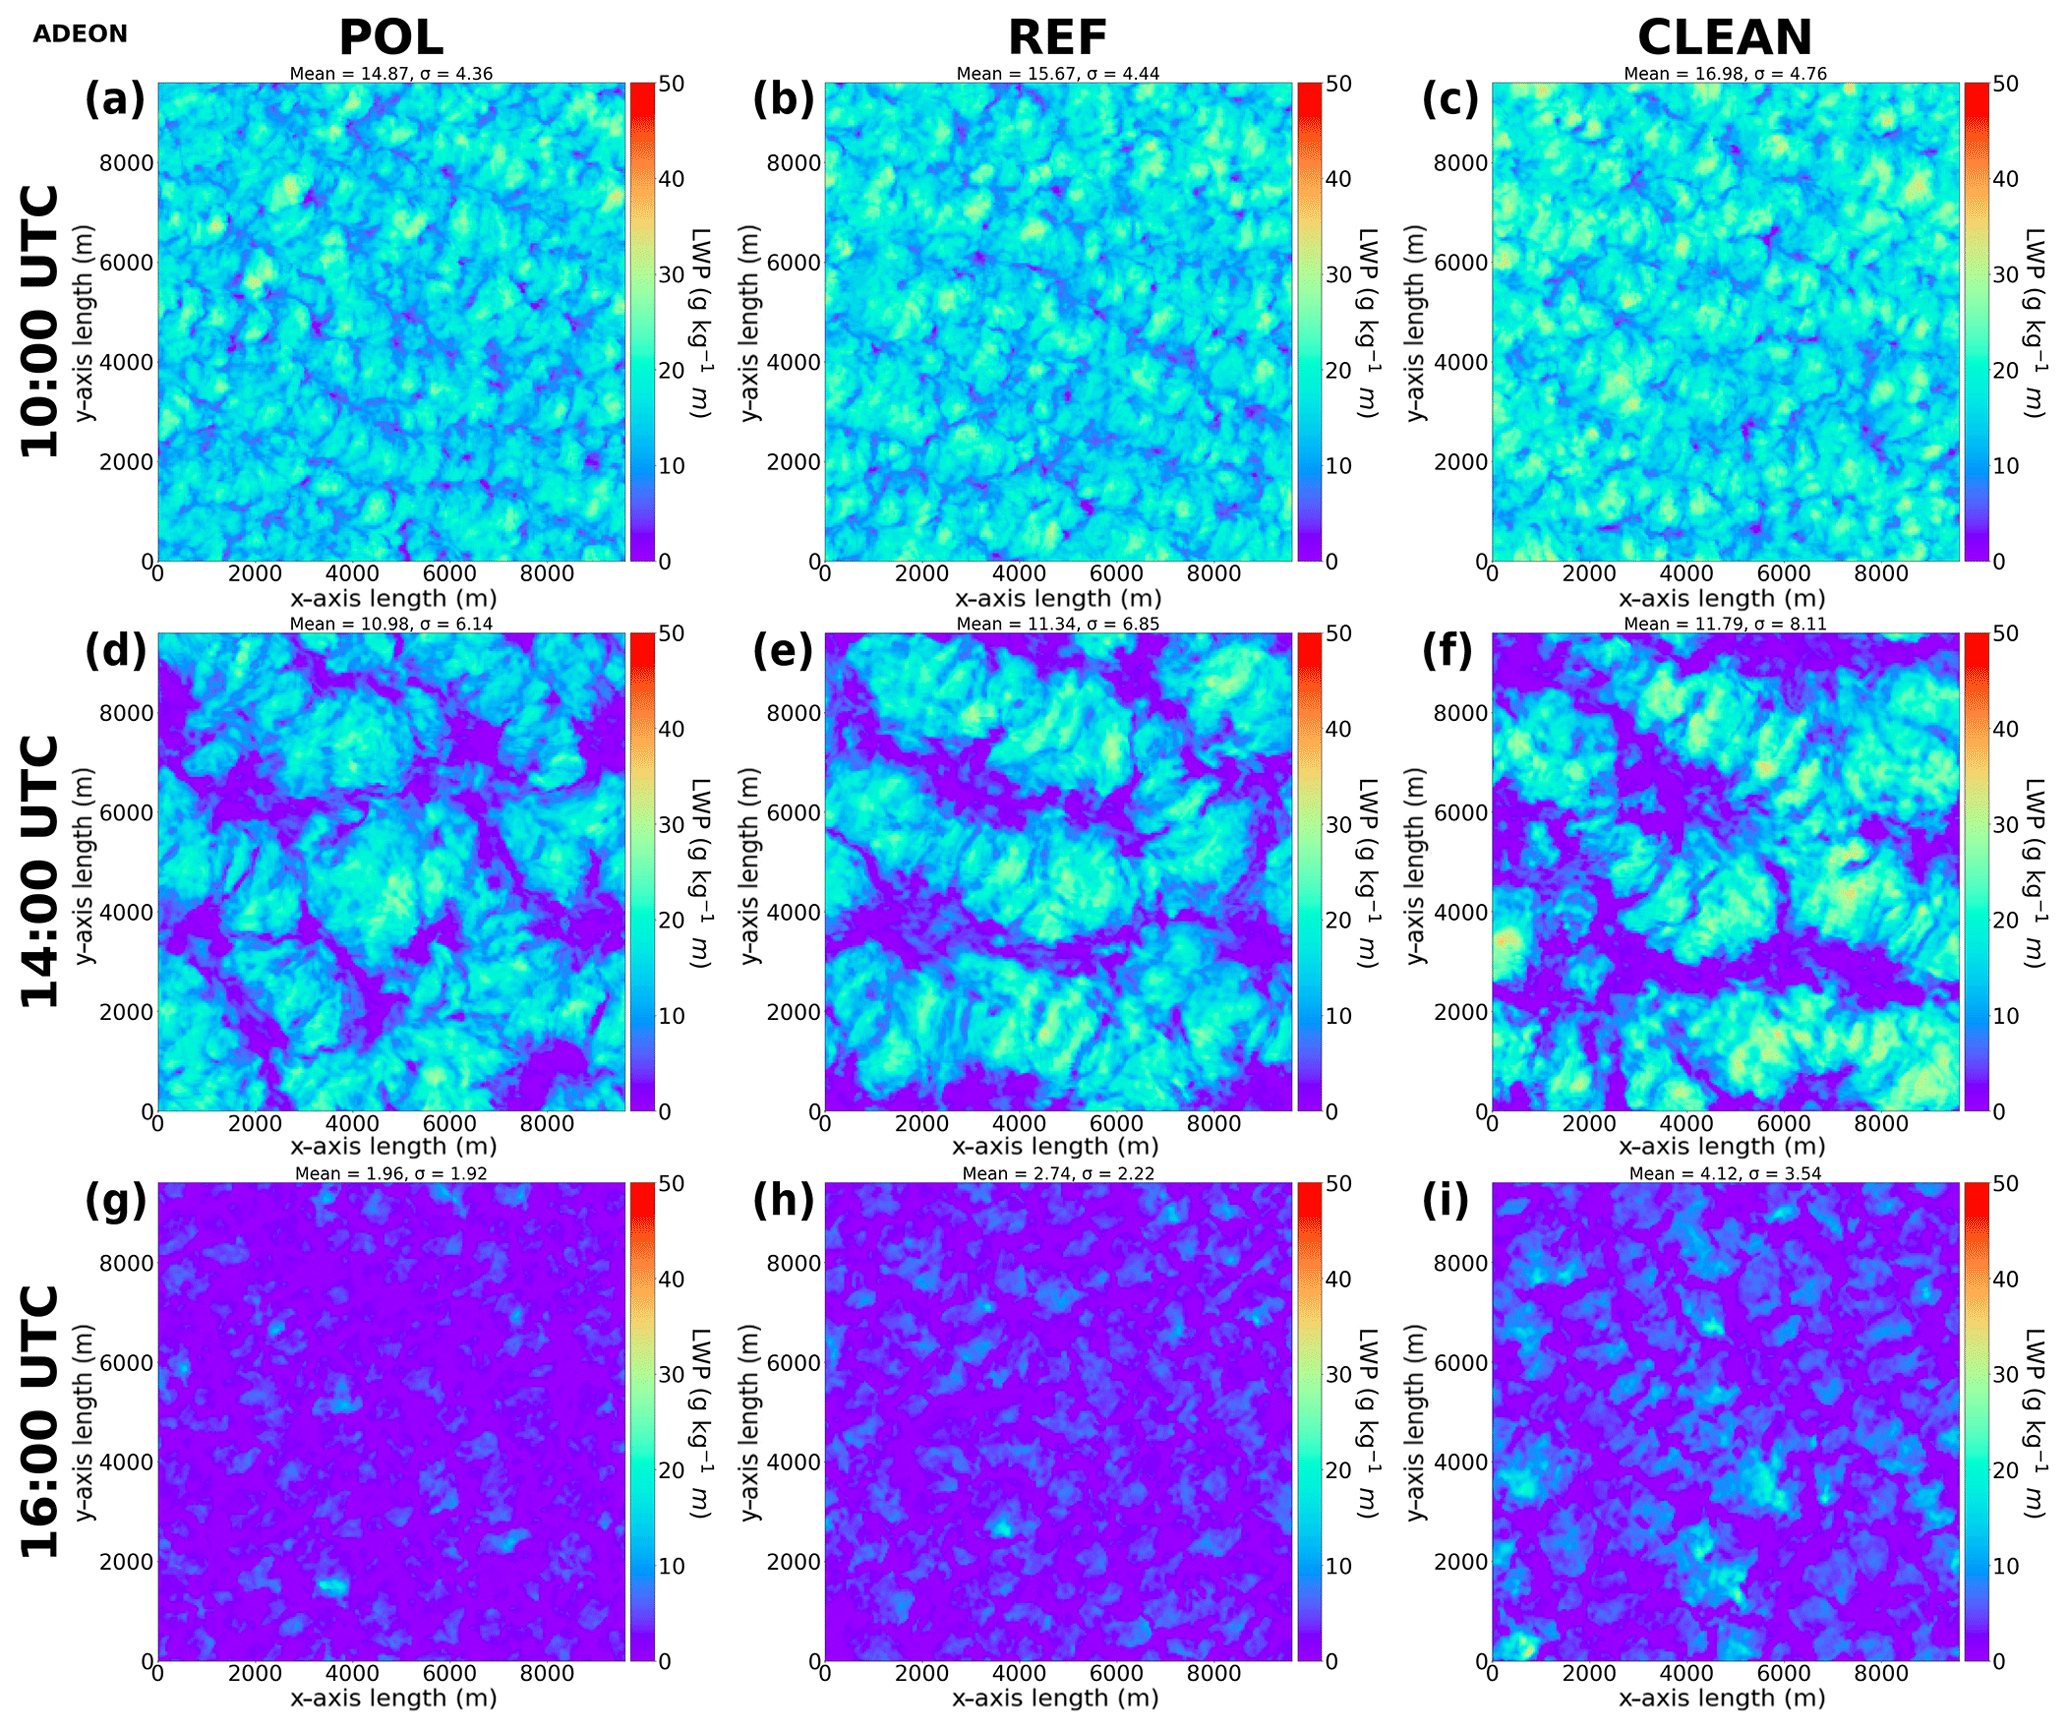
Figure 11LWP (g kg−1 m) in the POL (a, d, g), REF (b, e, h), and CLEAN (c, f, i) runs at 10:00 UTC (a–c), 14:00 UTC (d–f), and 16:00 UTC (g–i).
Figure 11 shows that the major reason behind the above-described trend of SWRADSURF is the difference in the cloud fraction in competing with the effect brought by different cloud reflectivities in various runs, especially before noon, when the zenith angle is still high. After sunrise, the cloud top starts to rise and the cloud layer becomes thicker. In the meantime, this upward development brings a downward entrainment of dry air from the temperature inversion zone above the cloud top and causes evaporation in the cloud. For a cloud with a large quantity of very small droplets as in POL and REF, the evaporation rate of droplets would exceed that in the CLEAN case, and thus more cloud-void spaces or a thinner cloud layer would form more easily than in the latter case. Note that a similar macrophysical response to aerosol concentration variation (in a simple high-versus-low setting) was also suggested in a marine cloud case, though with a coarse vertical resolution of 50 m (Wang et al., 2003). As shown in Fig. 11 and Table 3, the cloud layer in CLEAN is slightly denser than those in POL and REF, while cloud-void or thin-cloud pixels account for a substantially lower ratio within the domain. Thus, before noontime, cloud reflectivity seems to become the secondary factor compared to the cloud fraction in determining the value of SWRADSURF. As a result, SWRADSURF in CLEAN is significantly lower than REF and POL until the zenith angle becomes lower closer to noontime. The lower SWRADSURF in CLEAN would also have reduced the turbulent mixing and delayed the convection that would cause extensive cloud break-up. At 14:00 UTC, differences in cloud thickness and cloud-void space still exist but become relatively smaller among the three different runs (Fig. 11 and Table 3). Cloud reflectivity now becomes the primary reason for the different SWRADSURF as shown in Fig. 10c. Modeled clouds in POL and REF appear to dissipate earlier and much more quickly than in CLEAN in the late afternoon, largely due to their smaller droplet sizes (Fig. 11g–i).
Table 3Domain-averaged liquid water path (LWP, g kg−1 m) and poor-cloud pixel percentage (PCP, defined by the percentage of pixels where LWP < 10 g kg−1 m; percentage) in three different runs.
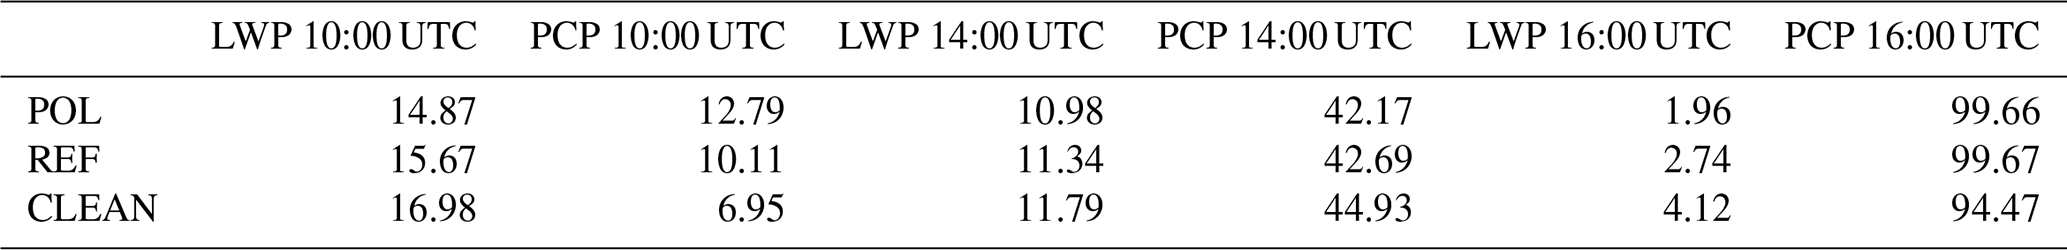
Looking into various temporally varying metrics of LWP in the different model runs, we find that, in general, LWP is inversely proportional to CDNC, as LWP in POL < LWP in REF < LWP in CLEAN, and this is applied to different metrics of LWP (Fig. 12, ADEON curves; Table 3) as well. However, in comparison, the peak LWP varies less significantly in the CLEAN case, while peak LWPs in the two other runs decrease with domain-averaged quantities at the convection stage. In our analysis, the difference in turbulent mixing driven by the surface radiative heating, as influenced by different microphysical features in various cases, seems to have played a critical role in the resulting inverse relation between LWP and CDNC. The situation of the CF is somewhat more complicated. As shown in Table 3 and Fig. A3, the CF relation to CDNC varies at different stages. An inverse relation between the CF and CDNC generally occurs in the earlier and later periods of the convection stage. This is primarily due to the faster evaporation of clouds with higher CDNC driven by entrainment in the former period (note the controlling role of the CF in determining the surface incoming solar radiation and thus turbulence at this stage) or by strong convection in the latter. In the middle of the convection stage (13:00–15:00 UTC), the above relation, however, would reverse or become insignificant owing to a weaker turbulent mixing in polluted cases since the cloud reflectivity becomes the dominant factor in controlling the surface incoming solar radiation, as discussed previously. Therefore, an analysis throughout the entire LLSC life cycle is very important for understanding the response of the CF and LWP to aerosol variation. Note that the atmospheric heating caused by absorbing black carbon aerosol is already included in this series of sensitivity simulations, though its impacts on the above result will be discussed later based on another set of sensitivity runs.
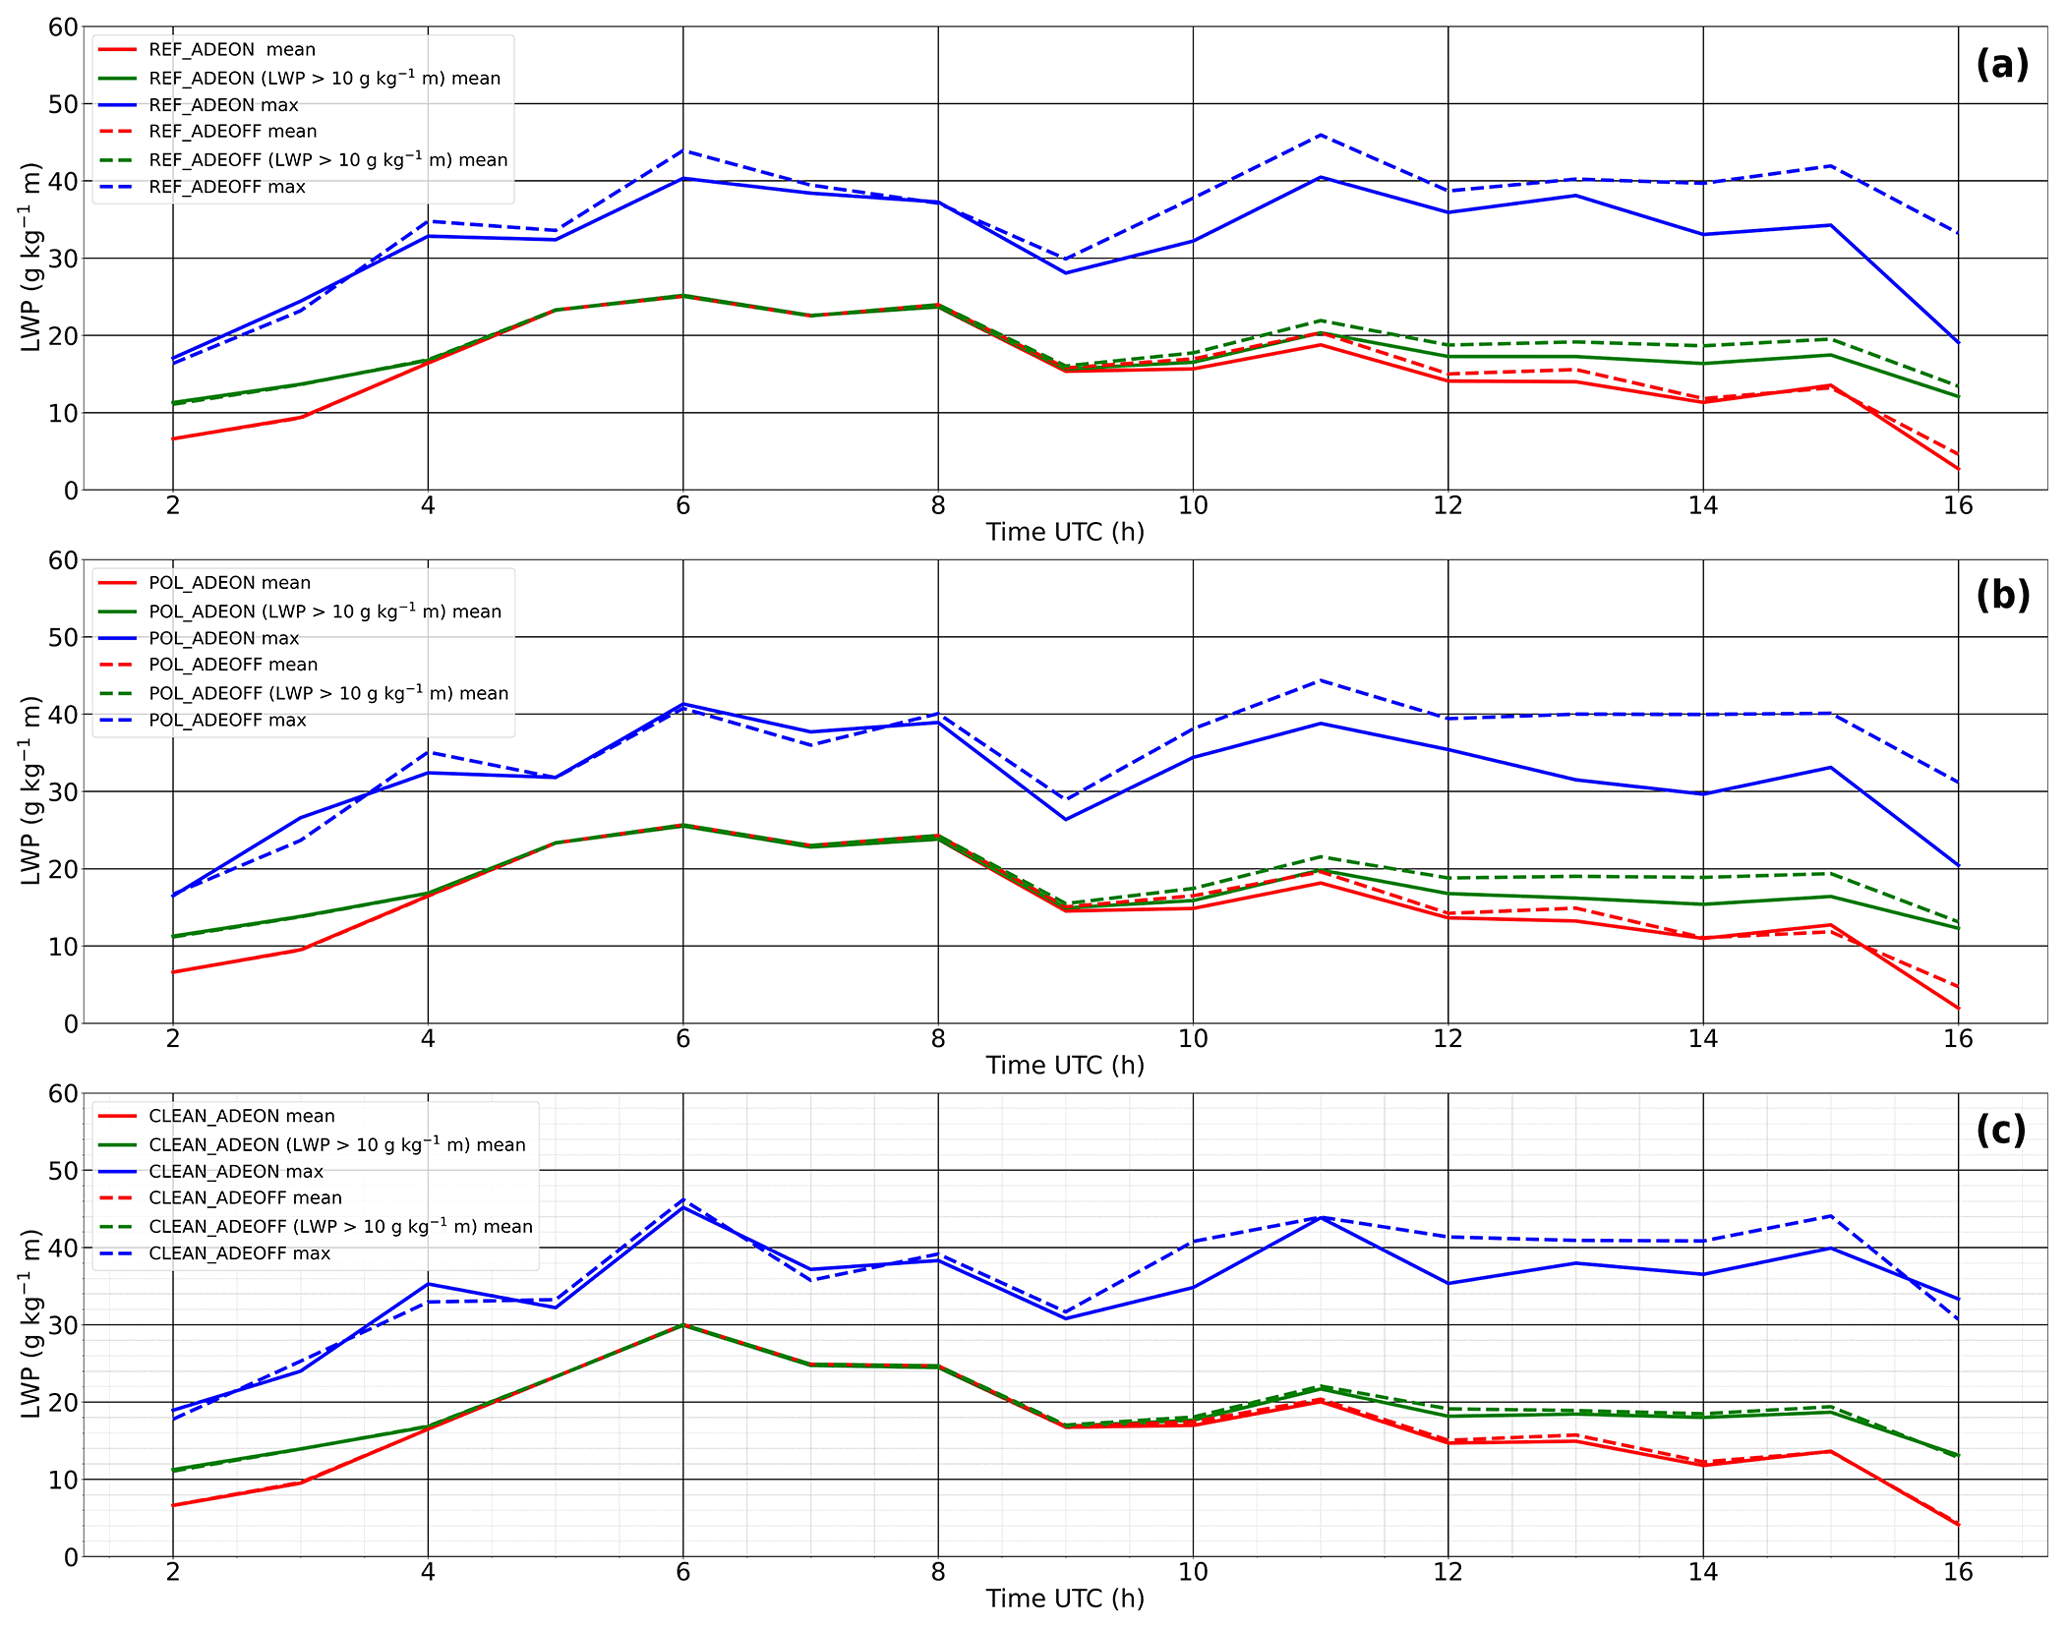
Figure 12Domain-averaged LWP (LWP mean), maximum LWP (LWP max), and domain-averaged LWP over pixels where LWP > 10 g kg−1 m in the ADEON and ADEOFF runs in the REF (a), POL (b), and CLEAN (c) cases, derived using hourly model outputs.
To summarize, as expected, aerosol concentration is a major factor in controlling the cloud microphysical features by determining the simulated droplet number concentration and radius with similar liquid water content. However, our results suggest that cloud reflectivity as a function of CDNC is not necessarily a dominant factor in solely determining the surface incoming solar radiation. Instead, the response of cloud macrophysical features such as cloud fraction as well as LWP to the variation caused by dry entrainment from the inversion layer above the cloud is also a competing factor in determining the incoming solar radiation at the ground. Our sensitivity simulations utilize different aerosol profiles that reflect the variations in both aerosol concentration and chemical composition based on observations, and the results indicate a critical role of the cloud microphysical response to aerosol in deciding the LWP and CF responses. The overall negative response of LWP to aerosol concentration derived here agrees with several previous studies (e.g., Wang et al., 2003; Jiang and Feingold, 2006), while the case for the CF response is more complicated, varying at different stages in the cloud life cycle. It is worth indicating however another factor that might contribute to the cloud life cycle: the atmospheric heating caused by the semi-direct effect of absorbing aerosol components such as black carbon has not been analyzed up to this moment and will be discussed in the following section.
4.2 Impacts of aerosol semi-direct effects on LLSCs
The semi-direct effect of aerosols, resulting from SW radiation absorption by absorbing aerosol, could affect the atmospheric dynamics surrounding LLSCs and thus their life cycle. To examine this effect, we have designed three additional sensitivity simulations, configured accordingly in the same way as their original experiments POL, REF, and CLEAN (hereafter ADEON of REF, POL, and CLEAN, respectively) but excluding aerosol direct effects (named ADEOFF). Therefore, comparison between the ADEOFF runs and their paired original ADEON runs provides information regarding the isolated impacts of the semi-direct effect on the LLSC life cycle for cases with different aerosol profiles. Apparently, BC is the major species behind the semi-direct effect in our case. The changes in cloud top and base, SWHR, and TKE due to aerosol absorption and the associated feedbacks are shown in Fig. 13. The results demonstrate that light-absorbing BC aerosols can cause a substantial atmospheric heating accompanied by a warming tendency near the tops of LLSCs (Fig. 13b). At 14:00 UTC, the domain-averaged heating due to BC aerosols (difference in SWHR between ADEON and ADEOFF) and a consequent cooling just above the cloud due mostly to the cloud top change are 12.16 and −13.14 K d−1 in POL and 7.71 and −9.24 K d−1 in REF, respectively. In comparison, the atmospheric heating and associated cooling of 1.30 and −2.25 K d−1 in the CLEAN case are clearly insignificant. Accordingly, in the ADEON runs, turbulent mixing in the PBL has been reduced (Fig. 13c, with a maximum decrease of −0.18 m2 s−2 for POL), leading to a decrease in the cloud top height, limiting entrainment and reducing incoming solar radiation at the surface due to BC in-cloud absorption. The cloud top height reduction due to the semi-direct effect in two polluted cases (POL and REF) is quite substantial, as shown in Fig. 13a, where the CTHs in POL and REF have decreased by up to 100 and 70 m, respectively, due to the presence of BC. On the other hand, CBH has also increased by about 20 m in both cases before break-up, suggesting a thinner cloud layer owing to the semi-direct effect. In comparison, CTH, CBH, and thus cloud vertical extent are less affected in the CLEAN run due to its low BC content. Before break-up, the in-cloud TKE just below the top of the heating layer has been reduced to some extent (Fig. 13c). On the other hand, due to a lower cloud top in the polluted cases, planetary boundary layer height would also be lowered. The effect of BC absorption in lowering the modeled cloud top and thinning cloud layer in POL and REF (implying a reduced upward development) is likely another factor in slowing down their break-up, as discussed before.
Figure 13Evolution of the differences in the mean CBH and CTH (a), SWHR (b), and TKE (c) between the simulation runs with and without the aerosol direct effect (ADEON − ADEOFF) for REF, POL, and CLEAN.
The impact of the semi-direct effect on other critical macrophysical features such as cloud fraction and LWP can also be seen from the model results. For instance, LWP, particularly the maximum LWP, is clearly lower in the ADEON runs of the two polluted cases (REF and POL) (Fig. 12). In addition, an increase in the cloud fraction due to the semi-direct effect can be seen throughout the convection stage until 15:00 UTC, when intense cloud break-up occurs (Fig. A3). All these imply a critical role of the semi-direct effect on cloud radiation.
We find that the semi-direct effect can both enhance and weaken the (negative) indirect radiative forcing, as also indicated by some previous works (Lohmann and Feichter, 2001; Koch and Del Genio, 2010; Huang et al., 2014; Yamaguchi et al., 2015; Stjern et al., 2017; Kreidenweis et al., 2019; Zhang and Zuidema, 2019). In the convection stage before 15:00 UTC, the difference in SWRADSURF between ADEON and ADEOFF is negative, reaching −33 and −75 W m−2, respectively, for REF and POL at 14:00 UTC (Fig. 14). This can be explained by an increase in the cloud fraction in the ADEON runs (Fig. A3, Table 3) that allows less solar irradiance to reach the surface despite the cloud layer being thinner, not to mention that solar irradiance itself has already been reduced due to BC absorption (Figs. 12, 14, and A2). Note that the different chemical compositions between POL and REF also lead to a quantitatively different effect. Hence, the semi-direct effect contributes positively to the enhancement of (negative) indirect radiative forcing in this case. On the other hand, at 16:00 UTC, the flux difference between ADEON and ADEOFF becomes positive with values for REF and POL of 32 and 66 W m−2, respectively. As the clouds break up more slowly in ADEOFF during this stage due to thicker cloud layers (Figs. A2 and A3), more clouds inside the domain with increased thicknesses cause weaker SW irradiance that reaches the ground. In other words, the semi-direct effect makes the cloud dissipate more quickly in the later convective stage. In this case, the semi-direct effect weakens the indirect radiative forcing.

Figure 14The domain-mean difference of SWRADSURF between the ADEON and ADEOFF configurations for the three scenarios.
The above results have demonstrated the important role of solar absorption by aerosols in determining the life cycles of LLSCs. Note that our modeling configurations are based on the aerosol profiles that are relatively well mixed throughout the PBL, with the concentration gradually decreasing along altitude above the PBL. Certain previous sensitivity experiments suggested that the location of the BC layer within or above the PBL could have different impacts on the development of convection, entrainment, and thus life cycles of the low clouds within the PBL. For instance, Johnson et al. (2004) suggested that, without considering the indirect effect of aerosols, BC existing within the boundary layer would lower LWP by nearly 20 % in a marine low-stratocumulus case where the cloud response is less sensitive to the change in surface shortwave heating compared to the situation in our case. Feingold et al. (2005) found that smoke plumes containing BC near the surface would reduce the cloudiness through both the atmospheric heating and the weakening effect on surface heat fluxes by BC. These results obtained with somewhat different model configurations than ours (e.g., coarser vertical resolution, different surface) are however in qualitative agreement with our findings. Nevertheless, the unique configuration of our model allows us to quantitatively examine the semi-direct effect with varying aerosol chemical compositions and thus the extent of aerosol absorption. This has led us to reveal further insights into the complicated interplays among various aerosol effects besides their individual impacts on the life cycles of LLSCs.
An observed LLSC case over southern West Africa has been simulated with the Meso-NH model in a large-eddy-simulation configuration constrained by measurements from the DACCIWA field campaign. The model has successfully reproduced the observed nocturnal–diurnal life cycle alongside key macrophysical and microphysical features as well as surface radiative and heat fluxes. To determine the impact of aerosols on the modeled life cycle of LLSCs, sensitivity simulations using several different aerosol profiles as well as the ones adopting these profiles but excluding the aerosol direct radiation effect have also been conducted. These aerosol profiles contain different size distributions and chemical compositions, reflecting the situations associated with various aerosol populations encountered during the field campaign.
The results from sensitivity simulations suggest that both aerosol size distribution and chemical composition can effectively influence the LLSC life cycle. The impact of the aerosol size distribution, as reflected by a comparison among simulations using aerosol profiles with different number concentrations and modal distributions, is initiated from resultant cloud microphysical features, in particular the cloud droplet number concentration and mean droplet size. Such a difference created by different aerosol size distributions also affects cloud reflectivity, as expected. We have found that the difference in cloud reflectivity caused by different aerosol concentrations does not always dominate the surface incoming solar radiation and thus cloud development after sunrise. This is due to a competing factor: the difference in the cloud fraction resulted from different evaporation speeds of cloud droplets (a function of CDNC) due to the dry air entrained from the inversion layer above the cloud top, which specifically dominates the variation of surface incoming solar radiation before noontime. Clouds influenced by higher aerosol concentrations and thus having higher number concentrations and smaller sizes of cloud droplets evaporate more easily, and this can lead to a lower cloud fraction. For the same reason, clouds with higher droplet concentrations are likely to break up earlier.
In addition, our sensitivity runs including versus excluding aerosol direct radiative effects have demonstrated the impact specifically of solar absorption by black carbon on the cloud life cycle. The excessive atmospheric heating reaching 12 K d−1 introduced by black carbon in our modeled cases is found to be able to lower the cloud top height and liquid water path, reduce dry entrainment, and increase the cloud fraction. Working with the cloud fraction response to the aerosol size distribution, this heating and its consequences might delay the break-up of the LLSCs until late afternoon. All these would enhance the aerosol indirect effect. On the other hand, the modeled clouds in polluted cases with higher aerosol concentrations and BC content would break up more quickly in late afternoon due to their thinner cloud layers. In this case the semi-direct effect would weaken the indirect effect.
Our study has demonstrated that the life cycle and thus the radiative forcing of LLSCs over the land area of SWA can be substantially influenced by aerosols from both long-range-transported biomass burning plumes and from local anthropogenic emissions. In fact, more aerosol profiles were collected during the DACCIWA campaign besides the ones used in this study. Future research works could reveal the aerosol impact under an even broader range of aerosol properties and examine the temporal variations of LLSC radiative effects evolving with different large-scale meteorological conditions with different associated air masses. More analysis of different cloud cases in SWA would also be able to assess or refute current results on the semi-direct effect.
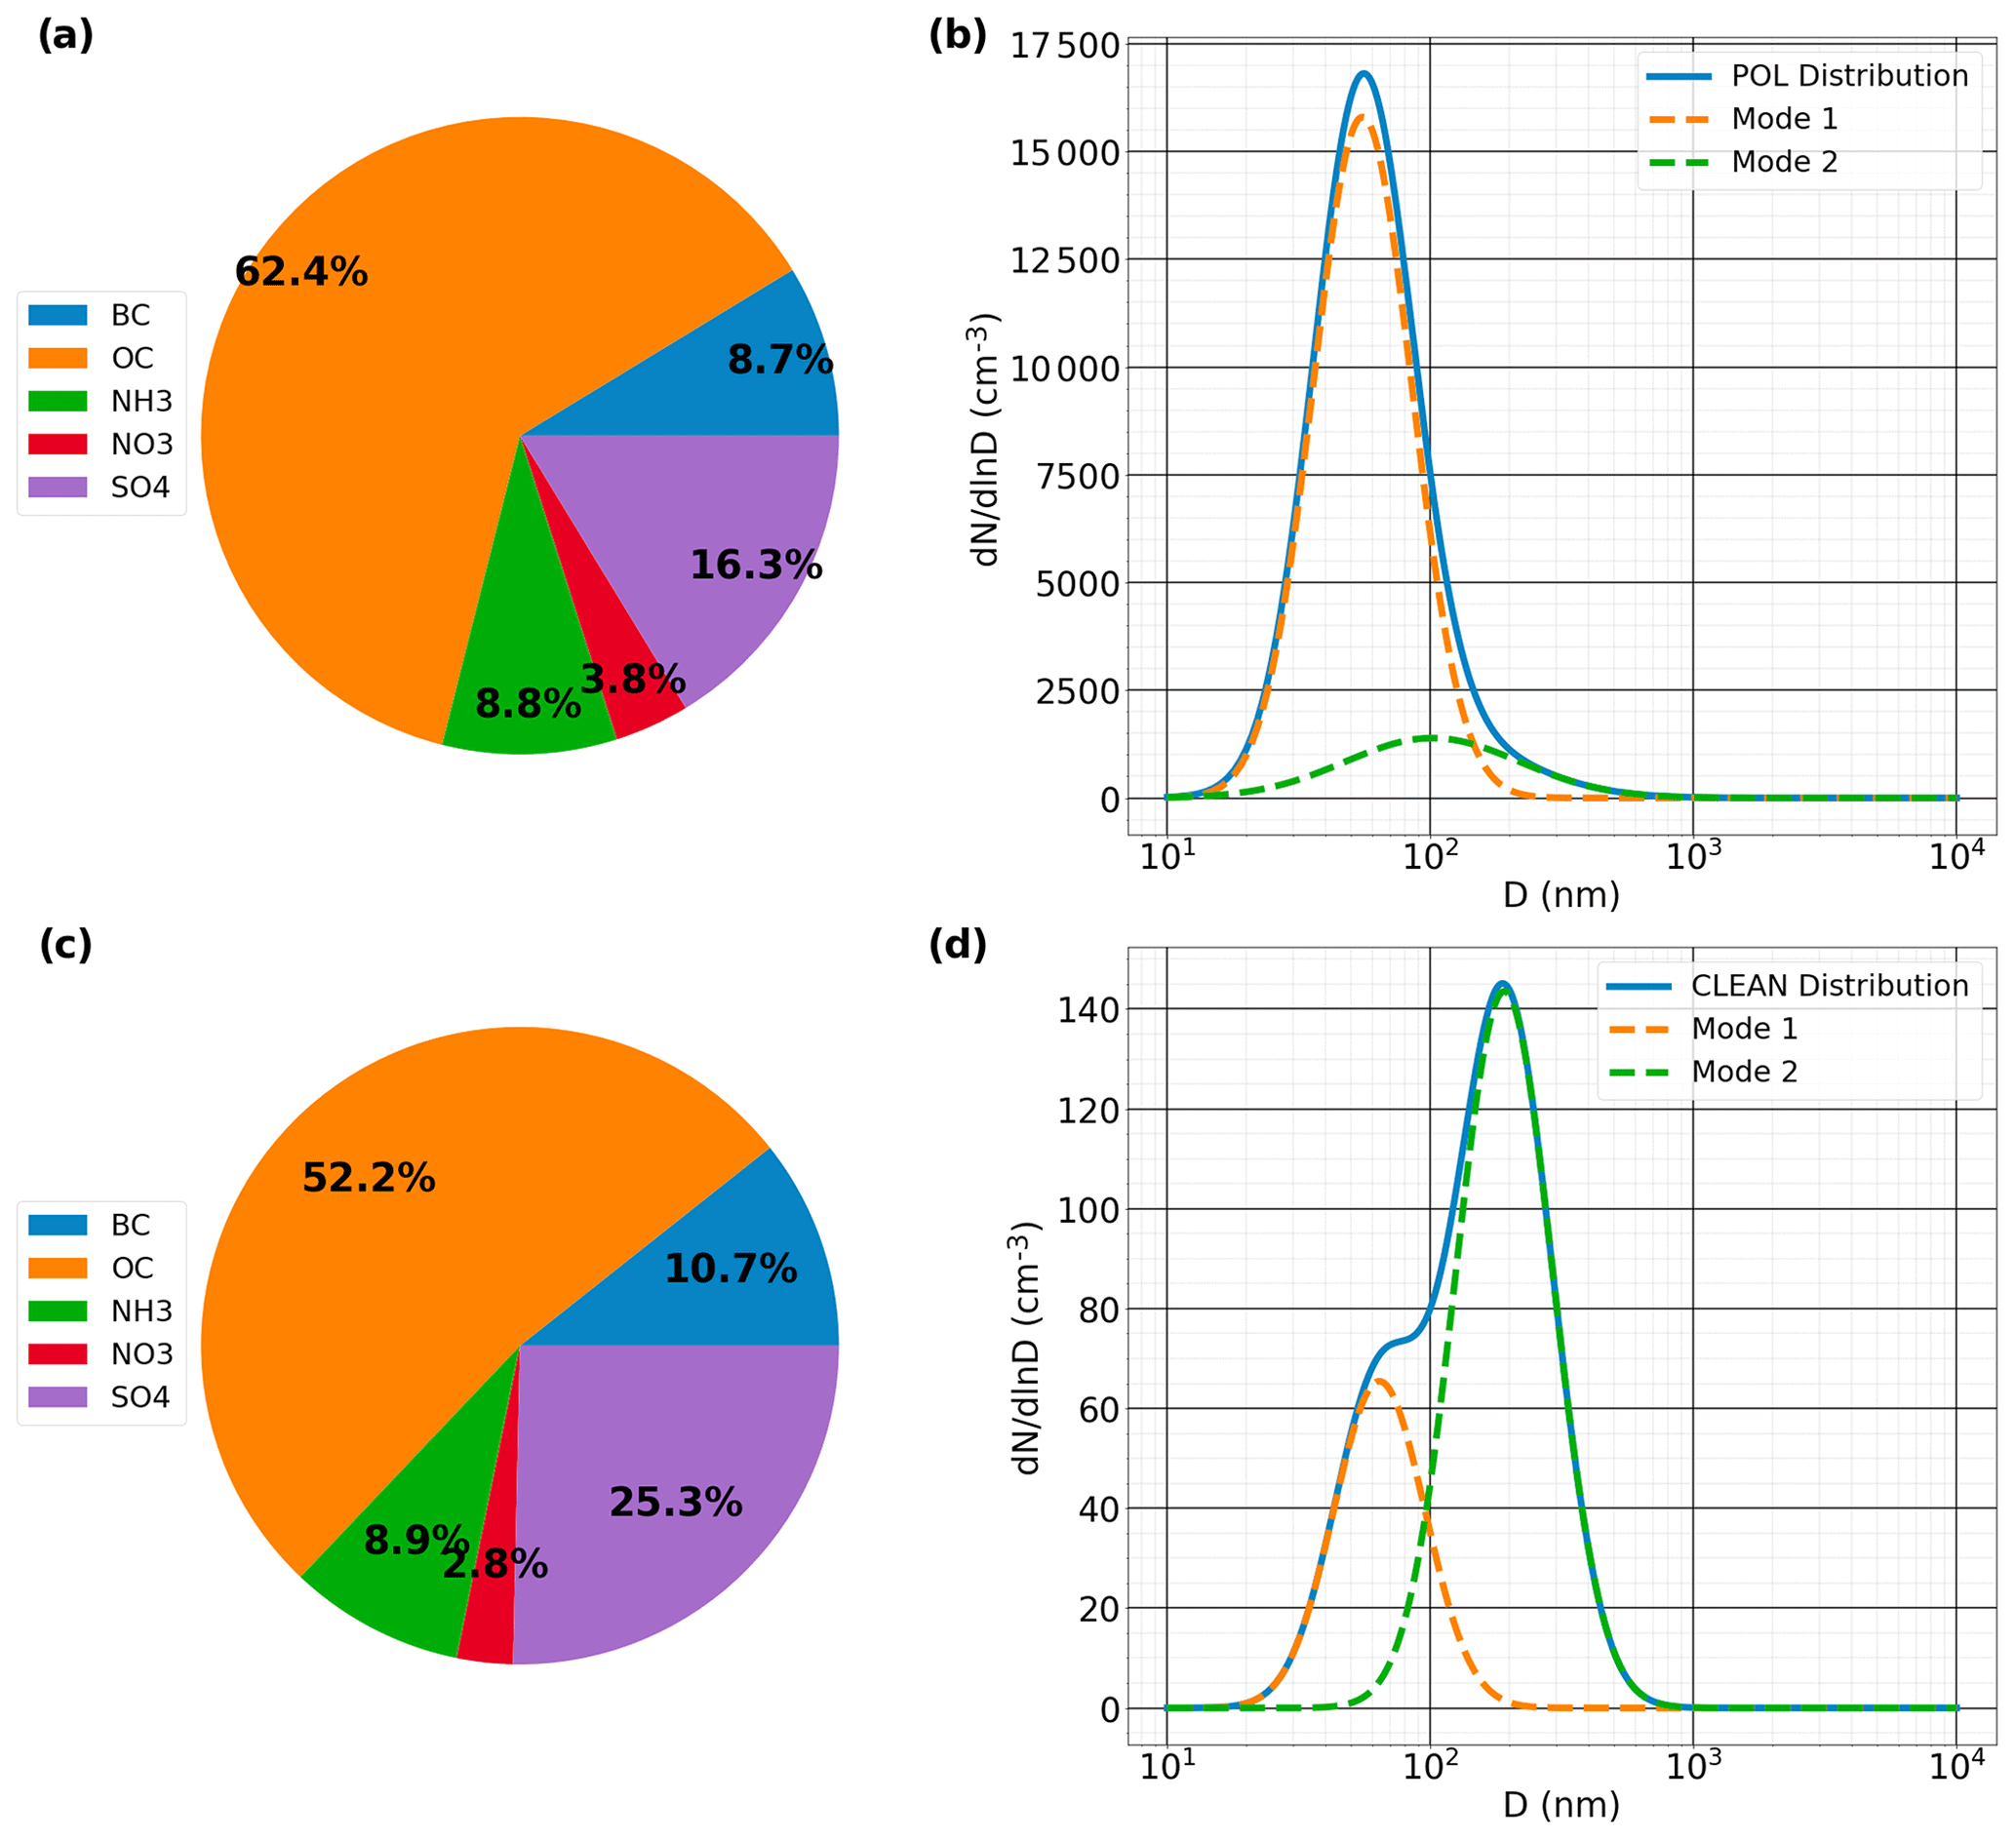
Figure A1Mass composition (a, c) and size distribution provided by Denjean et al. (2020a) and fitted into the two modes described in Table 2 (b, d) for the POL (a, b) and CLEAN (c, d) scenarios.
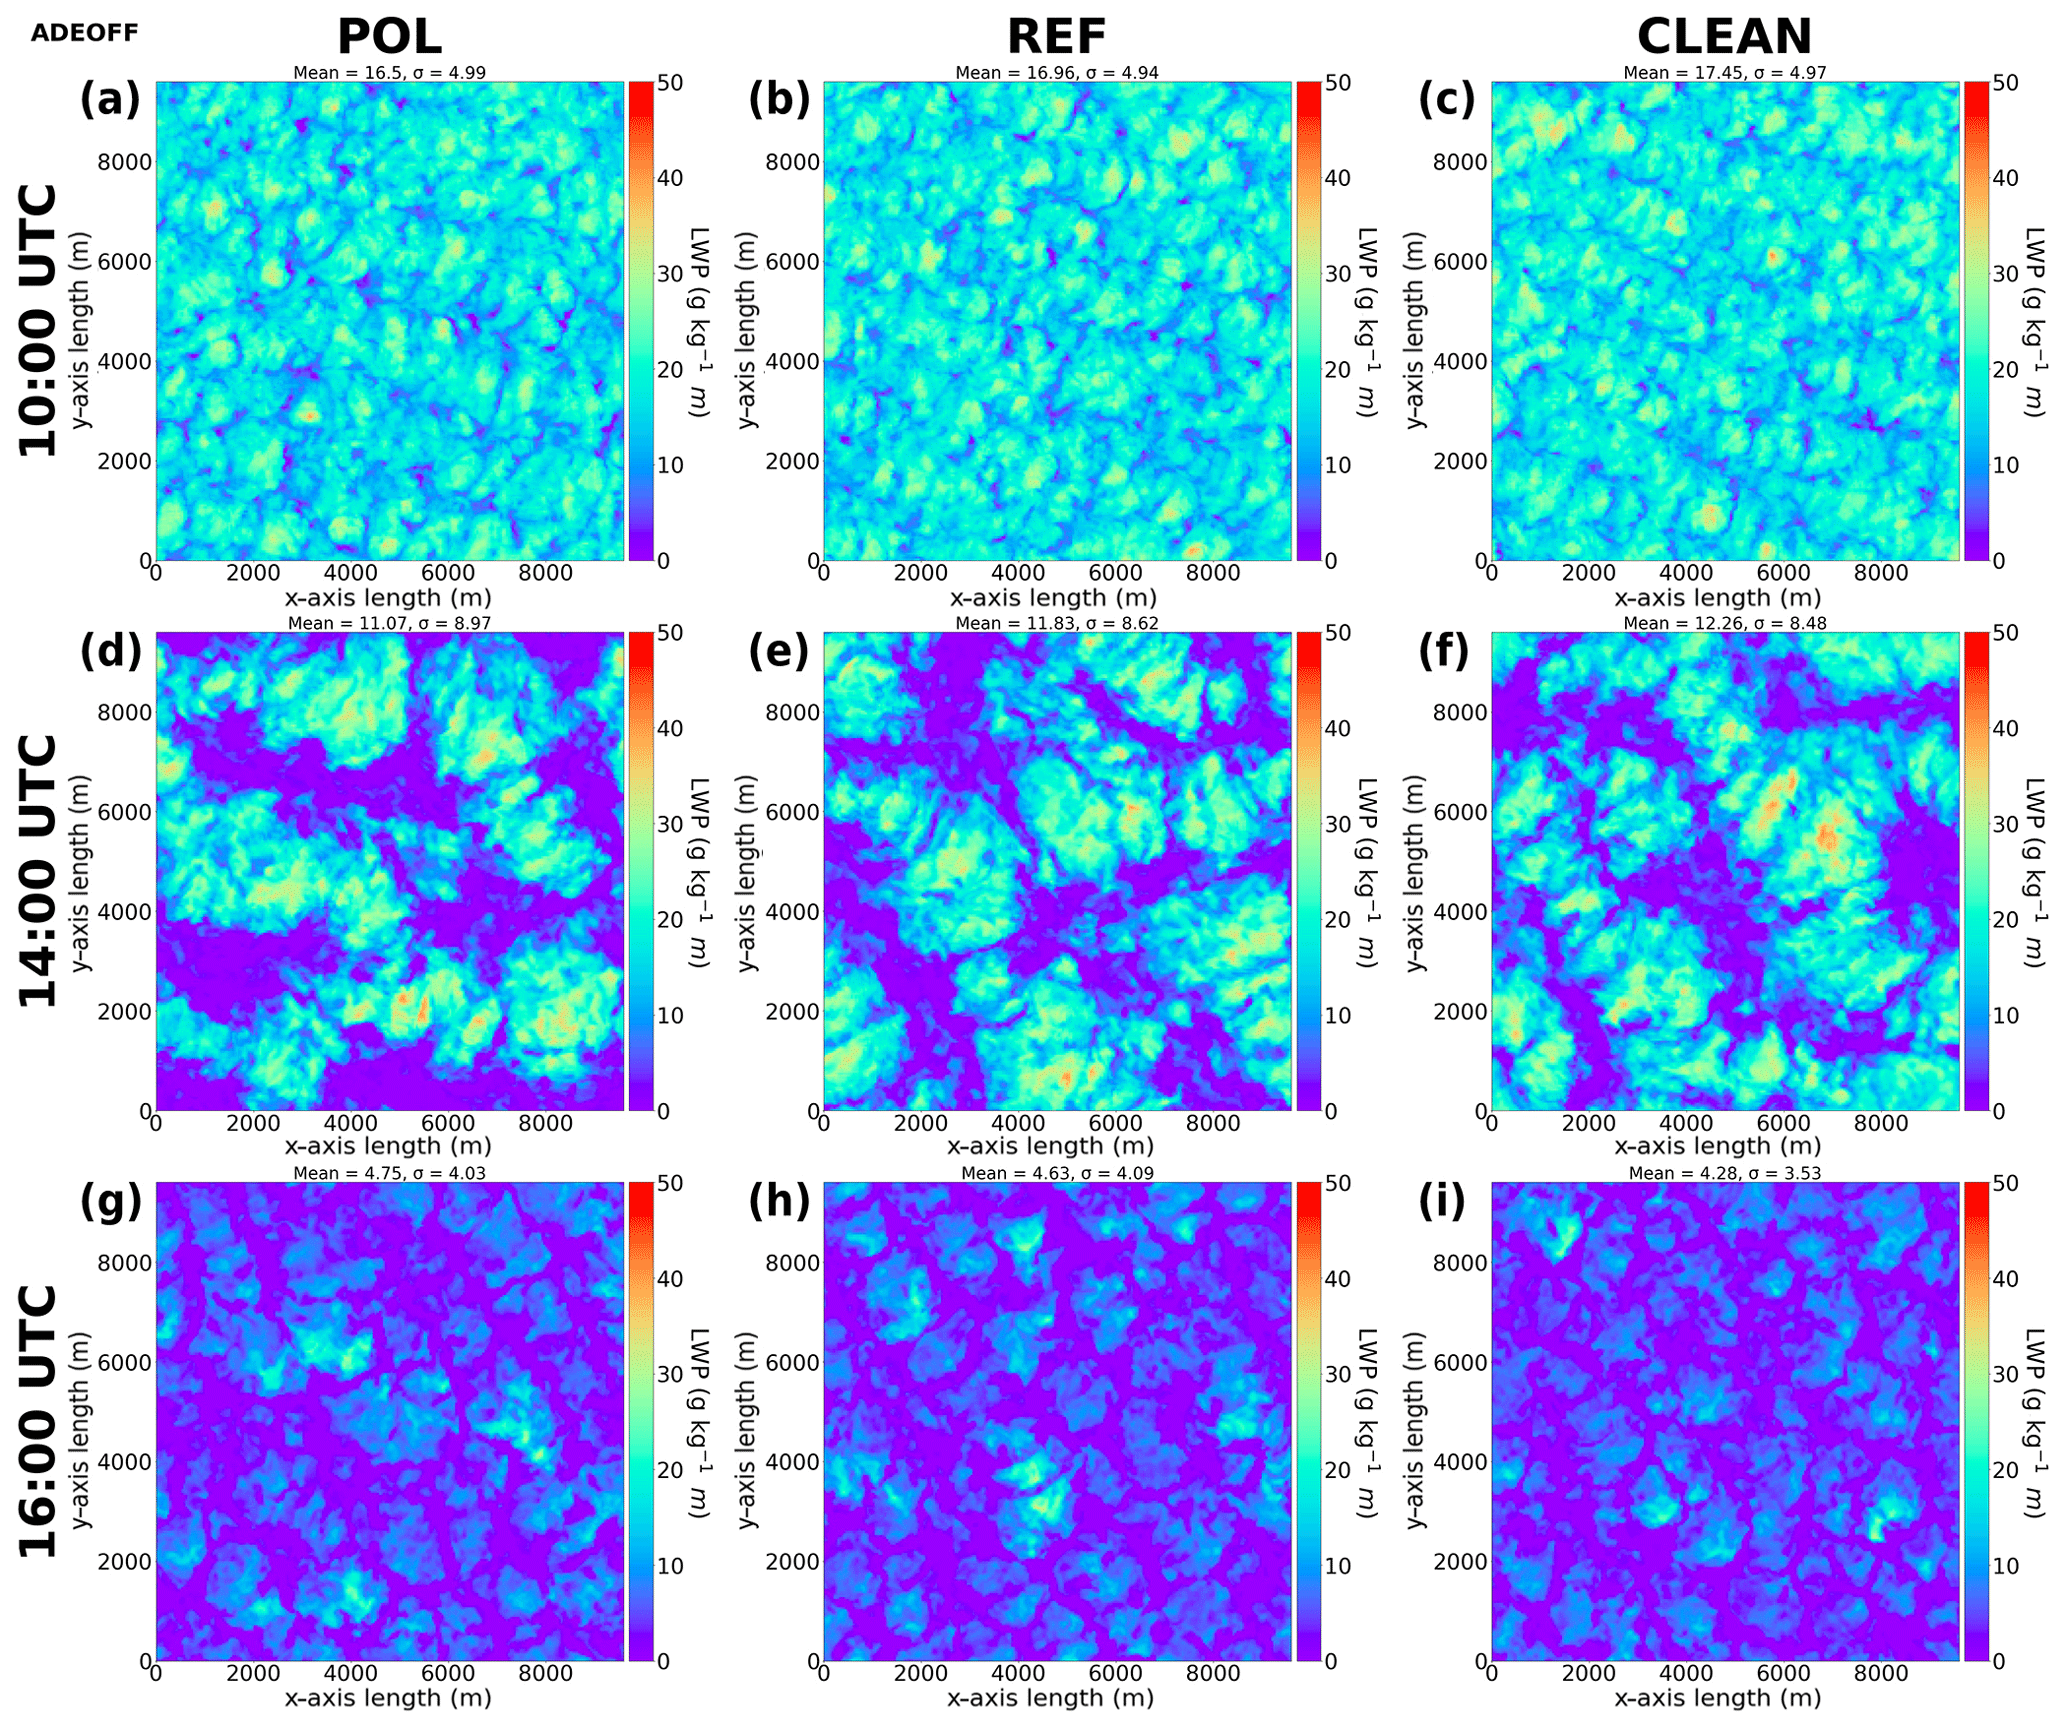
Figure A2Liquid water path (LWP, g kg−1 m) in the POL (a, d, g), REF (b, e, h), and CLEAN (c, f, i) ADEOFF runs at 10:00 UTC (a–c), 14:00 UTC (e–f), and 16:00 UTC (g–i).
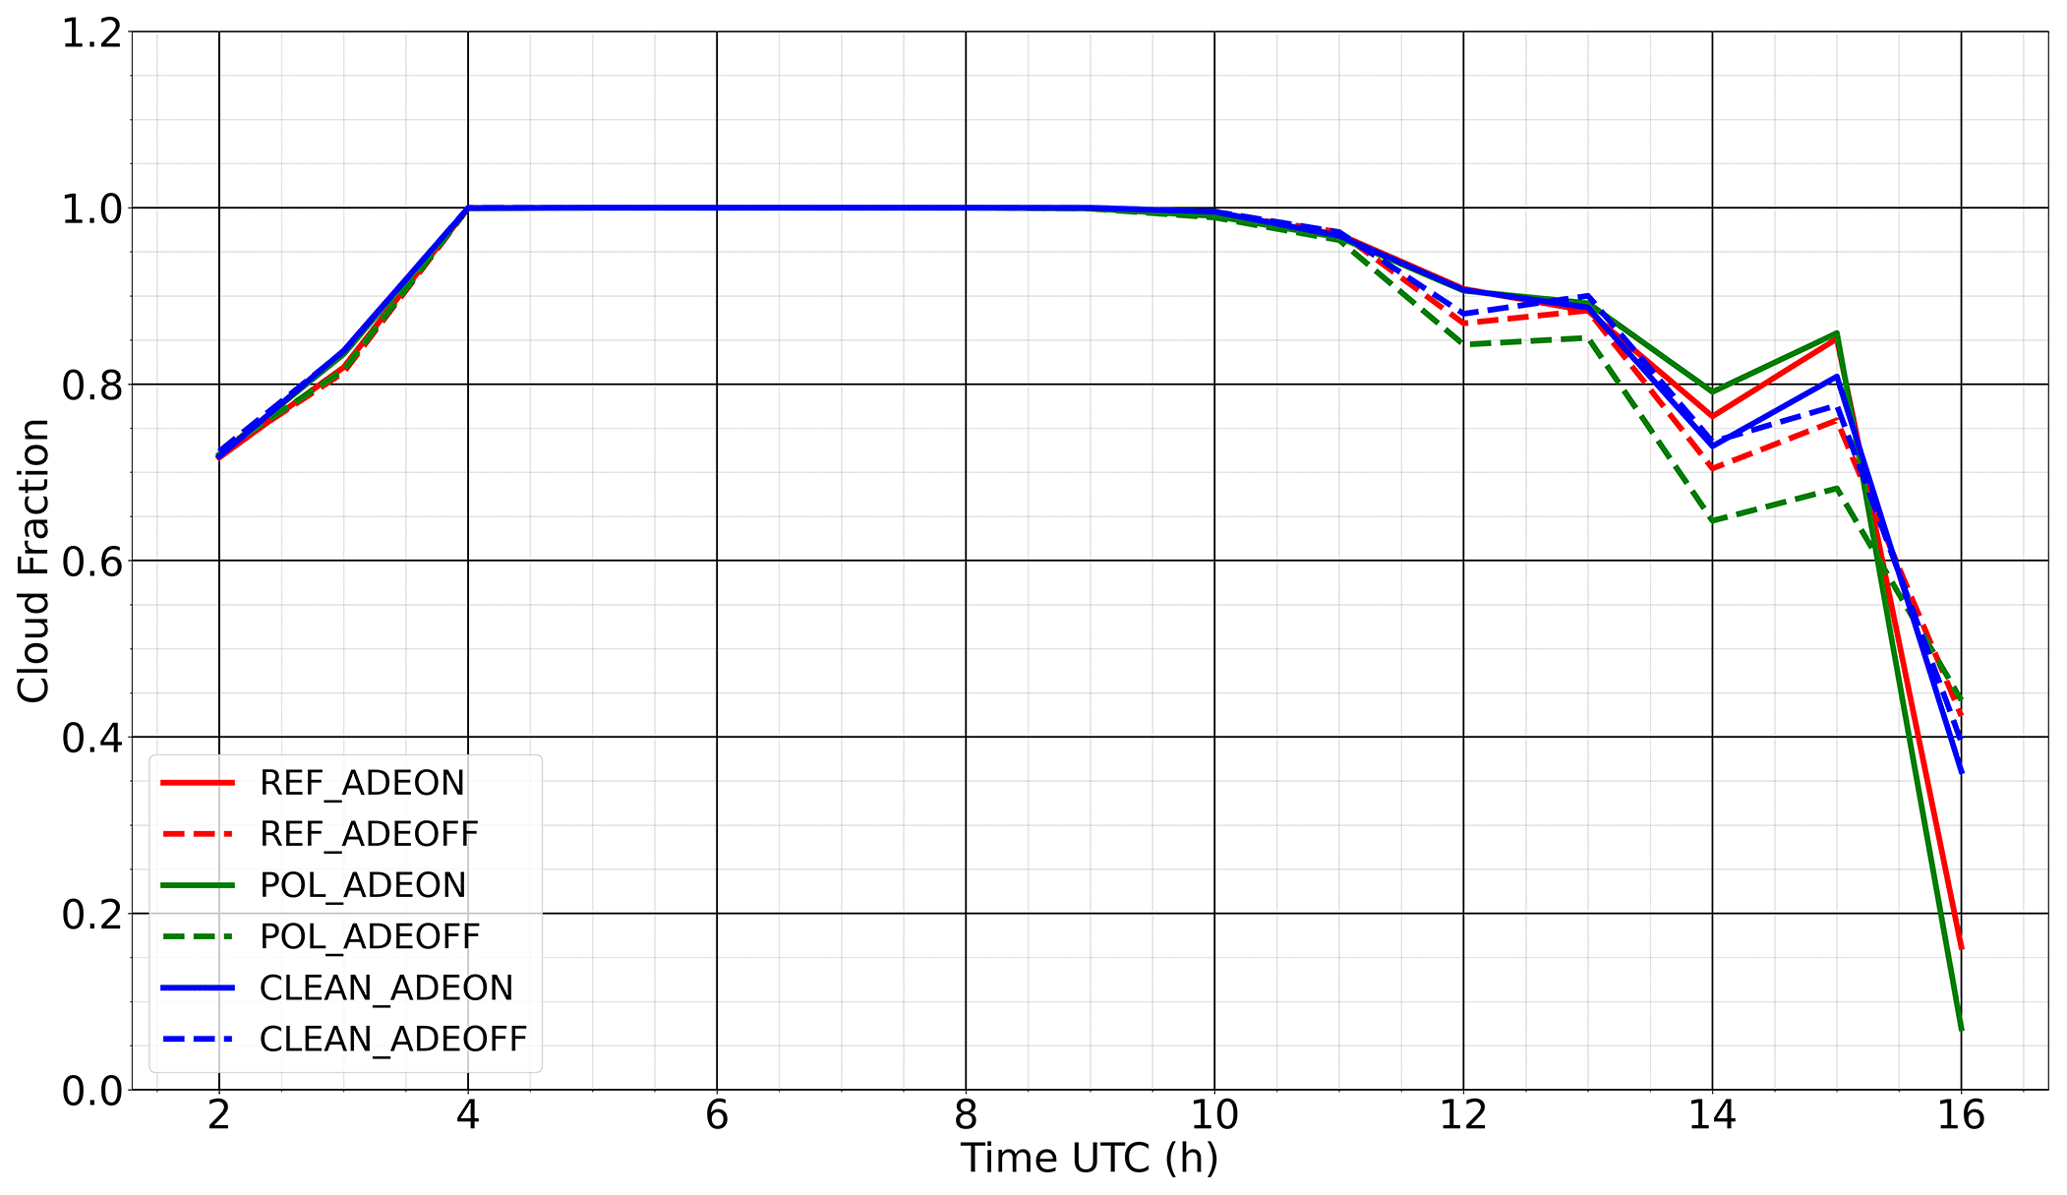
Figure A3Domain-averaged cloud fraction for the ADEON (solid lines) and ADEOFF (dotted lines) of the REF (red), POL (green), and CLEAN (blue) cases, derived using hourly model outputs. The cloud fraction here is a column quantity defined as pixels where LWP > 5 g kg−1 m.
The data obtained during the DACCIWA campaign at the Savè supersite alongside all the other data used in this study are publicly available in the SEDOO database (http://baobab.sedoo.fr/DACCIWA/, DACCIWA, 2023). The Meso-NH code is maintained and updated by LAERO and CNRM, and it is freely available for download at http://mesonh.aero.obs-mip.fr/mesonh52/ (LAERO, 2023).
LD and CW designed the simulations, and LD conducted the model simulations and data analyses. LD and CW wrote this paper with contributions from all the other co-authors. CW advised and helped LD to better understand the different aspects of this research work. PT advised and trained LD to use the Meso-NH and ORILAM module. CD processed and provided the aerosol profiles used in previous simulations, and NM was part of this work. MZ helped to select the study case and advised during the study case construction and analysis. AD brought a critical eye to this work.
The contact author has declared that none of the authors has any competing interests.
Publisher’s note: Copernicus Publications remains neutral with regard to jurisdictional claims made in the text, published maps, institutional affiliations, or any other geographical representation in this paper. While Copernicus Publications makes every effort to include appropriate place names, the final responsibility lies with the authors.
This study was supported by L'Agence Nationale de la Recherche (ANR) of France under the Programme d'Investissements d'Avenir (grant no. ANR-18-MPGA-003 EUROACE) and was co-funded by the Université de Toulouse III – Paul Sabatier. The computation of this work was performed using high-performance computing (HPC) resources of the French GENCI-IDRIS (grant nos. A0110110967 and A0090110967) and the French Regional Computations Center (CALMIP). Lambert Delbeke thanks the Université de Toulouse III – Paul Sabatier, France, for funding and hosting his PhD research activities. Lambert Delbeke also thanks the Meso-NH team, especially Quentin Rodier, Juan Escobar, and Philippe Wautelet, for their advice on using Meso-NH; Benoit Vié and Marie Mazoyer for their help in handling and modifying the microphysical scheme LIMA; Quentin Libois for explaining the details of Meso-NH's radiative schemes; and especially Fabienne Lohou (LAERO) for her introduction to the DACCIWA campaign alongside her guidance in using relevant data products. The authors especially thank all the people whose work was involved in the measurement and processing of the DACCIWA campaign data, especially over the Savè supersite. The research leading to the DACCIWA data results has received funding from the European Union Seventh Framework Programme (FP7/2007-2013) under grant agreement no. 603502. Many constructive comments and suggestions from Mónica Zamora Zapata and an anonymous reviewer as well as the handling editor, Graham Feingold, made a substantial impact on our effort to improve the quality of the manuscript.
This research has been supported by L'Agence Nationale de la Recherche (grant no. ANR-18-MPGA-003 EUROACE) and the Université de Toulouse III – Paul Sabatier (grant no. ANR-18-MPGA-003 EUROACE).
This paper was edited by Graham Feingold and reviewed by Mónica Zamora Zapata and one anonymous referee.
Abdul-Razzak, H. and Ghan, S. J.: Parameterization of the influence of organic surfactants on aerosol activation, J. Geophys. Res.-Atmos., 109, D03205, https://doi.org/10.1029/2003JD004043, 2004.
Ackerman, A. S., Kirkpatrick, M. P., Stevens, D. E., and Toon, O. B.: The impact of humidity above stratiform clouds on indirect aerosol climate forcing, Nature, 432, 1014–1017, https://doi.org/10.1038/nature03174, 2004.
Adler, B., Babić, K., Kalthoff, N., Lohou, F., Lothon, M., Dione, C., Pedruzo-Bagazgoitia, X., and Andersen, H.: Nocturnal low-level clouds in the atmospheric boundary layer over southern West Africa: an observation-based analysis of conditions and processes, Atmos. Chem. Phys., 19, 663–681, https://doi.org/10.5194/acp-19-663-2019, 2019.
Aouizerats, B., Thouron, O., Tulet, P., Mallet, M., Gomes, L., and Henzing, J. S.: Development of an online radiative module for the computation of aerosol optical properties in 3-D atmospheric models: validation during the EUCAARI campaign, Geosci. Model Dev., 3, 553–564, https://doi.org/10.5194/gmd-3-553-2010, 2010.
Babić, K., Adler, B., Kalthoff, N., Andersen, H., Dione, C., Lohou, F., Lothon, M., and Pedruzo-Bagazgoitia, X.: The observed diurnal cycle of low-level stratus clouds over southern West Africa: a case study, Atmos. Chem. Phys., 19, 1281–1299, https://doi.org/10.5194/acp-19-1281-2019, 2019.
Bauer, S. E., Im, U., Mezuman, K., and Gao, C. Y.: Desert Dust, Industrialization, and Agricultural Fires: Health Impacts of Outdoor Air Pollution in Africa, J. Geophys. Res.-Atmos., 124, 4104–4120, https://doi.org/10.1029/2018JD029336, 2019.
Bellon, G. and Stevens, B.: Time Scales of the Trade Wind Boundary Layer Adjustment, J. Atmos. Sci., 70, 1071–1083, https://doi.org/10.1175/JAS-D-12-0219.1, 2013.
Boucher, O., Randall, D., Artaxo, P., Bretherton, C., Feingold, G., Forster, P., Kerminen, V.-M., Kondo, Y., Liao, H., Lohmann, U., Rasch, P., Satheesh, S. K., Sherwood, S., Stevens, B., and Zhang, X. Y.: Clouds and Aerosols, in: Climate Change 2013: The Physical Science Basis. Contribution of Working Group I to the Fifth Assessment Report of the Intergovernmental Panel on Climate Change, edited by: Stocker, T. F., Qin, D., Plattner, G.-K., Tignor, M., Allen, S. K., Boschung, J., Nauels, A., Xia, Y., Bex, V., and Midgley, P. M., Cambridge University Press, Cambridge, United Kingdom and New York, NY, USA, ISBN 978-1-107-66182-0, 2013.
Bretherton, C. S., Blossy, F. N., and Uchida, J.: Cloud droplet sedimentation, entrainment efficiency, and subtropical stratocumulus albedo, Geophys. Res. Lett., 34, L03813, https://doi.org/10.1029/2006GL027648, 2007.
Brito, J., Freney, E., Dominutti, P., Borbon, A., Haslett, S. L., Batenburg, A. M., Colomb, A., Dupuy, R., Denjean, C., Burnet, F., Bourriane, T., Deroubaix, A., Sellegri, K., Borrmann, S., Coe, H., Flamant, C., Knippertz, P., and Schwarzenboeck, A.: Assessing the role of anthropogenic and biogenic sources on PM1 over southern West Africa using aircraft measurements, Atmos. Chem. Phys., 18, 757–772, https://doi.org/10.5194/acp-18-757-2018, 2018.
Caniaux, G., Redelsperger, J.-L., and Lafore, J.-P.: A Numerical Study of the Stratiform Region of a Fast-Moving Squall Line. Part I: General Description and Water and Heat Budgets, J. Atmos. Sci., 51, 2046–2074, 1994.
Carslaw, K. S., Gordon, H., Hamilton, D. S., Johnson, J. S., Regayre, L. A., Yoshioka, M., and Pringle, K. J.: Aerosols in the Pre-industrial Atmosphere, Current Climate Change Reports, 3, 1–15, https://doi.org/10.1007/s40641-017-0061-2, 2017.
Chatfield, R. B., Vastano, J. A., Li, L., Sachse, G. W., and Connors, V. S.: The Great African Plume from biomass burning: Generalizations from a three-dimensional study of TRACE A carbon monoxide, J. Geophys. Res.-Atmos., 103, 28059–28077, https://doi.org/10.1029/97JD03363, 1998.
Chen, T., Rossow, W. B., and Zhang, Y.: Radiative Effects of Cloud-Type Variations, J. Climate, 13, 264–286, https://doi.org/10.1175/1520-0442(2000)013<0264:REOCTV>2.0.CO;2, 2000.
Cleveland, W. S.: Robust Locally Weighted Regression and Smoothing Scatterplots, J. Am. Stat. Assoc. 74, 829–836, https://doi.org/10.1080/01621459.1979.10481038, 1979.
Cohard, J.-M. and Pinty, J.-P.: A comprehensive two-moment warm microphysical bulk scheme. I: Description and tests, Q. J. Roy. Meteor. Soc., 126, 1815–1842, https://doi.org/10.1002/qj.49712656613, 2000.
DACCIWA: DACCIWA Data Download, https://baobab.sedoo.fr/DACCIWA/ (last access: 17 October 2023), 2023.
Dearden, C., Hill, A., Coe, H., and Choularton, T.: The role of droplet sedimentation in the evolution of low-level clouds over southern West Africa, Atmos. Chem. Phys., 18, 14253–14269, https://doi.org/10.5194/acp-18-14253-2018, 2018.
Deetz, K., Vogel, H., Knippertz, P., Adler, B., Taylor, J., Coe, H., Bower, K., Haslett, S., Flynn, M., Dorsey, J., Crawford, I., Kottmeier, C., and Vogel, B.: Numerical simulations of aerosol radiative effects and their impact on clouds and atmospheric dynamics over southern West Africa, Atmos. Chem. Phys., 18, 9767–9788, https://doi.org/10.5194/acp-18-9767-2018, 2018.
Denjean, C., Bourrianne, T., Burnet, F., Mallet, M., Maury, N., Colomb, A., Dominutti, P., Brito, J., Dupuy, R., Sellegri, K., Schwarzenboeck, A., Flamant, C., and Knippertz, P.: Overview of aerosol optical properties over southern West Africa from DACCIWA aircraft measurements, Atmos. Chem. Phys., 20, 4735–4756, https://doi.org/10.5194/acp-20-4735-2020, 2020a.
Denjean, C., Brito, J., Libois, Q., Mallet, M., Bourrianne, T., Burnet, F., Dupuy, R., Flamant, C., and Knippertz, P.: Unexpected Biomass Burning Aerosol Absorption Enhancement Explained by Black Carbon Mixing State, Geophys. Res. Lett., 47, e2020GL089055, https://doi.org/10.1029/2020GL089055, 2020b.
Deroubaix, A., Menut, L., Flamant, C., Brito, J., Denjean, C., Dreiling, V., Fink, A., Jambert, C., Kalthoff, N., Knippertz, P., Ladkin, R., Mailler, S., Maranan, M., Pacifico, F., Piguet, B., Siour, G., and Turquety, S.: Diurnal cycle of coastal anthropogenic pollutant transport over southern West Africa during the DACCIWA campaign, Atmos. Chem. Phys., 19, 473–497, https://doi.org/10.5194/acp-19-473-2019, 2019.
Deroubaix, A., Menut, L., Flamant, C., Knippertz, P., Fink, A. H., Batenburg, A., Brito, J., Denjean, C., Dione, C., Dupuy, R., Hahn, V., Kalthoff, N., Lohou, F., Schwarzenboeck, A., Siour, G., Tuccella, P., and Voigt, C.: Sensitivity of low-level clouds and precipitation to anthropogenic aerosol emission in southern West Africa: a DACCIWA case study, Atmos. Chem. Phys., 22, 3251–3273, https://doi.org/10.5194/acp-22-3251-2022, 2022.
Dione, C., Lohou, F., Lothon, M., Adler, B., Babić, K., Kalthoff, N., Pedruzo-Bagazgoitia, X., Bezombes, Y., and Gabella, O.: Low-level stratiform clouds and dynamical features observed within the southern West African monsoon, Atmos. Chem. Phys., 19, 8979–8997, https://doi.org/10.5194/acp-19-8979-2019, 2019.
Eastman, R. and Warren, S. G.: Diurnal Cycles of Cumulus, Cumulonimbus, Stratus, Stratocumulus, and Fog from Surface Observations over Land and Ocean, J. Climate, 27, 2386–2404, https://doi.org/10.1175/JCLI-D-13-00352.1, 2014.
Feingold, G., Jiang, H. L., and Harrington, J. Y.: On smoke suppression of clouds in Amazonia, Geophys. Res. Lett., 32, 804, https://doi.org/10.1029/2004GL021369, 2005.
Flamant, C., Deroubaix, A., Chazette, P., Brito, J., Gaetani, M., Knippertz, P., Fink, A. H., de Coetlogon, G., Menut, L., Colomb, A., Denjean, C., Meynadier, R., Rosenberg, P., Dupuy, R., Dominutti, P., Duplissy, J., Bourrianne, T., Schwarzenboeck, A., Ramonet, M., and Totems, J.: Aerosol distribution in the northern Gulf of Guinea: local anthropogenic sources, long-range transport, and the role of coastal shallow circulations, Atmos. Chem. Phys., 18, 12363–12389, https://doi.org/10.5194/acp-18-12363-2018, 2018.
Flossmann, A. I. and Wobrock, W.: Cloud Processing of Aerosol Particles in Marine Stratocumulus Clouds, Atmosphere, 10, 520, https://doi.org/10.3390/atmos10090520, 2019.
Fouquart, Y. and Bonnel, B.: Computations of solar heating of the earth's atmosphere – A new parameterizatio, Beitrage zur Physik der Atmosphare, 53, 35–62, 1980.
Geoffroy, O., Brenguier, J.-L., and Sandu, I.: Relationship between drizzle rate, liquid water path and droplet concentration at the scale of a stratocumulus cloud system, Atmos. Chem. Phys., 8, 4641–4654, https://doi.org/10.5194/acp-8-4641-2008, 2008.
Ghonima, M., Heus, T., Norris, J. R., and J. Kleissl, J.: Factors controlling stratocumulus cloud lifetime over coastal land, J. Atmos. Sci., 73, 2961–2983, 2016.
Griffin, R. J., Nguyen, K., Dabdub, D., and Seinfeld, J. H.: A Coupled Hydrophobic-Hydrophilic Model for Predicting Secondary Organic Aerosol Formation, J. Atmos. Chem., 44, 171–190, https://doi.org/10.1023/A:1022436813699, 2003.
Hagan, H. D., Thompson, B., Palmo, J., and Ruszkowski, A.: py-smps, GitHub [code], https://github.com/quant-aq/py-smps (last access: 17 October 2023), 2022.
Hannak, L., Knippertz, P., Fink, A. H., Kniffka, A., and Pante, G.: Why Do Global Climate Models Struggle to Represent Low-Level Clouds in the West African Summer Monsoon?, J. Climate, 30, 1665–1687, https://doi.org/10.1175/JCLI-D-16-0451.1, 2017.
Hansen, J., Sato, M., Ruedy, R., Lacis, A., and Oinas, V.: Global warming in the twenty-first century: An alternative scenario, P. Natl. Acad. Sci. USA, 97, 9875–9880, 1998.
Hartmann, D. L., Ockert-Bell, M. E., and Michelsen, M. L.: The Effect of Cloud Type on Earth's Energy Balance: Global Analysis, J. Climate, 5, 1281–1304, https://doi.org/10.1175/1520-0442(1992)005<1281:TEOCTO>2.0.CO;2, 1992.
Haslett, S. L., Taylor, J. W., Evans, M., Morris, E., Vogel, B., Dajuma, A., Brito, J., Batenburg, A. M., Borrmann, S., Schneider, J., Schulz, C., Denjean, C., Bourrianne, T., Knippertz, P., Dupuy, R., Schwarzenböck, A., Sauer, D., Flamant, C., Dorsey, J., Crawford, I., and Coe, H.: Remote biomass burning dominates southern West African air pollution during the monsoon, Atmos. Chem. Phys., 19, 15217–15234, https://doi.org/10.5194/acp-19-15217-2019, 2019.
Haywood, J. and Boucher, O.: Estimates of the direct and indirect radiative forcing due to tropospheric aerosols: A review, Rev. Geophys., 38, 513–543, https://doi.org/10.1029/1999RG000078, 2000.
Hill, P. G., Allan, R. P., Chiu, J. C., Bodas-Salcedo, A., and Knippertz, P.: Quantifying the Contribution of Different Cloud Types to the Radiation Budget in Southern West Africa, J. Climate, 31, 5273–5291, https://doi.org/10.1175/JCLI-D-17-0586.1, 2018.
Huang, J., Wang, T., Wang, W., Li, Z., and Yan, H.: Climate effects of dust aerosols over East Asian arid and semiarid regions, J. Geophys Res.-Atmos., 119, 11398–11416, https://doi.org/10.1002/2014JD021796, 2014.
Jiang, G.-S. and Shu, C.-W.: Efficient Implementation of Weighted ENO Schemes, J. Comp. Phys., 126, 202–228, https://doi.org/10.1006/jcph.1996.0130, 1996.
Jiang, H. and Feingold, G.: Effect of aerosol on warm convective clouds: Aerosol-cloud-surface flux feedbacks in a new coupled large eddy model, J. Geophys. Res., 111, D01202, https://doi.org/10.1029/2005JD006138, 2006.
Jiang, H., Cotton, W. R., and Feingold, G.: Simulations of aerosol-cloud-dynamical feedbacks resulting from entrainment of aerosol into the marine boundary layer during the Atlantic Stratocumulus Transition Experiment, J. Geophys. Res., 107, 4813, https://doi.org/10.1029/2001JD001502, 2002.
Johnson, B. T., Shine, K. P., and Forster, P. M.,: The semi-direct aerosol effect: Impact of absorbing aerosols on marine stratocumulus, Q. J. Roy. Meteor. Soc., 130, 1407–1422, 2004.
Kalthoff, N., Lohou, F., Brooks, B., Jegede, G., Adler, B., Babić, K., Dione, C., Ajao, A., Amekudzi, L. K., Aryee, J. N. A., Ayoola, M., Bessardon, G., Danuor, S. K., Handwerker, J., Kohler, M., Lothon, M., Pedruzo-Bagazgoitia, X., Smith, V., Sunmonu, L., Wieser, A., Fink, A. H., and Knippertz, P.: An overview of the diurnal cycle of the atmospheric boundary layer during the West African monsoon season: results from the 2016 observational campaign, Atmos. Chem. Phys., 18, 2913–2928, https://doi.org/10.5194/acp-18-2913-2018, 2018.
Khairoutdinov, M. and Kogan, Y.: A New Cloud Physics Parameterization in a Large-Eddy Simulation Model of Marine Stratocumulus, Mon. Weather Rev., 128, 229–243, https://doi.org/10.1175/1520-0493(2000)128<0229:ANCPPI>2.0.CO;2, 2000.
Knippertz, P., Fink, A. H., Schuster, R., Trentmann, J., Schrage, J. M., and Yorke, C.: Ultra-low clouds over the southern West African monsoon region, Geophys. Res. Lett., 38, L21808, https://doi.org/10.1029/2011GL049278, 2011.
Knippertz, P., Coe, H., Chiu, J. C., Evans, M. J., Fink, A. H., Kalthoff, N., Liousse, C., Mari, C., Allan, R. P., Brooks, B., Danour, S., Flamant, C., Jegede, O. O., Lohou, F., and Marsham, J. H.: The DACCIWA Project: Dynamics–Aerosol–Chemistry–Cloud Interactions in West Africa, B. Am. Meteorol. Soc., 96, 1451–1460, https://doi.org/10.1175/BAMS-D-14-00108.1, 2015.
Knippertz, P., Fink, A. H., Deroubaix, A., Morris, E., Tocquer, F., Evans, M. J., Flamant, C., Gaetani, M., Lavaysse, C., Mari, C., Marsham, J. H., Meynadier, R., Affo-Dogo, A., Bahaga, T., Brosse, F., Deetz, K., Guebsi, R., Latifou, I., Maranan, M., Rosenberg, P. D., and Schlueter, A.: A meteorological and chemical overview of the DACCIWA field campaign in West Africa in June–July 2016, Atmos. Chem. Phys., 17, 10893–10918, https://doi.org/10.5194/acp-17-10893-2017, 2017.
Koch, D. and Del Genio, A. D.: Black carbon semi-direct effects on cloud cover: review and synthesis, Atmos. Chem. Phys., 10, 7685–7696, https://doi.org/10.5194/acp-10-7685-2010, 2010.
Kreidenweis, S. M., Petters, M., and Lohmann, U.: 100 Years of Progress in Cloud Physics, Aerosols, and Aerosol Chemistry Research, Meteor. Mon., 59, 11.1–11.72, https://doi.org/10.1175/AMSMONOGRAPHS-D-18-0024.1, 2019.
Lac, C., Chaboureau, J.-P., Masson, V., Pinty, J.-P., Tulet, P., Escobar, J., Leriche, M., Barthe, C., Aouizerats, B., Augros, C., Aumond, P., Auguste, F., Bechtold, P., Berthet, S., Bielli, S., Bosseur, F., Caumont, O., Cohard, J.-M., Colin, J., Couvreux, F., Cuxart, J., Delautier, G., Dauhut, T., Ducrocq, V., Filippi, J.-B., Gazen, D., Geoffroy, O., Gheusi, F., Honnert, R., Lafore, J.-P., Lebeaupin Brossier, C., Libois, Q., Lunet, T., Mari, C., Maric, T., Mascart, P., Mogé, M., Molinié, G., Nuissier, O., Pantillon, F., Peyrillé, P., Pergaud, J., Perraud, E., Pianezze, J., Redelsperger, J.-L., Ricard, D., Richard, E., Riette, S., Rodier, Q., Schoetter, R., Seyfried, L., Stein, J., Suhre, K., Taufour, M., Thouron, O., Turner, S., Verrelle, A., Vié, B., Visentin, F., Vionnet, V., and Wautelet, P.: Overview of the Meso-NH model version 5.4 and its applications, Geosci. Model Dev., 11, 1929–1969, https://doi.org/10.5194/gmd-11-1929-2018, 2018.
LAERO: Meso-NH Source Code Download, Labotoire d'Aerologie (LAERO), http://mesonh.aero.obs-mip.fr/mesonh52/ (last access: 17 October 2023), 2023.
Lascaux, F., Richard, E., and Pinty, J.-P.: Numerical simulations of three different MAP IOPs and the associated microphysical processes, Q. J. Roy. Meteor. Soc., 132, 1907–1926, https://doi.org/10.1256/qj.05.197, 2006.
Legain, D., Bousquet, O., Douffet, T., Tzanos, D., Moulin, E., Barrie, J., and Renard, J.-B.: High-frequency boundary layer profiling with reusable radiosondes, Atmos. Meas. Tech., 6, 2195–2205, https://doi.org/10.5194/amt-6-2195-2013, 2013.
Li, J., Carlson, B. E., Yung, Y. L., Lv, D., Hansen, J., Penner, J. E., Liao, H., Ramaswamy, V., Kahn, R. A., Zhang, P., Dubovik, O., Ding, A., Lacis, A. A., Zhang, L., and Dong, Y.: Scattering and absorbing aerosols in the climate system, Nature Reviews Earth & Environment, 3, 363–379, https://doi.org/10.1038/s43017-022-00296-7, 2022.
Liousse, C., Assamoi, E., Criqui, P., Granier, C., and Rosset, R.: Explosive growth in African combustion emissions from 2005 to 2030, Environ. Res. Lett., 9, 035003, https://doi.org/10.1088/1748-9326/9/3/035003, 2014.
Liu, Y., Jia, R., Dai, T., Xie, Y., and Shi, G.: A review of aerosol optical properties and radiative effects, J. Meteorol. Res., 28, 1003–1028, https://doi.org/10.1007/s13351-014-4045-z, 2014.
Lohmann, U. and Feichter, J.: Can the direct and semi-direct aerosol effect compete with the indirect effect on a global scale?, Geophys. Res. Lett., 28, 159–161, https://doi.org/10.1029/2000GL012051, 2001.
Lohou, F., Kalthoff, N., Adler, B., Babić, K., Dione, C., Lothon, M., Pedruzo-Bagazgoitia, X., and Zouzoua, M.: Conceptual model of diurnal cycle of low-level stratiform clouds over southern West Africa, Atmos. Chem. Phys., 20, 2263–2275, https://doi.org/10.5194/acp-20-2263-2020, 2020.
Lunet, T., Lac, C., Auguste, F., Visentin, F., Masson, V., and Escobar, J.: Combination of WENO and Explicit Runge- Kutta methods for wind transport in Meso-NH model, Mon. Weather Rev., 145, 3817–3838, https://doi.org/10.1175/MWR-D-16-0343.1, 2017.
Mari, C., Evans, M. J., Palmer, P. I., Jacob, D. J., and Sachse, G. W.: Export of Asian pollution during two cold front episodes of the TRACE-P experiment, J. Geophys. Res.-Atmos., 109, D15S17, https://doi.org/10.1029/2003JD004307, 2004.
Mari, C. H., Cailley, G., Corre, L., Saunois, M., Attié, J. L., Thouret, V., and Stohl, A.: Tracing biomass burning plumes from the Southern Hemisphere during the AMMA 2006 wet season experiment, Atmos. Chem. Phys., 8, 3951–3961, https://doi.org/10.5194/acp-8-3951-2008, 2008.
Marticorena, B. and Bergametti, G.: Two-year simulations of seasonal and interannual changes of the Saharan dust emissions, Geophys. Res. Lett., 23, 1921–1924, https://doi.org/10.1029/96GL01432, 1996.
Martin, G. M., Johnson, D. W., and Spice, A.: The Measurement and Parameterization of Effective Radius of Droplets in Warm Stratocumulus Clouds, J. Atmos. Sci., 51, 1823–1842, https://doi.org/10.1175/1520-0469(1994)051<1823:TMAPOE>2.0.CO;2, 1994.
Masson, V., Le Moigne, P., Martin, E., Faroux, S., Alias, A., Alkama, R., Belamari, S., Barbu, A., Boone, A., Bouyssel, F., Brousseau, P., Brun, E., Calvet, J.-C., Carrer, D., Decharme, B., Delire, C., Donier, S., Essaouini, K., Gibelin, A.-L., Giordani, H., Habets, F., Jidane, M., Kerdraon, G., Kourzeneva, E., Lafaysse, M., Lafont, S., Lebeaupin Brossier, C., Lemonsu, A., Mahfouf, J.-F., Marguinaud, P., Mokhtari, M., Morin, S., Pigeon, G., Salgado, R., Seity, Y., Taillefer, F., Tanguy, G., Tulet, P., Vincendon, B., Vionnet, V., and Voldoire, A.: The SURFEXv7.2 land and ocean surface platform for coupled or offline simulation of earth surface variables and fluxes, Geosci. Model Dev., 6, 929–960, https://doi.org/10.5194/gmd-6-929-2013, 2013.
Menut, L., Flamant, C., Turquety, S., Deroubaix, A., Chazette, P., and Meynadier, R.: Impact of biomass burning on pollutant surface concentrations in megacities of the Gulf of Guinea, Atmos. Chem. Phys., 18, 2687–2707, https://doi.org/10.5194/acp-18-2687-2018, 2018.
Menut, L., Tuccella, P., Flamant, C., Deroubaix, A., and Gaetani, M.: The role of aerosol–radiation–cloud interactions in linking anthropogenic pollution over southern west Africa and dust emission over the Sahara, Atmos. Chem. Phys., 19, 14657–14676, https://doi.org/10.5194/acp-19-14657-2019, 2019.
Metzger, S., Dentener, F., Pandis, S., and Lelieveld, J.: Gas/aerosol partitioning: 1. A computationally efficient model, J. Geophys. Res.-Atmos., 107, ACH 16-1–ACH 16-24, https://doi.org/10.1029/2001JD001102, 2002.
Mlawer, E. J., Taubman, S. J., Brown, P. D., Iacono, M. J., and Clough, S. A.: Radiative transfer for inhomogeneous atmospheres: RRTM, a validated correlated-k model for the longwave, J. Geophys. Res.-Atmos., 102, 16663–16682, https://doi.org/10.1029/97JD00237, 1997.
Morcrette, J.-J.: The Surface Downward Longwave Radiation in the ECMWF Forecast System, J. Climate., 15, 1875–1892, https://doi.org/10.1175/1520-0442(2002)015<1875:TSDLRI>2.0.CO;2, 2002.
Murphy, J. G., Oram, D. E., and Reeves, C. E.: Measurements of volatile organic compounds over West Africa, Atmos. Chem. Phys., 10, 5281–5294, https://doi.org/10.5194/acp-10-5281-2010, 2010.
Noilhan, J. and Planton, S.: A Simple Parameterization of Land Surface Processes for Meteorological Models, Mon. Weather Rev., 117, 536–549, https://doi.org/10.1175/1520-0493(1989)117<0536:ASPOLS>2.0.CO;2, 1989.
Pedruzo-Bagazgoitia, X., de Roode, S. R., Adler, B., Babić, K., Dione, C., Kalthoff, N., Lohou, F., Lothon, M., and Vilà-Guerau de Arellano, J.: The diurnal stratocumulus-to-cumulus transition over land in southern West Africa, Atmos. Chem. Phys., 20, 2735–2754, https://doi.org/10.5194/acp-20-2735-2020, 2020.
Petters, J. L., Harrington, J. Y., and Clothiaux, E. E.: Radiative–dynamical feedbacks in low liquid water path stratiform clouds, J. Atmos. Sci., 69, 1498–1512, https://doi.org/10.1175/JAS-D-11-0169.1, 2012
Pinty, J.-P. and Jabouille, P.: A mixed-phased cloud parameterization for use in a mesoscale non-hydrostatic model: simulations of a squall line and of orographic precipitation, Proc. Conf. on Cloud Physics, Everett, WA, 17–21 August 1998, 217–220, 1998.
Pruppacher, H. R., Klett, J. D., and Wang, P. K.: Microphysics of Clouds and Precipitation, Aerosol Sci. Tech., 28, 381–382, https://doi.org/10.1080/02786829808965531, 1998.
Reeves, C. E., Formenti, P., Afif, C., Ancellet, G., Attié, J.-L., Bechara, J., Borbon, A., Cairo, F., Coe, H., Crumeyrolle, S., Fierli, F., Flamant, C., Gomes, L., Hamburger, T., Jambert, C., Law, K. S., Mari, C., Jones, R. L., Matsuki, A., Mead, M. I., Methven, J., Mills, G. P., Minikin, A., Murphy, J. G., Nielsen, J. K., Oram, D. E., Parker, D. J., Richter, A., Schlager, H., Schwarzenboeck, A., and Thouret, V.: Chemical and aerosol characterisation of the troposphere over West Africa during the monsoon period as part of AMMA, Atmos. Chem. Phys., 10, 7575–7601, https://doi.org/10.5194/acp-10-7575-2010, 2010.
Sandu, I., Brenguier, J.-L., Geoffroy, O., Thouron, O., and Masson, V.: Aerosol Impacts on the Diurnal Cycle of Marine Stratocumulus, J. Atmos. Sci., 65, 2705–2718, https://doi.org/10.1175/2008JAS2451.1, 2008.
Sauvage, B., Thouret, V., Cammas, J.-P., Gheusi, F., Athier, G., and Nédélec, P.: Tropospheric ozone over Equatorial Africa: regional aspects from the MOZAIC data, Atmos. Chem. Phys., 5, 311–335, https://doi.org/10.5194/acp-5-311-2005, 2005.
Schrage, J. M. and Fink, A. H.: Nocturnal Continental Low-Level Stratus over Tropical West Africa: Observations and Possible Mechanisms Controlling Its Onset, Mon. Weather Rev., 140, 1794–1809, https://doi.org/10.1175/MWR-D-11-00172.1, 2012.
Schuster, R., Fink, A. H., and Knippertz, P.: Formation and maintenance of nocturnal low-level stratus over the Southern West African monsoon region during AMMA 2006, J. Atmos. Sci., 70, 2337–2355, https://doi.org/10.1175/JAS-D-12-0241.1, 2013.
Stevens, B., Cotton, W. R., Feingold, G., and Moeng, C.-H.: Large-eddy simulations of strongly precipitating, shallow, stratocumulus-topped boundary layers, J. Atmos. Sci., 55, 3616–3638, 1998.
Stevens, B., Moeng, C.-H., Ackerman, A. S., Bretherton, C. S., Chlond, A., de Roode, S., Edwards, J., Golaz, J.-C., Jiang, H., Khairoutdinov, M., Kirkpatrick, M. P., Lewellen, D. C., Lock, A., Müller, F., Stevens, D. E., Whelan, E., and Zhu, P.: Evaluation of large-eddy simulations via observations of nocturnal marine stratocumulus, Mon. Weather Rev., 133, 1443–1462, https://doi.org/10.1175/MWR2930.1, 2005.
Stjern, C. W., Samset, B. H., Myhre, G., Forster, P. M., Hodnebrog, Andrews, T., Boucher, O., Faluvegi, G., Iversen, T., Kasoar, M., Kharin, V., Kirkevåg, A., Lamarque, J.-F., Olivié, D., Richardson, T., Shawki, D., Shindell, D., Smith, C. J., Takemura, T., and Voulgarakis, A.: Rapid adjustments cause weak surface temperature response to increased black carbon concentrations, J. Geophys. Res.-Atmos., 122, 11462–11481, https://doi.org/10.1002/2017JD027326, 2017.
Taylor, J. W., Haslett, S. L., Bower, K., Flynn, M., Crawford, I., Dorsey, J., Choularton, T., Connolly, P. J., Hahn, V., Voigt, C., Sauer, D., Dupuy, R., Brito, J., Schwarzenboeck, A., Bourriane, T., Denjean, C., Rosenberg, P., Flamant, C., Lee, J. D., Vaughan, A. R., Hill, P. G., Brooks, B., Catoire, V., Knippertz, P., and Coe, H.: Aerosol influences on low-level clouds in the West African monsoon, Atmos. Chem. Phys., 19, 8503–8522, https://doi.org/10.5194/acp-19-8503-2019, 2019.
Thouron, O., Brenguier, J.-L., and Burnet, F.: Supersaturation calculation in large eddy simulation models for prediction of the droplet number concentration, Geosci. Model Dev., 5, 761–772, https://doi.org/10.5194/gmd-5-761-2012, 2012.
Tulet, P., Crassier, V., Solmon, F., Guedalia, D., and Rosset, R.: Description of the mesoscale nonhydrostatic chemistry model and application to a transboundary pollution episode between northern France and southern England, J. Geophys. Res.-Atmos., 108, ACH 5-1–ACH 5-11, https://doi.org/10.1029/2000JD000301, 2003.
Tulet, P., Crassier, V., Cousin, F., Suhre, K., and Rosset, R.: ORILAM, a three-moment lognormal aerosol scheme for mesoscale atmospheric model: Online coupling into the Meso-NH-C model and validation on the Escompte campaign, J. Geophys. Res.-Atmos., 110, D18201, https://doi.org/10.1029/2004JD005716, 2005.
Tulet, P., Grini, A., Griffin, R. J., and Petitcol, S.: ORILAM-SOA: A computationally efficient model for predicting secondary organic aerosols in three-dimensional atmospheric models, J. Geophys. Res.-Atmos., 111, D23208, https://doi.org/10.1029/2006JD007152, 2006.
Twohy, C. H., Anderson, J. R., Toohey, D. W., Andrejczuk, M., Adams, A., Lytle, M., George, R. C., Wood, R., Saide, P., Spak, S., Zuidema, P., and Leon, D.: Impacts of aerosol particles on the microphysical and radiative properties of stratocumulus clouds over the southeast Pacific Ocean, Atmos. Chem. Phys., 13, 2541–2562, https://doi.org/10.5194/acp-13-2541-2013, 2013.
Twomey, S.: PRECIPITATION BY DIRECT INTERCEPTION OF CLOUD-WATER, Weather, 12, 120–122, https://doi.org/10.1002/j.1477-8696.1957.tb00453.x, 1957.
Van der Dussen, J. J., de Roode, S. R., and Siebesma, A. P.: Factors controlling rapid stratocumulus cloud thinning, J. Atmos. Sci., 71, 655–664, https://doi.org/10.1175/JAS-D-13-0114.1, 2014.
Vié, B., Pinty, J.-P., Berthet, S., and Leriche, M.: LIMA (v1.0): A quasi two-moment microphysical scheme driven by a multimodal population of cloud condensation and ice freezing nuclei, Geosci. Model Dev., 9, 567–586, https://doi.org/10.5194/gmd-9-567-2016, 2016.
Wang, S., Wang, Q., and Feingold, G.: Turbulence, Condensation, and Liquid Water Transport in Numerically Simulated Nonprecipitating Stratocumulus Clouds, J. Atmos. Sci., 60, 262–278, https://doi.org/10.1175/1520-0469(2003)060<0262:TCALWT>2.0.CO;2, 2003.
Wood, R.: Stratocumulus Clouds, Mon. Weather Rev., 140, 2373–2423, https://doi.org/10.1175/MWR-D-11-00121.1, 2012.
Yamaguchi, T., Feingold, G., Kazil, J., and McComiskey, A.: Stratocumulus to cumulus transition in the presence of elevated smoke layers, Geophys. Res. Lett., 42, 10478–10485, https://doi.org/10.1002/2015GL066544, 2015.
Zhang, J. and Zuidema, P.: The diurnal cycle of the smoky marine boundary layer observed during August in the remote southeast Atlantic, Atmos. Chem. Phys., 19, 14493–14516, https://doi.org/10.5194/acp-19-14493-2019, 2019.
Zouzoua, M., Lohou, F., Assamoi, P., Lothon, M., Yoboue, V., Dione, C., Kalthoff, N., Adler, B., Babić, K., Pedruzo-Bagazgoitia, X., and Derrien, S.: Breakup of nocturnal low-level stratiform clouds during the southern West African monsoon season, Atmos. Chem. Phys., 21, 2027–2051, https://doi.org/10.5194/acp-21-2027-2021, 2021.
- Abstract
- Introduction
- Methods
- Analysis of REF results
- Sensitivity study to examine the influence of different aerosol profiles on the LLSC life cycle
- Conclusions
- Appendix A: Additional figures
- Code and data availability
- Author contributions
- Competing interests
- Disclaimer
- Acknowledgements
- Financial support
- Review statement
- References