the Creative Commons Attribution 4.0 License.
the Creative Commons Attribution 4.0 License.
 | 25 Jan 2023
Characteristics of fine particle matter at the top of Shanghai Tower
Changqin Yin
Jianming Xu
Wei Gao
Liang Pan
Yixuan Gu
Qingyan Fu
Fan Yang
To investigate the physical and chemical processes of fine particle matter (PM) at the mid-upper planetary boundary layer (PBL), we conducted 1-year continuous measurements of fine PM, the chemical composition of non-refractory submicron aerosol (NR-PM1), and some gas species (including sulfur dioxide, nitrogen oxides, and ozone) at an opening observatory (∼ 600 m) at the top of Shanghai Tower (SHT), which is China's first and the world's second highest building located in the typical financial central business district of Shanghai, China. This is the first report on the characteristics of fine particles based on continuous and sophisticated online measurements at the mid-upper level of the urban PBL. The observed PM2.5 and PM1 mass concentrations at SHT were 25.5 ± 17.7 and 17.3 ± 11.7 µg m−3, respectively. Organics, nitrate (NO3), and sulfate (SO4) occupied the first three leading contributions to NR-PM1 at SHT, accounting for 35.8 %, 28.6 %, and 20.8 %, respectively. The lower PM2.5 concentration was observed at SHT by 16.4 % compared with that near the surface during the observation period. It was attributed to the decreased nighttime PM2.5 concentrations (29.4 % lower than the surface) at SHT in all seasons due to the complete isolations from both emissions and gas precursors near the surface. However, daytime PM2.5 concentrations at SHT were 12.4 %–35.1 % higher than those near the surface from June to October, resulted from unexpected larger PM2.5 levels during early to middle afternoon at SHT than at the surface. We suppose the significant chemical production of secondary aerosols existed in the mid-upper PBL, because strong solar irradiance, adequate gas precursors (e.g., NOx), and lower temperature were observed at SHT, favorable for both photochemical production and gas-to-particle partitioning. This was further demonstrated by the significant increasing rate of oxygenated organic aerosols and NO3 observed at SHT during 08:00–12:00 in spring (7.4 % h−1 and 12.9 % h−1), fall (9.3 % h−1 and 9.1 % h−1), and summer (13.0 % h−1 and 11.4 % h−1), which cannot be fully explained by vertical mixing. It was noted that extremely high NO3 was observed at SHT both in daytime and nighttime in winter, accounting for 37.2 % in NR-PM1, suggesting the efficient pathway from heterogeneous and gas oxidation formation. Therefore, we highlight the priority of NOx reduction in Shanghai for the further improvement of air quality. This study reported greater daytime PM2.5 concentrations at the height of 600 m in the urban PBL compared with surface measurement, providing insight into their potential effects on local air quality, radiation forcing, and cloud and/or fog formations. We propose that the efficient production of secondary aerosol in the mid-upper PBL should be cognized and explored more comprehensively by synergetic observations in future.
- Article
(4311 KB) - Full-text XML
-
Supplement
(2792 KB) - BibTeX
- EndNote


Fine particle matter (PM) can absorb and scatter solar radiation and acts as cloud condensation nuclei. Thus, it can impact Earth's energy budget directly and indirectly (Yu et al., 2006). Therefore, PM observations are important and necessary. Although worldwide surface (SUR) PM observation networks are reinforcing (Zhang and Cao, 2015; Solomon et al., 2014), the characterization of PM vertical distribution remains uncertain. PM profiles can be acquired through ground-based lidar (Pappalardo et al., 2014) or airborne measurements (Kulmala et al., 2004). For aircraft observation, the advantage is a platform where flexible instruments can be equipped. For example, the aircraft studies gained aerosol size and composition during the ACE-Asia field campaign with the Aerodyne aerosol mass spectrometer (AMS) (Bahreini et al., 2003). For lidar observation, the continuous long-term and high spatial resolution data can be achieved at the same time (Liu et al., 2021; Voudouri et al., 2020). Nevertheless, PM concentration retrieval based on a lidar extinction coefficient highly depends on aerosol size distribution, aerosol composition, and atmospheric relative humidity assumptions, which are highly uncertain (Tao et al., 2016).
The AMS technique is frequently applied in field observation to analyze PM chemical composition (including organics, nitrate, sulfate, ammonium, and chloride) (Fröhlich et al., 2015; Zhang et al., 2007). Based on organic aerosol (OA) data of the AMS, the source apportionment of OAs can be performed through positive matrix factorization (PMF) (Zhang et al., 2011). The common outcomes of OA PMF source apportionment are hydrocarbon-like and oxygenated OA (HOA and OOA, respectively). As part of the ACE-Asia field campaign, the AMS was deployed in Asia for the first time (Zhou et al., 2020). As mentioned before, vertical PM composition observation needs a platform, which an aircraft, a mountain, a tower, or a high-altitude building can serve as. The observations conducted at mountains, towers, and high-altitude buildings make up the “blind zone” of aircraft and lidar observations.
For aircraft observations, the height can reach the free troposphere. Previous aircraft studies discovered OA formation in the nighttime planetary boundary layer (PBL) (Brown et al., 2013; Pratt et al., 2012) and in shallow cumulus clouds (Wonaschuetz et al., 2012). Besides, the distinct vertical distributions of PM chemical species were revealed (Brooks et al., 2019; Aldhaif et al., 2018; Liu et al., 2019). Zhao et al. (2020b) studied the vertical dispersion of size-resolved carbonaceous aerosols by comparing data at near-surface level and hilltop. Based on volatile organic compound (VOC) measurements at the heights of 118 and 488 m at Canton Tower, Mo et al. (2020) estimated the emission flux of VOC and secondary OA (SOA) formation potential using a mixed layer gradient technique. The measurements on a 300 m research tower in a suburban area near Denver showed that the sampling site was under the influence of aged air masses at heights between 40 and 120 m, while the fresh emissions were below 40 m (Ozturk et al., 2013). Based on a 325 m meteorological tower in Beijing, previous researchers studied the vertical distribution of chemical species through a series of field campaigns (Chen et al., 2015; Zhao et al., 2020c). W. Zhou et al. (2018) found that the differences between PM chemical species at SUR and 260 m originated from the different impacts of regional transport and local emission on primary and secondary species. Xie et al. (2019) presented the contribution of brown carbon to aerosol absorption.
Although previous studies made significant contributions to understanding PM vertical characteristics, long-term observations of PM and their chemical composition in the middle and upper boundary in high-density residential areas were lacking. Shanghai is one of the most densely populated megacities in the world. In this study, we present a 1-year continuous observation of PM2.5 and PM1 mass concentrations at the top of the 632 m high Shanghai Tower (SHT) in Shanghai, together with the observation of PM1 chemical composition. In Sect. 2, we describe the measurement sites, instruments, and analysis methods. In Sect. 3, we discuss the general characteristics, seasonal variations, and diurnal cycles of both SHT and SUR PM. Then, a conclusion is presented in Sect. 4.
2.1 Measurement site
Shanghai is seated in the east of the Yangtze River Delta region of China and is under the influence of northern subtropical monsoons. As mentioned before, the measurement site is located on a platform (∼ 600 m) at the top of SHT (121.501∘ E, 31.236∘ N) in the Lujiazui Finance and Trade Zone, a typical central business district with local emissions mainly from dense transportation. As the world's second highest construction that has been finished in the world, SHT stands out in the skyline (Fig. 1). To compare the PM characteristics between SUR and SHT, SUR PM data and meteorological data were collected at the Pudong Environmental Monitoring Center (PEMC) site and the Pudong Meteorological Bureau (PMET) site, respectively. The PEMC site (121.534∘ E, 31.229∘ N, about 3.2 km east of SHT) deployed by the Shanghai Environmental Monitoring Center belongs to the National Air Quality Monitoring Network, providing hourly concentrations of PM2.5, PM10, sulfur dioxide (SO2), carbon monoxide (CO), ozone (O3), and nitrogen dioxide (NO2) for this study. Hourly meteorological measurements, including 2 m air temperature, relative humidity (RH), 10 m horizontal wind speed, and direction were obtained at the PMET site (121.548∘ E, 31.222∘ N, about 4.7 km east of SHT) (Pan et al., 2019), which is a standard meteorological observatory managed by the Shanghai Meteorological Bureau. Both the PEMC site and the PMET site are referred to as the SUR site in the following discussion. All data are presented in Beijing standard time (BJT), which is 8 h ahead of coordinated universal time (UTC).
2.2 Instrumentation
The Aerodyne quadrupole-type Aerosol Chemical Speciation Monitor (Q-ACSM) was equipped at SHT to analyze non-refractory PM1 (NR-PM1) (Canagaratna et al., 2007) chemical components, including sulfate (SO4), nitrate (NO3), ammonium (NH4), chloride (Chl), and organics (Org) (Ng et al., 2011b), with a time resolution of ∼ 15 min. The Q-ACSM was deployed for 1 year from 17 April 2019 to 16 April 2020. The particles greater than 2.5 µm were removed through a PM2.5 cyclone (Model URG-2000-30ED) in front of the sampling line. The particles were then dried with a Nafion dryer (Perma Pure, Model MD-700-36S-1) before passing through the ACSM inlet. Moreover, PM1 and PM2.5 mass concentrations were collected simultaneously at a time resolution of 5 min by using the Thermo Scientific Model 5030 SHARP monitor. The nitrogen oxide (NO-NO2-NOx) and SO2 data were collected by the Thermo Scientific Model 42i and 43i, respectively. Both the gas and aerosol analyzers are deployed in a cabin equipped with air conditioning (Fig. 1), providing continuous measurements with high reliability for this study.
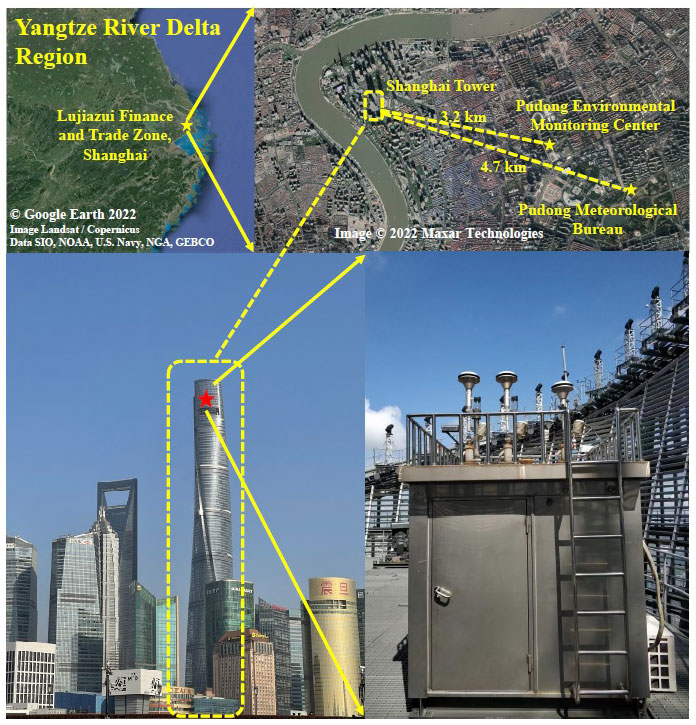
Figure 1The deployment of the SHT site. The upper-left image gives a view of the Yangtze River Delta region (screenshot from Google Earth 2022 map data: data SIO, NOAA, US Navy, NGA, GEBCO. Image Landsat/Copernicus). The upper-right image shows the map of sample sites (image © 2022 Maxar Technologies). The red star in the lower-left photo denotes the platform at the top of SHT.
2.3 ACSM data analysis
The ACSM chemical species concentrations were determined from the ion signals measured by an aerosol mass spectrometer, using the ACSM local software (version 1.6.1.0, released on October 2017) within Igor Pro (WaveMetrics, Inc., USA). The relative ionization efficiency (RIE) values were determined as 7.99 and 0.81 for NH4 and SO4 through ionization efficiency (IE) calibrations following the procedures brought by Ng et al. (2011b). RIE values were set as defaults for NO3 (1.1), Org (1.4), and Chl (1.3). The value of collection efficiency (CE) was taken as 0.5 based on previous field studies in China (Zhao et al., 2020a; Chen et al., 2015; Huang et al., 2012). The value of 0.5 is reasonable as aerosol particles were dried, and the mass fraction of ammonium nitrate (29 %) was below the threshold value (40 %) that affects CE (Middlebrook et al., 2012). Besides, the ratio of measured NH4 and predicted NH4 was 0.78, indicating that the particle acidity was weak and had little effects on CE. The composition-dependent CE was investigated according to the algorithm brought up by Middlebrook et al. (2012) and resulted in no significant changes.
2.4 Source apportionment
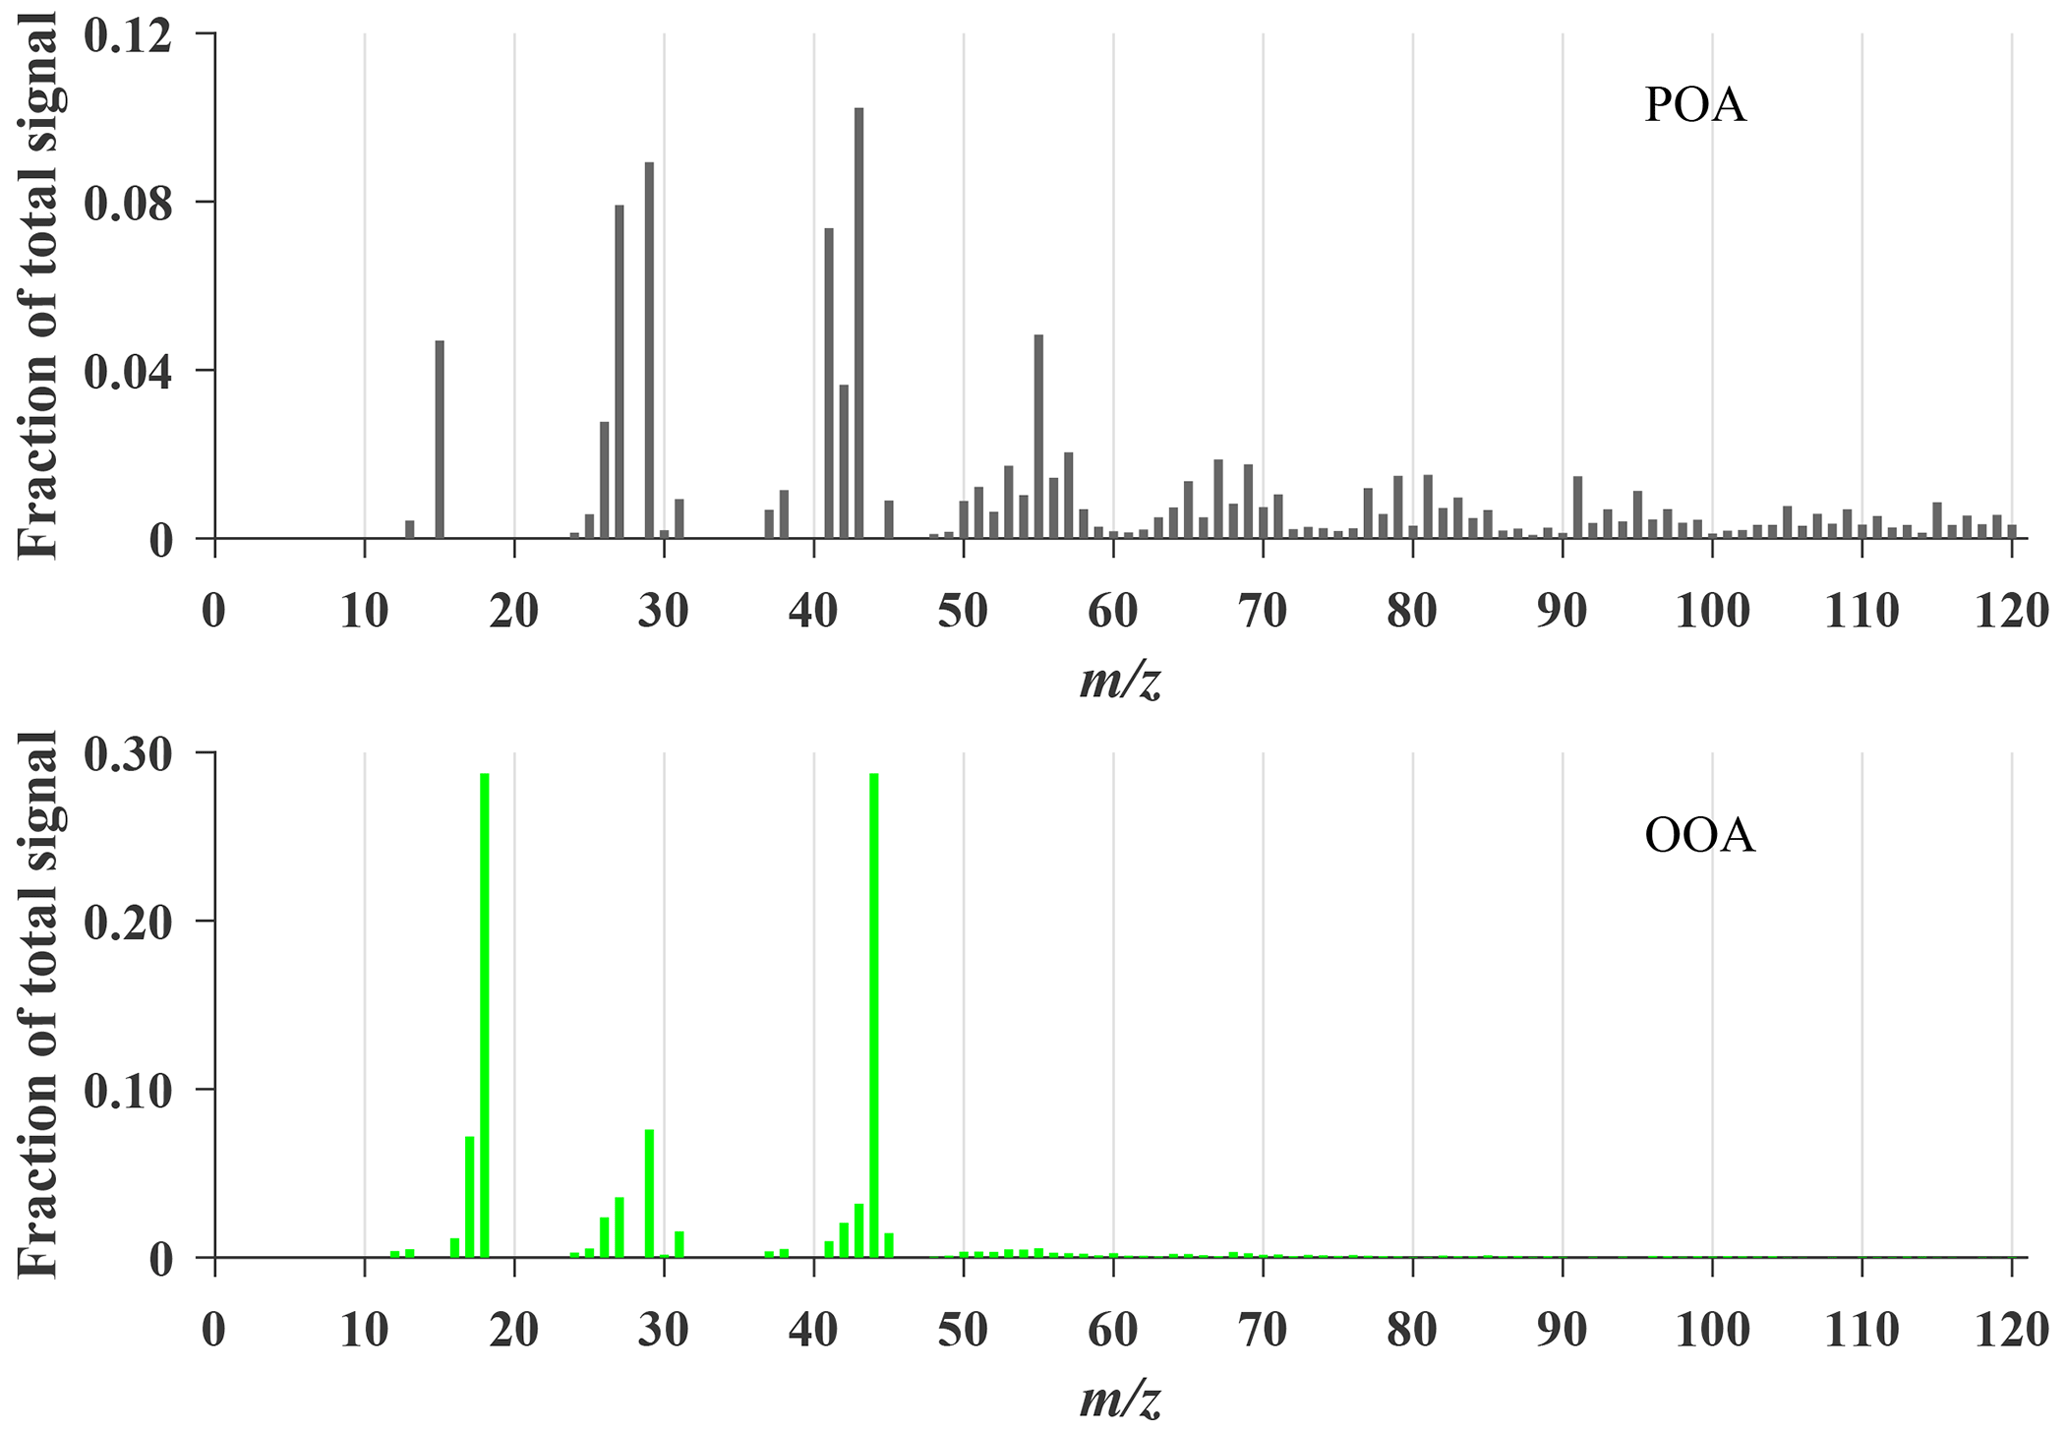
The data of organics were further examined by source apportionment using PMF (Canonaco et al., 2013) with an Igor-based source finder tool (SoFi version 6.G). Only lower than 120 were included in the source apportionment analysis. The unconstrained two-factor situation (Fig. 2) was chosen for following discussions. One factor was recognized as a mixture of primary OA (POA). The corresponding profile had hydrocarbon-like fragments (CnH2n−1 and CnH2n+1, particularly 27, 29, 41, 43, 55, 57, 67, and 71) as in HOA, a higher ratio of 55 than 57 as in cooking OA (COA), and distinctive polycyclic aromatic hydrocarbon (PAH) fragments as in coal combustion OA (CCOA) (Duan et al., 2019). The mixture of POA factors was also reported in previous ACSM studies (Sun et al., 2018). The other factor had an obvious OOA signature with a profile of significantly higher contribution (28.8 %) of 44 (CO as compared with previous ambient AMS and ACSM datasets (Ng et al., 2011a), meaning that OOAs reaching SHT experienced sufficient chemical aging processes. After increasing the number of unconstrained factors (Fig. S1 in the Supplement), no extra meaningful factors were interpreted. We also tried performing PMF analysis separately for each season (Figs. S2–S5); the POA factors were mixed with OOA features (prominent 44 signal) in two-factor solutions for all four seasons. We did an ME-2 (multilinear engine) analysis with an a priori POA profile from the unconstrained two-factor solution for the entire research period; two OOA factors could be identified as a more oxidized OOA (MO-OOA) and a less oxidized OOA (LO-OOA) (Figs. S6–S8). Then, we compared the mass concentrations of ME-2 OA factors with those of unconstrained factors. The Pearson correlation coefficients (R2) between the two methods were 0.97 and 1.00 for POA and OOA, respectively. However, a portion of 22.3 % of unconstrained POA mass further split into OOA in the ME-2 solution. As there was a lack of simultaneous measurements of surface chemical components, the unconstrained two-factor solution of PMF was adopted in consideration of focusing on PM differences between SHT and SUR.
2.5 PBL height analysis
To diagnose the relative location of the SHT site to the PBL, the seasonal and diurnal changes of PBL height (PBLH) were introduced. We obtained the PBLH at SHT from the nearest ERA5 gridded reanalysis data (Hersbach et al., 2020) (https://cds.climate.copernicus.eu/cdsapp#!/dataset/reanalysis-era5-single-levels?tab=form, last access: 27 November 2022). The ERA PBLH is calculated utilizing a bulk Richardson method, which is widely used for both convective and stable boundary layers (Kim, 2022). According to Wang et al. (2018), the ERA data tend to overestimate the PBLH at nighttime but underestimate the PBLH during daytime in eastern China by comparing it with the PBLH calculated from radiosonde sounding data. Overall, the reanalysis data can capture the diurnal and seasonal cycle of the PBL structure.
As shown in Fig. 3, fall found the highest PBLH for its prevailing synoptic of the continental high pressure (characterized as weak winds, strong solar radiation, and dry weather), favorable for the PBL development. The PBLH in four seasons presented similar diurnal variations. The PBL started to develop at 06:00–08:00 before reaching a daily top at 13:00–14:00 and then decreased until stabilizing after sunset (18:00–19:00). However, the summertime PBL had the longest development period (06:00–19:00), while the wintertime PBL had the shortest (08:00–18:00). At nighttime, the observatory at SHT generally stood on top of a stable PBL despite the deviations, whereas the time when the PBL top reached the SHT site in the morning varied from season to season. Nevertheless, the PBL had contact with SHT's top even for the lower bound of deviation, indicating inevitable mass exchanges between SHT and SUR during the daytime.
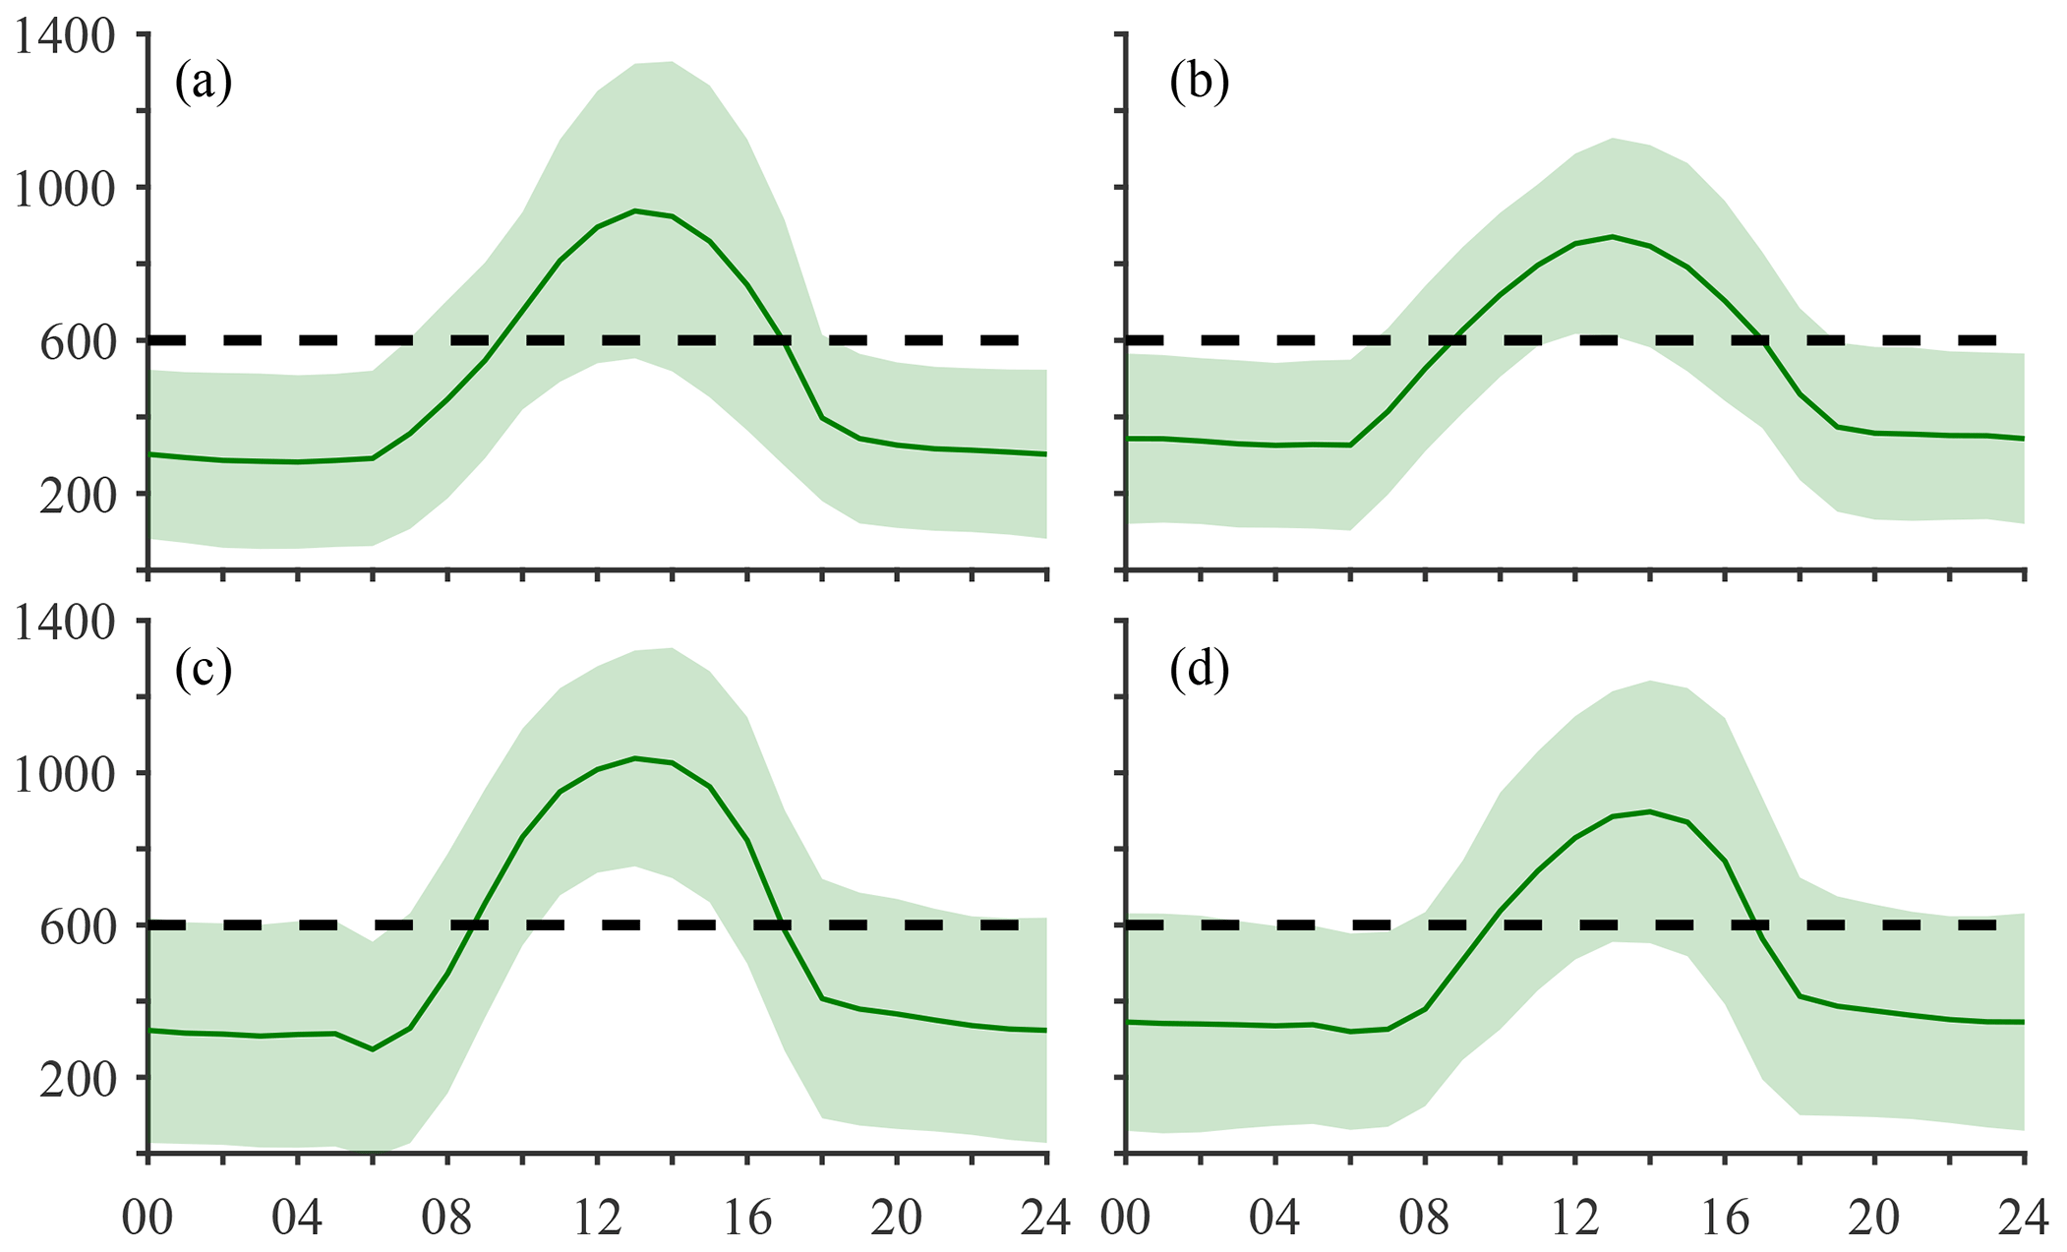
Figure 3Diurnal variations of the reanalysis PBLH in spring (a), summer (b), fall (c), and winter (d) at the grid box where the Shanghai Tower (SHT) site is in. The solid line represents the mean value, and the shaded area stands for the standard deviation. The dashed lines represent the altitude (∼ 600 m) of the SHT site.
First, it should be noted that we omitted the PM originating from transport outside Shanghai throughout the discussion. However, the seasonal winds induced by the Asian monsoon are quite different in upstream (ocean or land, mostly natural or anthropogenic in background) and could impact much more at SHT than on the surface. We analyzed the transport pathway at the height of 100 and 600 m in each season, using 72 h back trajectory from the HYbrid Single-Particle Lagrangian Integrated Trajectory (HYSPLIT) model. Though the two heights had similar tracks (Fig. S9), the small departures might lead to different source origins. This factor should be explored in future studies. Second, the PBLH is crucial for the vertical structure analysis, and direct observations of the PBLH are needed to give a precise view of the boundary layer processes.
3.1 Overview of PM levels and chemical compositions
3.1.1 PM2.5 and PM1 concentrations
The averaged PM2.5 concentration (Table 1) at SHT during the observation period was 25.5 ± 17.7 µg m−3, about 16.4 % lower than that (30.5 ± 20.7 µg m−3) at SUR. The PM2.5 measurements at SHT were generally consistent with those obtained from sensor-based instruments at the same platform reported by Hao et al. (2022) but only covered the period from June to November of 2019. The averaged PM1 concentration at SHT was 17.3 ± 11.7 µg m−3 (68 % of PM2.5), also lower than reported surface PM1 measurements in Shanghai (e.g., Qiao et al., 2015; G. Q. Zhou et al., 2018). The PM1 PM2.5 ratio at SHT was comparable with those reported by Qiao et al. (2016) and close to 0.69 presented by G. Q. Zhou et al. (2018), suggesting the main contribution of PM1 to PM2.5. R2 between SHT and SUR was 0.61 for hourly PM2.5 concentrations. In contrast, R2 of PM2.5 between PEMC and other surface sites in Pudong district were all higher than 0.89, indicating more significant inhomogeneity of PM distribution in the vertical than in the horizontal direction. The relatively lower R2 in a vertical direction suggests distinct origins, transformations, and fates of PM at the upper PBL which need to be explored.
3.1.2 Chemical compositions
The averaged concentration of NR-PM1 measured by ACSM was 16.4 ± 3.6 µg m−3, which was a little lower than the PM1 concentration from SHARP 5030, indicating small black carbon existence. Among NR-PM1, the averaged concentrations of chemical species were 3.4 ± 2.2 µg m−3 (20.9 %) for SO4, 4.7 ± 5.3 µg m−3 (28.6 %) for NO3, 2.1 ± 1.7 µg m−3 (12.9 %) for NH4, 1.9 ± 1.5 µg m−3 (11.4 %) for POA, 4.0 ± 2.8 µg m−3 (24.6 %) for OOA, and 0.3 ± 0.2 µg m−3 (1.6 %) for Chl. In general, OA, NO3, and SO4 were the first three leading contributors to NR-PM1, consistent with the ACSM measurements at the 260 m Beijing tower (Chen et al., 2015). Similarly to previous surface observations in Shanghai (e.g., Zhu et al., 2021; Zhao et al., 2020a), the OA dominated PM1 with a 35.8 % contribution at SHT in which POA and OOA comprised 31.5 % and 68.5 %, respectively, and the fractions were very close to the 260 m observations (39 % and 61 %) in Beijing (Chen et al., 2015). The NO3 at SHT (28.6 %) had a larger contribution than documented surface measurements (about 1 %–26 %, summarized in Table S1) (Zhao et al., 2020a; Zhu et al., 2021). We found significantly higher NO3 mass fractions in spring and winter at SHT than previous surface studies despite sampling sites, instruments, and years. In summer, the fraction at a rural site (Zhao et al., 2020) was found to be lower but close to this study. According to Cui et al. (2022), the proportion of NO3 was as high as 26.0 % in the late fall of 2018. For a similar period (November) in 2019, the ratio at SHT was 27.2 %. We also gathered surface water-soluble NO3 from Monitor for AeRosols and Gases in ambient Air (MARGA) observations at the PEMC site for the exact same period of this study, further supporting the higher portion of NO3 at SHT. The R2 between NR-PM1 and SHARP PM1 was 0.82, indicating consistency between measurements of ACSM and SHARP 5030. Both NR-PM1 and SHARP PM1 showed a decreasing frequency in mass concentration (Fig. S10), while a positive-skewed distribution was found for PM1 at SUR in a previous study in Shanghai (Zhao et al., 2020a). These results can be attributed to the fact that SHT is far away from emission sources and is influenced by lower PM background concentrations than SUR.
3.1.3 Meteorological elements
The observatory at SHT is close to the top of the PBL; observed air mass was less affected by direct exchange of heat and moisture from the surface. The meteorology at SHT presented lower temperature and less relative humidity (RH) than those at SUR. For example, the mean temperature at SHT was 3–4 ∘C lower than SUR in different seasons. In terms of RH at SHT, it was nearly consistent with that at SUR in summer and fall, while about 5 %–10 % lower in spring and winter. Both temperature and RH at SHT showed consistent seasonal variations with those at SUR.
The differences between the maximum and minimum temperature at SHT were greatest (5.5 ∘C) in spring and smallest (4.1 ∘C) in fall (shown in Table 1). In comparison, the daily ranges of temperature at SUR were greater than SHT in all seasons, with the largest range (8.8 ∘C) in spring and smallest (6.9 ∘C) in summer. As the daily maximum (minimum) temperature always shows around noontime (midnight), greater temperature differences between SHT and SUR were presumed during daytime than those during nighttime. Accordingly, temperature-sensitive particle formations, for example gas-to-particle partitions, were expected to have great differences between two altitudes during the daytime. The daily maximum RH at SHT was lower than SUR in all seasons, yet the daily minimum RH at SHT was higher than SUR. Unlike the temperature, the daily minimum (maximum) RH can always be found during daytime (nighttime). Thus, higher daytime and lower nighttime RH were expected at SHT than those at SUR, leading to higher daytime and lower nighttime chemical productions from potential heterogeneous reactions at SHT.
Table 1The seasonal and annual averaged concentrations of aerosol species (µg m−3) and meteorological parameters. The davg, dmax, and dmin mean the daily average, maximum, and minimum.

3.2 Seasonal changes
3.2.1 Monthly variations of PM2.5 at SHT and SUR
As shown in Fig. 4a, the monthly variations of PM2.5 at SHT and SUR were generally consistent, higher in winter and lower in late summer to early fall. The highest monthly PM2.5 concentrations at SHT (36.9 µg m−3) and SUR (52.6 µg m−3) both took place in January, while the minimums (17.5 µg m−3 for SHT and 18.8 µg m−3 for SUR) appeared in September. The significant monthly change of PM2.5 resulted from the distinct primary emissions (aerosol and its gas precursors), chemical transformation, transports, and diffusions, as well as wet removals in different seasons. In winter, more pronounced transport and much a shallower PBL are conductive to PM2.5 accumulation near the surface, resulting in higher SUR PM2.5 loadings in Shanghai. It is noted that the daytime PBL developments usually carry aerosols from the surface to a high altitude by turbulence, exerting opposite impacts on PM2.5 variations near the surface and at upper altitudes. As a result, local emissions and regional transports were expected to be responsible for the similar patterns of PM2.5 monthly variation at SHT and SUR, rather than PBL changes.
3.2.2 Monthly anomaly of PM2.5 at SHT and SUR
The anomaly was defined as the monthly deviation from the annual average. By calculating the anomaly, we intended to find monthly changes relative to the whole year. The comparison of SHT and SUR PM anomalies allows us to see the consistency of monthly features at two altitudes. For both SHT and SUR, negative PM2.5 anomalies were found in most months because of significant positive anomalies in January and December (Fig. 4b). The PM2.5 concentrations in January and December were 11.6 and 22.2 µg m−3 higher than the annual averages at SHT and SUR, respectively. Therefore, more stringent attention should be paid to PM mitigation during these 2 months. The monthly changes of PM2.5 anomalies presented very similar patterns at SHT and SUR, with the largest positive anomaly in January and the highest negative one in August and September. However, the SHT anomaly oscillated more flatly than SUR, for example, the relative anomaly (PM anomaly divided by yearly averaged value) during December to January (39.7 %) and August to September (−20.2 %) was much lower than those at SUR (62.8 % and −32.2 %). It could be partially explained by weaker influences from surface emissions and air pollutants at higher altitudes, due to nighttime isolations and the shallow PBL in winter discussed in the following section. It was noted that PM2.5 anomalies were opposite in February and October compared with those at SHT and SUR, indicating different leading roles on PM2.5 budgets between the surface and mid-upper PBL.
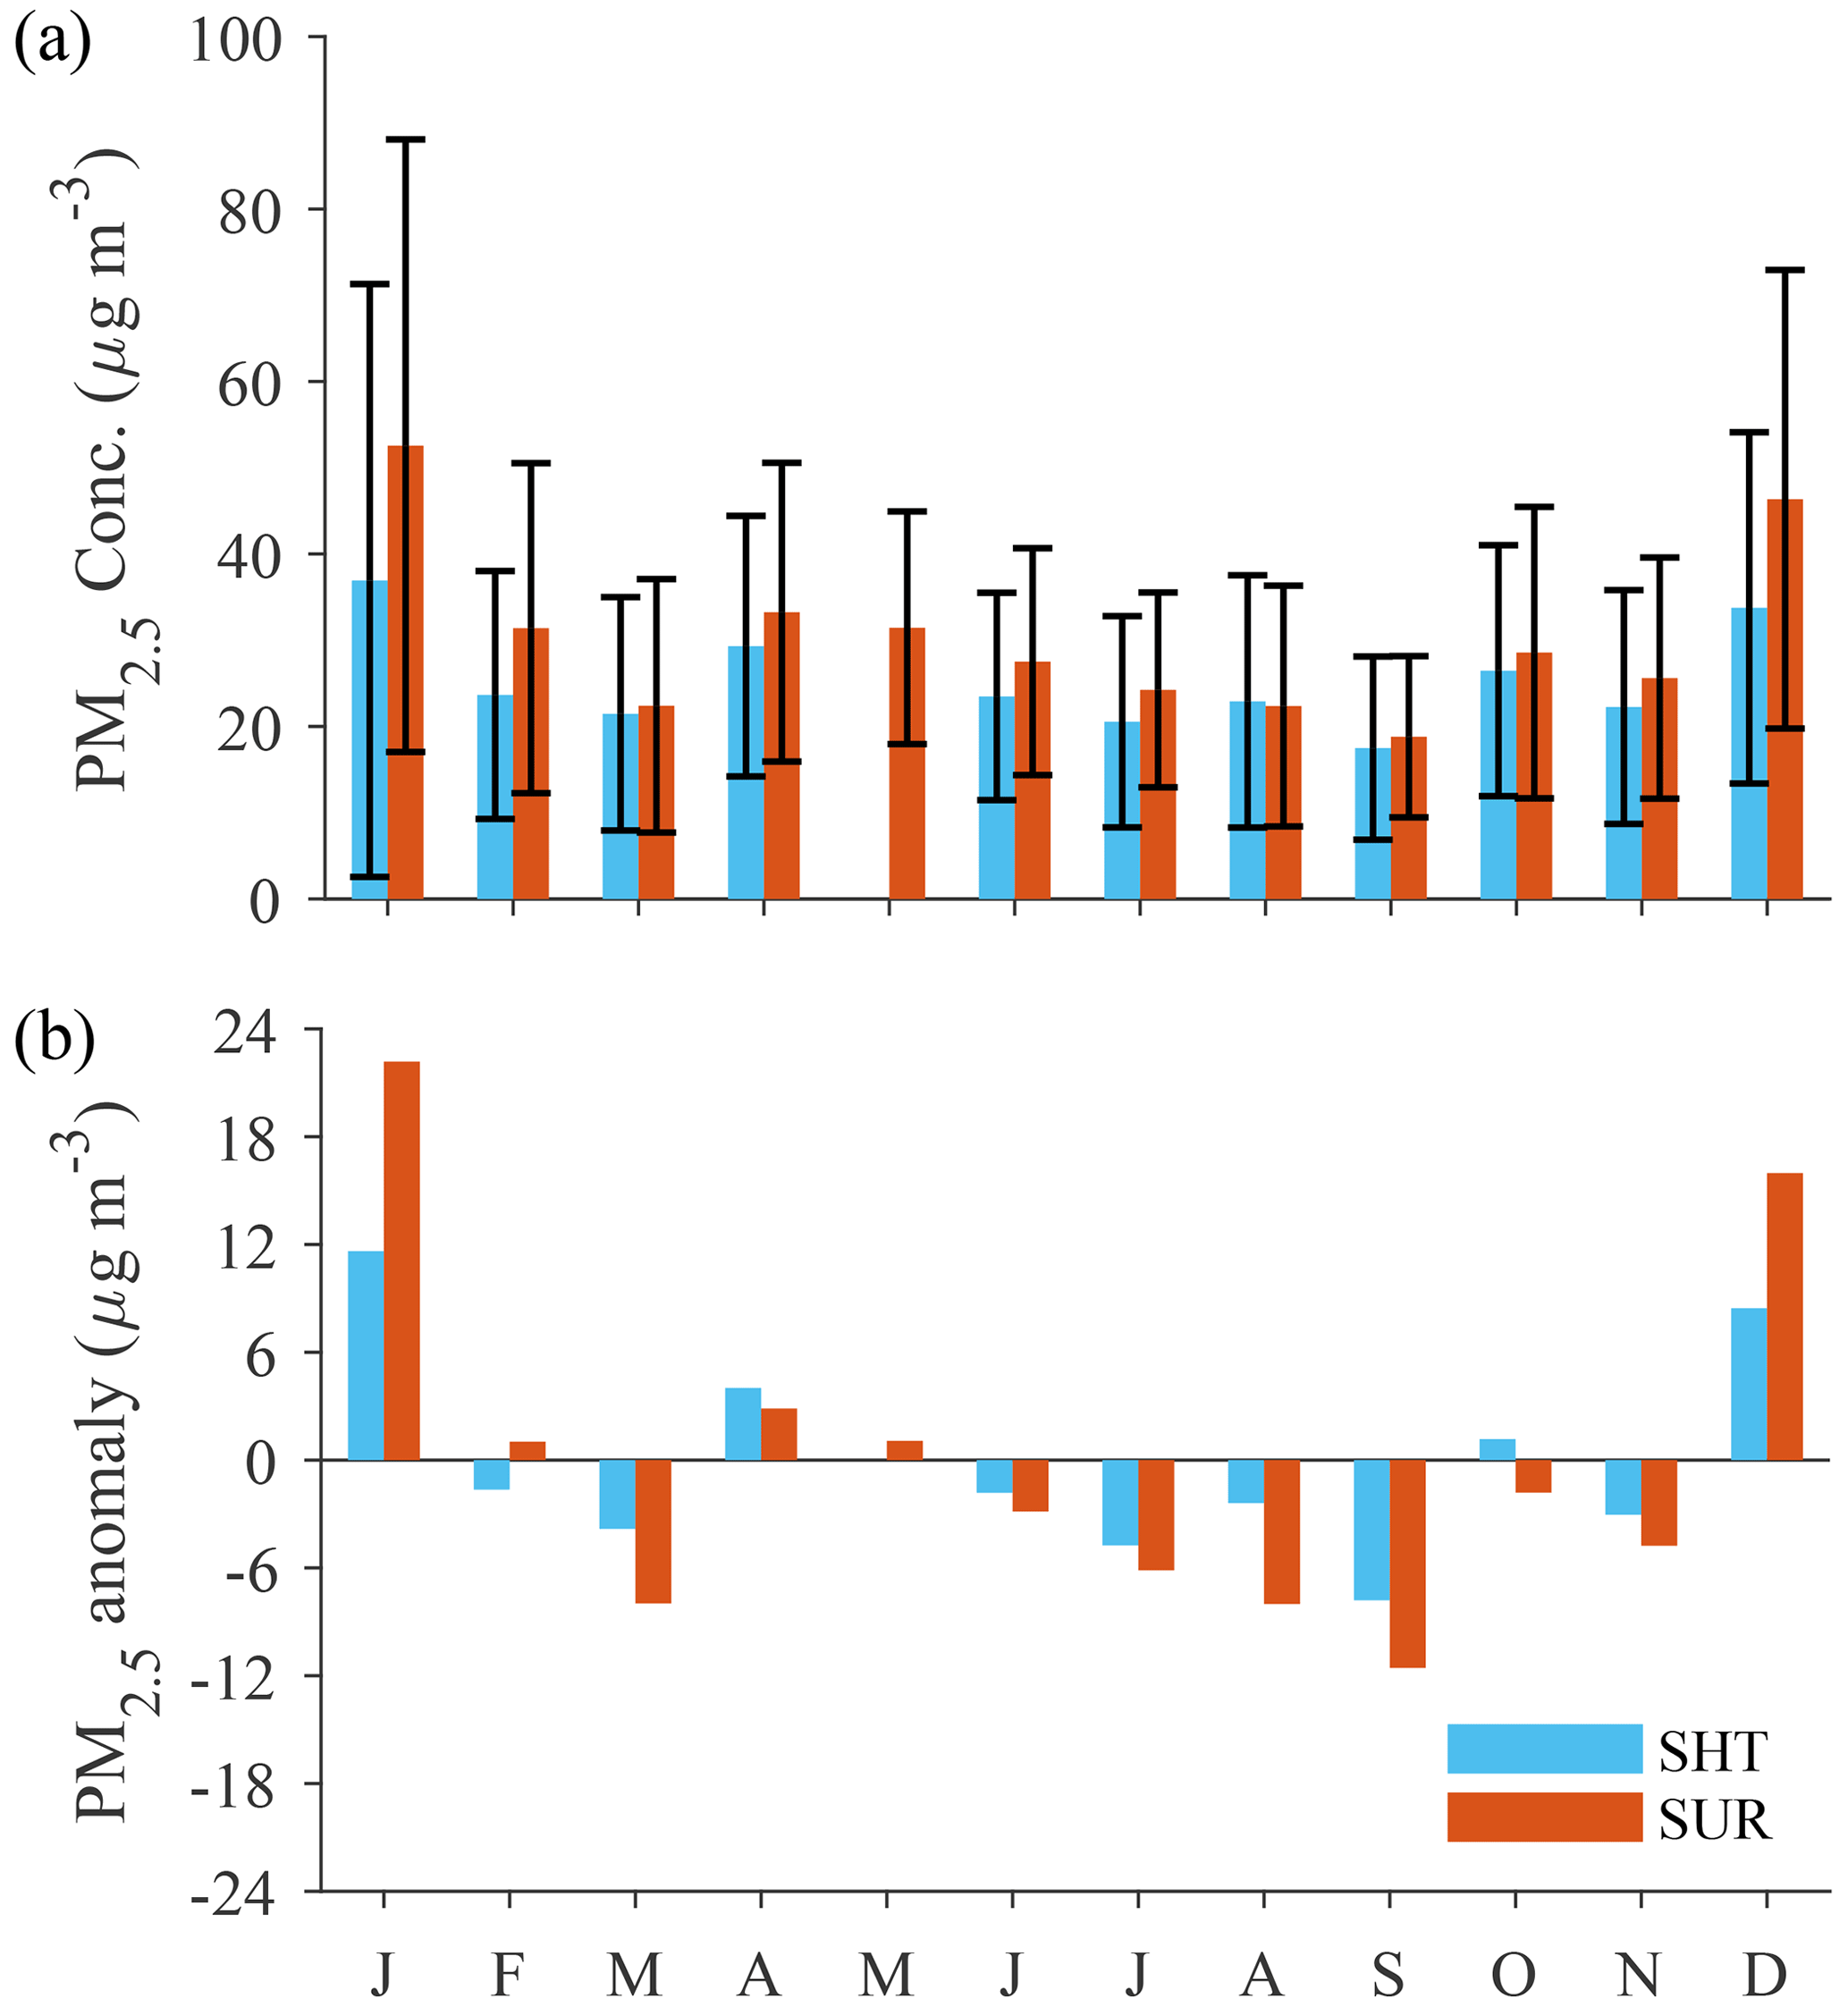
Figure 4Monthly variations of (a) PM2.5 concentrations (µg m−3) at SHT and SUR and (b) PM2.5 anomalies (µg m−3) at SHT and SUR. The monthly averaged PM2.5 in May at SHT is not presented because of low data collection efficiency (36 %).
3.2.3 Relative changes between monthly averaged PM at SHT and SUR
Since lower PM2.5 concentrations were observed at SHT compared with SUR, the relative percentage changes (RPC) ((PM2.5, SHT – PM2.5, SUR) PM %) in Fig. 5 were calculated to quantify their discrepancy. The RPC (Fig. 5a) exhibited the lowest value (−27.2 %) in winter (December, January, and February) and generally consistent values (−8.0 %, −9.2 %, and −9.1 % for spring, summer, and fall) in the other seasons. It was noted that the PM2.5 concentration observed at SHT was slightly higher (2.4 %) than SUR in August. Given that SHT was farther from the direct emission sources than SUR, the PM2.5 at SHT tended to have lower concentrations than SUR as in the other months despite vertical mixing during the daytime. Thus, the higher PM2.5 at SHT in August indicated extra aerosol productions at the mid-upper PBL.
The exchange of air pollutants between SHT and SUR only exists in daytime due to turbulent mixing. Such mixing process between SHT and SUR would terminate at night due to stable stratification. It could be presumed that nighttime PM2.5 observed at SHT (600 m) was independent from that at SUR. Therefore, it is necessary to compare the daytime and nighttime PM2.5 separately for SHT and SUR. In Fig. 5b, nighttime PM2.5 concentrations observed at SHT were consistently lower than at SUR, with RPC ranging from −20 % to −38 %. In addition, nighttime RPC presented very weak monthly variations, suggesting that PM2.5 observed at the height of SHT was mostly isolated from both air pollutants and primary emissions near the surface at night. In comparison, daytime RPC presented strong monthly variabilities. Different from the negative RPCs of daily PM2.5 presented in Fig. 5a, daytime PM2.5 concentrations at SHT were 20 %–40 % higher than those at SUR from June to October. As is known, turbulence induces the vertical mixing of PM2.5 to eliminate the PM2.5 gradient within the entire PBL. Since there are no direct primary sources at SHT, the higher PM2.5 measurements mean additional physical or chemical origins existed at this height. Thus, the daytime RPC modulated the seasonal signature of the total RPC, presenting the lowest RPC in winter and implying the necessity of looking into PM diurnal changes.
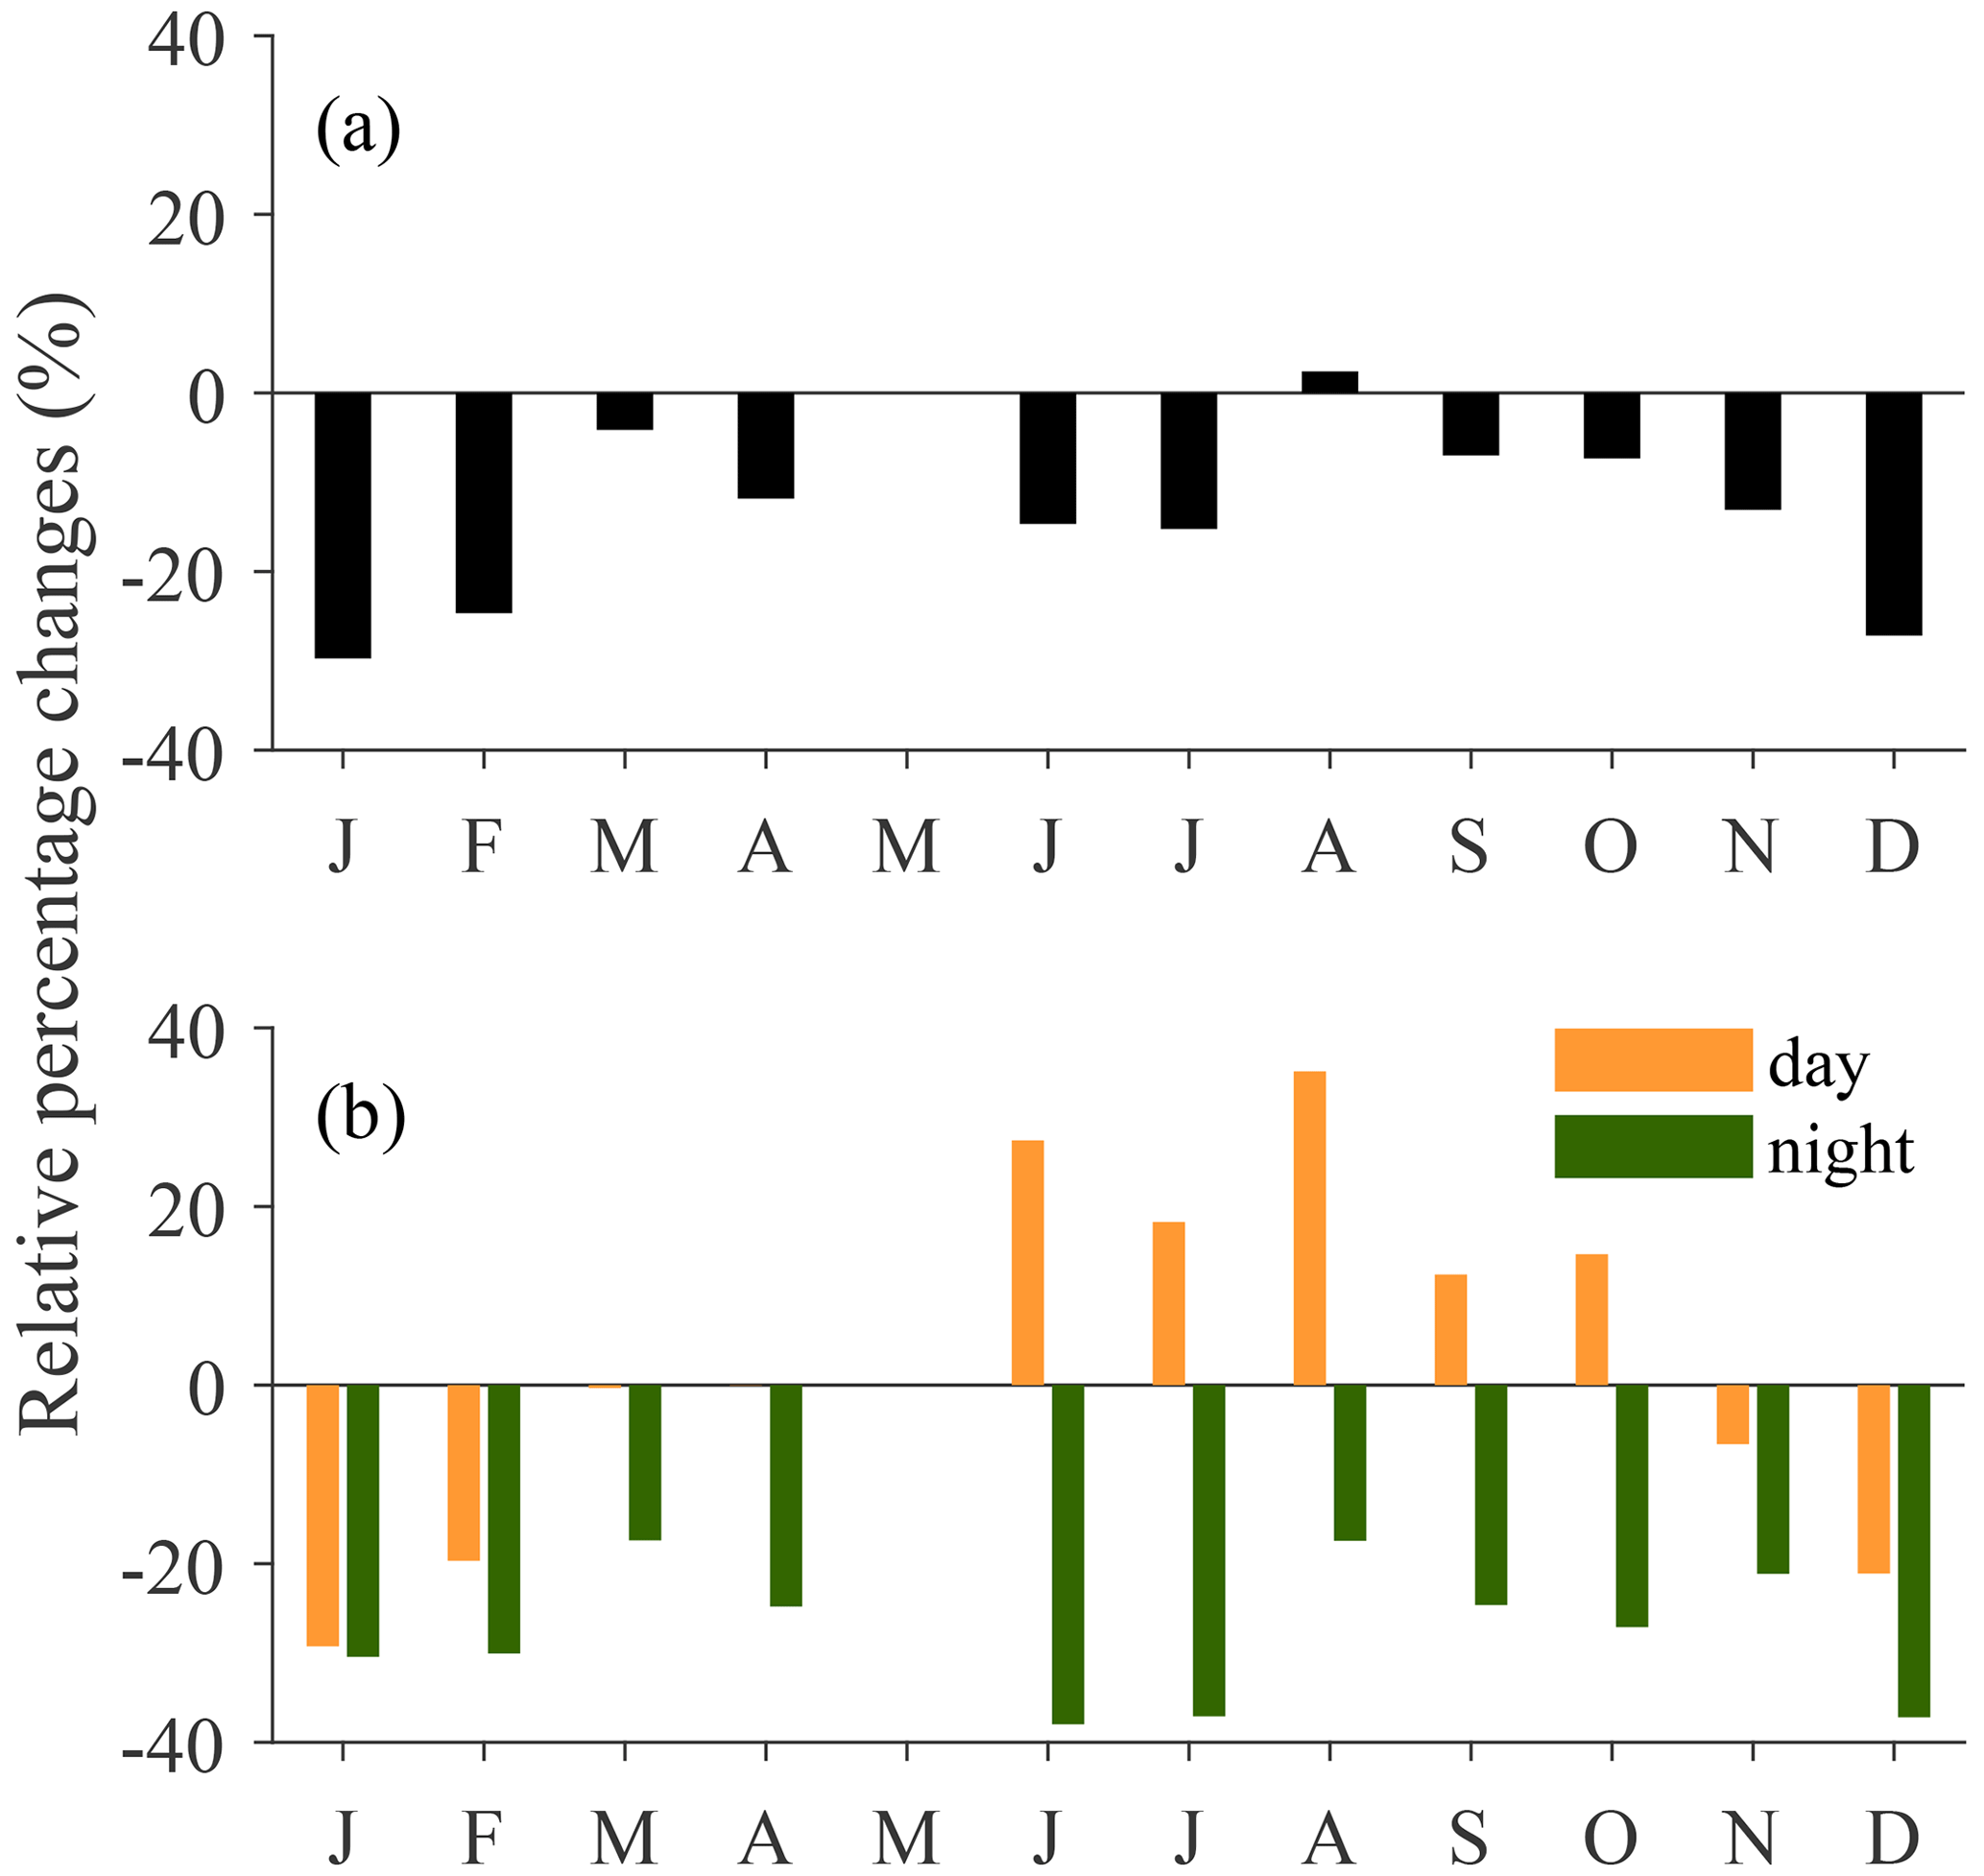
Figure 5Monthly variations of the relative percentage changes (%) between SHT and SUR for (a) all time, (b) daytime (08:00–19:00), and nighttime (20:00–07:00). The relative percentage changes are calculated as (PM2.5, SHT – PM2.5, SUR) PM %.
3.2.4 Monthly variations of chemical species at SHT
As shown in Fig. 6, the NR-PM1 at SHT presented consistent variability and slight departures with SHARP PM1, providing good insight to investigate the seasonal contributions of chemical compositions. OA, NO3, and SO4 were the three leading contributors to NR-PM1 at SHT, accounting for 36 %, 28.6 %, and 20.9 %, respectively. Their proportions in NR-PM1 presented distinct seasonal variations. In general, SO4 and OA occupied higher fractions in summer and lower proportions in winter. For example, SO4 had the largest portion of NR-PM1 at 26.1 % in summer, while the lowest of 17.1 % in winter. OA made up the highest proportion of NR-PM1 at 39.5 % in summer and the lowest of 29.9 % in winter. Both OOA and POA showed consistent seasonal contributions to NR-PM1 with OA. Larger fractions of OOA and SO4 in NR-PM1 exhibited in summer were attributed to relative stronger oxidation capacity and higher moisture conductive to both gas and aqueous transformations, which were also observed by other mass spectrometer studies near the surface (Dai et al., 2019; Hu et al., 2016). Different from OOA, HOA was mainly emitted by vehicles, especially in cold months. Some documents found that HOA dominated the organics in wintertime in Beijing due to enhanced primary emissions from the heating season (Duan et al., 2020; Zhang et al., 2013; Zhou et al., 2019). Zhu et al. (2021) also reported a slight decrease of the HOA fraction in summer than in other seasons in urban Shanghai. In this study, the POA observed at SHT comprised the highest fraction of NR-PM1 and organics at 14.6 % and 35.8 % in summer. In comparison, the ratios were 8.7 % and 28.3 % in winter, indicating that POA transport and the mixing process were significantly inhibited in winter than in summer. It was expected that NO3 presented an opposite seasonal pattern to SO4 and OA. The NO3 contributions were highest (37 %) in winter and lowest (21 %) in summer because of the temperature-dependent gas–particle partition. As for NH4, its seasonal variation was found to be insignificant.
The daytime and nighttime mass fractions were also shown in Fig. 6. As results of vertical mixing, the larger portions of primary species (POA and Chl) during daytime were notable, especially for summer and fall. The changes of OOA, NO3, and NH4 were slight, with an increase of OOA and NH4 but a decrease of NO3 from nighttime to daytime. Accordingly, SO4 saw a lower fraction of NR-PM1 during the daytime. More diurnal features of NR-PM1 can be found in Sect. 3.3.4.

Figure 6The monthly averaged (a) and seasonally averaged (b)–(d) mass fractions (%) of NR-PM1 at SHT. The mass fractions (%) are calculated based on all (b), daytime (c), and nighttime (d) data. The monthly averaged mass concentrations (µg m−3) of NR-PM1 are also shown. The solid and dashed line represent SHARP PM1 and NR-PM1, respectively.
3.3 Diurnal changes
3.3.1 Diurnal variations of PM2.5 at SHT and SUR
The air pollutants observed at the mid-upper PBL have different origins from those near the surface. They are effectively connected in daytime by turbulence, while absolutely isolated at night. As a result, the diurnal variations of air pollutants at the bottom and upper PBL need to be investigated by synergetic observations. In this section, the diurnal characteristics of PM2.5 and chemical compositions at SHT are displayed and compared with SUR to discuss the related dynamical and chemical processes at the mid-upper PBL.
The mean diurnal variations of PM2.5 observed at SHT and SUR are displayed in Fig. 7, exhibiting different patterns in all seasons. The PM2.5 diurnal cycle near the surface has been fully documented by previous studies, driven by primary emission, PBL evolution, and chemical transformation etc. In general, there existed a clear morning peak of PM2.5 concentration around 06:00–07:00 in all seasons, due to substantial air pollutants that were released from rush transportation and that accumulated in the shallow PBL. After sunrise, the PBL gradually developed by turbulence which transported PM2.5 from the surface to a high latitude. As a result, the PM2.5 concentration near the surface decreased until early afternoon, then increased again after sunset due to the depressed PBL and remained stable at night. However, the PM2.5 concentrations observed at SUR presented stable or slight enhancement during the PBL developing period (10:00–15:00) in summer and fall, differing from the clear PM2.5 descent during the same period in spring and winter. Pan et al. (2019) found that the significant PM2.5 enhancement around noontime in summer in downtown Shanghai could be explained by the rapid production of secondary aerosols related to strong photochemistry in summer, offsetting the aerosol loss by vertical mixing.
The PM2.5 diurnal variation observed at SHT presented a similar unimodal pattern in all seasons. Peak PM2.5 concentration was observed around midnoon (12:00) as a result of the rapid increasing of PM2.5 concentrations since early morning and the notable decline in the afternoon. The early morning PM2.5 enhancement at SHT was presumed to be resulted from the PBL development, transporting a higher concentration of aerosols from the surface to the upper layer. Accordingly, PM2.5 reduction at SUR was observed simultaneously in Fig. 7 due to vertical mixing. It was interesting to note that higher PM2.5 at SHT was observed than in SUR around noontime (10:00 to 15:00) in spring, summer, and fall, which could not be attributed to vertical mixing. According to the turbulent theory, materials including heat, moisture, and air pollutants in the PBL are supposed to be mixed homogeneously by vertical mixing. Therefore, when PM2.5 concentrations at SHT exceed that at SUR before noontime in Fig. 7, turbulence would mix the higher loadings of aerosol from the upper PBL to the surface. It could also be demonstrated by more significant PM2.5 anti-correlations between SUR and SHT during the morning to early noontime (06:00 to 10:00) when observed PM2.5 at SHT was lower than SUR. Therefore, there must exist other processes responsible for the higher PM2.5 concentrations that appeared around noontime at SHT. This was also observed by Hao et al. (2022) that the daytime PM2.5 concentration at 585 m was larger than that at 25 m by 10–15 µg m−3. We supposed significant chemical formation of secondary aerosols as the dominant process for the occurrence of greater PM2.5 levels at SHT around noontime, which is discussed in the following section.
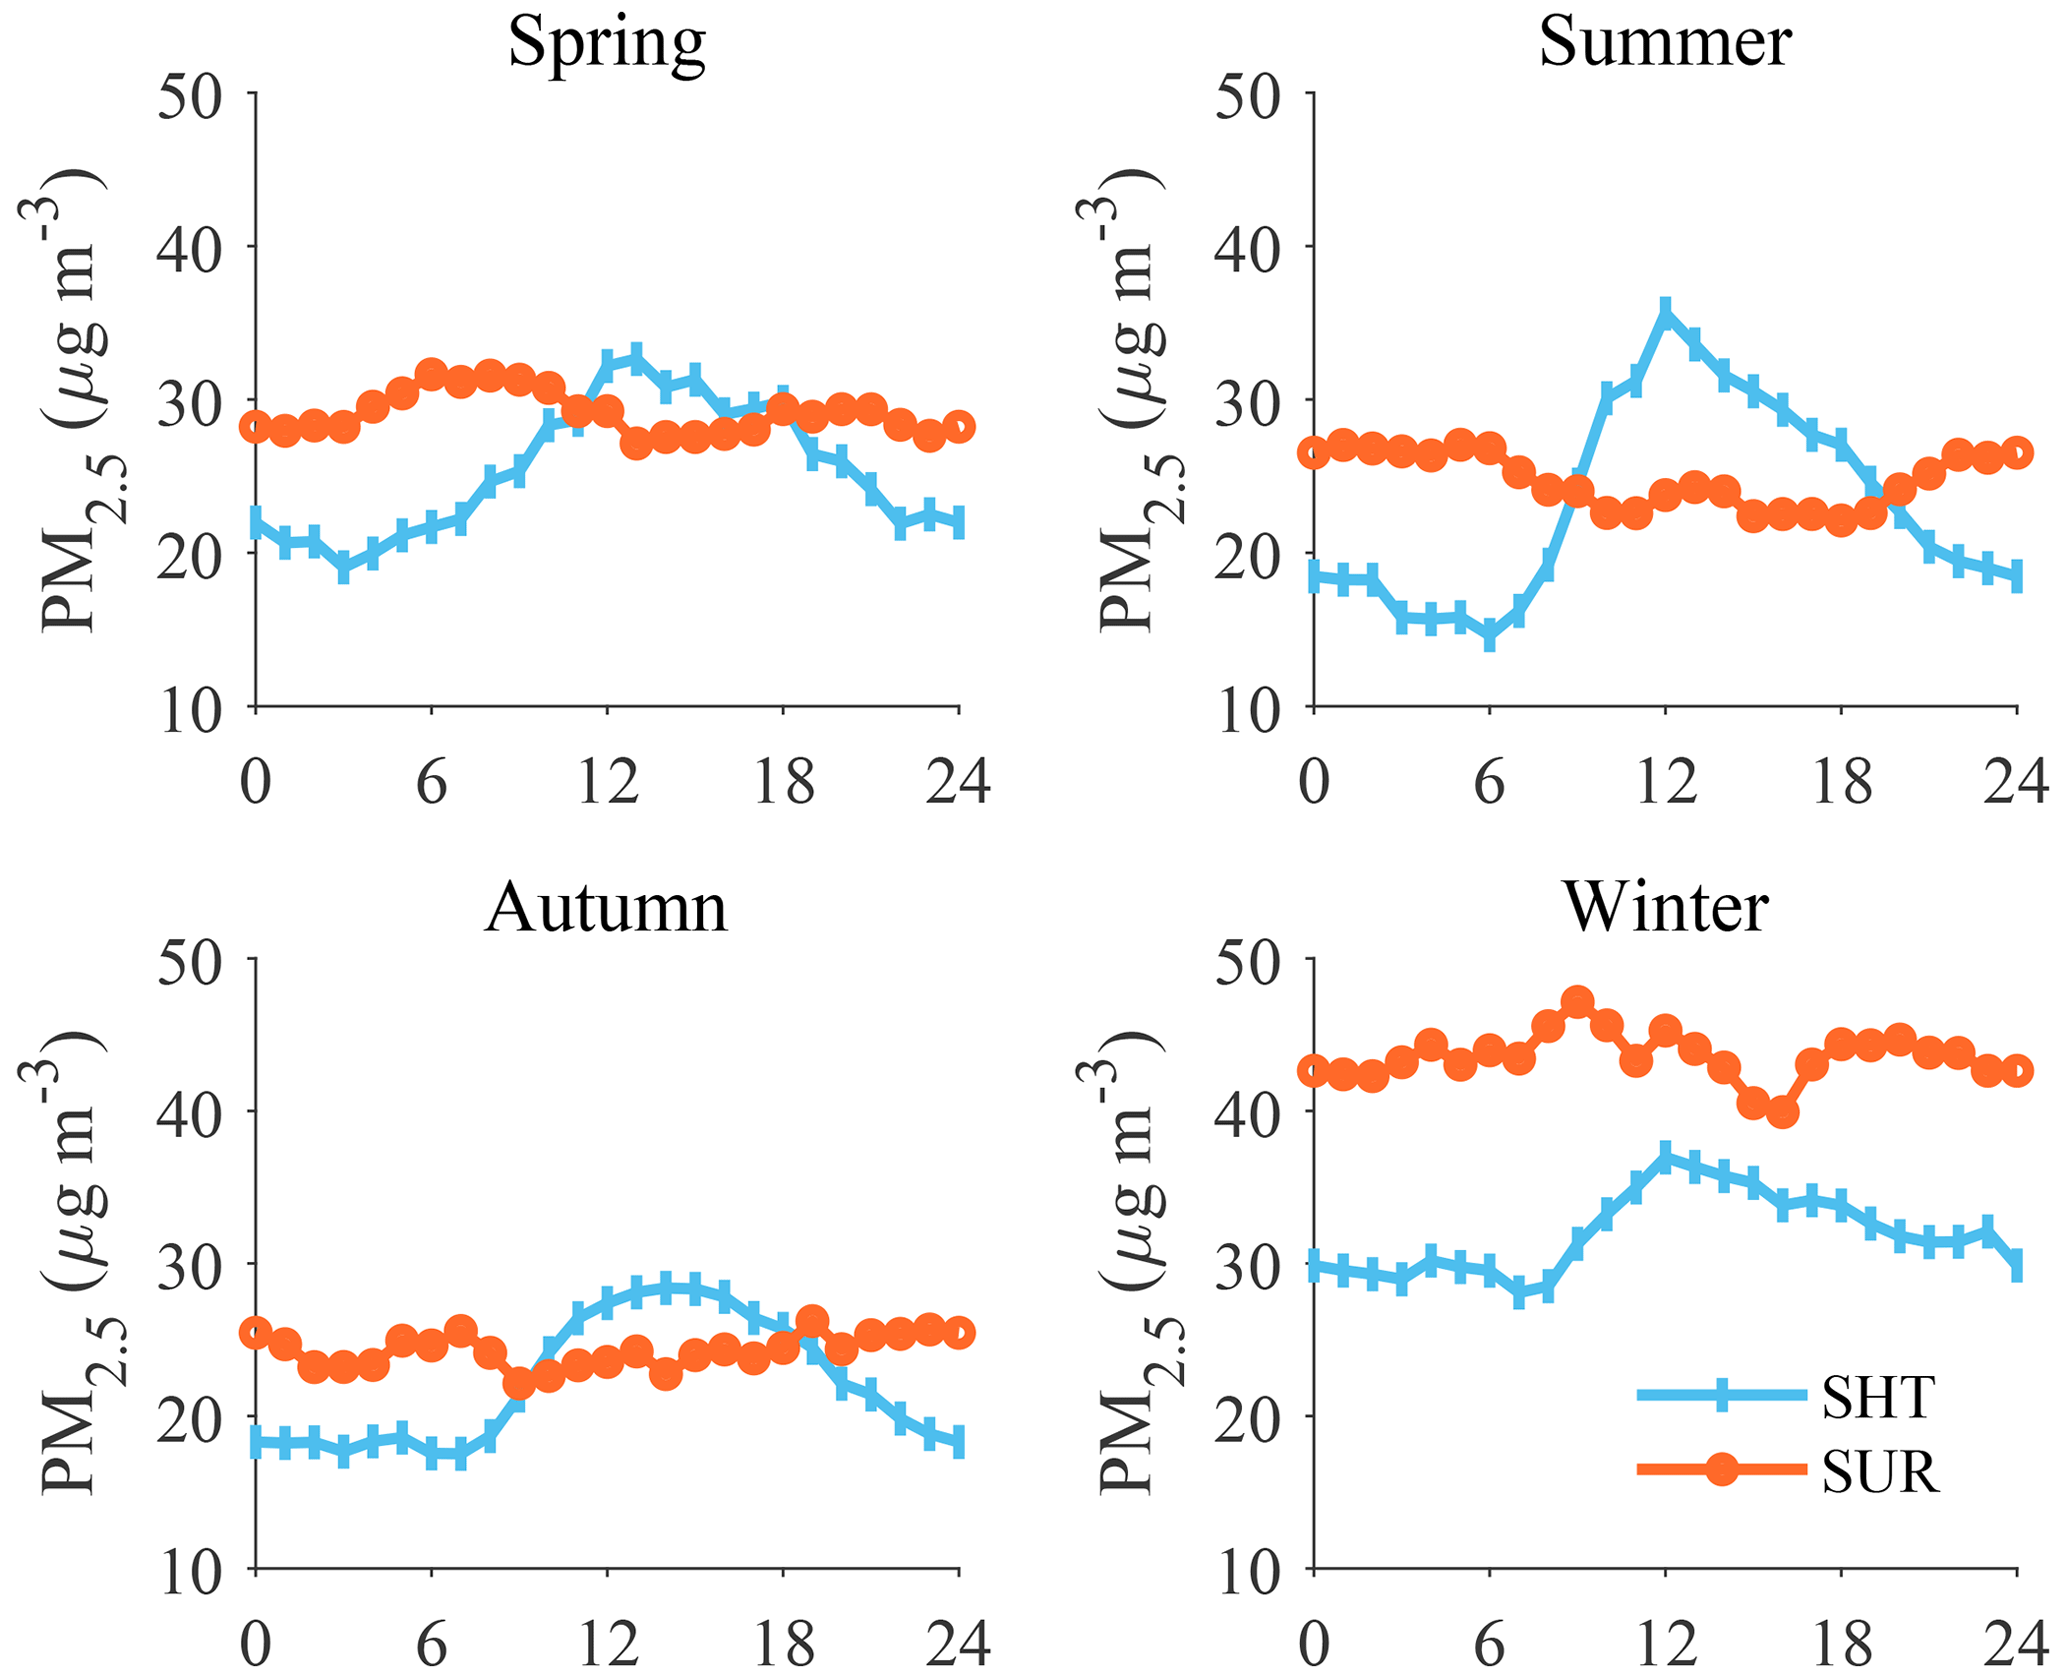
Figure 7Diurnal variations of PM2.5 mass concentrations (µg m−3) at SHT and SUR in four seasons.
3.3.2 Discussion on the daytime aerosol production at SHT
As shown in Fig. 7, the peak PM2.5 concentration at SHT was highest (∼ 40 µg m−3) in summer; it could not originate from air pollutants near the surface by vertical mixing, because the PM2.5 at SUR was relatively lower in summer. In addition, the PM2.5 at SHT presented a significant increasing rate even after its exceedance to SUR around 10:00, indicating that there must exist remarkable origins of aerosols at SHT, especially in summer. Therefore, chemical transformation from both gas and aqueous pathways were presumed to be the major process for promoting the aerosol productions at SHT, resulting in the significant peak PM2.5 concentration.
Chemical production of aerosol in daytime is mainly driven by gas-phase and aqueous-phase transformations from the gas precursors, including SO2, NO2, and VOCs. We further compared the gas species observed at SHT and SUR in Fig. 8. It was found that SO2 concentrations were low (<4 ppb) at both SHT and SUR, and SO2 concentrations at SUR was about 2 times higher than at SHT. A slight increase (2.1 %–19.2 %) of SO2 at SHT during 08:00–12:00 could be found in four seasons. Similar to SO2, lower NO2 was observed at SHT than at SUR. However, NO2 was found well mixed around noontime in all seasons. NO2 at SHT in different seasons rose by 21.8 %–61.4 % from 08:00 to 12:00 when NO2 was reduced at ground level, indicating the effects of vertical mixing. Therefore, the secondary formation of inorganic aerosols could be expected at SHT with adequate gas precursors.

Figure 8Diurnal variations of SO2 (ppb) and NO2 (ppb) observed at SHT (blue line) and SUR (black line) in four seasons and the entire observation period. The line stands for mean value. The shaded area represents the standard deviation.
Both gas and the aqueous formation of secondary aerosols in daytime are greatly determined by atmospheric oxidants, such as OH, H2O2 radicals, and O3, in which OH is produced from the photodissociation of O3 (clean atmosphere) or 2O2 (polluted atmosphere) in the troposphere so that solar radiation is vital for OH production. Apparently, stronger solar radiation could be expected at SHT than in the near surface due to the shorter optical range of sunlight and hardly any attenuation from buildings or vegetation, providing excellent photolysis capacity for OH production. We further examined the diurnal variations of the sulfur oxidation ratio (SOR) and nitrogen oxidation ratio (NOR) at SHT in different seasons in Fig. 9. The SOR and NOR are indicators of the secondary formation of SO4 and NO3 (Zhang et al., 2020). The SOR and NOR are calculated as [SO4]([SO4]+[SO2]) and [NO3]([NO3]+[NO2]), respectively. [x] stands for the molar concentration of x. The SOR in summer (0.51) was significantly higher than in the other seasons (0.36). The diurnal cycle of SOR was similar in each season, with the highest SOR appearing around 19:00, when RH reached the peak of the day (Fig. 10). However, the diurnal variations of NOR were not reproducible between the seasons and not as straightforward to interpret as those of SOR. The NOR in spring and winter (0.15) was about 1.6 times larger than in summer and autumn (0.09). In addition, the NOR did not see a notable decrease from 08:00 to 12:00, when NO2 increased significantly, indicating that NO3 formation at SHT was evident but not necessarily more efficient than at SUR.

As is discussed in Fig. 6, OOA, NO3, and SO4 are the major species in NR-PM1. Their production and variation are closely related to meteorology, especially temperature and RH. For example, lower temperature was favorable for the production of NO3 and some semi-volatile species in OA, whereas higher RH played important roles in the aqueous pathway of SO4 formation. Recent studies have also reported significant production of low-volatile OA by aqueous-phase reactions (Chen et al., 2021). Considering the importance of meteorology, the diurnal variation of temperature and RH at SHT were displayed in Fig. 10 and compared with that of SUR. In general, the SHT RH was found to be higher than at SUR from 09:00 to 19:00 in all seasons. Therefore, the SHT atmosphere provided better conditions for the aqueous-phase production of secondary aerosols during daytime. Similar to RH, the diurnal changes of air temperature were more visible for SUR. Overall, the temperature at SHT was 4.4 ∘C lower than at SUR during daytime, compared with 2.1 ∘C during nighttime. Furthermore, PM differences between SHT and SUR were found keen to both temperature and RH differences (Fig. S11). On the one hand, the lower temperature at SHT might correspond to a stronger vertical temperature gradient, promoting vertical mixing of PM. Additionally, the lower temperature was favorable for the partition of NO3 and semi-volatile organic species to particles.
According to the above discussions, we suggest that the gas precursors, atmospheric oxidants, and meteorology observed at SHT were all appropriate for aerosol formations through gas and aqueous pathways. As a result, the efficient production of secondary aerosols could be expected at SHT in daytime, leading to the higher PM2.5 concentration than in SUR.
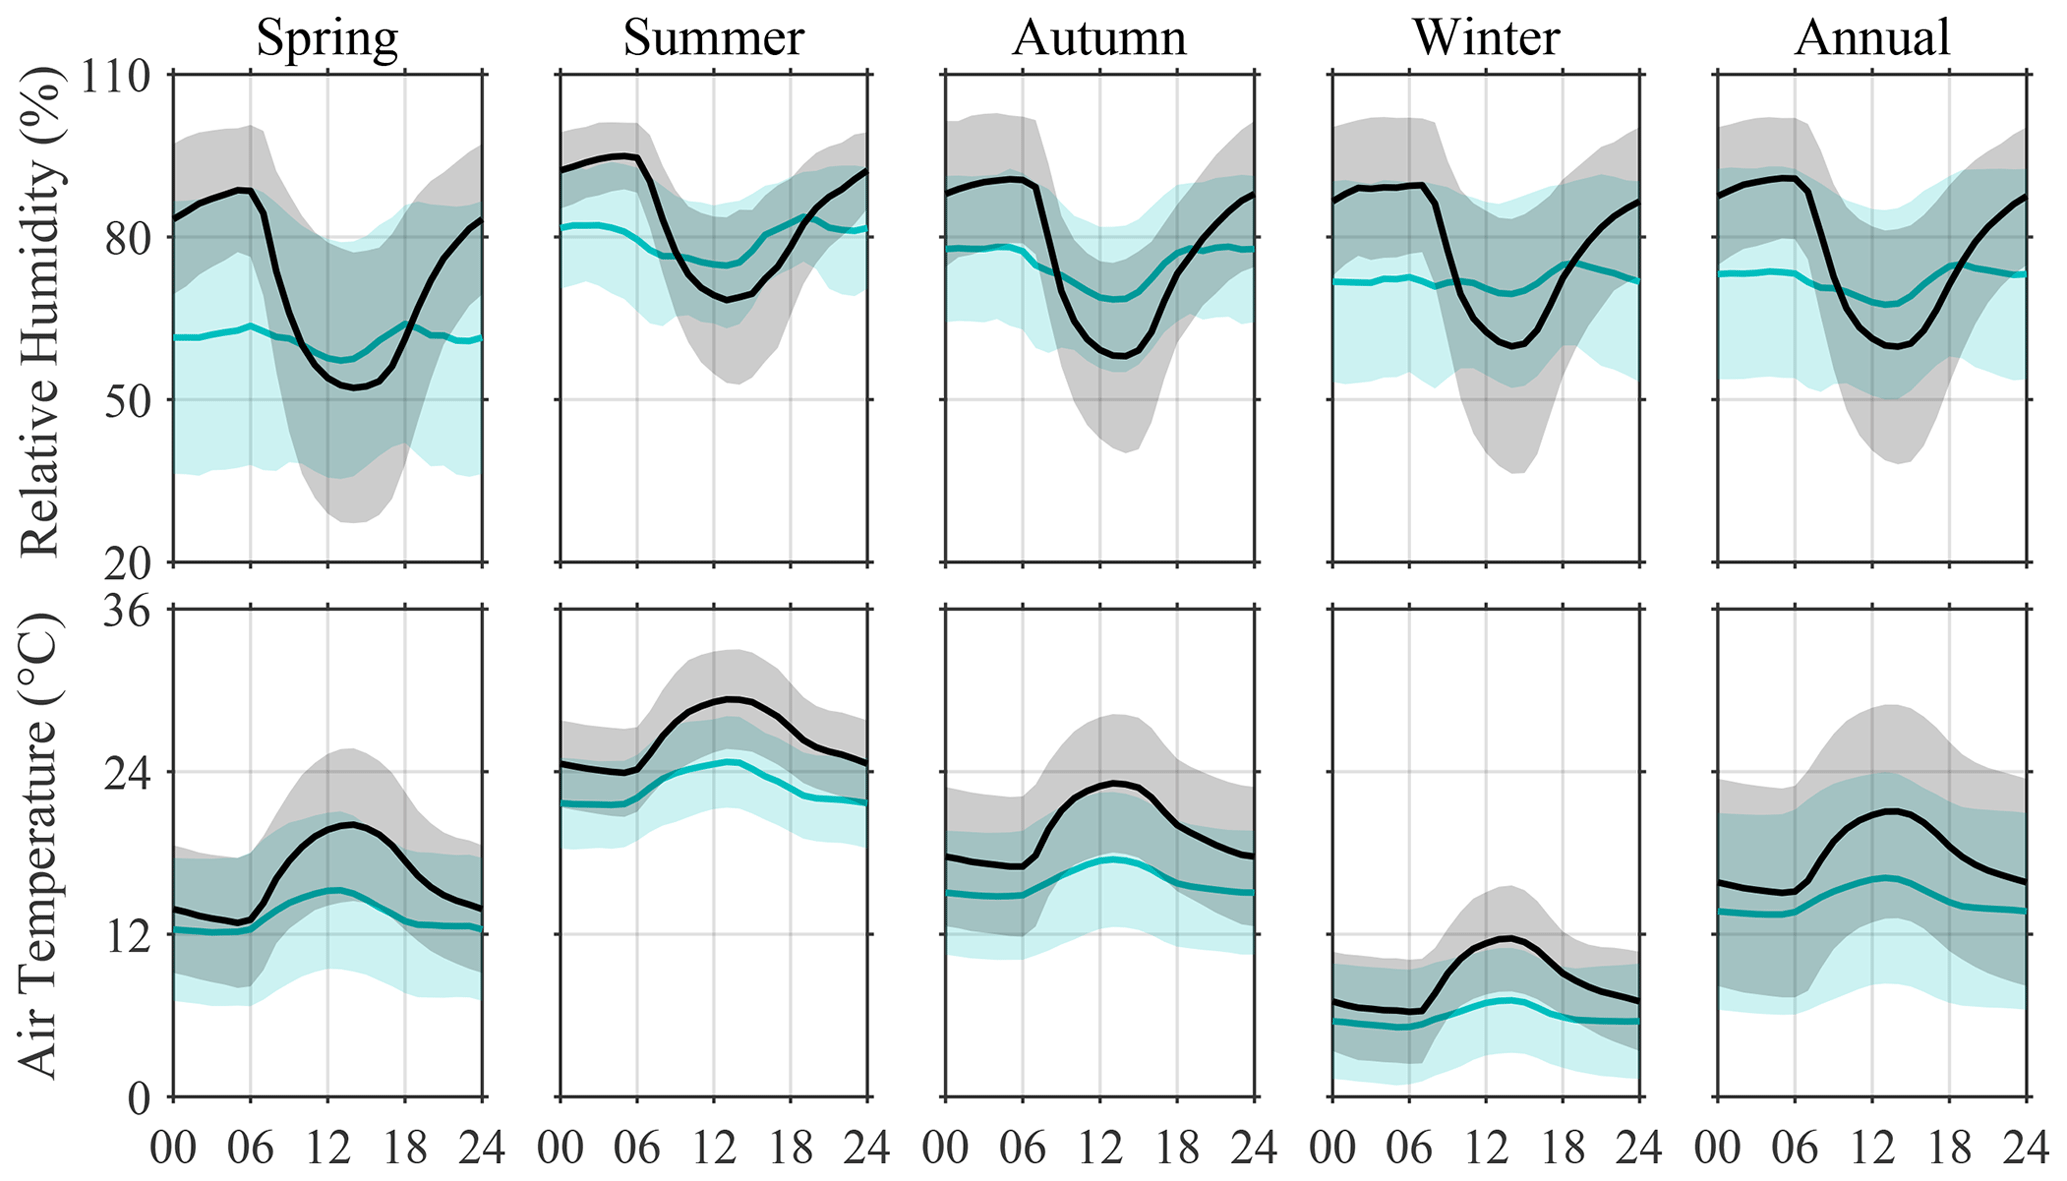
Figure 10The same as Fig. 8 but for relative humidity (%, upper panel) and air temperature (∘C, lower panel).
3.3.3 Relative amplitudes of PM at SHT and SUR
Besides a diurnal tendency, the diurnal amplitude of PM2.5 variations also presented clear distinctions between SHT and SUR. We introduced (Cmax- % to estimate the relative amplitudes (Ramps) of atmospheric species. Cmax, Cmin, and Cmean represent the maximum, minimum, and average of diurnal concentrations. The Ramps of PM2.5 at SUR were 15.5 %, 20.0 %, 16.9 %, and 16.6 % in spring, summer, fall, and winter, while those at SHT were 53.4 %, 89.9 %, 48.9 %, and 27.7 %, respectively. Apparently, the diurnal PM2.5 at SHT exhibited much larger Ramps than at SUR, indicating a more significant amplitude. This was because nighttime PM2.5 at SHT was much lower by isolating the site from the surface. As a result, the nighttime PM2.5 at SHT was 30 %–40 % lower than that at SUR. In the daytime, the PM2.5 departures between SHT and SUR were greatly narrowed to 10 %–20 % due to turbulent mixing. In addition, chemical production still played important roles in higher Ramps at SHT. It could be demonstrated by the fact that the highest Ramps happened in summer at SHT due to the significant production of aerosols in daytime. In winter, the PM2.5 enhancement during late morning to noontime was still observed at SHT but with weaker amplitude than those in other seasons. Since the PM2.5 concentration at SHT during this period was continuously lower than at SUR, vertical mixing made positive contributions to the PM2.5 concentration at SHT. It was supposed that the chemical production of aerosols at SHT was significantly inhibited due to weak solar radiation and few precursors from vertical mixing in winter except for NO3. While the mean PM2.5 level was still the highest in winter (Fig. 7), resulted from the greater nighttime PM2.5 level of 30 µg m−3, which was significantly higher than those in other seasons (15–20 µg m−3).
3.3.4 Diurnal variation of chemical compositions at SHT
The diurnal variations of chemical species at SHT were further examined in Fig. 11. The major species, such as NO3, SO4, and OOA exhibited a unimodal pattern similar as PM2.5, with the peak concentration appearing around noontime. These were different from the 260 m observations at Beijing reported by Chen et al. (2015); their peak concentrations of secondary species usually appeared at 20:00, indicating the distinct controlling process for the PM2.5 diurnal variation between the lower and upper PBL. The pronounced increasing rate of NO3 and OOA was observed during early morning (∼ 08:00) to midnoon (∼ 12:00) in spring, summer, and fall. For example, the increasing rates were estimated as 0.39 µg m−3 h−1 (9.3 % h−1) and 0.29 µg m−3 h−1 (8.5 % h−1) for NO3 and OOA, respectively, further demonstrating the significant chemical productions at SHT. NO3 presented significantly larger levels in winter and spring compared with other species. Both daytime and nighttime NO3 accounted for the largest fractions of NR-PM1 at 36 % in winter and 30 % in spring. Zang et al. (2022) suggested that both heterogeneous hydrolysis of dinitrogen pentoxide (N2O5) and the gas-phase OH oxidation of NO2 were important pathways for nitrate formation in Shanghai. It was noted that nighttime NO3 in winter was extremely high, up to 6–7 µg m−3, and even exceeded the daytime peak concentration in other seasons, indicating the most efficient heterogeneous production was on winter nights. In addition, the increasing NO3 rate in winter mornings was estimated as 0.42 µg m−3 h−1, significantly higher than other species. It was attributed to the synergetic impacts of lower temperature favorable for the gas-to-aerosol partition and higher NO2 concentration promoting gas-phase HNO3 productions. The enhanced level of NO3 with an altitude in the PBL was also reported by other studies (W. Zhou et al., 2018). OOA presented the most significant diurnal variability in summer, suggesting that OOA formation was more sensitive to atmospheric oxidation. SO4 formation in daytime is mainly driven by aqueous reactions. Therefore, higher SO4 at SHT in summer was expected from plenty moisture and strong solar radiation accelerating its aqueous transformation, despite the low SO2 level, favorable diffusion, and wet scavenging conditions of the atmosphere in summer. However, SO4 presented lower diurnal variabilities in all seasons compared with NO3 and OOA. In general, distinct mass fractions of increased PM1 (during 08:00–12:00) were observed with great contributions from NO3 and organics in spring (80.9 %), summer (85.4 %), and fall (83.0 %). The notable differences of mass fractions between SHT and previously documented surface measurements indicate that the increased PM1 at SHT were combined results of strong chemical production, as well as vertical mixing.
The diurnal Ramps of chemical species in the NR-PM1 were further estimated. It was clear that POA had the most significant diurnal amplitude, with Ramps of 89.1 %, 112.1 %, 99.0 %, and 59.4 % in spring, summer, fall, and winter, respectively. Similarly, another primary species, Chl, also had comparable Ramps of 95.8 %, 102.0 %, 58.7 %, and 66.4 % in each season, suggesting the dominant impact of turbulence on the diurnal variations of primary species. In comparison, the secondary species exhibited much lower diurnal Ramps, with 49.7 % for NO3, 41.9 % for OOA, 34.2 % for NH4, and 17.5 % for SO4. The larger Ramps of primary species at SHT could be well understood; their nighttime concentrations were very low due to the isolation from surface emissions, while in daytime the concentrations increased due to vertical mixing. In comparison, the Ramps reduction of secondary species mostly resulted from the chemical formations at night. The pronounced formation of secondary aerosols through heterogeneous pathways at night has been widely observed near the surface by many studies. A recent study by Zang et al. (2022) reported that heterogeneous pathways accounted for 68 % of NO3 production in winter in Shanghai. It could be found in Fig. 11 that the nighttime concentrations of secondary species were significantly higher than primary ones in nearly all seasons, suggesting that there also existed active heterogeneous formation of aerosols at night at the upper PBL level except in summer.
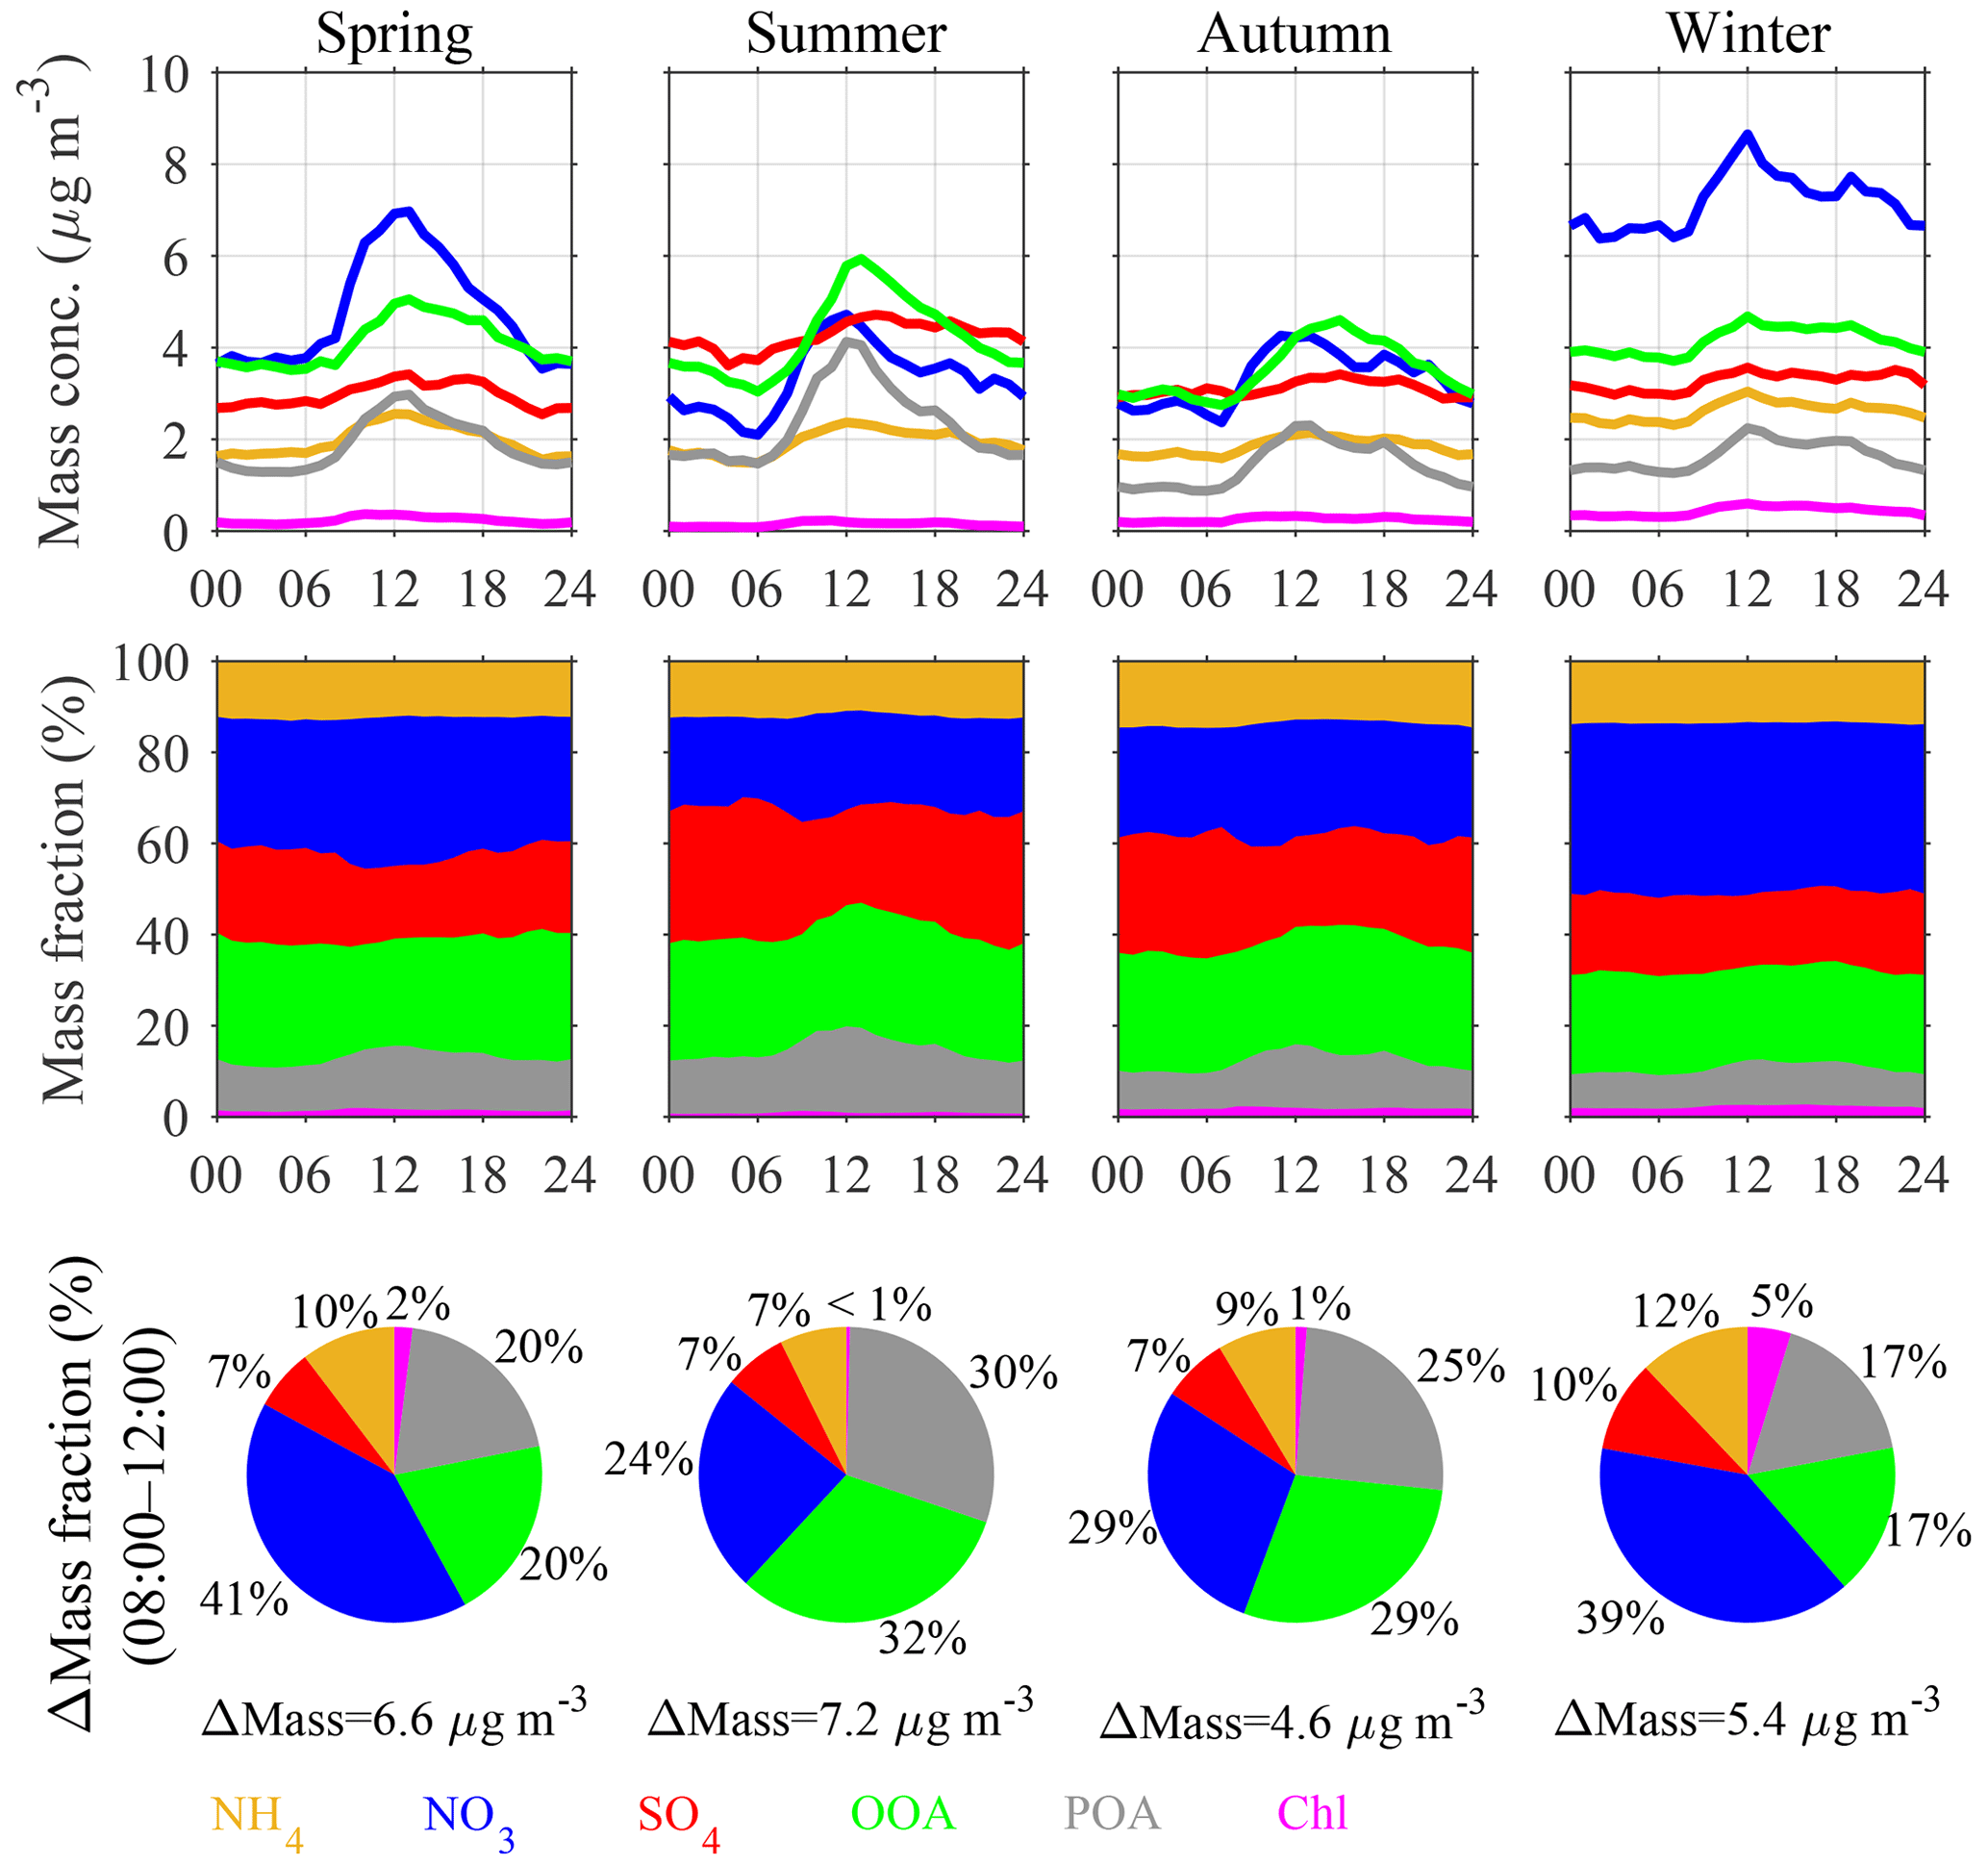
Figure 11Diurnal variations of NR-PM1 mass concentration (µg m−3) (upper panel) and mass fraction (%) (middle panel) at SHT in four seasons. Mass fractions (%) of increased NR-PM1 during 08:00–12:00 (lower panel) in four seasons.
This study presents a 1-year continuous observation of the fine PM mass concentrations and chemical compositions at the top of the 632 m high Shanghai Tower from 17 April 2019 to 16 April 2020. The results show that the SHT PM2.5 concentration was 16.3 % lower than at SUR during the entire observation period. Through investigating the diurnal changes, we found uniformly lower nighttime PM2.5 at SHT as a result of isolations from surface emission. However, the daytime PM2.5 presented significant monthly changes with unexpected higher concentrations than at SUR from June to October. Other than surface, the SHT PM exhibited a consistent unimodal diurnal change in four seasons, with a rapid increase of PM mass concentration starting from late morning and a peak in the early afternoon. Combining the adequate precursors and lower temperature at SHT during daytime, we suggest strong chemical production of secondary species from both photochemical reactions and gas-to-particle partitioning at the mid-upper PBL. Moreover, the averaged mass fraction of increased PM (during 08:00–12:00) at SHT revealed notably high proportions of NO3 and organics, further demonstrating the contributions from chemical production, as well as vertical mixing. In addition, we found high NO3 concentrations at SHT for both daytime and nighttime in winter, implying efficient gas-phase and heterogeneous formation.
Hourly data used in this study are deposited at the National Earth Observation Data Center (https://chinageoss.cn/datasharing/datasetDetails/630094ef42544e709be88207, last access: 27 November 2022; Yin, 2022), which provides open access to its data. Raw data of the ACSM are archived at the Shanghai Key Laboratory of Meteorology and Health and are available on request by contacting the corresponding author.
The supplement related to this article is available online at: https://doi.org/10.5194/acp-23-1329-2023-supplement.
JX designed the experiments and the research. CY, LP, WG, YG, QF, and FY provided experimental assistance and the analytical method. CY and JX analyzed the data and performed research. All authors commented on the manuscript.
The contact author has declared that none of the authors has any competing interests.
Publisher’s note: Copernicus Publications remains neutral with regard to jurisdictional claims in published maps and institutional affiliations.
This research has been supported by the Natural Science Foundation of Shanghai (grant no. 22ZR1467500) and the National Natural Science Foundation of China (grant no. 41605105).
This paper was edited by Eleanor Browne and reviewed by two anonymous referees.
Aldhaif, A. M., Stahl, C., Braun, R. A., Moghaddam, M. A., Shingler, T., Crosbie, E., Sawamura, P., Dadashazar, H., Ziemba, L., Jimenez, J. L., Campuzano-Jost, P., and Sorooshian, A.: Characterization of the Real Part of Dry Aerosol Refractive Index Over North America From the Surface to 12 km, J. Geophys. Res.-Atmos., 123, 8283–8300, https://doi.org/10.1029/2018jd028504, 2018.
Bahreini, R., Jimenez, J. L., Wang, J., Flagan, R. C., Seinfeld, J. H., Jayne, J. T., and Worsnop, D. R.: Aircraft-based aerosol size and composition measurements during ACE-Asia using an Aerodyne aerosol mass spectrometer, J. Geophys. Res.-Atmos., 108, 8645, https://doi.org/10.1029/2002jd003226, 2003.
Brooks, J., Allan, J. D., Williams, P. I., Liu, D., Fox, C., Haywood, J., Langridge, J. M., Highwood, E. J., Kompalli, S. K., O'Sullivan, D., Babu, S. S., Satheesh, S. K., Turner, A. G., and Coe, H.: Vertical and horizontal distribution of submicron aerosol chemical composition and physical characteristics across northern India during pre-monsoon and monsoon seasons, Atmos. Chem. Phys., 19, 5615–5634, https://doi.org/10.5194/acp-19-5615-2019, 2019.
Brown, S. S., Dubé, W. P., Bahreini, R., Middlebrook, A. M., Brock, C. A., Warneke, C., de Gouw, J. A., Washenfelder, R. A., Atlas, E., Peischl, J., Ryerson, T. B., Holloway, J. S., Schwarz, J. P., Spackman, R., Trainer, M., Parrish, D. D., Fehshenfeld, F. C., and Ravishankara, A. R.: Biogenic VOC oxidation and organic aerosol formation in an urban nocturnal boundary layer: aircraft vertical profiles in Houston, TX, Atmos. Chem. Phys., 13, 11317–11337, https://doi.org/10.5194/acp-13-11317-2013, 2013.
Canagaratna, M. R., Jayne, J. T., Jimenez, J. L., Allan, J. D., Alfarra, M. R., Zhang, Q., Onasch, T. B., Drewnick, F., Coe, H., Middlebrook, A., Delia, A., Williams, L. R., Trimborn, A. M., Northway, M. J., DeCarlo, P. F., Kolb, C. E., Davidovits, P., and Worsnop, D. R.: Chemical and microphysical characterization of ambient aerosols with the aerodyne aerosol mass spectrometer, Mass Spectrom. Rev., 26, 185–222, https://doi.org/10.1002/mas.20115, 2007.
Canonaco, F., Crippa, M., Slowik, J. G., Baltensperger, U., and Prévôt, A. S. H.: SoFi, an IGOR-based interface for the efficient use of the generalized multilinear engine (ME-2) for the source apportionment: ME-2 application to aerosol mass spectrometer data, Atmos. Meas. Tech., 6, 3649–3661, https://doi.org/10.5194/amt-6-3649-2013, 2013.
Chen, C., Sun, Y. L., Xu, W. Q., Du, W., Zhou, L. B., Han, T. T., Wang, Q. Q., Fu, P. Q., Wang, Z. F., Gao, Z. Q., Zhang, Q., and Worsnop, D. R.: Characteristics and sources of submicron aerosols above the urban canopy (260 m) in Beijing, China, during the 2014 APEC summit, Atmos. Chem. Phys., 15, 12879–12895, https://doi.org/10.5194/acp-15-12879-2015, 2015.
Chen, C. R., Zhang, H. X., Yan, W. J., Wu, N. A., Zhang, Q., and He, K. B.: Aerosol water content enhancement leads to changes in the major formation mechanisms of nitrate and secondary organic aerosols in winter over the North China Plain, Environ. Pollut., 287, 117625, https://doi.org/10.1016/j.envpol.2021.117625, 2021.
Cui, S., Huang, D. D., Wu, Y., Wang, J., Shen, F., Xian, J., Zhang, Y., Wang, H., Huang, C., Liao, H., and Ge, X.: Chemical properties, sources and size-resolved hygroscopicity of submicron black-carbon-containing aerosols in urban Shanghai, Atmos. Chem. Phys., 22, 8073–8096, https://doi.org/10.5194/acp-22-8073-2022, 2022.
Dai, Q., Schulze, B. C., Bi, X., Bui, A. A. T., Guo, F., Wallace, H. W., Sanchez, N. P., Flynn, J. H., Lefer, B. L., Feng, Y., and Griffin, R. J.: Seasonal differences in formation processes of oxidized organic aerosol near Houston, TX, Atmos. Chem. Phys., 19, 9641–9661, https://doi.org/10.5194/acp-19-9641-2019, 2019.
Duan, J., Huang, R.-J., Lin, C., Dai, W., Wang, M., Gu, Y., Wang, Y., Zhong, H., Zheng, Y., Ni, H., Dusek, U., Chen, Y., Li, Y., Chen, Q., Worsnop, D. R., O'Dowd, C. D., and Cao, J.: Distinctions in source regions and formation mechanisms of secondary aerosol in Beijing from summer to winter, Atmos. Chem. Phys., 19, 10319–10334, https://doi.org/10.5194/acp-19-10319-2019, 2019.
Duan, J., Huang, R.-J., Li, Y., Chen, Q., Zheng, Y., Chen, Y., Lin, C., Ni, H., Wang, M., Ovadnevaite, J., Ceburnis, D., Chen, C., Worsnop, D. R., Hoffmann, T., O'Dowd, C., and Cao, J.: Summertime and wintertime atmospheric processes of secondary aerosol in Beijing, Atmos. Chem. Phys., 20, 3793–3807, https://doi.org/10.5194/acp-20-3793-2020, 2020.
Fröhlich, R., Cubison, M. J., Slowik, J. G., Bukowiecki, N., Canonaco, F., Croteau, P. L., Gysel, M., Henne, S., Herrmann, E., Jayne, J. T., Steinbacher, M., Worsnop, D. R., Baltensperger, U., and Prévôt, A. S. H.: Fourteen months of on-line measurements of the non-refractory submicron aerosol at the Jungfraujoch (3580 m a.s.l.) – chemical composition, origins and organic aerosol sources, Atmos. Chem. Phys., 15, 11373–11398, https://doi.org/10.5194/acp-15-11373-2015, 2015.
Hao, X., Zhang, Y., Yu, G. Y., He, B. S., Yang, F., Zou, Z., Zhang, C. G., Yang, X., Ouyang, B., and Chang, Y. H.: Online vertical measurement of air pollutants: Development of a monitoring platform on a skyscraper and its application in Shanghai, Atmos. Pollut. Res., 13, 101477, https://doi.org/10.1016/j.apr.2022.101477, 2022.
Hersbach, H., Bell, B., Berrisford, P., Hirahara, S., Horanyi, A., Munoz-Sabater, J., Nicolas, J., Peubey, C., Radu, R., Schepers, D., Simmons, A., Soci, C., Abdalla, S., Abellan, X., Balsamo, G., Bechtold, P., Biavati, G., Bidlot, J., Bonavita, M., De Chiara, G., Dahlgren, P., Dee, D., Diamantakis, M., Dragani, R., Flemming, J., Forbes, R., Fuentes, M., Geer, A., Haimberger, L., Healy, S., Hogan, R. J., Holm, E., Janiskova, M., Keeley, S., Laloyaux, P., Lopez, P., Lupu, C., Radnoti, G., de Rosnay, P., Rozum, I., Vamborg, F., Villaume, S., and Thepaut, J. N.: The ERA5 global reanalysis, Q. J. Roy. Meteorol. Soc., 146, 1999-2049, https://doi.org/10.1002/qj.3803, 2020.
Hu, W. W., Hu, M., Hu, W., Jimenez, J. L., Yuan, B., Chen, W. T., Wang, M., Wu, Y. S., Chen, C., Wang, Z. B., Peng, J. F., Zeng, L. M., and Shao, M.: Chemical composition, sources, and aging process of submicron aerosols in Beijing: Contrast between summer and winter, J. Geophys. Res.-Atmos., 121, 1955–1977, https://doi.org/10.1002/2015jd024020, 2016.
Huang, X.-F., He, L.-Y., Xue, L., Sun, T.-L., Zeng, L.-W., Gong, Z.-H., Hu, M., and Zhu, T.: Highly time-resolved chemical characterization of atmospheric fine particles during 2010 Shanghai World Expo, Atmos. Chem. Phys., 12, 4897–4907, https://doi.org/10.5194/acp-12-4897-2012, 2012.
Kim, K.-Y.: Diurnal and seasonal variation of planetary boundary layer height over East Asia and its climatic change as seen in the ERA-5 reanalysis data, SN Appl. Sci., 4, 39, https://doi.org/10.1007/s42452-021-04918-5, 2022.
Kulmala, M., Vehkamaki, H., Petaja, T., Dal Maso, M., Lauri, A., Kerminen, V. M., Birmili, W., and McMurry, P. H.: Formation and growth rates of ultrafine atmospheric particles: a review of observations, J. Aerosol Sci., 35, 143–176, https://doi.org/10.1016/j.jaerosci.2003.10.003, 2004.
Liu, Q., Quan, J. N., Jia, X. C., Sun, Z. B., Li, X., Gao, Y., and Liu, Y. G.: Vertical Profiles of Aerosol Composition over Beijing, China: Analysis of In Situ Aircraft Measurements, J. Atmos. Sci., 76, 231–245, https://doi.org/10.1175/jas-d-18-0157.1, 2019.
Liu, T., He, Q., Chen, Y., Liu, J., Liu, Q., Gao, W., Huang, G., Shi, W., and Yu, X.: Long-term variation in aerosol lidar ratio in Shanghai based on Raman lidar measurements, Atmos. Chem. Phys., 21, 5377–5391, https://doi.org/10.5194/acp-21-5377-2021, 2021.
Middlebrook, A. M., Bahreini, R., Jimenez, J. L., and Canagaratna, M. R.: Evaluation of composition-dependent collection efficiencies for the Aerodyne aerosol mass spectrometer using field data, Aerosol Sci. Technol., 46, 258–271, https://doi.org/10.1080/02786826.2011.620041, 2012.
Mo, Z., Huang, S., Yuan, B., Pei, C., Song, Q., Qi, J., Wang, M., Wang, B., Wang, C., Li, M., Zhang, Q., and Shao, M.: Deriving emission fluxes of volatile organic compounds from tower observation in the Pearl River Delta, China, Sci. Total Environ., 741, 139763, https://doi.org/10.1016/j.scitotenv.2020.139763, 2020.
Ng, N. L., Canagaratna, M. R., Jimenez, J. L., Chhabra, P. S., Seinfeld, J. H., and Worsnop, D. R.: Changes in organic aerosol composition with aging inferred from aerosol mass spectra, Atmos. Chem. Phys., 11, 6465–6474, https://doi.org/10.5194/acp-11-6465-2011, 2011a.
Ng, N. L., Herndon, S. C., Trimborn, A., Canagaratna, M. R., Croteau, P. L., Onasch, T. B., Sueper, D., Worsnop, D. R., Zhang, Q., Sun, Y. L., and Jayne, J. T.: An aerosol chemical speciation monitor (ACSM) for routine monitoring of the composition and mass concentrations of ambient aerosol, Aerosol Sci. Technol., 45, 780–794, https://doi.org/10.1080/02786826.2011.560211, 2011b.
Ozturk, F., Bahreini, R., Wagner, N. L., Dube, W. P., Young, C. J., Brown, S. S., Brock, C. A., Ulbrich, I. M., Jimenez, J. L., Cooper, O. R., and Middlebrook, A. M.: Vertically resolved chemical characteristics and sources of submicron aerosols measured on a Tall Tower in a suburban area near Denver, Colorado in winter, J. Geophys. Res.-Atmos., 118, 13591–13605, https://doi.org/10.1002/2013jd019923, 2013.
Pan, L., Xu, J. M., Tie, X. X., Mao, X. Q., Gao, W., and Chang, L. Y.: Long-term measurements of planetary boundary layer height and interactions with PM2.5 in Shanghai, China, Atmos. Pollut. Res., 10, 989–996, https://doi.org/10.1016/j.apr.2019.01.007, 2019.
Pappalardo, G., Amodeo, A., Apituley, A., Comeron, A., Freudenthaler, V., Linné, H., Ansmann, A., Bösenberg, J., D'Amico, G., Mattis, I., Mona, L., Wandinger, U., Amiridis, V., Alados-Arboledas, L., Nicolae, D., and Wiegner, M.: EARLINET: towards an advanced sustainable European aerosol lidar network, Atmos. Meas. Tech., 7, 2389–2409, https://doi.org/10.5194/amt-7-2389-2014, 2014.
Pratt, K. A., Mielke, L. H., Shepson, P. B., Bryan, A. M., Steiner, A. L., Ortega, J., Daly, R., Helmig, D., Vogel, C. S., Griffith, S., Dusanter, S., Stevens, P. S., and Alaghmand, M.: Contributions of individual reactive biogenic volatile organic compounds to organic nitrates above a mixed forest, Atmos. Chem. Phys., 12, 10125–10143, https://doi.org/10.5194/acp-12-10125-2012, 2012.
Qiao, T., Zhao, M. F., Xiu, G. L., and Yu, J. Z.: Seasonal variations of water soluble composition (WSOC, Hulis and WSIIs) in PM1 and its implications on haze pollution in urban Shanghai, China, Atmos. Environ., 123, 306–314, https://doi.org/10.1016/j.atmosenv.2015.03.010, 2015.
Qiao, T., Zhao, M., Xiu, G., and Yu, J.: Simultaneous monitoring and compositions analysis of PM1 and PM2.5 in Shanghai: Implications for characterization of haze pollution and source apportionment, Sci. Total Environ., 557–558, 386–394, https://doi.org/10.1016/j.scitotenv.2016.03.095, 2016.
Solomon, P. A., Crumpler, D., Flanagan, J. B., Jayanty, R. K. M., Rickman, E. E., and McDade, C. E.: US National PM2.5 Chemical Speciation Monitoring Networks-CSN and IMPROVE: Description of networks, J. Air Waste Manage. Assoc., 64, 1410–1438, https://doi.org/10.1080/10962247.2014.956904, 2014.
Sun, Y., Xu, W., Zhang, Q., Jiang, Q., Canonaco, F., Prévôt, A. S. H., Fu, P., Li, J., Jayne, J., Worsnop, D. R., and Wang, Z.: Source apportionment of organic aerosol from 2-year highly time-resolved measurements by an aerosol chemical speciation monitor in Beijing, China, Atmos. Chem. Phys., 18, 8469–8489, https://doi.org/10.5194/acp-18-8469-2018, 2018.
Tao, Z., Wang, Z., Yang, S., Shan, H., Ma, X., Zhang, H., Zhao, S., Liu, D., Xie, C., and Wang, Y.: Profiling the PM2.5 mass concentration vertical distribution in the boundary layer, Atmos. Meas. Tech., 9, 1369–1376, https://doi.org/10.5194/amt-9-1369-2016, 2016.
Voudouri, K. A., Siomos, N., Michailidis, K., D'Amico, G., Mattis, I., and Balis, D.: Consistency of the Single Calculus Chain Optical Products with Archived Measurements from an EARLINET Lidar Station, Remote Sens., 12, 3969, https://doi.org/10.3390/rs12233969, 2020.
Wang, Y. J., Xu, X. D., Zhao, Y., and Wang, M. Z.: Variation characteristics of the planetary boundary layer height and its relationship with PM2.5 concentration over China, J. Trop. Meteorol., 24, 385–394, https://doi.org/10.16555/j.1006-8775.2018.03.011, 2018.
Wonaschuetz, A., Sorooshian, A., Ervens, B., Chuang, P. Y., Feingold, G., Murphy, S. M., de Gouw, J., Warneke, C., and Jonsson, H. H.: Aerosol and gas re-distribution by shallow cumulus clouds: An investigation using airborne measurements, J. Geophys. Res.-Atmos., 117, D17202, https://doi.org/10.1029/2012jd018089, 2012.
Xie, C., Xu, W., Wang, J., Wang, Q., Liu, D., Tang, G., Chen, P., Du, W., Zhao, J., Zhang, Y., Zhou, W., Han, T., Bian, Q., Li, J., Fu, P., Wang, Z., Ge, X., Allan, J., Coe, H., and Sun, Y.: Vertical characterization of aerosol optical properties and brown carbon in winter in urban Beijing, China, Atmos. Chem. Phys., 19, 165–179, https://doi.org/10.5194/acp-19-165-2019, 2019.
Yin, C. Q.: Hourly data of Shanghai Tower observation, National Earth Observation Data Center [data set], https://chinageoss.cn/datasharing/datasetDetails/630094ef42544e709be88207 (last access: 23 January 2023), 2022.
Yu, H., Kaufman, Y. J., Chin, M., Feingold, G., Remer, L. A., Anderson, T. L., Balkanski, Y., Bellouin, N., Boucher, O., Christopher, S., DeCola, P., Kahn, R., Koch, D., Loeb, N., Reddy, M. S., Schulz, M., Takemura, T., and Zhou, M.: A review of measurement-based assessments of the aerosol direct radiative effect and forcing, Atmos. Chem. Phys., 6, 613–666, https://doi.org/10.5194/acp-6-613-2006, 2006.
Zang, H., Zhao, Y., Huo, J., Zhao, Q., Fu, Q., Duan, Y., Shao, J., Huang, C., An, J., Xue, L., Li, Z., Li, C., and Xiao, H.: High atmospheric oxidation capacity drives wintertime nitrate pollution in the eastern Yangtze River Delta of China, Atmos. Chem. Phys., 22, 4355–4374, https://doi.org/10.5194/acp-22-4355-2022, 2022.
Zhang, Q., Jimenez, J. L., Canagaratna, M. R., Allan, J. D., Coe, H., Ulbrich, I., Alfarra, M. R., Takami, A., Middlebrook, A. M., Sun, Y. L., Dzepina, K., Dunlea, E., Docherty, K., DeCarlo, P. F., Salcedo, D., Onasch, T., Jayne, J. T., Miyoshi, T., Shimono, A., Hatakeyama, S., Takegawa, N., Kondo, Y., Schneider, J., Drewnick, F., Borrmann, S., Weimer, S., Demerjian, K., Williams, P., Bower, K., Bahreini, R., Cottrell, L., Griffin, R. J., Rautiainen, J., Sun, J. Y., Zhang, Y. M., and Worsnop, D. R.: Ubiquity and dominance of oxygenated species in organic aerosols in anthropogenically-influenced Northern Hemisphere midlatitudes, Geophys. Res. Lett., 34, 6, https://doi.org/10.1029/2007gl029979, 2007.
Zhang, Q., Jimenez, J. L., Canagaratna, M. R., Ulbrich, I. M., Ng, N. L., Worsnop, D. R., and Sun, Y. L.: Understanding atmospheric organic aerosols via factor analysis of aerosol mass spectrometry: a review, Anal. Bioanal. Chem., 401, 3045–3067, https://doi.org/10.1007/s00216-011-5355-y, 2011.
Zhang, Y. L. and Cao, F.: Fine particulate matter (PM2.5) in China at a city level, Sci. Rep., 5, 12, https://doi.org/10.1038/srep14884, 2015.
Zhang, Y. M., Sun, J. Y., Zhang, X. Y., Shen, X. J., Wang, T. T., and Qin, M. K.: Seasonal characterization of components and size distributions for submicron aerosols in Beijing, Sci. China-Earth Sci., 56, 890–900, https://doi.org/10.1007/s11430-012-4515-z, 2013.
Zhang, Y. R., Xu, L. L., Zhuang, M. Z., Zhao, G. Q., Chen, Y. P., Tong, L., Yang, C., Xiao, H., Chen, J. S., Wu, X., Hong, Y. W., Li, M. R., Bian, Y. H., and Chen, Y. T.: Chemical composition and sources of submicron aerosol in a coastal city of China: Results from the 2017 BRICS summit study, Sci. Total Environ., 741, 140470, https://doi.org/10.1016/j.scitotenv.2020.140470, 2020.
Zhao, Q. B., Huo, J. T., Yang, X., Fu, Q. Y., Duan, Y. S., Liu, Y. X., Lin, Y. F., and Zhang, Q.: Chemical characterization and source identification of submicron aerosols from a year-long real-time observation at a rural site of Shanghai using an Aerosol Chemical Speciation Monitor, Atmos. Res., 246, 105154, https://doi.org/10.1016/j.atmosres.2020.105154, 2020a.
Zhao, S. P., Yu, Y., Du, Z. H., Yin, D. Y., Yang, J. C., Dong, L. X., and Li, P.: Size-resolved carbonaceous aerosols at near surface level and the hilltop in a typical valley city, China, Atmos. Pollut. Res., 11, 129–140, https://doi.org/10.1016/j.apr.2019.09.022, 2020b.
Zhao, W., Ren, H., Kawamura, K., Du, H., Chen, X., Yue, S., Xie, Q., Wei, L., Li, P., Zeng, X., Kong, S., Sun, Y., Wang, Z., and Fu, P.: Vertical distribution of particle-phase dicarboxylic acids, oxoacids and α-dicarbonyls in the urban boundary layer based on the 325 m tower in Beijing, Atmos. Chem. Phys., 20, 10331–10350, https://doi.org/10.5194/acp-20-10331-2020, 2020c.
Zhou, G. Q., Xu, J. M., Gao, W., Gu, Y. X., Mao, Z. C., and Cui, L. L.: Characteristics of PM1 over Shanghai, relationships with precursors and meteorological variables and impacts on visibility, Atmos. Environ., 184, 224–232, https://doi.org/10.1016/j.atmosenv.2018.04.041, 2018.
Zhou, W., Sun, Y. L., Xu, W. Q., Zhao, X. J., Wang, Q. Q., Tang, G. Q., Zhou, L. B., Chen, C., Du, W., Zhao, J., Xie, C. H., Fu, P. Q., and Wang, Z. F.: Vertical Characterization of Aerosol Particle Composition in Beijing, China: Insights From 3-Month Measurements With Two Aerosol Mass Spectrometers, J. Geophys. Res.-Atmos., 123, 13016–13029, https://doi.org/10.1029/2018jd029337, 2018.
Zhou, W., Gao, M., He, Y., Wang, Q. Q., Xie, C. H., Xu, W. Q., Zhao, J., Du, W., Qiu, Y. M., Lei, L., Fu, P. Q., Wang, Z. F., Worsnop, D. R., Zhang, Q., and Sun, Y. L.: Response of aerosol chemistry to clean air action in Beijing, China: Insights from two-year ACSM measurements and model simulations, Environ. Pollut., 255, 113345, https://doi.org/10.1016/j.envpol.2019.113345, 2019.
Zhou, W., Xu, W., Kim, H., Zhang, Q., Fu, P., Worsnop, D. R., and Sun, Y.: A review of aerosol chemistry in Asia: insights from aerosol mass spectrometer measurements, Environ. Sci.-Process. Impacts, 22, 1616–1653, https://doi.org/10.1039/d0em00212g, 2020.
Zhu, W., Zhou, M., Cheng, Z., Yan, N., Huang, C., Qiao, L., Wang, H., Liu, Y., Lou, S., and Guo, S.: Seasonal variation of aerosol compositions in Shanghai, China: Insights from particle aerosol mass spectrometer observations, Sci. Total Environ., 771, 144948, https://doi.org/10.1016/j.scitotenv.2021.144948, 2021.