the Creative Commons Attribution 4.0 License.
the Creative Commons Attribution 4.0 License.
 | 18 Oct 2023
Nighttime ozone in the lower boundary layer: insights from 3-year tower-based measurements in South China and regional air quality modeling
Guowen He
Cheng He
Haofan Wang
Chenglei Pei
Xiaonuan Qiu
Chenxi Liu
Yiming Wang
Nanxi Liu
Jinpu Zhang
Lei Lei
Yiming Liu
Haichao Wang
Tao Deng
Qi Fan
Shaojia Fan
Nighttime ozone in the lower boundary layer regulates atmospheric chemistry and surface ozone air quality, but our understanding of its vertical structure and impact is largely limited by the extreme sparsity of direct measurements. Here we present 3-year (2017–2019) measurements of ozone in the lower boundary layer (up to 500 m) from the Canton Tower in Guangzhou, the core megacity in South China, and interpret the measurements with a 1-month high-resolution chemical simulation from the Community Multiscale Air Quality (CMAQ) model. Measurements are available at 10, 118, 168, and 488 m, with the highest (488 m) measurement platform higher than the typical height of the nighttime stable boundary layer that allows direct measurements of ozone in the nighttime residual layer (RL). We find that ozone increases with altitude in the lower boundary layer throughout the day, with a vertical ozone gradient between the 10 and 488 m heights (ΔOH10–488 m) of 3.6–6.4 ppbv hm−1 in nighttime and 4.4–5.8 ppbv hm−1 in daytime. We identify a high ozone residual ratio, defined as the ratio of ozone concentration averaged over nighttime to that in the afternoon (14:00–17:00 LT), of 69 %–90 % in January, April, and October, remarkably higher than that in the other three layers (29 %–51 %). Ozone in the afternoon convective mixing layer provides the source of ozone in the RL, and strong temperature inversion facilitates the ability of RL to store ozone from the daytime convective mixing layer. The tower-based measurement also indicates that the nighttime surface Ox (Ox= O3+NO2) level can be an effective indicator of RL ozone if direct measurement is not available. We further find significant influences of nocturnal RL ozone on both the nighttime and the following day's daytime surface ozone air quality. During the surface nighttime ozone enhancement (NOE) event, we observe a significant decrease in ozone and an increase in NO2 and CO at the 488 m height, in contrast to their changes at the surface, a typical feature of enhanced vertical mixing. The enhanced vertical mixing leads to an NOE event by introducing ozone-rich and NOx-poor air into the RL to enter the nighttime stable boundary layer. The CMAQ model simulations also demonstrate an enhanced positive contribution of vertical diffusion (ΔVDIF) to ozone at the 10 and 118 m heights and a negative contribution at the 168 and 488 m heights during the NOE event. We also observe a strong correlation between nighttime RL ozone and the following day's surface maximum daily 8 h average (MDA8) ozone. This is tied to enhanced vertical mixing with the collapse of nighttime RL and the development of a convective mixing layer, which is supported by the CMAQ diagnosis of the ozone budget, suggesting that the mixing of ozone-rich air from nighttime RL downward to the surface via the entrainment is an important mechanism for aggravating ozone pollution the following day. We find that the bias in CMAQ-simulated surface MDA8 ozone the following day shows a strong correlation coefficient (r= 0.74) with the bias in nighttime ozone in the RL, highlighting the necessity to correct air quality model bias in the nighttime RL ozone for accurate prediction of daytime ozone. Our study thus highlights the value of long-term tower-based measurements for understanding the coupling between nighttime ozone in the RL, surface ozone air quality, and boundary layer dynamics.
- Article
(7765 KB) - Full-text XML
-
Supplement
(1096 KB) - BibTeX
- EndNote


Ozone is a chemically and radiatively active species affecting the atmospheric oxidation capacity and climate and also harms human health and ecosystems (Monks et al., 2015; Fleming et al., 2018; Unger et al., 2020). It is generated from nitrogen oxides (NOx= NO + NO2), carbon monoxide (CO), and volatile organic compounds (VOCs) in the presence of sunlight, removed by chemical loss and dry deposition, and can be transported at different timescales. Ozone at different vertical layers has distinct differences in the magnitude of these budget terms and exchanges through vertical mixing, shaping its highly variable vertical structure in the boundary layer (Tang et al., 2017). Ozone concentrations at the surface (ground level) are low during nighttime due to chemical destruction and dry deposition. In the nocturnal residual layer (RL) that is a few hundred meters above the surface, however, a large amount of ozone may be maintained from the daytime convective mixing layer (Mathur et al., 2018; Xu et al., 2018). The lack of direct measurement of nighttime ozone in the lower boundary layer (including the stable boundary layer and the RL) has been limiting our understanding of its role in regulating nighttime chemistry and air quality. Here we combine observations and model simulation to analyze nighttime ozone in the lower boundary layer in Guangzhou, the core megacity in South China.
Nighttime ozone in the boundary layer plays an important role in the atmospheric oxidation capacity (Brown and Stutz, 2012; Wang et al., 2023b) and surface ozone air quality (Klein et al., 2014), and its evolution is highly coupled to the boundary layer dynamics. After sunset, the surface air decouples from the air aloft with radiative cooling, forming a nighttime stable boundary layer near the surface and an RL from the erstwhile convective mixing layer (Stull, 1988). Due to weak chemical destruction and dry deposition, the RL can largely store ozone concentrations from the daytime convective mixing layer, serving as an ozone reservoir (Hu et al., 2018; Caputi et al., 2019; Ouyang et al., 2022). High ozone in the nighttime RL exerts significant influences on the nighttime heterogeneous chemistry (Brown et al., 2016), including the formation of secondary aerosol (Prabhakar et al., 2017; Yang et al., 2022). Nighttime ozone in the RL also significantly affects surface ozone concentrations. In nighttime, the ozone-rich air in the RL may mix down to the surface and trigger a nocturnal ozone enhancement (NOE) event in favorable weather conditions such as nocturnal low-level jets (Sullivan et al., 2017; C. He et al., 2022; Wu et al., 2023). After sunrise, vertical mixing strengthens with increasing ground temperature and the formation of a convective mixing layer, accelerating the exchange of ozone-rich air in the RL with air at the surface (Doran et al., 2003; Zhao et al., 2019; Yu et al., 2020). A number of studies estimated that more than 50 % of surface ozone comes from the RL in the morning (Lin et al., 2010; Zhu et al., 2020a; He et al., 2021), indicating a significant contribution to daytime ozone air quality from the nighttime ozone in the RL.
Despite the important roles of nighttime ozone in the RL in atmospheric chemistry and air quality, direct observations of nighttime ozone in the boundary layer are extremely sparse. So far, existing approaches of ozone vertical profiling have included unoccupied aerial vehicles (Wu et al., 2021; Qu et al., 2022), aircraft (Petzold et al., 2015), ozonesondes (Tarasick et al., 2019), ground-based or vehicle-based lidars (Klein et al., 2017; Y. P. He et al., 2022), tethered balloons (Zhang et al., 2019), and satellites (Ziemke et al., 2019). The routine ozonesonde and satellite measurements are typically scheduled to observe ozone in the afternoon; therefore nighttime ozone profiles are missing. The unoccupied aerial vehicle, aircraft, and tethered balloon measurements of ozone profiles are operated in a low frequency and are dependent on weather conditions. Lidar measurements have the capability to achieve high spatiotemporal resolution of ozone profiles; however, the blind zone height and the overlap effect of the lidar system invalidate the measurements below hundreds of meters (Lin et al., 2021; Wang et al., 2021). The ozone retrieval algorithm brings additional uncertainty for both satellite and lidar measurements. In comparison, tower-based measurements of ozone and related precursors are unique platforms to investigate the interactions between surface ozone and ozone aloft in the lower boundary layer throughout the day. It has advantages over other approaches by providing continuous, simultaneous, and accurate measurements of ozone at different layers in the lower boundary layer in any weather conditions. Tower-based ozone studies in China have been reported with a focus on vertical characteristics and seasonal and/or decadal changes in ozone and aerosol components (Sun et al., 2010; L. Li et al., 2019, 2022; X.-B. Li et al., 2022; Y. S. Liu et al., 2022). However, much less attention has been given to the ozone evolution in nighttime in the RL and its interaction with surface ozone.
Here, we present 3-year (2017–2019) measurements of lower boundary layer ozone from the 610 m height Canton Tower in Guangzhou, the core megacity in South China where ozone concentrations are high and have been increasing (T. Wang et al., 2019; Li et al., 2020; Lu et al., 2020) even with controls on anthropogenic NOx emissions (Zheng et al., 2018; Zhong et al., 2018). We interpret the observations with a 1-month high-resolution chemical simulation from the Community Multiscale Air Quality (CMAQ) model. We analyze the observed nighttime versus daytime vertical structure and quantify the ozone vertical gradient in different seasons. We then investigate the chemical and meteorological factors controlling the nighttime ozone in the RL from the measurement at the 488 m height, which is typically higher than the nighttime stable boundary layer and can be representative of the RL. We further examine the roles of the nighttime RL ozone on both nocturnal ozone enhancement events and the following day's surface ozone air quality.
2.1 Observational data
We obtain hourly measurements of ozone, NO2, NO, CO, and meteorology parameters (temperature, wind speed) at the Canton Tower, the second highest TV tower in the world with a total height of 610 m including the shaft on the top. The Canton Tower (23.11∘ N, 113.33∘ E) is located in the center of urban Guangzhou, the core city in South China and a city typically influenced by the East Asia monsoon (Fig. 1). Measurements are conducted by the Guangzhou Environmental Monitoring Center. The instruments are arranged in an open area of the Canton Tower, thus enabling the measurements to reflect the properties of ambient air.
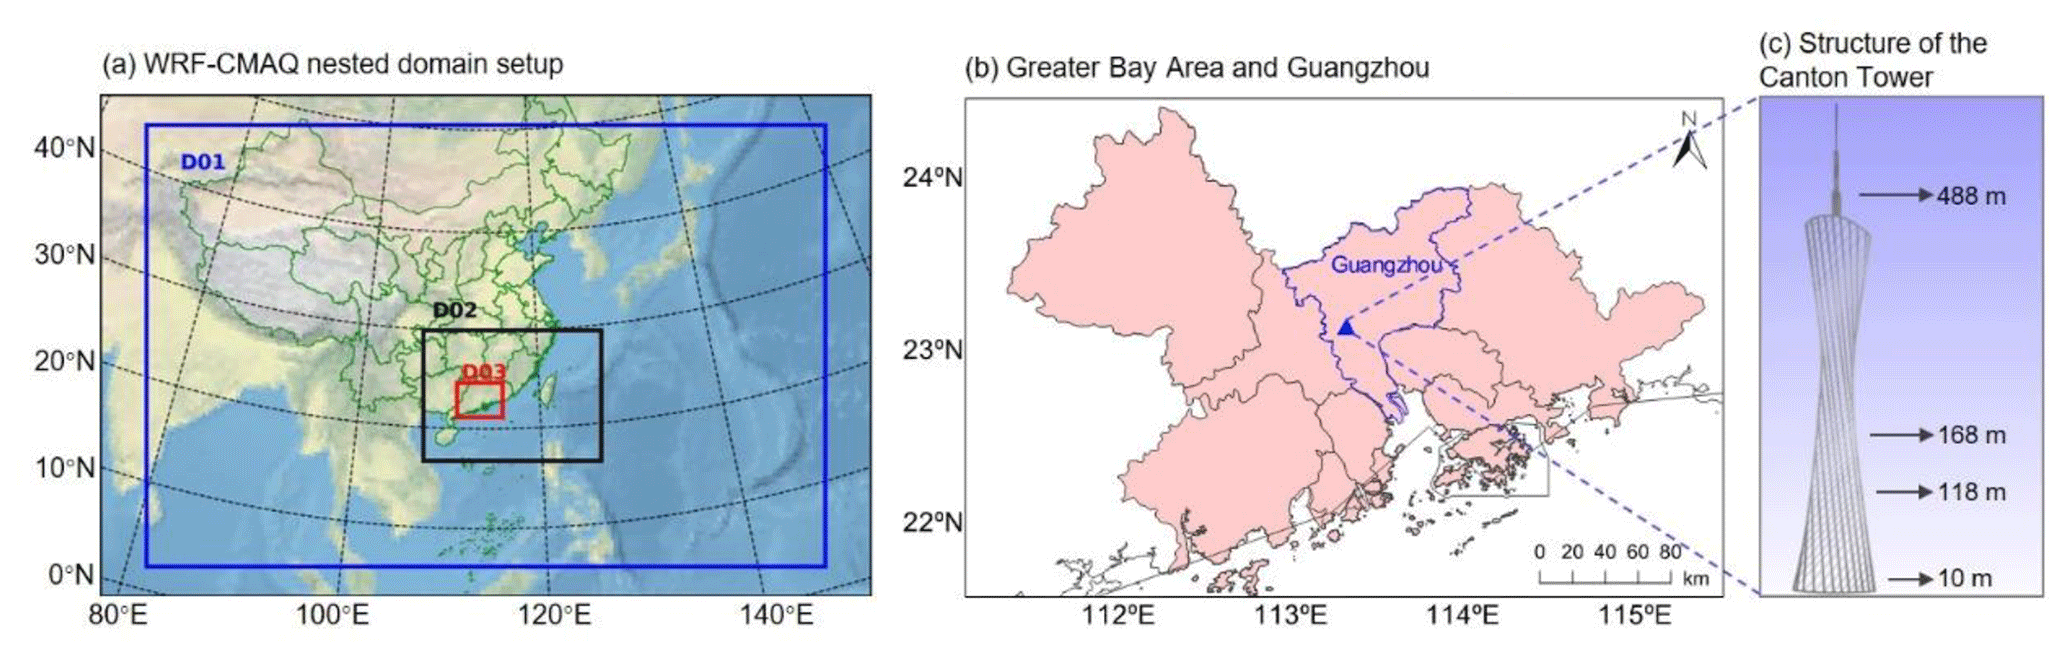
Figure 1Location of the Canton Tower and the region of interest in this study. Panel (a) shows the three nested domains of the Weather Research and Forecasting (WRF)-CMAQ model. Panel (b) shows the Greater Bay Area and Guangzhou. Panel (c) shows the structure of the Canton Tower, with the four measurements heights (10, 118, 168, and 488 m) denoted.
Ozone is measured online hourly via the Thermo 49i instrument placed in the tower at four vertical layers (10, 118, 168, and 488 m), extending from the surface to the lower boundary layer. Simultaneous measurements of temperature (10 and 118 m), wind speed (10, 118, 168, and 488 m), NO2, NO, and CO (10, 118, 168, and 488 m) are available. Measurements span from 2017–2019 for January, April, and October but are only available in 2019 for July due to instrument malfunction in other summers. Previous studies have illustrated the Canton Tower as a unique platform to study the vertical distribution, chemical reactivity, and source attribution of ozone and other pollutants (Mo et al., 2020; Zhou et al., 2020; X.-B. Li et al., 2022; Mo et al., 2022; Yang et al., 2022). The structure of the tower may cause complicated and different turbulence, affecting the measured winds on different altitudes; however, the above previous studies have demonstrated the reliability of atmosphere components measured from the Canton Tower. These studies typically cover a short slice of time periods (from a few days to a few months) and do not focus on the nighttime ozone structure and controlling factors.
We additionally obtain vertical ozone profiles in the lower boundary layer from the nearby ozonesonde station in Hong Kong SAR and reported tower-based observations at other cities in mainland China in order to compare the ozone vertical profiles from the Canton Tower with other measurements. Ozonesonde observations from the Hong Kong Observatory are publicly available at the World Ozone and Ultraviolet Radiation Data Centre (https://woudc.org/data/explore.php?lang=en, last access: 6 April 2023). Each sounding is launched on a weekly basis at local time (13:00–14:00) at King's Park Meteorological Station (22.31∘ N, 114.17∘ E; 66 m above sea level). A total of 45 profiles from 2017–2019 are obtained in this study (12 in January, 10 in April, 11 in July, and 12 in October, respectively). We extract the ozone concentrations from each profile at six levels (the lowest detection height, 100, 200, 300, 400, and 500 m). We also collect reported observations from the Beijing Meteorology Tower (325 m) (Y. S. Liu et al., 2022), Tianjin Meteorological Tower (250 m) (Han et al., 2020), Shenzhen Meteorology Tower (356 m) (Li et al., 2019), and another independent study at the Canton Tower (X.-B. Li et al., 2022). However, these studies do not separately report nighttime measurements; thus we focus the comparison on mean vertical ozone distributions.
2.2 Reanalysis data of planetary boundary layer height and wind field
We also obtain the planetary boundary layer height (PBLH) from the reanalysis dataset to describe the evolution of PBLH at the Canton Tower. Previous studies have evaluated the PBLH from several widely used reanalysis products, including the fifth-generation European Centre for Medium-Range Weather Forecasts (ECMWF) atmospheric reanalysis of the global climate (ERA5), the Modern-Era Retrospective Analysis for Research and Applications, version 2 (MERRA-2), the National Centers for Environmental Prediction final global reanalysis data (FNL), and the coupled ECMWF atmospheric reanalysis of medium-range weather (CERA) across China (Guo et al., 2021; Xu et al., 2022), with radiosounding observations. These studies highlight the robustness and suitability of estimating the PBLH using the ERA5 reanalysis dataset (https://cds.climate.copernicus.eu/#!/search?text=ERA5, last access: 8 April 2023), which is applied in this study. The ERA5 dataset has a horizontal resolution of 0.25∘ × 0.25∘ and a vertical resolution of 25 hPa with 1 h temporal resolution and is able to describe the diurnal characteristics of the boundary layer. We also apply the global continental blended high-resolution PBLH dataset developed by Guo et al. (2022) (https://doi.org/10.5281/zenodo.6498004), which is generated by integrating the ERA5 reanalysis dataset, the Global Land Data Assimilation System (GLDAS), and measurements at over 370 radiosonde stations worldwide using machine learning algorithms. The dataset has the same horizontal resolution of 0.25∘ × 0.25∘ as the ERA5 dataset but is only available every 3 h. To investigate the impacts of meteorological processes on NOE events at the Canton Tower, the horizontal and vertical wind speed and direction on pressure levels from the ERA5 reanalysis dataset are utilized for the analysis of two NOE cases.
2.3 WRF-CMAQ model simulation
We use the CMAQv5.4 model to interpret ozone measurements at the Canton Tower and to diagnose the interactions between surface ozone and that aloft in the lower boundary layer. The CMAQ model is a third-generation state-of-the-art air quality modeling system developed by the United States Environmental Protection Agency (US EPA) (Appel et al., 2021). The model is driven by meteorological input data simulated from the Weather Research and Forecasting (WRF) model version 3.9.1 (Skamarock et al., 2008). The initial and boundary conditions for the WRF model are obtained from the National Centers for Environmental Prediction (NCEP) FNL dataset with a horizontal resolution of 1∘ × 1∘ and a temporal resolution of 6 h.
Table 1 provides a summary of the chemical and physical schemes, as well as emission inventories used in the WRF-CMAQ model. The key configurations of the WRF-CMAQ model include the rapid radiative transfer model (RRTM) for short- and longwave radiation schemes, the Noah land surface model (LSM) for land–atmosphere interactions, the Mellor–Yamada–Janjić (MYJ) boundary layer scheme, the Purdue Lin microphysics scheme, and the Carbon Bond 06 (CB06) combined with AERO6 for gas-phase and aerosol chemistry. Anthropogenic emissions in China are reported by the Multiscale Emission Inventory of China (MEIC) (Zheng et al., 2018). Biogenic emissions were calculated by the Model of Emissions of Gases and Aerosols from Nature version2.1 (MEGAN v2.1) (Guenther et al., 2012).
Table 1Summary of key configurations in the WRF-CMAQ modeling system.
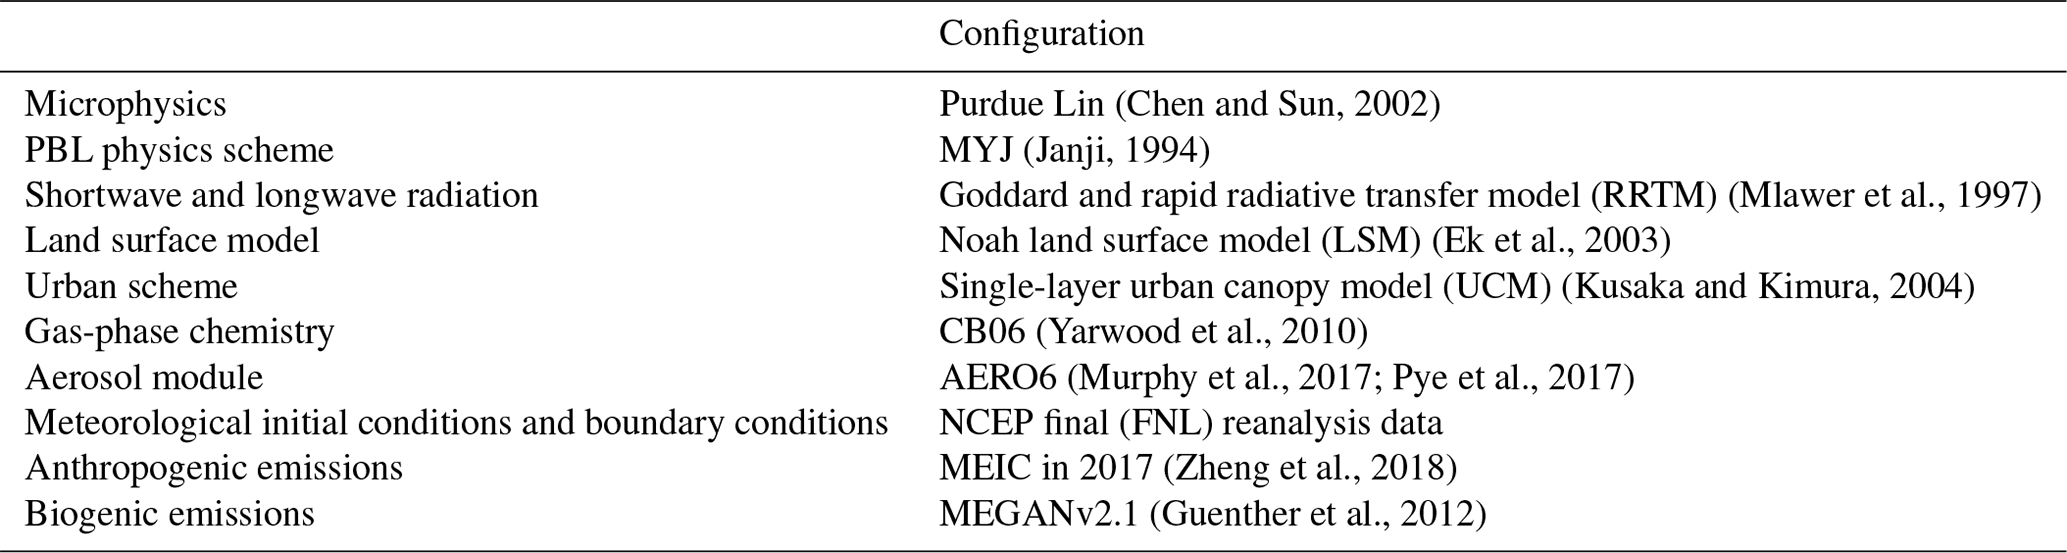
We set up three nested domains of the WRF-CMAQ model at a horizontal resolution of 27×27, 9×9, and 3× 3 km2, respectively, with the innermost domain focusing on the Pearl River Delta region (Fig. 1). For each domain we set up 40 vertical layers with the near-surface layer at about 20 m above the ground. We conduct a 1-month simulation focusing on October 2017 when high ozone concentrations are observed in Guangzhou, and the anthropogenic emission inventory is available. Anthropogenic emissions from MEIC in 2017 are downscaled from its original resolution of 25×25 km2 to the model resolution of 3×3 km2, using the Modular Emission Inventory Allocation Tool for Community Multiscale Air Quality Model (MEIAT-CMAQ) v1.0 (Wang et al., 2023a). The model simulation starts from 20 September 2017 to 1 November 2017 with the first 10 d used as spin-ups.
We apply the integrated process rate (IPR) diagnostic module implemented in the CMAQ model to quantify the physical and chemical influences on the ozone budget (N. Wang et al., 2019; Ouyang et al., 2022). The IPR diagnoses the change of ozone at each model grid from vertical advection (ΔZADV), horizontal advection (ΔHADV), horizontal diffusion (ΔHDIF), vertical diffusion (ΔVDIF), dry deposition (ΔDDEP), gas-phase chemistry (ΔCHEM), and aerosol processes (ΔAERO).
3.1 Mean nighttime versus daytime ozone vertical structure and budget in the lower boundary layer
Figure 2 shows the 2017–2019 monthly mean ozone diurnal cycle in the lower boundary layer measured at the Canton Tower in different seasons. Higher monthly mean ozone concentrations of 33 ppbv at the 10 m and 57 ppbv at the 488 m heights are observed in October than in other months. This seasonal ozone cycle is different from that in the northern mid-latitudes which typically shows ozone peak in boreal summer (Lu et al., 2019b), reflecting the dry and hot weather conditions in October in South China that are favorable for ozone chemical production with the retreat of the summer monsoon (Yin et al., 2019; Gao et al., 2020). Despite the difference in mean values, the diurnal cycle is consistent throughout the lower boundary layer from 10 to 488 m above the ground and for all seasons, with ozone increasing after sunrise, peaking in the afternoon, and decreasing gradually after sunset. There is a slight difference in the time of the ozone increase after sunrise between different vertical layers. The lowest three layers (10, 118, 168 m) show ozone increase at about 08:00, while ozone in the highest layer (488 m) typically shows a small decrease at 07:00–09:00 and starts to increase after 10:00.
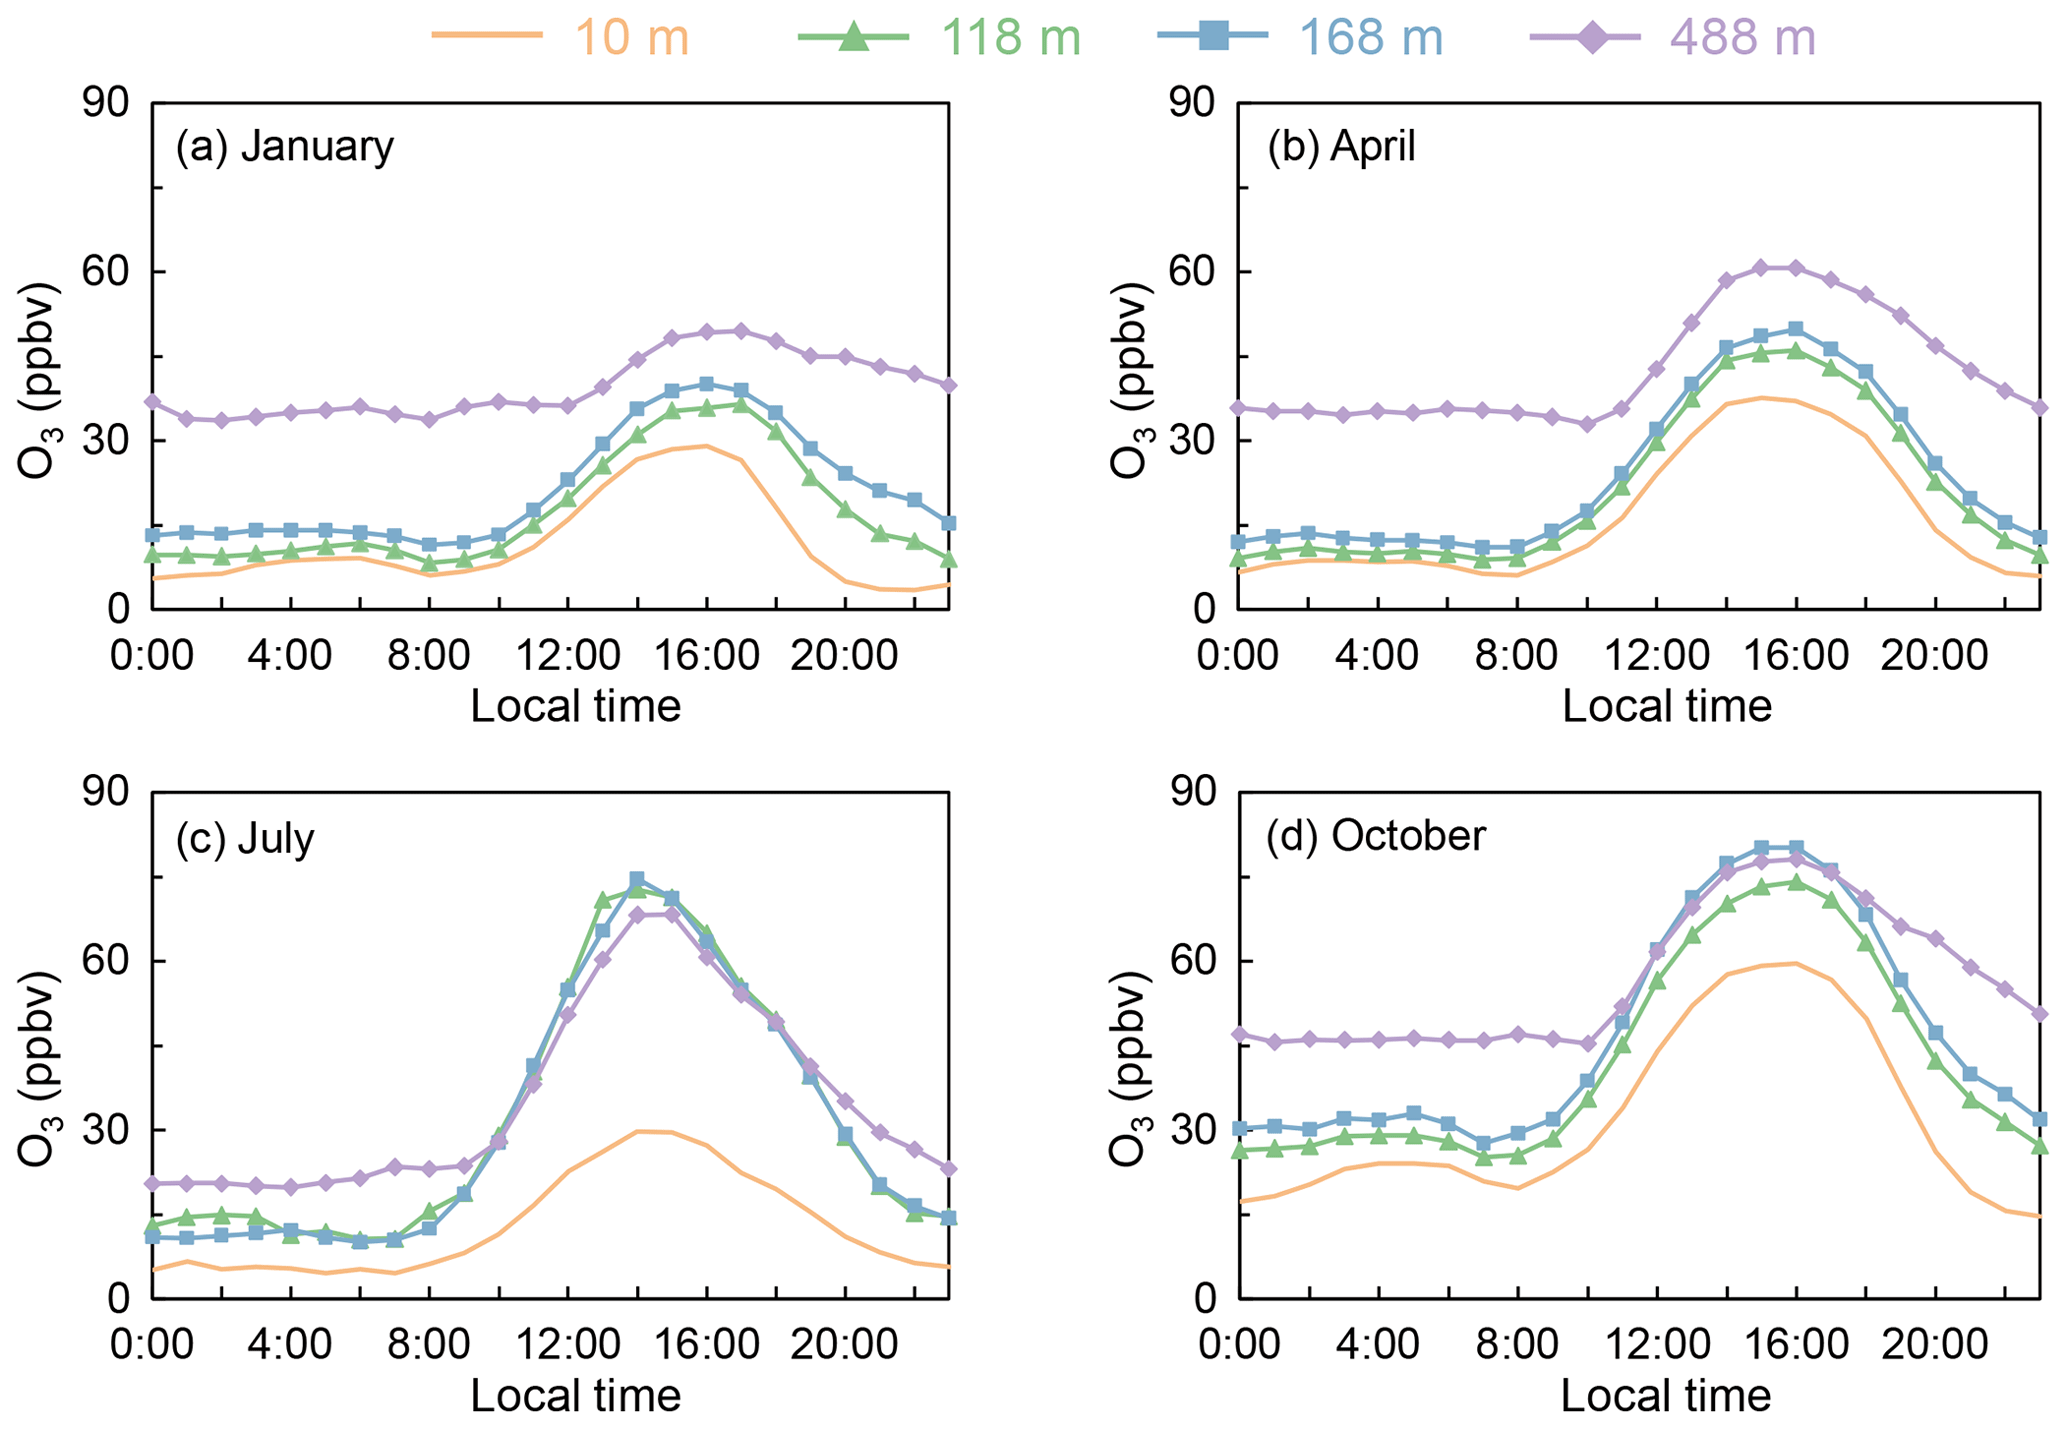
Figure 2Diurnal cycle and seasonal evolution of ozone in the lower boundary layer observed at the Canton Tower. Panels (a), (b), (c), and (d) show measurements in January, April, July (2019 only), and October averaged for 2017–2019. Measurements are available at 10, 118, 168, and 488 m.
We see from Fig. 2 that ozone concentrations are generally higher with increasing altitudes in the lower boundary layers. Figure 3 presents the 2017–2019 mean vertical ozone profile that reinforces this feature. The vertical ozone structure observed at the Canton Tower is generally consistent with that obtained from the nearby ozonesonde in Hong Kong and other reported tower-based measurements in China (Supplement Fig. S1); however, our analyses here provide additional information on the comparison of ozone structures in daytime (08:00–19:00 LT) and nighttime (20:00–07:00 LT). In nighttime (daytime), the monthly mean ozone concentrations at the 488 m height are 38 ± 18 (42 ± 20) (mean ± standard deviation from hourly measurements), 37 ± 16 (48 ± 19), 23 ± 7 (47 ± 15), and 50 ± 19 (64 ± 21) ppbv in January, April, July, and October, respectively (Table 2). In comparison, ozone concentrations at 10 m above the surface in nighttime (daytime) are 7 ± 7 (17 ± 12), 8 ± 7 (25 ± 16), 6 ± 6 (20 ± 15), and 20 ± 12 (43 ± 20) ppbv for the corresponding months. This shapes a significant vertical gradient of ozone concentrations in the lower boundary layer, with nighttime (daytime) ozone concentrations higher by 2.4–5.4 (1.5–2.4) times at the 488 m level than those at the surface.
Table 2Summary of the nighttime versus daytime ozone at the highest (488 m) and lowest (10 m) measurement platform at the Canton Tower.
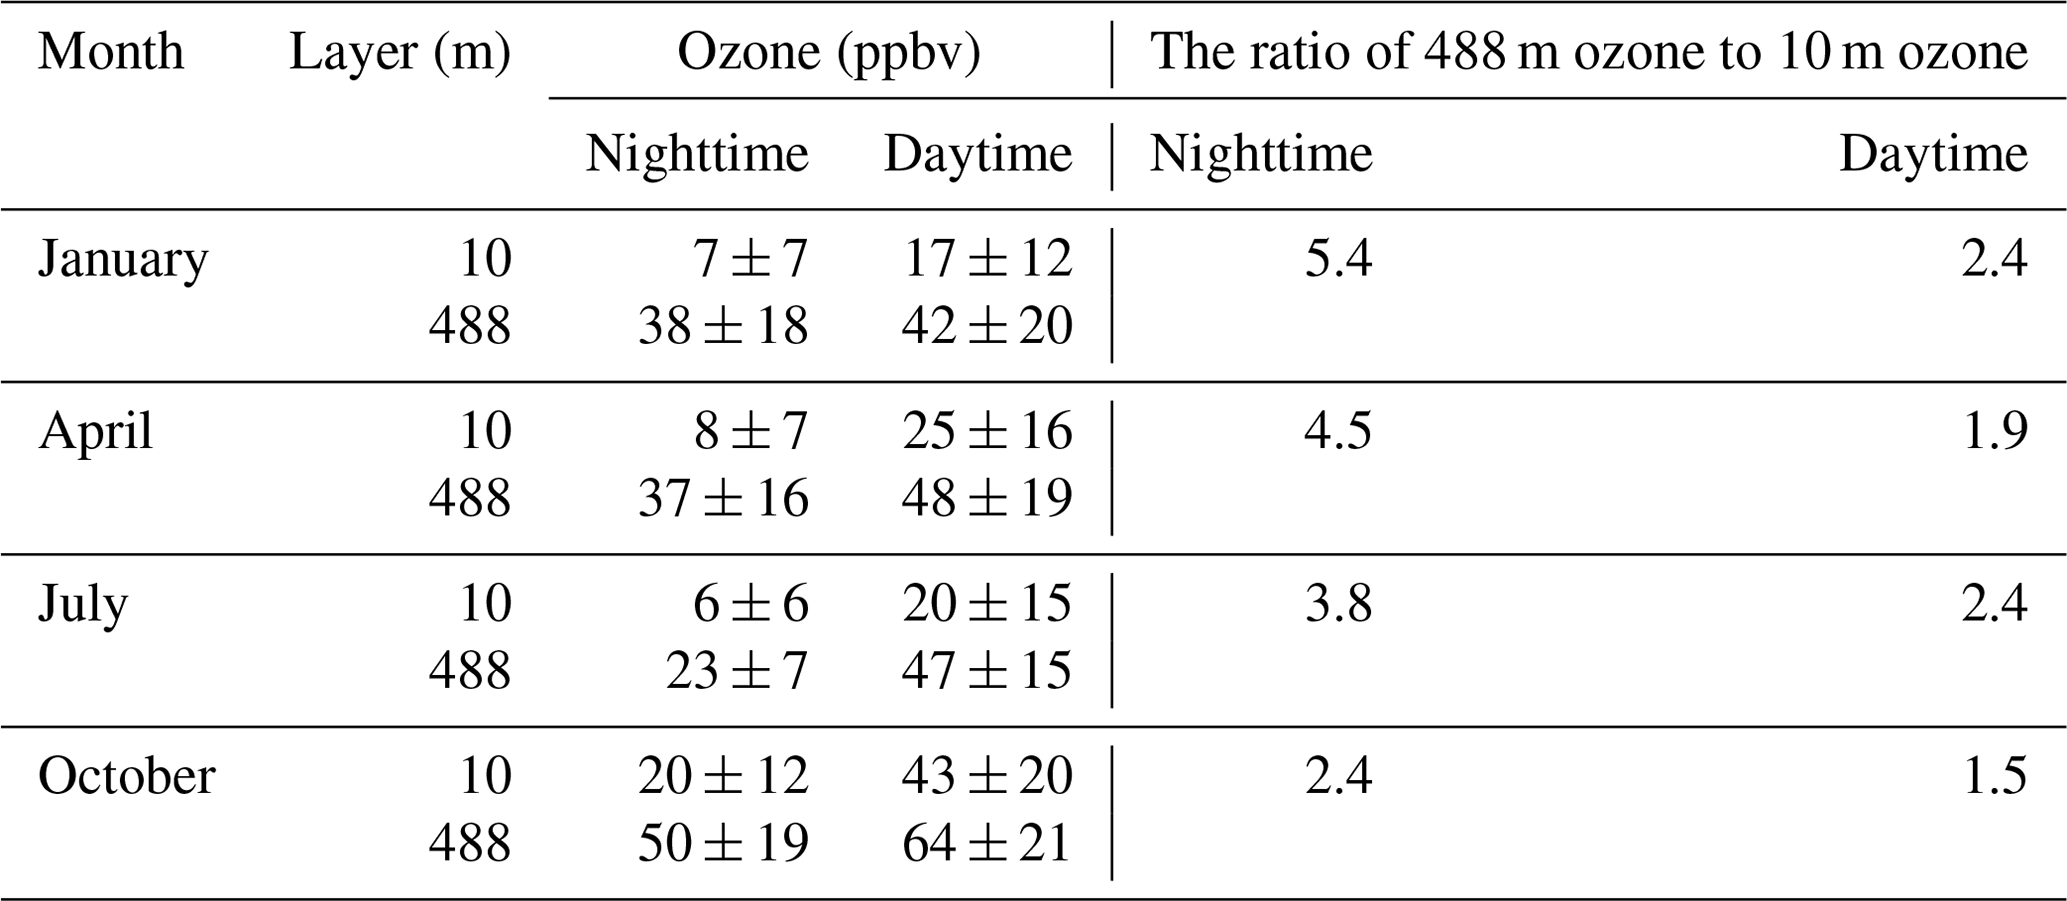
Table 3Summary of the nighttime versus daytime monthly mean vertical gradient of ozone.
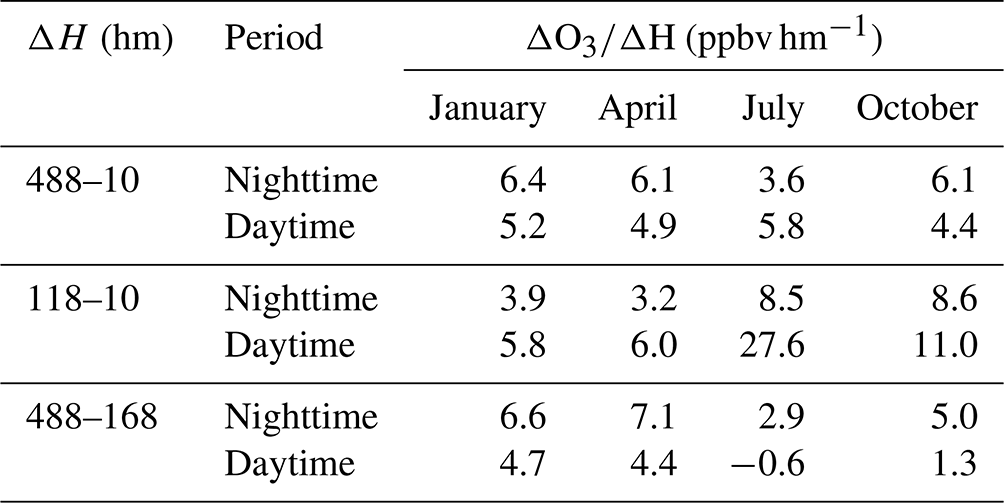
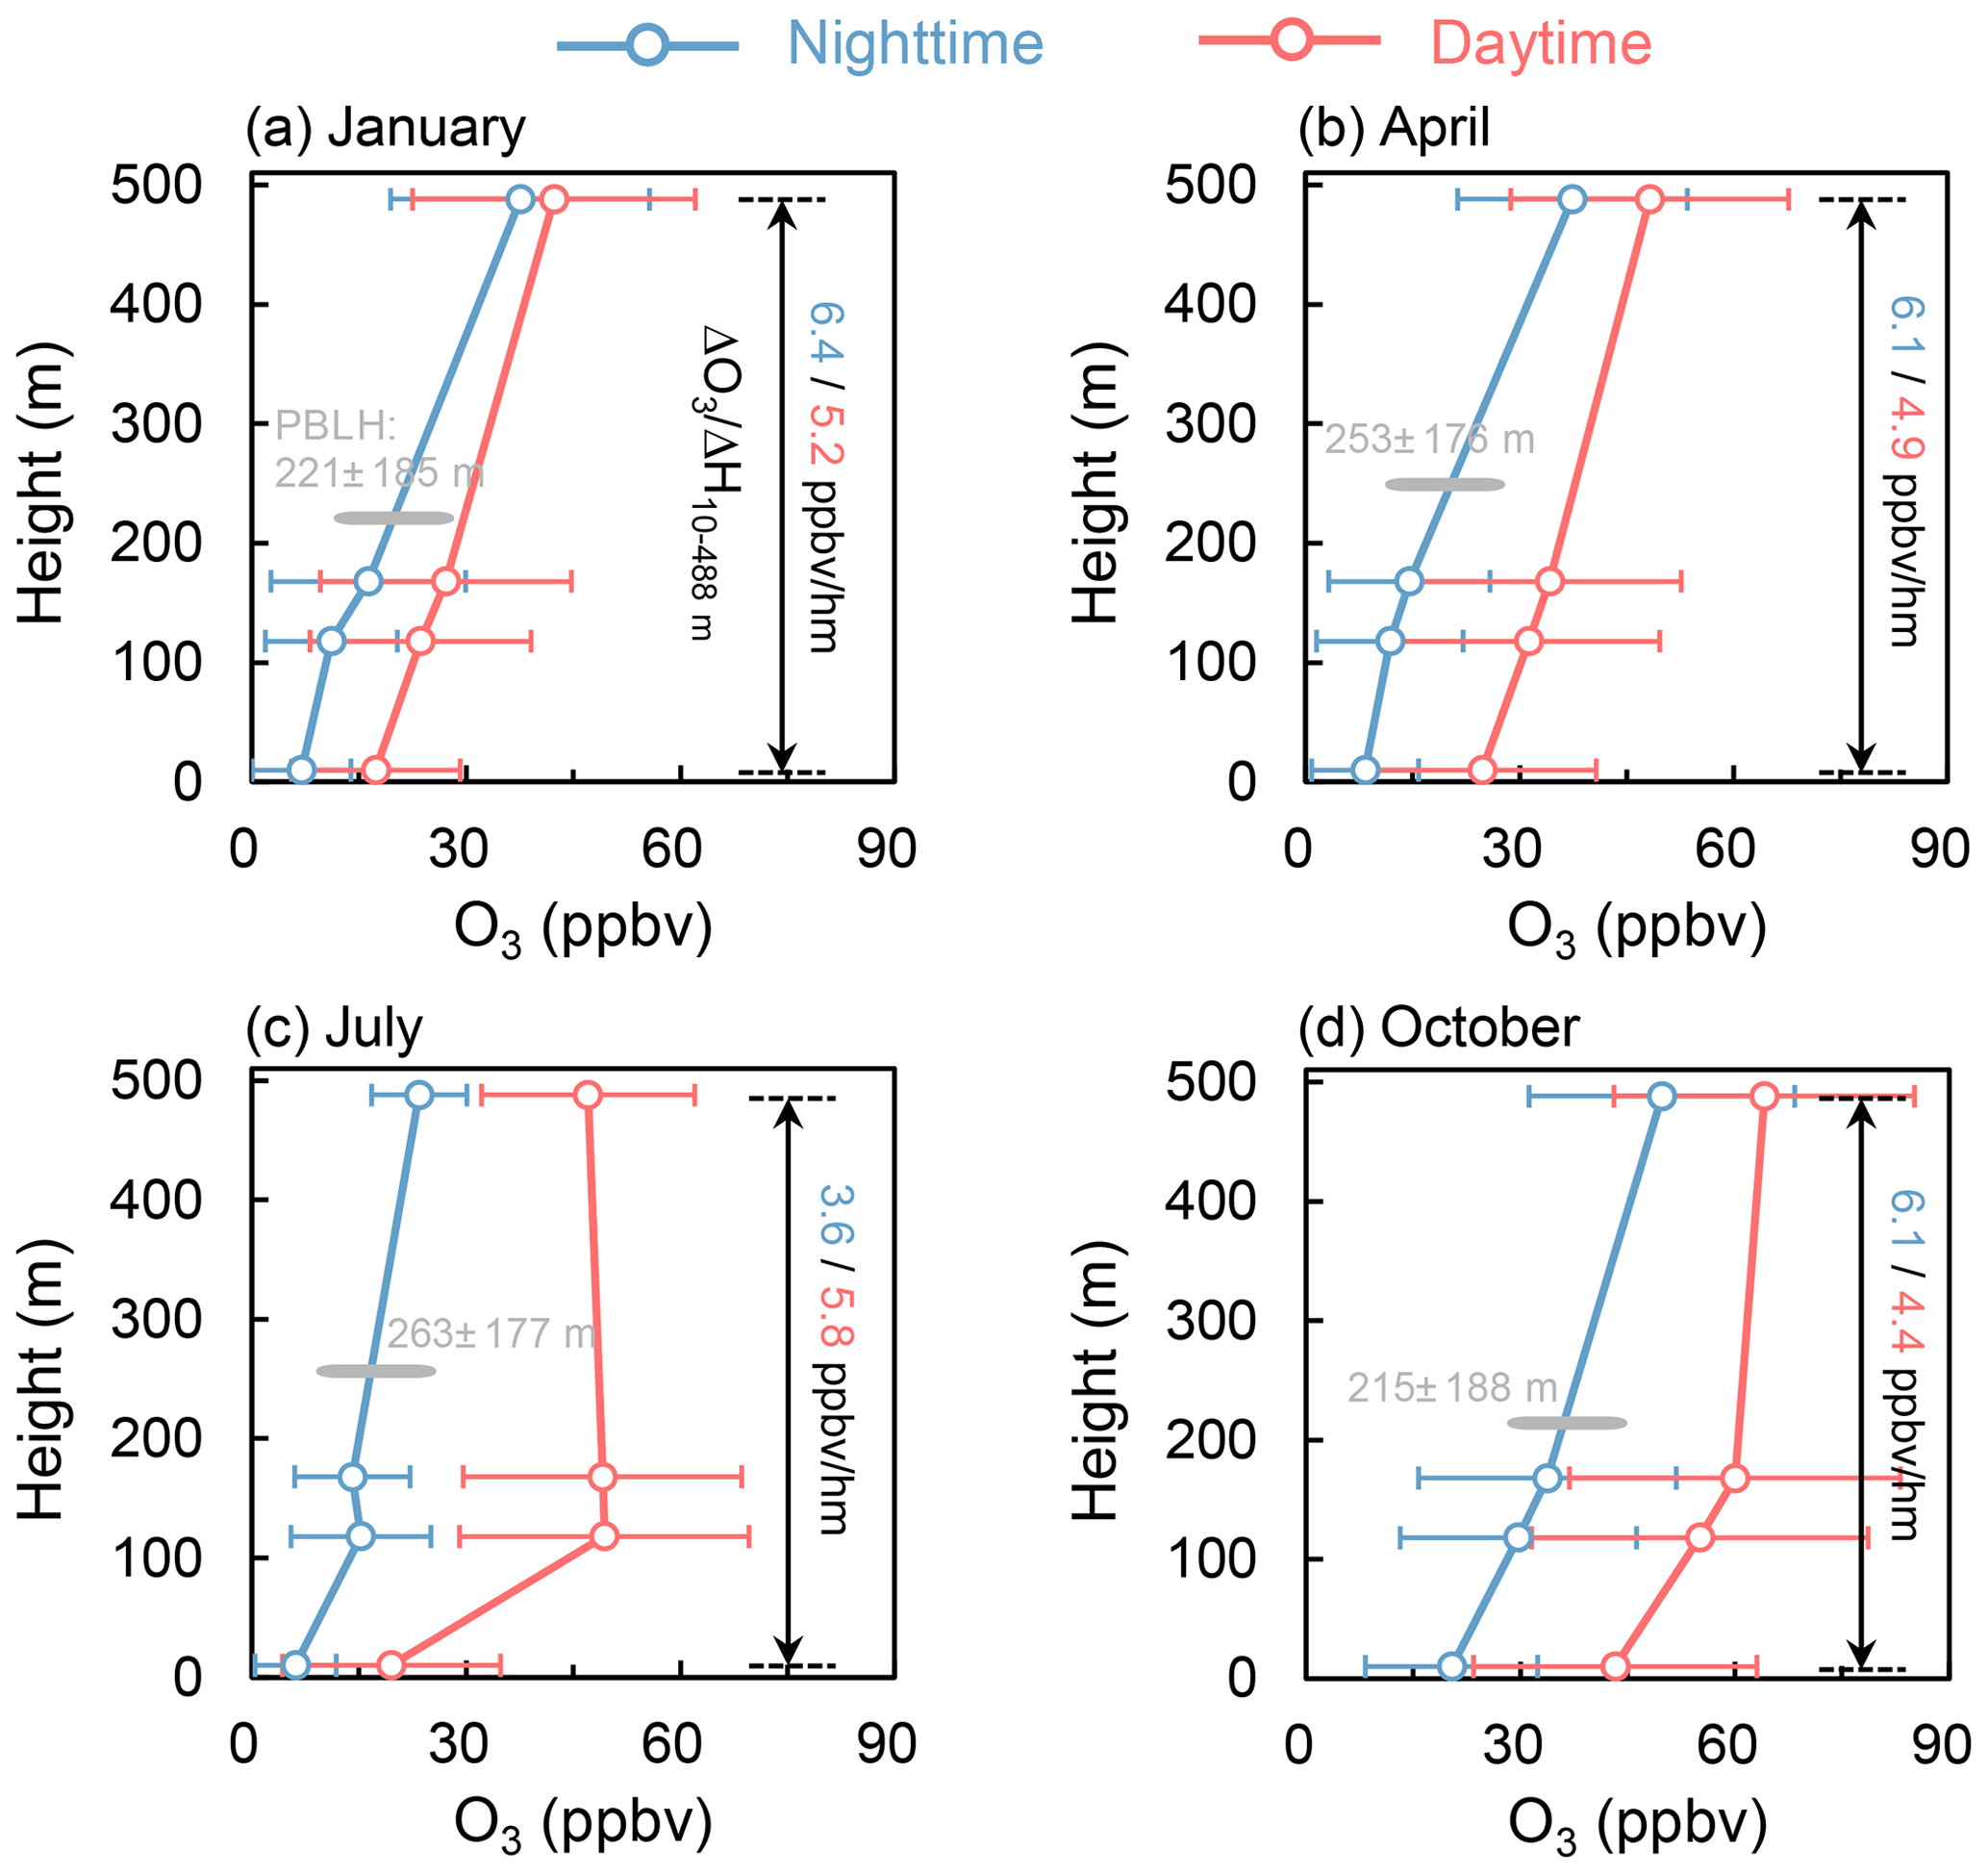
Figure 3The 2017–2019 mean ozone vertical structure in the lower boundary layer observed at the Canton Tower. The blue and rosy lines denote the nighttime (20:00–07:00 LT) and daytime (08:00–19:00 LT) mean ozone profiles, with the horizontal bars representing the standard deviation from the hourly measurements. The horizontal bar and numbers in grey denote the mean height and standard deviation of the nighttime stable boundary layer obtained from the ERA5 reanalysis data. ΔOH10–488 m represents the vertical gradient of ozone between 10 and 488 m.
We express the observed monthly mean vertical gradient of ozone as ΔOH (ppbv hm−1) derived from observation platforms at different heights. The overall ozone vertical gradients in the lower boundary layer (ΔOH10–488 m) are 6.4, 6.1, 3.6, and 6.1 ppbv hm−1 in nighttime, compared to 5.2, 4.9, 5.8, and 4.4 in daytime, suggesting a larger vertical ozone gradient between the 488 and 10 m levels in nighttime than in daytime. We also find a larger vertical gradient of NOx (NO + NO2) concentrations in nighttime than in daytime (Fig. S3), suggesting that the titration effect is an important factor shaping the ozone vertical structure. However, the daytime versus nighttime ΔOH features vary for different altitude ranges (Table 3). In the lowest layer (10–118 m) above the ground, the ozone vertical gradient is typically smaller in nighttime, with ΔOH10–118 m ranging from 3.2–8.6 ppbv hm−1 in nighttime to 5.8–27.6 ppbv hm−1 in daytime. In the higher layer (168–488 m), however, nighttime ΔOH168–488 m values are 2.9–7.1 ppbv hm−1, higher than the −0.6–4.7 ppbv hm−1 in daytime.
The larger nighttime ozone vertical gradient than that in daytime reflects the evolution of the atmospheric boundary layer. We analyze the boundary layer height at the Canton Tower derived from the ERA5 reanalysis dataset and the global continental blended high-resolution planetary boundary layer height (PBLH) dataset developed by Guo et al. (2022), as described in Sect. 2.2. The two datasets are consistent in the boundary layer height and its diurnal variation (Fig. S2). In daytime, we find that the mean PBLH is 527 ± 306, 694 ± 372, 716 ± 319, and 722 ± 417 m in January, April, July, and October, respectively. The highest (488 m) measurement platform of the Canton Tower is in the convective mixing layer, in which the ozone vertical gradient is relatively small as a result of rapid vertical mixing. In comparison, in nighttime, the average PBLHs (denote the height of the nighttime stable boundary layer) are 221 ± 185, 253 ± 176, 263 ± 177, and 215 ± 188 m for the corresponding months, with 85 %–89 % of the hourly records showing PBLHs smaller than 488 m, indicating that the 488 m platform is able to observe ozone in the RL. Therefore, nighttime ozone concentrations at 10, 118, and 168 m are relatively close to each other, while ozone concentrations at 488 m in the RL remain high and are decoupled from the lowest three layers in the nighttime stable boundary layer. This also corresponds to a decreasing day-to-night ozone contrast (difference between maximum and minimum ozone concentrations within the day) with increasing height except for July as shown in Fig. 2. At the surface, the day-to-night ozone contrast is 25, 32, 25, and 45 ppbv in January, April, July, and October, respectively, compared to 16, 26, 48, and 33 ppbv at the 488 m height, reflecting a smaller ozone diurnal cycle in the RL compared to the lower altitudes.
We use the 1-month CMAQ model simulation of October 2017 to diagnose the processes controlling the ozone evolution of the lower boundary layer at different altitudes. The evaluation of the simulated meteorological parameters and ozone concentrations with measurements at the Canton Tower is summarized in Table S1 in the Supplement. The CMAQ model captures the daily variation in and the diurnal cycle of the observed ozone concentrations, with a correlation coefficient (r) of 0.70 and a mean bias (MB) of −1.8 ppbv for all 744 hourly data points (Fig. 4). However, the model tends to overestimate daytime surface ozone concentrations and underestimate nighttime surface ozone concentrations. This is a common feature for most current state-of-the-art chemical transport models. Even with a resolution of 3 km, there is still a representative issue when comparing gridded model results to ozone measurements at a specific site. Artificial mixing of ozone precursors in model grids tends to overestimate ozone chemical production efficiency in daytime and the titration effect in nighttime, which leads to an overestimation of daytime ozone and underestimation of nighttime ozone (Lu et al., 2019b). The lack of a high-resolution (e.g., ∼3 km or higher) anthropogenic emission inventory may cause bias for the simulation of ozone precursors. Limitations in chemical mechanisms, emission inventories, and modeling fine-scale meteorology cause extra uncertainty in high-resolution regional ozone simulations (Liu and Wang, 2020; H. L. Liu et al., 2022; Yang and Zhao, 2023). Nevertheless, the model largely reproduces the nighttime vertical ozone gradient ΔOH10–488 m of 5.1 ppbv hm−1 compared to 6.0 ppbv hm−1 from the observations in October 2017, although it has difficulty in capturing the magnitude of the daytime vertical ozone gradient (Fig. 4).
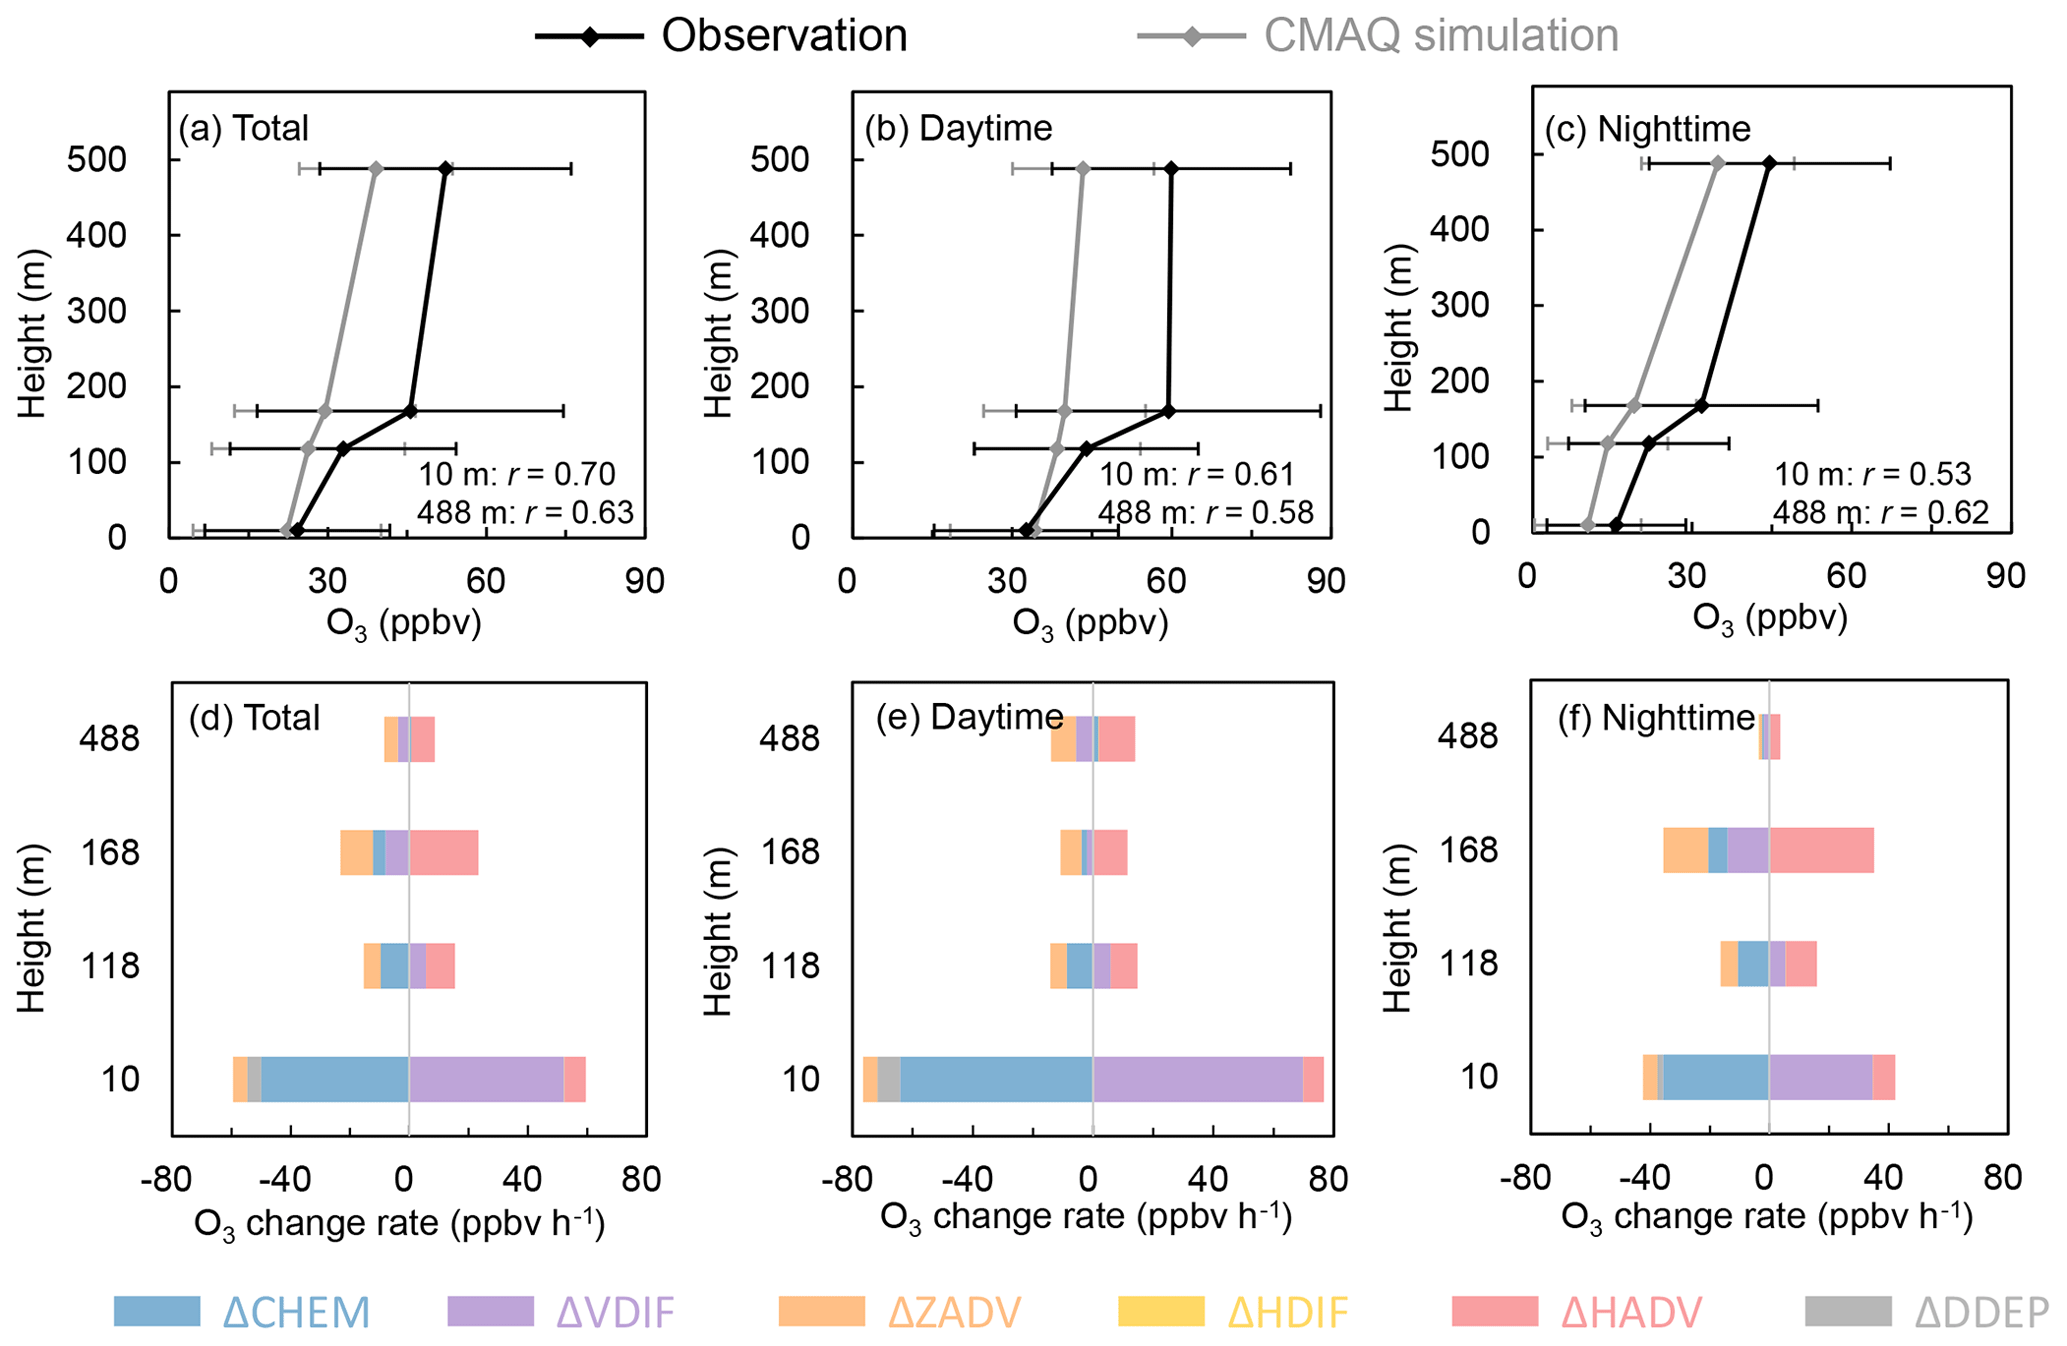
Figure 4The CMAQ model simulation of ozone structures and budgets at the Canton Tower, October 2017. Panels (a), (b), and (c) show the mean profile of observation and CMAQ simulation. r represents the correlation coefficient between the hourly observation and simulation at 10 and 488 m. The horizontal bars represent the standard deviation. Panels (d), (e), and (f) show the ozone budget terms diagnosed from the CMAQ IPR module at different measurement height. ΔCHEM represents changes in chemistry, ΔVDIF represents changes in vertical diffusion, ΔZADV represents changes in vertical advection, ΔHDIF represents changes in horizontal diffusion, ΔHADV represents changes in horizontal advection, and ΔDDEP represents changes in dry deposition.
Figure 4 summarizes the factors controlling daytime versus nighttime ozone budgets at different heights, derived from the CMAQ IPR diagnostic module. We find that vertical diffusion (ΔVDIF) is the main source of ozone at the surface, while net chemical loss (ΔCHEM) due to the net effect of ozone chemical production and destruction is the main loss. Dry deposition (ΔDDEP) also contributes to ozone decrease at the surface. In daytime, ΔVDIF contributes +70 and −6 ppbv h−1 to the ozone change rate at the surface and 488 m, respectively, while in nighttime, the corresponding contributions are +35 and −2 ppbv h−1. This implies that ΔVDIF has a different contribution to the ozone budget between the surface (source) and in the lower boundary layer (sink) and that there is a strong impact of ΔVDIF on surface ozone in both daytime and nighttime. ΔCHEM contributes +2 ppbv h−1 in daytime and −1 ppbv h−1 in nighttime to the ozone change rate at 488 m, respectively, indicating that chemistry is not a major source/sink of ozone at the height of 488 m. In noon when chemical production is intense, however, we find that ΔCHEM exhibits a positive contribution at ∼200–1000 m, while ΔVDIF exhibits a negative contribution at ∼ 200–1000 m but positive at the surface. These budgets are consistent with previous studies conducted in Hong Kong (Wang et al., 2015) and Guangzhou (Xu et al., 2023), indicating that surface ozone is mainly contributed by vertical diffusion from ozone-produced photochemistry at higher altitudes in urban Guangzhou.
3.2 Nighttime ozone in the residual layer and affecting factors
Our analyses above show that the mean height of the nighttime stable boundary layer at the Canton Tower is typically lower than 488 m, allowing us to use measurements at the 488 m height from the Canton Tower to probe into the ozone level in nighttime RL. This represents a major advantage of the Canton Tower for analyzing nighttime ozone evolution in both the stable boundary layer and the RL, compared with other existing tower measurements in other parts of China with a limited observation height of less than 400 m (Qiu et al., 2019; L. Li et al., 2022; Y. S. Liu et al., 2022). We take advantage of this feature to examine RL's ability to serve as a reservoir of ozone and its influencing factors.
We examine in Fig. 5 the nighttime ozone residual ratio at different heights, defined as the ratio of ozone concentrations averaged over nighttime to that averaged over the afternoon (14:00–17:00 LT). We note that this ratio at a certain height only quantifies the averaged level of nighttime ozone compared to the afternoon when ozone concentrations typically reach the daily peak and does not account for additional influence of horizontal transportation and vertical mixing. However, it can still serve as a useful metric to quantify to what extent ozone in the afternoon can be reserved in the nighttime. As shown in Fig. 5, the nighttime ozone residual ratio increases with altitude. In particular, the residual ratio at 488 m ranges from 43 % in July to 90 % in January, remarkably higher than that in the other three layers of 29 %–51 %. It indicates that except for July, ozone at the 488 m height during nighttime can, on average, reach about 70 % or above of the afternoon ozone level. The much larger nighttime ozone residual ratio between the layers also suggests that nighttime ozone at 488 m is decoupled well from the other three vertical layers. It is consistent with our analyses from PBLH that measurement at 488 m can be representative of the RL.
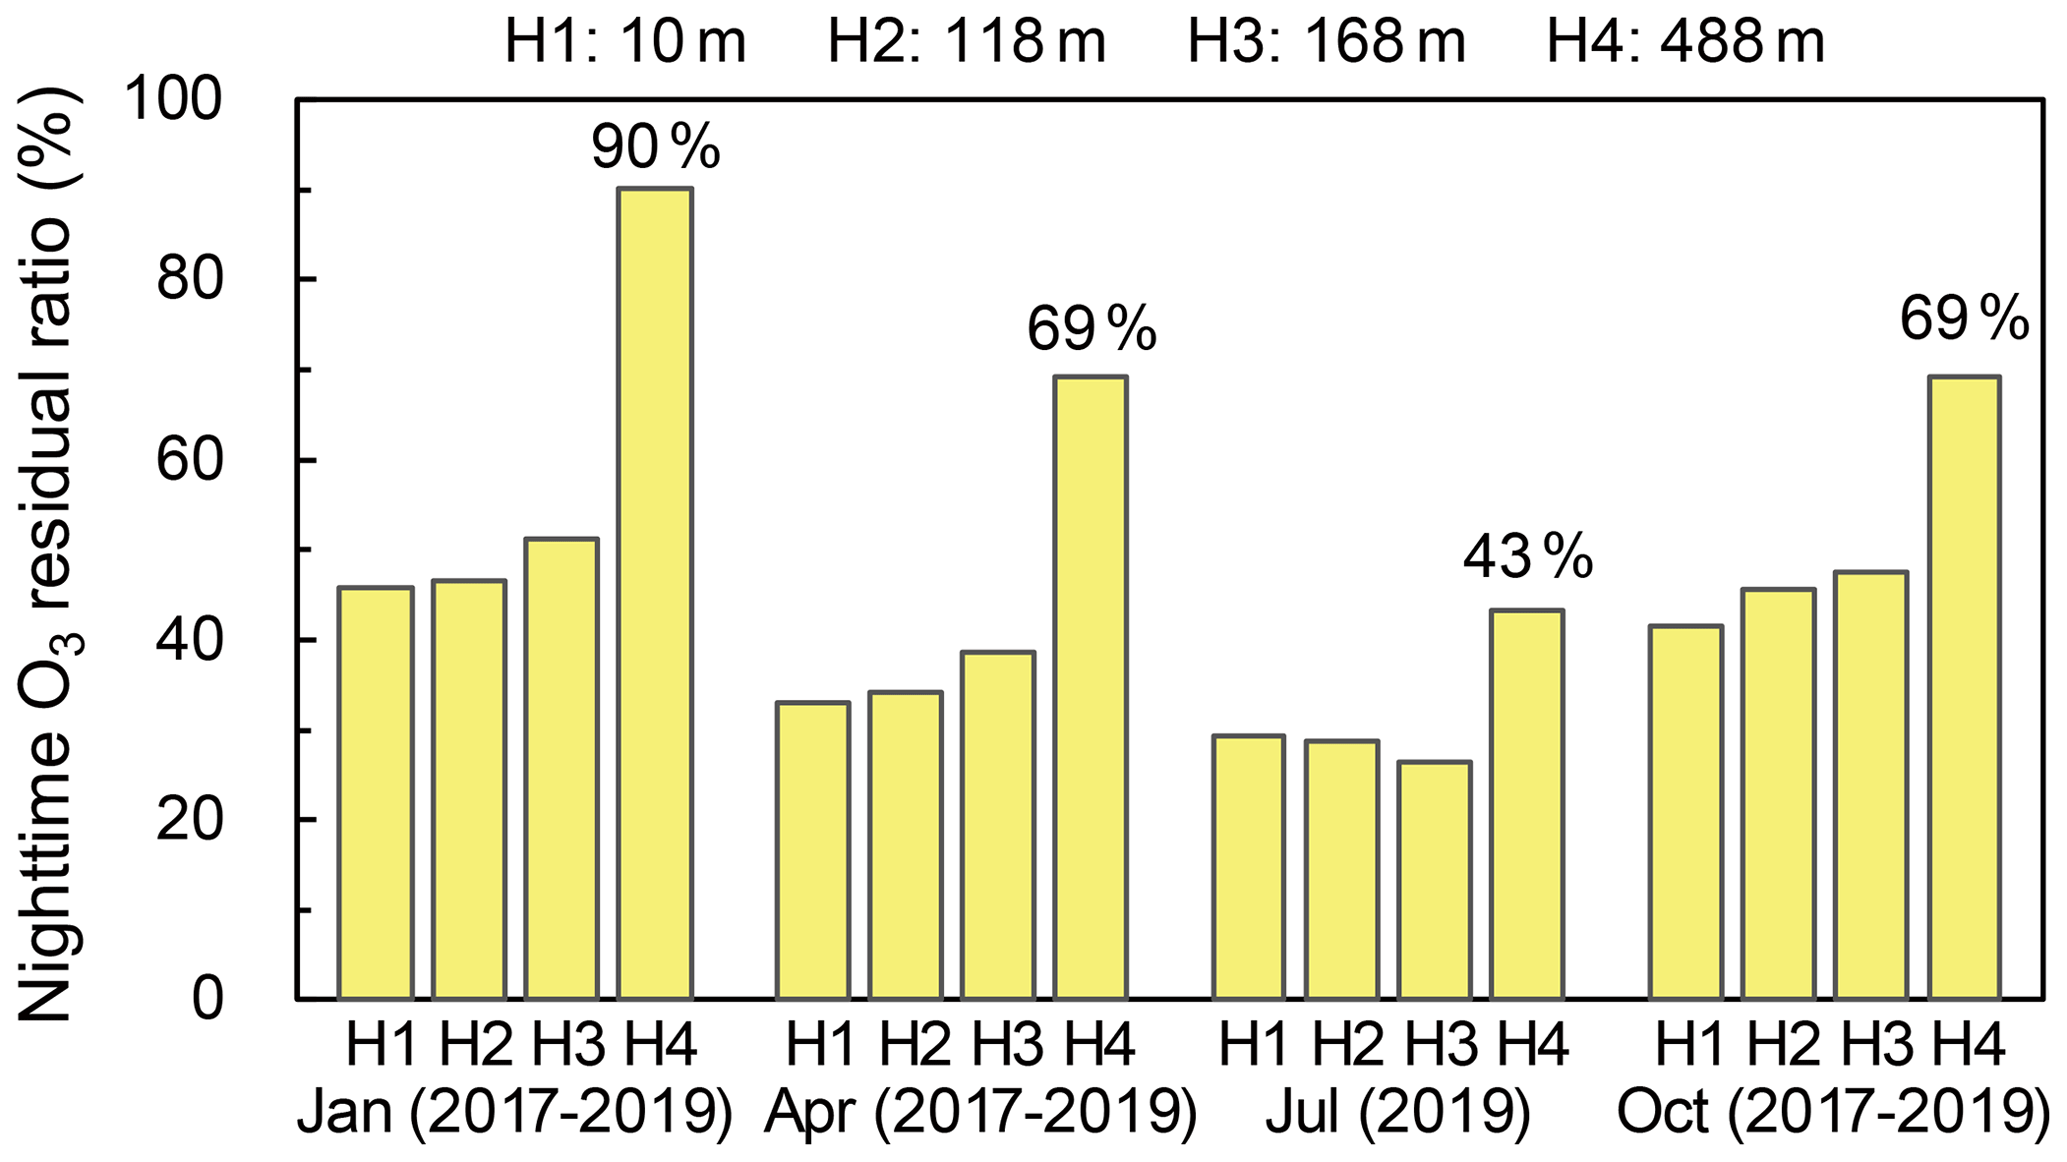
Figure 5The nighttime ozone residual ratio at different heights in the lower boundary layer in four seasons obtained from the Canton Tower measurements, 2017–2019. The nighttime ozone residual ratio is defined as the ratio of the ozone concentrations averaged over nighttime (20:00–07:00 LT) to that averaged over the afternoon (14:00–17:00 LT).
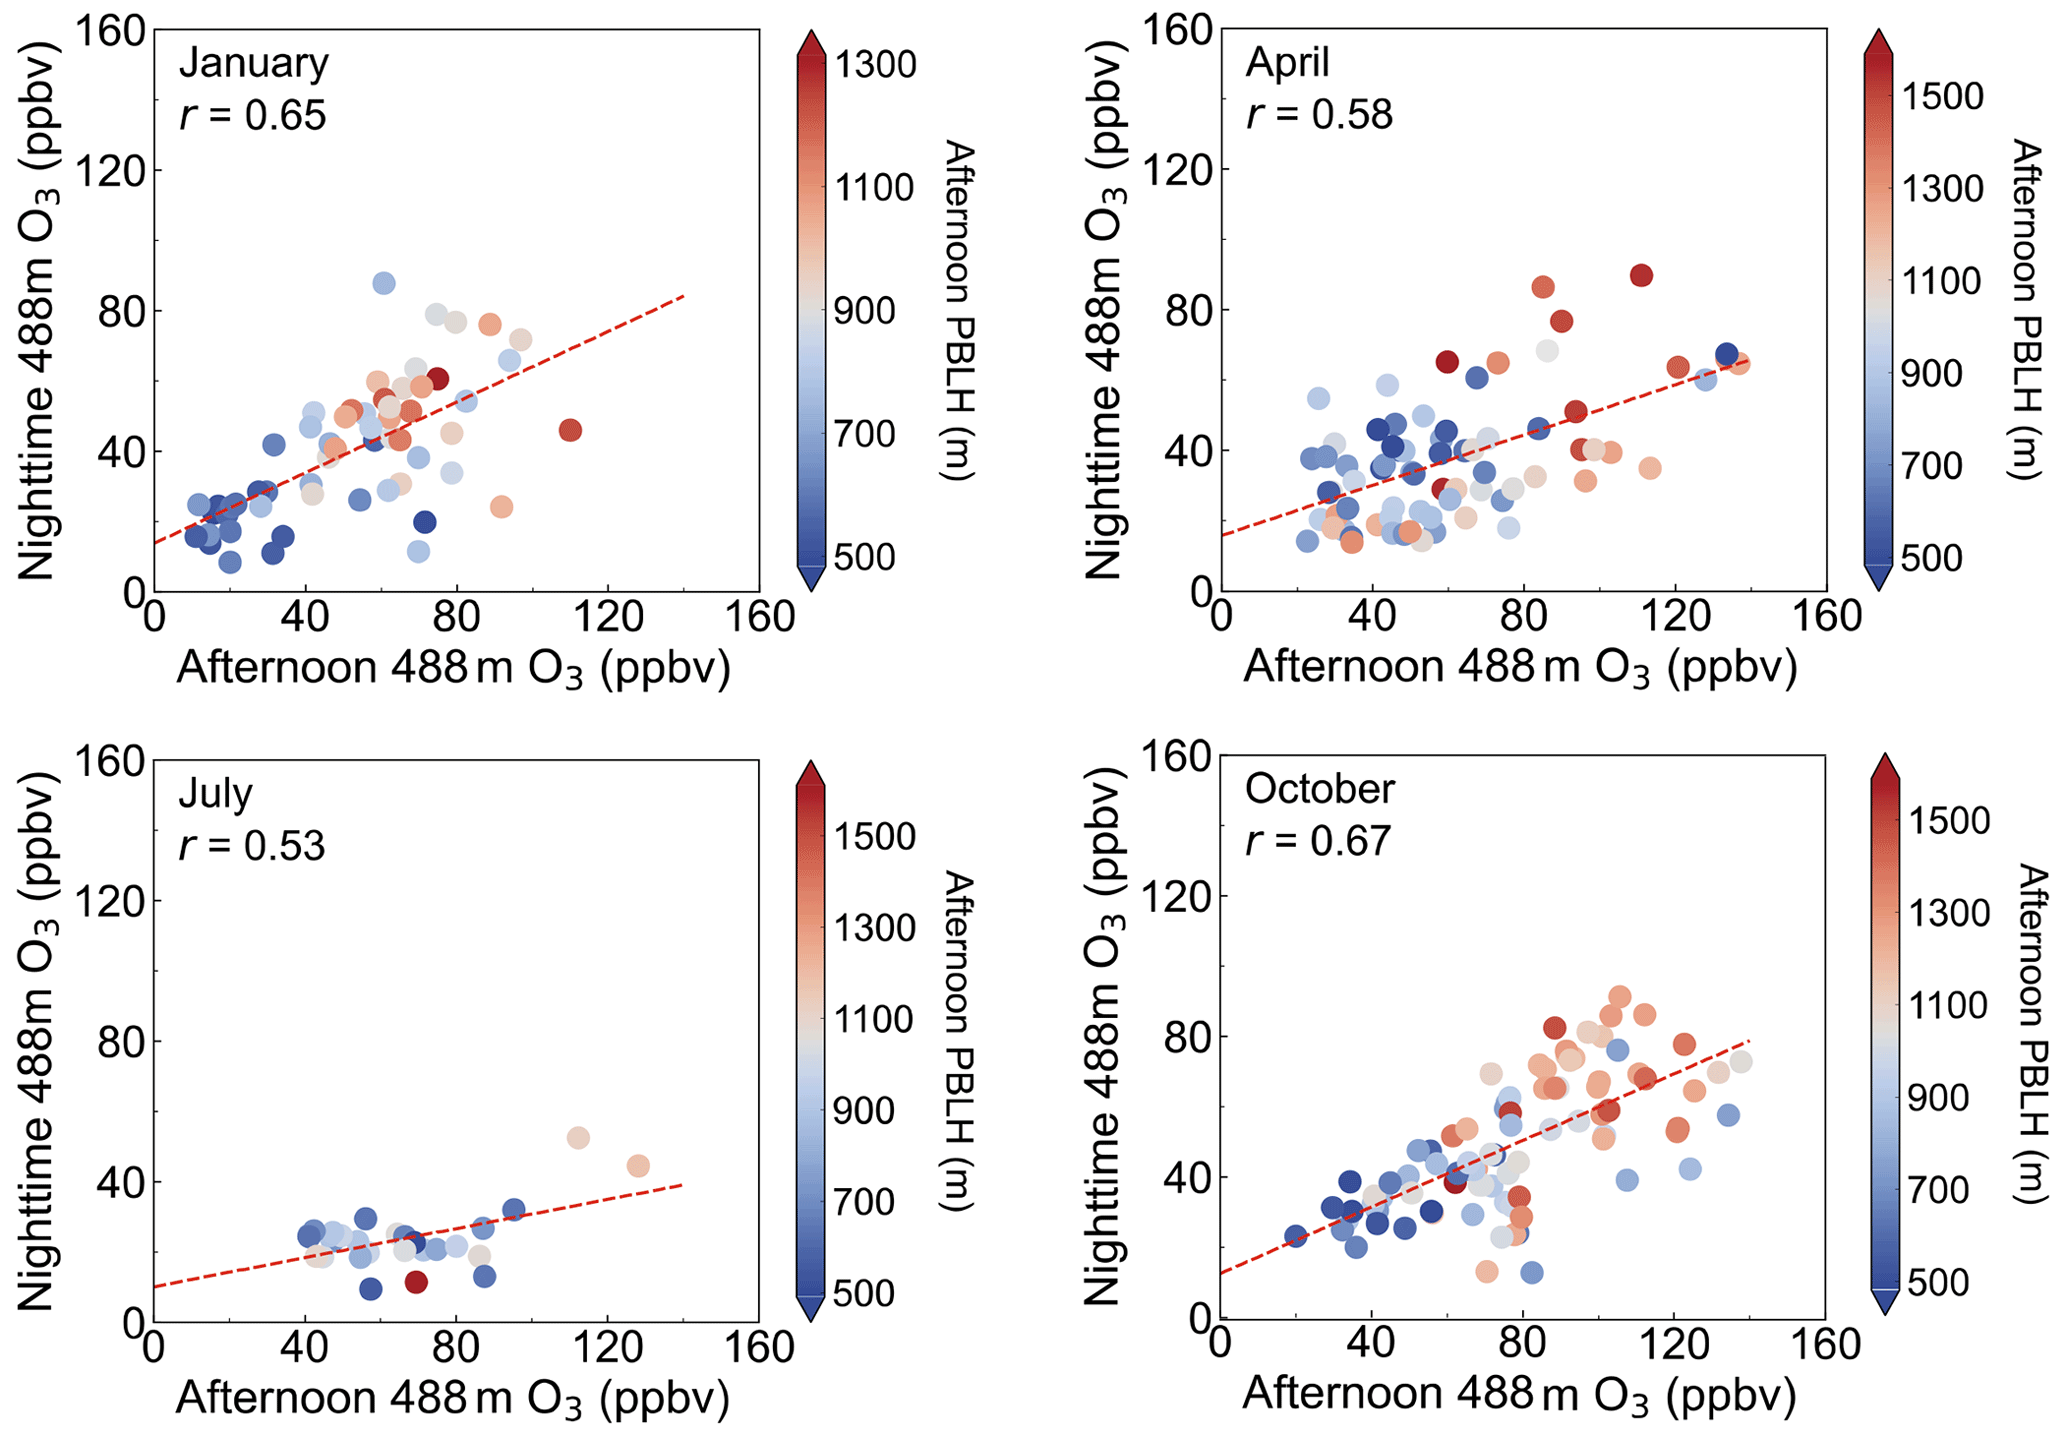
Figure 6Dependence of the nighttime (20:00–07:00 LT) 488 m ozone concentrations on the afternoon (14:00–17:00 LT) 488 m ozone concentrations. r represents the correlation coefficient between the two variables. The dashed red line is fit from the two variables by a first-order polynomial. The color represents the planetary boundary layer height (PBLH) obtained from the ERA5 reanalysis data averaged over the afternoon.
We then analyze the factors affecting the nighttime ozone level in the RL. The high ozone residual ratio at 488 m as shown in Fig. 5 suggests ozone concentrations in the afternoon largely determine nighttime ozone in the RL. Figure 6 shows a strong dependence of nighttime ozone concentrations at 488 m on those in the afternoon, with the correlation coefficients ranging from 0.53 to 0.67 in different months. Such strong correlation between the nighttime and afternoon ozone concentration is not observed at the 10 m measurement, reflecting the different ozone budgets in the nighttime stable boundary layer and the RL. We also see that both high daytime and high nighttime ozone concentrations are linked to high PBLH. High PBLH is typically coincident with high air temperature that favors ozone chemical production in a NOx-rich environment (Fu and Tian, 2019; Lu et al., 2019a) and also features vigorous atmosphere turbulence that enhances the vertical mixing of ozone (Dai et al., 2023), allowing ozone-rich air from higher altitudes and chemically produced ozone near the surface to mix with air in the lower boundary layer.
High ozone in the afternoon convective mixing layer provides the source of nighttime ozone in the RL, but whether ozone can be reserved in the RL also depends on nighttime mixing of air between the RL and the stable boundary layer. We then investigate the dependence of nighttime 488 m ozone concentrations on the concurrent temperature vertical lapse rate γ (), an indicator of atmospheric stability, derived from the temperature measurement between the 10 and 118 m heights. Figure 7 illustrates the clear positive dependence of the 488 m ozone concentrations on γ in nighttime for all seasons. In the presence of the temperature inversion (γ > 0), the mean nighttime 488 m ozone concentrations can reach 52–68 ppbv in January, April, and October, which is significantly higher than ozone concentrations with γ < 0, ranging from 32–52 ppbv.
We further compare the nighttime vertical ozone profiles with γ < 0 (non-inversion) versus that with γ > 0 (inversion) in Fig. 7. Here we rule out cases with wind speeds above 2 m s−1 at four vertical layers to exclude the possible influence of horizontal transport. We find a significantly steeper ozone vertical gradient when atmospheric inversion occurs (γ > 0) with ΔOH10–488 m ranging from 7.6–12.9 ppbv hm−1 compared to 3.5–6.1 ppbv hm−1 in the absence of temperature inversion. The presence of inversion also leads to a much lower nighttime stable boundary layer of 98 ± 72 m compared to non-inversion cases, leading to a strong ozone gradient between 10 and 118 m. The atmospheric inversion constrains the exchange of ozone at 488 m and ozone inside the stable boundary layer that are subject to strong chemical destruction and deposition, thus allowing high ozone concentrations to remain in the RL.
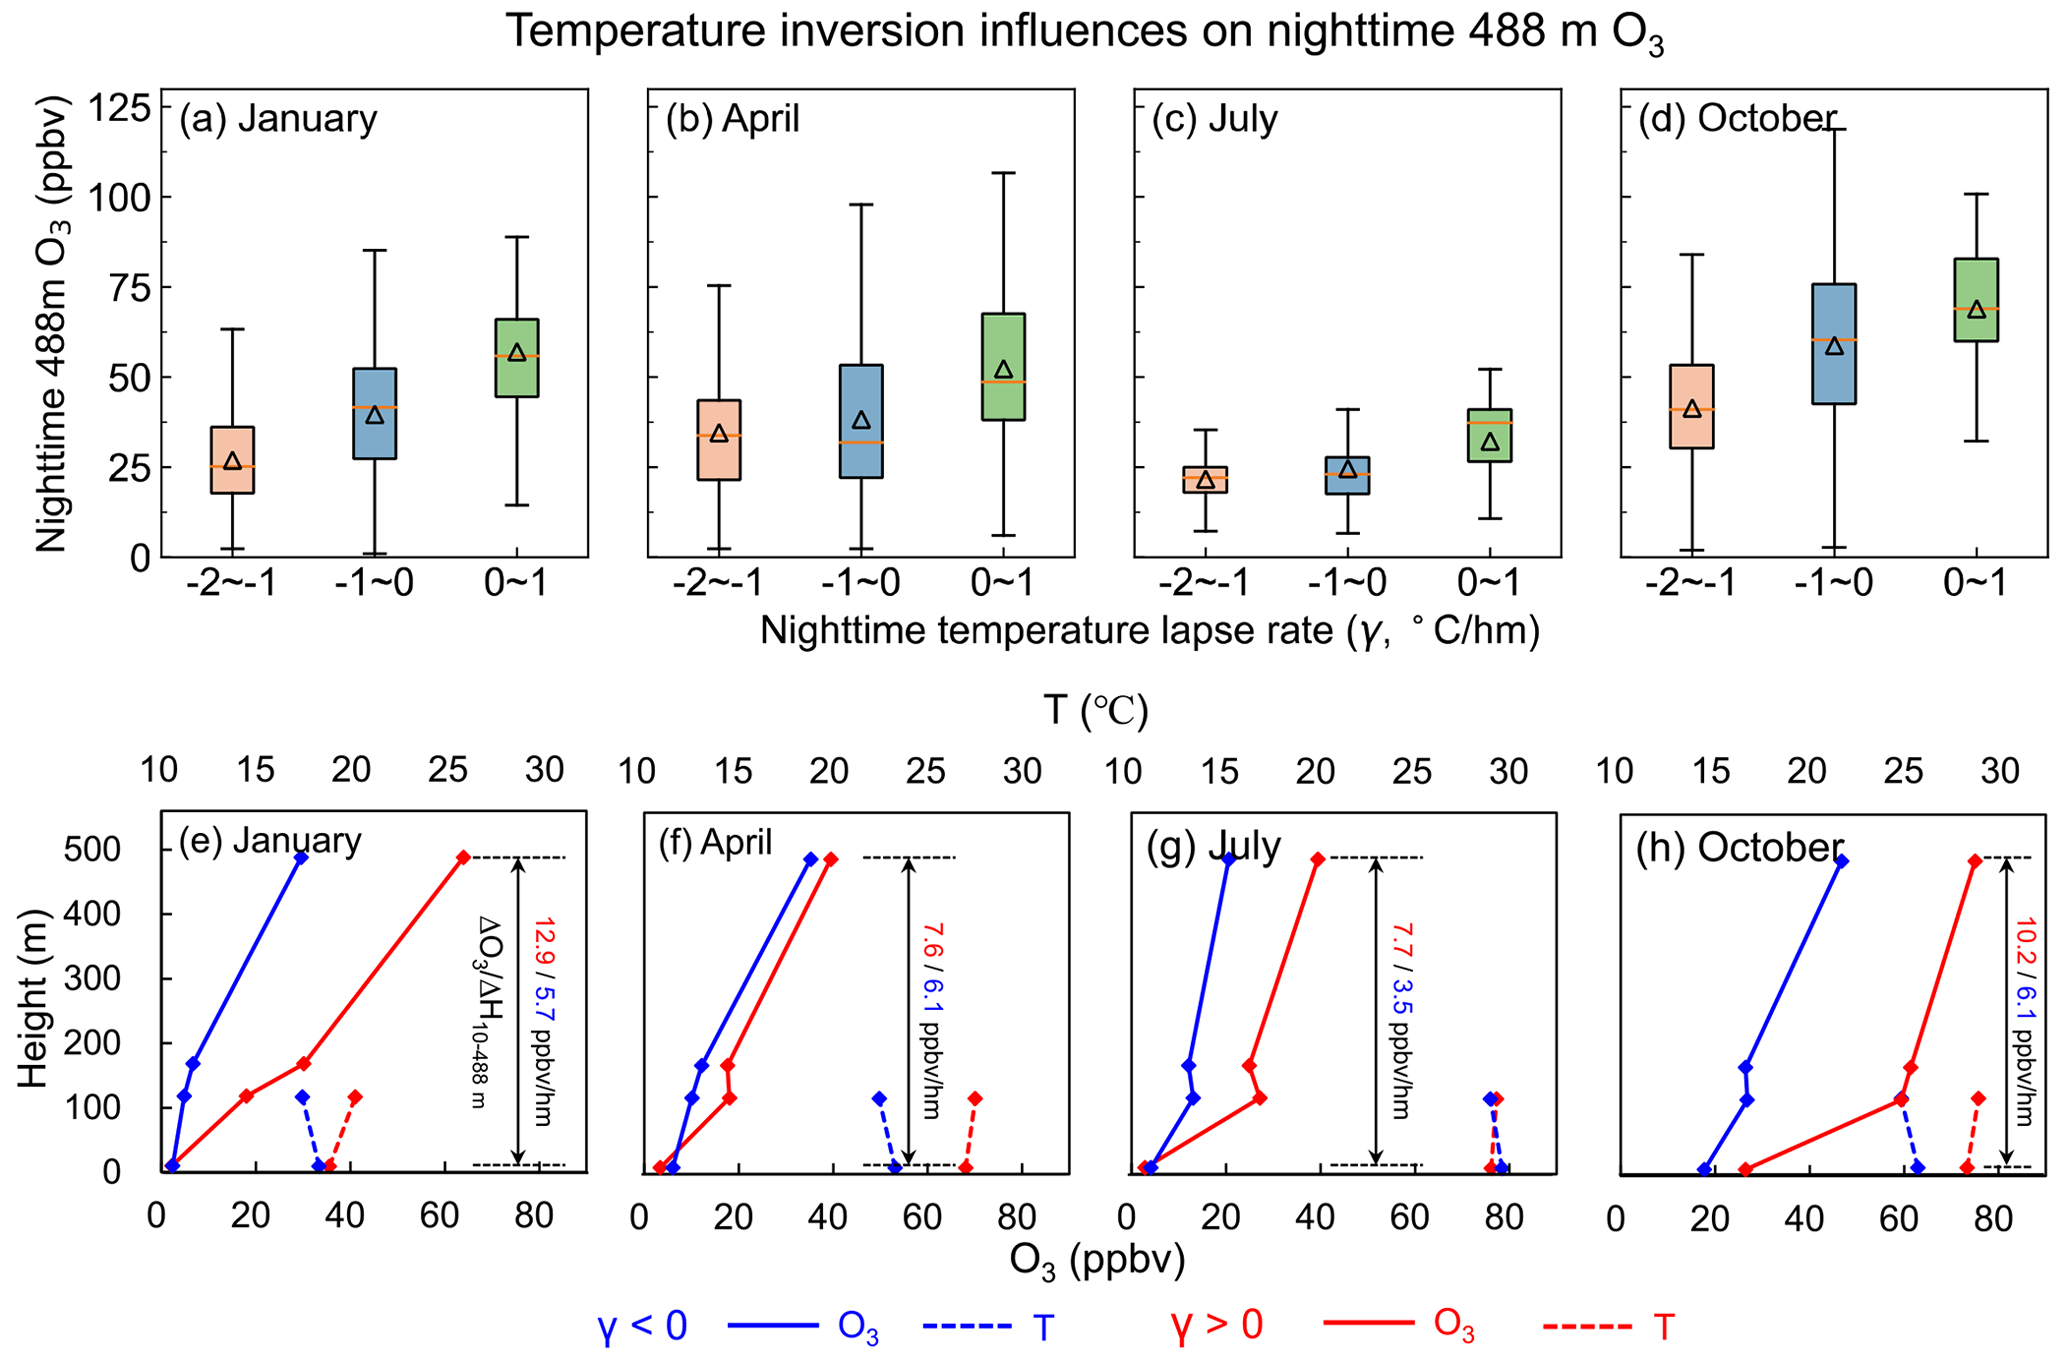
Figure 7Dependence of nighttime 488 m ozone concentrations on temperature inversion, categorized by the temperature lapse rate γ. Panels (a), (b), (c), and (d) show the box-and-whisker plots (minimum, 25th percentile, 50th percentile, 75th percentile, and maximum) of nighttime 488 m ozone concentrations on different ranges of γ. Panels (e), (f), (g), and (h) show the nighttime vertical ozone (bottom x axis) and temperature profile (top y axis) with γ < 0 (blue lines) versus those with γ > 0 (red lines). ΔOH10–488 m represents the vertical gradient of ozone between 10 and 488 m.
Previous studies have suggested using nighttime Ox (Ox= O3 + NO2) concentrations to indicate nighttime ozone in the RL (Wang et al., 2018; Tan et al., 2021; C. He et al., 2022), based on the rapid nighttime chemical conversion from ozone to NO2 (O3 + NO → NO2 + O2) at the surface. Our long-term tower-based observations can be applied to evaluate this assumption. We find in Fig. 8 strong correlation coefficients between nighttime 488 m ozone and nighttime surface Ox of 0.76, 0.73, and 0.85 in January, April, and October, respectively, except for July with r= 0.23 that may be affected by the small data samples. The slopes of nighttime 488 m ozone to nighttime surface Ox are 0.67, 0.91, and 0.90 in January, April, and October, respectively, reflecting the influence of nighttime NOx emissions at the surface. Our analyses above prove that nighttime surface Ox can be a good indicator of nighttime ozone in the RL if there are no direct observations.
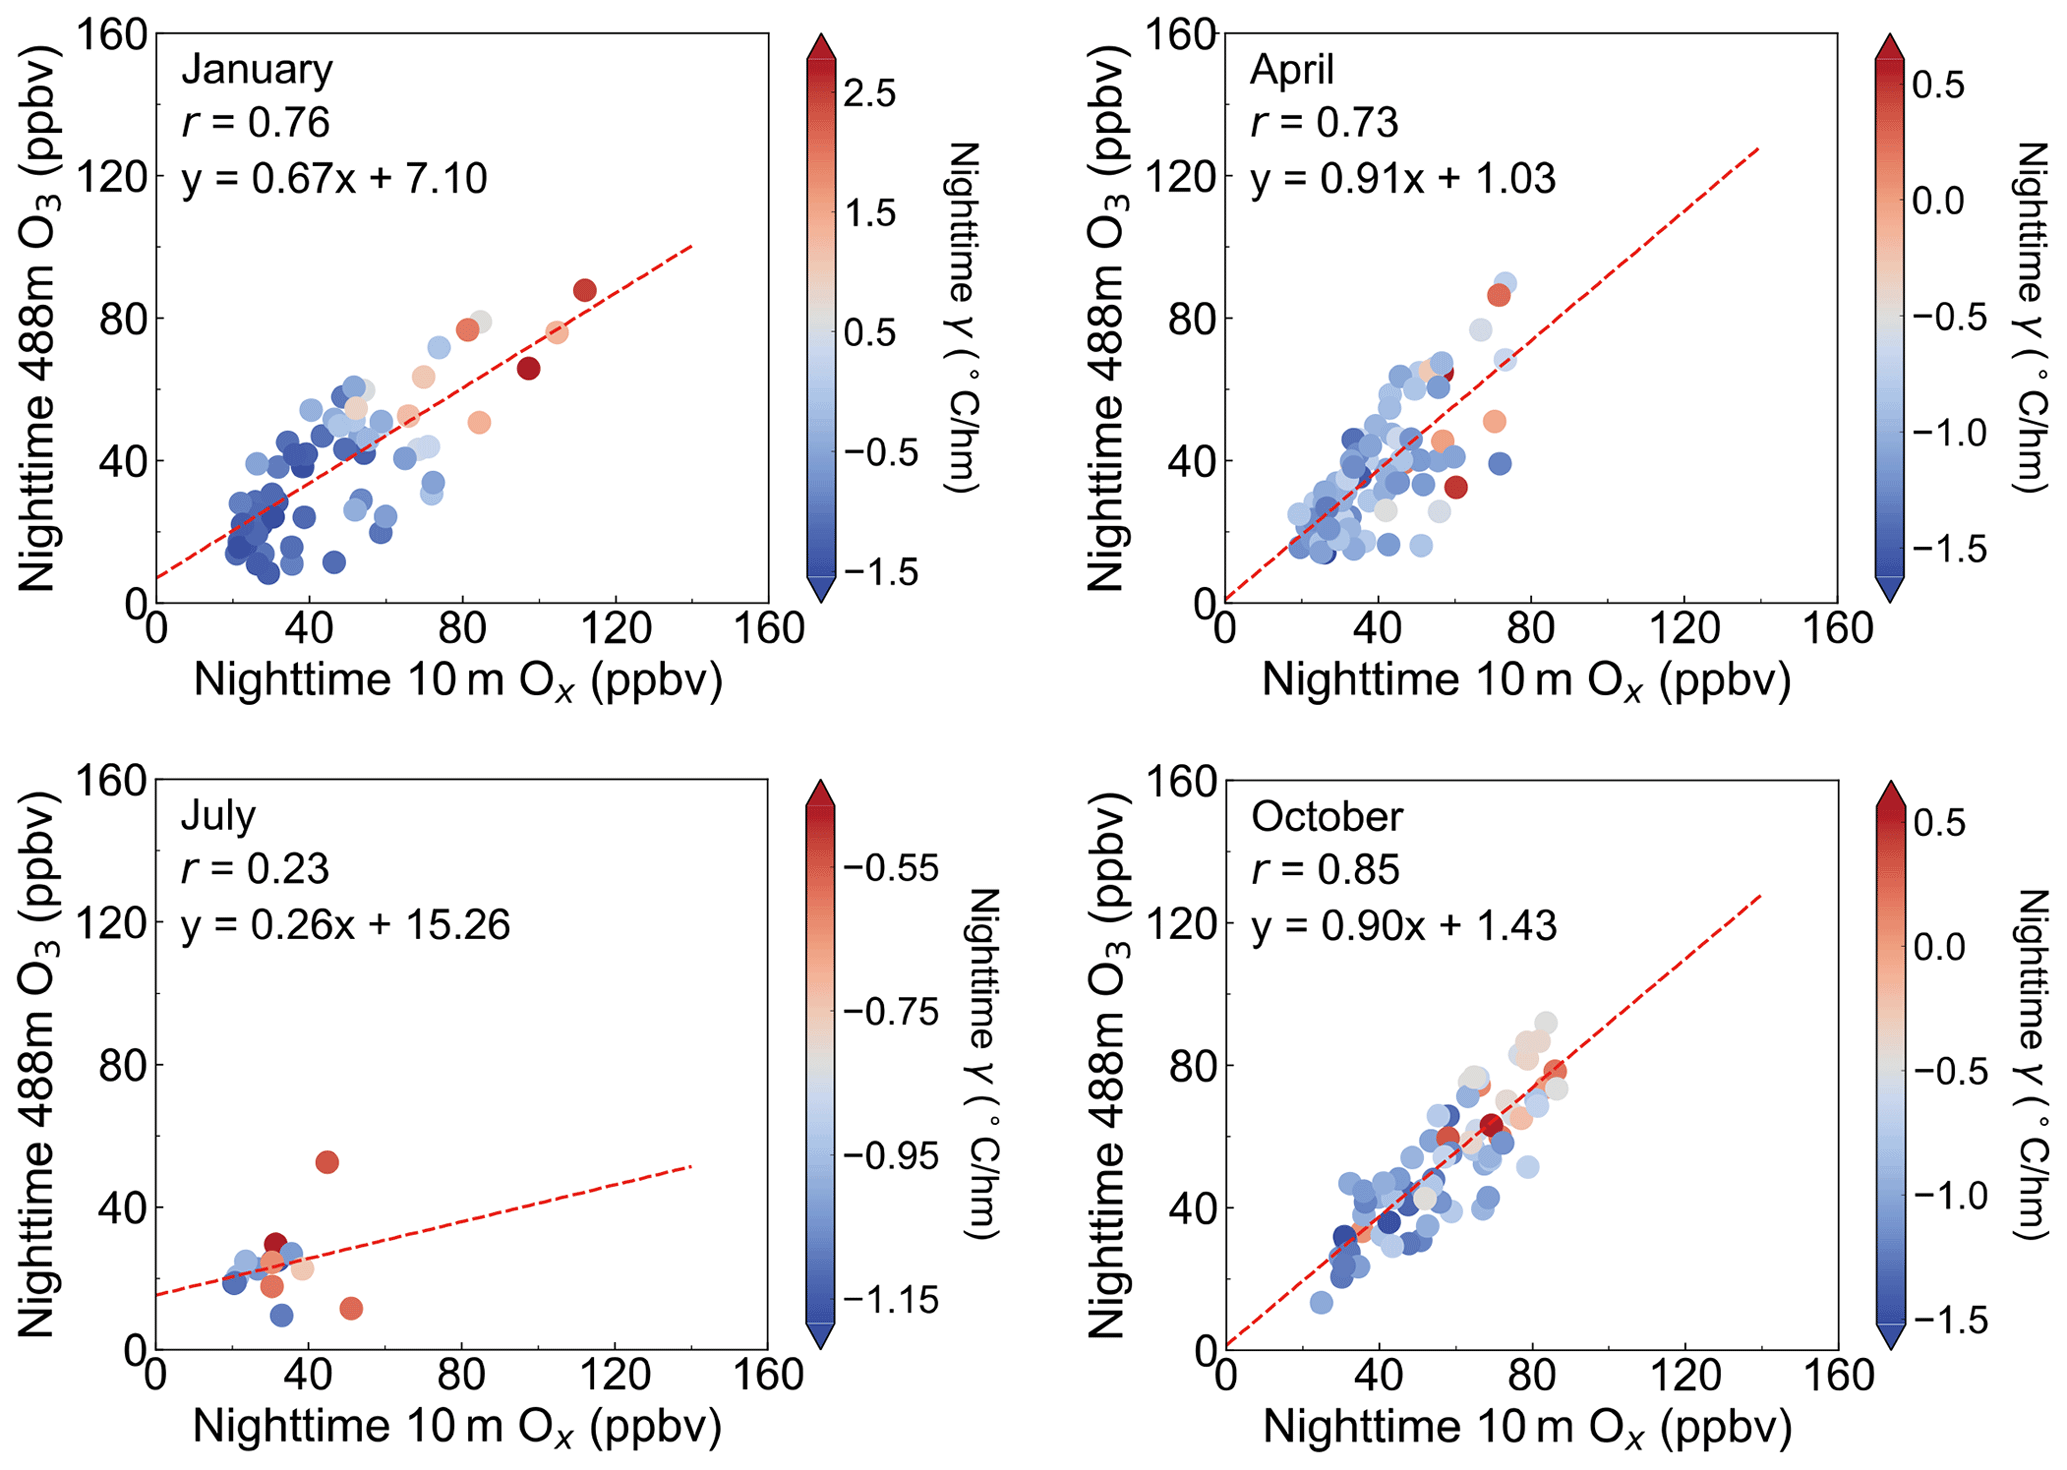
Figure 8Relationship between nighttime (20:00–07:00 LT) 488 m ozone concentrations and nighttime surface Ox (Ox= O3 + NO2) concentrations. r represents the correlation coefficient between the two variables. The dashed red line and the fitting formula are fit from the two variables by a first-order polynomial. The fill color represents the temperature lapse rate averaged over nighttime.
3.3 Nighttime surface ozone enhancement events linked to enhanced ozone mixing from the residual layer
The direct observations of ozone in nighttime RL allow us to examine its roles in modulating surface ozone air quality. This section discusses the role of nighttime RL ozone in the nighttime surface ozone enhancement events. Section 3.4 discusses its role in the following day's ozone air quality.
A previous study has reported a high frequency of nighttime ozone enhancement (NOE) events in China (C. He et al., 2022). A number of studies have suggested that enhanced nighttime vertical mixing induced by specific synoptic processes such as convective storms or low-level jets was a key driver for the NOE events, by allowing the ozone-rich air in the RL to mix with the surface layer ozone. These studies were mainly based on surface measurements, while the lack of direct measurements in the lower boundary layer and the RL limits the validation of the proposed mechanisms (Zhu et al., 2020b; C. He et al., 2022; Wu et al., 2023). Here our 3-year tower-based observation at the Canton Tower provides a unique opportunity to examine the proposed mechanism for such events. We follow previous studies to define an NOE event if surface (10 m) ozone concentration increases by more than 5 ppbv (ΔO > 5 ppbv h−1) in one of any two adjacent hours during nighttime (Eliasson et al., 2003; Zhu et al., 2020b; C. He et al., 2022). For comparison, we also define a non-enhanced nocturnal ozone (NNOE) event when the maximum ozone enhancement in all adjacent hours is less than 1 ppbv (maximum of ΔO < 1 ppbv h−1). We find 75 NOE events (24 %) among all the days in 2017–2019 with available observations. This ratio is generally consistent with a recent study that reported an NOE frequency of 19 % in Guangzhou based on 2014–2019 observations at six monitoring sites (C. He et al., 2022). The frequency of NOE events follows the seasonal pattern of autumn (37 %) > winter (32 %) > spring (11 %) > summer (3 %), which is consistent with Wu et al. (2023) for the period 2006–2019 in the Pearl River Delta region, which also shows a higher frequency in autumn and a lower frequency in summer.
Figure 9 shows the mean nighttime evolution during the NOE events at the four different observation heights at the Canton Tower. We find ozone enhancement of 8 ppbv at the surface (10 m) level and 4 ppbv at 118 and 168 m between 00:00 and 05:00 LT when averaged over all 75 events. The small magnitude of the ozone increase reflects the different occurrence times of NOE events among individual events (Fig. S4), and we see large nighttime ozone enhancement by up to 47 ppbv in specific episodes. In comparison, we find that ozone decreases at the 488 m level, in contrast to ozone increases at the lower three levels (Fig. 9a). These features are not shown in NNOE events, when ozone concentrations decrease gradually between 18:00 and 01:00 LT and remain stable afterward for all vertical layers (Fig. 9b).
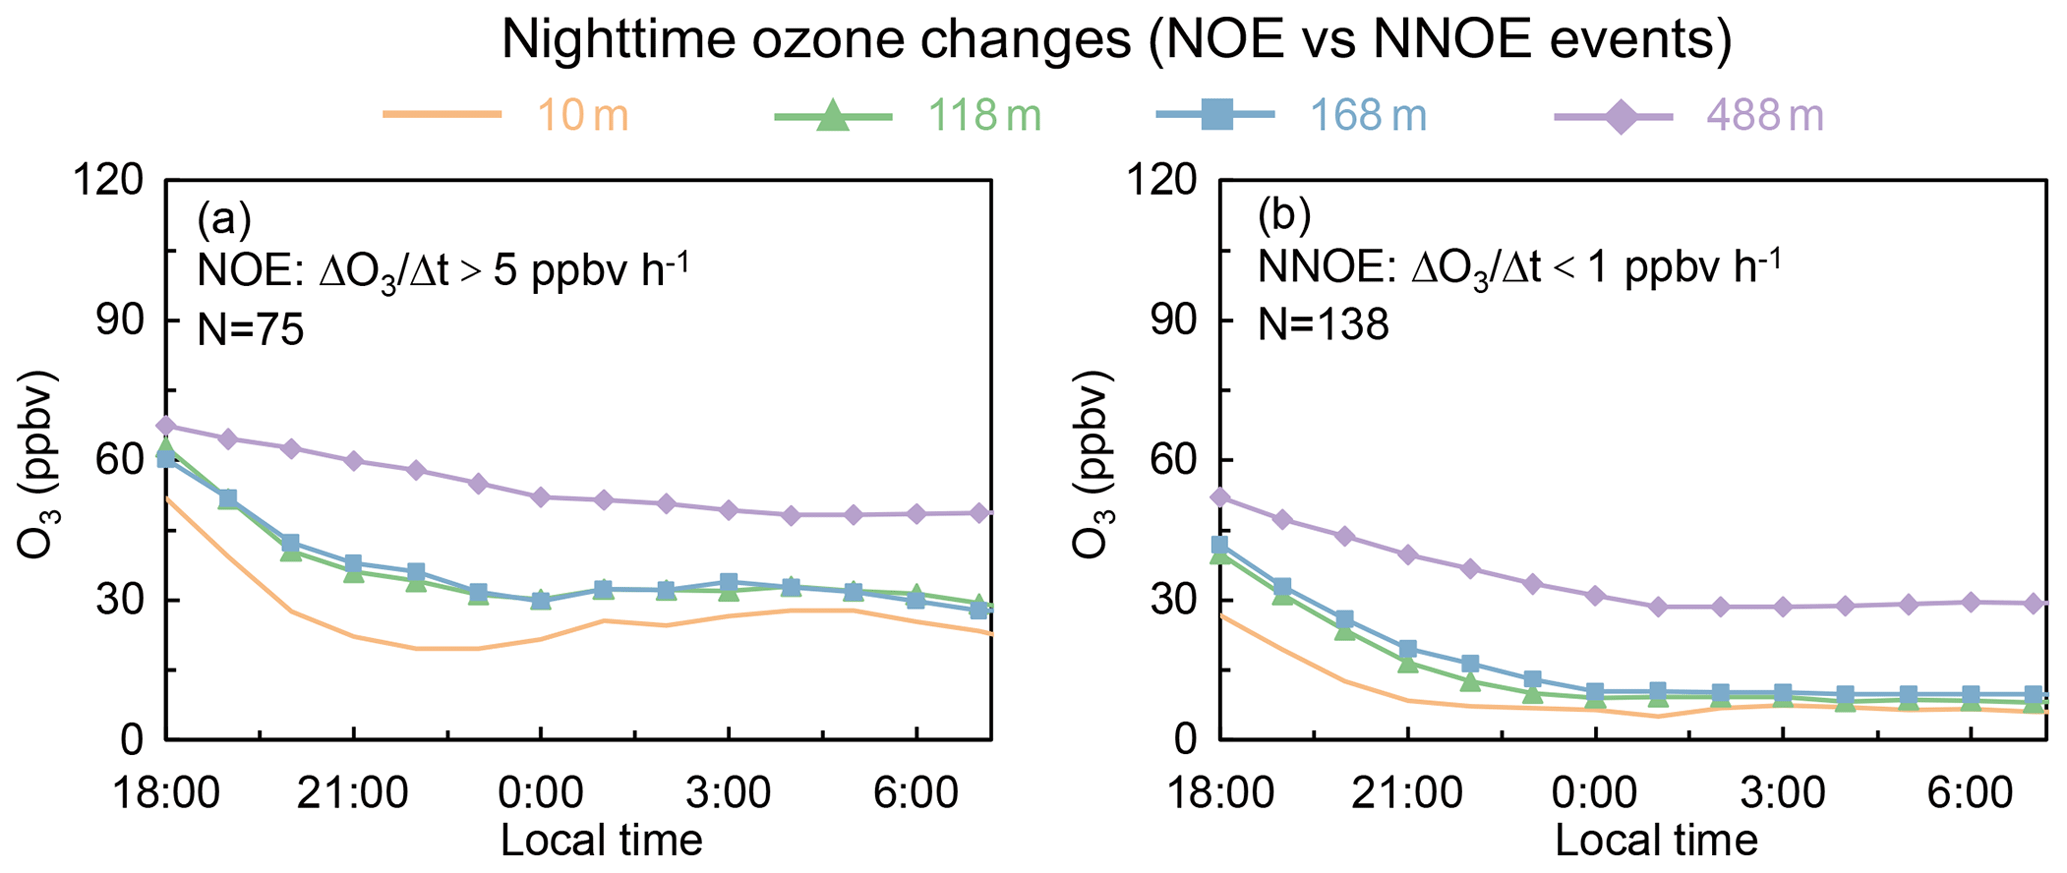
Figure 9Comparison of ozone time series between the nighttime ozone enhancement (NOE; maximum of ΔO > 5 ppbv h−1) and the non-enhanced nocturnal ozone (NNOE; maximum of ΔO < 1 ppbv h−1) events. Panels (a) and (b) show the nighttime ozone changes averaged over 75 NOE and 138 NNOE events in 2017–2019 with available observations, respectively.
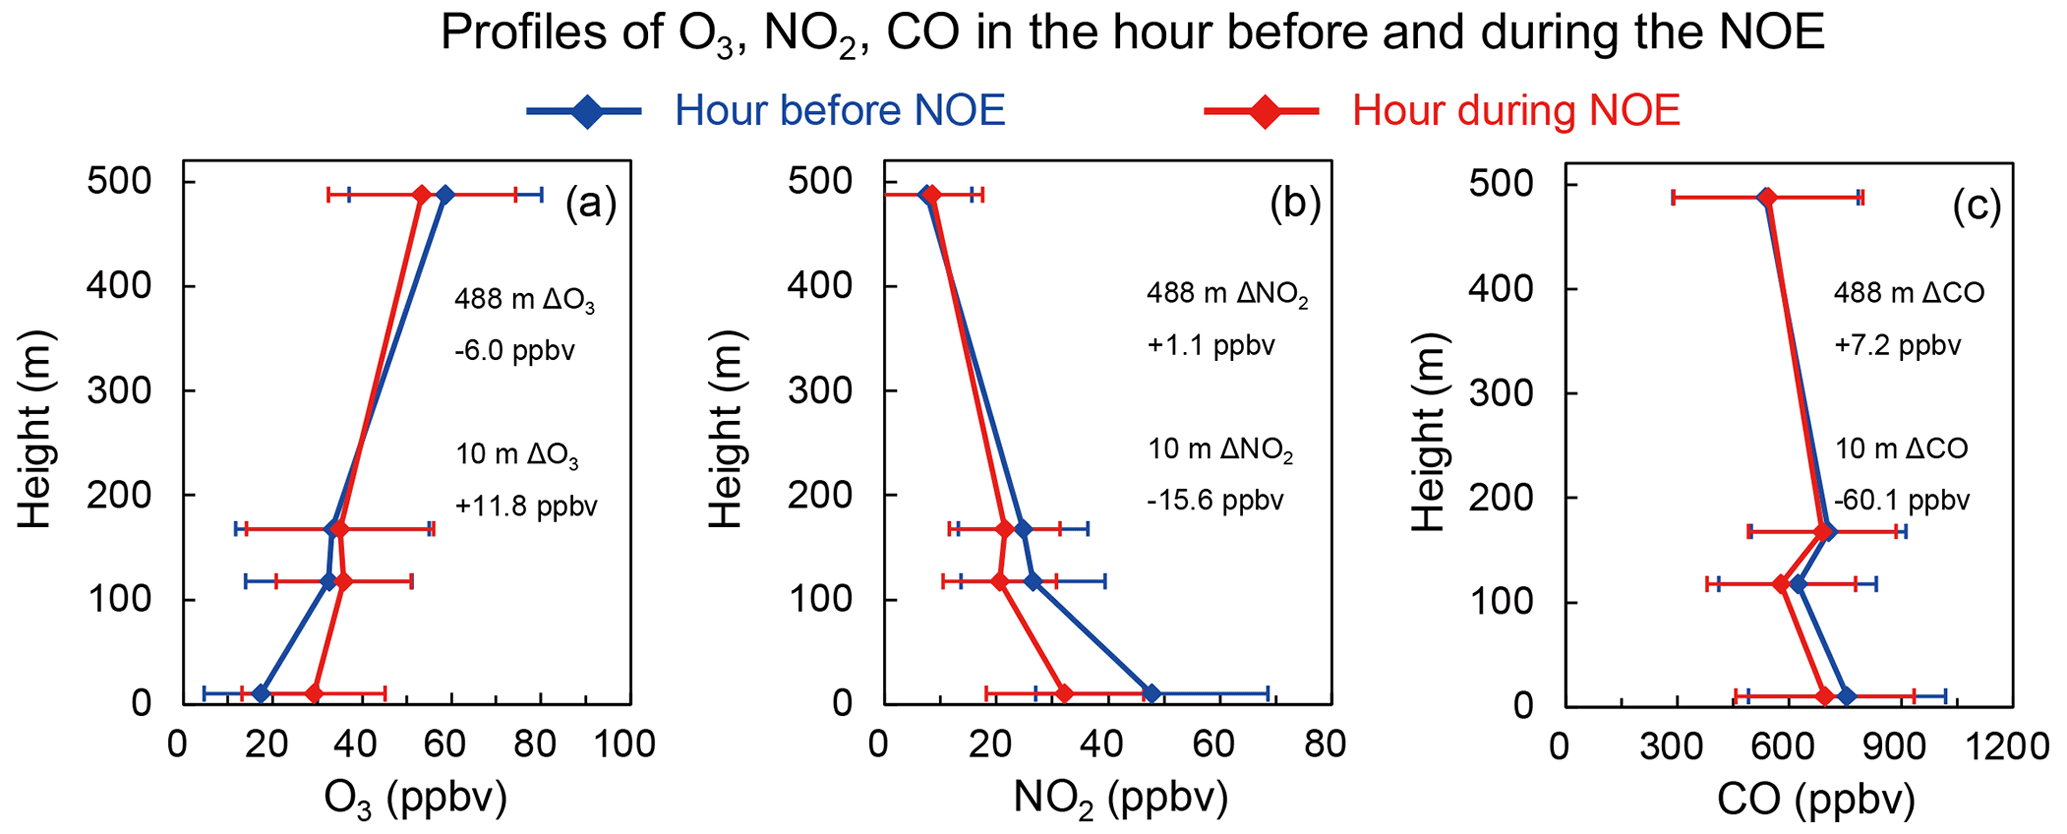
Figure 10Characteristics of ozone, NO2, and CO profiles before (blue lines) and during (red lines) the occurrence of the NOE event. ΔO3, ΔNO, and ΔCO represent the change in concentrations during the occurrence of the NOE event compared to the hour before the NOE event.
Figure 10 further compares the vertical profiles of ozone, NO2, and CO concentrations in the hour before and during the occurrence of NOE. We find significant ozone enhancement by 12 ppbv at the surface level, while ozone decreases by 6 ppbv at 488 m during the hour of the NOE occurrence. We also see sharp decreases in the NO2 and CO concentrations at the surface level but slight increases at 488 m, in contrast to the NNOE events when NO2 and CO concentrations at 488 m show continuous decreases. These features point to enhanced vertical mixing in the NOE events. Ozone concentrations are higher in nighttime RL than at the surface, whereas NO2 and CO concentrations are much higher at the surface as they are primarily released from anthropogenic emissions near the surface, while there is almost no direct source at higher altitudes near the Canton Tower. As such, the increase in NO2 and CO at 488 m during the NOE events, even though with very small magnitude, is most likely from the vertical mixing with surface-layer air mass or from horizontal transport of polluted air parcels. Thus, the averaged contrast change in ozone, NO2, and CO at the 488 m height versus that at the surface provides direct observational evidence that vertical mixing between the two layers is strengthened during the NOE events. The enhanced vertical mixing promotes the downward mixing of ozone-rich air from the RL to the surface while decreasing surface NOx concentrations and weakening the titration, thus contributing to the NOE events.
The CMAQ model simulation in October 2017 further supports the abovementioned mechanisms for the NOE events. As shown in Fig. 11, the model simulation suggests that vertical diffusion (ΔVDIF) is the major source of nighttime ozone near the surface (10 and 118 m), while it is a strong sink for ozone at the higher level. We find a significant difference in the magnitude of ΔVDIF between the NOE and NNOE. In particular, we see large and increasing positive ΔVDIF during the NOE events at 10 and 118 m, while negative ΔVDIF is found at 168 and 488 m (Fig. 11a). In comparison, ΔVDIF remains small during the NNOE events (Fig. 11b).
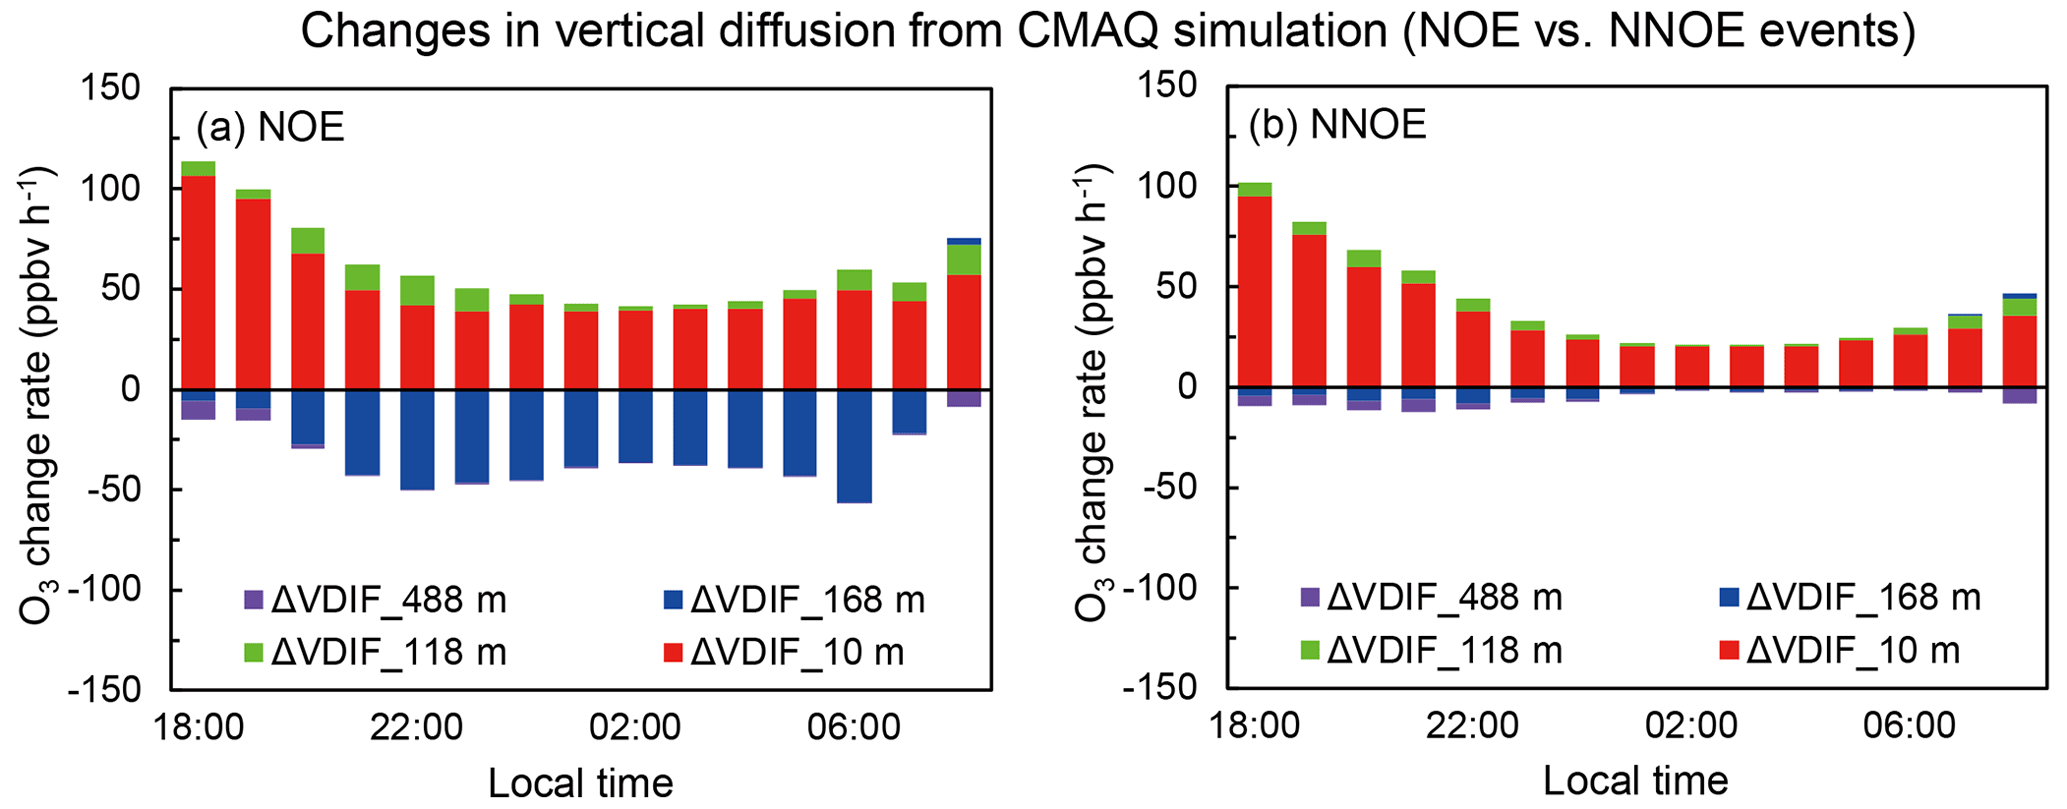
Figure 11Characteristics of vertical diffusion (ΔVDIF) during NOE and NNOE events at the four measurement heights at the Canton Tower. The budget terms of ΔVDIF are diagnosed from the CMAQ IPR module budget at the Canton Tower, October 2017.
We zoom in on the processes leading to NOE events in two episodes, 24 October (case I) and 28–29 October (case II) in 2017, as depicted in Fig. S5. We quantify the physical and chemical influences on the ozone budget at 02:00 and 00:00 LT when the observed ozone concentration at 10 m increases by 17 and 18 ppbv in case I and case II, respectively. The CMAQ model successfully captures the ozone enhancement in both episodes. At the surface level, ΔCHEM contributes significantly to ozone destruction, while ΔVDIF and ΔHADV positively contribute to ozone enhancement in both cases.ΔVDIF is the major impact factor for surface ozone enhancement in case I, while ΔVDIF and ΔHADV contribute equally in case II. We find that in case II, horizontal advection also contributes significantly in the boundary layer. This is associated with the occurrence of a low-level jet, as is evident from the high horizontal wind speed exceeding 12 m s−1 recorded as 950 hPa (from the ERA5 dataset) at midnight at the location at the Canton Tower (Fig. S6). The low-level jet not only brings air with a rich ozone concentration from the north, but also enhances vertical mixing by producing turbulent kinetic energy and weakening the decoupling of the RL and the stable boundary layer (C. He et al., 2022). This suggests a combined contribution of horizontal transport and vertical diffusion to the NOE event.
3.4 Significant contribution of nighttime residual layer ozone to the following day's daytime surface ozone
The observed high ozone concentrations in nighttime RL suggest that it can be a critical ozone source for the following day's surface ozone when the RL collapses with the development of the convective mixing layer after sunrise. Figure 12 shows that surface maximum daily 8 h average (MDA8) ozone the following day is positively correlated with the mean 488 m nighttime ozone, with an r of 0.67 (January), 0.47 (April), and 0.54 (October), except for July due to small data samples. We find that when the 488 m nighttime ozone is in the range of 60-80 ppbv, the surface-level MDA8 ozone the following day can reach 67 ppbv on average.
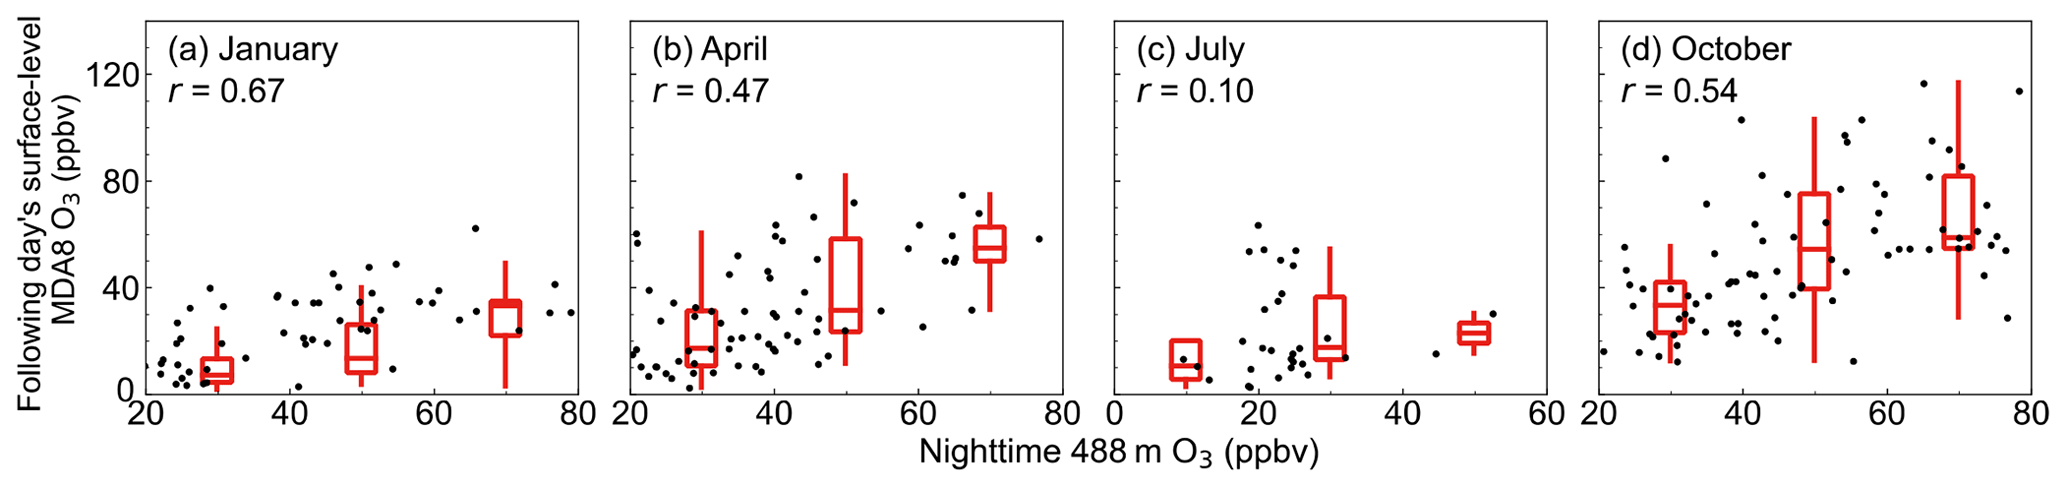
Figure 12Relationship between nighttime 488 m ozone and the following day's surface-level MDA8 ozone. r represents the correlation coefficient between the two variables. The box-and-whisker plots (minimum, 25th percentile, 50th percentile, 75th percentile, and maximum) represent the dependence of the following day's surface-level MDA8 ozone on different ranges of nighttime 488 m ozone.
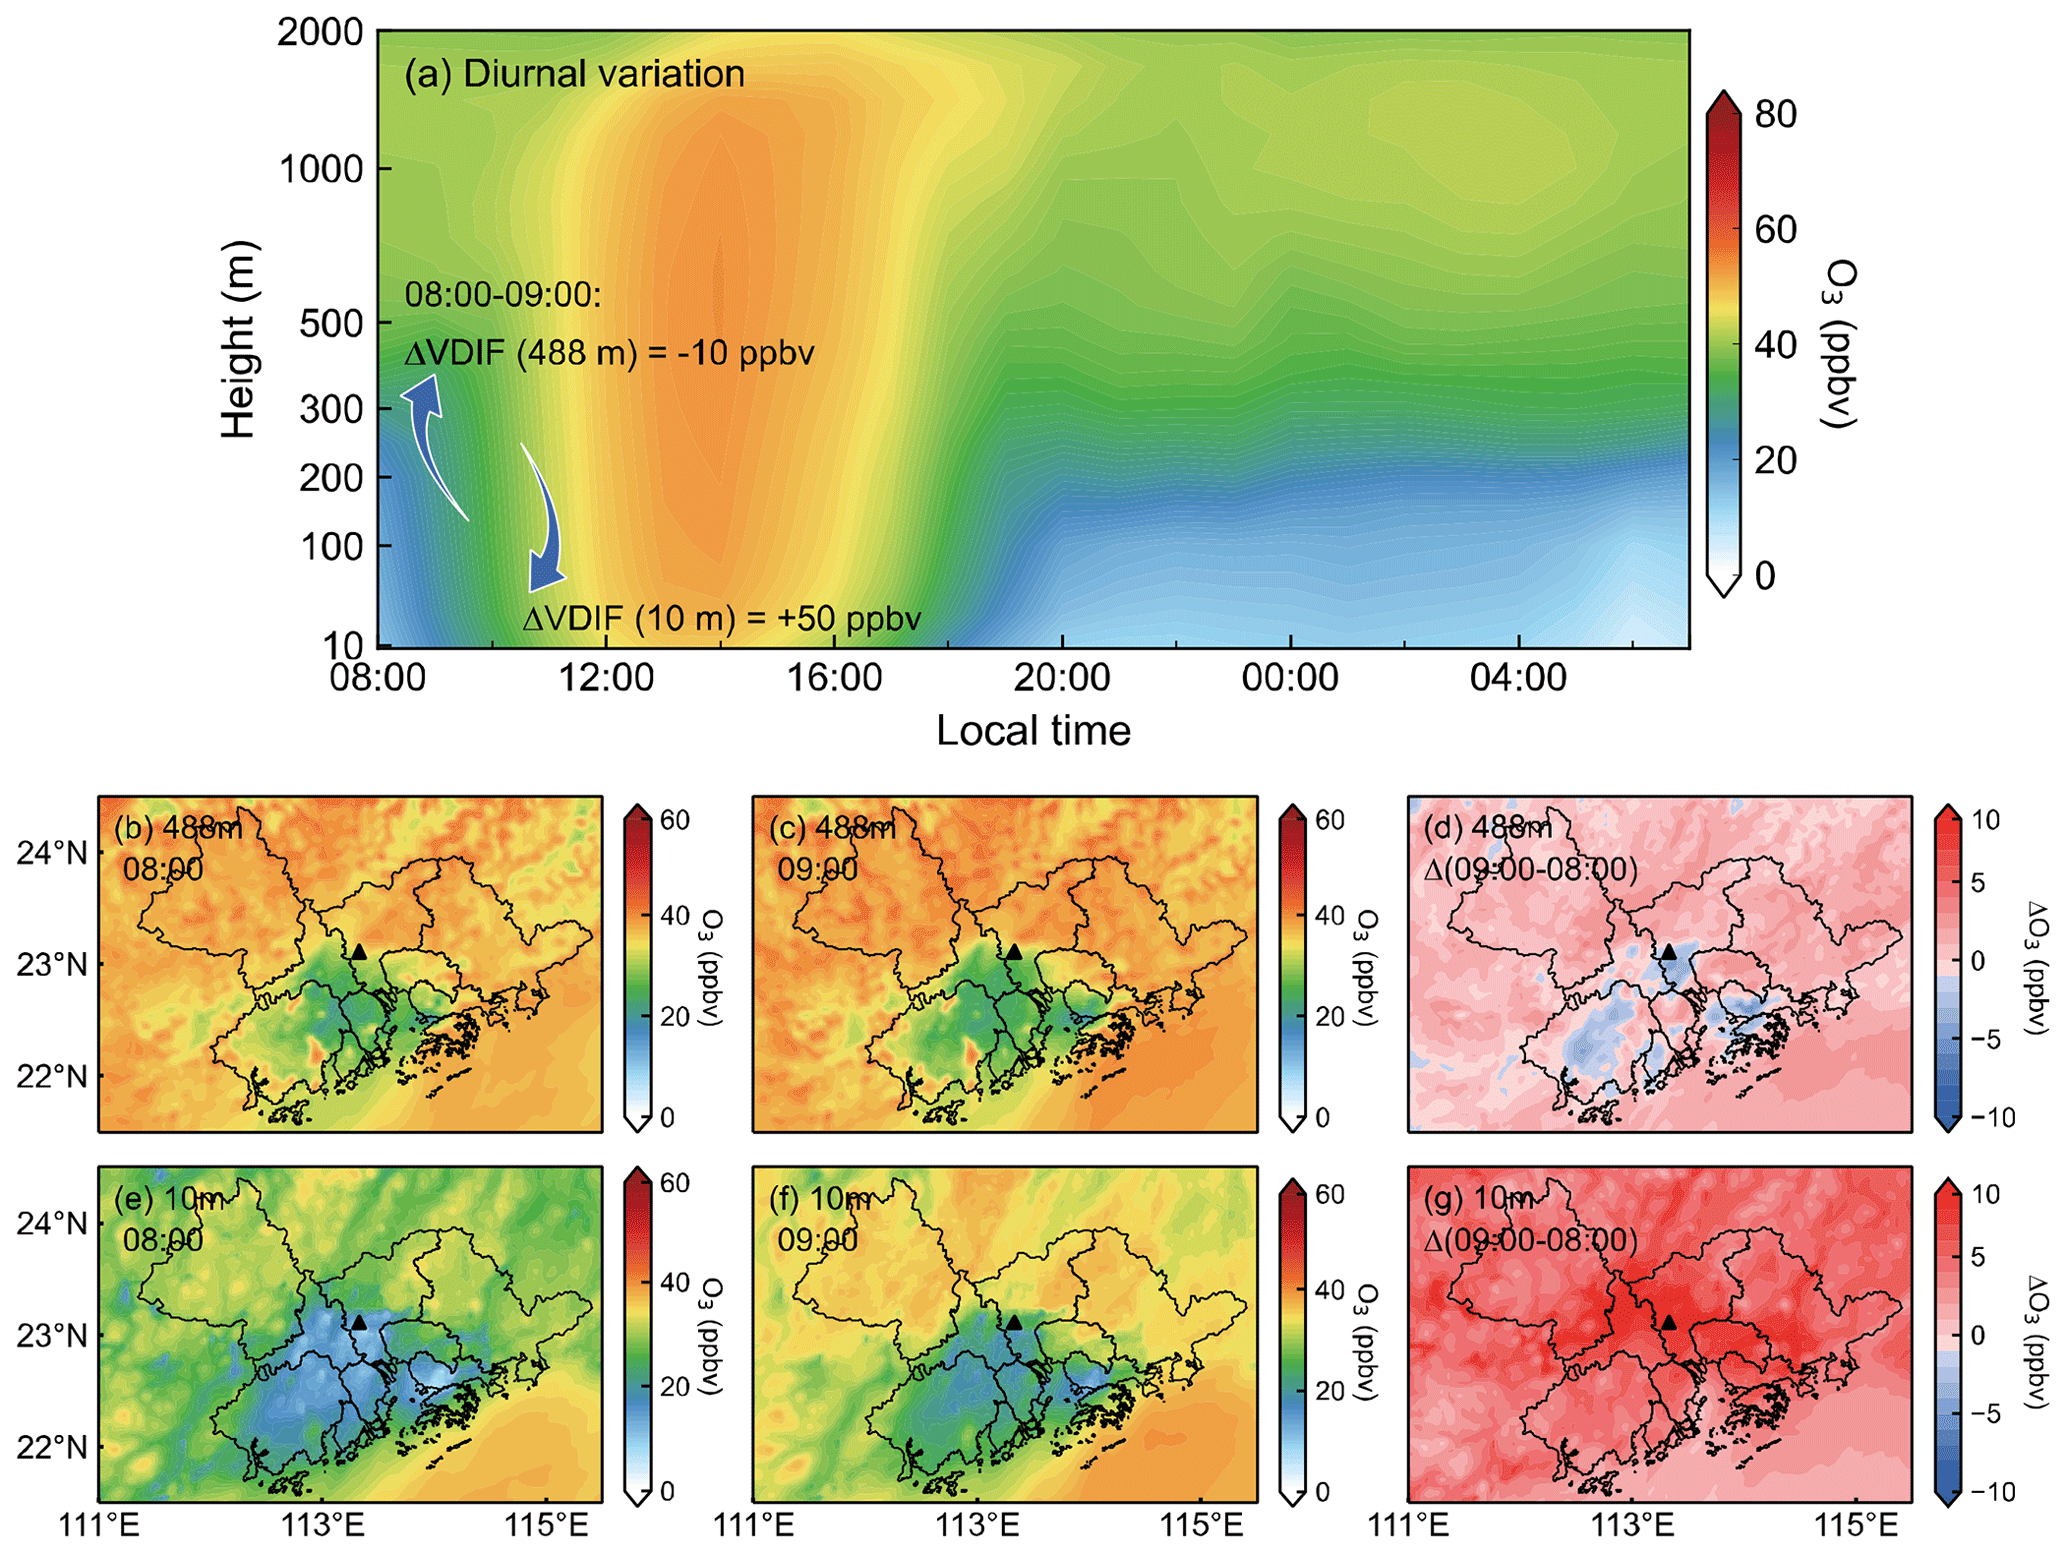
Figure 13CMAQ-simulated ozone changes in the early morning, October 2017. Panel (a) shows the simulated diurnal variation in ozone from the surface to 2000 m at the Canton Tower. The numbers denote the vertical diffusion (ΔVDIF) between 08:00 and 09:00 LT at the surface (10 m) and the 488 m height, diagnosed by the IPR module. Panels (b), (c), and (d) show the 488 m ozone concentrations at 08:00 and 09:00 LT and their difference. Panels (e), (f), and (g) are the same as panels (b), (c), and (d) but for the 10 m height. The triangle marks the location of the Canton Tower.
The observed high correlation between the mean 488 m nighttime ozone and surface MDA8 ozone the following day is tied to the enhanced downward mixing of the ozone-rich air in nighttime RL with the surface in the early morning. Figure 2 shows that the observed ozone at 10 m starts to increase at 08:00–09:00 LT, while the ozone at 488 m decreases concurrently. The CMAQ model simulation for October 2017 captures the contrast ozone change between 10 and 488 m at 08:00–09:00 LT (Fig. 13) and diagnoses a positive contribution of ΔVDIF of about 50 ppbv h−1 at the surface and a negative contribution of about −10 ppbv h−1 at 488 m, which can explain the observed ozone change at the 10 and 488 m heights. These analyses support the fact that the mixing of ozone-rich air from nighttime RL downwards to the ozone-poor air at the surface via the entrainment is an important mechanism for aggravating ozone pollution the following day.
The strong correlation between the nighttime RL ozone and the surface MDA8 ozone suggests that the level of nighttime RL ozone can be used as a powerful predictor for surface ozone air quality. It also has important implications for improving the bias in simulating daytime ozone using chemical transport models. Our CMAQ model simulation captures the positive relationship between nighttime ozone in the RL and the surface MDA8 ozone the following day with an r of 0.43. In addition, we find that the bias in simulated surface MDA8 ozone the following day shows a strong correlation coefficient (r= 0.74) with the bias in nighttime ozone in the RL to the observation (Fig. 14), suggesting that errors in modeling ozone in nighttime RL will propagate to surface ozone the following day. This result highlights the importance of improving the model's capability to simulate nighttime ozone in the RL, in terms of both chemical mechanisms and boundary layer dynamics, for daytime ozone air quality forecasts.
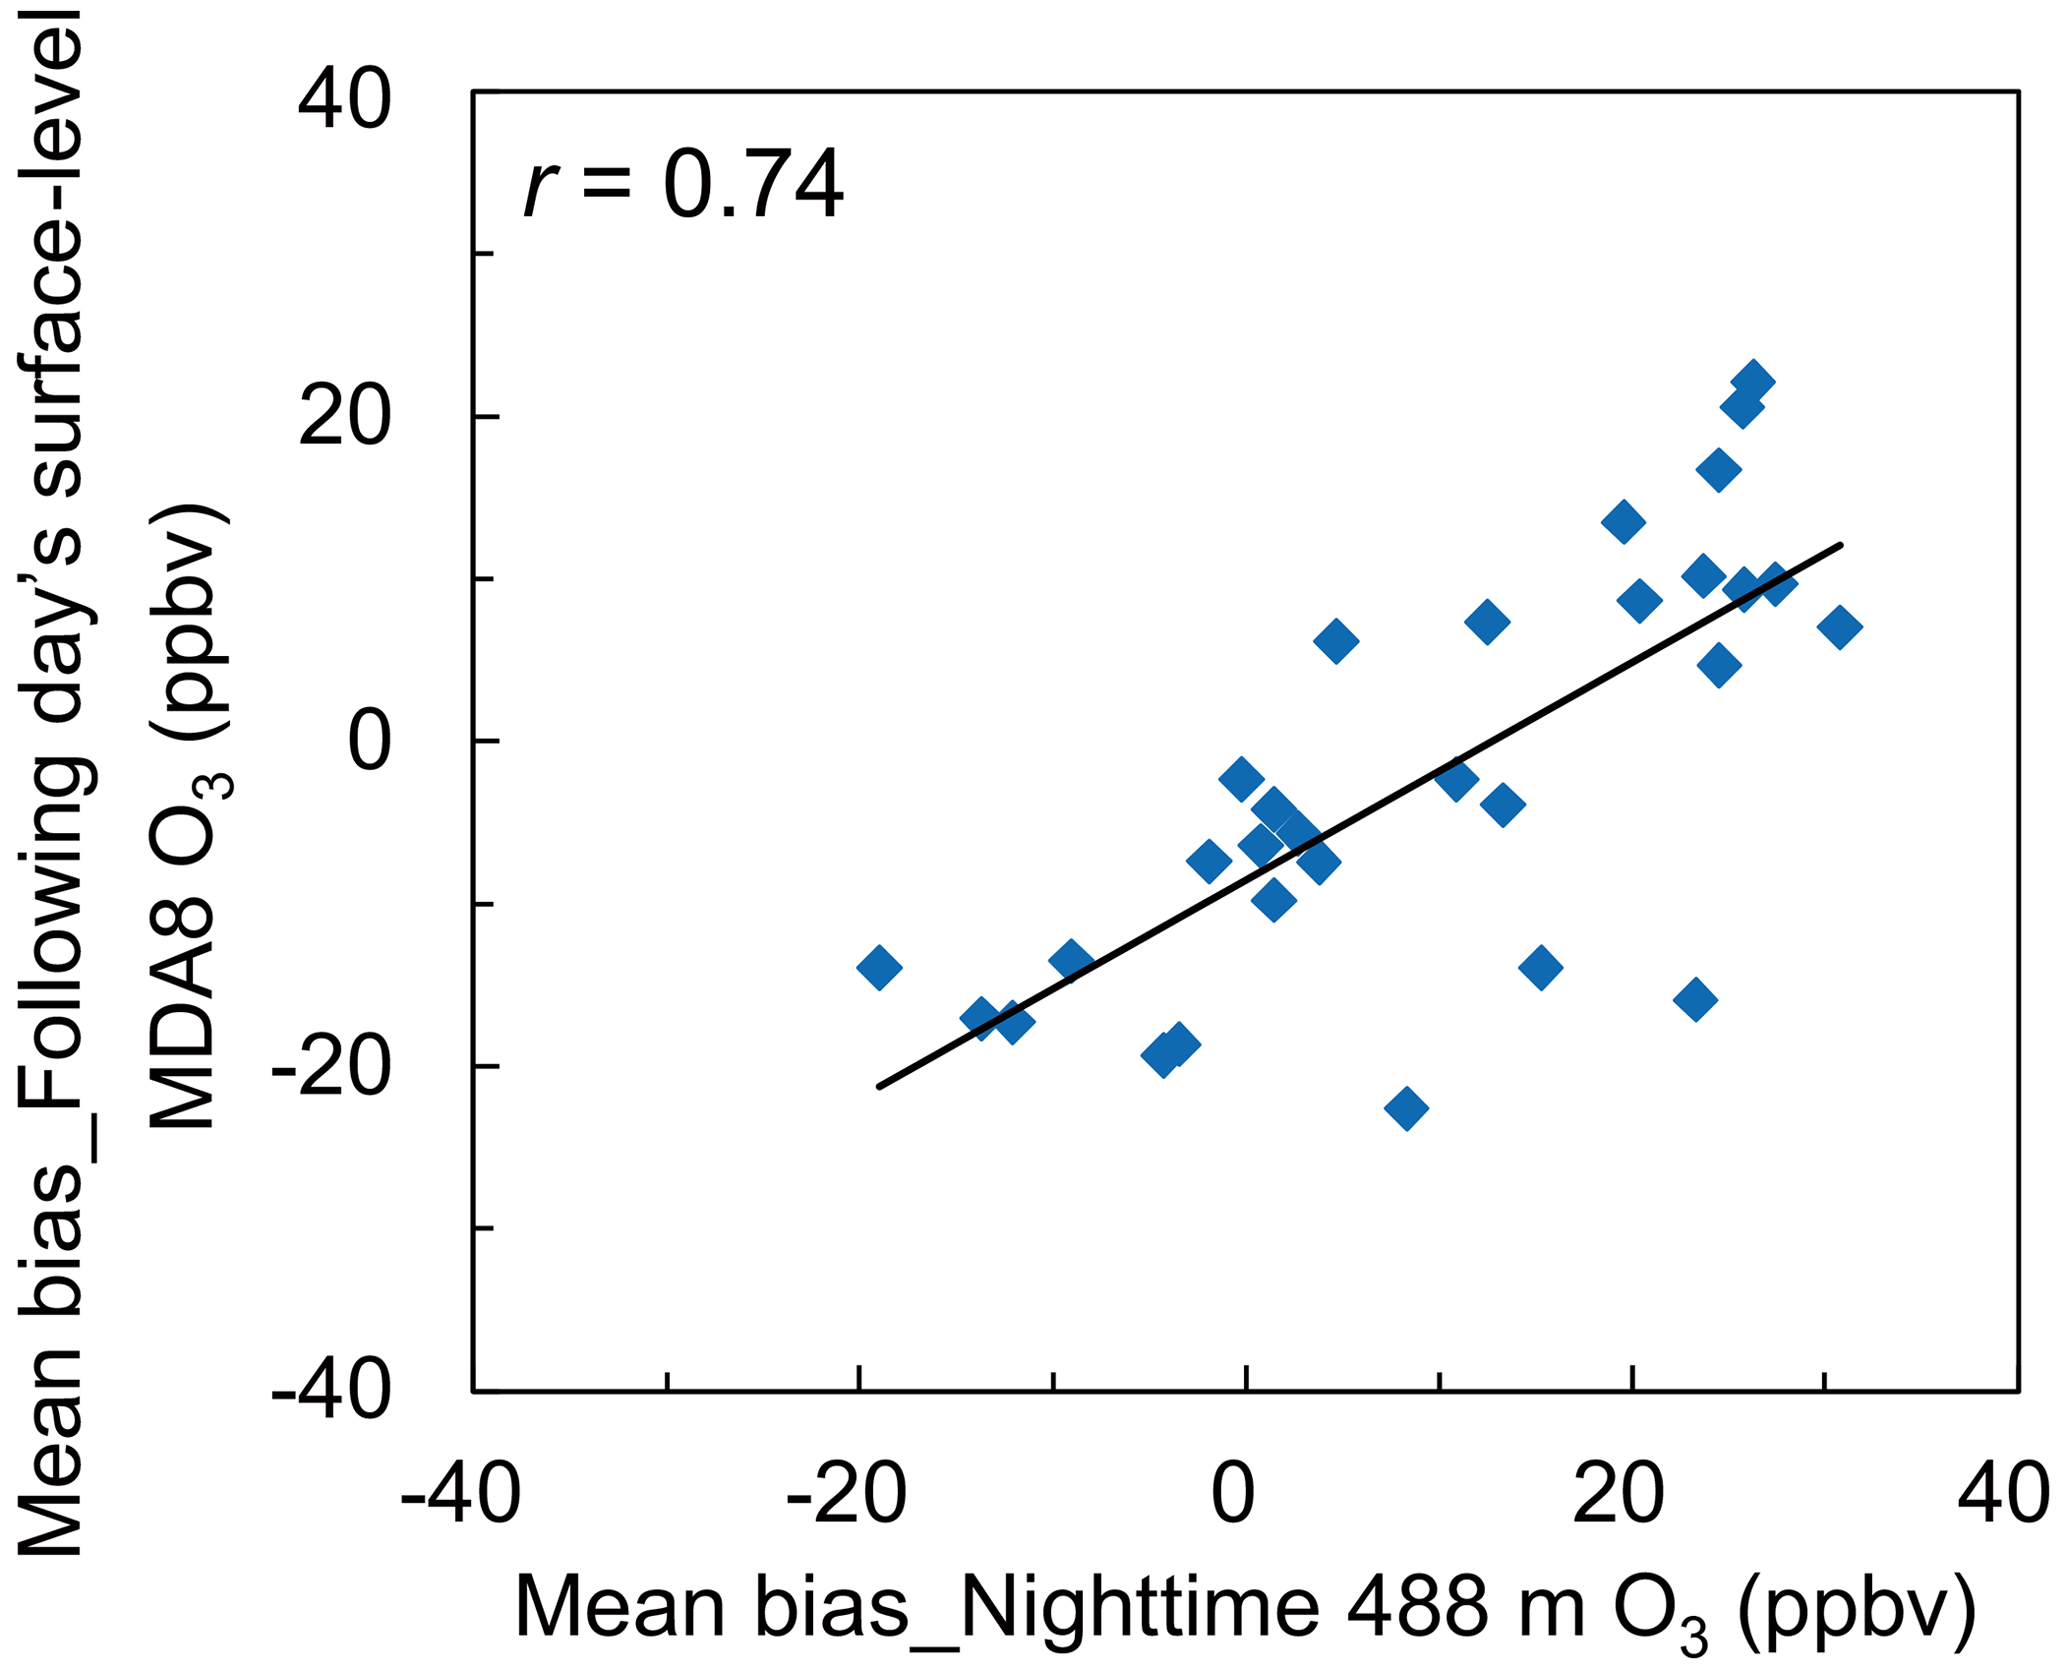
Figure 14Relationship between the CMAQ model bias in nighttime ozone at the 488 m height and bias in the following day's surface MDA8 ozone. r represents the correlation coefficient between the two variables.
In this study, we present 3-year (2017–2019) measurements of lower boundary layer ozone (up to 500 m) from the Canton Tower, with a focus on nighttime ozone evolution and the interaction between ozone in the RL and that at the ground level. The Canton Tower has the advantage of providing ozone measurement at a height of 488 m, higher than the typical height of the nighttime stable boundary layer derived from the reanalysis dataset so that direct measurement in the RL becomes available. We combine the Canton Tower measurement and the 1-month WRF-CMAQ simulation to examine the nighttime versus daytime ozone vertical gradient, the ability of the RL to serve as the ozone reservoir, and its chemical and meteorological influencing factors, and we further investigate the RL ozone's impact on both the nocturnal ozone enhancement event and the following day's surface MDA8 ozone.
Our findings are summarized in Fig. 15. We find that ozone at different heights in the lower boundary layer shows a consistent diurnal and seasonal cycle, with ozone peaking in daytime and in October. In both nighttime and daytime and for all seasons, ozone increases with altitude, with nighttime (daytime) ozone at the 488 m height being 2.4–5.4 (1.5–2.4) times higher than ozone at the 10 m height. We quantify an ozone vertical gradient between the 10 and 488 m heights (ΔOH10–488 m) of 3.6–6.4 ppbv hm−1 in nighttime and 4.4–5.8 ppbv hm−1 in daytime, averaged over 2017–2019, reflecting much weaker vertical mixing in nighttime than in daytime. The WRF-CMAQ model reports that vertical diffusion (ΔVDIF) has a different contribution to the ozone budget between the surface (source) and in the lower boundary layer (sink).
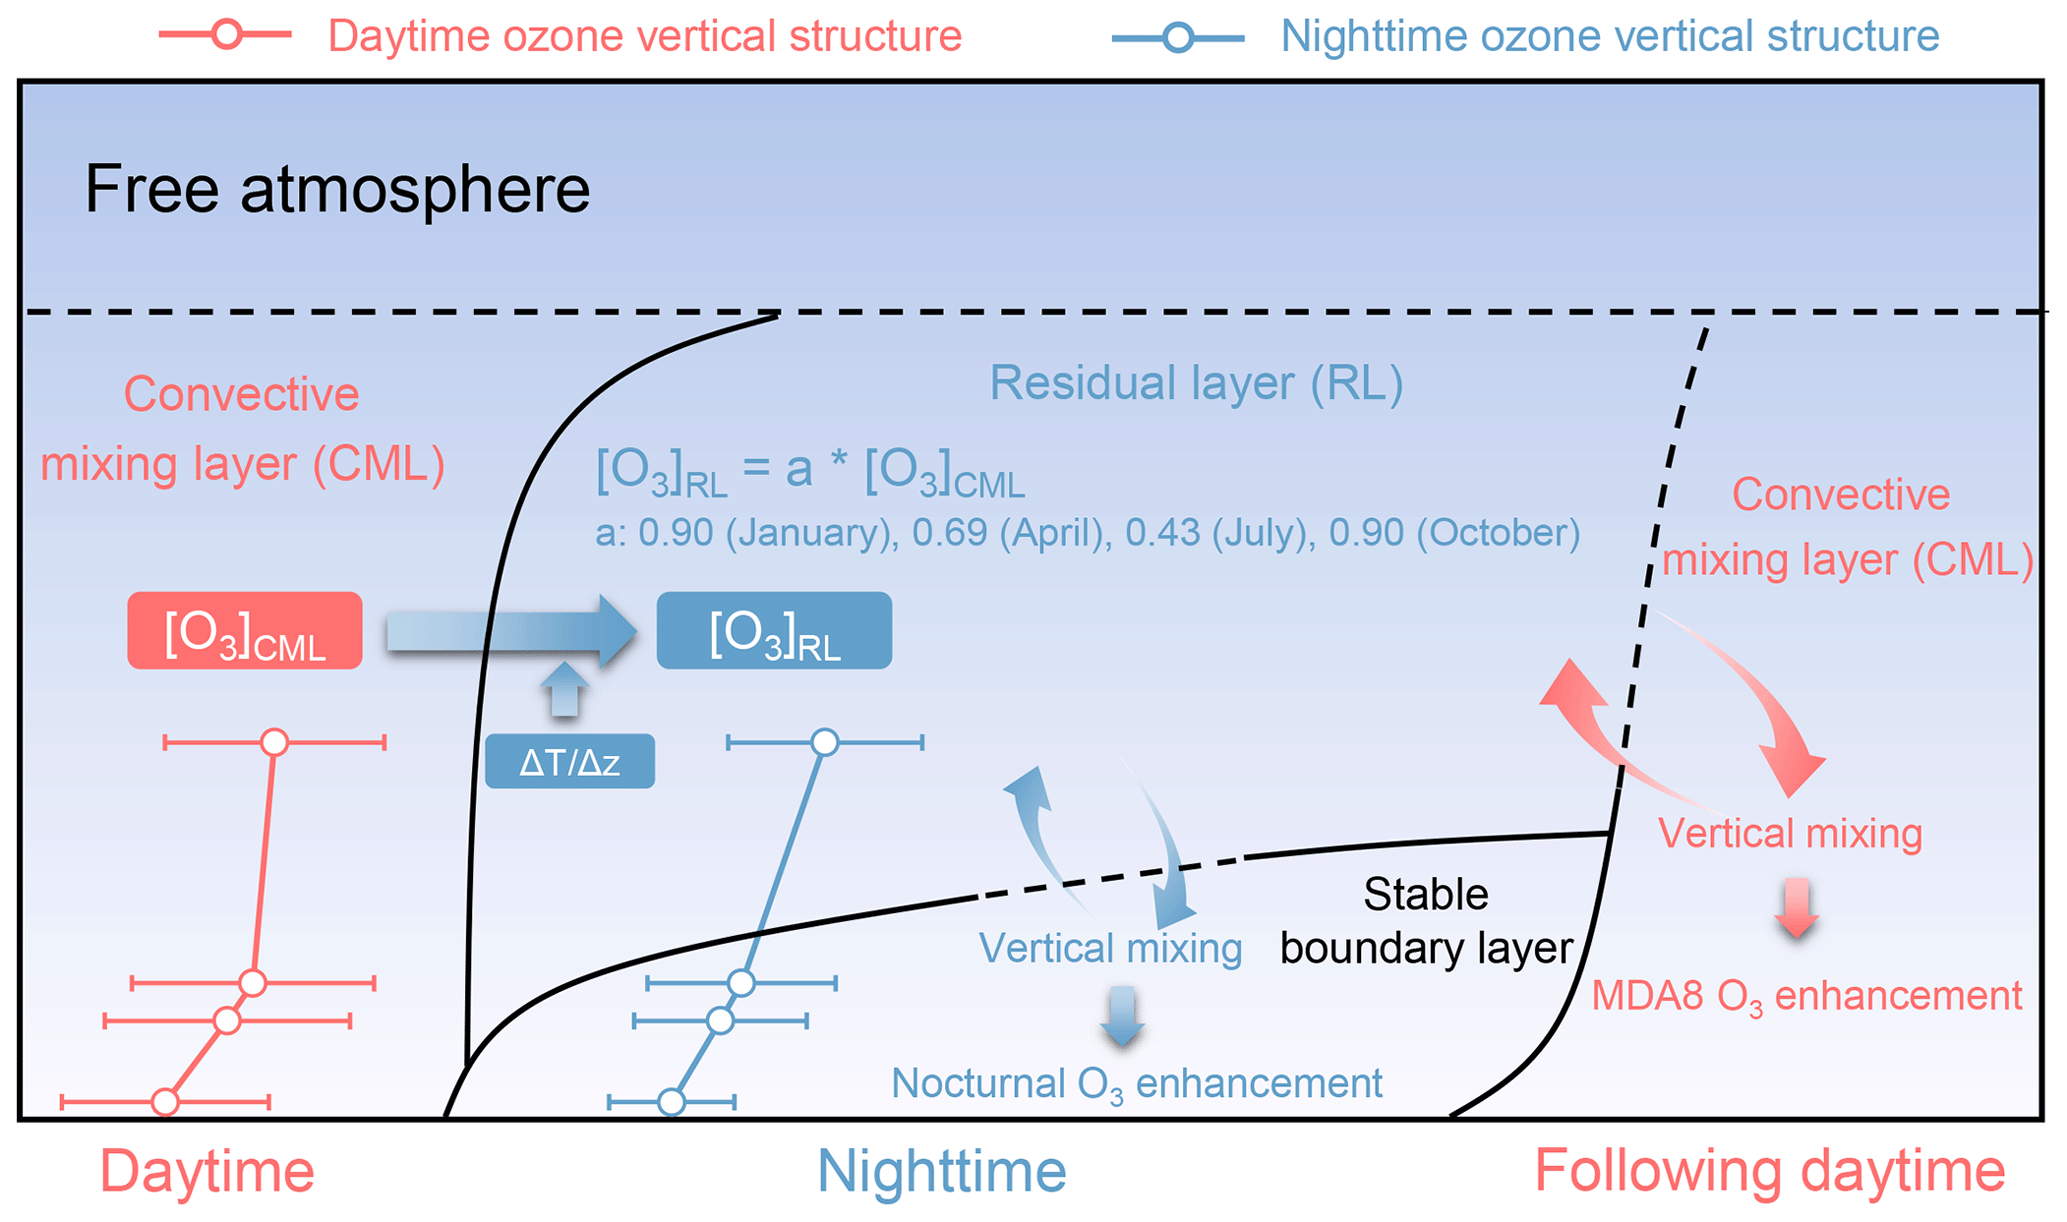
Figure 15Conceptual model of the nighttime ozone in the lower boundary layer and its influences on surface ozone. The ozone profiles and the residual ratio (defined as a) are obtained from the measurements in 2017–2019.
We identify a high ozone residual ratio (the ratio of nighttime to afternoon ozone) in the RL, ranging between 69 %–90 % in January, April, and October, remarkably higher than that in the other three layers (29 %–51 %). Ozone in the afternoon convective mixing layer provides the source of ozone in the RL, and strong temperature inversion facilitates the ability of the RL to store ozone by constraining the exchange of RL ozone with ozone inside the stable boundary layer that are subject to strong chemical destruction and deposition. The tower-based measurement also indicates a significant positive relationship (r= 0.73-0.85) between nighttime ozone at the 488 m height and nighttime Ox (Ox= O3 + NO2) at the surface (10 m), as well as a slope of 0.67–0.91 for January, April, and October between the two variables, suggesting that the surface Ox level can be an effective indicator of RL ozone if direct measurement is not available.
We further find significant influences of nocturnal RL ozone on both the nighttime and the following day's daytime surface ozone air quality. In nighttime, ozone mixing from the RL can trigger the nighttime ozone enhancement event (NOE). This is supported by the observed contrast in the ozone, NO2, and CO changes at the 488 m height and at the surface during the NOE event as well as by the CMAQ model simulation. The measurements show a significant ozone decrease at the 488 m level (6 ppbv on average) but increase (12 ppbv in average) at the surface during the occurrence of NOE. There are also slight increases in NO2 and CO concentrations at 488 m, where no direct source of NO2 and CO is expected; as such the increase is more likely due to mixing with air in the nighttime stable boundary layer. The enhanced downward mixing allows ozone-rich air in the RL to enter the nighttime stable boundary layer and also weakens the titration by diluting NOx concentrations, together contributing to the NOE event. The CMAQ model simulations also demonstrate the enhanced positive contribution of ΔVDIF to ozone at 10 and 118 m and the negative contribution at 168 and 488 m during the NOE event. Horizontal transport can also contribute to the NOE event as illustrated by our case study.
The following day, both observations and CMAQ modeling suggest a decrease in 488 m ozone in the early morning (08:00–09:00 LT) with the collapse of nighttime RL and the development of the convective mixing layer, and the model diagnoses a significant increase in ΔVDIF of 50 ppbv h−1 at 10 m and a negative ΔVDIF of −10 ppbv h−1 at 488 m. This partly contributes to the observed positive correlation between the nighttime RL ozone and the following day's surface MDA8 ozone, suggesting that the mixing of ozone-rich air from nighttime RL downward to the ozone-poor air at the surface via the entrainment is an important mechanism for aggravating ozone pollution the following day. We further find that the bias in CMAQ-simulated surface MDA8 ozone the following day shows a strong correlation coefficient (r= 0.74) with the bias in nighttime ozone in the RL to the observation. Therefore, correcting air quality model bias in the nighttime RL ozone can be important for daytime ozone air quality forecasts.
Our study thus illustrates the value of long-term tower-based measurements for understanding the relationship between nighttime ozone in the RL, surface ozone air quality, and boundary layer dynamics. Nevertheless, our study mainly focuses on the mean structure and evolution of nighttime ozone in the lower boundary layer on the basis of 3-year measurements and does not zoom in on specific episodes in which the interactions can be more significant and complex. We also call for expanded, continuous, and simultaneous vertical measurements of ozone and other atmospheric components, including VOCs, radicals, and aerosol components, to improve our understanding of the nighttime atmospheric chemistry from the surface to the boundary layer and to better constrain air quality models.
The ozonesonde datasets are available at https://doi.org/10.14287/10000008 (Government of Canada, 2023). The ERA5 reanalysis data can be accessed via https://cds.climate.copernicus.eu/cdsapp#!/dataset/reanalysis-era5-pressure-levels?tab=form (Hersbach et al., 2020). The global continental blended high-resolution PBLH dataset is obtained from https://doi.org/10.5281/zenodo.6498004 (Guo et al., 2022).
The supplement related to this article is available online at: https://doi.org/10.5194/acp-23-13107-2023-supplement.
XL and SF designed the study. GH, CH, and HW conducted the WRF-CMAQ model simulation and analyses with contributions from CP, XQ, CL, YW, NL, JZ, LL, YL, HW, TD, and QF. CP, XQ, JZ, and LL contributed to measurements. All authors provided practical comments. GH, XL, and SF wrote the paper with input from all co-authors.
The contact author has declared that none of the authors has any competing interests.
Publisher’s note: Copernicus Publications remains neutral with regard to jurisdictional claims made in the text, published maps, institutional affiliations, or any other geographical representation in this paper. While Copernicus Publications makes every effort to include appropriate place names, the final responsibility lies with the authors.
The authors gratefully acknowledge Guangzhou Environmental Monitoring Center for the provision of long-term tower-based measurements used in this publication.
This research has been supported by the Guangdong Basic and Applied Basic Research project (grant no. 2020B0301030004), the Key-Area Research and Development Program of Guangdong Province (grant no. 2020B1111360003), the National Natural Science Foundation of China (grant no. 42105103), and the Guangdong Basic and Applied Basic Research Foundation (grant no. 2022A1515011554).
This paper was edited by Tao Wang and reviewed by three anonymous referees.
Appel, K. W., Bash, J. O., Fahey, K. M., Foley, K. M., Gilliam, R. C., Hogrefe, C., Hutzell, W. T., Kang, D., Mathur, R., Murphy, B. N., Napelenok, S. L., Nolte, C. G., Pleim, J. E., Pouliot, G. A., Pye, H. O. T., Ran, L., Roselle, S. J., Sarwar, G., Schwede, D. B., Sidi, F. I., Spero, T. L., and Wong, D. C.: The Community Multiscale Air Quality (CMAQ) model versions 5.3 and 5.3.1: system updates and evaluation, Geosci. Model Dev., 14, 2867–2897, https://doi.org/10.5194/gmd-14-2867-2021, 2021.
Brown, S. S. and Stutz, J.: Nighttime radical observations and chemistry, Chem. Soc. Rev., 41, 6405–6447, https://doi.org/10.1039/C2CS35181A, 2012.
Brown, S. S., Dube, W. P., Tham, Y. J., Zha, Q. Z., Xue, L. K., Poon, S., Wang, Z., Blake, D. R., Tsui, W., Parrish, D. D., and Wang, T.: Nighttime chemistry at a high altitude site above Hong Kong, J. Geophys. Res.-Atmos., 121, 2457–2475, https://doi.org/10.1002/2015JD024566, 2016.
Caputi, D. J., Faloona, I., Trousdell, J., Smoot, J., Falk, N., and Conley, S.: Residual layer ozone, mixing, and the nocturnal jet in California's San Joaquin Valley, Atmos. Chem. Phys., 19, 4721–4740, https://doi.org/10.5194/acp-19-4721-2019, 2019.
Chen, S. H. and Sun, W. Y.: A one-dimensional time dependent cloud model, J. Meteorol. Soc. Jpn., 80, 99–118, https://doi.org/10.2151/jmsj.80.99, 2002.
Dai, H., Liao, H., Li, K., Yue, X., Yang, Y., Zhu, J., Jin, J., Li, B., and Jiang, X.: Composited analyses of the chemical and physical characteristics of co-polluted days by ozone and PM2.5 over 2013–2020 in the Beijing–Tianjin–Hebei region, Atmos. Chem. Phys., 23, 23–39, https://doi.org/10.5194/acp-23-23-2023, 2023.
Doran, J. C., Berkowitz, C. M., Coulter, R. L., Shaw, W. J., and Spicer, C. W.: The 2001 Phoenix Sunrise experiment: vertical mixing and chemistry during the morning transition in Phoenix, Atmos. Environ., 37, 2365–2377, https://doi.org/10.1016/S1352-2310(03)00134-1, 2003.
Ek, M. B., Mitchell, K. E., Lin, Y., Rogers, E., Grunmann, P., Koren, V., Gayno, G., and Tarpley, J. D.: Implementation of Noah land surface model advances in the National Centers for Environmental Prediction operational mesoscale Eta model, J. Geophys. Res.-Atmos., 108, 2002JD003296, https://doi.org/10.1029/2002JD003296, 2003.
Eliasson, I., Thorsson, S., and Andersson-Sköld, Y.: Summer nocturnal ozone maxima in Göteborg, Sweden, Atmos. Environ., 37, 2615–2627, https://doi.org/10.1016/S1352-2310(03)00205-X, 2003.
Fleming, Z. L., Doherty, R. M., von Schneidemesser, E., Malley, C. S., Cooper, O. R., Pinto, J. P., Colette, A., Xu, X., Simpson, D., Schultz, M. G., Lefohn, A. S., Hamad, S., Moolla, R., Solberg, S., and Feng, Z.: Tropospheric Ozone Assessment Report: Present-day ozone distribution and trends relevant to human health, Elem. Sci. Anth., 6, 12, https://doi.org/10.1525/elementa.273, 2018.
Fu, T. M. and Tian, H.: Climate Change Penalty to Ozone Air Quality: Review of Current Understandings and Knowledge Gaps, Curr. Pollut. Rep., 5, 159-171, https://doi.org/10.1007/s40726-019-00115-6, 2019.
Gao, M., Gao, J., Zhu, B., Kumar, R., Lu, X., Song, S., Zhang, Y., Jia, B., Wang, P., Beig, G., Hu, J., Ying, Q., Zhang, H., Sherman, P., and McElroy, M. B.: Ozone pollution over China and India: seasonality and sources, Atmos. Chem. Phys., 20, 4399–4414, https://doi.org/10.5194/acp-20-4399-2020, 2020.
Guenther, A. B., Jiang, X., Heald, C. L., Sakulyanontvittaya, T., Duhl, T., Emmons, L. K., and Wang, X.: The Model of Emissions of Gases and Aerosols from Nature version 2.1 (MEGAN2.1): an extended and updated framework for modeling biogenic emissions, Geosci. Model Dev., 5, 1471–1492, https://doi.org/10.5194/gmd-5-1471-2012, 2012.
Guo, J., Zhang, J., Yang, K., Liao, H., Zhang, S., Huang, K., Lv, Y., Shao, J., Yu, T., Tong, B., Li, J., Su, T., Yim, S. H. L., Stoffelen, A., Zhai, P., and Xu, X.: Investigation of near-global daytime boundary layer height using high-resolution radiosondes: first results and comparison with ERA5, MERRA-2, JRA-55, and NCEP-2 reanalyses, Atmos. Chem. Phys., 21, 17079–17097, https://doi.org/10.5194/acp-21-17079-2021, 2021.
Guo, J., Zhang., J., and Shao., J.: A Harmonized Global Continental High-resolution Planetary Boundary Layer Height Dataset Covering 2017–2021, Zenodo [data set], https://doi.org/10.5281/zenodo.6498004, 2022.
Government of Canada: OzoneSonde, Government of Canada [data set], https://doi.org/10.14287/10000008, 2023.
Han, S. Q., Yao, Q., Tie, X. X., Zhang, Y. F., Zhang, M., Li, P. Y., and Cai, Z. Y.: Analysis of surface and vertical measurements of O3 and its chemical production in the NCP region, China, Atmos. Environ., 241, 117759, https://doi.org/10.1016/j.atmosenv.2020.117759, 2020.
He, C., Lu, X., Wang, H., Wang, H., Li, Y., He, G., He, Y., Wang, Y., Zhang, Y., Liu, Y., Fan, Q., and Fan, S.: The unexpected high frequency of nocturnal surface ozone enhancement events over China: characteristics and mechanisms, Atmos. Chem. Phys., 22, 15243–15261, https://doi.org/10.5194/acp-22-15243-2022, 2022.
He, G. W., Deng, T., Wu, D., Wu, C., and Zhang, X.: Characteristics of boundary layer ozone and its effect on surface ozone concentration in Shenzhen, China: A case study, Sci. Total Environ., 791, 148044, https://doi.org/10.1016/j.scitotenv.2021.148044, 2021.
He, Y. P., Li, L., Wang, H. L., Xu, X. Q., Li, Y. M., and Fan, S. J.: A cold front induced co-occurrence of O3 and PM2.5 pollution in a Pearl River Delta city: Temporal variation, vertical structure, and mechanism, Environ. Pollut., 306, 119464, https://doi.org/10.1016/j.envpol.2022.119464, 2022.
Hersbach, H., Bell, B., Berrisford, P., Hirahara, S., Horányi, A.,Muñoz-Sabater, J., Nicolas, J., Peubey, C., Radu, R., Schepers, D., Simmons, A., Soci, C., Abdalla, S., Abellan, X., Balsamo, G., Bechtold, P., Biavati, G., Bidlot, J., Bonavita, M., De Chiara, G., Dahlgren, P., Dee, D., Diamantakis, M., Dragani, R., Flem ming, J., Forbes, R., Fuentes, M., Geer, A., Haimberger, L., Healy, S., Hogan, R. J., Hólm, E., Janisková, M., Keeley, S., Laloyaux, P., Lopez, P., Lupu, C., Radnoti, G., de Rosnay, P., Rozum, I., Vamborg, F., Villaume, S., and Thépaut, J.-N.: The ERA5 global reanalysis, Q. J. Roy. Meteorol. Soc., 146, 1999–2049, https://doi.org/10.1002/qj.3803, 2020 (data available at: https://cds.climate.copernicus.eu/cdsapp#!/dataset/reanalysis-era5-pressure-levels?tab=form last access: 8 April 2023)
Hu, J., Li, Y., Zhao, T., Liu, J., Hu, X.-M., Liu, D., Jiang, Y., Xu, J., and Chang, L.: An important mechanism of regional O3 transport for summer smog over the Yangtze River Delta in eastern China, Atmos. Chem. Phys., 18, 16239–16251, https://doi.org/10.5194/acp-18-16239-2018, 2018.
Janji, Z. I.: The Step-Mountain Eta Coordinate Model: Further Developments of the Convection, Viscous Sublayer, and Turbulence Closure Schemes, Mon. Weather Rev., 122, 927, https://doi.org/10.1175/1520-0493(1994)1222.0.CO;2, 1994.
Klein, A., Ancellet, G., Ravetta, F., Thomas, J. L., and Pazmino, A.: Characterizing the seasonal cycle and vertical structure of ozone in Paris, France using four years of ground based LIDAR measurements in the lowermost troposphere, Atmos. Environ., 167, 603–615, https://doi.org/10.1016/j.atmosenv.2017.08.016, 2017.
Klein, P. M., Hu, X. M., and Xue, M.: Impacts of Mixing Processes in Nocturnal Atmospheric Boundary Layer on Urban Ozone Concentrations, Bound.-Lay. Mereorol., 150, 107–130, https://doi.org/10.1007/s10546-013-9864-4, 2014.
Kusaka, H. and Kimura, F.: Coupling a single-layer urban canopy model with a simple atmospheric model: Impact on urban heat island simulation for an idealized case, J. Meteorol. Soc. Jpn., 82, 67–80, https://doi.org/10.2151/jmsj.82.67, 2004.
Li, K., Jacob, D. J., Shen, L., Lu, X., De Smedt, I., and Liao, H.: Increases in surface ozone pollution in China from 2013 to 2019: anthropogenic and meteorological influences, Atmos. Chem. Phys., 20, 11423–11433, https://doi.org/10.5194/acp-20-11423-2020, 2020.
Li, L., Lu, C., Chan, P. W., Zhang, X., and Zhang, L.: Tower observed vertical distribution of PM2.5, O3 and NOx in the Pearl River Delta, Atmos. Environ., 220, 117083, https://doi.org/10.1016/j.atmosenv.2019.117083, 2019.
Li, L., Lu, C., Chan, P. W., Lan, Z. J., Zhang, W. H., Yang, H. L., and Wang, H. C.: Impact of the COVID-19 on the vertical distributions of major pollutants from a tower in the Pearl River Delta, Atmos. Environ., 276, 119068, https://doi.org/10.1016/j.atmosenv.2022.119068, 2022.
Li, X.-B., Yuan, B., Wang, S., Wang, C., Lan, J., Liu, Z., Song, Y., He, X., Huangfu, Y., Pei, C., Cheng, P., Yang, S., Qi, J., Wu, C., Huang, S., You, Y., Chang, M., Zheng, H., Yang, W., Wang, X., and Shao, M.: Variations and sources of volatile organic compounds (VOCs) in urban region: insights from measurements on a tall tower, Atmos. Chem. Phys., 22, 10567–10587, https://doi.org/10.5194/acp-22-10567-2022, 2022.
Lin, C.-H., Wu, Y.-L., and Lai, C.-H.: Ozone reservoir layers in a coastal environment – a case study in southern Taiwan, Atmos. Chem. Phys., 10, 4439–4452, https://doi.org/10.5194/acp-10-4439-2010, 2010.
Lin, C. Q., Leung, K. K. M., Yu, A. L. C., Tsang, R. C. W., Tsui, W. B. C., Fung, J. C. H., Ng, E. K. W., Cheung, S. L., Tang, A. W. Y., Ning, Z., Li, Y., Zhang, T. S., and Lau, A. K. H.: Effects of synoptic patterns on the vertical structure of ozone in Hong Kong using lidar measurement, Atmos. Environ., 257, 118490, https://doi.org/10.1016/j.atmosenv.2021.118490, 2021.
Liu, H. L., Han, X., Tang, G. Q., Zhang, J. Q., Xia, X. A., Zhang, M. G., and Meng, L. H.: Model analysis of vertical exchange of boundary layer ozone and its impact on surface air quality over the North China Plain, Sci. Total Environ., 821, 153436, https://doi.org/10.1016/j.scitotenv.2022.153436, 2022.
Liu, Y. and Wang, T.: Worsening urban ozone pollution in China from 2013 to 2017 – Part 1: The complex and varying roles of meteorology, Atmos. Chem. Phys., 20, 6305–6321, https://doi.org/10.5194/acp-20-6305-2020, 2020.
Liu, Y. S., Tang, G. Q., Liu, B. X., Zhang, X., Li, Q. H., Hu, Q. H., Wang, Y., Yu, M., Sun, Y., Ji, D. S., Wang, Y. H., and Wang, Y. S.: Decadal changes in ozone in the lower boundary layer over Beijing, China, Atmos. Environ., 275, 119018, https://doi.org/10.1016/j.atmosenv.2022.119018, 2022.
Lu, X., Zhang, L., and Shen, L.: Meteorology and Climate Influences on Tropospheric Ozone: a Review of Natural Sources, Chemistry, and Transport Patterns, Curr. Pollut. Rep., 5, 238–260, https://doi.org/10.1007/s40726-019-00118-3, 2019a.
Lu, X., Zhang, L., Chen, Y., Zhou, M., Zheng, B., Li, K., Liu, Y., Lin, J., Fu, T.-M., and Zhang, Q.: Exploring 2016–2017 surface ozone pollution over China: source contributions and meteorological influences, Atmos. Chem. Phys., 19, 8339–8361, https://doi.org/10.5194/acp-19-8339-2019, 2019b.
Lu, X., Zhang, L., Wang, X. L., Gao, M., Li, K., Zhang, Y. Z., Yue, X., and Zhang, Y. H.: Rapid Increases in Warm-Season Surface Ozone and Resulting Health Impact in China Since 2013, Environ. Sci. Tech. Lett., 7, 240–247, https://doi.org/10.1021/acs.estlett.0c00171, 2020.
Mathur, R., Hogrefe, C., Hakami, A., Zhao, S. L., Szykman, J., and Hagler, G.: A Call for an Aloft Air Quality Monitoring Network: Need, Feasibility, and Potential Value, Environ. Sci. Technol., 52, 10903–10908, https://doi.org/10.1021/acs.est.8b02496, 2018.
Mlawer, E. J., Taubman, S. J., Brown, P. D., Iacono, R. J., and Clough, S. A.: Radiative transfer for inhomogeneous atmospheres: RRTM, a validated correlated-k model for the longwave, J. Geophys. Res.-Atmos., 102, 16663–16682, https://doi.org/10.1029/97jd00237, 1997.
Mo, Z. W., Huang, S., Yuan, B., Pei, C. L., Song, Q. C., Qi, J. P., Wang, M., Wang, B. L., Wang, C., Li, M., Zhang, Q., and Shao, M.: Deriving emission fluxes of volatile organic compounds from tower observation in the Pearl River Delta, China, Sci. Total Environ., 741, 139763, https://doi.org/10.1016/j.scitotenv.2020.139763, 2020.
Mo, Z. W., Huang, S., Yuan, B., Pei, C., Song, Q., Qi, J., Wang, M., Wang, B., Wang, C., and Shao, M.: Tower-based measurements of NMHCs and OVOCs in the Pearl River Delta: Vertical distribution, source analysis and chemical reactivity, Environ. Pollut., 292, 118454–118454, https://doi.org/10.1016/j.envpol.2021.118454, 2022.
Monks, P. S., Archibald, A. T., Colette, A., Cooper, O., Coyle, M., Derwent, R., Fowler, D., Granier, C., Law, K. S., Mills, G. E., Stevenson, D. S., Tarasova, O., Thouret, V., von Schneidemesser, E., Sommariva, R., Wild, O., and Williams, M. L.: Tropospheric ozone and its precursors from the urban to the global scale from air quality to short-lived climate forcer, Atmos. Chem. Phys., 15, 8889–8973, https://doi.org/10.5194/acp-15-8889-2015, 2015.
Murphy, B. N., Woody, M. C., Jimenez, J. L., Carlton, A. M. G., Hayes, P. L., Liu, S., Ng, N. L., Russell, L. M., Setyan, A., Xu, L., Young, J., Zaveri, R. A., Zhang, Q., and Pye, H. O. T.: Semivolatile POA and parameterized total combustion SOA in CMAQv5.2: impacts on source strength and partitioning, Atmos. Chem. Phys., 17, 11107–11133, https://doi.org/10.5194/acp-17-11107-2017, 2017.
Ouyang, S., Deng, T., Liu, R., Chen, J., He, G., Leung, J. C.-H., Wang, N., and Liu, S. C.: Impact of a subtropical high and a typhoon on a severe ozone pollution episode in the Pearl River Delta, China, Atmos. Chem. Phys., 22, 10751–10767, https://doi.org/10.5194/acp-22-10751-2022, 2022.
Petzold, A., Thouret, V., Gerbig, C., Zahn, A., Brenninkmeijer, C. A. M., Gallagher, M., Hermann, M., Pontaud, M., Ziereis, H., Boulanger, D., Marshall, J., Nedelec, P., Smit, H. G. J., Friess, U., Flaud, J. M., Wahner, A., Cammas, J. P., Volz-Thomas, A., and Team, I.: Global-scale atmosphere monitoring by in-service aircraft – current achievements and future prospects of the European Research Infrastructure IAGOS, Tellus B, 67, 28452, https://doi.org/10.3402/tellusb.v67.28452, 2015.
Prabhakar, G., Parworth, C. L., Zhang, X., Kim, H., Young, D. E., Beyersdorf, A. J., Ziemba, L. D., Nowak, J. B., Bertram, T. H., Faloona, I. C., Zhang, Q., and Cappa, C. D.: Observational assessment of the role of nocturnal residual-layer chemistry in determining daytime surface particulate nitrate concentrations, Atmos. Chem. Phys., 17, 14747–14770, https://doi.org/10.5194/acp-17-14747-2017, 2017.
Pye, H. O. T., Murphy, B. N., Xu, L., Ng, N. L., Carlton, A. G., Guo, H., Weber, R., Vasilakos, P., Appel, K. W., Budisulistiorini, S. H., Surratt, J. D., Nenes, A., Hu, W., Jimenez, J. L., Isaacman-VanWertz, G., Misztal, P. K., and Goldstein, A. H.: On the implications of aerosol liquid water and phase separation for organic aerosol mass, Atmos. Chem. Phys., 17, 343–369, https://doi.org/10.5194/acp-17-343-2017, 2017.
Qiu, Y. L., Lin, W. L., Li, K., Chen, L., Yao, Q., Tang, Y. X., and Ma, Z. Q.: Vertical characteristics of peroxyacetyl nitrate (PAN) from a 250-m tower in northern China during September 2018, Atmos. Environ., 213, 55–63, https://doi.org/10.1016/j.atmosenv.2019.05.066, 2019.
Qu, Y. W., Zhao, M., Wang, T. J., Li, S., Li, M. M., Xie, M., and Zhuang, B. L.: Lidar- and UAV-Based Vertical Observation of Spring Ozone and Particulate Matter in Nanjing, China, Remote Sens., 14, 3051, https://doi.org/10.3390/rs14133051, 2022.
Skamarock, W. C., Klemp, J. B., Dudhia, J., Gill, D. O., Barker., D. M., Duda., M. G., Huang., X.-Y., Wang., W., and Powers, J. G.: A Description of the Advanced Research WRF Version 3 (NCAR Tech. Note NCAR/TN-475+STR), Ncar Technical, 113, https://doi.org/10.5065/D68S4MVH, 2008.
Stull, R. B.: An Introduction to Boundary Layer Meteorology, Kluwer Academic Publishers, Dordrecht, the Netherlands, https://doi.org/10.1007/978-94-009-3027-8_6, 1988.
Sullivan, J. T., Rabenhorst, S. D., Dreessen, J., McGee, T. J., Delgado, R., Twigg, L., and Sumnicht, G.: Lidar observations revealing transport of O3 in the presence of a nocturnal low-level jet: Regional implications for “next-day” pollution, Atmos. Environ., 158, 160–171, https://doi.org/10.1016/j.atmosenv.2017.03.039, 2017.
Sun, Y., Wang, Y. S., and Zhang, C. C.: Vertical observations and analysis of PM2.5, O3, and NOx at Beijing and Tianjin from towers during summer and Autumn 2006, Adv. Atmos. Sci., 27, 123–136, https://doi.org/10.1007/s00376-009-8154-z, 2010.
Tan, Z. F., Ma, X. F., Lu, K. D., Jiang, M. Q., Zou, Q., Wang, H. C., Zeng, L. M., and Zhang, Y. H.: Direct evidence of local photochemical production driven ozone episode in Beijing: A case study, Sci. Total Environ., 800, 148868, https://doi.org/10.1016/j.scitotenv.2021.148868, 2021.
Tang, G. Q., Zhu, X. W., Xin, J. Y., Hu, B., Song, T., Sun, Y., Zhang, J. Q., Wang, L. L., Cheng, M. T., Chao, N., Kong, L. B., Li, X., and Wang, Y. S.: Modelling study of boundary-layer ozone over northern China – Part I: Ozone budget in summer, Atmos. Res., 187, 128–137, https://doi.org/10.1016/j.atmosres.2016.10.017, 2017.
Tarasick, D., Galbally, I. E., Cooper, O. R., Schultz, M. G., Ancellet, G., Leblanc, T., Wallington, T. J., Ziemke, J., Liu, X., Steinbacher, M., Staehelin, J., Vigouroux, C., Hannigan, J. W., Garcia, O., Foret, G., Zanis, P., Weatherhead, E., Petropavlovskikh, I., Worden, H., Osman, M., Liu, J., Chang, K. L., Gaudel, A., Lin, M. Y., Granados-Munoz, M., Thompson, A. M., Oltmans, S. J., Cuesta, J., Dufour, G., Thouret, V., Hassler, B., Trickl, T., and Neu, J. L.: Tropospheric Ozone Assessment Report: Tropospheric ozone from 1877 to 2016, observed levels, trends and uncertainties, Elem. Sci. Anth., 7, 39, https://doi.org/10.1525/elementa.376, 2019.
Unger, N., Zheng, Y., Yue, X., and Harper, K. L.: Mitigation of ozone damage to the world's land ecosystems by source sector, Nat. Clim. Change, 10, 134–137, https://doi.org/10.1038/s41558-019-0678-3, 2020.
Wang, H., Lu, K., Chen, X., Zhu, Q., Wu, Z., Wu, Y., and Sun, K.: Fast particulate nitrate formation via N2O5 uptake aloft in winter in Beijing, Atmos. Chem. Phys., 18, 10483–10495, https://doi.org/10.5194/acp-18-10483-2018, 2018.
Wang, H., Qiu, J., Liu, Y., Fan, Q., Lu, X., Zhang, Y., Wu, K., Shen, A., Xu, Y., Jin, Y., Zhu, Y., Sun, J., and Wang, H.: MEIAT-CMAQ v1.0: A Modular Emission Inventory Allocation Tool for Community Multiscale Air Quality Model Version 1.0, EGUsphere [preprint], https://doi.org/10.5194/egusphere-2023-1309, 2023a.
Wang, H., Wang, H. L., Lu, X., Lu, K. D., Zhang, L., Tham, Y. J., Shi, Z. B., Aikin, K., Fan, S. J., Brown, S. S., and Zhang, Y. H.: Increased night-time oxidation over China despite widespread decrease across the globe, Nat. Geosci., 16, 217–223, https://doi.org/10.1038/s41561-022-01122-x, 2023b.
Wang, N., Guo, H., Jiang, F., Ling, Z. H., and Wang, T.: Simulation of ozone formation at different elevations in mountainous area of Hong Kong using WRF-CMAQ model, Sci. Total Environ., 505, 939–951, https://doi.org/10.1016/j.scitotenv.2014.10.070, 2015.
Wang, N., Lyu, X. P., Deng, X. J., Huang, X., Jiang, F., and Ding, A. J.: Aggravating O3 pollution due to NOx emission control in eastern China, Sci. Total Environ., 677, 732–744, https://doi.org/10.1016/j.scitotenv.2019.04.388, 2019.
Wang, T., Dai, J. N., Lam, K. S., Nan Poon, C., and Brasseur, G. P.: Twenty-Five Years of Lower Tropospheric Ozone Observations in Tropical East Asia: The Influence of Emissions and Weather Patterns, Geophys. Res. Lett., 46, 11463–11470, https://doi.org/10.1029/2019GL084459, 2019.
Wang, X. Q., Zhang, T. S., Xiang, Y., Lv, L. H., Fan, G. Q., and Ou, J. P.: Investigation of atmospheric ozone during summer and autumn in Guangdong Province with a lidar network, Sci. Total Environ., 751, 141740, https://doi.org/10.1016/j.scitotenv.2020.141740, 2021.
Wu, C., Liu, B., Wu, D., Yang, H. L., Mao, X., Tan, J., Liang, Y., Sun, J. Y., Xia, R., Sun, J. R., He, G. W., Li, M., Deng, T., Zhou, Z., and Li, Y. J.: Vertical profiling of black carbon and ozone using a multicopter unmanned aerial vehicle (UAV) in urban Shenzhen of South China, Sci. Total Environ., 801, 149689, https://doi.org/10.1016/j.scitotenv.2021.149689, 2021.
Wu, Y., Chen, W., You, Y., Xie, Q., Jia, S., and Wang, X.: Quantitative impacts of vertical transport on the long-term trend of nocturnal ozone increase over the Pearl River Delta region during 2006–2019, Atmos. Chem. Phys., 23, 453–469, https://doi.org/10.5194/acp-23-453-2023, 2023.
Xu, Y. F., Shen, A., Jin, Y. B., Liu, Y. M., Lu, X., Fan, S. J., Hong, Y. Y., and Fan, Q.: A quantitative assessment and process analysis of the contribution from meteorological conditions in an O3 pollution episode in Guangzhou, China, Atmos. Environ., 303, 119757, https://doi.org/10.1016/j.atmosenv.2023.119757, 2023.
Xu, Z. N., Huang, X., Nie, W., Shen, Y. C., Zheng, L. F., Xie, Y. N., Wang, T. Y., Ding, K., Liu, L. X., Zhou, D. R., Qi, X. M., and Ding, A. J.: Impact of Biomass Burning and Vertical Mixing of Residual-Layer Aged Plumes on Ozone in the Yangtze River Delta, China: A Tethered-Balloon Measurement and Modeling Study of a Multiday Ozone Episode, J. Geophys. Res.-Atmos., 123, 11786–11803, https://doi.org/10.1029/2018JD028994, 2018.
Xu, Z. Q., Chen, H. S., Guo, J. P., Zhang, G. W., Meng, C. C., Zhang, X. Y., Hu, H. B., Miao, S. G., and Zhai, P. M.: Regionalization of the summertime planetary boundary layer height in comparison with various reanalysis datasets over China, Atmos. Res., 283, 106534, https://doi.org/10.1016/j.atmosres.2022.106534, 2022.
Yang, J. Y. and Zhao, Y.: Performance and application of air quality models on ozone simulation in China – A review, Atmos. Environ., 293, 119446, https://doi.org/10.1016/j.atmosenv.2022.119446, 2023.
Yang, S., Yuan, B., Peng, Y., Huang, S., Chen, W., Hu, W., Pei, C., Zhou, J., Parrish, D. D., Wang, W., He, X., Cheng, C., Li, X.-B., Yang, X., Song, Y., Wang, H., Qi, J., Wang, B., Wang, C., Wang, C., Wang, Z., Li, T., Zheng, E., Wang, S., Wu, C., Cai, M., Ye, C., Song, W., Cheng, P., Chen, D., Wang, X., Zhang, Z., Wang, X., Zheng, J., and Shao, M.: The formation and mitigation of nitrate pollution: comparison between urban and suburban environments, Atmos. Chem. Phys., 22, 4539–4556, https://doi.org/10.5194/acp-22-4539-2022, 2022.
Yarwood, G., Jung, J., Whitten, G. Z., Heo, G., Mellberg, J., and Estes, E.: Updates to the Carbon Bond Mechanism for Version 6 (CB6), 9th Annual CMAS Conference, October 2010, Chapel Hill, 2010.
Yin, C. Q., Deng, X. J., Zou, Y., Solmon, F., Li, F., and Deng, T.: Trend analysis of surface ozone at suburban Guangzhou, China, Sci. Total Environ., 695, 133880, https://doi.org/10.1016/j.scitotenv.2019.133880, 2019.
Yu, D., Tan, Z. F., Lu, K. D., Ma, X. F., Li, X., Chen, S. Y., Zhu, B., Lin, L. L., Li, Y. T., Qiu, P. P., Yang, X. P., Liu, Y. H., Wang, H. C., He, L. Y., Huang, X. F., and Zhang, Y. H.: An explicit study of local ozone budget and NOx-VOCs sensitivity in Shenzhen China, Atmos. Environ., 224, 117304, https://doi.org/10.1016/j.atmosenv.2020.117304, 2020.
Zhang, K., Zhou, L., Fu, Q. Y., Yan, L., Bian, Q. G., Wang, D. F., and Xiu, G. L.: Vertical distribution of ozone over Shanghai during late spring: A balloon-borne observation, Atmos. Environ., 208, 48–60, https://doi.org/10.1016/j.atmosenv.2019.03.011, 2019.
Zhao, W., Tang, G., Yu, H., Yang, Y., Wang, Y., Wang, L., An, J., Gao, W., Hu, B., and Cheng, M. J. J. o. E. S.: Evolution of boundary layer ozone in Shijiazhuang, a suburban site on the North China Plain, J. Environ. Sci., 83, 152–160, https://doi.org/10.1016/j.jes.2019.02.016, 2019.
Zheng, B., Tong, D., Li, M., Liu, F., Hong, C., Geng, G., Li, H., Li, X., Peng, L., Qi, J., Yan, L., Zhang, Y., Zhao, H., Zheng, Y., He, K., and Zhang, Q.: Trends in China's anthropogenic emissions since 2010 as the consequence of clean air actions, Atmos. Chem. Phys., 18, 14095–14111, https://doi.org/10.5194/acp-18-14095-2018, 2018.
Zhong, Z. M., Zheng, J. Y., Zhu, M. N., Huang, Z. J., Zhang, Z. W., Jia, G. L., Wang, X. L., Bian, Y. H., Wang, Y. L., and Li, N.: Recent developments of anthropogenic air pollutant emission inventories in Guangdong province, China, Sci. Total Environ., 627, 1080–1092, https://doi.org/10.1016/j.scitotenv.2018.01.268, 2018.
Zhou, S., Wu, L., Guo, J., Chen, W., Wang, X., Zhao, J., Cheng, Y., Huang, Z., Zhang, J., Sun, Y., Fu, P., Jia, S., Tao, J., Chen, Y., and Kuang, J.: Measurement report: Vertical distribution of atmospheric particulate matter within the urban boundary layer in southern China – size-segregated chemical composition and secondary formation through cloud processing and heterogeneous reactions, Atmos. Chem. Phys., 20, 6435–6453, https://doi.org/10.5194/acp-20-6435-2020, 2020.
Zhu, X. W., Ma, Z. Q., Qiu, Y. L., Liu, H., Liu, Q., and Yin, X. M.: An evaluation of the interaction of morning residual layer ozone and mixing layer ozone in rural areas of the North China Plain, Atmos. Res., 236, 104788, https://doi.org/10.1016/j.atmosres.2019.104788, 2020a.
Zhu, X. W., Ma, Z. Q., Li, Z. M., Wu, J., Guo, H., Yin, X. M., Ma, X. H., and Qiao, L.: Impacts of meteorological conditions on nocturnal surface ozone enhancement during the summertime in Beijing, Atmos. Environ., 225, 117368, https://doi.org/10.1016/j.atmosenv.2020.117368, 2020b.
Ziemke, J. R., Oman, L. D., Strode, S. A., Douglass, A. R., Olsen, M. A., McPeters, R. D., Bhartia, P. K., Froidevaux, L., Labow, G. J., Witte, J. C., Thompson, A. M., Haffner, D. P., Kramarova, N. A., Frith, S. M., Huang, L.-K., Jaross, G. R., Seftor, C. J., Deland, M. T., and Taylor, S. L.: Trends in global tropospheric ozone inferred from a composite record of TOMS/OMI/MLS/OMPS satellite measurements and the MERRA-2 GMI simulation, Atmos. Chem. Phys., 19, 3257–3269, https://doi.org/10.5194/acp-19-3257-2019, 2019.