the Creative Commons Attribution 4.0 License.
the Creative Commons Attribution 4.0 License.
 | 17 Oct 2023
High enrichment of heavy metals in fine particulate matter through dust aerosol generation
Qianqian Gao
Shengqiang Zhu
Kaili Zhou
Jinghao Zhai
Shaodong Chen
Qihuang Wang
Shurong Wang
Jin Han
Xiaohui Lu
Hong Chen
Liwu Zhang
Zimeng Wang
Xiaofei Wang
Dust is a major source of atmospheric aerosols. Its chemical composition is often assumed to be similar to the parent soil. However, this assumption has not been rigorously verified. Here, we generated dust aerosols from soils to determine if there is particle-size-dependent selectivity of heavy metals in the dust generation. Mn, Cd, Pb and other heavy metals were found to be highly enriched in fine-dust (PM2.5) aerosols, which can be up to ∼ 6.5-fold. To calculate the contributions of dust to atmospheric heavy metals, regional air quality models usually use the dust chemical profiles from the U.S. Environmental Protection Agency's (EPA) SPECIATE database, which does not capture the correct size-dependent selectivity of heavy metals in dust aerosols. Our air quality modeling for China demonstrates that the calculated contribution of fine-dust aerosols to atmospheric heavy metals, as well as their cancer risks, could have significant errors without using proper dust profiles.
- Article
(2228 KB) - Full-text XML
-
Supplement
(4416 KB) - BibTeX
- EndNote


One of the major sources of natural aerosols is mineral dust aerosols produced by wind erosion (Prospero et al., 2002). Dust aerosols are influenced by regional atmospheric circulation, soil characteristics and local weather conditions (Bryant, 2013; Ding et al., 2005; Huebert et al., 2003; Liu et al., 2004; Yang et al., 2008), and they are mainly generated and aerosolized when strong wind passes over soil or sandy areas (Gillette and Goodwin, 1974). Recent studies show mineral dust aerosol accounts for approximately 40 % of the mass fraction of natural atmospheric aerosol, with an estimated annual flux of ∼ 2000 Tg yr−1 (Alfaro, 2008; Griggs and Noguer, 2002; Huneeus et al., 2011; Textor et al., 2006). As the second-largest natural source of atmospheric aerosols in terms of mass flux, dust aerosol has a profound impact on the ecosystem (Middleton et al., 2019), especially the climate (Evan et al., 2014; Kok et al., 2018; Shao et al., 2013). Interactions between dust aerosols and water vapor play a critical role in cloud condensation and ice nucleation processes (Kaufman et al., 2002; Tang et al., 2016). Dust particles can be transported on large scales (Shao and Dong, 2006) and could act as a medium to transport toxic compounds, including heavy metals. These toxic compounds significantly harm human health, particularly the human respiratory system, and can cause premature death (Urrutia-Pereira et al., 2021).
Atmospheric studies often assume that the chemical composition of aerosolized dust is similar to the parent soil (Gunawardana et al., 2012; Zhuang et al., 2001). The chemical composition of dust aerosol is a key part in source apportionment modeling (Balakrishna and Pervez, 2009; Samiksha et al., 2017; Santos et al., 2017; Ying et al., 2018). A critical approach in source apportionment modeling is the chemical transport model, which predicts the dust aerosol on global and regional scales based on the prior knowledge of source emission, atmospheric transport and chemical reaction process. SPECIATE is the U.S. Environmental Protection Agency's (EPA) speciation profile repository of air pollution sources of volatile organic compounds (VOCs) and particulate matter (PM). Therefore, the U.S. EPA's SPECIATE database is an important product to convert total emissions from specific sources into the speciated emissions needed for the chemical transport model. The previous study (Ying et al., 2018) has combined the U.S. EPA's SPECIATE database and air quality model to predict dust aerosols, based on the assumption that the chemical composition of dust aerosols is similar to the resuspended soil profiles.
Yet, dust generation and aerosolization are complex processes, which may have some chemical selectivity. Most small dust particles (< 20 µm) are produced either by wind erosion, which leads to soil movements such as creeping, saltation and suspension (Burezq, 2020), or sandblasting, which leads soil particles (∼ 75 µm) to be lifted by the wind and moved in ballistic trajectories due to the combined effect of aerodynamic force and gravity force (Grini and Zender, 2004; Shao and Raupach, 1993; Shao et al., 1996). The sandblasting efficiency of a soil particle is highly sensitive to its size (Grini and Zender, 2004; Grini et al., 2002). In addition, the chemical composition of soil particles can also vary with particle size. As smaller soil particles are more easily ejected, dust aerosol particles are unlikely to have exactly the same composition as their parent soils (Perlwitz et al., 2015; Wu et al., 2022). Dust deposited samples were the dust samples collected on the road or other surfaces using a brush and plastic tray (Shangguan et al., 2022), while dust aerosol samples were collected by filtering the air. Dust aerosols were produced by the ballistic impacts of wind-driven sand grains (Kok et al., 2023). Indeed, some previous studies do find that in the deposited dust samples (not dust aerosol samples), smaller particles tend to contain higher quantities of heavy metals (Naderizadeh et al., 2016; Parajuli et al., 2016; Becagli et al., 2020). However, the heavy-metal profiles for dust aerosols from the U.S. EPA's SPECIATE database seem to have no such enrichment between each particle size, as Table S1 in the Supplement reports profile 41350 as an example. Although these profiles have been widely used in air quality modeling works (Lowenthal et al., 2010; Simon et al., 2010; Ashrafi et al., 2018), they were actually measured in the 1970s and 1980s with the resuspension of soil samples, which placed soil in a glass tube and drew airflow to blow and suspend the soil particles to the air (Miller et al., 1972). This method is not likely to produce realistic dust aerosols, as it does not simulate the sandblasting process properly. It is not known whether using such a problematic dust profile could significantly impact air quality model calculations.
Here we examined the enrichment of heavy metals in the laboratory-generated dust aerosols. A dust aerosol generator that mimics realistic sandblasting and saltation was used to generate dust aerosol from a collection of soil samples (Lafon et al., 2014). The concentrations of heavy metals in soil and dust aerosols were measured by an inductively coupled plasma mass spectrometer (ICP-MS). In this study, some heavy metals, such as Mn, Cd, Zn and Pb, were found to be highly enriched in dust aerosols and the enrichment factors would be much higher for smaller dust aerosols. We also utilized a single-particle aerosol mass spectrometer (SPAMS) to study heavy-metal-containing dust aerosols before, during and after a dust storm. Regional air quality models usually use problematic dust composition profiles from the U.S. EPA's SPECIATE database. Herein we modeled the contribution of dust aerosol to atmospheric heavy-metal loadings, utilizing a range of dust aerosol profiles determined in this laboratory study as well as the SPECIATE profile, to investigate whether using a proper dust profile is critical to air quality modeling and cancer risk calculations.
2.1 Soil sample collection
The researchers collected 14 samples from the top 10 cm of the natural soil profile from various locations in dust source regions and Shanghai, China (Table S2, Fig. S1). S1–S4 were collected from dust sources on the northern slope of Yinshan in central Inner Mongolia and the adjacent areas of the Hunshandake Sandy Land, S5–S12 were collected from dust sources of Hexi Corridor and Alxa Plateau, S13 was collected in Xinjiang Province, in the dust sources of the Taklimakan Desert, and S14 was sampled from Shanghai Yangpu District. Although the soil (S14) collected in Shanghai does not originate from a dust source region, it can still produce dust aerosols in some cases. For example, under dry weather conditions, the soil surface in the Shanghai area could serve as a significant local contributor to the generation of dust aerosols (Liu et al., 2016, 2020). During the prevailing dust-storm period from March to May, Shanghai is primarily influenced by dust originating from the western Inner Mongolia Gobi, deserts in the Tibetan Plateau and arid deserts in northwest China (Fu et al., 2010, 2014; Sun et al., 2017). Soil texture determination and soil texture characterization were conducted based on the method outlined in a previous study (Kettler et al., 2001). Soil-particle dispersion was achieved by adding hexametaphosphate (HMP) and sodium hydroxide (NaOH) to a soil sample (particle size < 2 mm) and shaking it for 16 h. The percentage of sand and silt was obtained using a laser scattering particle size distribution analyzer (LA-960). Further details can be found in the Supplement. As shown in Table S2, the samples represent several soil types: S1 was silty loam; S2, S4, S7, S10, S11 and S12 were sand; S3 was sandy loam; S5 and S6 were loam; S8 and S13 were loam sand; and S9 and S14 were silty clay loam. Before dust aerosol generation, soil samples were placed in a fume hood and left to dry, without stirring or other treatment. Fine- and coarse-dust aerosols (PM2.5 and PM10) were produced with a GAMEL (Générateur d'Aérosol Minéral En Laboratoire) dust aerosol generator, which can realistically simulate the sandblasting process. Then, the pH of the soil was measured. Detailed information can be found in Fig. S1 and Table S2.
2.2 Laboratory dust aerosol generation and collection
A GAMEL laboratory dust generator (Lafon et al., 2014) was used to produce dust aerosols from the soil samples. The GAMEL dust generator can realistically simulate the sandblasting process. Wind tunnels have the advantage of realistically simulating the generation of dust aerosols. However, conducting this study has certain drawbacks. These include the requirement for a substantial quantity of parent soils and the significant cost associated with eliminating ambient aerosol interference (Alfaro et al., 1997; Lafon et al., 2006; Alfaro, 2008). In GAMEL's dust production system, 10 g of each soil sample was added to a PTFE flask, which was agitated by a shaker simulating the sandblasting process to produce dust aerosols. A constant flow of particle-free air was passed through the dust-generating flask. The optimal generation parameter of the shaker was set at a frequency of 500 cycles min−1 according to Lafon et al. (2014) with an airflow rate of 8 L min−1 controlled by a mass flow controller (MFC, Sevenstar, Beijing Sevenstar Flow Co., LTD). The sample stream was filtered through a cyclone and particles were collected on a 47 mm PVC film held in a metal frame filter holder (Pall Gelman, Port Washington, NY, USA). Dust PM2.5 and dust PM10 were obtained with and without an 8 L min−1 cyclone, respectively. The running time was 1 min. To obtain more dust aerosols in different size ranges, size-fractionated particle sampling of dust aerosols was carried out with a 10-stage micro-orifice uniform deposit impactor (MOUDI 110R; MSP Corporation) with size cut points of 10, 5.6, 3.2, 1.8, 1.0 and 0.56 µm. Analysis of the size distribution and chemical composition of dust generated by GAMEL and dust generated under natural conditions has shown that the GAMEL generator can produce realistic dust aerosol (Lafon et al., 2014). All the dust aerosol mass collected is shown in Tables S3 and S4. The instrument setup is illustrated in Fig. S2.
2.3 Analysis of laboratory-generated dust aerosols
The dust aerosol samples collected were weighed with an analytical balance and then put into 25 mL digestion tubes with 6 mL 69 % HNO3 symmetrically. The temperature program of the microwave digestion (Anton Paar) was as follows: initial temperature of 100 ∘C held for 5 min, then ramped to 140 ∘C for 5 min and finally at 180 ∘C for 60 min. The whole process was held for 120 min. According to Chang et al. (1984), almost all the heavy-metal elements in the natural soil and dust aerosol in concentrated nitric acid were extracted using this experimental procedure. After digestion, the solution was acid-fed at 120 ∘C for 1.5 h and deionized water (conductivity 18.25 MΩ) was added; the volume was constant with a 25 mL volumetric flask and then passed through a 0.45 µm membrane. The samples were diluted with 2 % HNO3 four times for further analysis. Three blank PVC film samples were digested using the same method for background control.
The heavy-metal content was determined by an inductively coupled plasma mass spectrometer (ICP-MS; Agilent, 8900). Before analysis, tuning procedures including plasma parameter, ion transmission path, quadrupole mass spectrometer and detector had been done. During analysis, standard solutions were prepared at concentrations of 0, 1, 2, 5, 10, 20, 50 and 100 µg L−1. In, Bi and Rn were used as internal standard elements and were introduced into the nebulizer by mixing them with the sample to be tested and the standard solution in the sampling pipeline by online addition, and the instrument drift and matrix effect were compensated for. After each analysis of a sample, 2 % dilute nitric acid was used to clean the injection line for 1 min before the second sample was collected to eliminate the memory effect of the previous sample.
A scanning electron microscope (SEM; Phenom Pro) equipped with an energy-dispersive X-ray detector was used for morphologies of particle examination at the voltage of 10 kV. All the samples (soil, PM2.5 and PM10) were on the carbon conductive adhesive, then sprayed with platinum to improve the conductivity. Here, the parent soil of S10, the generated PM2.5 and the generated PM10 were examined.
Statistical analysis was performed using SPSS Statistics. The correlation analysis was conducted through Spearman's correlation and the significant difference was used with an independent sample t test.
2.4 Ambient dust aerosol measurements
On 23 May 2018 (LT), on-site field measurements were conducted in Shanghai to assess the ambient dust particles. The measurements indicated an average wind speed of 2.2 m s−1, which corresponds to a level of a floating dust storm with visibility of up to 10 km. The sampling was located on the sixth floor of the Environmental Science Building on Jiangwan Campus, Fudan University, a typical residential area in a heavily polluted urban area. The chemical composition of individual ambient particles was measured by single-particle aerosol mass spectrometry (SPAMS, Hexin Co., Ltd). Detailed information on SPAMS is available elsewhere (Li et al., 2011). An adaptive resonance theory-based clustering method (ART-2a) was used to classify the mass spectra generated and identify dust- and heavy-metal-containing particles (Sullivan et al., 2007). The Hybrid Single-Particle Lagrangian Integrated Trajectory (HYSPLIT-4) model developed by the ARL (Air Resources Laboratory) of NOAA (National Oceanic and Atmospheric Administration, U.S.) was employed to compute hourly resolved 48 h air mass backward trajectories at 500 m arrival height (Lv et al., 2021; Pongkiatkul and Kim Oanh, 2007).
2.5 Air quality model configuration and application
The source-oriented Community Multiscale Air Quality (CMAQ) model v5.0.1 with an expanded stratospheric and air pollution research-99 (SAPRC-99) photochemical mechanism was applied to simulate PM2.5 levels and track the sources of primary PM2.5 (PPM2.5) in China during the entire year of 2013 (Guenther et al., 2012; Ying et al., 2018). The simulation domain covered China and its surrounding countries, with a horizontal resolution of 36 × 36 km2 (127 × 197 grids). Anthropogenic emissions were based on the Multi-resolution Emission Inventory for China (MEIC, v1.3, 0.25∘ × 0.25∘, http://www.meicmodel.org, last access: June 2023). Biogenic emissions were generated by the Model of Emissions of Gases and Aerosols from Nature (MEGAN) v2.1 (Guenther et al., 2012). The meteorological inputs for the CMAQ model were calculated by the Weather Research and Forecasting (WRF) model (https://www2.mmm.ucar.edu/wrf/users, last access: June 2023).
Five major source contributions (windblown dust, residential, transportation, power generation and industrial sources) to PM2.5 were investigated based on the inventory-observation-constrained emission factors (Ying et al., 2018). Three control trials were conducted for each heavy metal according to measured soil, dust PM2.5 and the SPECIATE datasets from the four regions (three dust sources and Shanghai). It is worth noting that the emission factors for areas outside these four regions were estimated using inverse distance weight (IDW) spatial interpolation methods. These methods were based on the dataset of emission factors within these four regions, which represent the amount of heavy metal emitted per kilogram of dust (Zhang and Tripathi, 2018). Each heavy-metal source concentration from dust aerosol and all four sources were used to quantify the contribution to heavy-metal concentrations in the atmospheric dust aerosols, which can be represented in Eq. (1):
where Ei is the PPM2.5 emission from the ith source; si is the emission factor of the specific heavy metals from the ith source; and a is the concentration of heavy metal in measured soil, dust PM2.5 and the SPECIATE datasets. E1, s1 and a are the values for dust.
In addition, the human health risk of heavy metals was assessed. The three main routes of chemical daily intake (CDI, mg kg−1 d−1) of air heavy metals were (1) direct ingestion of particles or gases existing in the air (CDIing), (2) inhalation of suspended particles through mouth and nose (CDIinh) and (3) daily absorption of heavy metals through the skin (CDIdermal) (Luo et al., 2012). To assess the carcinogenic and non-carcinogenic effects of heavy metals, we evaluated these effects in 13 age groups ranging from birth to ≥ 81 years old. These age groups are as follows: < 1, 1 to < 2, 2 to < 3, 3 to < 6, 6 to < 11, 11 to < 16, 16 to < 20, 21 to < 31, 31 to < 51, 51 to < 61, 61 to < 71, 71 to < 81 and ≥ 81 years (Gholizadeh et al., 2019). The variables and values used for estimating human exposure to heavy metals were obtained from the U.S. Environmental Protection Agency (EPA) and the U.S. Department of Energy (U.S. DoE) (Moya et al., 2011; U.S. DoE, 2011). CDIing, CDIinh and CDIdermal were calculated as
Moreover, the total carcinogenic risk (TCR) for each heavy metal was calculated by
Here IRing is ingestion rate (mg d−1), EF is exposure frequency (d yr−1), ED is exposure duration (year), BW is body weight (kg), AT is averaging time (day), SA is total body skin surface area (m2), AF is skin adherence factor (mg cm−2), ET is exposure time (h d−1), ABSd is the dermal absorption factor, IRinh is inhalation rate (m3 d−1), ABSGI is the gastrointestinal absorption factor and CSF is the cancer slope factor. The values of these parameters can be found in the previous study (Gholizadeh et al., 2019).
3.1 Enrichment of heavy metals in fine-dust aerosols
Figures S3–S4 show the absolute concentrations of heavy metals in dust aerosols and their parent soils. The concentrations of heavy metals in dust PM10 were similar to soil concentrations, which showed a significant correlation between soils and PM10 (p < 0.01) (Fig. S5). While the concentrations of heavy metals in dust PM2.5 were higher than those in soils, especially Mn, Ni, Cu and Zn showed significant differences (p < 0.001) (Fig. S6). This trend was consistent across all soil samples. The enrichment factor (EF) of heavy metals in dust aerosols relative to the parent soils was calculated with Eq. (7).
Here C1 is the heavy-metal concentration in dust PM, m1 is the mass of dust PM collected on the filter, m0 is the mass of soil in the ICP-MS sample and C0 is the heavy-metal concentration of the soil.
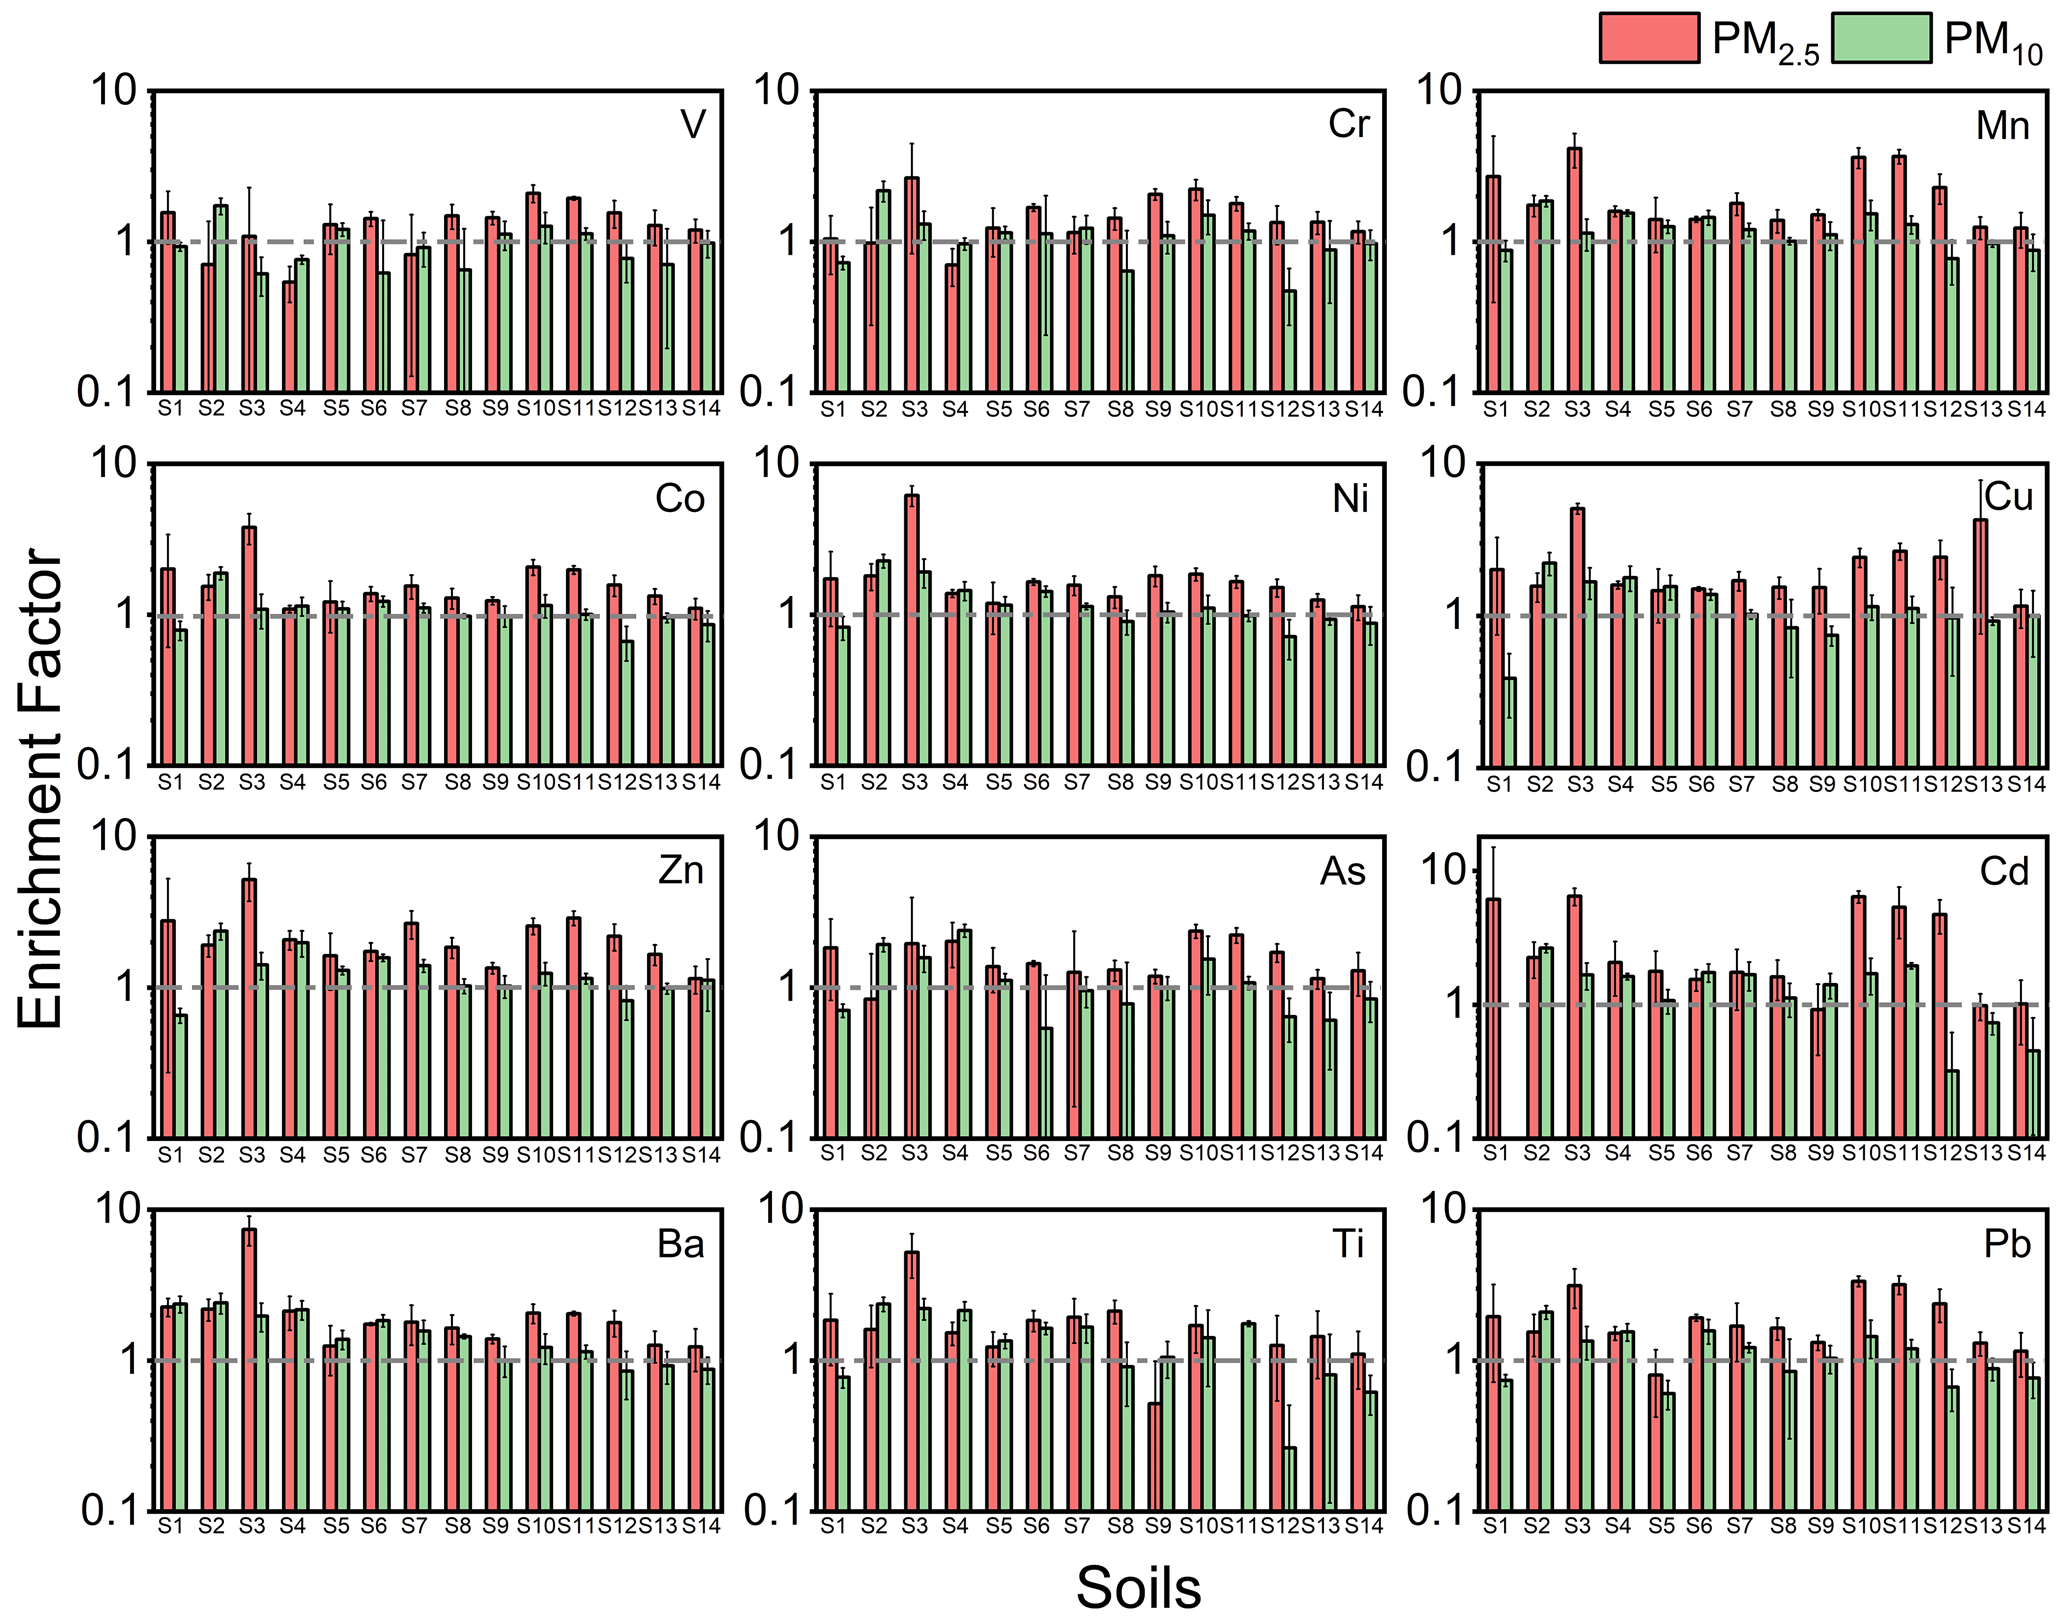
Figure 1Enrichment factors of PM2.5 and PM10. Enrichment factors of heavy metals in dust aerosols from soil S1–S14; red represents PM2.5 and green represents PM10. The gray dotted line represents the EF as 1. The whiskers on the bars represent the standard deviations of triplicates.
Figures 1 and S7 show that many heavy metals were highly enriched in fine-dust aerosols (PM2.5); i.e., their absolute concentrations were significantly higher in fine-dust particles than in the parent soil (Fig. S6). V, Cr, Mn, Co, Ni, Cu, Zn, As, Cd, Ba, Ti and Pb were all enriched in dust PM2.5 during the process of dust formation. The following trend of heavy-metal enrichment was established for dust PM2.5: Cd > Zn > Ba > Cu > Mn > Pb > Ni > Ti > Co > As > Cr > V. Notably, the EFs of Cd were greater than 5 for soils S1, S10 and S11. No other literature has reported the enrichment of Cd or other heavy metals in dust aerosols. However, there is one study showing the enrichment of water-soluble ions during dust aerosol production from soil (Wu et al., 2022). It reports that from sandy soils in the Taklamakan Desert, the EFs of Ca2+ ranged from approximately 5.6 to 223.1, and the EF values of Mg2+ were between approximately 2.1 and 90.3 for dust PM2.5. In this study, it is found that the EF of Cd and other metals falls within the range of EF for these water-soluble ions, consistent with the values reported by Wu et al. (2022). Figure 1 also illustrates that all heavy metals were more highly enriched in smaller PM2.5 dust particles compared to larger PM10 dust particles. For example, the Cd's EF reached ∼ 6.4 and ∼ 1.7 for dust PM2.5 and dust PM10, respectively, from soil S1. Most dust PM2.5 should originate from the small colloids in soil, which are defined as soil particles with a diameter less than 2 µm. These soil colloids usually carry large amounts of negative charge, which can help adsorb many cations in soil, including various heavy-metal ions (Brady and Weil, 2008). Thus, heavy metals are enriched in small soil aggregates. During the sandblasting process, the smaller soil grains with higher heavy-metal concentrations are more likely to be ejected and form dust aerosols. The particle-size dependence of heavy-metal enrichment could have significant ramifications for the health impacts of dust aerosols. The dust aerosol size distribution (Fig. S8) was also measured by an Aerodynamic Particle Sizer (APS, APS model 3321; TSI Inc.; USA). It is found that the peak of the particle-size distribution of dust aerosol was at approximately 2–3 µm. Similarly, the scanning electron microscope (SEM) images of these dust aerosols (generated by S10) show the presence of a large number of particles with sizes of 2–3 µm. As particle size decreased, the shape of particles changed from flakes to rods, which means a larger surface area (Fig. S9). When examining the impact of soil texture on dust aerosol enrichment, first, notable variations were observed in the EF values from one soil texture, such as sandy soils, specifically S2, S4, S7, S10, S11 and S12. To assess the significance of these variations, a one-way analysis of variance (ANOVA) was conducted using SPSS. In ANOVA, the p value represents the probability of obtaining the observed differences in means (or more extreme differences) by random chance alone, assuming no true difference between the groups. A p value below a predetermined significance level (commonly 0.05) indicates significant differences between the means of the compared groups. Specifically, for sandy soil, analysis results reveal significant variations between these six soils in terms of the EF values for both dust PM2.5 (p value = 0.004 < 0.05) and dust PM10 (p value = 0 < 0.05) (Tables S5 and S6). These results indicate that there are significant differences in the EFs of heavy metals within the sandy soil group. Then, the variation between soil types was analyzed. For the six different types of soil samples, the results of ANOVA showed significant differences in the EFs of dust PM2.5 (p value = 0 < 0.05) and dust PM10 (p value = 0 < 0.05) among these soil types (Tables S7 and S8). The differences among the six soils from different soil types were greater than those observed among the different soils in the same soil type, indicating a potential role of soil type in affecting EFs, which would require further study to elucidate. Detailed information can be found in the Supplement's Section 3 and Tables S5–S10.
To investigate the link between dust particle size and heavy-metal EFs in greater detail, a MOUDI impactor was used to collect dust PM from 0.56 to 10 µm (absolute concentration obtained in Fig. S10). Consistent with the results discussed above, the EFs for some heavy metals, such as Pb, significantly increased with decreasing particle diameter (r = −1, p < 0.01) (Fig. 2). For the smallest dust particles (0.56–1.0 µm), the EFs for Pb were approximately 83, an order of magnitude greater than the EFs (∼ 3) for the largest dust particles (> 10 µm). V, Cr, Co, Mn, Ni, Cu, Zn, As and Ba show consistent trends, with EFs increasing as the particle size decreases. As the particle size decreases from 10 to 0.56 µm, the details are as follows: V ranging from ∼ 1.1 to ∼ 18.9, Cr ranging from ∼ 1.5 to ∼ 23.7, Co ranging from ∼ 1.7 to ∼ 93.7, Mn ranging from ∼ 2.3 to ∼ 7.4, Ni ranging from ∼ 1.6 to ∼ 29.7, Cu ranging from ∼ 3.3 to ∼ 54.3, Zn ranging from ∼ 2.3 to ∼ 19.0, As ranging from ∼ 1.8 to ∼ 112.3 and Ba ranging from ∼ 1.4 to ∼ 7.0. These results demonstrate that some heavy metals are indeed enriched in smaller soil particles, which could be aerosolized during the sandblasting process. The particle-size dependence of heavy-metal enrichment could have significant ramifications for the health impacts of dust aerosols. In contrast, Cd's EFs remain relatively unchanged with varying particle sizes. Ti exhibits an opposite trend, with EF values decreasing as the particle size decreases, and the reason for this difference requires further study.
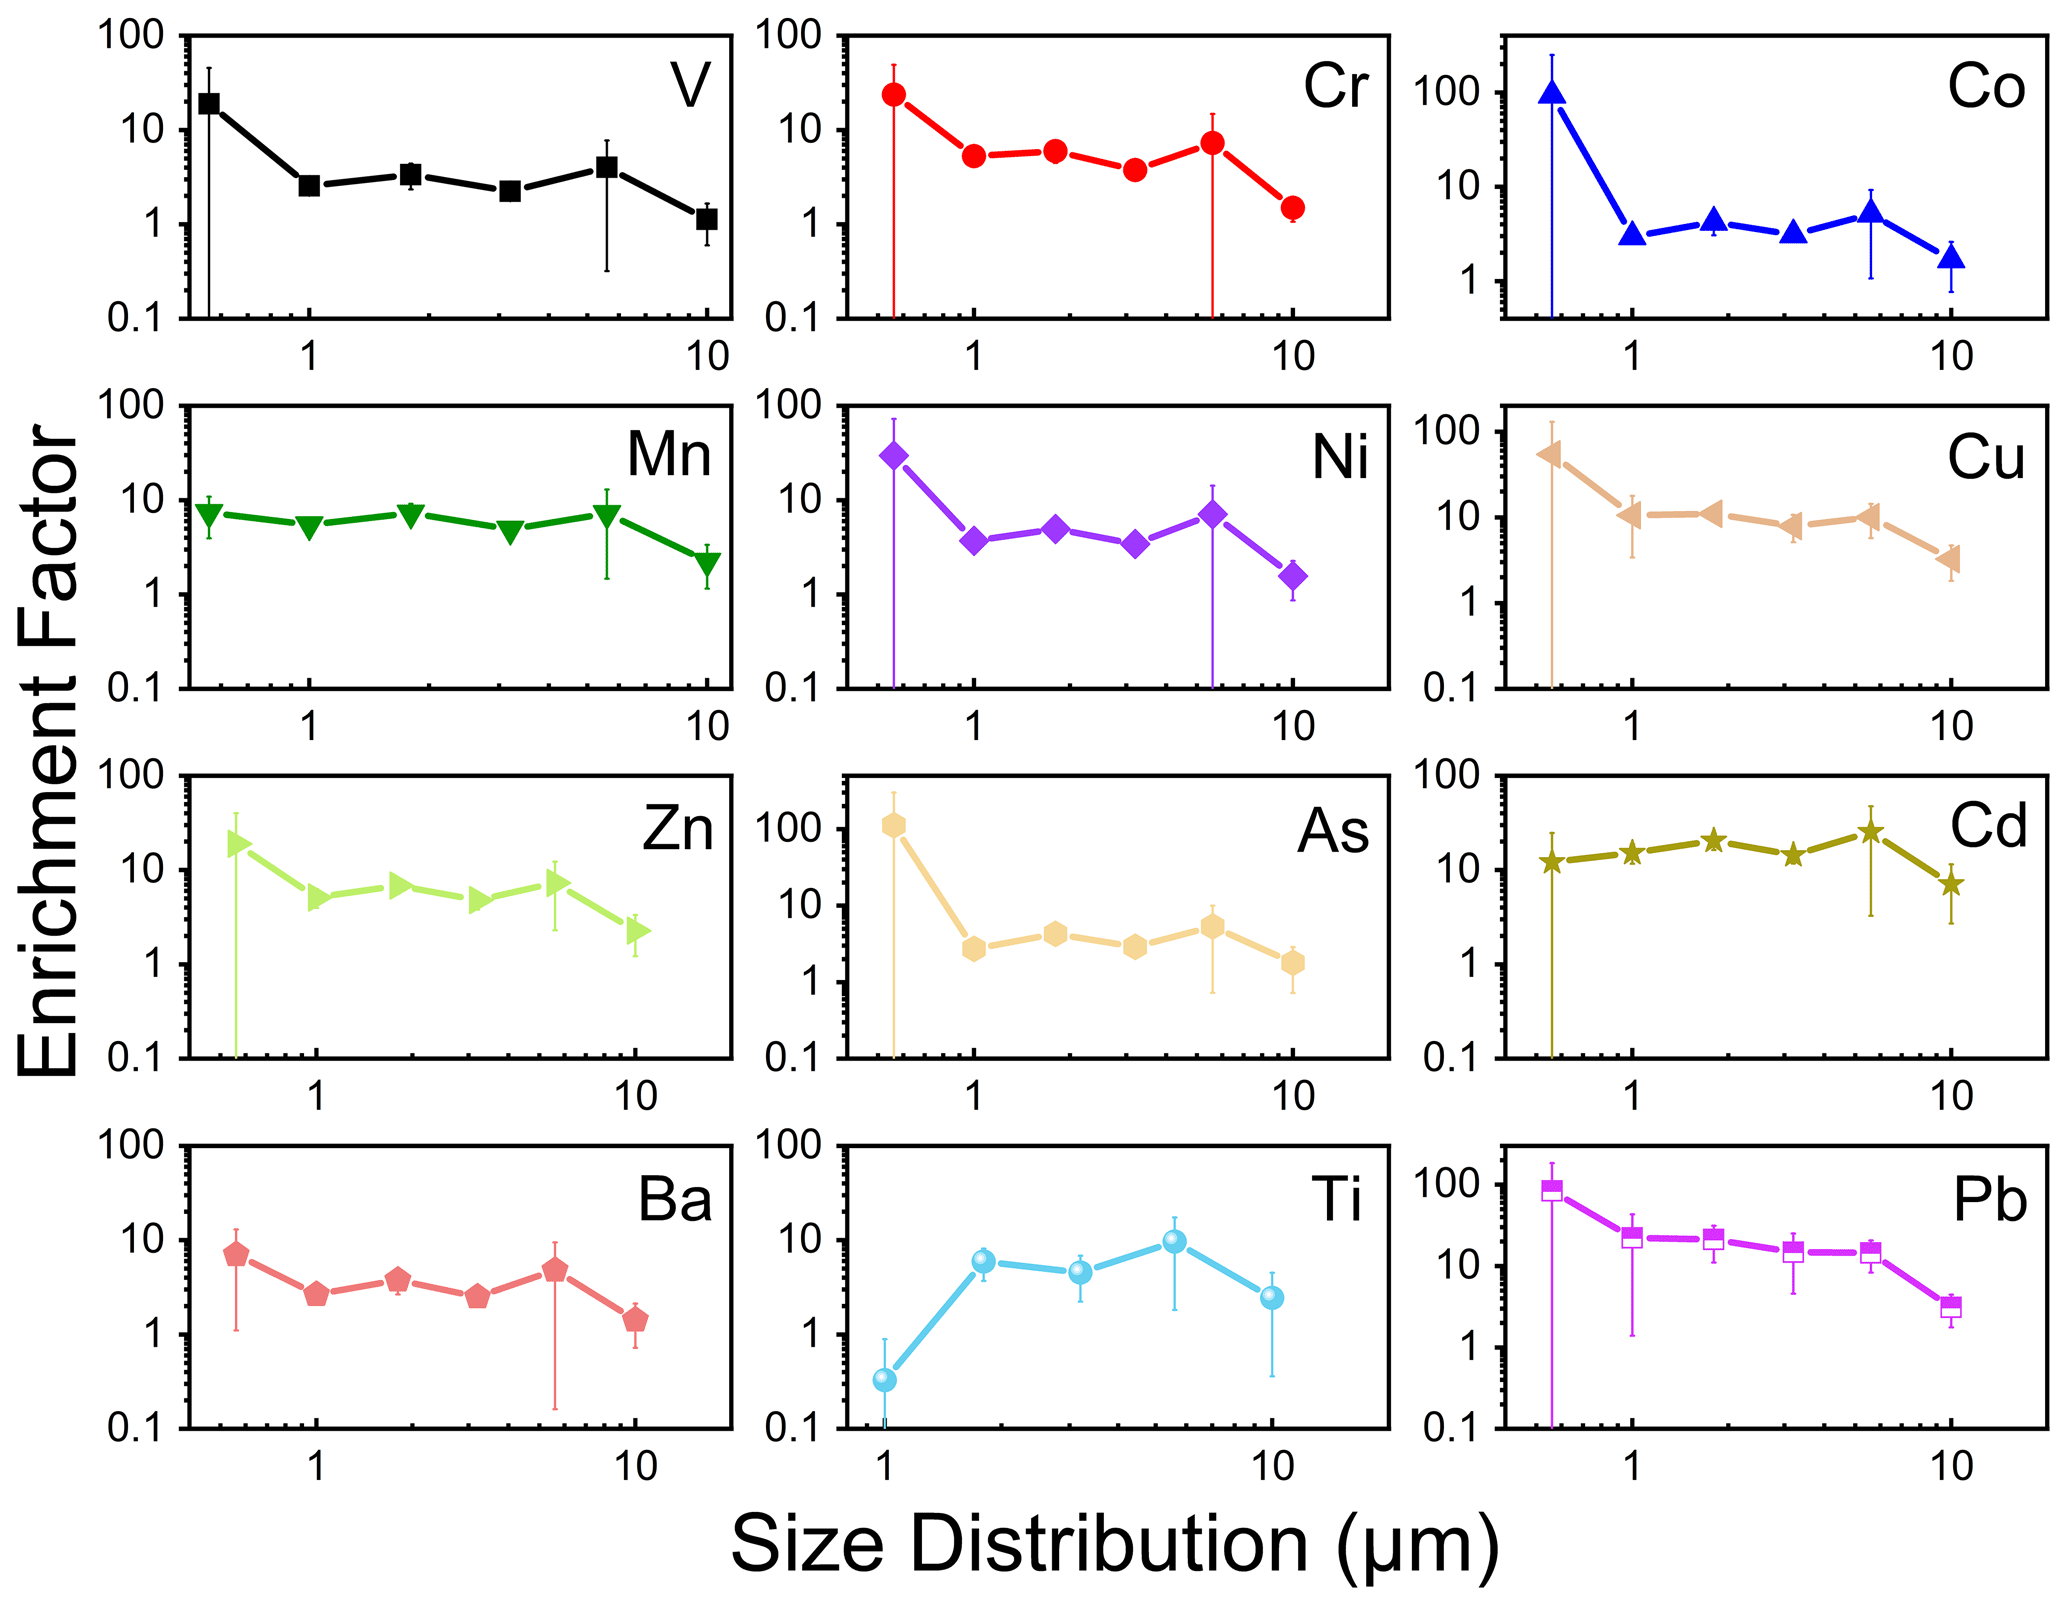
Figure 2Enrichment factors of heavy metals in dust aerosols with different particle-size ranges. The EF data were produced from the soil S10, with diameters at above 10, 5.6–10, 3.2–5.6, 1.8–3.2, 1.0–1.8 and 0.56–1.0 µm. The whiskers on the bars represent the standard deviations of triplicates.
3.2 Modeling of the contributions of dust aerosols to atmospheric heavy metals using the dust profiles from this study and the SPECIATE datasets
It is necessary to know the sources of atmospheric heavy metals to effectively control their emission. Air quality models with emission inventories can estimate the contributions of various sources to atmospheric heavy metals. However, when estimating heavy-metal emissions from dust production, some widely used air quality models, such as the CMAQ model, typically use dust profiles from the U.S. EPA's SPECIATE datasets. As discussed in the Introduction, this dust profile may be outdated and cannot reflect realistic dust compositions. We used the CMAQ model to assess the potential impact of a dust–aerosol profile in atmospheric dust aerosol using our measured profile and the profile (no. 41350) from the SPECIATE datasets. The model tracked heavy metals in PM2.5 in China for the year 2013 (see “Materials and methods” section) from five major sources: windblown dust, residential, transportation, power generation and industry.
Figure 3 shows the modeled contributions of the dust source to the Cr and Pb concentrations in PM2.5 for China using the measured soil, dust PM2.5 profiles from this study and the SPECIATE composition profiles (see the “Materials and methods” section). In addition, the modeled results for other metals, such as As, Cu, Mn, Ti and Zn, are presented in Figs. S11–S15.
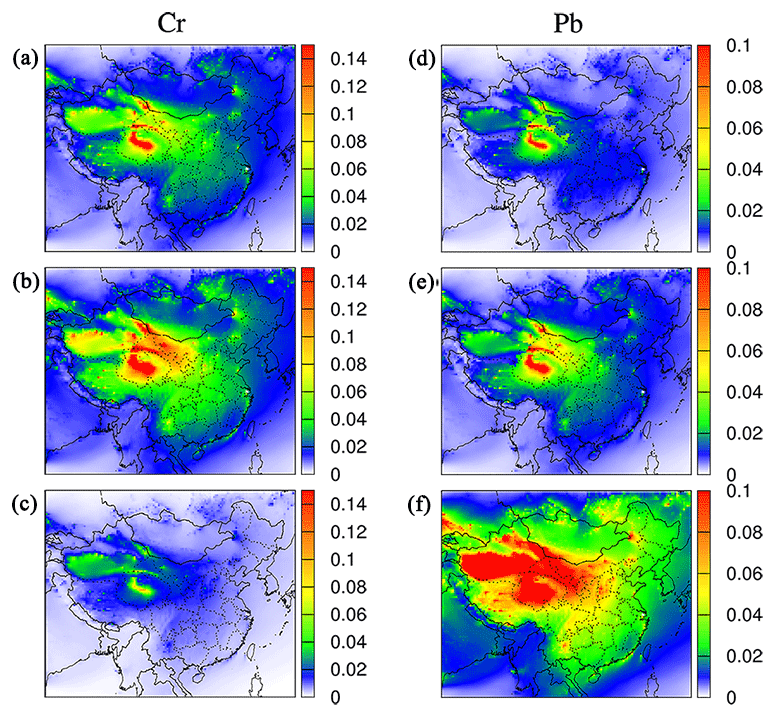
Figure 3Modeling of the contributions of dust aerosols to atmospheric Cr and Pb concentrations. These results use the dust profiles of measured soil (a, d), dust PM2.5 (b, e) and the SPECIATE datasets (c, f). The unit is µg m−3.
For atmospheric Cr, it is clear that the scenario of applying the SPECIATE database significantly underestimates the contribution of dust aerosol, with a highest value of ∼ 0.08 µg m−3, when compared to the scenario of applying the measured dust PM2.5 profiles, which had a highest value of ∼ 0.14 µg m−3. For Pb, as shown in the right column of Fig. 3, the scenario of applying the SPECIATE profile overestimates the contribution of dust aerosol, with the value up to ∼ 0.4 µg m−3, when compared to the scenario of applying the measured dust PM2.5 profiles, which had a highest value of ∼ 0.14. Uncertainties associated with the use of SPECIATE have also been identified in previous studies (Ho et al., 2003; Xia et al., 2017). Specifically, the dust PM2.5 source profiles obtained from local studies indicated that SPECIATE overestimated the contributions of atmospheric K and Al by approximately 23 %, while underestimating the contributions of Ca and Na by 50 %. Additionally, the model represents the annual average data for the year 2013. Although there are some field studies conducted in the same year (Wang et al., 2021; Shi et al., 2018), there are no available annual average data for a direct comparison with the model results. These results demonstrate that the modeled heavy-metal distribution in the atmosphere is quite sensitive to the input of the dust composition profile, strongly suggesting that using a proper dust composition profile is key in such air quality modeling.
As discussed in the Introduction, many atmospheric studies assume that dust aerosol composition is similar to the composition of its parent soil. In this study, we also use the soil composition as an input dust profile in the model calculation to see how the modeled results compared to those using the dust PM2.5 profile. For Cr, an obvious elevation of contribution was found by comparing the map using soil (Fig. 3a) and dust PM2.5 (Fig. 3b) profiles, with the hotspots of contribution (∼ 0.14 µg m−3) distributed in northwest China. The region with dust aerosol contribution ranged from 0.02 to 0.08 µg m−3 and covers most areas in China by using the dust PM2.5 profile. In contrast, the application of the soil profile to the model reveals a significantly reduced area where the modeled Cr concentration from dust aerosols falls within the range of 0.02 to 0.08 µg m−3. For Pb, a significant difference is also found. The high contribution areas are mainly distributed in northwest China for scenarios applying soil and dust profiles with a value up to 0.1 µg m−3, while the area with low dust aerosol contribution (< 0.02 µg m−3) shrinks considerably in the scenario of applying soil profile.
The applied dust enrichment factors to modeled Cr in PM2.5 had an even stronger impact on modeled source apportionment (Fig. 3a–b). The average dust source contribution to the total PM2.5 Cr concentration over China was calculated to be 0.03 and 0.05 µg m−3 in the scenarios of applying soil and dust profiles, respectively. The model results for As, Cu, Mn, Ti and Zn (Figs. S11–S15) also show similar trends, indicating that applying realistic enrichment factors to heavy-metal concentrations in fine-dust aerosols is critical to accurately model the sources of atmospheric heavy metals. These results demonstrate that it is not appropriate to assume dust aerosol composition is equal to soil composition, at least in air quality modeling.
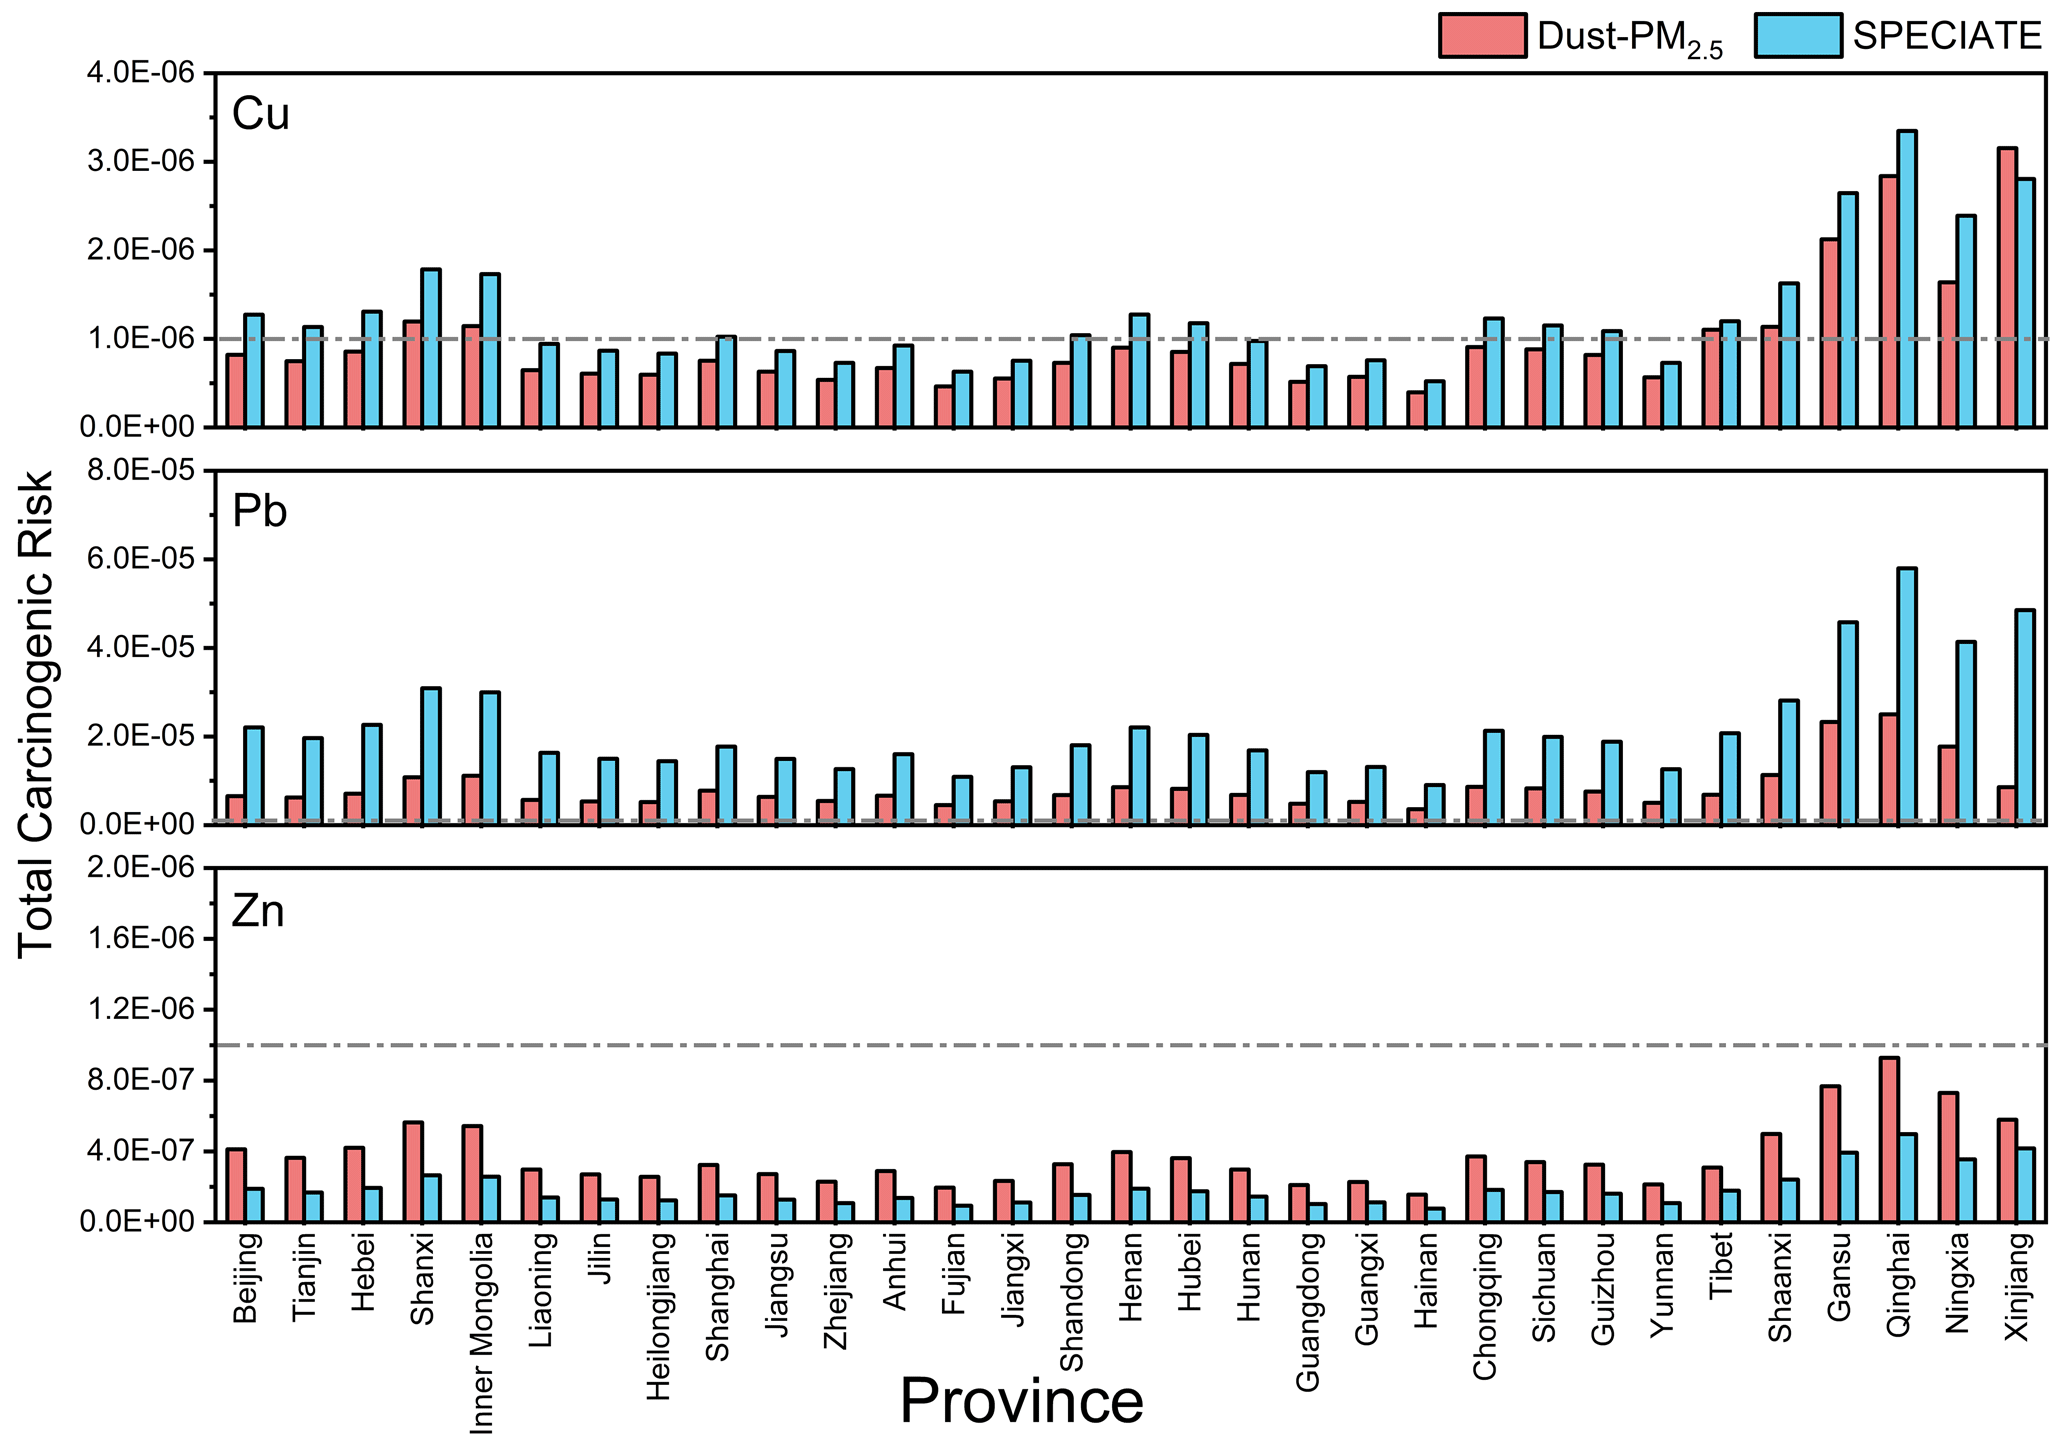
Figure 4Comparison of the total carcinogenic risk (TCR) of the modeled atmospheric heavy metals for each province in mainland China between using the dust PM2.5 and SPECIATE profiles. Here, the TCR of Cu, Pb and Zn was calculated. The gray dotted line is 10−6, the threshold value for health concerns.
Figure 4 shows the total carcinogenic risk (TCR) of the modeled atmospheric heavy metals (Cu, Pb and Zn) for each province in mainland China. The modeled results using the dust-PM2.5 and the SPECIATE profiles are compared here. The carcinogenic risks lower than 10−6 are considered negligible, and risks above 10−4 are not accepted by most international regulatory agencies (Cheng et al., 2015; U.S. EPA, 1989; Luo et al., 2012). For Cu, it is evident that using the SPECIATE profile overestimated (the difference ranges up to ∼ 7.5 × 10⁻⁷) the TCR in China compared to using the dust-PM2.5 profile, as some regions exceed 10−6, the threshold value. For Pb, although all regions were above 10−6, the TCR using the SPECIATE profile was greatly overestimated (the difference range is ∼ 5.5 × 10⁻⁶–4.0 × 10⁻⁵). The model results for Zn showed that all the regions were not above 10−6 but significantly underestimated risks using the SPECIATE profile. This indicates that the health risk assessment is also sensitive to dust composition profiles. Using the SPECIATE profile might be problematic for assessing these risks.
3.3 Field observation before, during and after a dust storm
Our modeling results suggest that dust aerosol could be a major source of multiple heavy metals in PM2.5 in China. Therefore, dust storms should significantly increase the concentrations of heavy metals in PM2.5. To test this idea, we studied a dust-storm plume, which originated from Mongolia and arrived in Shanghai (Huang et al., 2010) on 23 May 2018 (Fig. S16). Real-time single-particle mass spectra were generated by a single-particle mass spectrometer. Single-particle mass spectrometry can offer detailed information on the chemically resolved mixing state at the single-particle level. According to the similarities of the mass-to-charge ratio and peak intensity of characterized signals, Dust particles were classified via an adaptive-resonance-theory-based clustering method (ART-2a, see“material and methods” section). The number fraction of Dust particles was ∼ 4.94 % before the dust storm and after the dust storm, and it increased to ∼ 9.73 % during the dust-storm episode (Fig. 5a).
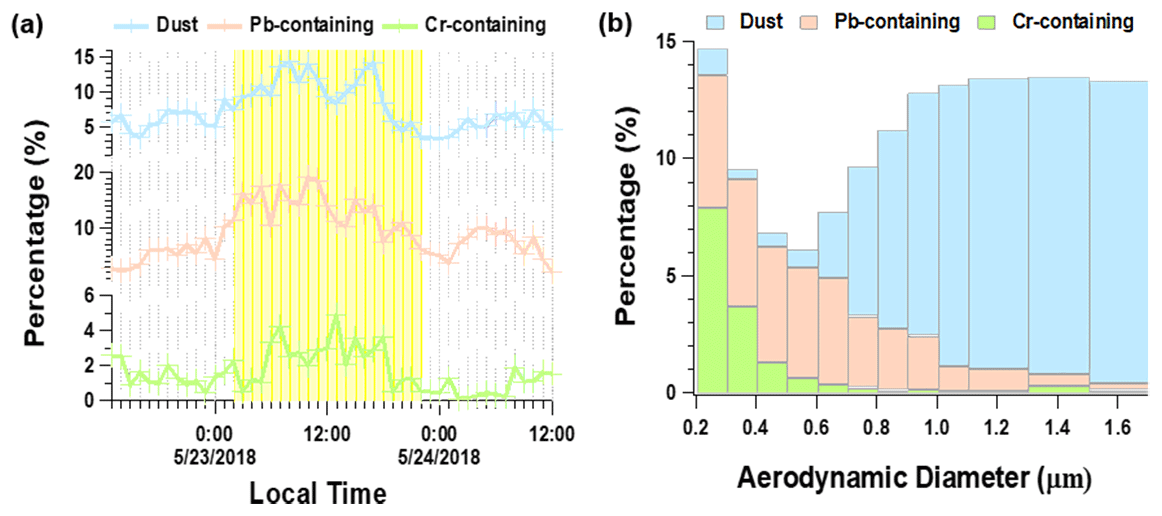
Figure 5Ambient dust aerosol measurements. (a) Temporal variation of the percentages of dust aerosol, Pb-containing and Cr-containing particle clusters. The yellow shading represents the dust-storm episode. (b) Size-resolved number fraction of dust aerosol, Pb-containing and Cr-containing particle clusters.
Dust particle mass spectra also contained ion markers indicative of an array of heavy metals ( 55 [Mn+], 51 [V+], 207 [Pb+], 63 [Cu+], 75 [As+], 91 [AsO+], 52 [Cr+], −84 [CrO], −100 [CrO]) (red sticks in Fig. S17), indicating the existence of heavy metals in the ambient dust aerosols. The time series of Pb-containing and Cr-containing particle number fractions showed similar trends to the Dust particles. When the dust storm arrived, both Pb-containing and Cr-containing particle fractions increased as the dust cluster fraction increased. Before and after the dust storm, the percentages of Pb-containing and Cr-containing particles that overlapped with the Dust cluster were 41 % and 32 %, respectively. However, this overlapped ratio increased to 86 % and 71 % during the dust-storm episode. The increase of heavy-metal particles in step with the dust particles indicated that the dust particles could be the dominant source of these heavy-metal species during this dust-storm episode.
We further analyzed the size-resolved number fraction of dust aerosol, Pb-containing and Cr-containing particles during the dust-storm episode (Fig. 5b). The number fraction of Dust particles increased with increasing aerodynamic diameter. For particles above 1.0 µm, Dust accounted for > 12 % of the total particles during the storm. However, the Pb-containing and Cr-containing particles made up a larger number fraction of analyzed particles with decreasing particle diameter size (< 1 µm). The number fractions of Pb-containing and Cr-containing particles were 5.7 % and 7.9 % of all mass spectra for particles from 0.2–0.3 µm, respectively. This result was consistent with our laboratory results that there is high heavy-metal enrichment in smaller dust particles, as well as our modeling results that dust aerosol is likely a major source of atmospheric Pb and Cr over China.
In this study, many heavy metals were found to be highly enriched in fine-dust (PM2.5) aerosols compared to their concentrations in the parent soils. We propose that heavy metals tend to be enriched in smaller soil aggregates (Ikegami et al., 2014). During the sandblasting process, the heavy-metal-enriched smaller soil aggregates are more likely to be ejected and form dust aerosols. This work finds that dust aerosols from different soils may have a range of heavy-metal enrichment factors. To study the transfer of heavy metals from soils to the air, it is critical to have a complete set of enrichment factors for each major soil type. There is a difference among the heavy-metal enrichment factors from different soil samples. The variability in the EFs is likely due to differences in soil properties (soil texture, size distribution etc.) which may affect the sandblasting–saltation process. For example, the enrichment factors of the heaviest metals for soils S1, S10 and S11 were higher than other soils. The detailed reason is still unknown and needs further exploration. Moreover, air quality models, including CMAQ models and various chemical mass balance (CMB) models, often use the dust chemical profiles from the U.S. EPA's SPECIATE to calculate the contribution of fine-dust aerosols to atmospheric heavy metals, which are outdated and could lead to significant errors in estimating the emission of heavy metals through dust generation. Without using proper dust profiles in estimating heavy-metal emissions from dust generation, the contribution of fine-dust aerosols to atmospheric heavy metals and the associated health risks are likely significantly mistaken.
Dust generation and aerosolization are complex processes that may have certain chemical selectivity. Here, we deployed a laboratory generator to produce dust aerosol with a realistic sandblasting process. The concentrations of heavy metals (including V, Cr, Mn, Co, Ni, Cu, Zn, As, Cd, Ba, Ti and Pb) in soils, fine-dust (PM2.5) aerosols and coarse-dust (PM10) aerosols were measured. With research efforts to elucidate the enrichment process of heavy metals in dust aerosols compared to their parent soils, our results fill the knowledge gaps of the compositional variation of heavy metals between the parent soils and the generated dust aerosols. Mn, Cd, Pb and other heavy metals were found to be highly enriched in fine-dust (PM2.5) aerosols, which can be up to ∼ 6.5-fold. These findings were also consistent with our field observation results. In addition, air quality models often use an outdated heavy-metal profile for dust aerosols from the U.S. EPA's SPECIATE database, which seems to lack enrichment between each particle size. We modeled the impact of the contribution of heavy metals in dust aerosol and their health risks in CMAQ, a widely used air quality model, and determined the atmospheric heavy-metal concentrations over China, which drastically changed when we applied different dust profiles, such as the measured soil and dust PM2.5 profiles from this study, as well as the SPECIATE composition profiles. Our air quality modeling for China demonstrates that the calculated contribution of fine-dust aerosols to atmospheric heavy metals, as well as their cancer risks, could have significant errors without using proper dust profiles.
All data supporting this study and its findings are available in an online data repository at https://doi.org/10.17632/wpphf8rd33.1 (Gao et al., 2022).
The supplement related to this article is available online at: https://doi.org/10.5194/acp-23-13049-2023-supplement.
XW and JC conceptualized the work and designed the experiments. HZ and SZ led the air quality modeling work. QG led the experimental work of heavy-metal enrichment measurements. JZ led the field observation. KZ, QW, SC, SW, JH, XL and HC helped in experimental works. LZ, LW, ZW, XY and HZ helped in the experimental design and data analysis. QY provided the data required for the air quality modeling. All the authors contributed to the paper's writing.
The contact author has declared that none of the authors have any competing interests.
Publisher's note: Copernicus Publications remains neutral with regard to jurisdictional claims made in the text, published maps, institutional affiliations, or any other geographical representation in this paper. While Copernicus Publications makes every effort to include appropriate place names, the final responsibility lies with the authors.
The authors also thank Xiangcheng Zeng for their help in heavy metal measurement. Comments from Camille Sultana greatly improved this article.
This research has been supported by the National Natural Science Foundation of China (grant nos. 92044301, 42077193 and 21906024).
This paper was edited by N'Datchoh Evelyne Touré and reviewed by two anonymous referees.
Alfaro, S. C.: Influence of soil texture on the binding energies of fine mineral dust particles potentially released by wind erosion, Geomorphology, 93, 157–167, https://doi.org/10.1016/j.geomorph.2007.02.012, 2008.
Alfaro, S. C., Gaudichet, A., Gomes, L., and Maille, M.: Modeling the size distribution of a soil aerosol produced by sandblasting, J. Geophys. Res.-Atmos., 102, 11239–11249, https://doi.org/10.1029/97jd00403, 1997.
Ashrafi, K., Fallah, R., Hadei, M., Yarahmadi, M., and Shahsavani, A.: Source apportionment of total suspended particles (TSP) by positive matrix factorization (PMF) and chemical mass balance (CMB) modeling in Ahvaz, Iran, Arch. Environ. Con. Tox., 75, 278–294, 2018.
Balakrishna, G. and Pervez, S.: Source apportionment of atmospheric dust fallout in an urban-industrial environment in India, Aerosol Air Qual. Res., 9, 359–367, 2009.
Becagli, S., Caiazzo, L., Di Iorio, T., di Sarra, A., Meloni, D., Muscari, G., Pace, G., Severi, M., and Traversi, R.: New insights on metals in the Arctic aerosol in a climate changing world, Sci. Total Environ., 741, 140511, https://doi.org/10.1016/j.scitotenv.2020.140511, 2020.
Brady, N. and Weil, R.: The nature and properties of soils, Prentice Hall, Upper Saddle River, ISBN 978-0-13-227939-0, 2008.
Bryant, R. G.: Recent advances in our understanding of dust source emission processes, Progress in Physical Geography-Earth and Environment, 37, 397–421, https://doi.org/10.1177/0309133313479391, 2013.
Burezq, H.: Combating wind erosion through soil stabilization under simulated wind flow condition – Case of Kuwait, International Soil and Water Conservation Research, 8, 154–163, https://doi.org/10.1016/j.iswcr.2020.03.001, 2020.
Chang, A. C., Warneke, J. E., Page, A. L., and Lund, L. J.: Accumulation of Heavy Metals in Sewage Sludge-Treated Soils, J. Environ. Qual., 13, 87–91, https://doi.org/10.2134/jeq1984.00472425001300010016x, 1984.
Cheng, I., Xu, X., and Zhang, L.: Overview of receptor-based source apportionment studies for speciated atmospheric mercury, Atmos. Chem. Phys., 15, 7877–7895, https://doi.org/10.5194/acp-15-7877-2015, 2015.
Ding, R. Q., Li, J. P., Wang, S. G., and Ren, F. M.: Decadal change of the spring dust storm in northwest China and the associated atmospheric circulation, Geophys. Res. Lett., 32, L02808, https://doi.org/10.1029/2004gl021561, 2005.
Evan, A. T., Flamant, C., Fiedler, S., and Doherty, O.: An analysis of aeolian dust in climate models, Geophys. Res. Lett., 41, 5996–6001, https://doi.org/10.1002/2014gl060545, 2014.
Fu, Q., Zhuang, G., Li, J., Huang, K., Wang, Q., Zhang, R., Fu, J., Lu, T., Chen, M., Wang, Q., Chen, Y., Xu, C., and Hou, B.: Source, long-range transport, and characteristics of a heavy dust pollution event in Shanghai, J. Geophys. Res.-Atmos., 115, D00K29, https://doi.org/10.1029/2009JD013208, 2010.
Fu, X., Wang, S. X., Cheng, Z., Xing, J., Zhao, B., Wang, J. D., and Hao, J. M.: Source, transport and impacts of a heavy dust event in the Yangtze River Delta, China, in 2011, Atmos. Chem. Phys., 14, 1239–1254, https://doi.org/10.5194/acp-14-1239-2014, 2014.
Gao, Q., Zhu, S., Zhou, K., Zhai, J., Chen, S., Wang, Q., Wang, S., Han, J., Lu, X., Chen, H., Zhang, L., Wang, L., Wang, Z., Yang, X., Ying, Q., Zhang, H., Chen, J., and Wang, X.: High Enrichment of Heavy Metals in Fine Particulate Matter through Dust Aerosol Generation, Mendeley Data, V1 [data set], https://doi.org/10.17632/wpphf8rd33.1, 2022.
Gholizadeh, A., Taghavi, M., Moslem, A., Neshat, A. A., Lari Najafi, M., Alahabadi, A., Ahmadi, E., Ebrahimi Aval, H., Asour, A. A., Rezaei, H., Gholami, S., and Miri, M.: Ecological and health risk assessment of exposure to atmospheric heavy metals, Ecotox. Environ. Safe., 184, 109622, https://doi.org/10.1016/j.ecoenv.2019.109622, 2019.
Gillette, D. and Goodwin, P. A.: Microscale transport of sand-sized soil aggregates eroded by wind, J. Geophys. Res., 79, 4080–4084, https://doi.org/10.1029/JC079i027p04080, 1974.
Griggs, D. J. and Noguer, M.: Climate change 2001: the scientific basis. Contribution of working group I to the third assessment report of the intergovernmental panel on climate change, Weather, 57, 267–269, 2002.
Grini, A. and Zender, C. S.: Roles of saltation, sandblasting, and wind speed variability on mineral dust aerosol size distribution during the Puerto Rican Dust Experiment (PRIDE), J. Geophys. Res.-Atmos., 109, D07202, https://doi.org/10.1029/2003jd004233, 2004.
Grini, A., Zender, C. S., and Colarco, P. R.: Saltation Sandblasting behavior during mineral dust aerosol production, Geophys. Res. Lett., 29, 15-1–15-4, https://doi.org/10.1029/2002gl015248, 2002.
Guenther, A. B., Jiang, X., Heald, C. L., Sakulyanontvittaya, T., Duhl, T., Emmons, L. K., and Wang, X.: The Model of Emissions of Gases and Aerosols from Nature version 2.1 (MEGAN2.1): an extended and updated framework for modeling biogenic emissions, Geosci. Model Dev., 5, 1471–1492, https://doi.org/10.5194/gmd-5-1471-2012, 2012.
Gunawardana, C., Goonetilleke, A., Egodawatta, P., Dawes, L., and Kokot, S.: Source characterisation of road dust based on chemical and mineralogical composition, Chemosphere, 87, 163–170, https://doi.org/10.1016/j.chemosphere.2011.12.012, 2012.
Ho, K. F., Lee, S. C., Chow, J. C., and Watson, J. G.: Characterization of PM10 and PM2.5 source profiles for fugitive dust in Hong Kong, Atmos. Environ., 37, 1023–1032, https://doi.org/10.1016/s1352-2310(02)01028-2, 2003.
Huang, K., Zhuang, G. S., Li, J. A., Wang, Q. Z., Sun, Y. L., Lin, Y. F., and Fu, J. S.: Mixing of Asian dust with pollution aerosol and the transformation of aerosol components during the dust storm over China in spring 2007, J. Geophys. Res.-Atmos., 115, D00K13, https://doi.org/10.1029/2009jd013145, 2010.
Huebert, B. J., Bates, T., Russell, P. B., Shi, G. Y., Kim, Y. J., Kawamura, K., Carmichael, G., and Nakajima, T.: An overview of ACE-Asia: Strategies for quantifying the relationships between Asian aerosols and their climatic impacts, J. Geophys. Res.-Atmos., 108, 8633, https://doi.org/10.1029/2003jd003550, 2003.
Huneeus, N., Schulz, M., Balkanski, Y., Griesfeller, J., Prospero, J., Kinne, S., Bauer, S., Boucher, O., Chin, M., Dentener, F., Diehl, T., Easter, R., Fillmore, D., Ghan, S., Ginoux, P., Grini, A., Horowitz, L., Koch, D., Krol, M. C., Landing, W., Liu, X., Mahowald, N., Miller, R., Morcrette, J.-J., Myhre, G., Penner, J., Perlwitz, J., Stier, P., Takemura, T., and Zender, C. S.: Global dust model intercomparison in AeroCom phase I, Atmos. Chem. Phys., 11, 7781–7816, https://doi.org/10.5194/acp-11-7781-2011, 2011.
Ikegami, M., Yoneda, M., Tsuji, T., Bannai, O., and Morisawa, S.: Effect of Particle Size on Risk Assessment of Direct Soil Ingestion and Metals Adhered to Children's Hands at Playgrounds, Risk Anal., 34, 1677–1687, https://doi.org/10.1111/risa.12215, 2014.
Kaufman, Y. J., Tanre, D., and Boucher, O.: A satellite view of aerosols in the climate system, Nature, 419, 215–223, https://doi.org/10.1038/nature01091, 2002.
Kettler, T. A., Doran, J. W., and Gilbert, T. L.: Simplified Method for Soil Particle-Size Determination to Accompany Soil-Quality Analyses, Soil Sci. Soc. Am. J., 65, 849–852, https://doi.org/10.2136/sssaj2001.653849x, 2001.
Kok, J. F., Ward, D. S., Mahowald, N. M., and Evan, A. T.: Global and regional importance of the direct dust-climate feedback, Nat. Commun., 9, 241, https://doi.org/10.1038/s41467-017-02620-y, 2018.
Kok, J. F., Storelvmo, T., Karydis, V. A., Adebiyi, A. A., Mahowald, N. M., Evan, A. T., He, C., and Leung, D. M.: Mineral dust aerosol impacts on global climate and climate change, Nature Reviews Earth & Environment, 4, 71–86, https://doi.org/10.1038/s43017-022-00379-5, 2023.
Lafon, S., Sokolik, I. N., Rajot, J. L., Caquineau, S., and Gaudichet, A.: Characterization of iron oxides in mineral dust aerosols: Implications for light absorption, J. Geophys. Res.-Atmos., 111, D21207, https://doi.org/10.1029/2005jd007016, 2006.
Lafon, S., Alfaro, S. C., Chevaillier, S., and Rajot, J. L.: A new generator for mineral dust aerosol production from soil samples in the laboratory: GAMEL, Aeolian Res., 15, 319–334, https://doi.org/10.1016/j.aeolia.2014.04.004, 2014.
Li, L., Huang, Z. X., Dong, J. G., Li, M., Gao, W., Nian, H. Q., Fu, Z., Zhang, G. H., Bi, X. H., Cheng, P., and Zhou, Z.: Real time bipolar time-of-flight mass spectrometer for analyzing single aerosol particles, Int. J. Mass Spectrom., 303, 118–124, https://doi.org/10.1016/j.ijms.2011.01.017, 2011.
Liu, Q., Wang, Y., Kuang, Z., Fang, S., Chen, Y., Kang, Y., Zhang, H., Wang, D., and Fu, Y.: Vertical distributions of aerosol optical properties during haze and floating dust weather in Shanghai, J. Meteorol. Res., 30, 598–613, https://doi.org/10.1007/s13351-016-5092-4, 2016.
Liu, Q., Liu, X., Liu, T., Kang, Y., Chen, Y., Li, J., and Zhang, H.: Seasonal variation in particle contribution and aerosol types in Shanghai based on satellite data from MODIS and CALIOP, Particuology, 51, 18–25, https://doi.org/10.1016/j.partic.2019.10.001, 2020.
Liu, X. D., Yin, Z. Y., Zhang, X. Y., and Yang, X. C.: Analyses of the spring dust storm frequency of northern China in relation to antecedent and concurrent wind, precipitation, vegetation, and soil moisture conditions, J. Geophys. Res.-Atmos., 109, D16210, https://doi.org/10.1029/2004jd004615, 2004.
Lowenthal, D. H., Watson, J. G., Koracin, D., Chen, L.-W. A., Dubois, D., Vellore, R., Kumar, N., Knipping, E. M., Wheeler, N., and Craig, K.: Evaluation of regional-scale receptor modeling, J. Air Waste Manage. Assoc., 60, 26–42, 2010.
Luo, X.-S., Ding, J., Xu, B., Wang, Y.-J., Li, H.-B., and Yu, S.: Incorporating bioaccessibility into human health risk assessments of heavy metals in urban park soils, Sci. Total Environ., 424, 88–96, 2012.
Lv, M., Hu, A., Chen, J., and Wan, B.: Evolution, Transport Characteristics, and Potential Source Regions of PM2.5 and O3 Pollution in a Coastal City of China during 2015–2020, Atmosphere, 12, 1282, https://doi.org/10.3390/atmos12101282, 2021.
Middleton, N., Tozer, P., and Tozer, B.: Sand and dust storms: underrated natural hazards, Disasters, 43, 390–409, https://doi.org/10.1111/disa.12320, 2019.
Miller, M. S., Friedlander, S. K., and Hidy, G. M.: A chemical element balance for the Pasadena aerosol, J. Colloid Interf. Sci., 39, 165–176, https://doi.org/10.1016/0021-9797(72)90152-X, 1972.
Moya, J., Phillips, L., Schuda, L., Wood, P., Diaz, A., Lee, R., Clickner, R., Birch, R., Adjei, N., and Blood, P.: Exposure factors handbook: 2011 edition, U.S. Environmental Protection Agency, https://www.epa.gov/expobox/exposure-factors-handbook-2011-edition (last access: October 2023), 2011.
Naderizadeh, Z., Khademi, H., and Ayoubi, S.: Biomonitoring of atmospheric heavy metals pollution using dust deposited on date palm leaves in southwestern Iran, Atmósfera, 29, 141–155, https://doi.org/10.20937/ATM.2016.29.02.04, 2016.
Parajuli, S. P., Zobeck, T. M., Kocurek, G., Yang, Z. L., and Stenchikov, G. L.: New insights into the wind-dust relationship in sandblasting and direct aerodynamic entrainment from wind tunnel experiments, J. Geophys. Res.-Atmos., 121, 1776–1792, https://doi.org/10.1002/2015jd024424, 2016.
Perlwitz, J. P., Pérez García-Pando, C., and Miller, R. L.: Predicting the mineral composition of dust aerosols – Part 1: Representing key processes, Atmos. Chem. Phys., 15, 11593–11627, https://doi.org/10.5194/acp-15-11593-2015, 2015.
Pongkiatkul, P. and Kim Oanh, N. T.: Assessment of potential long-range transport of particulate air pollution using trajectory modeling and monitoring data, Atmos. Res., 85, 3–17, https://doi.org/10.1016/j.atmosres.2006.10.003, 2007.
Prospero, J. M., Ginoux, P., Torres, O., Nicholson, S. E., and Gill, T. E.: Environmental characterization of global sources of atmospheric soil dust identified with the Nimbus 7 Total Ozone Mapping Spectrometer (TOMS) absorbing aerosol product, Rev. Geophys., 40, 2-1–2-31, 2002.
Samiksha, S., Raman, R. S., Nirmalkar, J., Kumar, S., and Sirvaiya, R.: PM10 and PM2.5 chemical source profiles with optical attenuation and health risk indicators of paved and unpaved road dust in Bhopal, India, Environ. Pollut., 222, 477–485, 2017.
Santos, J. M., Reis, N. C., Galvão, E. S., Silveira, A., Goulart, E. V., and Lima, A. T.: Source apportionment of settleable particles in an impacted urban and industrialized region in Brazil, Environ. Sci. Pollut. R., 24, 22026–22039, 2017.
Shangguan, Y., Zhuang, X., Querol, X., Li, B., Moreno, N., Trechera, P., Sola, P. C., Uzu, G., and Li, J.: Characterization of deposited dust and its respirable fractions in underground coal mines: Implications for oxidative potential-driving species and source apportionment, Int. J. Coal Geol., 258, 104017, https://doi.org/10.1016/j.coal.2022.104017, 2022.
Shao, Y. and Dong, C. H.: A review on East Asian dust storm climate, modelling and monitoring, Global Planet. Change, 52, 1–22, https://doi.org/10.1016/j.gloplacha.2006.02.011, 2006.
Shao, Y. and Raupach, M. R.: Effect of saltation bombardment on the environment of dust by wind, J. Geophys. Res.-Atmos., 98, 12719–12726, https://doi.org/10.1029/93jd00396, 1993.
Shao, Y. P., Raupach, M. R., and Leys, J. F.: A model for predicting aeolian sand drift and dust entrainment on scales from paddock to region, Aust. J. Soil Res., 34, 309–342, https://doi.org/10.1071/sr9960309, 1996.
Shao, Y. P., Klose, M., and Wyrwoll, K. H.: Recent global dust trend and connections to climate forcing, J. Geophys. Res.-Atmos., 118, 11107–11118, https://doi.org/10.1002/jgrd.50836, 2013.
Shi, J., Li, Z., Sun, Z., Han, X., Shi, Z., Xiang, F., and Ning, P.: Specific features of heavy metal pollutant residue in PM2.5 and analysis of their damage level for human health in the urban air of Kunming, J. Saf. Environ., 18, 795–800, 2018.
Simon, H., Beck, L., Bhave, P. V., Divita, F., Hsu, Y., Luecken, D., Mobley, J. D., Pouliot, G. A., Reff, A., and Sarwar, G.: The development and uses of EPA's SPECIATE database, Atmos. Pollut. Res., 1, 196–206, 2010.
Sullivan, R. C., Guazzotti, S. A., Sodeman, D. A., and Prather, K. A.: Direct observations of the atmospheric processing of Asian mineral dust, Atmos. Chem. Phys., 7, 1213–1236, https://doi.org/10.5194/acp-7-1213-2007, 2007.
Sun, R., Wang, H., Ma, X., Chen, Y., Zhao, B., Qin, Y., Zhang, H., and Ye, W.: Aerosol optical properties and formation mechanism of a typical air pollution episode in Shanghai during different weather condition periods, Acta Scientiae Circumstantiae, 37, 814–823, 2017.
Tang, M. J., Cziczo, D. J., and Grassian, V. H.: Interactions of Water with Mineral Dust Aerosol: Water Adsorption, Hygroscopicity, Cloud Condensation, and Ice Nucleation, Chem. Rev., 116, 4205–4259, https://doi.org/10.1021/acs.chemrev.5b00529, 2016.
Textor, C., Schulz, M., Guibert, S., Kinne, S., Balkanski, Y., Bauer, S., Berntsen, T., Berglen, T., Boucher, O., Chin, M., Dentener, F., Diehl, T., Easter, R., Feichter, H., Fillmore, D., Ghan, S., Ginoux, P., Gong, S., Grini, A., Hendricks, J., Horowitz, L., Huang, P., Isaksen, I., Iversen, I., Kloster, S., Koch, D., Kirkevåg, A., Kristjansson, J. E., Krol, M., Lauer, A., Lamarque, J. F., Liu, X., Montanaro, V., Myhre, G., Penner, J., Pitari, G., Reddy, S., Seland, Ø., Stier, P., Takemura, T., and Tie, X.: Analysis and quantification of the diversities of aerosol life cycles within AeroCom, Atmos. Chem. Phys., 6, 1777–1813, https://doi.org/10.5194/acp-6-1777-2006, 2006.
Urrutia-Pereira, M., Rizzo, L. V., Staffeld, P. L., Chong-Neto, H. J., Viegi, G., and Sole, D.: Dust from the Sahara to the American Continent: Health impacts, Allergol. Immunopath., 49, 187–194, https://doi.org/10.15586/aei.v49i4.436, 2021.
U.S. Department of Energy (U.S. DoE): The risk assessment information system (RAIS), U.S. Department of Energy's Oak Ridge Operations Office (ORO), Argonne, IL, https://rais.ornl.gov/ (last access: October 2023), 2011.
U.S. Environmental Protection Agency (U.S. EPA): Risk assessment guidance for superfund. Volume I: human health evaluation manual (part a), Office of Emergency and Remedial Response, U.S. Environmental Protection Agency, EPA/540/1-89/002, 1989.
Wang, L., Li, H., Zhang, W., Qi, J., Tian, H., Huang, K., Chen, D., and Guo, J.: Regional Pollution Characteristics of Heavy Metals in PM2.5, Research of Environmental Sciences, 34, 849–862, 2021.
Wu, F., Cheng, Y., Hu, T., Song, N., Zhang, F., Shi, Z., Hang Ho, S. S., Cao, J., and Zhang, D.: Saltation–Sandblasting Processes Driving Enrichment of Water-Soluble Salts in Mineral Dust, Environ. Sci. Technol. Lett., 9, 921–928, https://doi.org/10.1021/acs.estlett.2c00652, 2022.
Xia, Z., Fan, X., Huang, Z., Liu, Y., Yin, X., Ye, X., and Zheng, J.: Comparison of Domestic and Foreign PM2.5 Source Profiles and Influence on Air Quality Simulation, Research of Environmental Sciences, 30, 359–367, 2017.
Yang, Y. Q., Hou, Q., Zhou, C. H., Liu, H. L., Wang, Y. Q., and Niu, T.: Sand/dust storm processes in Northeast Asia and associated large-scale circulations, Atmos. Chem. Phys., 8, 25–33, https://doi.org/10.5194/acp-8-25-2008, 2008.
Ying, Q., Feng, M., Song, D., Wu, L., Hu, J., Zhang, H., Kleeman, M. J., and Li, X.: Improve regional distribution and source apportionment of PM2.5 trace elements in China using inventory-observation constrained emission factors, Sci. Total Environ., 624, 355–365, 2018.
Zhang, H. R. and Tripathi, N. K.: Geospatial hot spot analysis of lung cancer patients correlated to fine particulate matter (PM2.5) and industrial wind in Eastern Thailand, J. Clean. Prod., 170, 407–424, https://doi.org/10.1016/j.jclepro.2017.09.185, 2018.
Zhuang, G. S., Guo, J. H., Yuan, H., and Zhao, C. Y.: The compositions, sources, and size distribution of the dust storm from China in spring of 2000 and its impact on the global environment, Chinese Sci. Bull., 46, 895–901, https://doi.org/10.1007/bf02900460, 2001.