the Creative Commons Attribution 4.0 License.
the Creative Commons Attribution 4.0 License.
 | 13 Oct 2023
Characterization of the nitrogen stable isotope composition (δ15N) of ship-emitted NOx
Zeyu Sun
Zheng Zong
Yang Tan
Chongguo Tian
Fan Zhang
Rong Sun
Yingjun Chen
Gan Zhang
The nitrogen stable isotope composition (δ15N) of nitrogen oxides (NOx) is a powerful indicator of source apportionment of atmospheric NOx; however, δ15N–NOx values emitted from ships have not been reported, affecting the accuracy of source partitioning of atmospheric NOx in coastal zones with a lot of vessel activity. In addition, δ15N–NOx values from ship emissions could also be important for source apportionment of atmospheric nitrogen deposition in remote ocean regions. This study systemically analysed the δ15N–NOx variability and main influencing factors of ship emissions. The results showed that δ15N–NOx values from ships, which were calculated by weighting the emission values from the main engine and auxiliary engine of the vessel, ranged from −35.8 ‰ to 2.04 ‰ with a mean ± standard deviation of −18.5 ± 10.9 ‰. The δ15N–NOx values increased monotonically with the ongoing tightening of emission regulations, presenting a significantly negative logarithmic relationship with NOx concentrations (p<0.01). The selective catalytic reduction (SCR) system was the most important factor affecting changes in δ15N–NOx values, followed by the ship category, fuel types, and operation states of ships. Based on the relationship between δ15N–NOx values and emission regulations observed in this investigation, a mass-weighted model to compute accurate assessments over time was developed, and the temporal variation in δ15N–NOx values from ship emissions in the international merchant fleet was evaluated. These simulated δ15N–NOx values can be used to select suitable δ15N–NOx values for a more accurate assessment, including the contribution of ship-emitted exhaust to atmospheric NOx and its influence on atmospheric nitrate (NO air quality and nitrogen deposition studies.
- Article
(1400 KB) - Full-text XML
-
Supplement
(1042 KB) - BibTeX
- EndNote


Due to its detrimental impact on the environment, ecology, and public health, anthropogenic emissions of nitrogen oxides (NOx), including nitric oxide (NO) and nitrogen dioxide (NO2), have drawn considerable attention in recent decades. Transportation exhaust (motor vehicles and ships) tends to overtake coal combustion as the most important source of NOx emissions in anthropogenic activities (Zhang et al., 2020; Jin et al., 2021; Shi et al., 2021), contributing 48 % of total emissions at a global scale in 2014 (Huang et al., 2017). Air pollution from navigation has become a growing concern in maritime regions, with increasing demand for global and regional trade activities (Johansson et al., 2017; Nunes et al., 2017). To illustrate this, the NOx emissions from ships in China, a major maritime trading country, have reached 130–220 kt, accounting for approximately 34 % of national motor vehicle NOx emissions (Fu et al., 2017). International organizations and national governments have developed a series of regulations on marine traffic activities, prescribing limits for NOx emissions. For instance, the International Convention for the Prevention of Pollution from Ships (MARPOL) implemented by the International Maritime Organization (IMO) is a momentous international treaty concerning the avoidance of pollution generated by vessels during operations or from unexpected causes. To mitigate the negative effects of navigation on the environment, the IMO set stringent NOx emission regulations with a decrease of 16 %–22 % and 80 % in 2011 (Tier II) and 2016 (Tier III), respectively, in comparison with the year 2000 (Tier I) through MARPOL Annex VI (https://dieselnet.com/standards/inter/imo.php#other, last access: 18 March 2023). While improving the quality of marine fuel, solutions for marine diesel engines that reduce emissions, mainly including exhaust after-treatment systems, pre-combustion control techniques, and fuel optimizations, are rapidly developing and are being applied to newly built ships for future, stricter requirements of NOx pollution abatement (Deng et al., 2021; Selleri et al., 2021). In addition, statistics reveal that the world merchant fleet has ships of 2.184 billion deadweight tonnage (DWT) with an average age of 11.8 years in 2021, compared with 797 million DWT with an average age of 18.8 years in 2001 (Wei et al., 2022; Yang and Zhou, 2002). The current world merchant fleet thus comprises more newly built vessels that have benefited from the implementation of emission reduction technologies. The rapid development of the shipping industry indicates that emission factors (EFs) of NOx from ships are changing significantly.
The EF of a ship refers to the parameter that measures the rate or proportion of pollutants generated by the ship during its operation, usually expressed in grams per kilowatt-hour (g (KWh)−1). The gram per kilowatt-hour value indicates the number of pollutants emitted per kilowatt-hour of energy consumed. A lower EF value indicates lower emissions of pollutants per unit of energy consumed, indicating a cleaner and more environmentally friendly combustion process. Emission factors are important basic data for compiling emission inventories, for which adequate and reliable information is crucial to work effectively in controlling emissions and associated health impacts for policy makers. Early assessment, not providing high-precision spatiotemporal variability in ship emissions because of limited data availability, showed that about 70 % of ship emissions occurred within 400 km of the coast based on emission factors and proxies highly pertinent to ship activities (e.g. fuel usage, port throughput, and seaborne trade) (Corbett and Fischbeck, 1997). A recent evaluation suggested that 60 % of total emissions happened within 20 nautical miles (nmi) of the coast on the basis of emission factors and historic ship traffic activities by detailed automatic identification system (AIS) data, which are able to provide a ship emission inventory with high spatiotemporal resolution (Liu et al., 2016). Simulations of atmospheric air quality models further revealed that the intensive emissions from ships within 12 nmi from the coastline were the primary contributor to ship-related NOx, accounting for approximately 70 % of the total emissions (Wang et al., 2018). These studies of ship emissions and their environmental impacts indicate that the effect of ship emissions on air quality in offshore zones is becoming increasingly significant. Thus, it is critical to estimate ship-emitted NOx and their impact as precisely and thoroughly as feasible. Due to the variation in NOx emission factors from ships, additional methods independent of the emission factors are necessary to evaluate the impact of ship emissions.
NOx released into the atmosphere principally oxidizes to nitrate (NO and nitric acid (HNO3), and their nitrogen stable isotope composition (δ15N, i.e. 15N/14N, expressed in ‰) is a powerful method to apportion NOx sources due to the significant differences in δ15N values of NOx (δ15N–NOx) from different sources (Walters et al., 2015a, b; Zong et al., 2020a). In recent years, δ15N values of NO (δ15N–NO in the atmosphere have been proverbially adopted in tracing sources of atmospheric NOx based on Bayesian models and δ15N–NOx values characterized for various sources (Song et al., 2019; Zong et al., 2020b, 2017). The considered sources were mainly coal combustion, vehicle exhaust, biomass burning, and biological soil emissions (Luo et al., 2019; Song et al., 2020, 2019; Zong et al., 2020b; Zhu et al., 2021; Yin et al., 2022). However, ship emissions were not considered because δ15N–NOx values emitted from ships have not been reported so far. The lack of δ15N–NOx values from ships affects the accuracy of atmospheric NOx source apportionment based on δ15N signals in offshore areas, especially in some ports with frequent ship activities. To address the lack of δ15N–NOx measurements associated with ship emissions, this study systemically collected NOx discharged by ships to analyse the variation in δ15N–NOx values and their possible influencing factors. Furthermore, based on the δ15N–NOx values in our findings, the temporal variation in δ15N–NOx values from ship emissions in the international merchant fleet was evaluated by developing a mass-weighted model. These insights have implications for assessing changes in δ15N–NOx values of ship emissions and its potential applications in source apportionment.
2.1 Sampling campaign
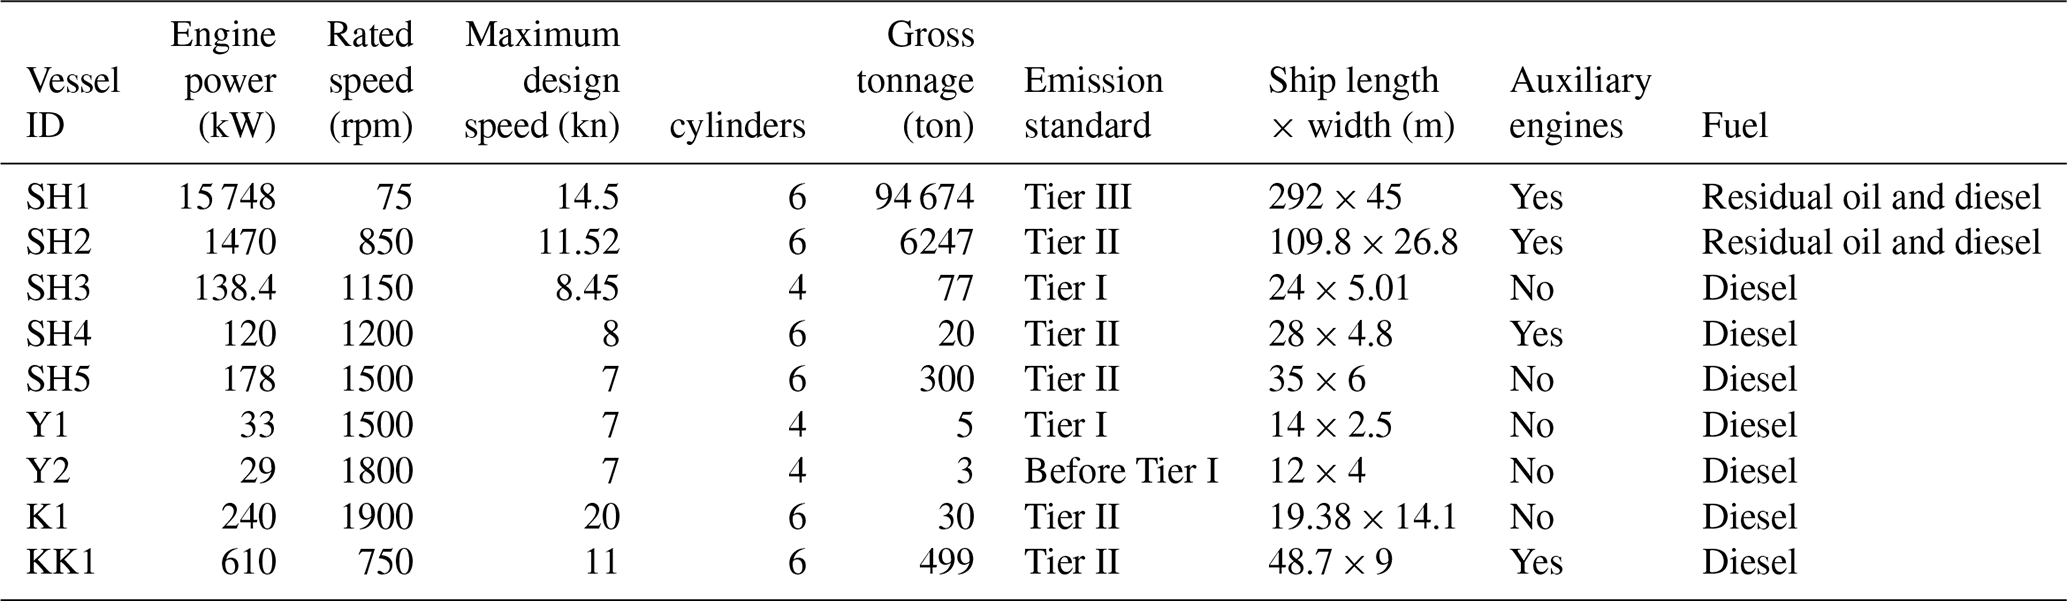
NOx samples were collected from four types of ships between January 2020 and April 2021. These ships included five cargo ships (SH1–SH5), two fishing boats (Y1, Y2), one passenger ship (K1), and one research ship (KK1). The number of ships per category applied for NOx sample collection was determined based on previous reports that cargo ships accounted for more than 50 % of all NOx emissions from ships in China in 2014 and the fuel consumed by fishing boats accounted for 40 % of all ship fuel use in China in 2011 (Chen et al., 2017; Zhang et al., 2018; Zong et al., 2017). The technical parameters of ships utilized for sample collection are listed in Table 1. Under different operating conditions, ships have different speeds and loads, and factors such as the fuel consumption rate, the combustion temperature, and time will change, which in turn affects the emission of NOx from ships (Liu et al., 2022). NOx samples were collected under actual operating conditions of ships, and actual ship speed was monitored by the global positioning system (GPS) equipped on board. Samples were grouped based on three operating modes on the basis of the actual speed of each ship: cruising mode (> 8 kn, ship operating at a higher speed), manoeuvering mode (1–8 kn, ship operating at a lower speed when approaching berths or anchorages), and hotelling mode (< 1 kn, ship at berth or anchored) (Chen et al., 2016). Meteorological conditions primarily affect ship emissions by influencing the operational mode of the ship, and this impact is relatively small and difficult to quantify (Huang et al., 2018; Duan et al., 2022; Zhao et al., 2020). Considering the unpredictable weather circumstances, we attempted to pick calm weather (with zephyrs and gentle waves) and appropriate temperature to carry out ship experiments. As presented in Table S1 of the Supplement, the temperature, wind speed, and relative humidity ranged from 1 to 27 ∘C, from 2.8 to 5.1 m s−1, and from 49 % to 68 % during the observation period, respectively, which were obtained from the local weather station established by the China Meteorological Administration (Wang et al., 2019). Consequently, similar to some previous research regarding NOx emitted from ships (Wang et al., 2019; Jiang et al., 2019; Zhang et al., 2018; Zhao et al., 2020), the influence of meteorological conditions during sampling was not taken into account in this study.
A total of 146 NOx samples were collected in the present study. These NOx samples were collected directly from the chimneys of ships to better reflect the initial condition of the emitted NOx. NOx exhaust from the main engines (MEs) of ships was collected. If the ship also had auxiliary engines (AEs) and boilers, NOx emitted from AEs were also collected, but boilers were not sampled since these make a small contribution to NOx emissions, less than 5 % compared to those from MEs and AEs (Wan et al., 2020; Shi et al., 2020; Chen et al., 2017). The setup of the onboard sampling device is illustrated in Fig. S1 of the Supplement. Before the ship emission test, a stainless steel bellow with a length of 1.5 or 3.0 m and an inner diameter of 40 mm was placed into the ship's chimney to direct the exhaust gas to the sampling platform. The exhaust gas was pumped at a flow rate of 1.0 L min−1 into a gas-washing bottle containing 100 mL of 0.25 mol L−1 potassium permanganate (KMnO4) and 0.50 mol L−1 sodium hydroxide (NaOH) absorption solution through a Teflon tube (approximately 1.5 m in length and 12.77 mm inner diameter), and NOx was collected as NO. Particulates and HNO3 in the exhaust were removed when passing through a microporous filter and a Nylasorb filter, respectively, before entering the gas-washing bottle. The method proved to be effective at collecting 100 % (±5 %, 1σ) of the NOx and producing consistent isotope results under a wide variety of conditions (Fibiger et al., 2014; Zong et al., 2020a). Each sample was collected continuously for 20 min after 5 min of stable operation in each operating mode of the ship. An adequate sampling time is essential to ensure that a sufficient amount of NO was collected for conducting δ15N measurement and minimizing uncertainties associated with isotope blank correction.
The whole sampling process was conducted carefully to avoid interference with isotopic measurements caused by NHx, containing ammonia (NH3) and ammonium (NH, and isotopic fractionation. The absorption solution prepared beforehand within 12 h before sampling was completely sealed before and after each collection and was titrated within 6 h after sampling to remove redundant KMnO4 from the solution using 30 % hydrogen peroxide (H2O2) (Zong et al., 2020a). Fibiger et al. (2014) and Margeson et al. (1984) found that the chemical conversion of NH3 to NO can lead to a 0.6 % or 2.8 % increase in the NO concentration when KMnO4 was not removed from the absorption solution for 36 h or 7 d, respectively. The fast removal of KMnO4 from the solution in the present study indicates that the experimental error regarding NHx was negligible. The total length of the connecting pipe (stainless steel bellows and Teflon tubes) from the ship chimneys to the gas-washing bottles was about 2 or 4 m for different ships, and NOx was accordingly present in the pipe for less than 4 min, which was significantly shorter than the normal airborne NO lifespan (∼ 15216.3 s), meaning that fractional distillation could be ignored (Massman, 1998). Penetration tests for NOx collection were performed on each vessel by connecting two gas-washing bottles in series with the same absorbent solution over a sampling period of 30 min. There was no experimental evidence of NOx penetration into the second bottle, denoting that the approach used in this study effectively collected all of the NOx emissions from the sampled ship exhaust. Additionally, samples for the background blank were collected during the sampling period of each ship (3 samples per ship, totalling 45 samples) to quantify background NO concentrations and to correct for isotope blanks.
2.2 Chemical and isotopic analysis
The NO concentration in the samples, where redundant KMnO4 was removed, was quantified by standard colorimetric absorbance techniques (AutoAnalyzer 3, SEAL Analytical Ltd.), and the detection limit was 5 ng mL−1. The bacterial denitrifier method was then conducted for δ15N–NO analysis with the injection volume of samples calculated by the NO concentration (Sigman et al., 2001; Mcilvin and Casciotti, 2011). In short, the collected NO solution containing 20 nmol N was put into the 20 mL headspace bottle, and then 2 mL concentrated bacterial solution (helium-purged at 30 mL min−1 for 4 h to alleviate the background interference) was added to convert NO to nitrous oxide (N2O). P. aureofaciens was selected as the experimental strain, which lacks the N2O reductase enzyme. After it was sealed and reacted for 12 h, 0.1 mL 10 mol L−1 NaOH was injected to terminate the denitrification process. Finally, the δ15N of the produced N2O was analysed by an isotope ratio mass spectrometer (MAT 253, Thermo Fisher Scientific, Waltham, MA), and the δ15N values were reported in parts per thousand relative to international standards (IAEA–NO–3, USGS32, USGS34, and USGS35) (Bohlke et al., 2003):
The average NO concentration of the background blank samples from each ship was 45.33–682.50 µg N L−1, accounting for 1.15 ± 2.02 % of that for the regular samples. This includes the background value of NO in the absorption solution and the NO converted from NOx captured from ambient air during the collection time of 20 min. Therefore, the final NO concentrations for samples from each vessel were recalculated by subtracting the average blank value during sampling. The average δ15N values related to the background blank for each ship ranged from −3.02 ‰ to 11.34 ‰, and the δ15N value for each sample was redetermined by mass balance (Fibiger et al., 2014), leading to an average variation in δ15N values ranging from 1.12 % to 4.87 %:
where δ15Ntotal and δ15Nblank are the δ15N values (%) of the samples and blanks of the ship, respectively, and [NO]total and [NO]blank are the NO concentrations (µg N L−1) of the samples and blanks of the ship, respectively. The analytical precision of NO concentrations and δ15N values were less than 1.8 % and 0.5 ‰, respectively, as determined by the replicates in this study.
2.3 Data analysis
Considering the high power and load, MEs of ships are the main NOx source, and emissions vary greatly between operating conditions. AEs drive other power machinery on board besides MEs, such as generators, oil splitters, marine pumps, and air conditioning units, and the output power usually varies with the ME power during navigation. Hence the AE to ME power ratio (typically 0.22) was used to estimate the rated power of AEs (Chen et al., 2017; Trozzi, 2010). Since a ship's ME and AE work simultaneously most times, the emission powers of the two were used for weighted calculations, and thus the actual δ15N–NOx values emitted by ships under each operating condition could be obtained as follows:
where δ15NAE and δ15NME are the δ15N–NOx values (%) emitted by the AE and ME of the ship, respectively, and LF (%) is the load factor of the ME under different operating conditions of the ship and can be calculated from the actual sailing speed (AS, knots) and the maximum design speed (MS, knots) of the ship (Chen et al., 2017):
It was capped to 1.0 in the case of the calculated value exceeding 100 %. Details on the NOx emissions of the collected ship exhaust after integration of the ME and AE are shown in Table S2 of the Supplement.
Among the statistical analysis methods, the analysis of variance (ANOVA) and the Mann–Whitney U test were applied to support the factors influencing δ15N–NOx values from ships and to further compare whether there was a significant discrepancy between different classifications under the influence factor, respectively. ANOVA is a statistical method used to compare the means of two or more groups to determine if there is a significant difference. The core idea of ANOVA is to compare the differences between groups to the differences within groups. It calculates the ratio of between-group variation to within-group variation, known as the F value, and then compares this F value with the F critical value corresponding to the given significance level to determine if the mean differences are statistically significant. The Mann–Whitney U test is widely used in various fields for evaluating differences between two groups by comparing whether the medians of two samples are the same (Mann and Whitney, 1947). The Mann–Whitney U test typically reports a p value, which represents the probability of observing the current test statistic or a more extreme test statistic under the same null hypothesis conditions. If the p value is less than the significance level, the null hypothesis that the medians of the two samples are the same can be rejected.
The conditional inference tree (CIT), random forest (RF), and boosted regression tree (BRT) were implemented to quantitatively evaluate the impact degree of different factors on the variation in ship-emitted δ15N–NOx values. A total of 75 % of the sample data were utilized to generate the prediction model, and the remaining data were utilized to evaluate the accuracy of the simulation results of the prediction model. The CIT is a non-parametric decision tree algorithm that recursively binary splits the dependent variable based on the values of correlations. It can handle features with different scales and selects features in an unbiased manner, as the feature and the best split point are determined after the feature selection (Hothorn et al., 2006). RF is an ensemble of regression trees originally used for classification. It evaluates the importance of candidate predictor variables by measuring the variance reduction in predictive accuracy before and after permuting the variables and combines the predictions of multiple trees to improve the overall model performance (Strobl et al., 2007; Speybroeck, 2012). The BRT combines the strengths of regression trees and boosting, which is an adaptive method that combines many simple models to improve predictive performance (Elith et al., 2008). In the operation process, BRT randomly selects a subset of data multiple times to analyse the impact of predictor variables on the dependent variable and uses the remaining data to validate the fitting results. The output is the average of the generated regression trees. BRT is tolerant to covariance among predictors and non-normality, and it is less prone to overfitting, thus providing higher predictive accuracy for new data. These statistical analysis methods were conducted by R 4.1.3 software.
3.1 δ15N–NOx values emitted from ships
As illustrated in Fig. 1, the δ15N–NOx values emitted from ships sampled in this study were in the range of −35.8 ‰ to 2.04 ‰, with a mean ± standard deviation of −18.5 ± 10.9 ‰. There can be large variation in δ15N–NOx values emitted from the same vessel under the same operating condition as shown in Table S2, which was often observed during the hotelling and cruising modes. This could be attributed to changes in the usage requirements of different onboard equipment in hotelling mode, as well as the differences in engine load concerning the substantial variations in vessel speed during cruising mode (Cooper, 2003; Huang et al., 2018). A more detailed interpretation can be found in Sect. S1 of the Supplement. NOx produced during the combustion of fossil fuels can be divided into two groups: fuel NOx, generated when chemically bound nitrogen in fuel oxidizes, and thermal NOx, which is related to the thermal immobilization of atmospheric nitrogen (N2), i.e. produced by the reaction between oxygen and nitrogen in air at high temperatures (Beyn et al., 2015; Walters et al., 2015b). Previous measurements have revealed that NOx derived from biomass burning and coal combustion is inclined to be enriched in 15N abundance, largely influenced by the nitrogen content of the biomass and coal itself (Felix et al., 2012; Fibiger and Hastings, 2016; Zong et al., 2022), and NOx produced thermally by internal combustion engines tends to be depleted in 15N abundance due to the kinetic isotope effect associated with the thermal decomposition of the strong triple bond of N2 (Ti et al., 2021; Walters et al., 2015a, b; Zong et al., 2020a; Snape et al., 2003). Moreover, it is well known that residual oil such as marine fuel remains after the removal of valuable distillates (such as gasoline) from petroleum, which contains more impurities, including nitrogen-containing substrates, than gasoline and diesel (Corbett and Winebrake, 2008). If the nitrogen-containing substances in the residual oil are the major contributors to the vessel-emitted NOx, it is expected that these NOx emissions may be enriched in 15N abundance (Felix et al., 2012; Fibiger and Hastings, 2016). However, we found that there was no statistically significant difference in δ15N–NOx values emitted from vessels fuelled by residual oil and diesel at the 99 % confidence level (p>0.01), although the former (−14.7 ± 7.72 ‰, n=14) was slightly higher than the latter (−18.9 ± 11.1 ‰, n=109), as indicated in Fig. S2. Therefore, it can be concluded that the δ15N–NOx values emitted from ships do not depend much on the fuel type, and this finding is in agreement with the small proportion (10 %) of NOx originating from fuel-combined nitrogen for engines burning residual oil reported in a previous study (Goldsworthy, 2003). Overall, the negative δ15N–NOx values emitted from ships in this research, with minimal influence from fuels, suggest that these values are more likely associated with the production of thermal NOx rather than the conversion of nitrogen in the fuels (Walters et al., 2015a, b; Zong et al., 2022).
It was found that the majority of the NOx emissions from cars are derived from thermal production (Toof, 1986; Tsague et al., 2006). Figure 1 summarizes the δ15N–NOx values emitted from ships sampled in this study and from vehicles reported in previous studies to assess whether there are significant differences in δ15N values of these thermally generated NOx emissions (Walters et al., 2015a, b). Statistical results showed that the δ15N–NOx values were −12.3 ± 7.21 ‰ (n=51), ‰ (n=158), and −0.100 ± 1.76 ‰ (n=3) for diesel-, gasoline-, and liquefied petroleum gas (LPG)-powered combustion engines, respectively. The δ15N–NOx values from ships (−18.5 ± 10.9 ‰, n=123) were significantly lower than those produced by diesel-, gasoline-, and LPG-powered combustion engines of vehicles at a confidence level of 99 % (p<0.01), as shown in Fig. 1. The significant difference observed highlights the importance of addressing the data gap in measuring δ15N–NOx emissions from ships for accurately apportioning atmospheric NOx sources in coastal zones, especially in some port areas with high ship activity. Further discussion is needed to understand the reasons behind the noticeable difference and to better utilize the measured values of ship-emitted δ15N–NOx, including the variations in δ15N–NOx values and their primary influencing factors.
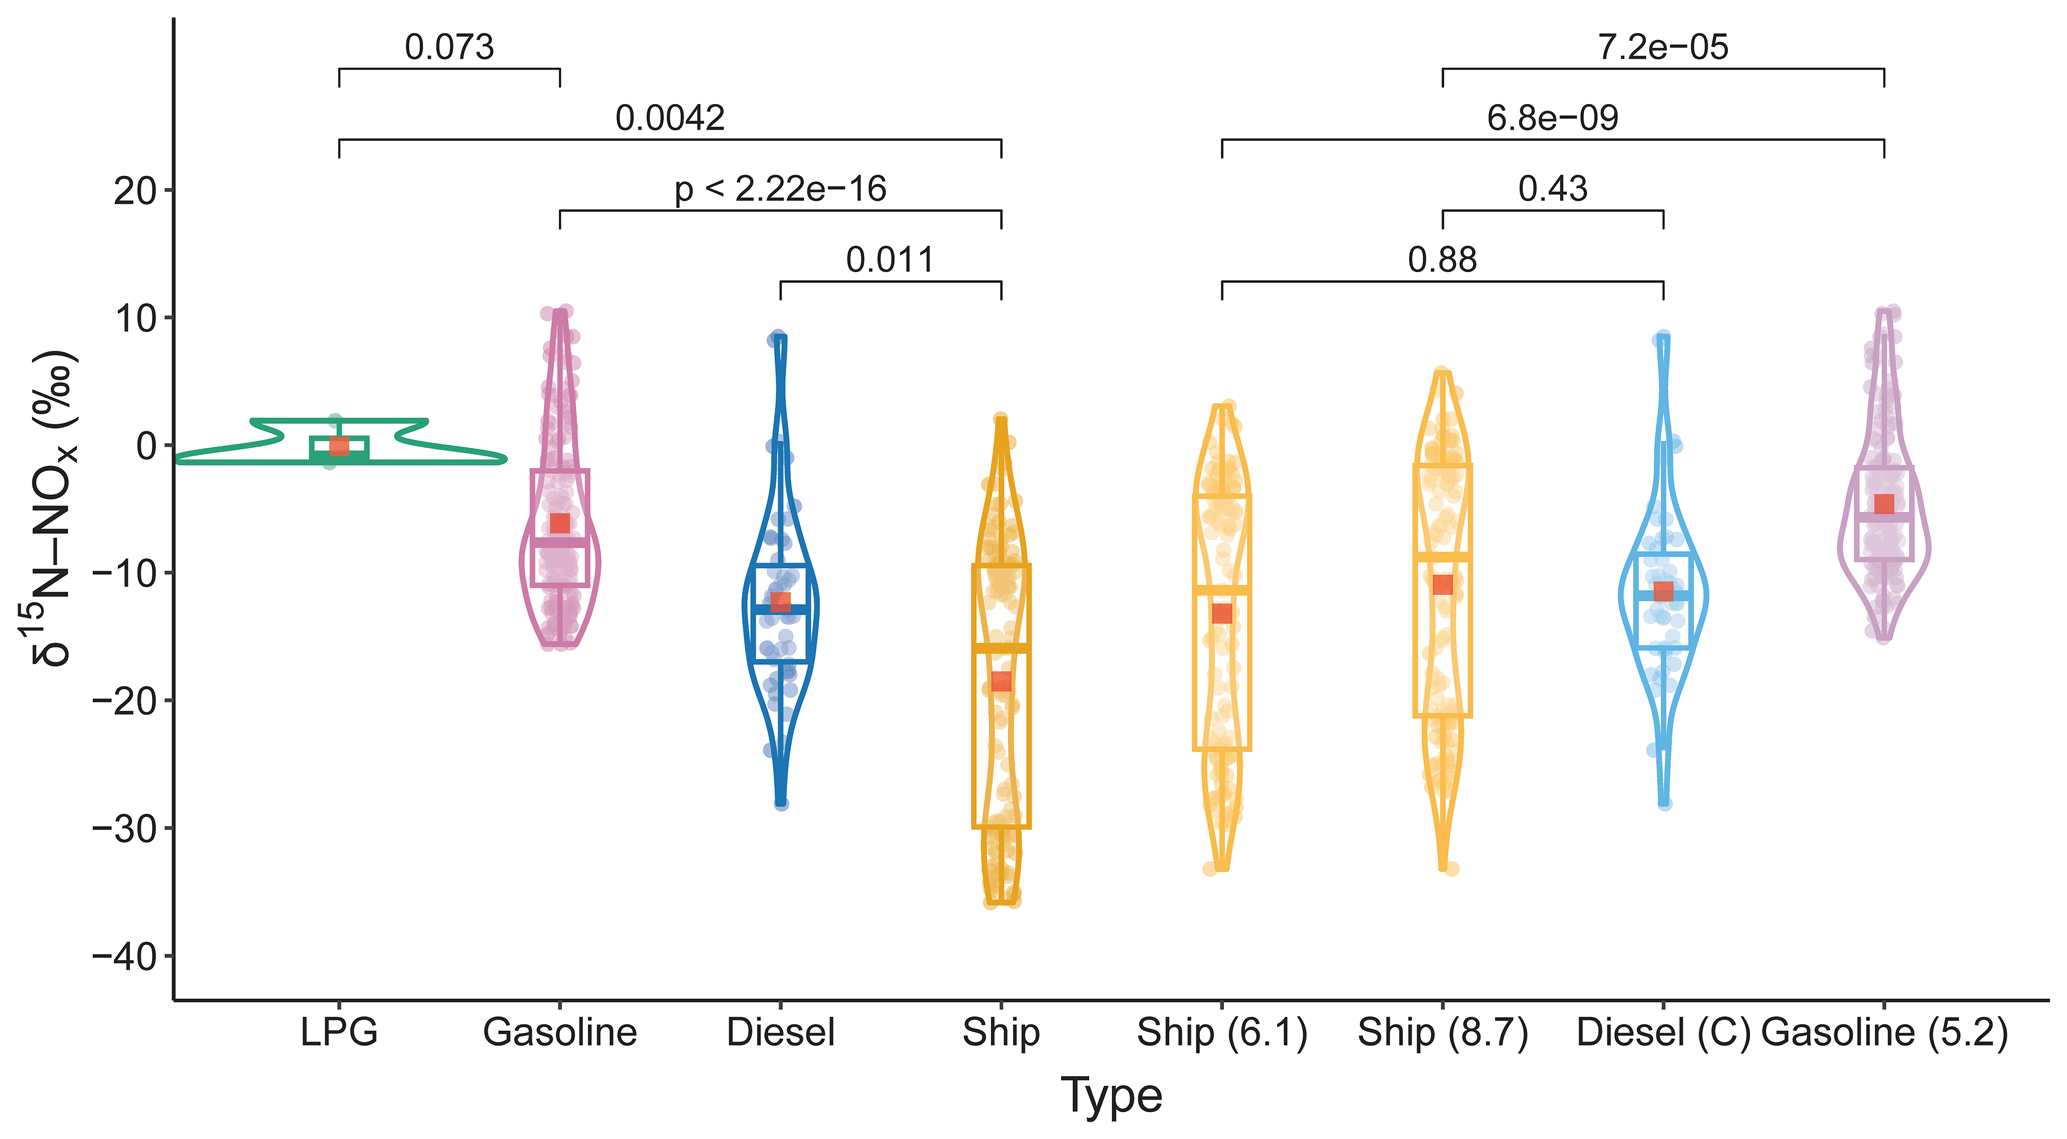
Figure 1δ15N–NOx values emitted from ships in this study and cars fuelled by diesel, gasoline, and liquefied petroleum gas (LPG) reported from other references (Walters et al., 2015a, b). The ship (6.1) and ship (8.7) indicate that δ15N–NOx values from ships without selective catalytic reduction (SCR) systems are corrected by 6.1 ‰ and 8.7 ‰, respectively. The diesel (C) and gasoline (5.2) indicate that δ15N–NOx values from diesel and gasoline cars without SCR systems are corrected using 6.1 ‰ or 8.7 ‰ and 5.2 ‰, respectively. Red square, mean; centre line, median; box bounds, upper and lower quartiles; whiskers, 1.5 times the interquartile range; points, outliers; outer line, data distribution. The p values indicating the distinction between the two groups are shown at the top of the figure. (the Mann–Whitney U test).
3.2 Main factors affecting δ15N–NOx emitted by ships
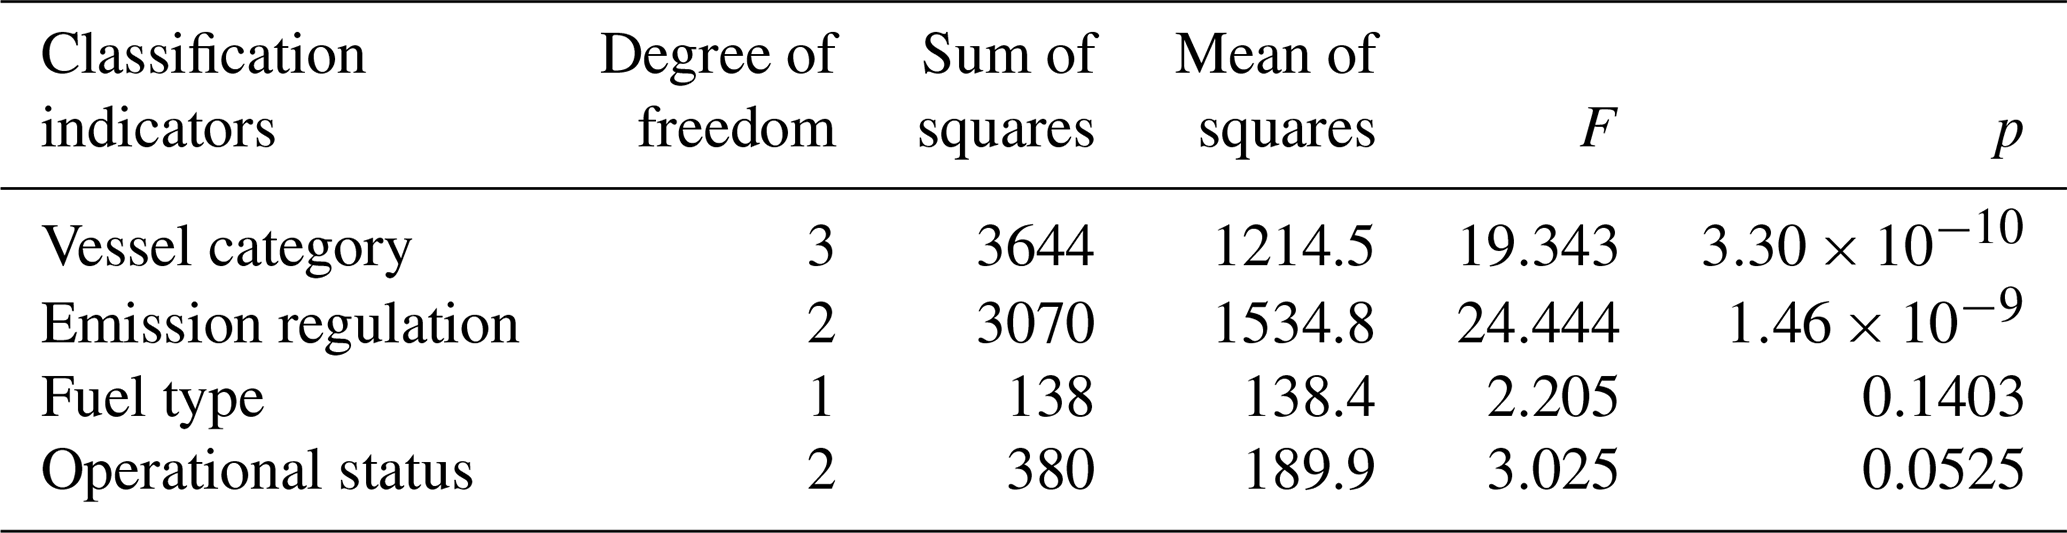
The δ15N–NOx values emitted from ships had a wider range of variation than those emitted from other sources in the source apportionment of NOx, which is not conducive to constraining the sources of NOx in the atmosphere (see Table S3) (Snape et al., 2003; Felix and Elliott, 2014; Li and Wang, 2008; Moore, 1977; Chai et al., 2019; Redling et al., 2013; Zong et al., 2022; Felix et al., 2012; Fibiger and Hastings, 2016; Walters et al., 2015a, b; Yu and Elliott, 2017; Felix and Elliott, 2013; Miller et al., 2018, 2017; Perez et al., 2001; Ammann et al., 1999; Shi et al., 2022; Freyer, 1978; Heaton, 1990). Clarifying the main factors affecting the change in δ15N–NOx is beneficial to narrowing the range of δ15N–NOx changes in source analysis. Several classification indicators including the emission regulation met by ship engines, the ship category, the ship fuel type, and the actual operational status of ships are considered for the assessment in this study. The reason for considering compliance with the emission regulation for ship engines as a criterion is that the IMO emission regulation is the most important measure to restrict NOx emissions from ships, and once each standard was proposed by the IMO, newly constructed or significantly refurbished marine diesel engines had to comply with its requirements. Therefore, the emission regulation that a ship complies with is actually related to its age. Moreover, the category, fuel type, and actual operational status are often used to assess the variation in δ15N–NOx values from vehicles (Walters et al., 2015a, b). The statistics of δ15N–NOx values classified according to the four indicators are illustrated in Figs. S2–S4 and 2. Various analytical methods were adopted to explore the impact of the four indicators on ship emission δ15N–NOx values. The outcomes of ANOVA are shown in Table 2. The p values of δ15N–NOx values grouped by the emission regulation and vessel category from the variance analysis were both less than 0.001, indicating that the two indicators were the dominant factors influencing the variation in ship δ15N–NOx values. Similar significant differences (small p values) in δ15N–NOx values between the types of emission regulations and the different vessel categories were calculated by the Mann–Whitney U test, as displayed in Figs. 2 and S3, respectively.
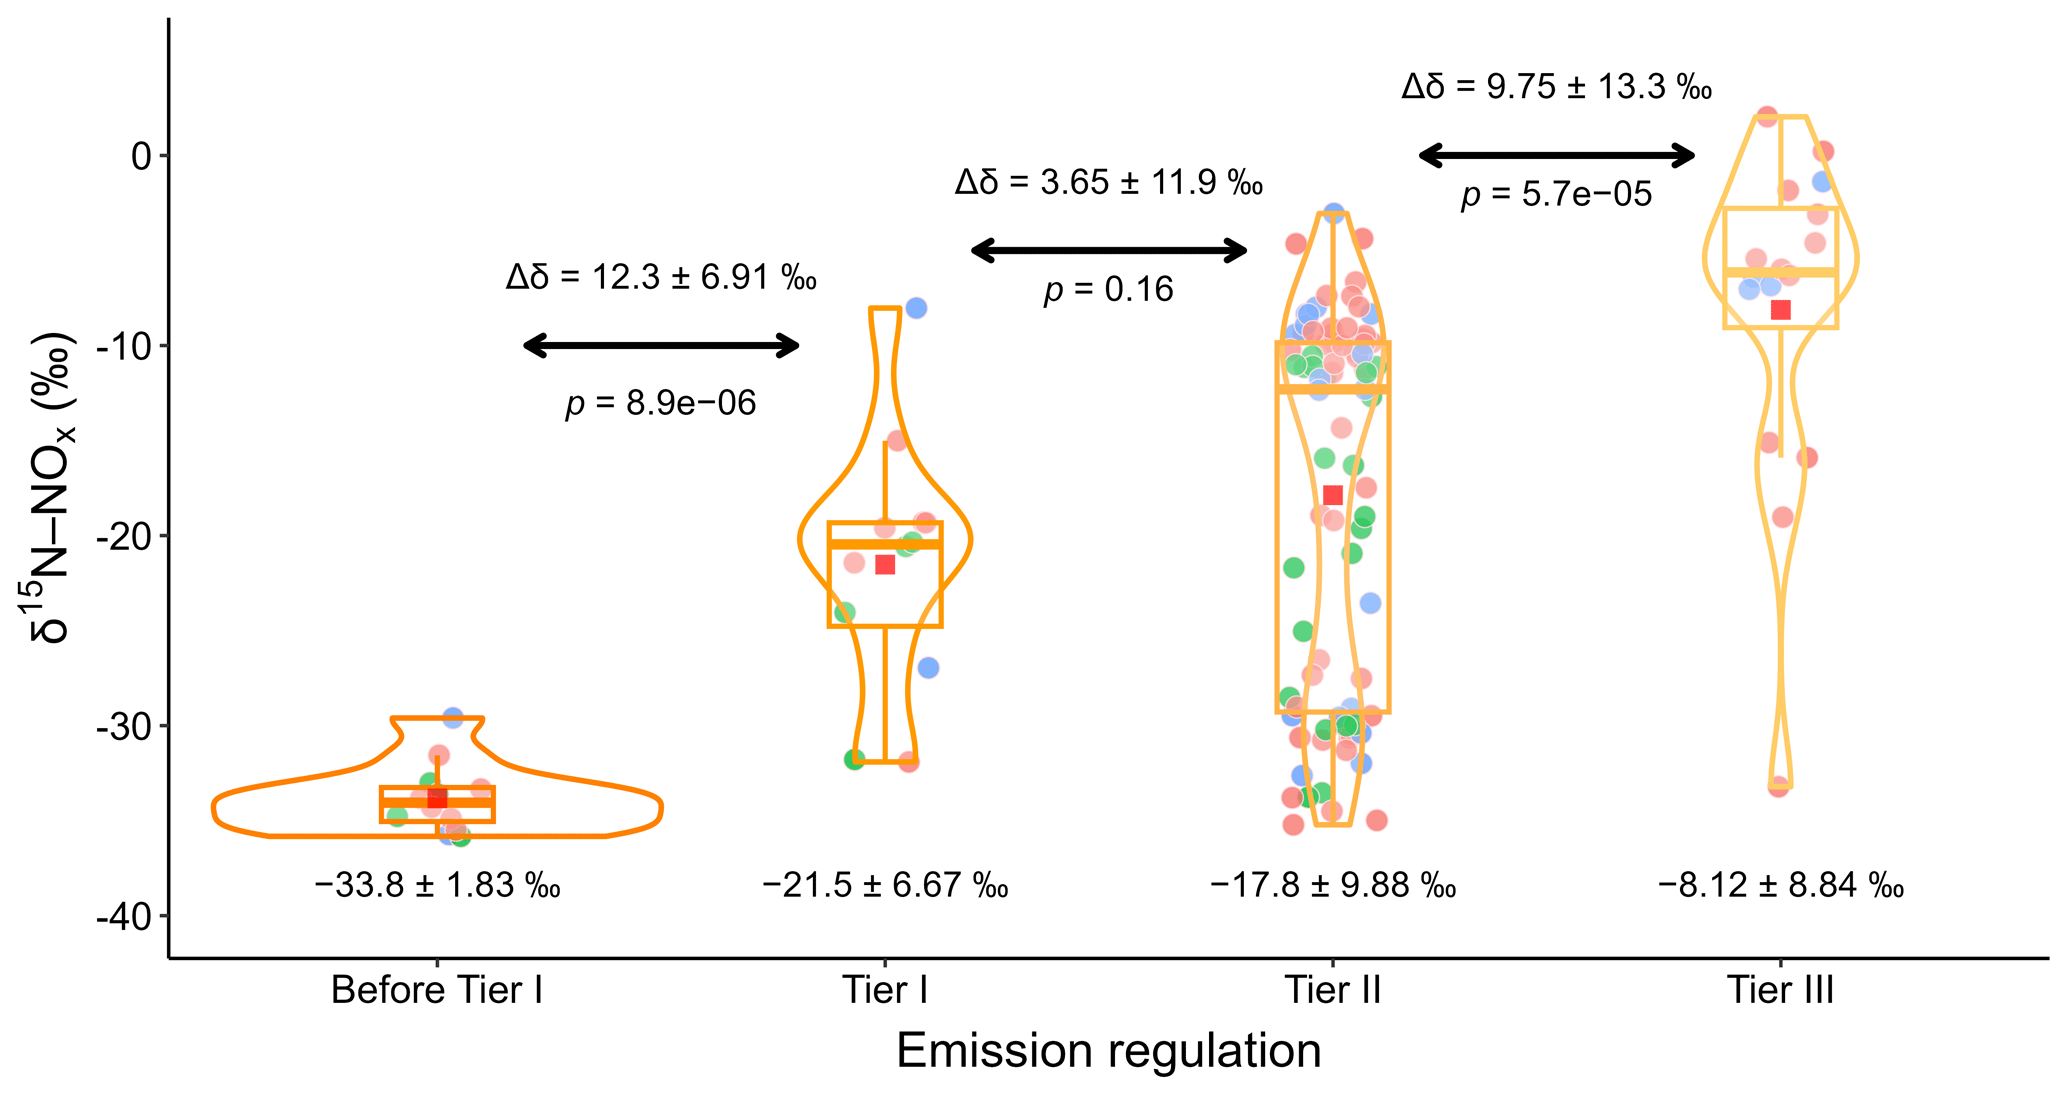
Figure 2δ15N–NOx values emitted from ships under different emission regulations established by the IMO. Red square, mean; centre line, median; box limits, upper and lower quartiles; whiskers, 1.5 times the interquartile range; points, outliers (pink, cruising; green, hotelling; blue, manoeuvering); outer line, distribution of data. The mean ± standard deviation of δ15N–NOx values of each group is marked on the bottom of the panel. The difference and p values indicating the distinction between the two groups are shown at the top of the panel (the Mann–Whitney U test).
The CIT analysis provided a more intuitive result, as indicated in Fig. 3. It was found that the emission regulation met by ships was the most important splitting factor of the root node (node 1) and the second terminal node. Samples collected from ships prior to the implementation of IMO Tier I (stage 1) and ships implementing Tier I–III (stage 2–4) were separated into terminal node 9 (−33.8 ± 1.83 ‰) and node 2 (−16.8 ± 9.50 ‰), respectively, indicating a strong impact of implementing Annex V to the MARPOL 73/78 on these δ15N–NOx values. Then the emission regulation was again used as the next splitting factor to separate δ15N–NOx values emitted from ships meeting Tier III (stage 4) from node 2 as node 3 ( ‰). The δ15N–NOx values emitted from ships meeting Tier I and II (stage 2 and 3) as node 4 (−18.3 ± 9.25 ‰) were subsequently divided by the ship category to node 5 (passenger ship and research ship, −11.3 ± 1.67 ‰) and node 6 (cargo ship and fishing boat, −21.0 ± 9.48 ‰). Finally, fuel type was the last splitting variable, separating samples taken when the ships used diesel (node 7, −22.7 ± 9.25 ‰) and residual oil (node 8, −11.2 ± 1.38 ‰) as fuel. The splitting process suggests that the emission regulation has a greater influence on δ15N–NOx values than the ship category. Analogously, the results of the RF and BRT methods elucidated that the most important influencing factor on δ15N–NOx values from ships was emission regulation, followed by ship category, fuel type, and operational status, as shown in Figs. S5 and S6. The relevant parameters for the accuracy assessment of these three decision-tree-based methods are listed in Table S4. The influence of ship category on ship-emitted δ15N–NOx values primarily concerns engine types of different ships, and the minor influence of fuel type is due to the principle of thermally generated NOx by internal combustion engines of ships as mentioned above (Goldsworthy, 2003). The operational condition of ships has the smallest effect on the variation in δ15N–NOx values. More detailed interpretations can be found in Sect. S2.
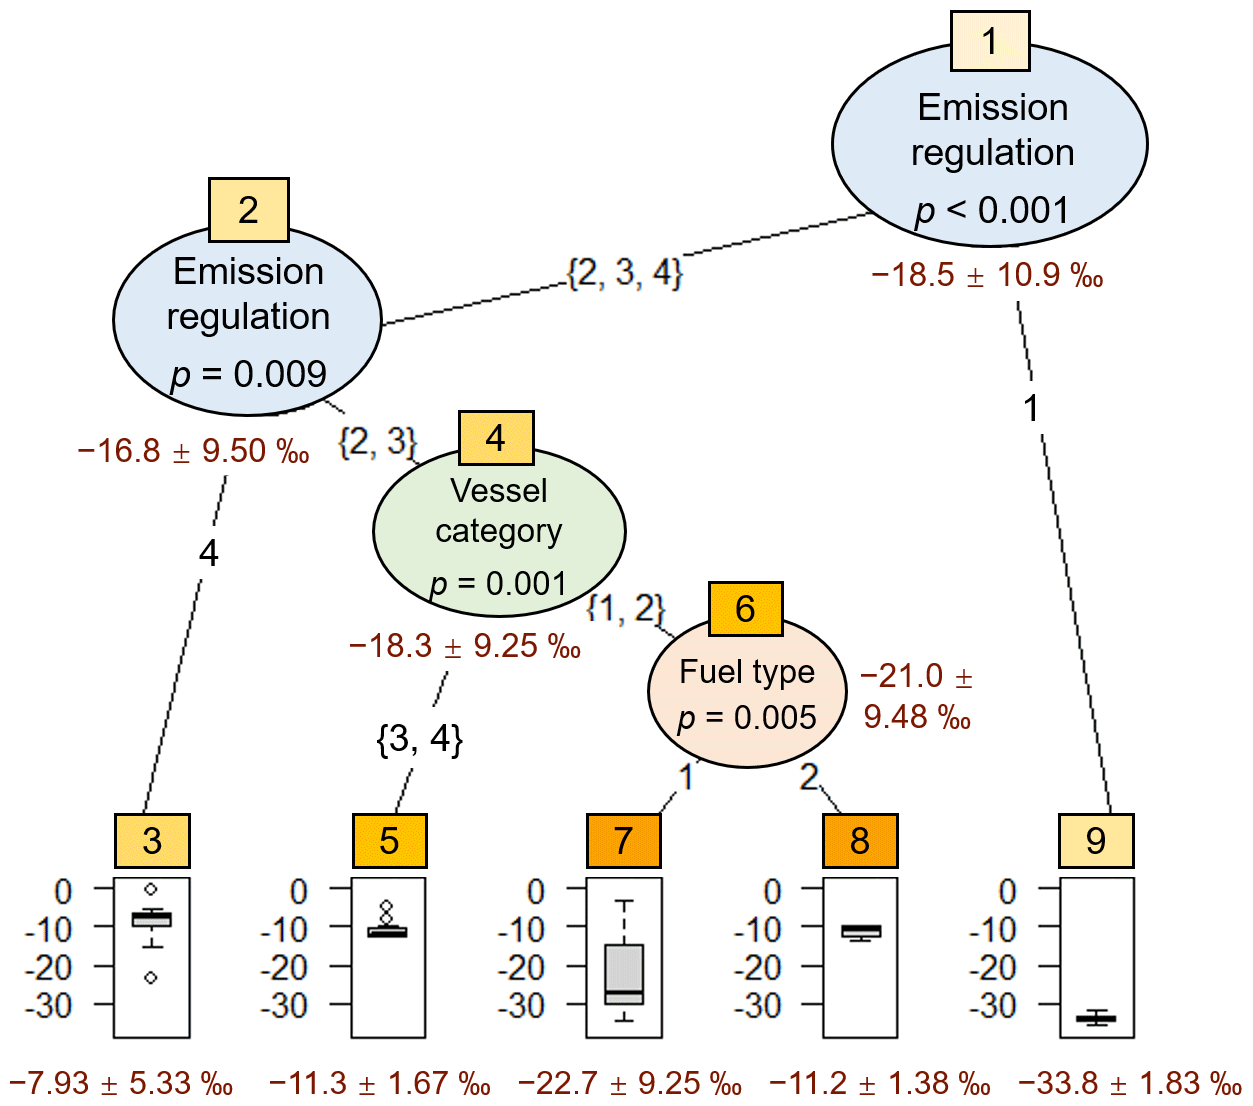
Figure 3Conditional inference trees (CITs) for the δ15N–NOx values emitted from ships. For each inner node, the p values are given, and the range of δ15N–NOx values is displayed for each terminal node.
Figure 2 displays δ15N values in NOx emitted from ships under different emission regulations established by the IMO and more information on ship-emitted NOx at various stages of emission regulations is summarized in Table 3. The mean ± standard deviation of δ15N–NOx values and their 95 % confidence intervals estimated using bootstrapping were −33.8 ± 1.83 ‰ (n=12, −34.8–−32.7 ‰), −21.5 ± 6.67 ‰ (n=12, −25.2–−17.7 ‰), −17.8 ± 9.88 ‰ (n=83, −19.9–−15.4 ‰), and −8.12 ± 8.84 ‰ (n=16, −10.8–−5.64 ‰) for stages 1, 2, 3, and 4, respectively. In general, the δ15N–NOx values progressively increased with the tightening of ship NOx emission standards. This is in accordance with the variation trend of δ15N–NOx values emitted from gasoline vehicles complying with the national vehicle emission standards GB I to GB VI in China, which were established by the Ministry of Ecology and Environment of the People's Republic of China (Zong et al., 2020a). The largest average growth rate of δ15N–NOx values emitted from ships between the three adjacent phases from 1 to 4 occurred between the implementation of IMO Tier II and III (stage 3–4, 54.1 %), followed by before and after the implementation of Tier I (stage 1–2, 36.4 %), and between Tier I and II (stage 2–3, 17.8 %). Since the implementation of IMO Tier I on 1 January 2000, fuel optimization technologies (fuel emulsification, fuel desulfurization, and fuel additives) and pre-combustion control technologies (fuel injection strategy, water injection strategy, Miller cycle, two-stage turbocharging, and dual-fuel combustion strategy), as demonstrated in Table 3, have been applied and have experienced rapid development. The former reduce the production of NOx by changing the composition of fuel or adding additives to improve the combustion process, while the latter primarily suppress the formation of NOx by modifying the internal structure of diesel engines or adjusting parameters (Ampah et al., 2021; Deng et al., 2021; Lion et al., 2020). The average growth rate of δ15N–NOx values between Tier I and Tier II (17.8 %) is lower than that before and after the implementation of Tier I (36.4 %). This difference can be attributed to the fact that different emission standards have varying levels of impact on NOx emission reductions. Compared to the optimization and development of emission reduction technologies between Tier I and II, the implementation of Tier I fills the gap in ship engine and fuel emission reduction measures, which clearly has a greater impact on NOx emissions. The exhaust after-treatment system, including exhaust gas recirculation (EGR), selective catalytic reduction (SCR), non-thermal plasma (NTP), etc., has been widely adopted after the release of IMO Tier III. It offers the best emission reduction results by effectively reducing NOx emissions from marine diesel engines while maintaining engine performance and fuel efficiency. As the most commonly used exhaust after-treatment system, SCR can reduce NOx emissions by more than 90 % without increasing fuel consumption by injecting a urea solution into the exhaust gas and using a catalyst to convert the NOx in the exhaust gas into harmless nitrogen and water. Previous studies have found significant differences in δ15N–NOx emissions from fuel combustion sources with and without SCR systems because lighter molecules of NOx are preferentially decomposed during catalytic reduction, so the produced NOx is inclined to be enriched in 15N abundance because of balanced isotope effects (Felix et al., 2012). Comparably, distinctions were also observed in δ15N–NOx values released by vehicles equipped with three-way catalytic (TWC) converters, which made the δ15N–NOx values from those vehicles reliant on operating circumstances (e.g. cold start or warm start) and NOx mitigation efficiency (Walters et al., 2015a, b). Consequently, the progressive adoption of NOx emission control technologies (e.g. SCR and TWC) is anticipated to bring about a rise in the δ15N–NOx values of NOx emissions associated with fuel combustion, and the magnitude of this increase depends on the NOx fractionation characteristics and the efficiency of NOx reduction associated with the catalytic reduction technology employed (Felix et al., 2012). Accordingly, the δ15N–NOx values from ships equipped with SCR systems, which comply with the Tier III emission standard, were significantly higher than those from ships equipped without SCR systems at the 99 % confidence level (p<0.01) in our study; therefore, the relatively largest difference in δ15N–NOx values between ships implementing Tier II and Tier III, as shown in Fig. 2, is in a great measure derived from the SCR system.
Table 3Summary of ship-emitted NOx at each stage of the emission regulations.
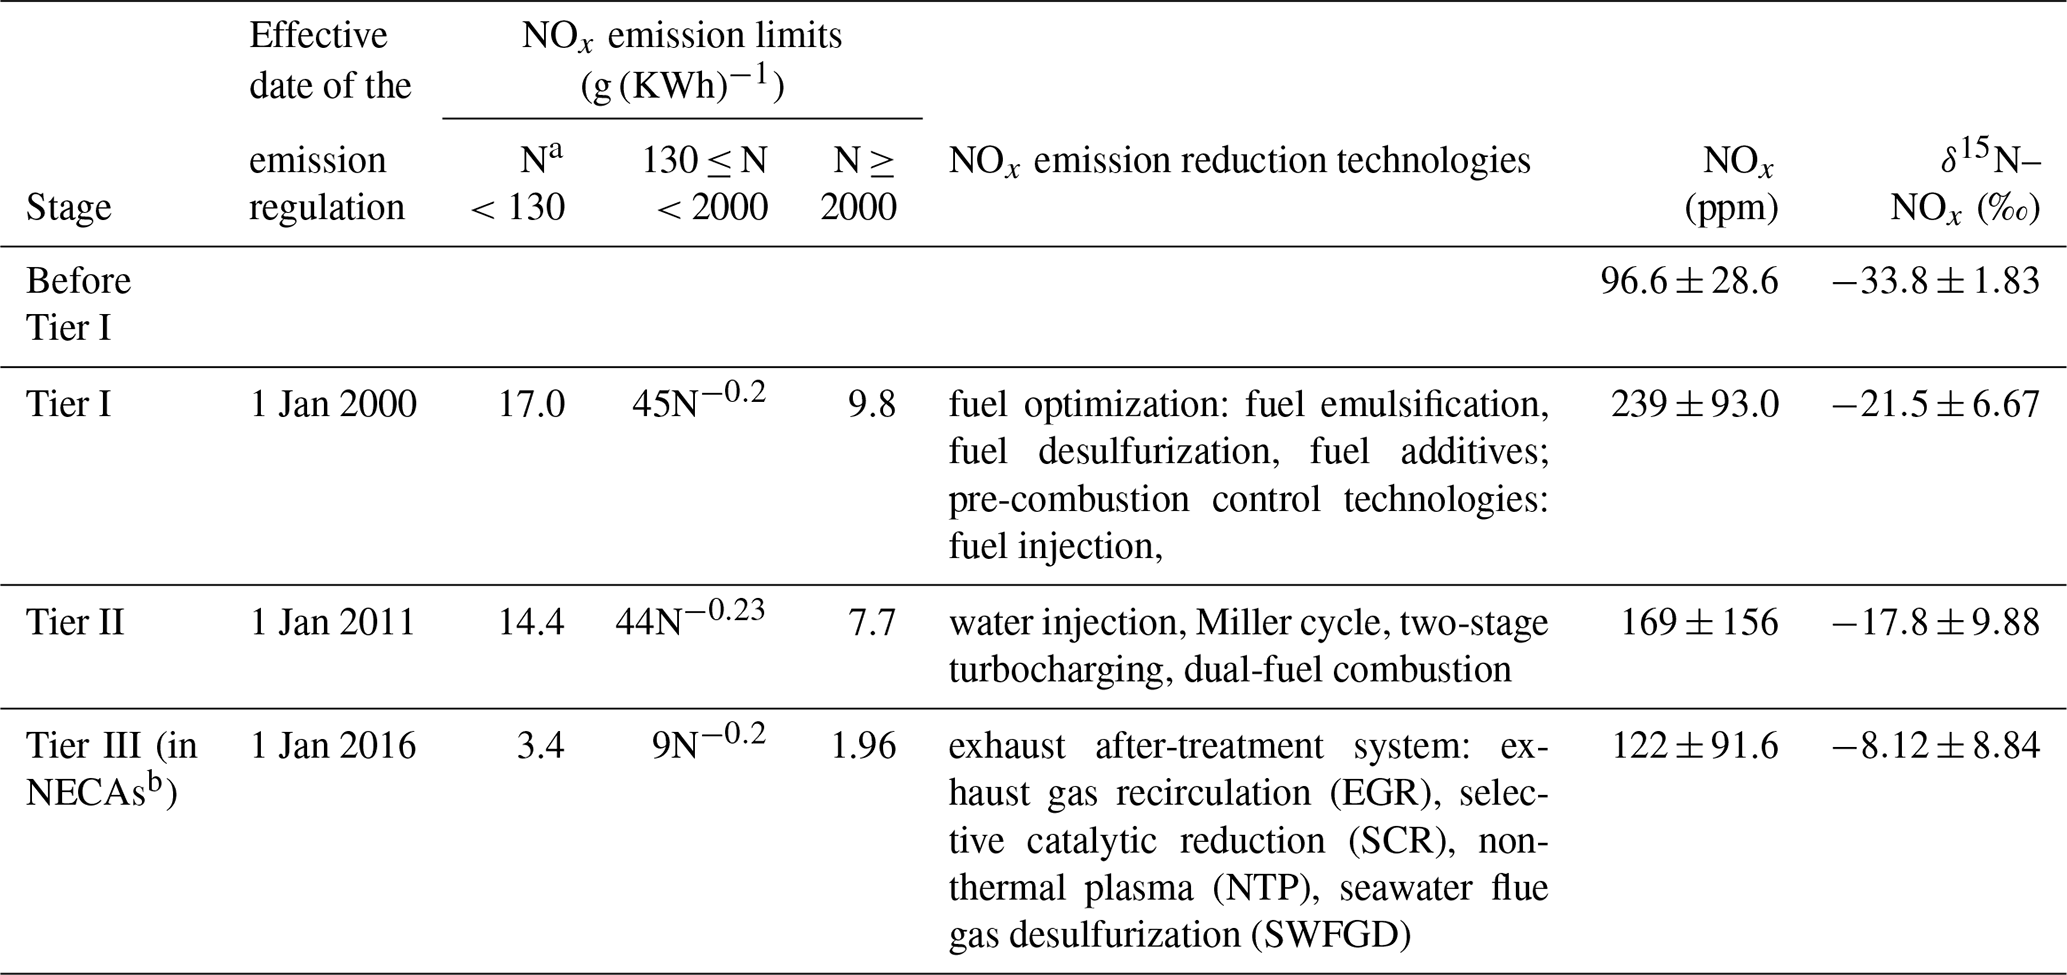
a N: rated speed (rpm). b NECAs: the nitrogen oxide emission control areas, mainly including the Baltic Sea area, the North American emission control area, and the Caribbean Sea emission control area.
Meanwhile, compared to the δ15N–NOx values which progressively increased with the tighter policing, the corresponding NOx concentrations gradually decreased and were 239 ± 93.0 ppm, 169 ± 156 ppm, and 122 ± 91.6 ppm under Tier I, II, and III, respectively, as presented in Table 3. These gradually increasing δ15N–NOx values and decreasing NOx emissions showed a negative logarithmic correlation (, p<0.01), as shown in Fig. 4. Walters et al. (2015b) demonstrated that there was also a negative logarithmic relationship between δ15N–NOx values and NOx concentrations from vehicle emissions, which was stronger in vehicles with NOx emission control technologies () than in vehicles without NOx emission control technologies (). The stronger relationship between δ15N–NOx values and NOx concentrations for vehicles with NOx emission control technologies versus vehicles without is attributed to the enrichment of δ15N relative to the thermally produced NOx while catalytically reducing NOx to N2 (Walters et al., 2015a). The strength of the correlation between δ15N–NOx values and NOx concentrations of ship emissions is just within the range of those reported in vehicle emissions with or without NOx emission control technologies because only 13 % of ship-emitted samples in our research were collected from ships equipped with SCR systems, further revealing that whether a ship is equipped with the NOx catalytic reduction device or not is a major factor that affects the δ15N–NOx values.
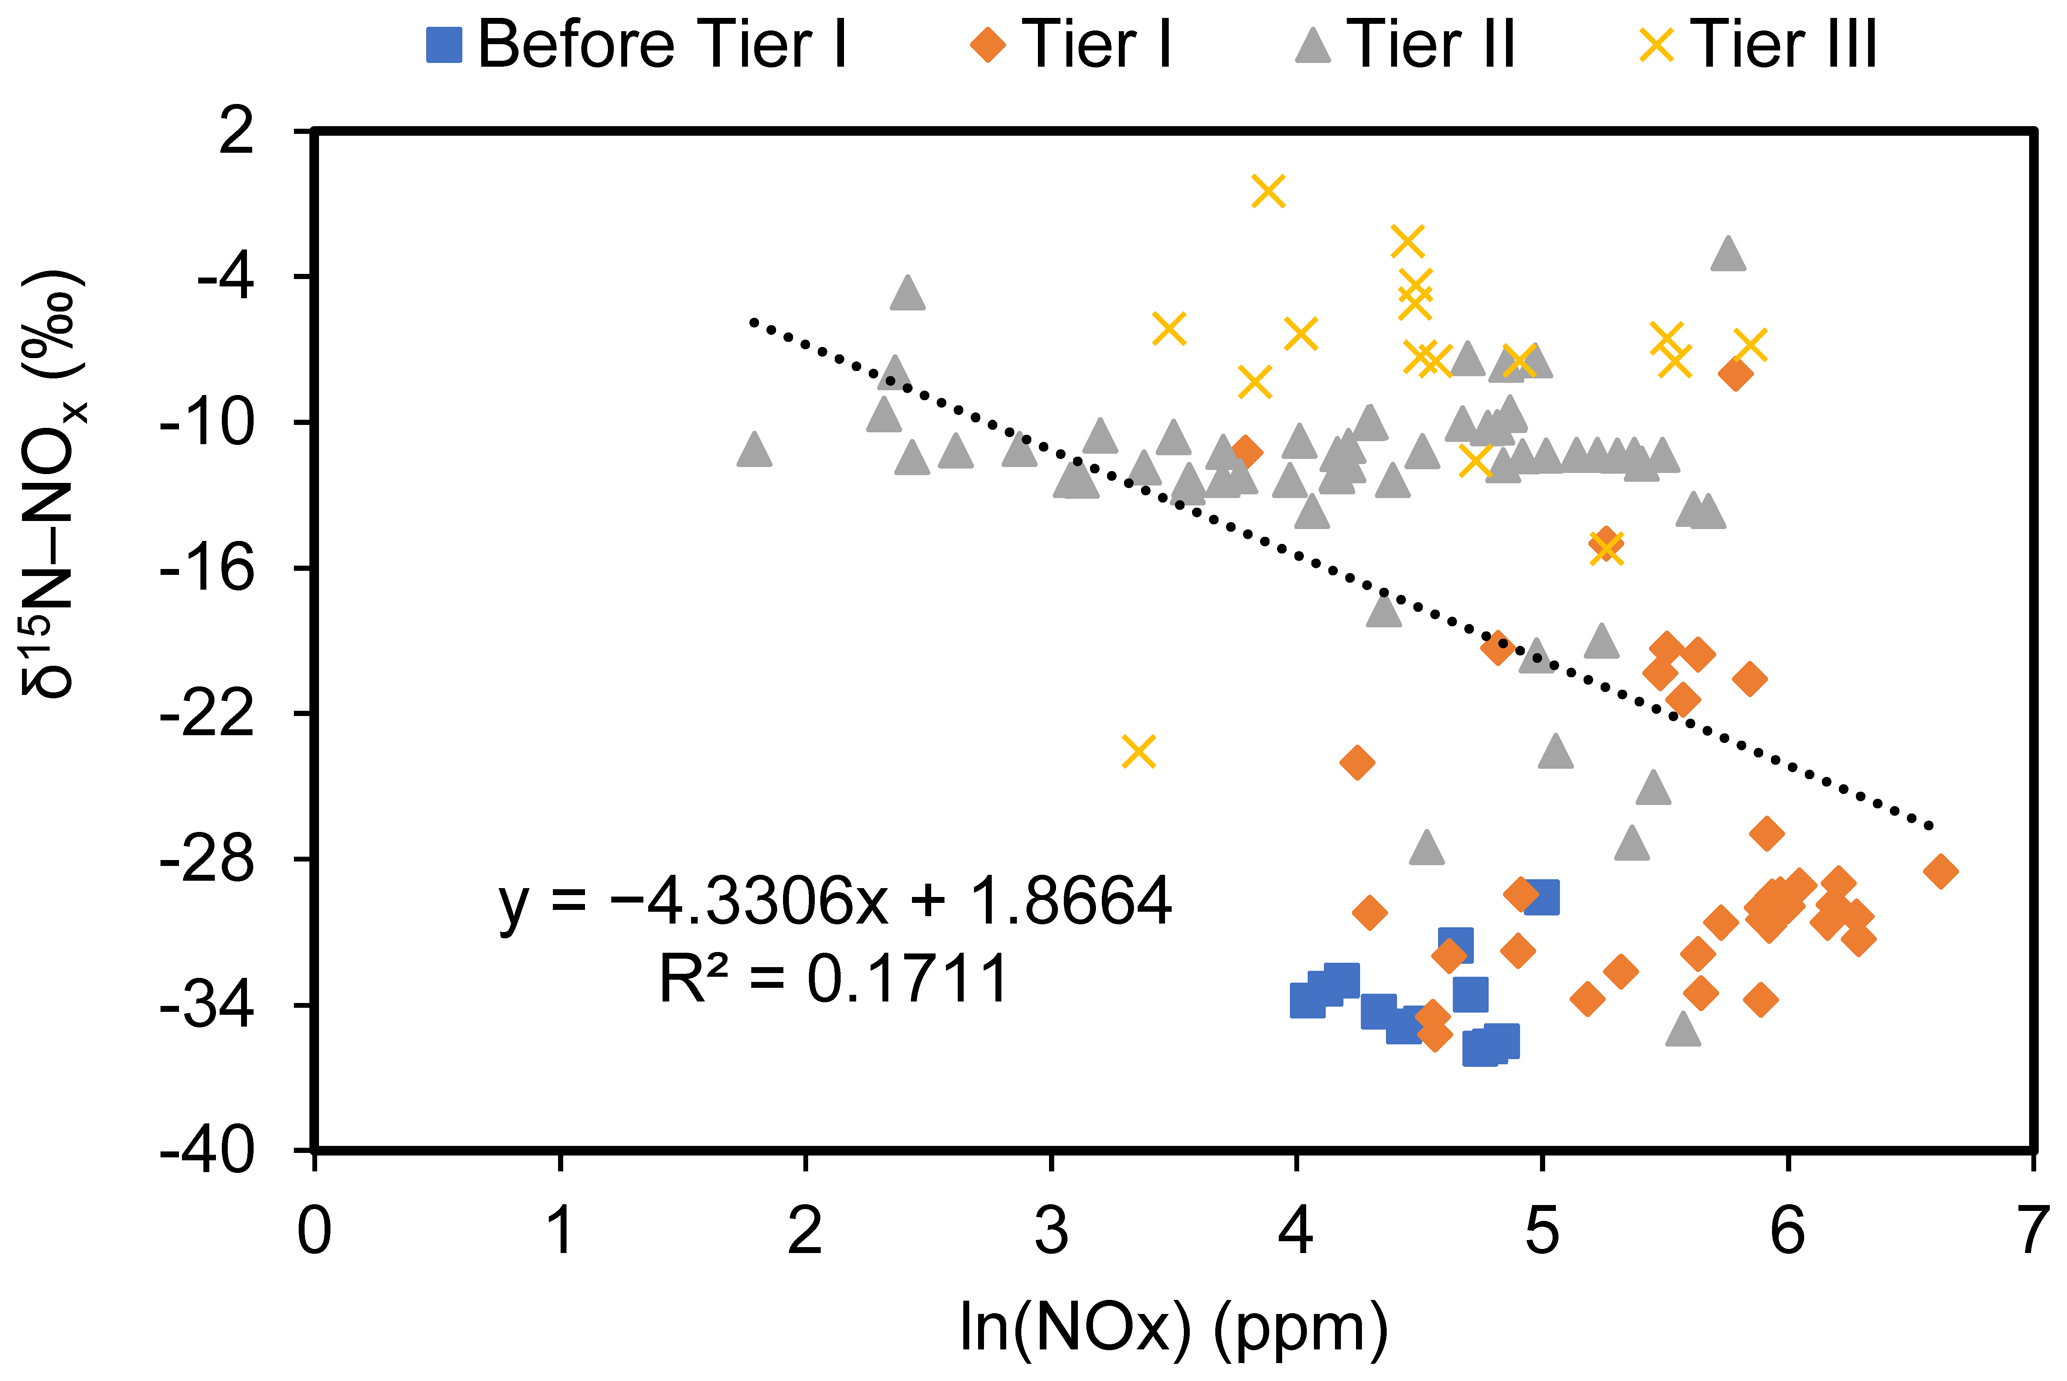
Figure 4The negative logarithmic relationship between δ15N–NOx values and NOx concentrations emitted from ships.
To further determine the effect of exhaust gas treatment devices on the emission of thermal δ15N–NOx values from different internal combustion engines, the δ15N–NOx values from ships, diesel vehicles, and gasoline vehicles not equipped with NOx catalytic reduction devices were corrected separately and compared again as shown in Fig. 1. It was found that the enrichment factors concerning catalytic NOx reduction relative to the original thermal NOx were 6.1 ‰ and 8.7 ‰ for light- and heavy-duty diesel-powered engines and 5.2 ‰ for gasoline-powered engines (Walters et al., 2015a, b). Consequently, the δ15N–NOx values emitted from ships without catalytic reduction systems were corrected by the enrichment factors of 6.1 ‰ and 8.7 ‰, and diesel vehicles and gasoline vehicles without catalytic reduction systems were corrected by 6.1 ‰ or 8.7 ‰ and 5.2 ‰, respectively. After the correction, the δ15N–NOx values from ships are −11.0 ± 10.1 ‰ (corrected by 8.7 ‰) and ‰ (corrected by 6.1 ‰), and those from diesel vehicles and gasoline vehicles are −11.5 ± 6.87 ‰ and −4.62 ± 5.71 ‰, respectively. These corrected δ15N–NOx values from ships are still significantly lower than the δ15N–NOx values from gasoline vehicles but insignificantly different than those from diesel vehicles (p>0.1), demonstrating that the catalytic reduction system is a major reason for the differences in δ15N–NOx values produced by various internal combustion engines. In addition, we found no significant difference in the δ15N–NOx values emitted from gasoline and LPG vehicles. Hence the δ15N–NOx values after eliminating the effect of SCR systems can be divided into two groups, one from ships and diesel vehicles and the other from gasoline and LPG vehicles. The δ15N–NOx values in the first group are emitted from compression ignition engines fuelled by diesel and residual oil, and those in the second group are emitted from spark-ignition engines fuelled by gasoline and LPG (Mikalsen, 2011; Mitukiewicz et al., 2015; Park et al., 2020). Engines of the same structural design using different fuels produced comparable δ15N–NOx values, which indicates once more that fuel type is not a major factor affecting the δ15N–NOx values (Mikalsen, 2011). The main reasons for the significant difference in δ15N–NOx values between the two groups may be the difference in the state variables during operation of the two different engine designs. It has been well proven that the combustion with high pressure, the extended Zeldovich mechanism, and N2O reactions are the major sources of combustion engine-emitted NOx (Goldsworthy, 2003). The combustion chamber temperature, equivalence ratio of fuel mass to oxidizer mass, oxygen concentration, and retention time of oxygen and nitrogen at a high temperature are different between the types of engines and are the main factors determining the NOx generation rate (Cho et al., 2018; Goldsworthy, 2003; Mikalsen, 2011; Querel et al., 2015; Tomeczek and Gradon, 1997). These parameters are likely to be the major causes of the large variations in δ15N–NOx values and should be further quantified in future studies.
3.3 Implications for δ15N–NOx values from ships
As mentioned in Sect. S3, the impact of ship emissions on atmospheric NOx pollution cannot be ignored (Fig. S7), and reliable δ15N–NOx values of ship emissions are essential for the accuracy of source apportionment when assessing atmospheric NOx sources in coastal areas based on δ15N methods. Although the δ15N–NOx values obtained in the present study are constrained and do not accurately reflect the data emitted from all types of ships, they are practical for assessing δ15N–NOx source characterization of traffic exhaust. In general, we found that ships and diesel vehicles emit lower δ15N–NOx values than gasoline and LPG vehicles because these NOx emissions are produced by compression ignition engines, and δ15N–NOx values emitted from ships increase with the decrease in the emission factor of NOx to meet the requirements of tightened regulations established by the IMO, especially when ships are equipped with SCR systems. A previous study concluded that the volume of global maritime trade increased by almost 3-fold from 1980 to 2019, and approximately 90 % of these goods were carried by merchant fleets (Kong et al., 2022). Thus, this study collected the age distribution of ships larger than 300 gross tonnage (GT) in the international merchant fleet during 2001 and 2021 to assess the temporal variation in δ15N–NOx emitted from ships by developing a mass-weighted model (Yang and Zhou, 2002; Zhou et al., 2004; Meng et al., 2005, 2007; Meng and Huang, 2006; Qi et al., 2008, 2010, 2013, 2020; Qin et al., 2009, 2012, 2015, 2017, 2018; Li et al., 2011, 2014, 2016; Shen and Qi, 2019; Liu et al., 2021; Wei et al., 2022). In the model, the mass-weighted δ15N–NOx value in a specified year can be expressed as
where δ15Ni, EFi, and TSi are the δ15N–NOx value, emission factor of NOx, and number of ships complying with the ith emission regulation, respectively. The subscript of i from 1 to 4 means before Tier I, Tier I, Tier II, and Tier III, respectively. The δ15N–NOx values in the four stages are shown in Fig. 2. The EF values in the four stages are 9.8, 9.8, 7.7, and 1.96 g (KWh)−1, as presented in Table 3 (https://dieselnet.com/standards/inter/imo.php#other). The TS was calculated based on the age distribution of ships during 2001 and 2021, as shown in Fig. S8. On this basis, 100 000 δ15N–NOx values were stochastically generated to be the typical values of ships meeting each emission regulation to calculate the mass-weighted δ15N–NOx value in a specified year.
The temporal variation in the mass-weighted δ15N–NOx emitted from ships between 2001 and 2021 is displayed in Fig. 5, and the specific calculation results of the mass-weighted δ15N–NOx values used in this figure can be found in Table S5. As expected, the δ15N–NOx values from ships larger than 300 GT in the international merchant fleet continued to increase as ships implemented tighter emission standards. The growth rate of the δ15N–NOx values was relatively gentle during approximately 10 years from 2001 to 2012 (0.25 ‰ yr−1) and then became faster between 2013 and 2021 (0.40 ‰ yr−1), attributed to the further tightening of emission regulations. Assuming the same age distribution of vessels after 2022 as in 2021, it can be estimated that the δ15N–NOx values will continue to increase before 2040 (0.40 ‰ yr−1) as shown in Fig. 5. After a few years of gentle growth, the δ15N–NOx values will remain basically flat after 2046 when all ships will meet the Tier III emission standard. In conclusion, the δ15N–NOx values obtained after mass weighting based on the ship age distribution have a smaller range of variation and more valuable and practical significance. In addition, given that the calculated results only involved the age distribution and emission reduction level of the international merchant fleet, the subsequent process of using δ15N to evaluate the contribution of ship emissions to atmospheric NOx can be combined with the actual situation of ships in the study area to select more appropriate δ15N–NOx values to acquire a more accurate ship emission contribution and reduce the uncertainty in NOx source apportionment.
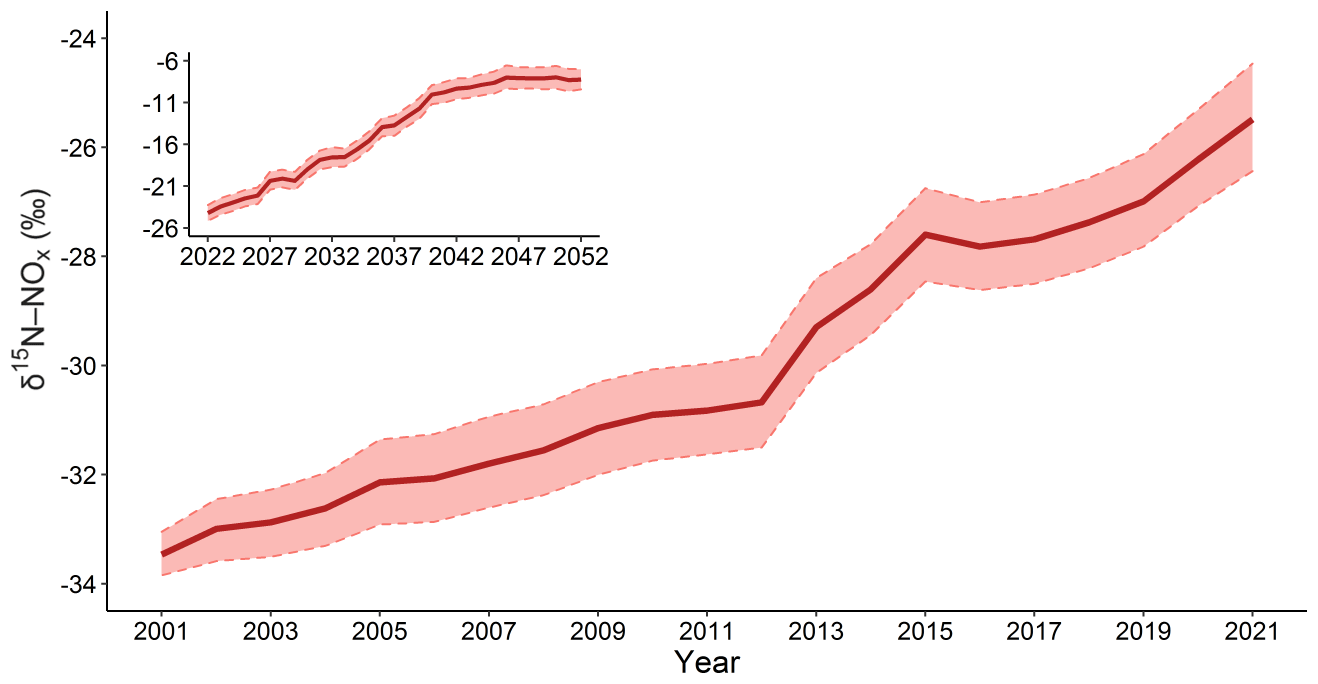
Figure 5Temporal variation in the mass-weighted δ15N values in NOx emitted from ships larger than 300 GT in the international merchant fleet during 2001 and 2021. Predicted temporal changes in δ15N–NOx values from these ships between 2022 and 2052 assuming that the distribution of the ship ages is the same as that in 2021 are given in the inset. Solid red line, mean; dashed red line, upper and lower quartiles.
The δ15N–NOx values emitted from ships play a crucial role in accurately analysing the sources of atmospheric NOx in coastal areas with frequent shipping activities, as well as the sources of nitrogen deposition in remote marine regions. This study conducted the first measurements of δ15N–NOx values emitted from ships and investigated their main influencing factors. Moreover, a weighted model that enabled precise assessment of the temporal variation in ship-emitted δ15N–NOx values was developed based on the relationship between observed δ15N–NOx values and emission regulations. Using this model, the δ15N–NOx values emitted from ships in the international merchant fleet were calculated with the age distribution of ships in the fleet.
The δ15N–NOx values emitted from ships sampled in this study were −18.5 ± 10.9 ‰, significantly lower (p<0.01) than the reported δ15N–NOx values from vehicle emissions. Given that these values were negative and there was no significant statistical difference (p>0.01) between δ15N–NOx values emitted from ships using residual oil and diesel fuel, the δ15N–NOx values are more likely associated with the production of thermal NOx rather than the conversion of nitrogen in the fuels.
Statistical analysis methods and machine learning techniques indicated that the most important influencing factor on δ15N–NOx values from ships was emission regulation, followed by ship category, fuel type, and operational status. Overall, the δ15N–NOx values progressively increased with the tightening of ship NOx emission standards. The δ15N–NOx values from ships equipped with SCR systems, which comply with the Tier III emission standard, were significantly higher than those from ships equipped without SCR systems at the 99 % confidence level (p<0.01). Therefore, the relatively largest difference in δ15N–NOx values between ships implementing Tier II and Tier III is in a great measure derived from the SCR system. Furthermore, the δ15N–NOx values from ships, diesel vehicles, and gasoline vehicles not equipped with NOx catalytic reduction devices were corrected separately and compared again. These corrected δ15N–NOx values from ships are still significantly lower than the δ15N–NOx values from gasoline vehicles but insignificantly different than those from diesel vehicles (p>0.1), demonstrating that the catalytic reduction system is a major reason for the differences in δ15N–NOx values produced by various internal combustion engines.
Based on the relationship between δ15N–NOx values and emission regulations, this study evaluated the temporal variation in δ15N–NOx emissions from ships larger than 300 GT in the international merchant fleet by establishing a mass-weighted model. With the implementation of stricter emission standards, the δ15N–NOx values of ship emissions continued to rise, and the growth rate increased from 0.25 ‰ yr−1 (2001–2012) to 0.40 ‰ yr−1 (2013–2021). Assuming the same age distribution of vessels after 2022 as in 2021, it can be estimated that the δ15N–NOx values will continue to increase before 2040 (0.40 ‰ yr−1) and will remain basically flat after 2046 when all ships will meet the Tier III emission standard.
While the δ15N–NOx values obtained in this study may not provide an exact representation of emissions from all ship types, they are valuable for assessing source characterization of traffic exhaust in terms of δ15N–NOx. Meanwhile, the δ15N–NOx values calculated through mass weighting, considering the age distribution of ships, exhibit a narrower range of variation and hold greater practical significance. In addition, local δ15N–NOx values can be calculated by incorporating the age distribution and emission reduction level of ships in the study area. This would facilitate a more accurate contribution of ship emissions to atmospheric NOx and would have an impact on NO air quality and nitrogen deposition.
The δ15N–NOx values emitted from cars fuelled by diesel, gasoline, and LPG used in this paper can be found in research work by Walters et al. (2015a, b). The age distributions of ships larger than 300 GT in the international merchant fleet during 2001 and 2021 used to develop the mass-weighted model of δ15N–NOx values emitted from ships are obtained from a series of reviews and prospects of the world shipping market from 2001 to 2021 published in Ship & Boat (Yang and Zhou, 2002; Zhou et al., 2004; Meng et al., 2005, 2007; Meng and Huang, 2006; Qi et al., 2008, 2010, 2013, 2020; Qin et al., 2009, 2012, 2015, 2017, 2018; Li et al., 2011, 2014, 2016; Shen and Qi, 2019; Liu et al., 2021; Wei et al., 2022). Corresponding data for the collected ship-emitted NOx samples can be accessed on request to the corresponding author (Chongguo Tian, cgtian@yic.ac.cn).
The supplement related to this article is available online at: https://doi.org/10.5194/acp-23-12851-2023-supplement.
The article was written through the contributions of all the authors. ZS, ZZ, CT, and FZ designed the research; ZS, ZZ, and ZL conducted the sample collection; ZS and YT performed the chemical analyses; ZS and CT analysed the data, carried out the simulations, and wrote the original article; and RS, YC, JL, and GZ helped with article submissions. All the authors have given approval to the final version of the article.
The contact author has declared that none of the authors has any competing interests.
Publisher's note: Copernicus Publications remains neutral with regard to jurisdictional claims in published maps and institutional affiliations.
This research has been supported by the National Natural Science Foundation of China (grant nos. 41977190 and U1906215).
This paper was edited by Katye Altieri and reviewed by three anonymous referees.
Ammann, M., Siegwolf, R., Pichlmayer, F., Suter, M., Saurer, M., and Brunold, C.: Estimating the uptake of traffic-derived NO2 from 15N abundance in Norway spruce needles, Oecologia, 118, 124–131, https://doi.org/10.1007/s004420050710, 1999.
Ampah, J. D., Yusuf, A. A., Afrane, S., Jin, C., and Liu, H.: Reviewing two decades of cleaner alternative marine fuels: Towards IMO's decarbonization of the maritime transport sector, J. Clean. Prod., 320, 128871, https://doi.org/10.1016/j.jclepro.2021.128871, 2021.
Beyn, F., Matthias, V., Aulinger, A., and Daehnke, K.: Do N-isotopes in atmospheric nitrate deposition reflect air pollution levels?, Atmos. Environ., 107, 281–288, https://doi.org/10.1016/j.atmosenv.2015.02.057, 2015.
Bohlke, J. K., Mroczkowski, S. J., and Coplen, T. B.: Oxygen isotopes in nitrate: new reference materials for 18O:17O:16O measurements and observations on nitrate-water equilibration, Rapid Commun. Mass Spectrom., 17, 1835–1846, https://doi.org/10.1002/rcm.1123, 2003.
Chai, J., Miller, D. J., Scheuer, E., Dibb, J., Selimovic, V., Yokelson, R., Zarzana, K. J., Brown, S. S., Koss, A. R., Warneke, C., and Hastings, M.: Isotopic characterization of nitrogen oxides (NOx), nitrous acid (HONO), and nitrate (pNO3−) from laboratory biomass burning during FIREX, Atmos. Meas. Tech., 12, 6303–6317, https://doi.org/10.5194/amt-12-6303-2019, 2019.
Chen, D., Zhao, Y., Nelson, P., Li, Y., Wang, X., Zhou, Y., Lang, J., and Guo, X.: Estimating ship emissions based on AIS data for port of Tianjin, China, Atmos. Environ., 145, 10–18, https://doi.org/10.1016/j.atmosenv.2016.08.086, 2016.
Chen, D., Wang, X., Li, Y., Lang, J., Zhou, Y., Guo, X., and Zhao, Y.: High-spatiotemporal-resolution ship emission inventory of China based on AIS data in 2014, Sci. Total Environ., 609, 776–787, https://doi.org/10.1016/j.scitotenv.2017.07.051, 2017.
Cho, H., Fulton, B., Upadhyay, D., Brewbaker, T., and van Nieuwstadt, M.: In-cylinder pressure sensor-based NOx model for real-time application in diesel engines, Int. J. Engine Res., 19, 293–307, https://doi.org/10.1177/1468087417703201, 2018.
Cooper, D. A.: Exhaust emissions from ships at berth, Atmos. Environ., 37, 3817–3830, https://doi.org/10.1016/S1352-2310(03)00446-1, 2003.
Corbett, J. J. and Fischbeck, P.: Emissions from ships, Science, 278, 823–824, https://doi.org/10.1126/science.278.5339.823, 1997.
Corbett, J. J. and Winebrake, J. J.: Emissions tradeoffs among alternative marine fuels: Total fuel cycle analysis of residual oil, marine gas oil, and marine diesel oil, J. Air Waste Manage. Assoc., 58, 538–542, https://doi.org/10.3155/1047-3289.58.4.538, 2008.
Deng, J., Wang, X., Wei, Z., Wang, L., Wang, C., and Chen, Z.: A review of NOx and SOx emission reduction technologies for marine diesel engines and the potential evaluation of liquefied natural gas fuelled vessels, Sci. Total Environ., 766, 144319, https://doi.org/10.1016/j.scitotenv.2020.144319, 2021.
Duan, K., Li, Q., Liu, H., Zhou, F., Lu, J., Zhang, X., Zhang, Z., Wang, S., Ma, Y., and Wang, X.: Dynamic NOx emission factors for main engines of bulk carriers, Transport Res. D-Tr. E., 107, 103290, https://doi.org/10.1016/j.trd.2022.103290, 2022.
Elith, J., Leathwick, J. R., and Hastie, T.: A working guide to boosted regression trees, J. Anim. Ecol., 77, 802–813, https://doi.org/10.1111/j.1365-2656.2008.01390.x, 2008.
Felix, J. D. and Elliott, E. M.: The agricultural history of human-nitrogen interactions as recorded in ice core δN15–NO, Geophys. Res. Lett., 40, 1642–1646, https://doi.org/10.1002/grl.50209, 2013.
Felix, J. D. and Elliott, E. M.: Isotopic composition of passively collected nitrogen dioxide emissions: Vehicle, soil and livestock source signatures, Atmos. Environ., 92, 359–366, https://doi.org/10.1016/j.atmosenv.2014.04.005, 2014.
Felix, J. D., Elliott, E. M., and Shaw, S. L.: Nitrogen isotopic composition of coal-fired power plant NOx: Influence of emission controls and implications for global emission inventories, Environ. Sci. Technol., 46, 3528–3535, https://doi.org/10.1021/es203355v, 2012.
Fibiger, D. L. and Hastings, M. G.: First measurements of the nitrogen isotopic composition of NOx from biomass burning, Environ. Sci. Technol., 50, 11569–11574, https://doi.org/10.1021/acs.est.6b03510, 2016.
Fibiger, D. L., Hastings, M. G., Lew, A. F., and Peltier, R. E.: Collection of NO and NO2 for isotopic analysis of NOx emissions, Anal. Chem., 86, 12115–12121, https://doi.org/10.1021/ac502968e, 2014.
Freyer, H. D.: Seasonal trends of NH and NO nitrogen isotope composition in rain collected at Julich, Germany, Tellus, 30, 83–92, https://doi.org/10.1111/j.2153-3490.1978.tb00820.x, 1978.
Fu, M., Liu, H., Jin, X., and He, K.: National- to port-level inventories of shipping emissions in China, Environ. Res. Lett., 12, https://doi.org/10.1088/1748-9326/aa897a, 2017.
Goldsworthy, L.: Reduced kinetics schemes for oxides of nitrogen emissions from a slow-speed marine diesel engine, Energy Fuel., 17, 450–456, https://doi.org/10.1021/ef020172c, 2003.
Heaton, T. H. E.: 15N/14N ratios of NOx from vehicle engines and coal-fired power stations, Tellus B, 42, 304–307, https://doi.org/10.1034/j.1600-0889.1990.t01-1-00009.x, 1990.
Hothorn, T., Hornik, K., and Zeileis, A.: Unbiased recursive partitioning: A conditional inference framework, J. Comput. Graph. Stat., 15, 651–674, https://doi.org/10.1198/106186006x133933, 2006.
Huang, L., Wen, Y., Geng, X., Zhou, C., and Xiao, C.: Integrating multi-source maritime information to estimate ship exhaust emissions under wind, wave and current conditions, Transport Res. D.-Tr. E, 59, 148–159, https://doi.org/10.1016/j.trd.2017.12.012, 2018.
Huang, T., Zhu, X., Zhong, Q., Yun, X., Meng, W., Li, B., Ma, J., Zeng, E. Y., and Tao, S.: Spatial and Temporal Trends in Global Emissions of Nitrogen Oxides from 1960 to 2014, Environ. Sci. Technol., 51, 7992–8000, https://doi.org/10.1021/acs.est.7b02235, 2017.
Jiang, H., Wu, G., Li, T., He, P., and Chen, R.: Characteristics of Particulate Matter Emissions from a Low-Speed Marine Diesel Engine at Various Loads, Environ. Sci. Technol., 53, 11552–11559, https://doi.org/10.1021/acs.est.9b02341, 2019.
Jin, Z., Qian, L., Shi, Y., Fu, G., Li, G., and Li, F.: Quantifying major NOx sources of aerosol nitrate in Hangzhou, China, by using stable isotopes and a Bayesian isotope mixing model, Atmos. Environ., 244, https://doi.org/10.1016/j.atmosenv.2020.117979, 2021.
Johansson, L., Jalkanen, J.-P., and Kukkonen, J.: Global assessment of shipping emissions in 2015 on a high spatial and temporal resolution, Atmos. Environ., 167, 403–415, https://doi.org/10.1016/j.atmosenv.2017.08.042, 2017.
Kong, X., Feng, K., Wang, P., Wan, Z., Lin, L., Zhang, N., and Li, J.: Steel stocks and flows of global merchant fleets as material base of international trade from 1980 to 2050, Global. Environ. Chang., 73, 102493, https://doi.org/10.1016/j.gloenvcha.2022.102493, 2022.
Li, D. and Wang, X.: Nitrogen isotopic signature of soil-released nitric oxide (NO) after fertilizer application, Atmos. Environ., 42, 4747–4754, https://doi.org/10.1016/j.atmosenv.2008.01.042, 2008.
Li, Y., Qin, Q., Qi, B., Shen, S., and Zhou, Y.: Review of the world ship market in 2010 and beyond, Ship & Boat, 22, 1–9, 2011.
Li, Y., Qin, Q., Qi, B., Shen, S., and Liu, F.: Review of world ship market in 2013 and future prospect, Ship & Boat, 25, 1–12, https://doi.org/10.19423/j.cnki.31-1561/u.2014.01.002, 2014.
Li, Y., Qin, Q., Qi, B., Shen, S., and Liu, F.: Review of world ship market in 2015 and 2016 predication, Ship & Boat, 27, 1–15, https://doi.org/10.19423/j.cnki.31-1561/u.2016.01.001, 2016.
Lion, S., Vlaskos, I., and Taccani, R.: A review of emissions reduction technologies for low and medium speed marine Diesel engines and their potential for waste heat recovery, Energ. Convers. Manage., 207, 112553, https://doi.org/10.1016/j.enconman.2020.112553, 2020.
Liu, F., Wang, Y., Du, L., and Wei, M.: Review of World Shipping Market in 2020 and Prospect in 2021, Ship & Boat, 32, 1–16, https://doi.org/10.19423/j.cnki.31-1561/u.2021.01.001, 2021.
Liu, H., Fu, M., Jin, X., Shang, Y., Shindell, D., Faluvegi, G., Shindell, C., and He, K.: Health and climate impacts of ocean-going vessels in East Asia, Nat. Clim. Change, 6, 1037-+, https://doi.org/10.1038/nclimate3083, 2016.
Liu, Z., Chen, Y., Zhang, Y., Zhang, F., Feng, Y., Zheng, M., Li, Q., and Chen, J.: Emission Characteristics and Formation Pathways of Intermediate Volatile Organic Compounds from Ocean-Going Vessels: Comparison of Engine Conditions and Fuel Types, Environ. Sci. Technol., 56, 12917–12925, https://doi.org/10.1021/acs.est.2c03589, 2022.
Luo, L., Wu, Y., Xiao, H., Zhang, R., Lin, H., Zhang, X., and Kao, S.-J.: Origins of aerosol nitrate in Beijing during late winter through spring, Sci. Total Environ., 653, 776–782, https://doi.org/10.1016/j.scitotenv.2018.10.306, 2019.
Mann, H. B. and Whitney, D. R.: On a test of whether one of two random variables is stochastically larger than the other, Ann. Math. Stat., 18, 50–60, 1947.
Margeson, J. H., Knoll, J. E., Midgett, M. R., Oldaker, G. B., Loder, K. R., Grohse, P. M., and Gutknecht, W. F.: An integrated method for determining nitrogen oxide (NOx) emissions at nitric acid plants, Anal. Chem., 56, 2607–2610, https://doi.org/10.1021/ac00277a079, 1984.
Massman, W. J.: A review of the molecular diffusivities of H2O, CO2, CH4, CO, O3, SO2, NH3, N2O, NO, AND NO2 in air, O2 AND N2 near STP, Atmos. Environ., 32, 1111–1127, https://doi.org/10.1016/s1352-2310(97)00391-9, 1998.
McIlvin, M. R. and Casciotti, K. L.: Technical updates to the bacterial method for nitrate isotopic analyses, Anal. Chem., 83, 1850–1856, https://doi.org/10.1021/ac1028984, 2011.
Meng, X. and Huang, Y.: Review of world ship market in 2005 and its prospect, Ship & Boat, 17, 1–8, 2006.
Meng, X., Huang, Y., and Zhou, B.: 2004 world ship market analysis and forecast, Ship & Boat, 16, 1–6, 2005.
Meng, X., Qi, B., Qin, Q., and Ming, H.: Review of world ship market in 2006 and its prospect, Ship & Boat, 18, 1–8, 2007.
Mikalsen, R.: 6 – Internal combustion and reciprocating engine systems for small and micro combined heat and power (CHP) applications, in: Small and Micro Combined Heat and Power (CHP) Systems, edited by: Beith, R., Woodhead Publishing, 125–146, https://doi.org/10.1533/9780857092755.2.125, 2011.
Miller, D. J., Wojtal, P. K., Clark, S. C., and Hastings, M. G.: Vehicle NOx emission plume isotopic signatures: Spatial variability across the eastern United States, J. Geophys. Res.-Atmos., 122, 4698–4717, https://doi.org/10.1002/2016jd025877, 2017.
Miller, D. J., Chai, J., Guo, F., Dell, C. J., Karsten, H., and Hastings, M. G.: Isotopic composition of in situ soil NOx emissions in manure-fertilizes cropland, Geophys. Res. Lett., 45, 12058–12066, https://doi.org/10.1029/2018gl079619, 2018.
Mitukiewicz, G., Dychto, R., and Leyko, J.: Relationship between LPG fuel and gasoline injection duration for gasoline direct injection engines, Fuel, 153, 526–534, https://doi.org/10.1016/j.fuel.2015.03.033, 2015.
Moore, H.: Isotopic composition of ammonia, nitrogen-dioxide and nitrate in atmosphere, Atmos. Environ., 11, 1239–1243, https://doi.org/10.1016/0004-6981(77)90102-0, 1977.
Nunes, R. A. O., Alvim-Ferraz, M. C. M., Martins, F. G., and Sousa, S. I. V.: The activity-based methodology to assess ship emissions – A review, Environ. Pollut., 231, 87–103, https://doi.org/10.1016/j.envpol.2017.07.099, 2017.
Park, J., Choi, I., Oh, J., and Lee, C.: Nitrogen Oxides and Particulate Matter from Marine Diesel Oil (MDO), Emulsified MDO, and Dimethyl Ether Fuels in Auxiliary Marine Engines, J. Mar. Sci. Eng., 8, 322, https://doi.org/10.3390/jmse8050322, 2020.
Perez, T., Trumbore, S. E., Tyler, S. C., Matson, P. A., Ortiz-Monasterio, I., Rahn, T., and Griffith, D. W. T.: Identifying the agricultural imprint on the global N2O budget using stable isotopes, J. Geophys. Res.-Atmos., 106, 9869–9878, https://doi.org/10.1029/2000jd900809, 2001.
Qi, B., Qin, Q., Ming, H., and Meng, X.: Review of world ship market in 2007 and its prospect, Ship & Boat, 19, 1–9, 2008.
Qi, B., Li, Y., Qin, Q., and Shen, S.: Review of world ship market in 2009 and market prospect, Ship & Boat, 21, 1–8, 2010.
Qi, B., Zhou, Y., Qin, Q., Shen, S., and Li, Y.: Review of world ship market in 2012 and future prospect, Ship & Boat, 24, 1–9, 2013.
Qi, B., Du, L., Wang, Y., Pan, F., and Shen, S.: Review of World Shipping Market in 2019 and Prospects in 2020, Ship & Boat, 31, 1–14, https://doi.org/10.19423/j.cnki.31-1561/u.2020.01.001, 2020.
Qin, Q., Meng, X., Li, Y., and Qi, B.: Review of world ship market in 2008 and market prospect, Ship & Boat, 20, 1–8, 2009.
Qin, Q., Li, Y., Qi, B., Shen, S., and Zhou, Y.: Review of world ship market in 2011 and future prospect, Ship & Boat, 23, 1–10, 2012.
Qin, Q., Qi, B., Shen, S., Liu, F., and Zhao, H.: Review of world ship market in 2014 and beyond, Ship & Boat, 26, 1–14, https://doi.org/10.19423/j.cnki.31-1561/u.2015.01.001, 2015.
Qin, Q., Qi, B., Shen, S., Liu, F., and Jiang, H.: Review of world ship market in 2016 and prospect in 2017, Ship & Boat, 28, 1–15, 2017.
Qin, Q., Qi, B., Shen, S., Liu, F., and Jiang, H.: Review of world shipping market in 2017 and prospects in 2018, Ship & Boat, 29, 1–18, 2018.
Querel, C., Grondin, O., and Letellier, C.: Semi-physical mean-value NOx model for diesel engine control, Control Eng. Pract., 40, 27–44, https://doi.org/10.1016/j.conengprac.2015.02.005, 2015.
Redling, K., Elliott, E., Bain, D., and Sherwell, J.: Highway contributions to reactive nitrogen deposition: tracing the fate of vehicular NOx using stable isotopes and plant biomonitors, Biogeochemistry, 116, 261–274, https://doi.org/10.1007/s10533-013-9857-x, 2013.
Selleri, T., Melas, A. D., Joshi, A., Manara, D., Perujo, A., and Suarez-Bertoa, R.: An Overview of Lean Exhaust deNOx Aftertreatment Technologies and NOx Emission Regulations in the European Union, Catalysts, 11, 404, https://doi.org/10.3390/catal11030404, 2021.
Shen, S. and Qi, B.: Review of World Ship Market in 2018 and Prospects for 2019, Ship & Boat, 30, 1–16, https://doi.org/10.19423/j.cnki.31-1561/u.2019.01.001, 2019.
Shi, K., Weng, J., and Li, G.: Exploring the effectiveness of ECA policies in reducing pollutant emissions from merchant ships in Shanghai port waters, Mar. Pollut. Bull., 155, 111164, https://doi.org/10.1016/j.marpolbul.2020.111164, 2020.
Shi, Y., Li, C., Jin, Z., Zhang, Y., Xiao, J., and Li, F.: Combining dual isotopes and a Bayesian isotope mixing model to quantify the nitrate sources of precipitation in Ningbo, East China, Sci. Total Environ., 778, 146297, https://doi.org/10.1016/j.scitotenv.2021.146297, 2021.
Shi, Y., Tian, P., Jin, Z., Hu, Y., Zhang, Y., and Li, F.: Stable nitrogen isotope composition of NOx of biomass burning in China, Sci. Total Environ., 803, 149857, https://doi.org/10.1016/j.scitotenv.2021.149857, 2022.
Sigman, D. M., Casciotti, K. L., Andreani, M., Barford, C., Galanter, M., and Bohlke, J. K.: A bacterial method for the nitrogen isotopic analysis of nitrate in seawater and freshwater, Anal. Chem., 73, 4145–4153, https://doi.org/10.1021/ac010088e, 2001.
Snape, C. E., Sun, C. G., Fallick, A. E., Irons, R., and Haskell, J.: Potential of stable nitrogen isotope ratio measurements to resolve fuel and thermal NOx in coal combustion, Abstr. Pap. Am. Chem. Soc., 225, U843–U843, 2003.
Song, W., Wang, Y.-L., Yang, W., Sun, X.-C., Tong, Y.-D., Wang, X.-M., Liu, C.-Q., Bai, Z.-P., and Liu, X.-Y.: Isotopic evaluation on relative contributions of major NOx sources to nitrate of PM2.5 in Beijing, Environ. Pollut., 248, 183–190, https://doi.org/10.1016/j.envpol.2019.01.081, 2019.
Song, W., Liu, X.-Y., Wang, Y.-L., Tong, Y.-D., Bai, Z.-P., and Liu, C.-Q.: Nitrogen isotope differences between atmospheric nitrate and corresponding nitrogen oxides: A new constraint using oxygen isotopes, Sci. Total Environ., 701, 134515, https://doi.org/10.1016/j.scitotenv.2019.134515, 2020.
Speybroeck, N.: Classification and regression trees, Int. J. Public Health, 57, 243–246, https://doi.org/10.1007/s00038-011-0315-z, 2012.
Strobl, C., Boulesteix, A.-L., Zeileis, A., and Hothorn, T.: Bias in random forest variable importance measures: Illustrations, sources and a solution, BMC Bioinformatics, 8, 25, https://doi.org/10.1186/1471-2105-8-25, 2007.
Ti, C., Ma, S., Peng, L., Tao, L., Wang, X., Dong, W., Wang, L., and Yan, X.: Changes of δ15N values during the volatilization process after applying urea on soil, Environ. Pollut., 270, 116204, https://doi.org/10.1016/j.envpol.2020.116204, 2021.
Tomeczek, J. and Gradon, B.: The role of nitrous oxide in the mechanism of thermal nitric oxide formation within flame temperature range, Combust. Sci. Technol., 125, 159–180, https://doi.org/10.1080/00102209708935658, 1997.
Toof, J. L.: A Model for the Prediction of Thermal, Prompt, and Fuel NOx Emissions From Combustion Turbines, J. Eng. Gas Turb. Power., 108, 340–347, https://doi.org/10.1115/1.3239909, 1986.
Trozzi, C.: Emission estimate methodology for maritime navigation, U.S. Environmental Protection Agency, United States, https://www.academia.edu/28998830/Emission_estimate_methodology_for_maritime_navigation (last access: 18 March 2023), 2010.
Tsague, L., Tsogo, J., and Tatietse, T. T.: Prediction of the production of nitrogen oxide (NOx) in turbojet engines, Atmos. Environ., 40, 5727–5733, https://doi.org/10.1016/j.atmosenv.2006.05.055, 2006.
Walters, W. W., Goodwin, S. R., and Michalski, G.: Nitrogen stable isotope composition (δ15N) of vehicle-emitted NOx, Environ. Sci. Technol., 49, 2278–2285, https://doi.org/10.1021/es505580v, 2015a.
Walters, W. W., Tharp, B. D., Fang, H., Kozak, B. J., and Michalski, G.: Nitrogen isotope composition of thermally produced NOx from various fossil-fuel combustion sources, Environ. Sci. Technol., 49, 11363–11371, https://doi.org/10.1021/acs.est.5b02769, 2015b.
Wan, Z., Ji, S., Liu, Y., Zhang, Q., Chen, J., and Wang, Q.: Shipping emission inventories in China's Bohai Bay, Yangtze River Delta, and Pearl River Delta in 2018, Mar. Pollut. Bull., 151, https://doi.org/10.1016/j.marpolbul.2019.110882, 2020.
Wang, C., Hao, L., Ma, D., Ding, Y., Lv, L., Zhang, M., Wang, H., Tan, J., Wang, X., and Ge, Y.: Analysis of ship emission characteristics under real-world conditions in China, Ocean Eng., 194, 106615, https://doi.org/10.1016/j.oceaneng.2019.106615, 2019.
Wang, Z., Zhang, W., Peng, C., Liu, Y., and Qin, C.: Study on Characteristics of Ship Emissions from Surrounding China Seas, Energ. Conserv. Environ. Prot. Transp., 14, 11–15, https://doi.org/10.3969/j.issn.1673-6478.2018.01.004, 2018.
Wei, M., Pan, F., Wang, Y., and Du, L.: Review of World Shipping Market in 2021 and Prospects in 2022, Ship & Boat, 33, 1–18, https://doi.org/10.19423/j.cnki.31-1561/u.2022.01.001, 2022.
Yang, Y. and Zhou, B.: Review of world shipbuilding market in 2001, Ship & Boat, 13, 5–10, 2002.
Yin, M. J., Guan, H., Luo, L., Xiao, H. Y., and Zhang, Z. Y.: Using nitrogen and oxygen stable isotopes to analyze the major NOx sources to nitrate of PM2.5 in Lanzhou, northwest China, in winter-spring periods, Atmos. Environ., 276, 119036, https://doi.org/10.1016/j.atmosenv.2022.119036, 2022.
Yu, Z. and Elliott, E. M.: Novel method for nitrogen isotopic analysis of soil-emitted nitric oxide, Environ. Sci. Technol., 51, 6268–6278, https://doi.org/10.1021/acs.est.7b00592, 2017.
Zhang, F., Chen, Y., Chen, Q., Feng, Y., Shang, Y., Yang, X., Gao, H., Tian, C., Li, J., Zhang, G., Matthias, V., and Xie, Z.: Real-world emission factors of gaseous and particulate pollutants from marine fishing boats and their total emissions in China, Environ. Sci. Technol., 52, 4910–4919, https://doi.org/10.1021/acs.est.7b04002, 2018.
Zhang, Z., Zheng, N., Zhang, D., Xiao, H., Cao, Y., and Xiao, H.: Rayleigh based concept to track NOx emission sources in urban areas of China, Sci. Total Environ., 704, 135362, https://doi.org/10.1016/j.scitotenv.2019.135362, 2020.
Zhao, J., Zhang, Y., Yang, Z., Liu, Y., Peng, S., Hong, N., Hu, J., Wang, T., and Mao, H.: A comprehensive study of particulate and gaseous emissions characterization from an ocean-going cargo vessel under different operating conditions, Atmos. Environ., 223, 117286, https://doi.org/10.1016/j.atmosenv.2020.117286, 2020.
Zhou, B., Meng, X., and Yang, Y.: Analysis of world ship market in 2003 and its future, Ship & Boat, 15, 5–10, 2004.
Zhu, Y. C., Zhou, S. Q., Li, H. W., Luo, L., Wang, F. H., Bao, Y., and Chen, Y.: Formation pathways and sources of size-segregated nitrate aerosols in a megacity identified by dual isotopes, Atmos. Environ., 264, 118708, https://doi.org/10.1016/j.atmosenv.2021.118708, 2021.
Zong, Z., Wang, X., Tian, C., Chen, Y., Fang, Y., Zhang, F., Li, C., Sun, J., Li, J., and Zhang, G.: First assessment of NOx sources at a regional background site in North China using isotopic analysis linked with modeling, Environ. Sci. Technol., 51, 5923–5931, https://doi.org/10.1021/acs.est.6b06316, 2017.
Zong, Z., Sun, Z., Xiao, L., Tian, C., Liu, J., Sha, Q., Li, J., Fang, Y., Zheng, J., and Zhang, G.: Insight into the variability of the nitrogen isotope composition of vehicular NOx in China, Environ. Sci. Technol., 54, 14246–14253, https://doi.org/10.1021/acs.est.0c04749, 2020a.
Zong, Z., Tan, Y., Wang, X., Tian, C., Li, J., Fang, Y., Chen, Y., Cui, S., and Zhang, G.: Dual-modelling-based source apportionment of NOx in five Chinese megacities: Providing the isotopic footprint from 2013 to 2014, Environ. Int., 137, 105592, https://doi.org/10.1016/j.envint.2020.105592, 2020b.
Zong, Z., Shi, X., Sun, Z., Tian, C., Li, J., Fang, Y., Gao, H., and Zhang, G.: Nitrogen isotopic composition of NOx from residential biomass burning and coal combustion in North China, Environ. Pollut., 304, 119238–119238, https://doi.org/10.1016/j.envpol.2022.119238, 2022.