the Creative Commons Attribution 4.0 License.
the Creative Commons Attribution 4.0 License.
 | 10 Oct 2023
Characterizing water-soluble brown carbon in fine particles in four typical cities in northwestern China during wintertime: integrating optical properties with chemical processes
Miao Zhong
Jianzhong Xu
Huiqin Wang
Li Gao
Haixia Zhu
Lixiang Zhai
Xinghua Zhang
Wenhui Zhao
Brown carbon (BrC) aerosol could impact atmospheric radiative forcing and play a crucial role in atmospheric photochemistry. In this study, fine particulate matter (PM2.5) filter samples were collected synchronously in four major cities in northwestern China during the winter season (December 2019–January 2020): Lanzhou (LZ), Xining (XN), Yinchuan (YC), and Ürümqi (UR), which are represented as energy-producing and heavy manufacturing cities in China. The primary aim of the study is to explore the optical properties, sources, and chemical processes of water-soluble BrC (WS-BrC). The average mass absorption efficiency at 365 nm (MAE365) of WS-BrC at these four cities was 1.24 ± 0.19 m2 g−1 (XN), 1.19 ± 0.12 m2 g−1 (LZ), 1.07 ± 0.23 m2 g−1 (YC), and 0.78 ± 0.16 m2 g−1 (UR). The properties of WS-BrC were further investigated by an acid–base titration experiment. The results showed that the MAE365 values in all cities increased with higher pH values (2–11), while the fluorescence intensities of water extracts fluctuated with pH values, being stronger under both highly acidic and basic conditions. The sensitivity to pH variation was most pronounced in the WS-BrC samples from YC and LZ, indicating the important contribution of acid or base functional group compounds in these locations. Additionally, the study revealed significant photo-enhancement (LZ) or photo-bleaching (YC and UR) phenomena of WS-BrC in different cities. These results suggest that the sources and/or chemical processes of WS-BrC varied among the cities.
The sources and chemical processes of WS-BrC were further explored by a combination of parallel factor analysis (PARAFAC) on excitation–emission matrix (EEM) spectra of WS-BrC and positive matrix factorization analysis (PMF) on high-resolution mass spectra of water-soluble organic aerosol (WSOA). Six PARAFAC components were identified, including three humic-like substances (HULIS; two less oxygenated (LO) HULIS and one highly oxygenated (HO) HULIS), two protein-like or phenol-like substances (PLS), and one undefined substance. Four PMF factors were identified, including a water-soluble primary OA (WS-POA), a less oxidized oxygenated OA associated with coal combustion-induced WSOA (LO-OOA), and two highly oxidized oxygenated OAs resulting from photochemical oxidation and aqueous-phase oxidation transformations (HO-OOA1 and HO-OOA2). WS-POA was determined to be the most significant source of light absorption, accounting for 30 %–60 % based on multiple linear regression models, and it showed a significant correlation with PLS and LO-HULIS components. The loss of light absorption of WS-POA was found to occur through its conversion to LO-OOA and HO-OOAs through photochemical or aqueous reactions, with HO-OOAs being significantly correlated with the HO-HULIS component. These processes can be clearly illustrated by integrating optical properties and chemical composition using a Van Krevelen diagram and an EEM plot.
- Article
(5845 KB) - Full-text XML
-
Supplement
(781 KB) - BibTeX
- EndNote


Brown carbon (BrC) is a certain fraction of organic aerosols that absorb light in the ultraviolet and visible (UV-Vis) ranges (Andreae and Gelencsér, 2006; Laskin et al., 2015). The light absorption of BrC displays a strong wavelength dependence, which can be characterized by a higher value (≥ 2) of the absorption Ångström exponent (AAE) (Laskin et al., 2015). The significant effects of BrC on climate and atmospheric chemistry have been characterized previously. Wang et al. (2018) estimate the global mean absorption direct radiative effect (DRE) of BrC is +0.048 W m−2 using the GEOS-Chem chemical transport model. The absorption of solar radiation due to BrC can also affect the formation of ozone and radicals of •OH •HO2 and corresponding atmospheric chemical reactions (Mok et al., 2016; Baylon et al., 2018).
Biomass combustion is a major global source of primary BrC, as biomass is widely used for residential heating and cooking and is also produced during wildfires (Washenfelder et al., 2015; Lin et al., 2017; Zeng et al., 2020). Coal combustion is another important source of primary BrC, particularly in urban areas during the winter heating period (Tan et al., 2016; Hu et al., 2020; Yuan et al., 2021; Deng et al., 2022). In addition to primary sources, secondary BrC is formed through various reaction pathways, such as gas-phase photo-oxidation of aromatic volatile organic compounds (VOCs) and nighttime aqueous-phase formation of aromatic nitration products in the atmospheric condensed phase (Lin et al., 2015; Vidovic et al., 2018; Liu et al., 2019). The chemical compositions and light absorption of BrC can vary significantly due to atmospheric aging. For instance, BrC can be photo-bleached through photolysis reactions in the presence of •OH radical and O3 or darken via the formation of nitrated organic compounds (Lin et al., 2015; Zhao et al., 2015; Moise et al., 2015; C. Li et al., 2020). Furthermore, atmospheric conditions such as changes in pH, air temperature, and relative humidity can affect the light absorption characteristics of BrC (Song et al., 2013; Moise et al., 2015; Phillips et al., 2017; Qin et al., 2020).
The solvent extracts from filter samples have been widely used to assess the absorbing properties of BrC (Zhang et al., 2017; Wu et al., 2019; Xu et al., 2020b; Zou et al., 2023). Water-soluble BrC is only a portion of BrC and accounts for approximately half of the total light absorption by solvent-extractable organic aerosols in urban areas (Cheng et al., 2017; Huang et al., 2018; Y. Chen et al., 2020) and exceeds half and even up to 90 % of the total in remote areas (Zhu et al., 2018; Li et al., 2022). The aerosol extracts are measured offline using a UV-Vis spectrometer to determine the light absorption of BrC (Hecobian et al., 2010). Excitation–emission matrix spectroscopy (EEMs) was recently used to reveal similar chemical structures and photochemical features and to trace the sources of BrC chromophores (Chen et al., 2016; Tang et al., 2020). A few recent studies have characterized BrC compounds by combining high-resolution mass spectrometry and UV-Vis spectroscopy (Lin et al., 2017; Wang et al., 2019; Huang et al., 2020; Ni et al., 2021), which facilitates the assessment of the chemical composition of BrC chromophores at the molecular level. Recent studies have identified the major water-soluble BrC species, including humic-like substances, phenols, nitroaromatics, and oxygenated aromatics (Cai et al., 2020; Qin et al., 2022a; Jiang et al., 2022; Zhou et al., 2022).
In recent years, cities in northwestern China have experienced more severe air pollution due to rapid economic development and intensive anthropogenic activities, especially in the major cities of this region. Despite previous research on the chemical compositions and source apportionment of atmospheric aerosols (Xu et al., 2014, 2016; Tan et al., 2016; Xu et al., 2020a; Zhang et al., 2021a), the current understanding of the optical properties and formation mechanisms of brown carbon over northwestern China is quite limited and deserves more attention. This study aims to characterize the optical properties of water-soluble BrC (WS-BrC) by collecting PM2.5 filter samples from four major cities in northwestern China and analyzing them using a suite of instruments. In particular, the study focused on the contribution of primary and secondary sources of atmospheric water-soluble chromophores and the related chemical processes. This objective could be accomplished by combining data from excitation–emission matrices (EEMs) spectroscopy and high-resolution aerosol mass spectrometry (HR-AMS).
2.1 Filter samples collection at the four cities
PM2.5 filter samples were collected synchronously from four major cities in northwestern China, namely Yinchuan (YC), Xining (XN), Ürümqi (UR), and Lanzhou (LZ), from 5 December 2019 to 20 January 2020 (Fig. 1). The sampling sites were located on building rooftops and situated within the cultural and educational districts of each city, away from significant pollution sources. Filter samples were collected by a mid-volume PM2.5 sampler (Laoying Ltd., model 2030) with a flow rate of 100 L min−1 in YC (sample IDs: 1−14), by a low-volume PM2.5 sampler (Wuhan Tianhong Instrument Co Ltd., TH-16E) with a flow rate of 16.7 L min−1 in XN and UR (sample IDs: 15–28 and IDs: 29–42), and by a low-volume aerosol sampler (BGI, model PQ 200) with a flow rate of 16.7 L min−1 in LZ (sample IDs: 43–56). Fine particles were collected onto quartz filters with a 90 nm diameter (Whatman, UK) in YC and with a 45 nm diameter (PALL Life Sciences, USA) in other cities, which had pre-baked at 550 ∘C for 5 h to eliminate carbonaceous particles. Blank filter samples were obtained from each site by leaving the filters in the sampler for 10 min without sampling. Each filter was wrapped in aluminum foil and frozen at −20 ∘C until analysis. The daily average concentrations of PM2.5, SO2, NO2, CO, O3, and meteorological data (air temperature and relative humidity) were obtained from the nearest station of the National Environmental Monitoring Net sites (http://www.cnemc.cn/, last access: 11 November 2020) for comparison. Figure 1 also illustrates the energy consumption structure of industrial enterprises in four cities, with YC, UR, and LZ being energy production cities and XN being a heavy manufacturing city (Shan et al., 2018). The energy consumption data for 2019 was obtained from the Statistical Yearbook sharing platform (https://www.yearbookchina.com/, last access: 12 October 2021).
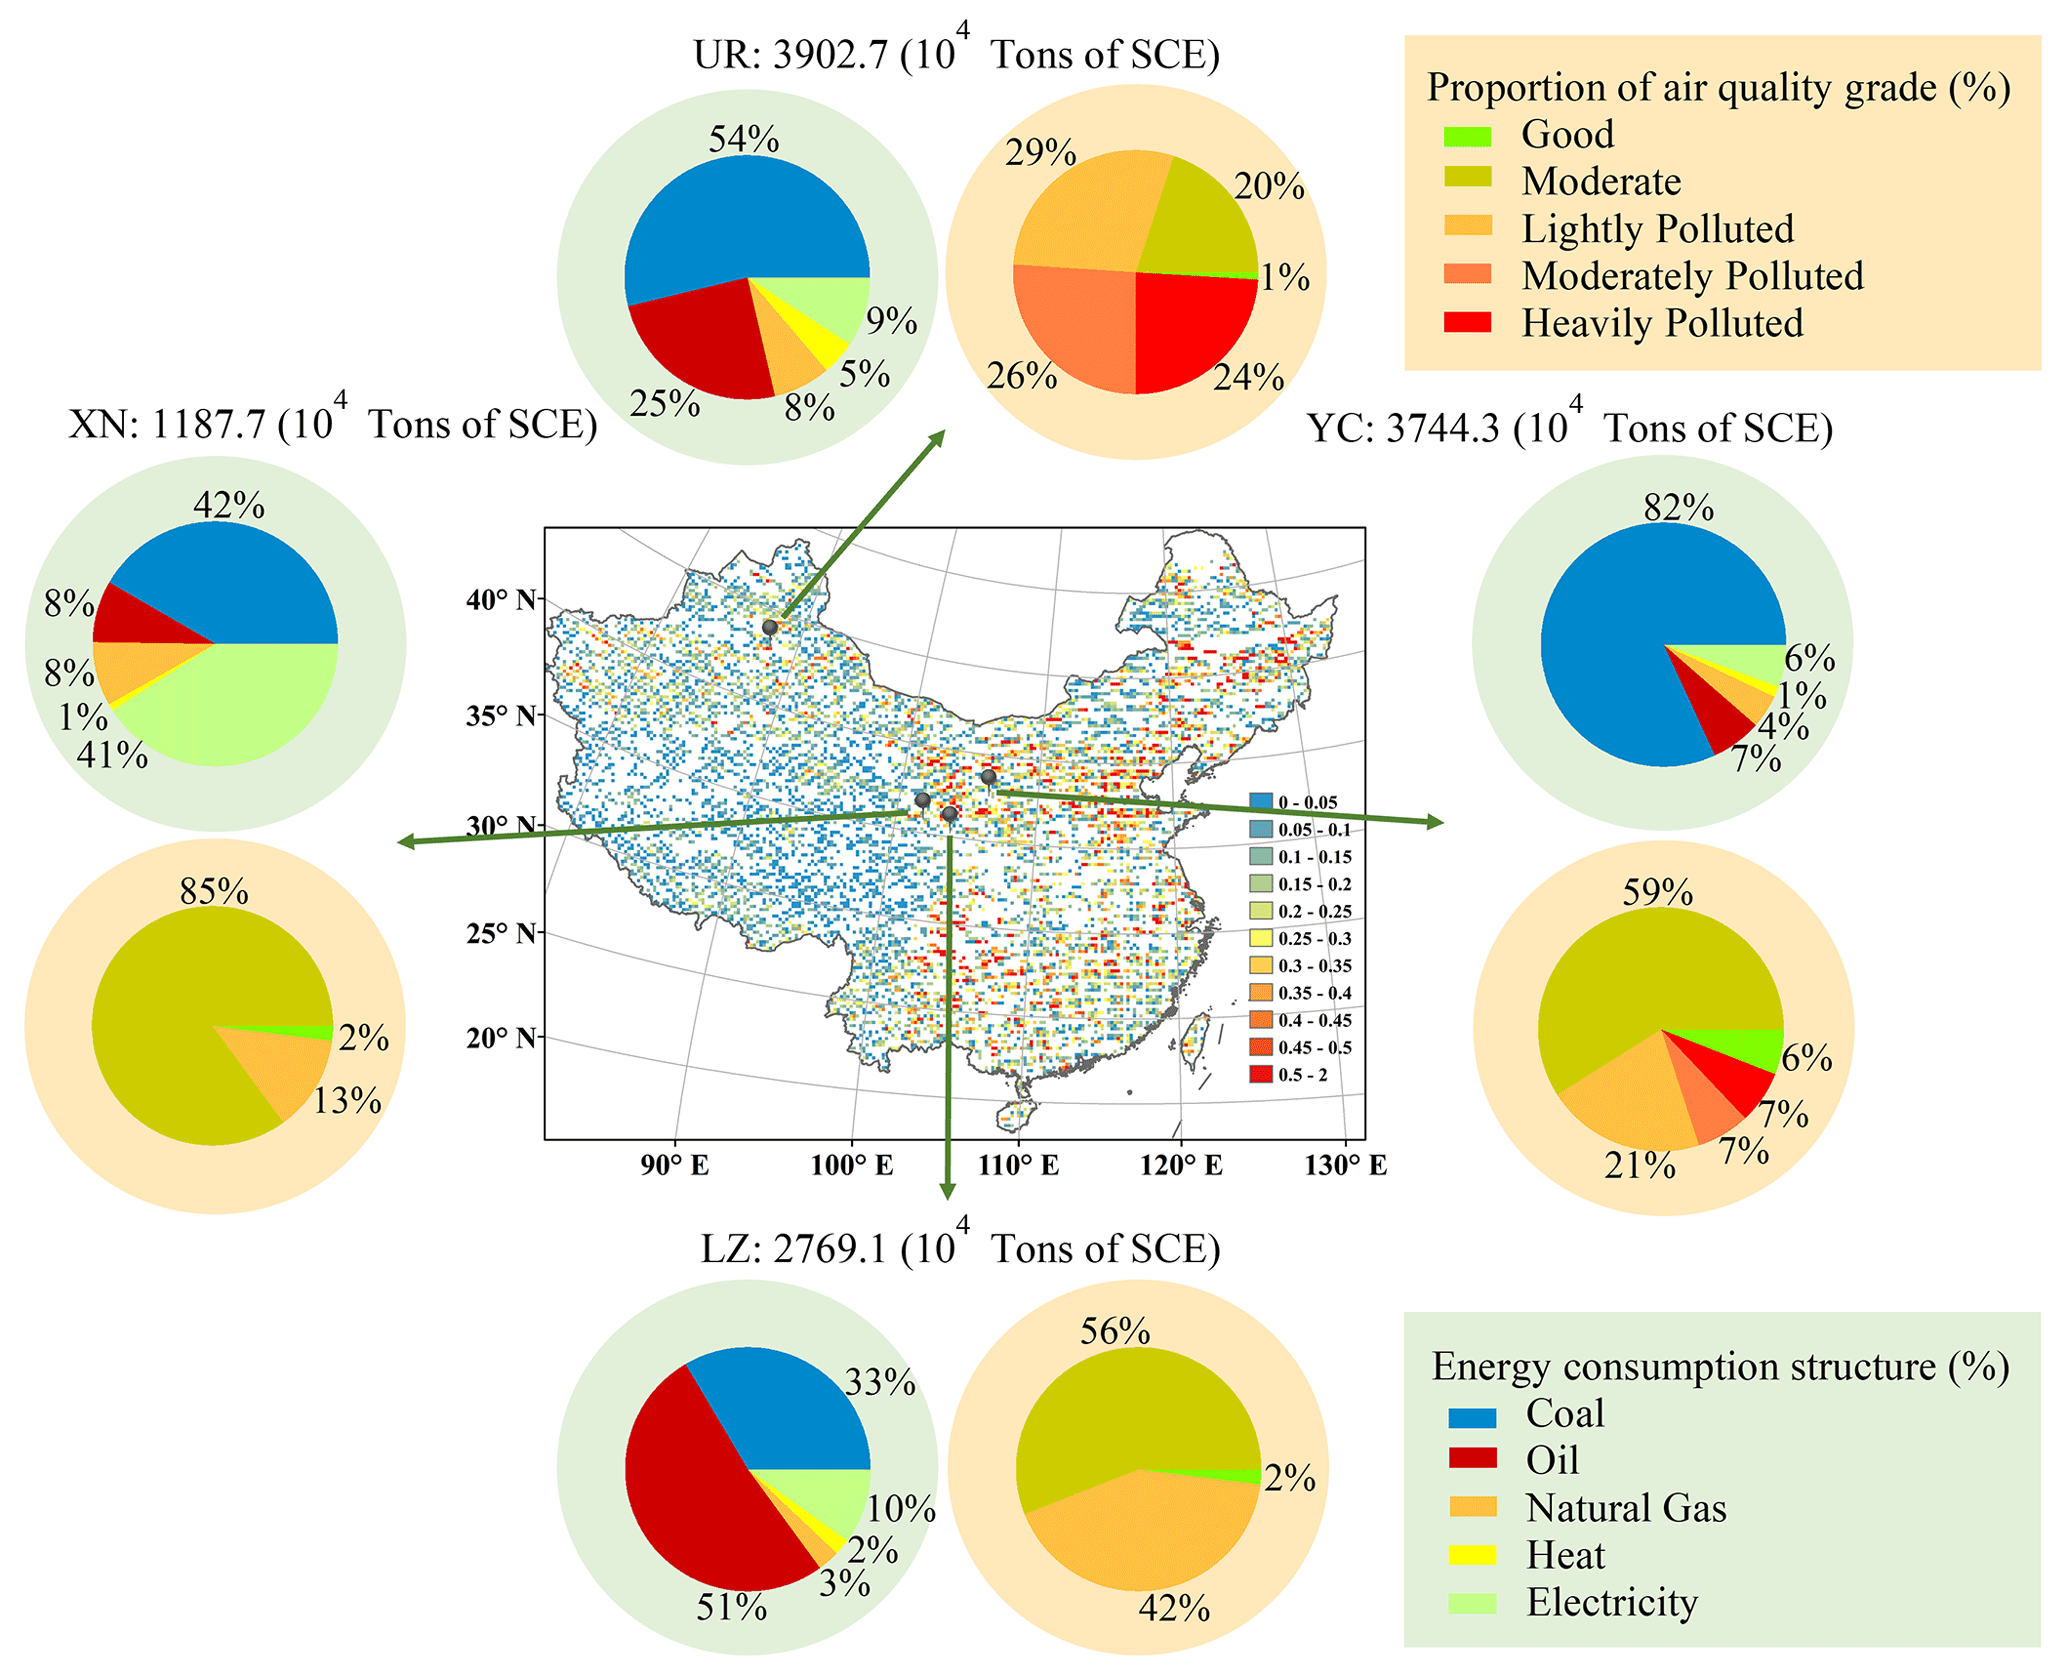
Figure 1Location map for the sampling sites in this study and the corresponding energy structure in each city and air quality in each city during 2019. The locations of the four cities are also shown the spatial variation of SO2 concentration in China (resolution of 0.25∘ × 0.25∘), retrieved from OMI satellite data during the period from 1 December 2019 to 31 January 2020 (http://www.satdatafresh.com/, last access: 22 March 2022). Pie charts around the map show the energy consumption structure of industrial enterprises above the designated size during 2019 (China Energy Statistical Yearbook) and the proportion of urban air quality grades during the sampling period at YC, XN, UR, and LZ (https://www.zq12369.com/, last access: 28 March 2022), respectively. Publisher's remark: please note that the above figure contains disputed territories.
2.2 Chemical analysis
The chemical components of the samples were analyzed using multiple instruments. Firstly, a piece of each filter (0.50 cm2) was analyzed for organic carbon (OC) and elemental carbon (EC) contents using a thermal/optical carbon analyzer (DRI Model 2015A, Desert Research Institute, USA) with the IMPROVE-A method (Chow et al., 2007). A quarter of each filter from YC and half of each filter from other cities was extracted in 30 mL of Milli-Q water (18.2 MΩ cm) using an ultrasonic bath for 40 min. Ice was added to the ultrasonic bath to minimize chemical reactions and evaporation loss during sonication. Water-insoluble residuals were eliminated by filtering extracts via a 0.45 µm PTFE syringe filter (Pall Life Sciences, USA). The concentrations of water-soluble inorganic ions (WSIIs) (Cl−, NO, SO, NH, Na+, K+, Ca2+, and Mg2+) were analyzed using two 881 compact ion chromatography systems (Metrohm, Herisau, Switzerland). The operation details can be found elsewhere (Xu et al., 2015). Water-soluble organic carbon (WSOC) was analyzed using a total organic carbon (TOC) analyzer (Elementar Vario TOC cube, Hanau, Germany) with the method of total inorganic carbon (TIC) subtracted from total carbon (TC) (Xu et al., 2015; Zhang et al., 2017).
2.3 Analysis by ultraviolet-visible absorption spectroscopy
The absorption spectra of water extracts in the 200–700 nm wavelength range were obtained using a UV-Vis absorption spectrophotometer (UV-2700; Shimadzu, Kyoto, Japan) at 1 nm intervals with Milli-Q water as the reference. The absorption spectra were corrected by subtracting the average absorbance between 690 and 700 nm (A700) from the absorbance at wavelength λ.
The light absorption coefficient at a given wavelength (Absλ, M m−1) of water extracts is calculated as follows:
where Aλ is the absorbance at wavelength λ, Vl is the extract volume (30 mL), Va is the volume of air passing through the filter, and l is the optical path length, 5 cm.
The mass absorption efficiency (MAEλ, m2 g−1) of water extracts can be derived as follows:
where CWSOC represents the mass concentration of WSOC in the extract. For simplicity, the absorption at 360–370 nm (mean 365 nm) is used to characterize the absorption of BrC (Hecobian et al., 2010).
The spectral dependence of light absorption fits a power law as follows:
where K is a constant related to light absorption, and the absorption Ångström exponent (AAE) can be fitted at the range of 300–400 nm.
The imaginary part k of the particle refractive index represents the light absorption by aerosols and can be calculated as follows (Liu et al., 2013):
where ρ (g cm−3) is estimated as ρ= (12 + H C + 16 × O C) (7 + 5 × H C + 4.15 × O C) (Kuwata et al., 2012).
The direct radiative forcing of WS-BrC is estimated by the simple forcing efficiency (SFE) model. The wavelength-dependent SFEAbs (W g−1) of WS-BrC is calculated using the following equation (Bikkina and Sarin, 2019):
where S(λ) represents the wavelength-dependent solar irradiance obtained from ASTM G173–03 reference spectra. Additionally, τatm refers to atmospheric transmission (0.79); D is assigned the value of 0.5, representing the proportion of daylight hours; FC is set to 0.6, representing the cloud proportion; and αs is fixed at 0.19 for the global average, representing the surface albedo (Chen and Bond, 2010).
2.4 EEM fluorescence spectra analysis
The three-dimensional excitation–emission matrix spectroscopy (EEMs) of the samples were obtained using an F-7100 fluorescence spectrometer (Hitachi High-Technologies, Japan). The EEMs were measured in the range of 200 to 400 nm with 5 nm intervals for excitation and 250 to 550 nm with 1 nm intervals for emission. The inner filter effect was reduced by diluting the extracts until their absorbance was below 0.1 at 254 nm (Ohno, 2002). The original EEMs were processed in the following way: (1) subtracting the Milli-Q water spectrum to reduce background influence, (2) interpolating to eliminate the interference signals of the Rayleigh scattered light, and (3) adjusting the fluorescence intensity by dividing the Raman peak area of Milli-Q water at Ex of 350 nm to remove instrument dependency (Lawaetz and Stedmon, 2009).
The obtained corrected fluorescence intensity in Raman units (RU) were further processed using parallel factor analysis (PARAFAC) to group potentially similar chemical components. This process was conducted using the MATLAB 2016b software combined with the DOMFluor and drEEM toolboxes (Murphy et al., 2013). The 6-component model was eventually chosen from 2- to 10-component PARAFAC models because the residual errors decreased markedly when the number of components increased from 2 to 6 (Supplement Fig. S1). In addition, the 6-component model has reasonable spectra for each fluorescent component.
Furthermore, the fluorescence properties of the water extracts were examined through the fluorescence indices. The humification index (HIX) was calculated by the ratio of the integrated fluorescence emission intensity in the region of 435–480 to 300–345 nm under the excitation wavelength of 255 nm. The biological index (BIX) was calculated by the ratio of the emission intensity of 380 to 430 nm under the excitation wavelength of 310 nm (Zsolnay et al., 1999; Mcknight et al., 2001; Y. Yang et al., 2020). The average fluorescence intensities (AFIs) can be calculated in the region of 200–400 nm for excitation wavelengths and 250–550 nm for emission wavelengths.
The apparent fluorescence quantum yields (AQYs) can be calculated as follows:
where FI represents the fluorescence intensity (RU) at each excitation (200–400 nm) and emission (250–550 nm) wavelength.
2.5 The pH titration experiment
To investigate the variation in light-absorbing and fluorescent properties of ambient aerosols under the influence of pH, we selected samples with higher water-soluble organic aerosol (WSOA) concentrations at each city and recorded their UV-Vis absorption and fluorescence spectra at different pH settings. The water extracts were adjusted to pH 2 using 2 M HCl and then titrated with 0.1 M NaOH to different pH values until the pH reached 11, as measured by a pH meter (Orion Star A111, Thermo Fisher Scientific, Waltham, MA, USA). The pH meter was calibrated with buffer solutions of pH 4.01, 7.00, and 10.01 during the measurement.
2.6 HR-AMS measurements
Offline measurements by high-resolution time-of-flight aerosol mass spectrometry (HR-AMS) were conducted to analyze the ion group, elemental ratio, and oxidation properties of WSOA. Each sample was atomized with argon (purity: 99.9999 %) to eliminate interference from CO2 in the air. The generated aerosol was passed through a silica gel diffusion dryer to remove water vapors, and the aerosol particles were then sampled into an HR-AMS instrument (Aerodyne Inc., Billerica, MA, USA) through an aerodynamic lens inlet. The HR-AMS was operated in both V- and W-mode. Deionized water was aerosolized and analyzed in the same procedures between every two samples. Elemental ratios, including O C, H C, N C, and OM OC, were determined based on high-resolution mass spectra ( up to 120) and the improved ambient (I-A) method (Canagaratna et al., 2015). The elemental contributions of C, O, H, and N reported are mass based, and more details can be found elsewhere (Xu et al., 2013). Positive matrix factorization (PMF) was performed on high-resolution mass spectra of WSOA at four cities to identify the potential source factors of WSOA, and four factors were ultimately decomposed. A detailed description of PMF can be found in Zhao et al. (2022).
In addition, the mass concentration of WSOA can be calculated as follows:
3.1 Overview of the field observations
Figure 2 presents an overview of the time series of meteorological conditions (air temperature, relative humidity (RH), and precipitation), Abs365, and AFI and the mass concentrations of WSIIs, WSOA, and EC in the four cities. The weather during the study was generally sunny, cold, and dry (Fig. 2a). For instance, the average (±1σ) daily air temperature was −3.2 ± 3.4 ∘C at YC, −4.4 ± 2.2 ∘C at XN, −9.2 ± 3.7 ∘C at UR, and −3.8 ± 2.5 ∘C at LZ, and the average (±1σ) RH was 62.4 ± 15.8 % at YC, 56.1 ± 14.7 % at XN, and 58.1 ± 9.7 % at LZ. At UR, there were relatively high RH conditions (83.9 ± 6.6 %), and frequent foggy weather and two snowfall events were observed, mainly due to the invasion of cold and wet air mass from the Arctic Ocean during winter (H. Yang et al., 2020). Both the cold and wet and cold and dry weather conditions in our study facilitated the study of different chemical processes.
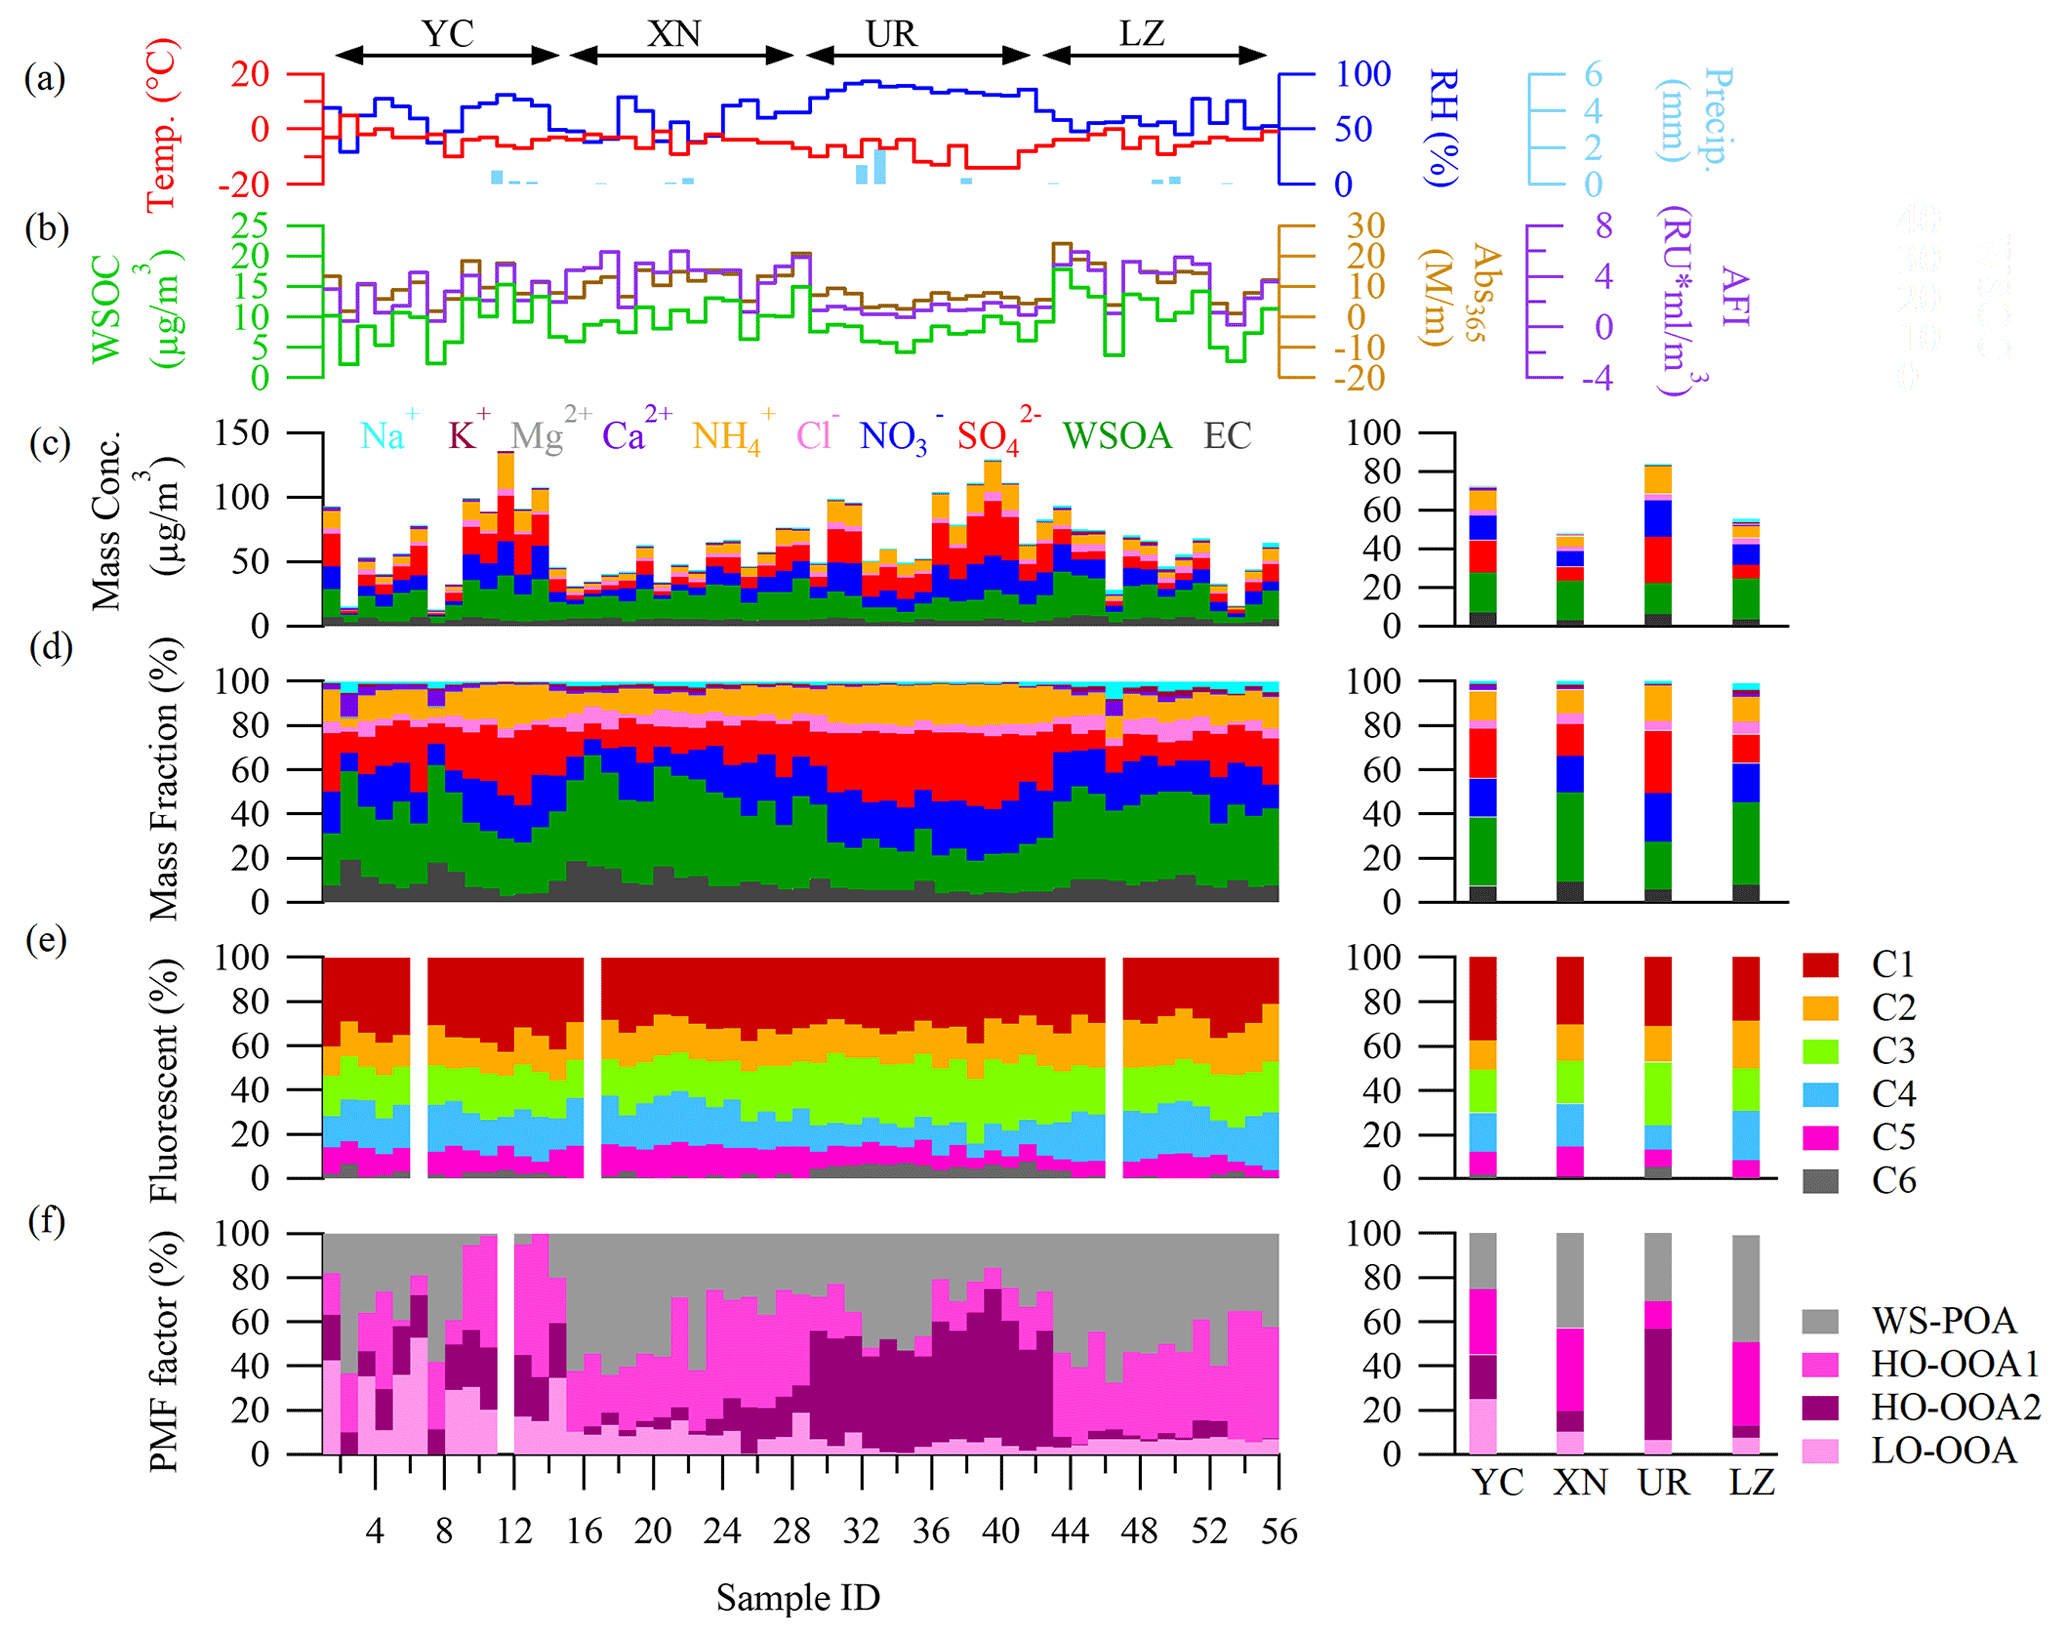
Figure 2Summary of meteorological and aerosol species data. (a) Meteorological conditions during the sampling, including air temperature, relative humidity, and precipitation. (b) WSOC concentrations, the light-absorption (Abs), and average fluorescence intensity (AFI) of WSOA. (c) The concentrations of total identified species (WSIIs, WSOA, and EC). (d) The relative abundance of total identified species. (e) The relative abundances of the identified six fluorescent components by PARAFAC analysis. (f) Mass contributions of the factors resolved by PMF analysis on WSOA.
The mass concentrations of chemical species of PM2.5, as well as their mass fractions, varied dynamically during the sampling period in four cities (Fig. 2c and d). Heavy pollution (the daily average PM2.5 mass concentration higher than 150 µg m−3) occurred frequently in UR, followed by YC (Fig. 1). These heavy-pollution events, such as samples 10–13 and 36–40, commonly occurred under high RH conditions (Fig. 2a and c), which were favorable for the secondary generation of atmospheric particulate matter (Sun et al., 2013). Therefore, the contribution of secondary inorganic ions (SNA: sulfate + nitrate + ammonium) showed an important contribution to the reconstructed PM2.5 mass (WSOA + EC + WSIIs) with an average of 53.0 ± 12.7 %, 41.6 ± 11.5 %, 67.3 ± 7.8 %, and 41.8 ± 7.3 %, respectively, in YC, XN, UR, and LZ, and could be as high as 65.6 %–76.9 % during heavy-pollution periods at YC and UR (Fig. 2d). WSOA was also a major component of PM2.5, accounting for 31.4 ± 5.5 %, 40.6 ± 5.4 %, 21.8 ± 4.6 %, and 37.7 ± 4.1 % at YC, XN, UR, and LZ, respectively. The mass contribution of EC was comparable in four cities (5.8 %–8.9 %). The higher contribution of SNA at YC and UR, in contrast with the higher contribution of WSOA at XN and LZ, likely suggested their different sources and chemical processes. The contributions of WSOA and SNA at XN and LZ in our study were comparable with those in Xi'an, another megacity in northwestern China, during wintertime (Huang et al., 2014), while YC and UR showed greater similarity with cities in eastern China, such as Beijing, Tianjin, and Jinan, where there are relatively wet conditions during wintertime (Lei et al., 2021; Y. Zhang et al., 2021; Dao et al., 2022).
The ratio of WSOC OC is commonly used to predict the potential contribution of secondary organic aerosol to total organic aerosol (Psichoudaki and Pandis, 2013). Overall, WSOC showed a strong correlation with OC (R2= 0.84) with a linear slope of 0.55 for all samples from four cities (Fig. S3). The slope values varied among the cities, with YC and UR having higher values (0.61 and 0.59) than XN and LZ (0.54 and 0.52), suggesting a potentially higher secondary OA formation in YC and UR. The WSOC OC values in our study were within the range reported in other cities during winter, such as Xi'an (0.50 and 0.53) (Zhang et al., 2018; Liu et al., 2020), Beijing (0.54) (Ni et al., 2022), and Guangzhou (0.55) (Tao et al., 2022). Significant correlations among WSOC, OC, EC, Cl−, K+, and SNA were found in four cities, indicating the primary and secondary sources of water-soluble organic compounds (Fig. S2, Table S3 in the Supplement). Furthermore, the Abs365 and AFI values varied with WSOC concentration, and we observed significant correlation between them ( 0.87; 0.61). These findings suggest an important contribution of WS-BrC chromophores to WSOC.
3.2 Bulk optical properties of WS-BrC
Figure 3a presents the average MAE spectra of WSOA from various cities. XN and LZ exhibited significantly higher MAE365 values (1.22 ± 0.18 and 1.19 ± 0.12 m2 g−1) compared to YC (1.02 ± 0.23 m2 g−1) and UR (0.78 ± 0.16 m2 g−1) (t test, P < 0.01) (Table 1). When compared with previous studies during wintertime, the MAE365 values in XN and LZ were comparable to those in Beijing (1.21–1.26) (Du et al., 2014; Cheng et al., 2016; J. Li et al., 2020); the MAE365 values in YC were close to those in Guangzhou (0.93 ± 0.06 m2 g−1) and in Nanjing (1.04 m2 g−1) (Fan et al., 2016; Chen et al., 2018); and the MAE365 values in UR were similar to those in Yangzhou (0.75 ± 0.29 m2 g−1) (Y. Chen et al., 2020). In addition, the imaginary refractive index at 365 nm (k365) for WS-BrC showed the same trend as MAE365, i.e., XN (0.034 ± 0.007) > LZ (0.031 ± 0.007) > YC (0.029 ± 0.009) > UR (0.023 ± 0.007) (Table 1). Overall, the k365 values in this study were comparable to those reported in other urban areas, such as Kanpur in central India during winter (0.042) (Choudhary et al., 2021) and Jinan in northern China during spring (0.035) (Wen et al., 2021); however, they were higher than those reported in the Himalayan cryosphere during winter (0.009–0.026) (Choudhary et al., 2022) and in the northeastern margin of Qinghai–Tibetan Plateau during summer (0.022) (J. Xu et al., 2020). Previous studies indicated that photochemical aging decreased the k values for BrC aerosols (Laskin et al., 2015; Sumlin et al., 2017).
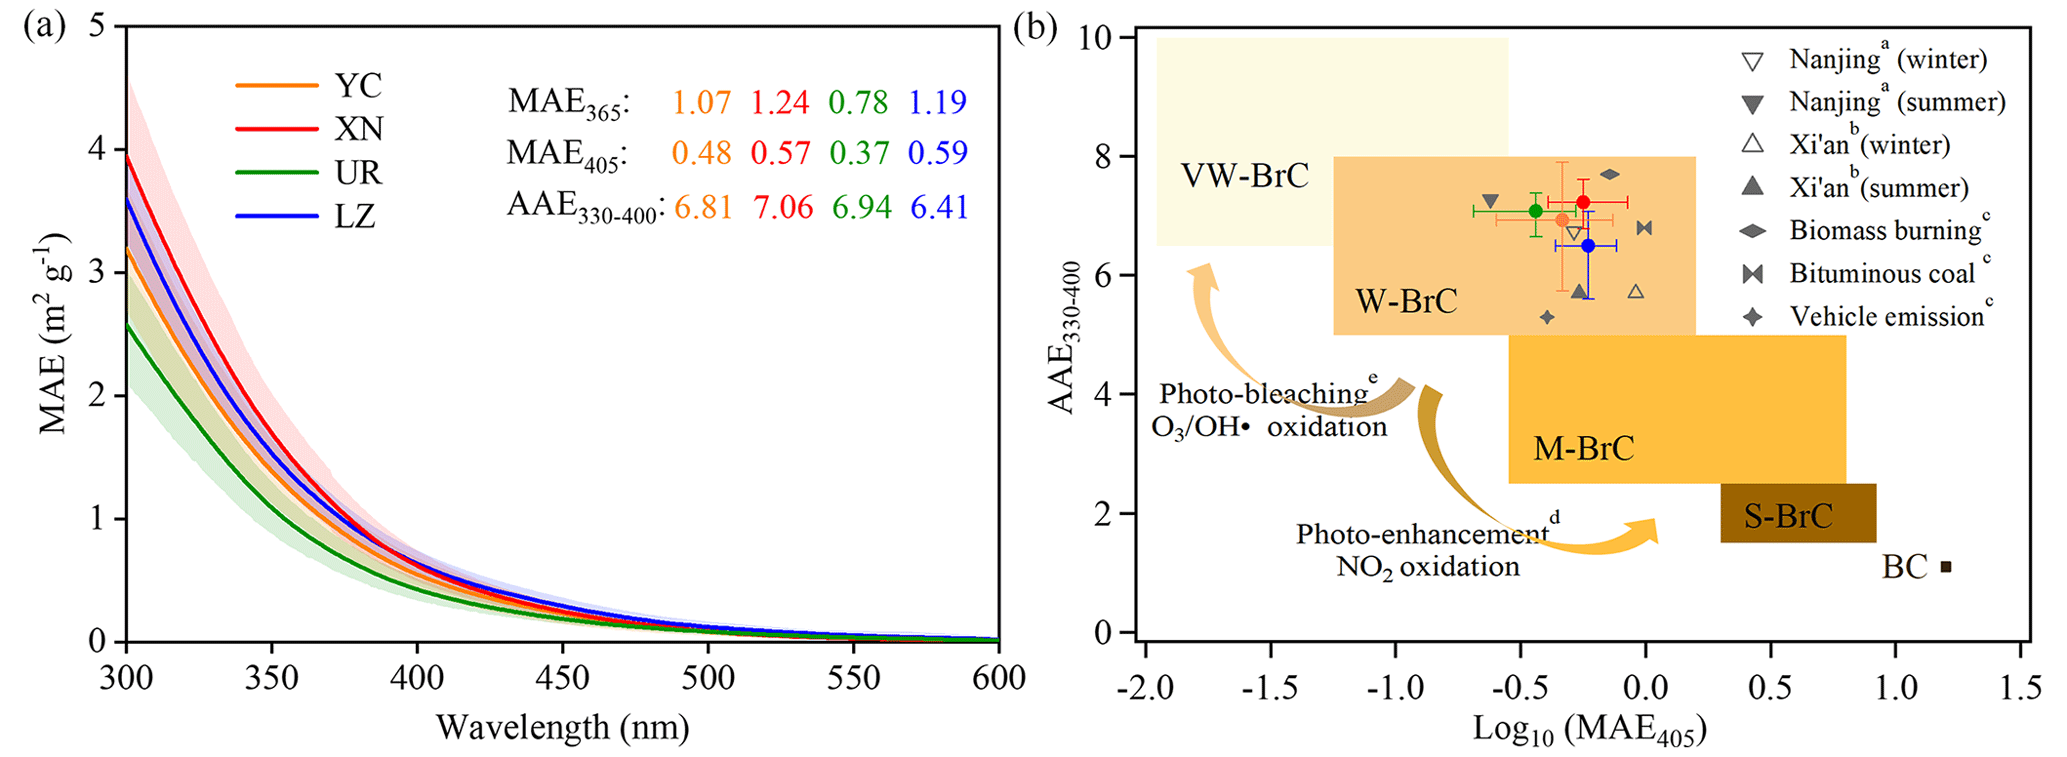
Figure 3(a) The average MAE spectrum and their standard deviations of WS-BrC in each city represented by different colors. (b) Graphical representation of the optical-based BrC classes in the log10(MAE405)-AAE space (Saleh, 2020). The shaded areas indicate very weakly (VW), weakly (W), moderately (M), and strongly (S) absorbing BrC and absorbing BC, respectively. Gray marks indicate the data from previous studies about ambient BrC aerosol, i.e., a Chen et al. (2018) b Huang et al. (2018), c Tang et al. (2020). The curve with the arrowhead displays the variation tendency of optical properties of the lab-generated BrC aerosol and aged in the presence of NO3 or O3 •OH radicals, i.e.,d C. Li et al. (2020), e Browne et al. (2019).
Table 1Light-absorbing properties of BrC in PM2.5 water extracts in four cities.
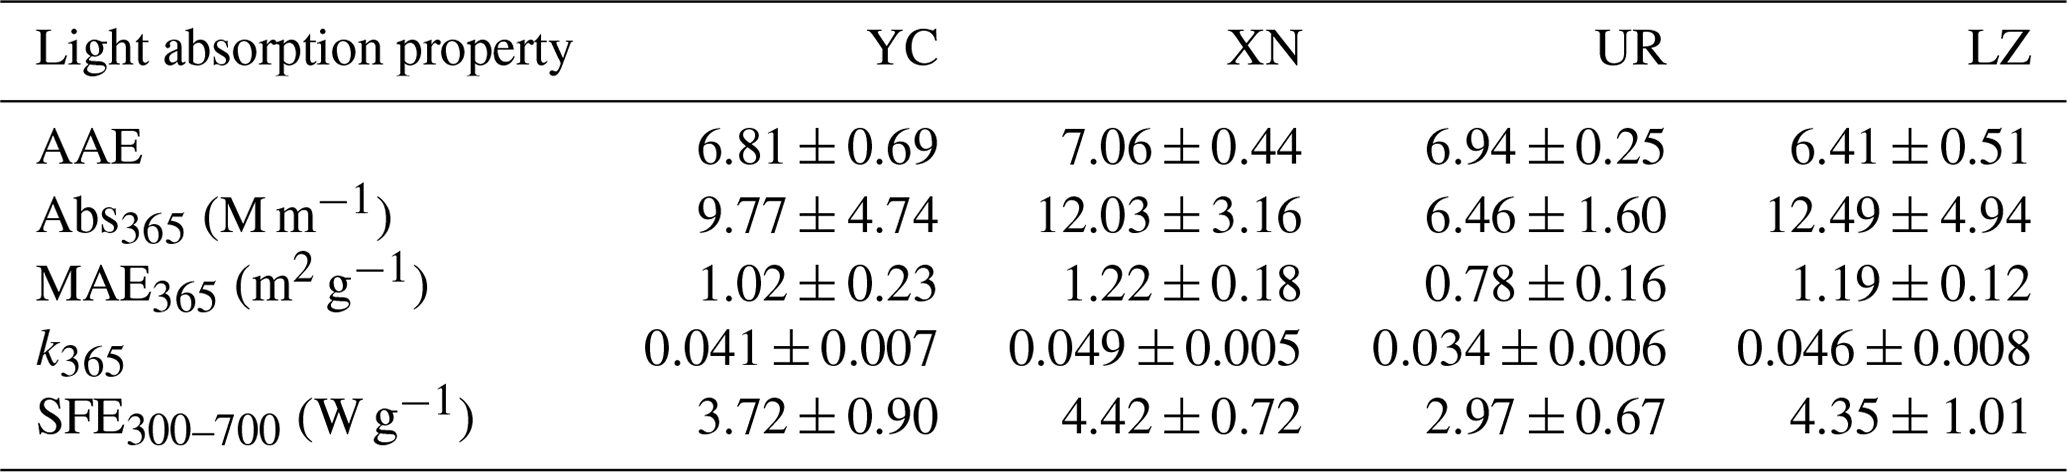
AAE denotes the wavelength dependence of light absorption of BrC, an important optical parameter that can be used to infer the chemical properties of BrC (Andreae and Gelencsér, 2006). In this study, the AAE values at YC, XN, and UR were 6.8 ± 0.7, 7.1 ± 0.4, and 6.9 ± 0.3, respectively. Significantly lower AAE was observed (6.4 ± 0.5) at LZ (t test, P < 0.01) (Table 1). Our AAE values fell within the range of values reported in other cities during winter for PM2.5 water extracts calculated in the same wavelength range, such as at Nanjing (6.8) (Chen et al., 2018), Beijing (7.3 and 7.5) (Du et al., 2014; Cheng et al., 2016), and Guangzhou (6.7 ± 0.1) (Fan et al., 2016). Previous studies have suggested that higher AAE values may be associated with primary biomass combustion emissions and/or secondary organic aerosol (SOA) formation. For instance, Chen and Bond (2010) emphasized that particles from smoldering of various wood types have higher values of 7–16. Lambe et al. (2013) indicated that secondary BrC generated in the laboratory also has a higher AAE value (5.2–8.8). Therefore, the differences in AAE values among the four cities may indicate their different sources and/or chemical compositions.
Saleh (2020) proposed an optical-based classification of BrC using the space of MAE405 vs. AAE, which is linked with their physicochemical properties (i.e., molecular sizes and solubility) and atmospheric aging (i.e., photo-enhancement or photo-bleaching). Almost all samples in this study fell into the region of W-BrC (Weakly absorptive BrC), similar to ambient samples from other studies (Zhou et al., 2021; Xu et al., 2022). However, a few samples at UR fell into the region of VW-BrC (very weakly absorptive BrC). Furthermore, the WS-BrC in YC exhibited a broader range than in other three cities, indicating multiple sources and/or processes for WS-BrC in this city. Higher AAE and MAE405 values were found in XN, which could be associated with biomass-burning emissions. Additionally, WS-BrC in LZ was the closest to the region of M-BrC (moderately absorptive BrC) among the four cities, and the different positions among them could be related to their chemical processes in each city. For instance, upon examining the relationship between MAE365 and the O C ratio, a positive correlation was observed only in LZ, while negative relationships were observed in other three cities (Fig. 10). The chemical processes of WS-BrC are discussed in detail in Sect. 3.7.
We estimated the integrated mean SFE values of WS-BrC within the 300–700 nm range (SFE300−700) due to the abrupt decrease in solar spectral energy below 300 nm and the negligible absorption of solar radiation by BrC above 700 nm. SFE300−700 was larger at XN (4.42 ± 0.72 W g−1) and LZ (4.35 ± 1.01 W g−1) than at YC (3.72 ± 0.90 W g−1) and UR (2.97 ± 0.6 W g−1) (Table 1), indicating their stronger light-absorbing capacity of WS-BrC. The SFE values in this study were similar to those in Hong Kong during winter (4.4 W g−1) (Zhang et al., 2020), slightly higher than those in Jinan during spring (3.3 W g−1) (Wen et al., 2021), but only half of those in laboratory biomass burning samples (7.7–8.3 W g−1) (Lei et al., 2018).
3.3 Fluorescence indices
Fluorescence indices, such as HIX and BIX, have been used in recent years to study the source and chemical processes of atmospheric organic aerosols (Lee et al., 2013; Fu et al., 2015; Qin et al., 2018; Deng et al., 2022). The HIX indicates the degree of humification of WSOA, and it increases significantly upon aging (Lee et al., 2013; Fan et al., 2020). The BIX is broadly in contrast with HIX and is known as the freshness index. A higher BIX value implies a higher contribution of freshly released organics, while a lower value indicates greater degrees of aging (Lee et al., 2013; Wen et al., 2021).
Table 1 shows that the HIX and BIX values were 1.85 ± 0.36 and 1.28 ± 0.14 at UR, 1.32 ± 0.23 and 1.48 ± 0.11 at YC, 1.29 ± 0.27 and 1.49 ± 0.15 at XN, and 1.16 ± 0.18 and 1.52 ± 0.11 at LZ, respectively. The highest HIX value and lowest BIX value were found in UR, indicating a higher degree of aging and oxidation of WS-BrC. On the other hand, the lower HIX and higher BIX values observed in LZ suggest a high contribution of freshly emitted BrC. These results were consistent with the results of the MAE365 discussed earlier.
The HIX exhibits a significant negative correlation with BIX across all the data (R2= 0.86, slope = 2.19) (Fig. 4a). In Fig. 4b, a comparison is presented between our findings and other datasets derived from laboratory or ambient aerosols in different cities throughout China. These datasets can be roughly categorized into three zones, distinguished by the dashed gray, pink, and blue boxes. The freshly introduced materials generated from the laboratory (gray box) were located at a much lower position than those of ambient samples. Differences also existed in ambient samples, with higher (lower) BIX (HIX) values from our samples (pink box) than those from eastern China (blue box) (Qin et al., 2018; Yue et al., 2019; Wen et al., 2021; Deng et al., 2022), which suggested that our samples are generally less aged than those from eastern cities, although the position of UR fell within the overlapped range between these two zones.
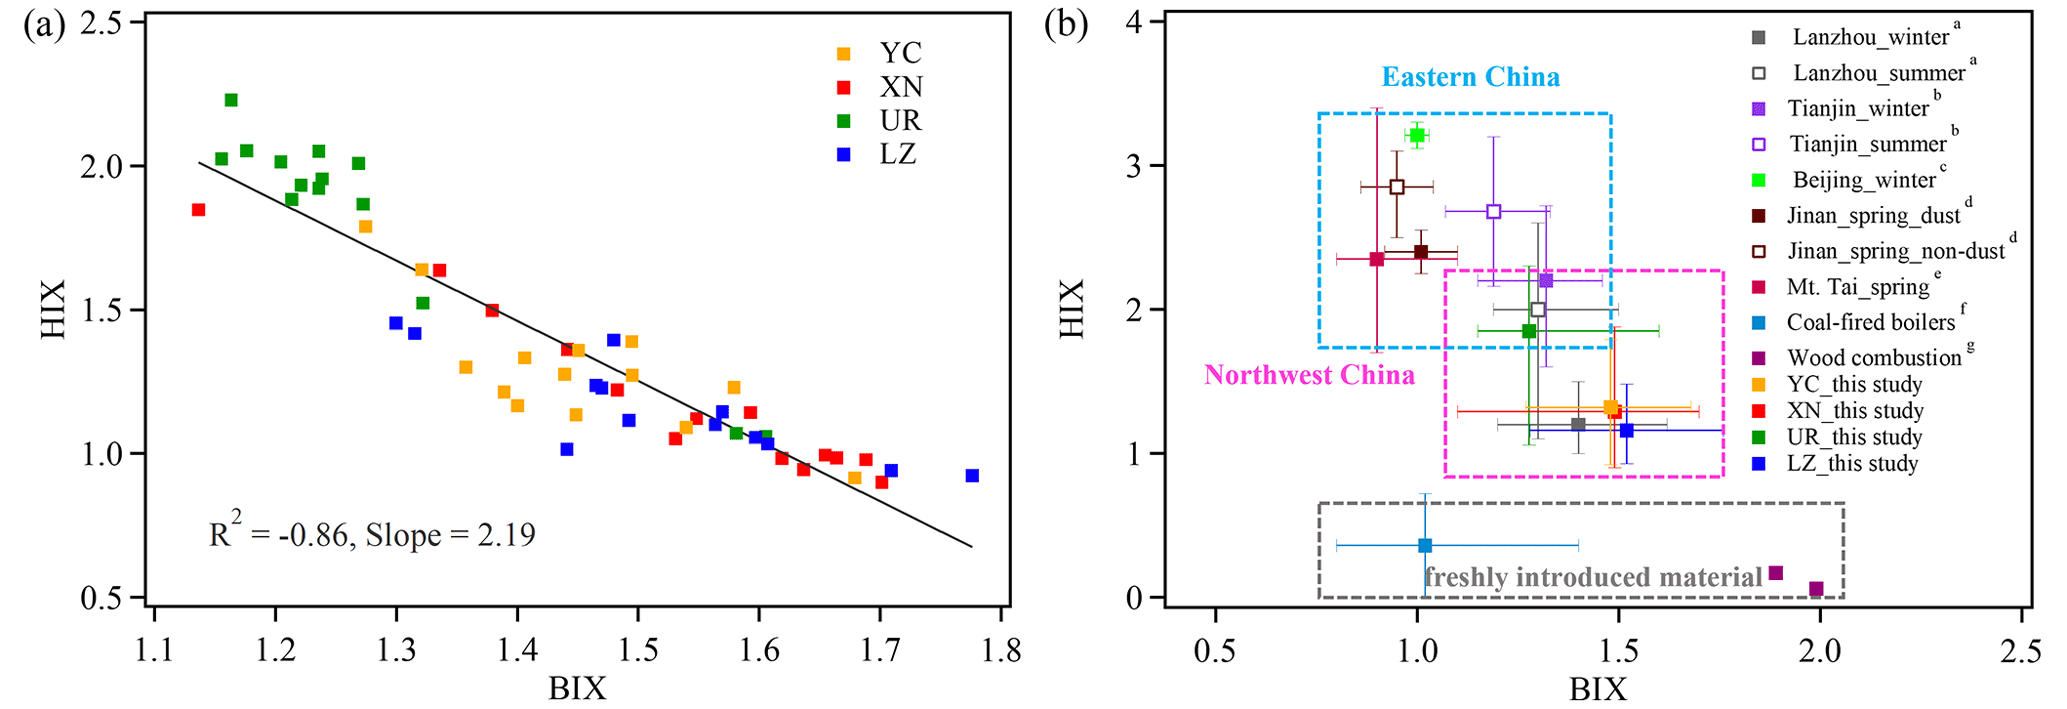
Figure 4(a) Scatter plots of the humification index (HIX) as a function of the biological index (BIX) for WSOA in four cities. (b) Comparison plot of HIX vs. BIX for this study and previous literature, including WSOA from ambient aerosols in Lanzhou from a Qin et al. (2018), Tianjin from b Deng et al. (2022), Beijing from c J. Qin et al. (2022), Jinan from d Wen et al. (2021), Mt. Tai from e Yue et al. (2019), from coal-fired aerosols from f Y. Yang et al. (2020), and from biomass burning aerosols from g Fan et al. (2019).
3.4 Influence of pH on optical properties
Recent studies have shown that the optical properties of BrC vary depending on pH, which is important for modeling its climate-forcing effect, as the general assumption of a neutral state for aerosol in models may not be accurate (Phillips et al., 2017). We investigated the effect of pH on the absorption and fluorescence spectra of WSOA for our samples (Figs. 5 and 6). The absorption spectra showed a significant increase in absorbance with the increasing pH values (from 2 to 10). The integrated absorbance (300–450 nm) increased by 66.6 %, 55.2 %, 43.4 %, and 25.3 % in YC, LZ, XN, and UR at pH 10 relative to pH 2 (Fig. S4). The MAE365 increased with increasing pH values (slope = 0.03–0.07), while the AAE decreased (slope = −0.15 to −0.40) (Fig. S5). Notably, the light absorption spectra in YC and LZ exhibited greater sensitivity to pH variation, evident from their steeper slopes. Previous studies have observed variations in light absorbance as a function of pH, attributing these changes to the protonation or deprotonation of carboxyl and phenolic functional groups and/or alterations in macromolecular conformation (Lin et al., 2017; Phillips et al., 2017; Xu et al., 2020b; Qin et al., 2020; J. Qin et al., 2022). The different sensitivity of WS-BrC to pH at our sampling sites suggested variations in chemical compositions among them, which could be further investigated through fluorescence spectra.
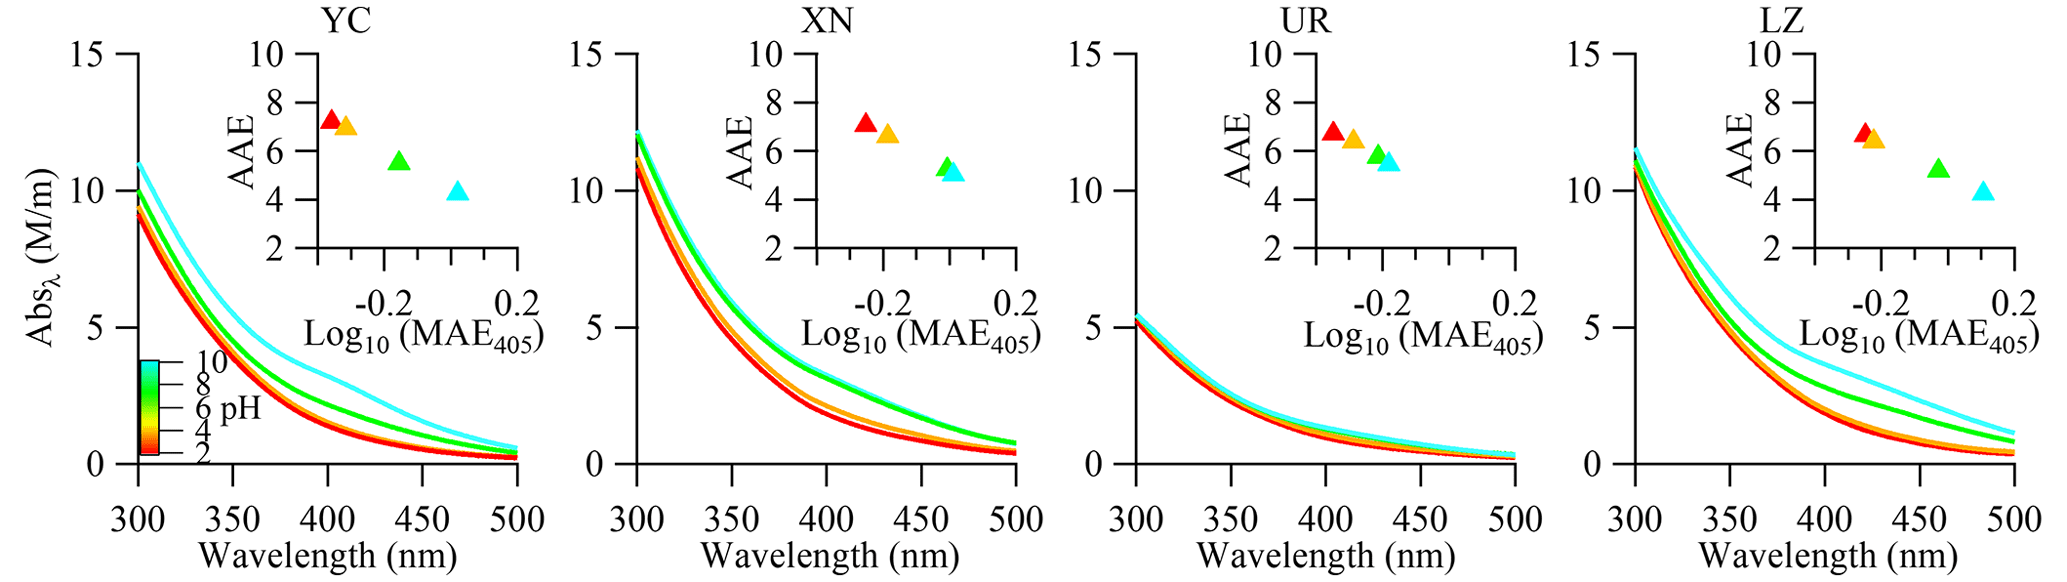
Figure 5The influence of pH on absorbance spectra (the insets shows the log10(MAE405)-AAE values at different pH levels).
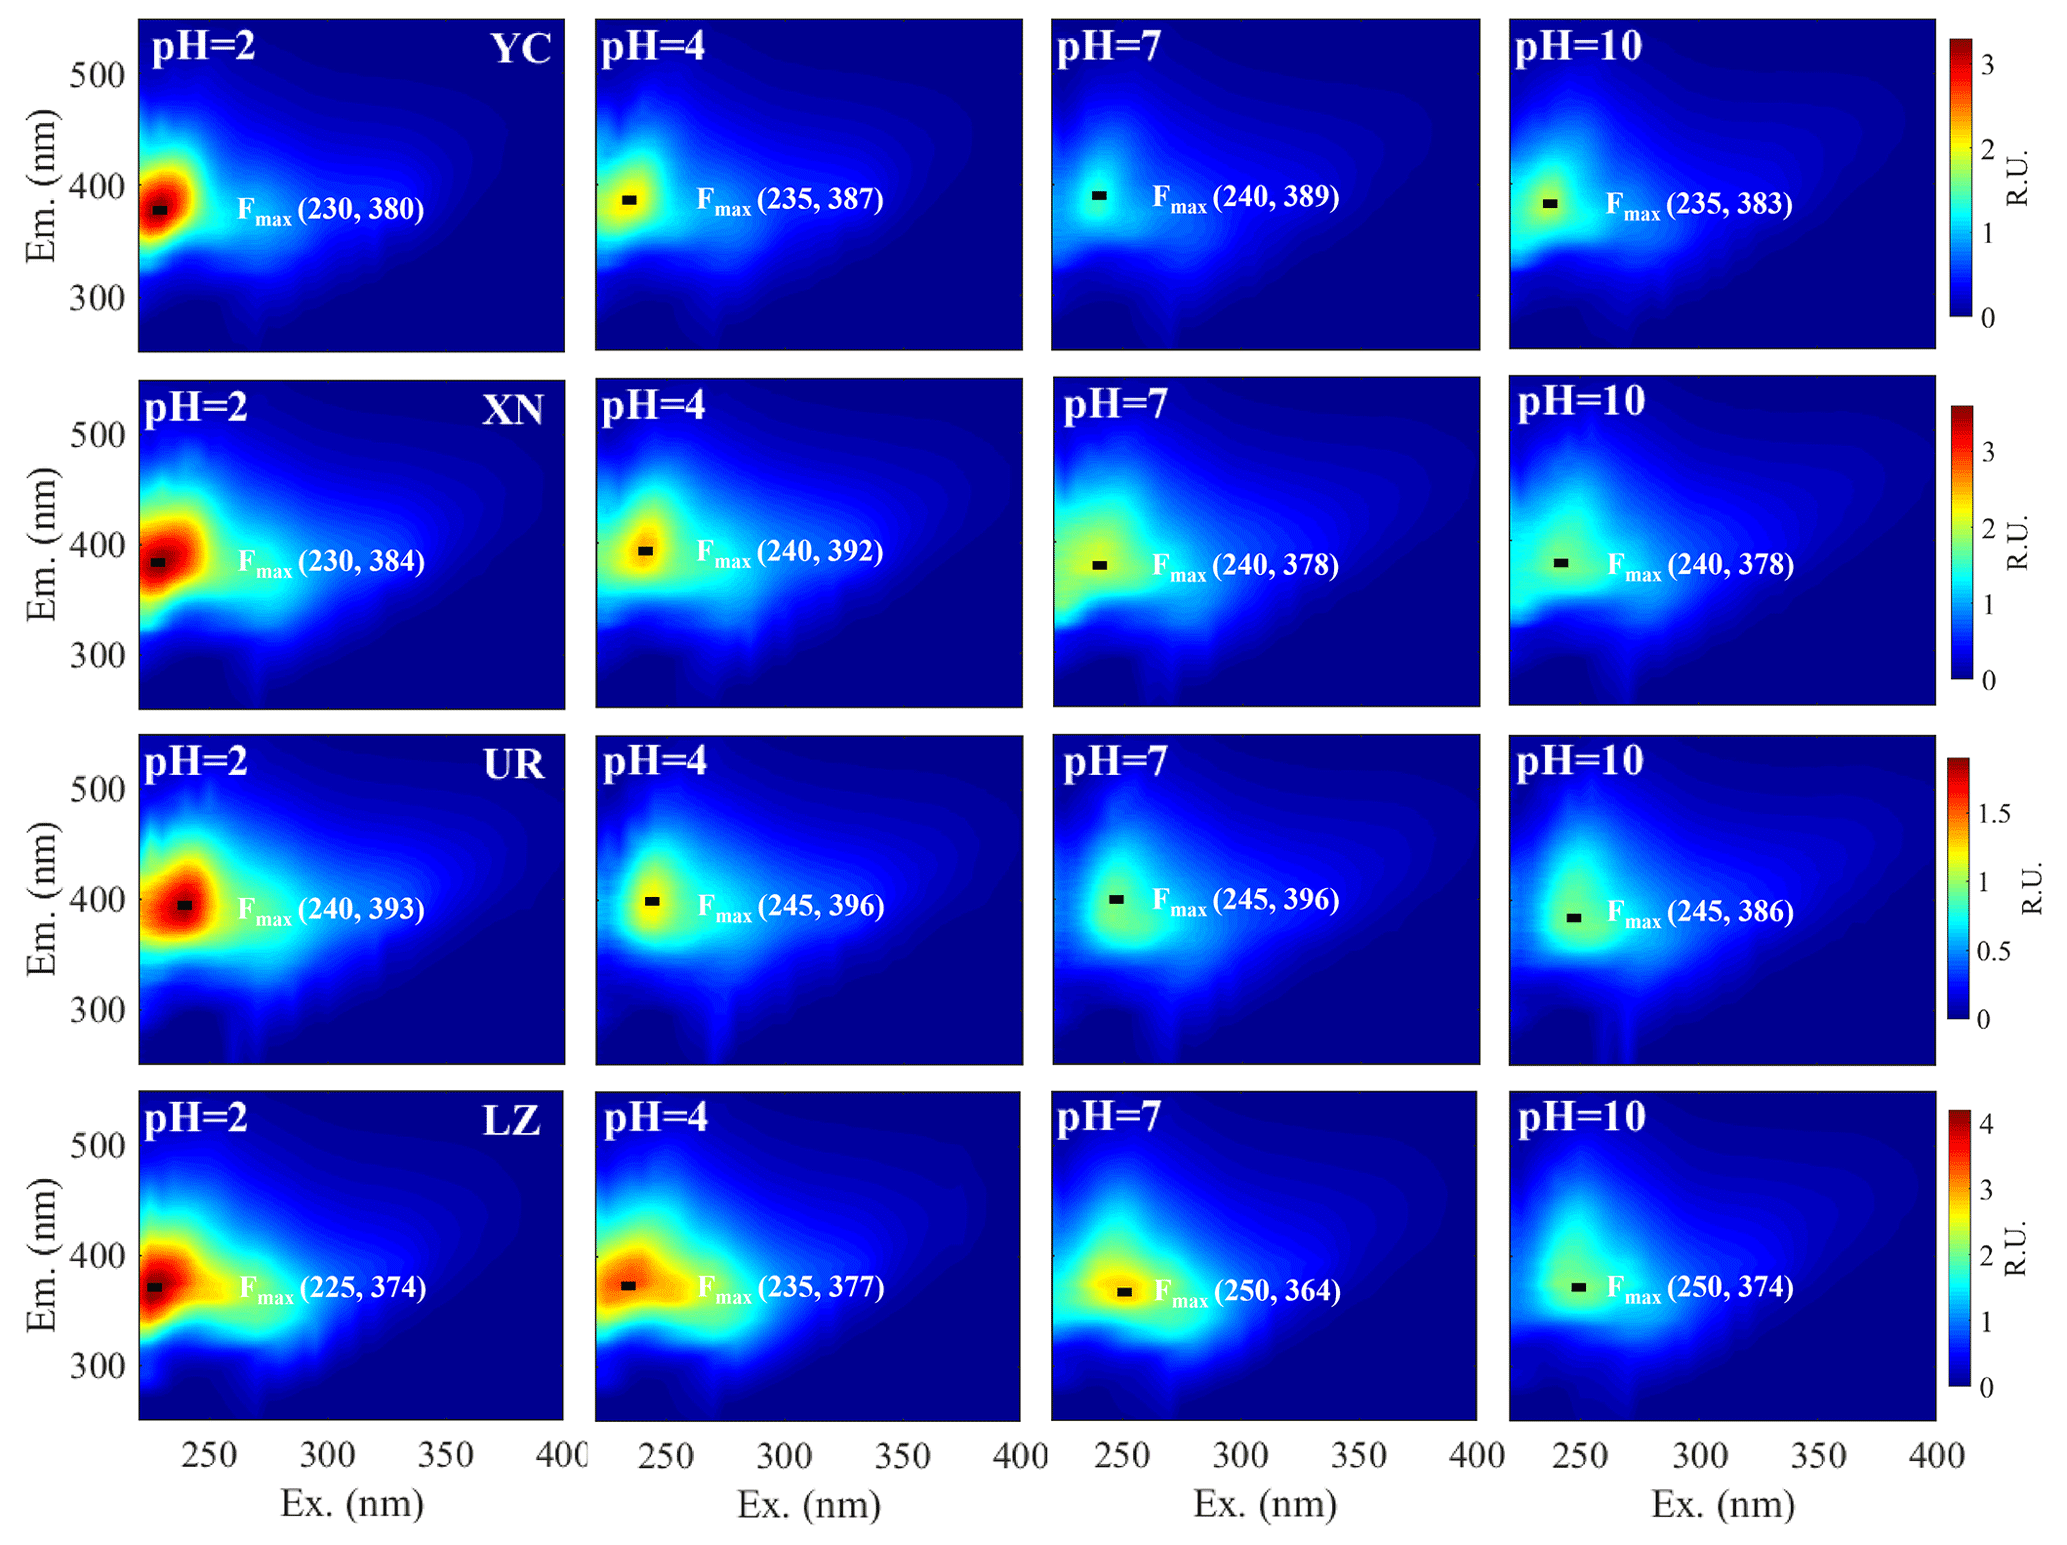
Figure 6EEM spectra and the fluorescence peak (Ex, Em) of WSOA at different pH values in four cities.
The EEM spectra exhibited the highest fluorescent intensity values at pH of 2 and tended to decrease with increasing pH. However, for the YC and UR samples, the fluorescent intensity at pH of 10 slightly increased compared to that at pH of 7 (Fig. 6). The underlying mechanism behind the variations in fluorescence intensity with pH values may be related to the rigid properties of fluorophores. Specifically, the formation of hydrogen bonds at lower pH values could give the aggregates a stronger rigid planar conformation and enhance fluorescence efficiency (Ghosh and Schnitzer, 1981; Mei et al., 2009). As pH values increased, the repulsion among generated anions disrupts hydrogen bonding, leading to a more open conformation. The increased conformational flexibility enhanced light absorption while depressing fluorescence. This explained why the light absorbance of WSOC increased under basic conditions while the fluorescence intensity increased under acidic conditions. In addition, in Figure 6, the turning point of fluorescence intensity at pH 2–4 and pH 7–10 may be related to acidic and basic groups bound to the fluorophore cores (Cox et al., 1999; Milne et al., 2001; Phillips et al., 2017), and the position variation of the fluorescence peak (λEm) can further reveal the types of acidic and basic groups (Qin et al., 2022a; Y. Qin et al., 2022). At XN and LZ, the λEm red shifted at pH 2–4, indicating the deprotonation of electron-donating groups (e.g., −OH and −NH2), while the λEm blue shifted at pH 4–7, indicating the deprotonation of electron-withdrawing groups (e.g., −COOH, −C=O, and −NO2). At LZ, the λEm further red shifted at pH 7–10, suggesting another electron-donating group. In contrast, at YC and UR, the λEm red shifted in pH 2–7 and then blue shifted in pH 7–10, suggesting that the deprotonation of electron-donating and electron-withdrawing groups was different from that of LZ.
To identify the potential dominant chemical components of WS-BrC responsible for the pH dependency, we analyzed several fluorescence peaks associated with specific chemical constituents across different pH values (Chen et al., 2003; Fellman et al., 2010). Peak A (Ex Em = 225–250/356–440 nm) was classified as a humic-like fluorophore (Fu et al., 2015; Qin et al., 2018), peak T (Ex Em = 270–280 330–355 nm) and peak B (Ex/Em = 270–280 290–310 nm) were classified as protein-like fluorophores (Chen et al., 2003; Birdwell and Engel, 2010), and peak M (Ex Em = 310–320 380–420 nm) was categorized as an oxygenated organic substance (Chen et al., 2003; Qin et al., 2022b). As shown in Fig. 7, peak A dominated the variation, contributing 78.5 %, 69.1 %, 74.1 %, and 61.2 % of the total variation of all fluorescence peaks in YC, XN, UR, and LZ, respectively. In comparison, other peaks showed moderate variations in the four cities, ranging from 8.3 % to 12.4 % for peak M, 11.2 % to 17.9 % for peak T, and 1.6 % to 7.6 % for peak B. The variation trend of peak A was highly consistent with the trends of the average fluorescence efficiency (AFI TOC) and the average apparent quantum yield (AQY) over the entire Ex Em range at each city (Figs. 7 and S7). These results suggested that the major fluorophores in all the samples are humic-like compounds. Note that although the dominant contribution comes from the humic-like compound (peak A) in all of the samples, the chemical composition of humic-like compounds among the cities is somewhat different, as indicated by the distinct AQY peak shapes of this peak (Fig. S6). These differences can be further elucidated using the PARAFAC model.
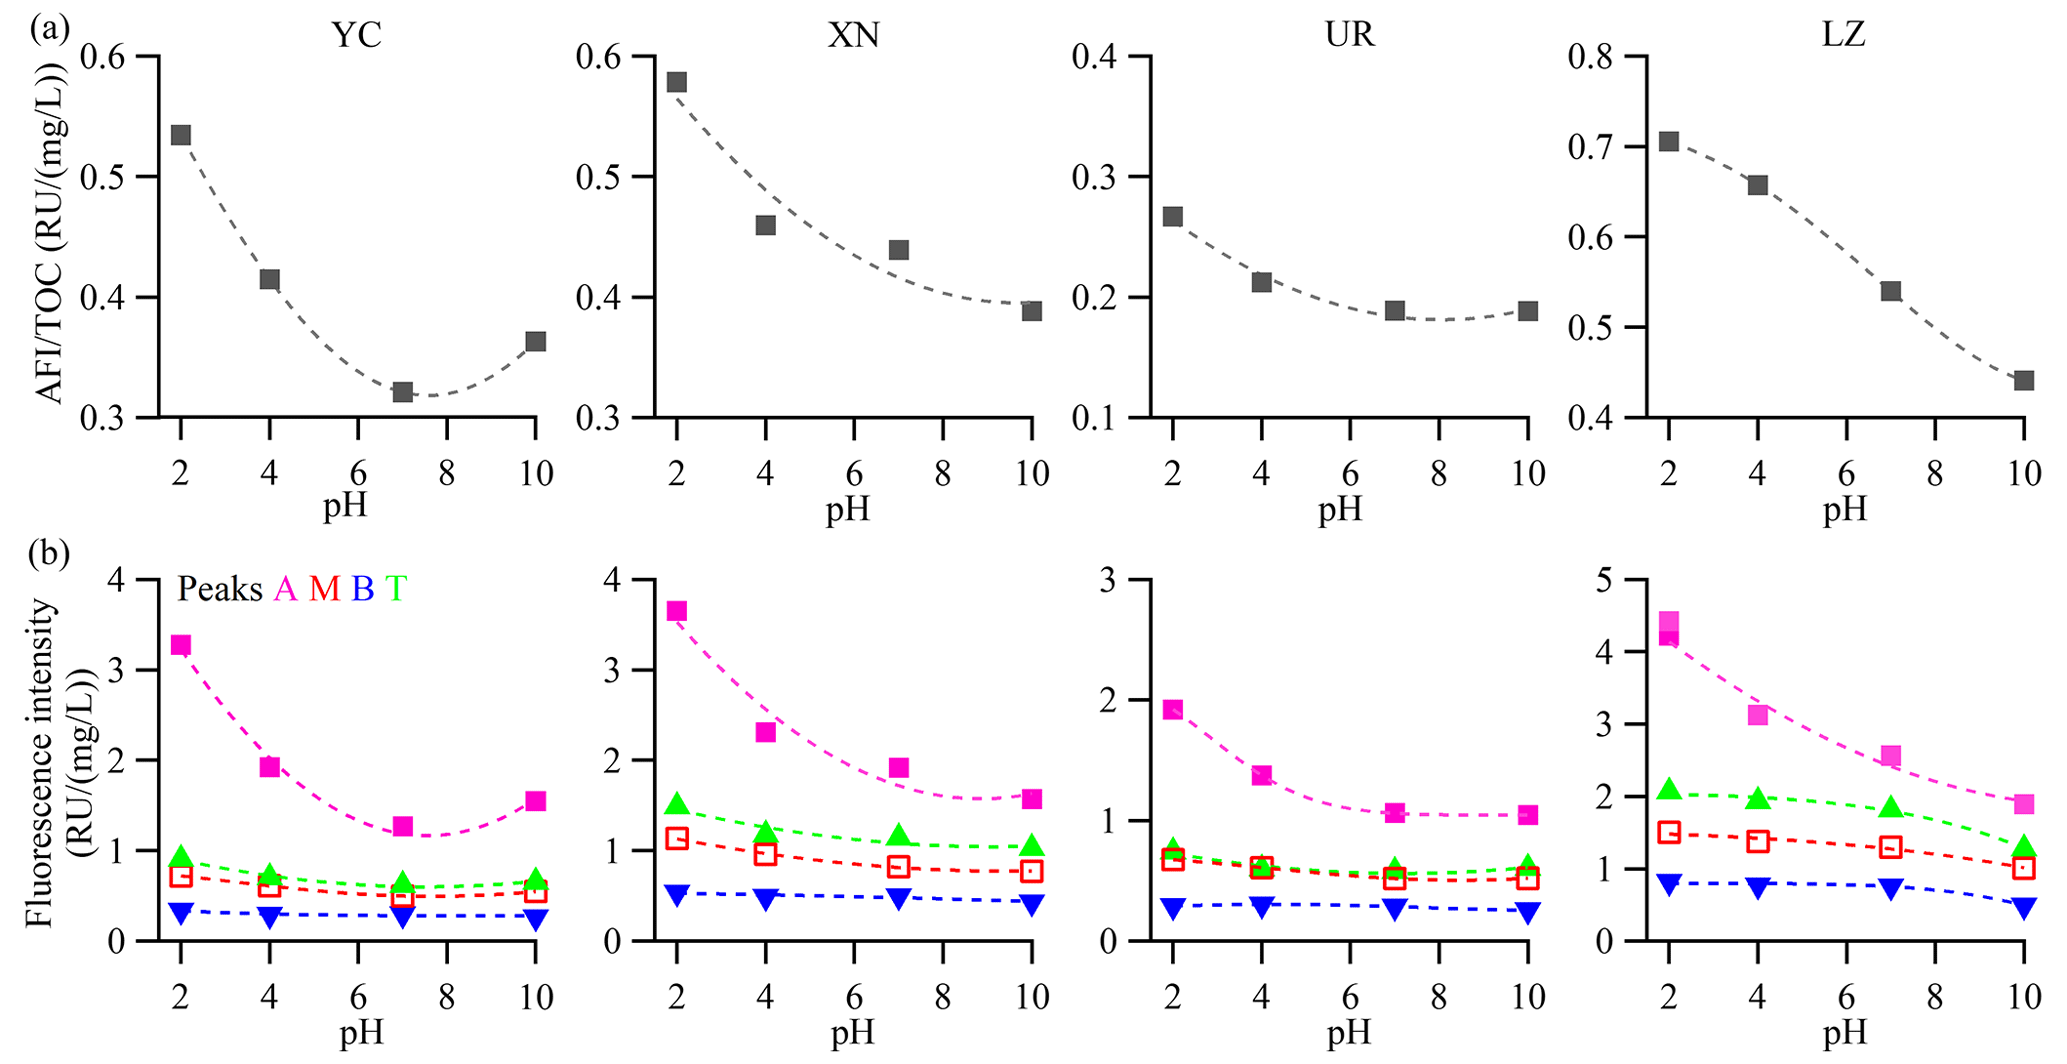
Figure 7(a) The AFI/TOC and (b) maximum peak intensity of major fluorescence peaks as a function of pH values.
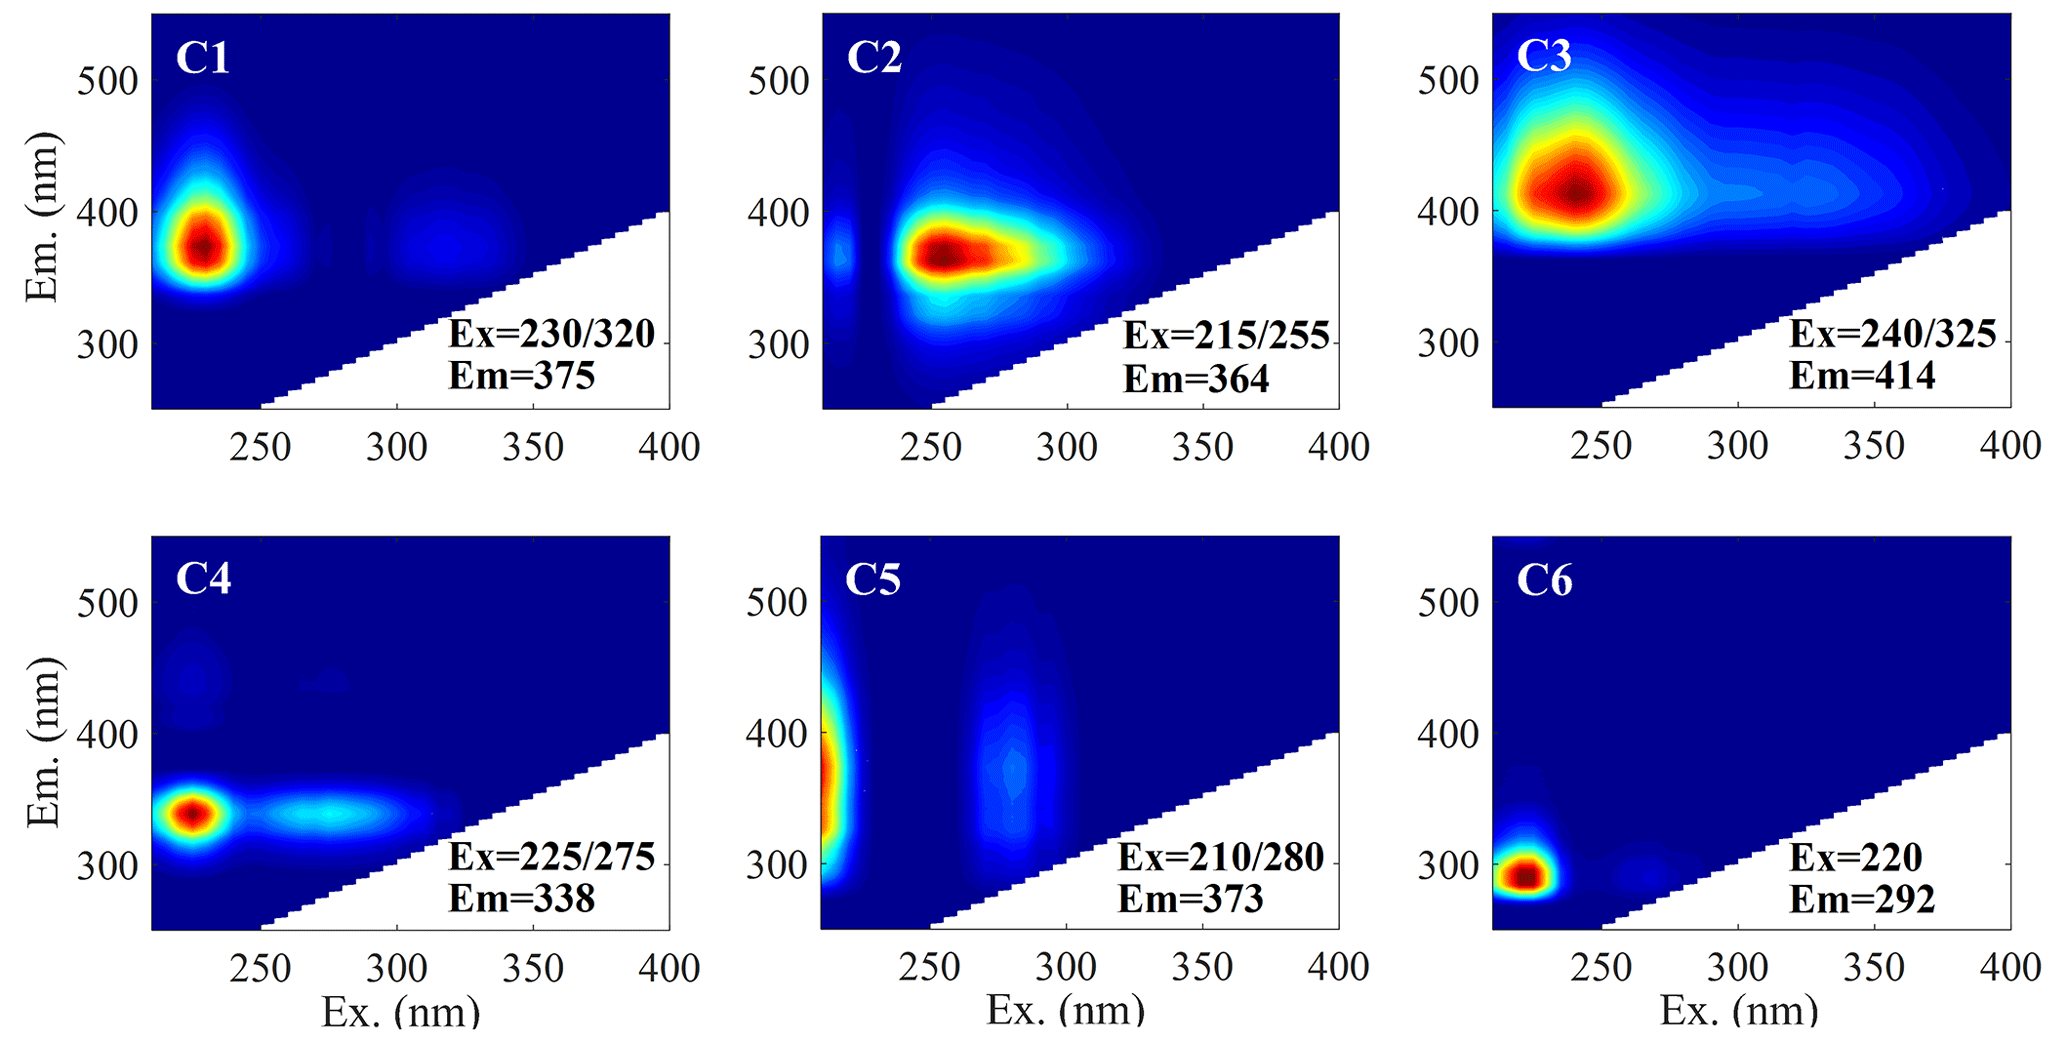
3.5 Fluorescent components
Using the PARAFAC model, we identified six chromophore components (C1–C6) from EEMs (Fig. 8 and Table S2). C1 displayed a primary peak (Ex Em) at 230 nm 375 nm and a secondary peak at 320 nm 375 nm, while C5 exhibited two similar peaks at 210 nm 373 nm and 280 nm 373 nm, albeit with a blue shift. These two chromophores were identified as less oxygenated humic-like substances (LO-HULIS), typically associated with combustion sources (Chen et al., 2016; Q. Chen et al., 2020; Chen et al., 2021). Therefore, we speculated that C5 is likely a primary chromophore, while a red shift of C1 suggests that C1 is a secondary product (Matos et al., 2015; Wang et al., 2020). C2 exhibited a fluorescence peak at (255 nm 364 nm) and has been observed in previous studies on fossil burning aerosol but has not been defined (Tang et al., 2020; Q. Chen et al., 2020). C3, peaking at 240 nm 300 nm (Ex) and 414 nm (Em), was regarded as a highly oxygenated humic-like chromophore (HO-HULIS) and is commonly considered a secondary formation (Chen et al., 2016; Yan and Kim, 2017; Cao et al., 2021). Notably, Hawkins et al. (2016) and Aiona et al. (2017) discovered that the fluorescence generated by the aqueous-phase reaction of aldehydes with ammonium sulfate or amines closely matched the HULIS fluorescence peak (Ex < 250 ∼ 300 nm, Em > 400 nm) in WSOA of ambient aerosol. C4 (Ex = 225 275 nm and Em = 338 nm) and C6 (Ex = 220 nm, Em = 292 nm) both peaked at a short wavelength and were usually characterized as protein-like fluorophores (PLSs) (Yan and Kim, 2017; Wu et al., 2019; Q. Chen et al., 2020; Chen et al., 2021) but could also be phenol-like substances or other aromatic compounds, especially for urban ambient aerosol samples (Barsotti et al., 2016; Q. Chen et al., 2020; Cao et al., 2021; Deng et al., 2022). The average relative contributions of chromophores were dominated by HULIS chromophores (C1, C3, and C5) with a total contribution of 56.5 %–68.4 %, followed by PLS chromophores (C4 and C6) (16.5 %–22.3 %), and then the undefined chromophores (C2) (14.9 %–20.8 %) (Fig. 2e). Additionally, significant differences existed in the relative content of each fluorescent component among the four cities. For example, the content of C1 was higher in YC (38.4 % vs. 28.7 %–31.0 % in the other three cities) (t test, P < 0.01); the contents of C2 and C4 were higher in LZ (20.8 % and 21.1 %) than in other three cities (14.7 %–16.2 % and 11.2 %–18.6 %) (t test, P < 0.01); and the content of C3 was significantly higher in UR than in YC, XN, and LZ (28.6 % vs. 18.8–19.4 %) (t test, P < 0.01).
3.6 Source apportionment of WSOA by PMF analysis
Four WSOA factors were identified through PMF analysis on the high-resolution mass spectra of WSOA at four cities, including a water-soluble primary OA (WS-POA), two highly oxidized oxygenated OA (HO-OOA1 and HO-OOA2), and a less oxidized oxygenated OA (LO-OOA) (Fig. 9). The mass spectrum of WS-POA was dominated by CxH (51 %) fragment ions, followed by CxHyO (24 %), CxHyO (14 %), CxHyN (6 %), HyO1 (4 %), and CxHyOzN (1 %). The WS-POA had the lowest O C (0.47) and the highest H C (1.68) among the four factors, but its O C was much higher than those of online measurement decomposed POA (< 0.1) (Xu et al., 2020a; Zhao et al., 2022). In addition to oxygen-containing ions, the WS-POA exhibited a few characteristics similar to those of the online measurement decomposed POA, such as relatively high at 55 and 57, with the 55-to-57 ratio being 2.67, 60 (fraction of signal = 0.39 %), and 115 (fraction of signal = 0.21 %), which could be related to cooking, biomass burning, and coal combustion, respectively. These results suggested that the WS-POA factor in our study represents mixed primary sources. The mass contribution of WS-POA was 26.2 ± 19.1 %, 42.9 ± 15.2 %, 30.7 ± 10.2 %, and 48.8 ± 9.3 % in YC, XN, UR, and LZ, respectively.
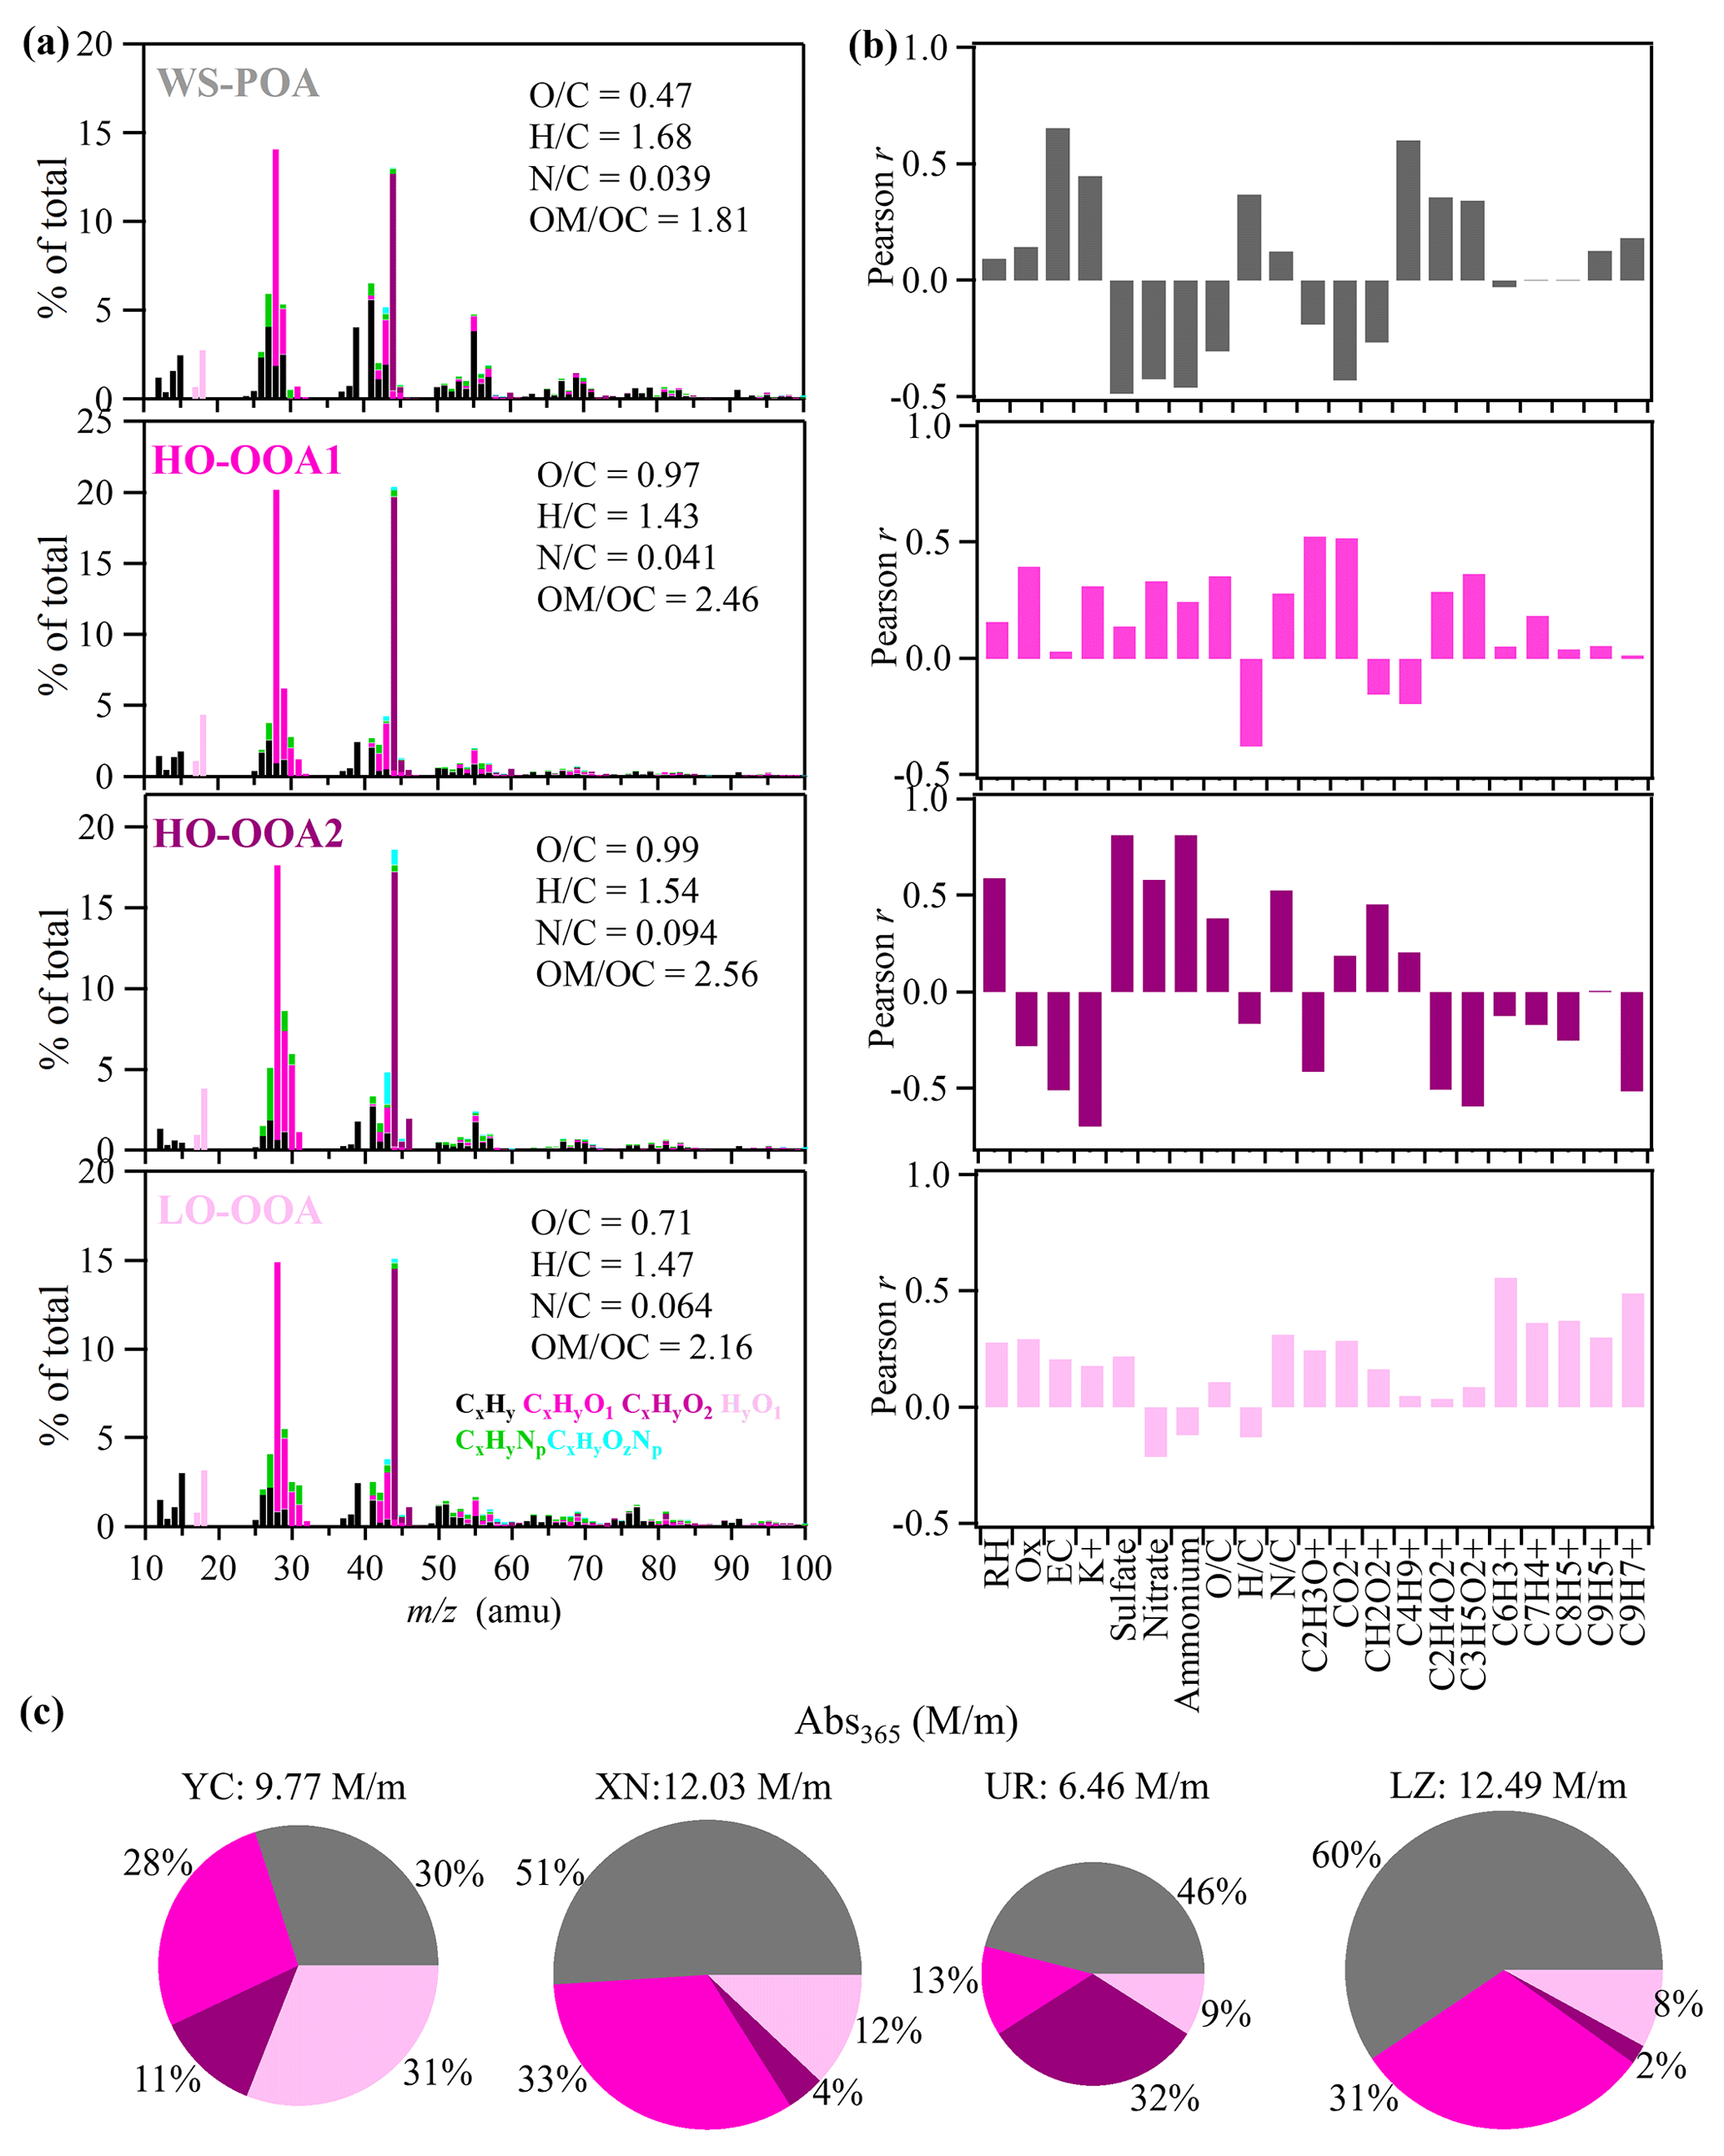
Figure 9(a) The mass spectra of PMF factors (WS-POA, HO-OOA1, HO-OOA2, LO-OOA), (b) correlations between PMF factors and various tracers, and (c) average contributions of WSOA factors to light absorption at 365 nm.
The mass spectrum of LO-OOA also displayed a pronounced signal at 115 (signal fraction = 0.36 %), and its concentration was highly correlated with specific polycyclic aromatic hydrocarbon (PAH) signals, such as C6H, C7H, C8H, and C9H (Fig. 9), indicating that LO-OOA was associated with coal-combustion-induced WSOA. However, LO-OOA exhibited significantly higher OSc (−0.05 vs. −0.74 for LO-OOA and WS-POA, respectively), lower CxH ions (33 %), and higher combination of oxygenated ions (57 % in total), including CxHyO (32 %), CxHyO(18 %), HyO1 (4 %), and CxHyOzN (2 %), compared to the primary factor. These implied that LO-OOA likely represented a low oxidation OOA associated with coal-combustion-induced WSOA. The same factor was also observed in water-soluble aerosol samples from Beijing during winter (Hu et al., 2020). The mass contribution of LO-OOA was 25.2 ± 15.3 %, 10.9 ± 3.3 %, 6.4 ± 2.3 %, and 7.3 ± 1.6 % in YC, XN, UR, and LZ, respectively.
The mass spectrum of HO-OOA1 was characterized by a distinct signal at 44, which accounted for 20.4 % of the total signal and was mainly composed of CO (94 %). Additionally, HO-OOA1 exhibited a high O C value (0.97), indicating its high oxidation. HO-OOA1 was significantly correlated with nitrate and odd oxygen (Ox= O3 + NO2), which are the products of photochemical processes (Fig. S7), suggesting that HO-OOA1 was photochemically produced (Herndon et al., 2008; Ye et al., 2017). The mass contribution of HO-OOA1 was 29.6 ± 18.1 %, 37.2 ± 10.1 %, 13.4 ± 10.2 %, and 38.3 ± 8.5 % in YC, XN, UR, and LZ, respectively. The HO-OOA2 exhibited comparable O C to that of HO-OOA1 (0.99 vs. 0.97), but it had a higher N C ratio (0.094 vs. 0.041) and a stronger correlation with RH and sulfate than HO-OOA1, suggesting its potential for aqueous processing production (Sun et al., 2016; Wang et al., 2021). Furthermore, HO-OOA2 exhibited a significant correlation with CH2O (r= 0.48, P < 0.01), a typical fragment ion for glyoxal, which could be generated from ring breaking in the aqueous-phase oxidation of polycyclic aromatic hydrocarbons (Chhabra et al., 2010; Wang et al., 2021). The mass contributions of HO-OOA2 were 19.0 ±5.8 %, 8.9 ± 6.2 %, 49.5 ± 7.2 %, and 5.1 ± 2.7 % in YC, XN, UR, and LZ, respectively. Overall, the WSOA in LZ exhibited the highest contribution of POA. Conversely, the WSOA in UR had the highest contribution of HO-OOA2, while the WSOA in YC demonstrated the highest contribution of LO-OOA (Fig. 2).
To further assess the relative light absorption contributions of WSOA from different sources, the four WSOA factors mentioned above were assigned to Abs365 using the multiple linear regression (MLR) model, as described in the following equation: Abs365= a × [WS-POA] + b × [LO-OOA] + c × [HO-OOA1] + d × [HO-OOA2], where [WS-POA], [LO-OOA], [HO-OOA1], and [HO-OOA2] are the mass concentrations of WSOA factors and a, b, c, and d denote regression coefficients (m2 g−1) representing the MAE value for each factor.
The reconstructed Abs365 fits well with the measured Abs365, and the slope is close to 1 (Fig. S8), indicating the effectiveness of the algorithm. The fitted MAE values were higher for WS-POA and LO-OOA, with values of 1.34 and 1.33 (m2 g−1), respectively (Table S4). These values were comparable to those of FF-POA (fossil-fuel POA) (1.35) and LO-OOA (1.24) factors previously determined during the winter in Beijing (Wang et al., 2021). The lower MAE of HO-OOA1 (1.10 m2 g−1) was likely attributed to photo-bleaching occurring in photochemical processes (Browne et al., 2019; Y. Chen et al., 2020; Zhang et al., 2021b). The lowest MAE value for HO-OOA2 (0.58 m2 g−1) suggested a strong photobleaching effect of the aqueous-phase oxidation process (Wang et al., 2021). The average relative contributions of different WSOA factors to light absorption are shown in Fig. 9c. WS-POA was the most important WS-BrC in our study, contributing 60 %, 51 %, 46 %, and 30 % of Abs365 in LZ, XN, UR, and YC, respectively. HO-OOA1 also played an important role in the absorption of WS-BrC, contributing nearly 30 % except in UR (only 13 %). HO-OOA2 emerged as a significant contributor to WS-BrC (32 %) in UR due to its high-quality contribution (50 %), while it was the least contributing factor to Abs365 in other three cities (only 2 %–11 %). LO-OOA was an equally important contributor to Abs365 as WS-POA in YC (31 % vs. 30 %), while the contribution was around 10 % in other three cities.
3.7 Chemical transformations of chromophores
The light absorption capacity of BrC is closely related to atmospheric aging processes and their chemical composition (Lin et al., 2016; Jiang et al., 2022). To understand the relationship between light absorption properties and chemical processes, several indexes, including O C, H C, N C, and carbon oxidation state (OSc), were investigated for the relationship with MAE365 and AAE (Fig. 10). The indexes of O C and OSc, which reflect the degree of atmospheric aging, were lower in LZ than in other cities (0.58 vs. 0.64–0.77). A significant positive relationship was observed between O C and MAE365 in LZ (r= 0.57), while significant negative relationships were observed in YC and UR (0.70 and −0.53). These findings suggested that the photo-enhancement phenomenon occurred in LZ, while the photo-bleaching phenomenon took place in the other three cities. Fitting MAE365 vs. O C for all data from the four cities using least-squares linear regression (Fig. S9), the trend changed around an O C ratio of 0.64: MAE365= 1.04 × O C + 0.58 for O C < 0.64 and MAE365= −1.23 × O C + 1.90 for O C ≥ 0.64. A similar phenomenon was found by Jiang et al. (2022) in various polar solvent extracts of PM2.5 filters from Beijing, which suggested that chemical processing is dominated by functionalization for the low O C period, while it is primarily controlled by fragmentation for the high O C period. Therefore, we inferred that the photo-enhancement phenomenon in LZ is probably due to the initial aging of fresh WSOA.
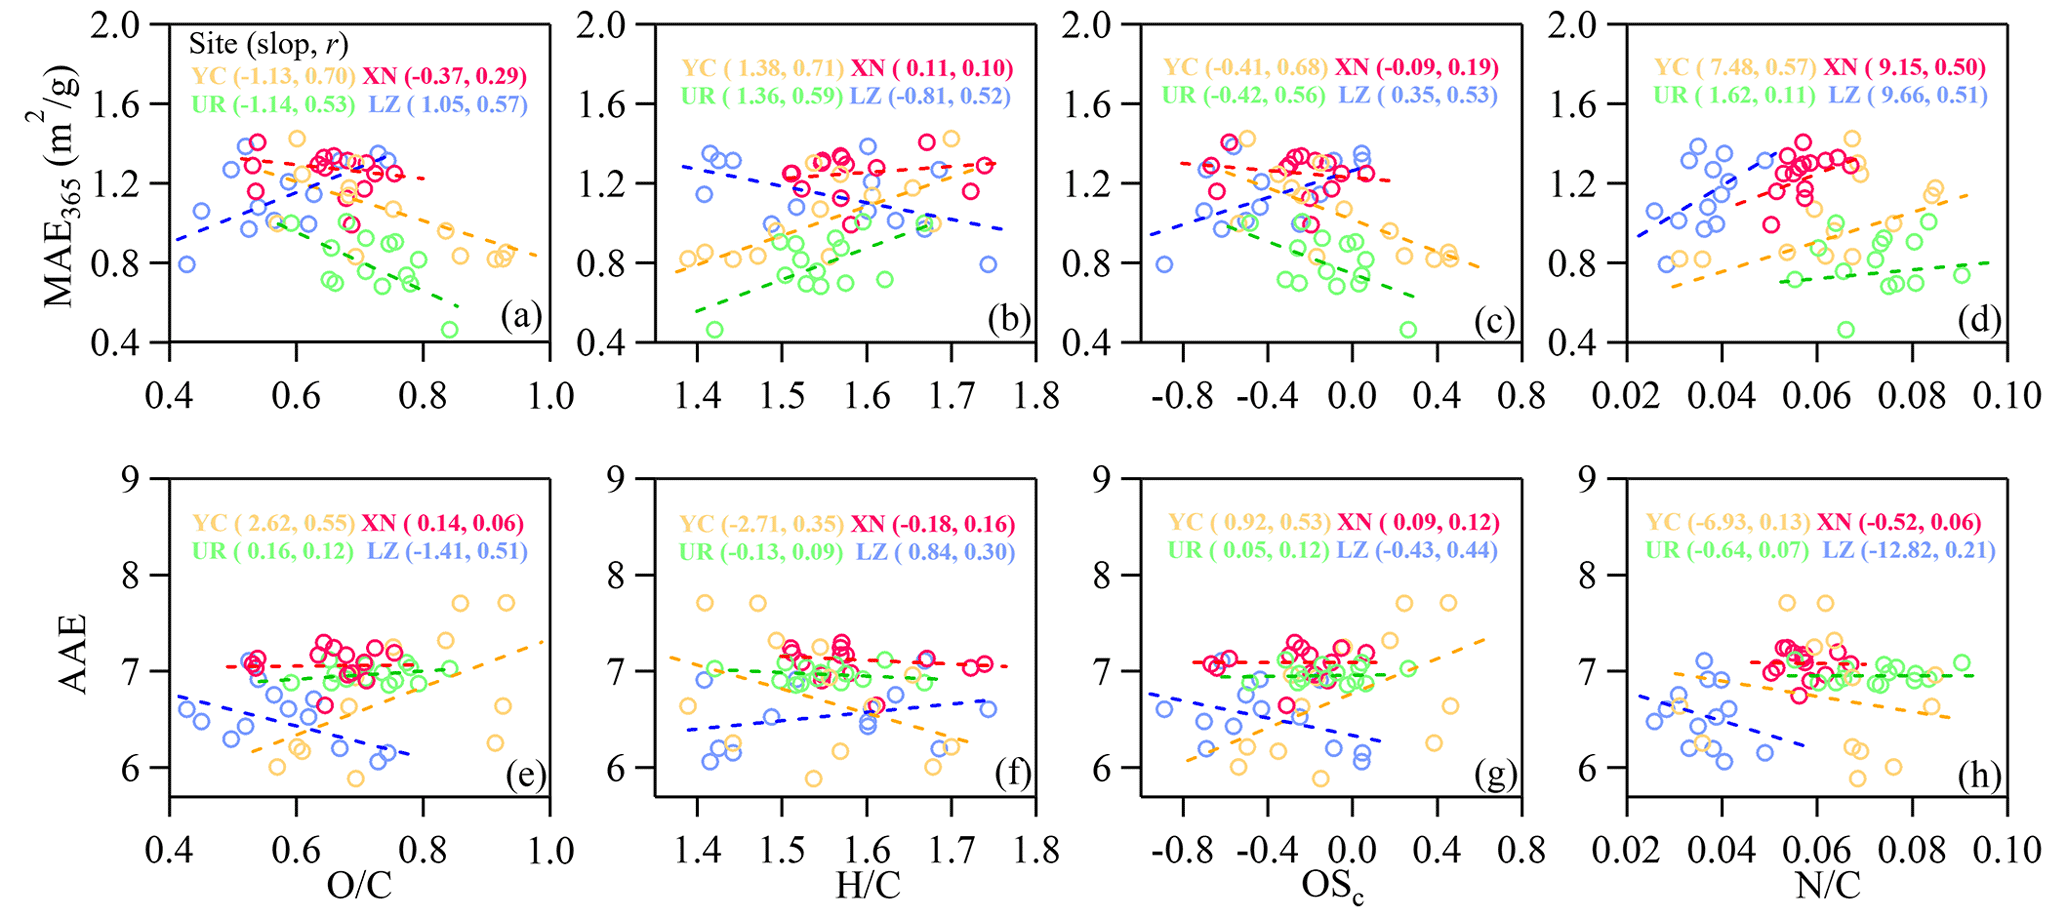
Figure 10Scatter plots of MAE365 (a–d) and AAE (e–h) vs. (a, e) O C, (b, f) H C, (c, g) OSc, and (d, h) N C in four cities. The slope and correlation coefficients found by fitting the scatter of each group are shown, and the p test is significant at the 0.05 level when r reaches 0.49.
The variation between MAE365 and H C was broadly opposite to that of O C. A significant positive correlation between MAE365 and H C was observed in YC and UR, suggesting a higher MAE365 for fresh aerosols. MAE365 values showed a significantly positive correlation with N C in YC, XN, and LZ (r= 0.57, 0.50, and 0.51, respectively) and a weak correlation in UR (r= 0.11), indicating that N-containing organic species are effectively light-absorbing chromophores (Chen et al., 2018). To elucidate the potential chemical composition and sources of N-containing species, a correlation analysis between MAE365 and N-containing fragment ions was conducted. Higher correlation coefficients were found for the CxHyN and CxHyOZN family ions, such as CHN+, CH4N+, C2H3N+, C2H6N+, C3H8N+, C2HNO+, C2H2NO+, C2H5NO+, and C3H4NO+ (Fig. S10). These ions may be associated with amine, imine, N-heterocyclic compounds (e.g., imidazole), organonitrates, and nitroaromatic compounds, which have been proven to be important BrC components in ambient aerosol (Farmer et al., 2010; Sun et al., 2012; Kim et al., 2019; Kasthuriarachchi et al., 2020; Ditto et al., 2022; Jiang et al., 2022).
The relationship between AAE and O C was also investigated. In YC, AAE increased significantly with rising O C (slope = 2.62, r= 0.55), which could be attributed to the significant chemical oxidation and the formation of O-containing functional groups with weakly light-absorbing characteristics of WSOA (Sumlin et al., 2017; Zeng et al., 2021), resulting in a shift in the absorption spectrum towards UV wavelengths (Zhang et al., 2013; Mo et al., 2018). Nevertheless, a significant negative relationship between AAE and O C was observed in LZ (slope = −1.41, 0.51). The initial oxidation occurring in LZ introduced functional groups to form auxochrome or chromophores, leading to absorption enhancement and an absorption spectrum red shift (Lin et al., 2015; Zeng et al., 2021; Jiang et al., 2022). Additionally, the AAE values showed a roughly decreasing trend with increasing N C in the four cities, possibly due to the abundance of N heteroatoms leading to a red shift in the absorption spectrum (Jiang et al., 2022).
Cross-correlation among fluorescent chromophores and chemical components of PM2.5 were performed to infer the possible sources and atmospheric chemical processes of WS-BrC (Fig. 11a). The results revealed that C1, C3, and C6 were tightly correlated with SNA, particularly sulfate, indicating contributions from secondary production sources. In contrast, C2, C4, and C5 exhibited tight correlations with primary species like EC, K+, and Cl−, suggesting origins from primary emission sources. Furthermore, the fluorescent chromophores were assigned to different WSOA factors based on Pearson's correlation analysis between the relative abundance of the four PMF factors and the relative content of the six PARAFAC components. For example, C2, C4, and C5, identified as primary chromophore components, significantly correlated with WS-POA. C1, characterized as less oxygenated humic-like components, significantly correlated with LO-OOA, representing secondary chromophoric components with less oxidation. C3, identified as highly oxygenated humic-like components, strongly correlated with HO-OOA2. Notably, there was a significant positive correlation between C3 and HO-OOA1 when excluding UR data (Fig. S11). Thus C3 was likely to represent secondary chromophoric components with a high degree of oxidation, formed through either aqueous-phase or photochemical oxidation, with different contributions from these two aging pathways in different cities of our study. C6 exhibited a significant correlation with HO-OOA2, and the EEM spectra of C6 overlapped highly with phenol chromophore (Barsotti et al., 2016; Q. Chen et al., 2020), implying that C6 might be a phenol-like chromophore and an aqueous-phase oxidation product. Recent studies have indicated the presence of benzene and its derivatives in atmospheric waters such as clouds and fog (Raja et al., 2009). Benzene reacts readily with hydroxyl radicals in the aqueous phase (kOH= 4.7 × 10⁵ µM−1 min−1), which is much faster than its reaction to other atmospheric radicals such as ozone ( 6.1 × 10⁻⁶ µM−1 min−1) and nitrate radicals ( 4.0 × 10⁻¹ µM−1 min−1) or photolysis in the gas phase (Minakata et al., 2009). Thus, the atmospheric chemistry reaction of benzenes is likely initiated by •OH in the aqueous phase, leading to the formation of phenol-like chromophores (Borrás and Tortajada-Genaro, 2012; Heath et al., 2013; Faust et al., 2017).
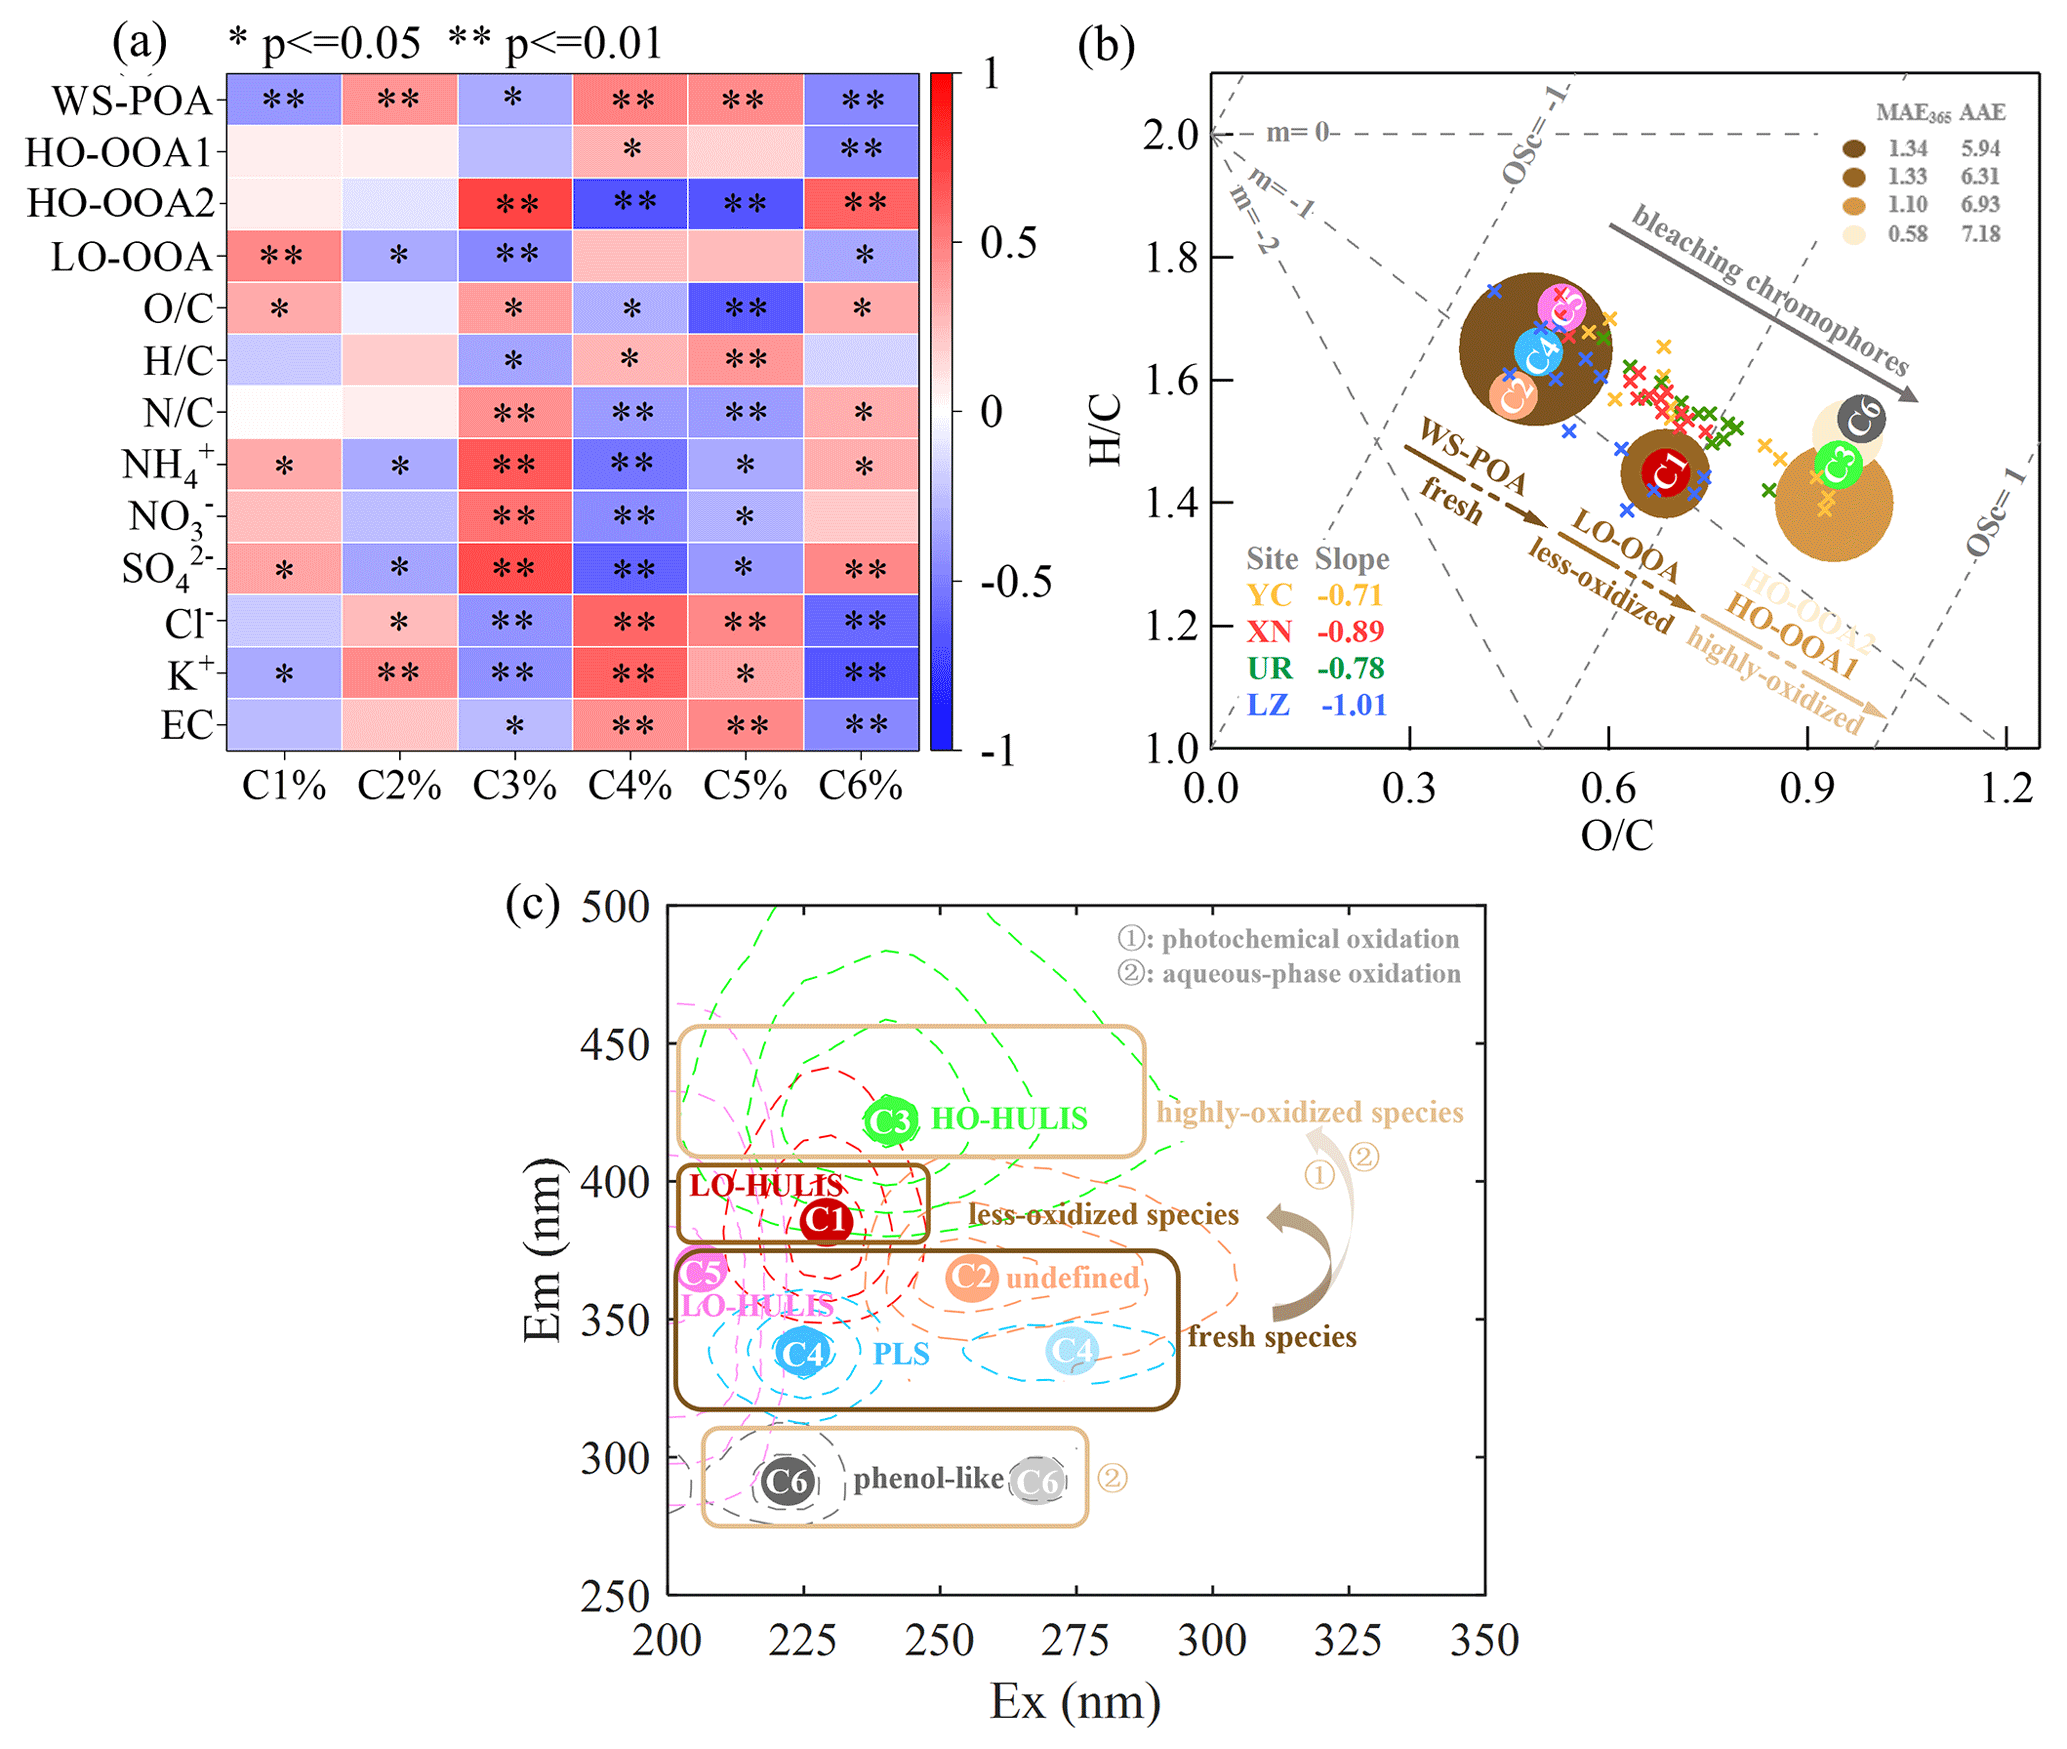
Figure 11The diagram illustrates the aging from fresh species to less oxidized and/or highly oxidized species and the corresponding variation in optical properties. (a) Heatmap of the correlation analysis between the PARAFAC components and PMF factors, with highly significant correlations (p < 0.01) marked by and significant correlations (0.01 < p < 0.05) marked by *. (b) The Van Krevelen plot (H : C vs. O : C) for ambient WSOA samples and different WSOA factors in this study, with the slopes of the fitted line for ambient WSOA samples from each city noted in the lower left. The fitted MAE365 and AAE values for each WSOA factor are noted in the upper right, and each WSOA factor is colored by its MAE365 value, with fading color indicating bleaching chromophores. The size of the color block represents the average contribution of each WSOA factor to Abs365. Based on the correlation coefficients between PARAFAC components and PMF factors, C2, C4, and C5 chromophores were assigned to WS-POA; C1 chromophores were assigned to LO-OOA; and C3 and C6 chromophores were assigned to HO-OOA (HO-OOA1 and HO-OOA2). (c) The Ex Em plot for fluorescence peak positions and the corresponding compounds of these six fluorophores.
By combining the information provided above into a Van Krevelen plot (H : C vs. O : C), commonly used to illustrate the evolution of organic aerosols (Heald et al., 2010; Ng et al., 2011; Canagaratna et al., 2015), a tight relationship between the evolution of chemical processes and the light absorbance of chromophores was clearly revealed. Note that in the Van Krevelen plot, each WSOA factor is colored by its fitted MAE365, with the size of each WSOA factor representing the average contribution to Abs365, and the PARAFAC components are also assigned to distinct WSOA factors based on their relevance to each factor. Overall, the aging processes from fresh species (WS-POA) to LO-OOA and HO-OOAs, along the direction of increasing OSc, were clearly associated with a photobleaching phenomenon, as evidenced by a decrease or increase in MAE365 and AAE values. The slope from WS-POA to each OOA component could be used to some extent to describe this photobleaching phenomenon, i.e., −0.91 for WS-POA and LO-OOA, −0.53 for WS-POA and HO-OOA1, and −0.34 for WS-POA and HO-OOA2. A lower slope (closer to −1) could be related to the addition of carboxylic acid functional groups, while higher slopes (such as −0.5) could be related to the addition of alcohol or peroxide functional groups. Additionally, the slopes for each dataset from the four cities exhibited variation: −1.01 at LZ, −0.89 at XN, −0.78 at UR, and −0.71 at YC. This variation further underscores the different chemical processes and optical properties in each city.
Figure 11c displays the EEM profiles of the six PARAFAC components (indicated by dashed line) along with their fluorescence peak positions (Ex Em) (represented by circles C1–C6), as well as their corresponding compound categories. The potential origins and atmospheric chemical transformations of these chromophores are further revealed by correlating the PMF results. The classification of the highly oxygenated and less oxygenated species regions proposed by Chen et al. (2016) closely matches with our research findings. However, our results are divided into three distinct categories, i.e., fresh species, less oxidized species, and highly oxidized species, with each region circled by a different shade of brown box in Fig. 11c. Note that the chemical transformation of the loss of primary chromophores (fresh species) and the generation of secondary chromophores (less oxidized and highly oxidized species) can occur through either photochemical oxidation or aqueous-phase oxidation, with different contributions from the two aging pathways in different cities. Additionally, certain chromophores formed from high-oxidation processes exhibit short emission wavelengths, which were originally classified as PLS chromophores, providing a reference for determining PLS sources and processes in future studies.
In this study, a comprehensive comparison was conducted regarding the optical properties, potential sources, and chemical processes of WSOA using atmospheric aerosols collected from four typical cities, namely Yinchuan (YC), Xining (XN), Ürümqi (UR), and Lanzhou (LZ). The main conclusions and environmental implications are obtained as follows.
Firstly, the optical properties of WSOA were found to be influenced by its chemical composition. The MAE365, HIX, and BIX values of XN (1.24 m2 g−1, 1.29, 1.49) and LZ (1.19 m2 g−1, 1.16, 1.52) were higher, lower, and higher, respectively, than those of YC (1.07 m2 g−1, 1.32, 1.48) and UR (0.78 m2 g−1, 1.85, 1.28), possibly due to a higher contribution of fresh WSOA in XN and LZ and a greater degree of humification and aging or oxidation of WSOA in YC and UR. Secondly, the optical properties of WSOA were found to be influenced by pH variation. The integrated absorbance (300–450 nm) and MAE365 exhibited a monotonically increasing trend with rising pH in four cities. The impact of pH on EEM spectra was much more complex, involving the rigidity and planarity of molecule structure and the protonation or deprotonation of electron-withdrawing groups (−COOH and −NO2) and electron-donating groups (−NH2 and −OH) connected to the fluorophore nuclei. The WSOA in YC and LZ were found to be most sensitive to pH variation and exhibited distinct trends, indicating that their chemical structures are rich in different types of acid and base functional groups. Thirdly, changes in the optical properties of WSOA were observed during aging or oxidation processes. Obvious photo-bleaching was observed in YC and UR, while photo-enhancement was observed in LZ, reflecting the role of the initial aging (functionalization) and further oxidation (fragmentation) of fresh WSOA on the optical properties of WS-BrC based on the analysis of optical properties and bulk chemical characteristics. Finally, the analysis combining chromophores with WSOA factors can be used to illustrate the chemical processes and optical variation by V–K plot and EEM plot, which is useful for understanding the dominant chemical pathway at each city.
Overall, this study provides insights into the optical properties, sources, and chemical transformations of WS-BrC. These insights will provide an important reference for future studies to determine the sources and processes of atmospheric chromophores and to further help estimate the climatic effects of atmospheric aerosols and control carbonaceous aerosol pollution.
The data used in this study can be accessed on request from corresponding author.
The supplement related to this article is available online at: https://doi.org/10.5194/acp-23-12609-2023-supplement.
JX designed the research, and MZ, HW, LG, and WL collected samples. MZ processed data, plotted the figures, and wrote the manuscript, while JX and XZ provided constructive discussions. LZ and WZ had an active role in supporting the experimental work. All authors contributed to the discussions of the results and the refinement of the manuscript.
The contact author has declared that none of the authors has any competing interests.
Publisher's note: Copernicus Publications remains neutral with regard to jurisdictional claims in published maps and institutional affiliations.
This research has received support from the National Natural Science Foundation of China (grant no. 41977189) and the Key Laboratory of Cryospheric Sciences Scientific Research Foundation (grant no. SKLCS-ZZ-2023).
This paper was edited by Markus Petters and reviewed by two anonymous referees.
Aiona, P. K., Lee, H. J., Leslie, R., Lin, P., Laskin, A., Laskin, J., and Nizkorodov, S. A.: Photochemistry of Products of the Aqueous Reaction of Methylglyoxal with Ammonium Sulfate, ACS Earth Sp. Chem., 1, 522–532, https://doi.org/10.1021/acsearthspacechem.7b00075, 2017.
Andreae, M. O. and Gelencsér, A.: Black carbon or brown carbon? The nature of light-absorbing carbonaceous aerosols, Atmos. Chem. Phys., 6, 3131–3148, https://doi.org/10.5194/acp-6-3131-2006, 2006.
Barsotti, F., Ghigo, G., and Vione, D.: Computational assessment of the fluorescence emission of phenol oligomers: A possible insight into the fluorescence properties of humic-like substances (HULIS), J. Photoch. Photobio. A, 315, 87–93, https://doi.org/10.1016/j.jphotochem.2015.09.012, 2016.
Baylon, P., Jaffe, D. A., Hall, S. R., Ullmann, K., Alvarado, M. J., and Lefer, B. L.: Impact of Biomass Burning Plumes on Photolysis Rates and Ozone Formation at the Mount Bachelor Observatory, J. Geophys. Res.-Atmos., 123, 2272–2284, https://doi.org/10.1002/2017jd027341, 2018.
Bikkina, S. and Sarin, M.: Brown carbon in the continental outflow to the North Indian Ocean, Environ. Sci.-Proc. Imp., 21, 970–987, https://doi.org/10.1039/c9em00089e, 2019.
Birdwell, J. E. and Engel, A. S.: Characterization of dissolved organic matter in cave and spring waters using UV–Vis absorbance and fluorescence spectroscopy, Org. Geochem., 41, 270–280, https://doi.org/10.1016/j.orggeochem.2009.11.002, 2010.
Borrás, E. and Tortajada-Genaro, L. A.: Secondary organic aerosol formation from the photo-oxidation of benzene, Atmos. Environ., 47, 154–163, https://doi.org/10.1016/j.atmosenv.2011.11.020, 2012.
Browne, E. C., Zhang, X., Franklin, J. P., Ridley, K. J., Kirchstetter, T. W., Wilson, K. R., Cappa, C. D., and Kroll, J. H.: Effect of heterogeneous oxidative aging on light absorption by biomass burning organic aerosol, Aerosol Sci. Tech., 53, 663–674, https://doi.org/10.1080/02786826.2019.1599321, 2019.
Cai, J., Zeng, X., Zhi, G., Gligorovski, S., Sheng, G., Yu, Z., Wang, X., and Peng, P.: Molecular composition and photochemical evolution of water-soluble organic carbon (WSOC) extracted from field biomass burning aerosols using high-resolution mass spectrometry, Atmos. Chem. Phys., 20, 6115–6128, https://doi.org/10.5194/acp-20-6115-2020, 2020.
Canagaratna, M. R., Jimenez, J. L., Kroll, J. H., Chen, Q., Kessler, S. H., Massoli, P., Hildebrandt Ruiz, L., Fortner, E., Williams, L. R., Wilson, K. R., Surratt, J. D., Donahue, N. M., Jayne, J. T., and Worsnop, D. R.: Elemental ratio measurements of organic compounds using aerosol mass spectrometry: characterization, improved calibration, and implications, Atmos. Chem. Phys., 15, 253–272, https://doi.org/10.5194/acp-15-253-2015, 2015.
Cao, T., Li, M., Zou, C., Fan, X., Song, J., Jia, W., Yu, C., Yu, Z., and Peng, P.: Chemical composition, optical properties, and oxidative potential of water- and methanol-soluble organic compounds emitted from the combustion of biomass materials and coal, Atmos. Chem. Phys., 21, 13187–13205, https://doi.org/10.5194/acp-21-13187-2021, 2021.
Chen, Q., Miyazaki, Y., Kawamura, K., Matsumoto, K., Coburn, S., Volkamer, R., Iwamoto, Y., Kagami, S., Deng, Y., Ogawa, S., Ramasamy, S., Kato, S., Ida, A., Kajii, Y., and Mochida, M.: Characterization of Chromophoric Water-Soluble Organic Matter in Urban, Forest, and Marine Aerosols by HR-ToF-AMS Analysis and Excitation-Emission Matrix Spectroscopy, Environ. Sci. Technol., 50, 10351–10360, https://doi.org/10.1021/acs.est.6b01643, 2016.
Chen, Q., Li, J., Hua, X., Jiang, X., Mu, Z., Wang, M., Wang, J., Shan, M., Yang, X., Fan, X., Song, J., Wang, Y., Guan, D., and Du, L.: Identification of species and sources of atmospheric chromophores by fluorescence excitation-emission matrix with parallel factor analysis, Sci. Total Environ., 718, 137322, https://doi.org/10.1016/j.scitotenv.2020.137322, 2020.
Chen, Q., Hua, X., Li, J., Chang, T., and Wang, Y.: Diurnal evolutions and sources of water-soluble chromophoric aerosols over Xi'an during haze event, in Northwest China, Sci. Total Environ., 786, 147412, https://doi.org/10.1016/j.scitotenv.2021.147412, 2021.
Chen, W., Westerhoff, P., Leenheer, J. A., and Booksh, K.: Fluorescence excitation-emission matrix regional integration to quantify spectra for dissolved organic matter, Environ. Sci. Technol., 37, 5701–5710, https://doi.org/10.1021/es034354c, 2003.
Chen, Y. and Bond, T. C.: Light absorption by organic carbon from wood combustion, Atmos. Chem. Phys., 10, 1773–1787, https://doi.org/10.5194/acp-10-1773-2010, 2010.
Chen, Y., Ge, X., Chen, H., Xie, X., Chen, Y., Wang, J., Ye, Z., Bao, M., Zhang, Y., and Chen, M.: Seasonal light absorption properties of water-soluble brown carbon in atmospheric fine particles in Nanjing, China, Atmos. Environ., 187, 230–240, https://doi.org/10.1016/j.atmosenv.2018.06.002, 2018.
Chen, Y., Xie, X., Shi, Z., Li, Y., Gai, X., Wang, J., Li, H., Wu, Y., Zhao, X., Chen, M., and Ge, X.: Brown carbon in atmospheric fine particles in Yangzhou, China: Light absorption properties and source apportionment, Atmos. Res., 244, 105028, https://doi.org/10.1016/j.atmosres.2020.105028, 2020.
Cheng, Y., He, K.-b., Du, Z.-y., Engling, G., Liu, J.-m., Ma, Y.-l., Zheng, M., and Weber, R. J.: The characteristics of brown carbon aerosol during winter in Beijing, Atmos. Environ., 127, 355–364, https://doi.org/10.1016/j.atmosenv.2015.12.035, 2016.
Cheng, Y., He, K. B., Engling, G., Weber, R., Liu, J. M., Du, Z. Y., and Dong, S. P.: Brown and black carbon in Beijing aerosol: Implications for the effects of brown coating on light absorption by black carbon, Sci. Total Environ., 599–600, 1047–1055, https://doi.org/10.1016/j.scitotenv.2017.05.061, 2017.
Chhabra, P. S., Flagan, R. C., and Seinfeld, J. H.: Elemental analysis of chamber organic aerosol using an aerodyne high-resolution aerosol mass spectrometer, Atmos. Chem. Phys., 10, 4111–4131, https://doi.org/10.5194/acp-10-4111-2010, 2010.
Choudhary, V., Rajput, P., and Gupta, T.: Absorption properties and forcing efficiency of light-absorbing water-soluble organic aerosols: Seasonal and spatial variability, Environ. Pollut., 272, 115932, https://doi.org/10.1016/j.envpol.2020.115932, 2021.
Choudhary, V., Gupta, T., and Zhao, R.: Evolution of Brown Carbon Aerosols during Atmospheric Long-Range Transport in the South Asian Outflow and Himalayan Cryosphere, ACS Earth Sp. Chem., 6, 2335–2347, https://doi.org/10.1021/acsearthspacechem.2c00047, 2022.
Chow, J. C., Watson, J. G., Chen, L. W., Chang, M. C., Robinson, N. F., Trimble, D., and Kohl, S.: The IMPROVE_A temperature protocol for thermal/optical carbon analysis: maintaining consistency with a long-term database, J. Air Waste Manage., 57, 1014–1023, https://doi.org/10.3155/1047-3289.57.9.1014, 2007.
Cox, J. S., Smith, D. S., Warren, L. A., and Ferris, F. G.: Characterizing Heterogeneous Bacterial Surface Functional Groups Using Discrete Affinity Spectra for Proton Binding, Environ. Sci. Technol., 33, 4514–4521, https://doi.org/10.1021/es990627l, 1999.
Dao, X., Di, S., Zhang, X., Gao, P., Wang, L., Yan, L., Tang, G., He, L., Krafft, T., and Zhang, F.: Composition and sources of particulate matter in the Beijing-Tianjin-Hebei region and its surrounding areas during the heating season, Chemosphere, 291, 132779, https://doi.org/10.1016/j.chemosphere.2021.132779, 2022.
Deng, J., Ma, H., Wang, X., Zhong, S., Zhang, Z., Zhu, J., Fan, Y., Hu, W., Wu, L., Li, X., Ren, L., Pavuluri, C. M., Pan, X., Sun, Y., Wang, Z., Kawamura, K., and Fu, P.: Measurement report: Optical properties and sources of water-soluble brown carbon in Tianjin, North China – insights from organic molecular compositions, Atmos. Chem. Phys., 22, 6449–6470, https://doi.org/10.5194/acp-22-6449-2022, 2022.
Ditto, J. C., Machesky, J., and Gentner, D. R.: Analysis of reduced and oxidized nitrogen-containing organic compounds at a coastal site in summer and winter, Atmos. Chem. Phys., 22, 3045–3065, https://doi.org/10.5194/acp-22-3045-2022, 2022.
Du, Z., He, K., Cheng, Y., Duan, F., Ma, Y., Liu, J., Zhang, X., Zheng, M., and Weber, R.: A yearlong study of water-soluble organic carbon in Beijing II: Light absorption properties, Atmos. Environ., 89, 235–241, https://doi.org/10.1016/j.atmosenv.2014.02.022, 2014.
Fan, X., Wei, S., Zhu, M., Song, J., and Peng, P.: Comprehensive characterization of humic-like substances in smoke PM2.5 emitted from the combustion of biomass materials and fossil fuels, Atmos. Chem. Phys., 16, 13321–13340, https://doi.org/10.5194/acp-16-13321-2016, 2016.
Fan, X., Cao, T., Yu, X., Wang, Y., Xiao, X., Li, F., Xie, Y., Ji, W., Song, J., and Peng, P.: The evolutionary behavior of chromophoric brown carbon during ozone aging of fine particles from biomass burning, Atmos. Chem. Phys., 20, 4593–4605, https://doi.org/10.5194/acp-20-4593-2020, 2020.
Fan, X. J., Cao, T., Yu, X. F., Song, J. Z., Wang, Y., Xiao, X., Xie, Y., and Li, F. Y.: Emission characteristics and optical properties of extractable brown carbon from residential wood combustion, China Environ. Sci., 39, 3215–3224, https://doi.org/10.19674/j.cnki.issn1000-6923.2019.0380, 2019.
Farmer, D. K., Matsunaga, A., Docherty, K. S., Surratt, J. D., Seinfeld, J. H., Ziemann, P. J., and Jimenez, J. L.: Response of an aerosol mass spectrometer to organonitrates and organosulfates and implications for atmospheric chemistry, P. Natl. Acad. Sci. USA, 107, 6670–6675, https://doi.org/10.1073/pnas.0912340107, 2010.
Faust, J. A., Wong, J. P., Lee, A. K., and Abbatt, J. P.: Role of Aerosol Liquid Water in Secondary Organic Aerosol Formation from Volatile Organic Compounds, Environ. Sci. Technol., 51, 1405–1413, https://doi.org/10.1021/acs.est.6b04700, 2017.
Fellman, J. B., Hood, E., and Spencer, R. G. M.: Fluorescence spectroscopy opens new windows into dissolved organic matter dynamics in freshwater ecosystems: A review, Limnol. Oceanogr., 55, 2452–2462, https://doi.org/10.4319/lo.2010.55.6.2452, 2010.
Fu, P., Kawamura, K., Chen, J., Qin, M., Ren, L., Sun, Y., Wang, Z., Barrie, L. A., Tachibana, E., Ding, A., and Yamashita, Y.: Fluorescent water-soluble organic aerosols in the High Arctic atmosphere, Sci. Rep., 5, 9845, https://doi.org/10.1038/srep09845, 2015.
Ghosh, K. and Schnitzer, M.: Fluorescence Excitation-Spectra and Viscosity Behavior of a Fulvic-Acid and Its Copper and Iron Complexes, Soil Sci. Soc. Am. J., 45, 25–29, https://doi.org/10.2136/sssaj1981.03615995004500010005x, 1981.
Hawkins, L. N., Lemire, A. N., Galloway, M. M., Corrigan, A. L., Turley, J. J., Espelien, B. M., and De Haan, D. O.: Maillard Chemistry in Clouds and Aqueous Aerosol As a Source of Atmospheric Humic-Like Substances, Environ. Sci. Technol., 50, 7443–7452, https://doi.org/10.1021/acs.est.6b00909, 2016.
Heald, C. L., Kroll, J. H., Jimenez, J. L., Docherty, K. S., DeCarlo, P. F., Aiken, A. C., Chen, Q., Martin, S. T., Farmer, D. K., and Artaxo, P.: A simplified description of the evolution of organic aerosol composition in the atmosphere, Geophys. Res. Lett., 37, L08803, https://doi.org/10.1029/2010gl042737, 2010.
Heath, A. A., Ehrenhauser, F. S., and Valsaraj, K. T.: Effects of temperature, oxygen level, ionic strength, and pH on the reaction of benzene with hydroxyl radicals in aqueous atmospheric systems, J. Environ. Chem. Eng., 1, 822–830, https://doi.org/10.1016/j.jece.2013.07.023, 2013.
Hecobian, A., Zhang, X., Zheng, M., Frank, N., Edgerton, E. S., and Weber, R. J.: Water-Soluble Organic Aerosol material and the light-absorption characteristics of aqueous extracts measured over the Southeastern United States, Atmos. Chem. Phys., 10, 5965–5977, https://doi.org/10.5194/acp-10-5965-2010, 2010.
Herndon, S. C., Onasch, T. B., Wood, E. C., Kroll, J. H., Canagaratna, M. R., Jayne, J. T., Zavala, M. A., Knighton, W. B., Mazzoleni, C., Dubey, M. K., Ulbrich, I. M., Jimenez, J. L., Seila, R., de Gouw, J. A., de Foy, B., Fast, J., Molina, L. T., Kolb, C. E., and Worsnop, D. R.: Correlation of secondary organic aerosol with odd oxygen in Mexico City, Geophys. Res. Lett., 35, L15804, https://doi.org/10.1029/2008gl034058, 2008.
Hu, R., Xu, Q., Wang, S., Hua, Y., Bhattarai, N., Jiang, J., Song, Y., Daellenbach, K. R., Qi, L., Prevot, A. S. H., and Hao, J.: Chemical characteristics and sources of water-soluble organic aerosol in southwest suburb of Beijing, J. Environ. Sci., 95, 99–110, https://doi.org/10.1016/j.jes.2020.04.004, 2020.
Huang, R. J., Zhang, Y., Bozzetti, C., Ho, K. F., Cao, J. J., Han, Y., Daellenbach, K. R., Slowik, J. G., Platt, S. M., Canonaco, F., Zotter, P., Wolf, R., Pieber, S. M., Bruns, E. A., Crippa, M., Ciarelli, G., Piazzalunga, A., Schwikowski, M., Abbaszade, G., Schnelle-Kreis, J., Zimmermann, R., An, Z., Szidat, S., Baltensperger, U., El Haddad, I., and Prevot, A. S.: High secondary aerosol contribution to particulate pollution during haze events in China, Nature, 514, 218–222, https://doi.org/10.1038/nature13774, 2014.
Huang, R. J., Yang, L., Cao, J., Chen, Y., Chen, Q., Li, Y., Duan, J., Zhu, C., Dai, W., Wang, K., Lin, C., Ni, H., Corbin, J. C., Wu, Y., Zhang, R., Tie, X., Hoffmann, T., O'Dowd, C., and Dusek, U.: Brown Carbon Aerosol in Urban Xi'an, Northwest China: The Composition and Light Absorption Properties, Environ. Sci. Technol., 52, 6825–6833, https://doi.org/10.1021/acs.est.8b02386, 2018.
Huang, R. J., Yang, L., Shen, J., Yuan, W., Gong, Y., Guo, J., Cao, W., Duan, J., Ni, H., Zhu, C., Dai, W., Li, Y., Chen, Y., Chen, Q., Wu, Y., Zhang, R., Dusek, U., O'Dowd, C., and Hoffmann, T.: Water-Insoluble Organics Dominate Brown Carbon in Wintertime Urban Aerosol of China: Chemical Characteristics and Optical Properties, Environ. Sci. Technol., 54, 7836–7847, https://doi.org/10.1021/acs.est.0c01149, 2020.
Jiang, X., Liu, D., Li, Q., Tian, P., Wu, Y., Li, S., Hu, K., Ding, S., Bi, K., Li, R., Huang, M., Ding, D., Chen, Q., Kong, S., Li, W., Pang, Y., and He, D.: Connecting the Light Absorption of Atmospheric Organic Aerosols with Oxidation State and Polarity, Environ. Sci. Technol., 56, 12873–12885, https://doi.org/10.1021/acs.est.2c02202, 2022.
Kasthuriarachchi, N. Y., Rivellini, L. H., Chen, X., Li, Y. J., and Lee, A. K. Y.: Effect of Relative Humidity on Secondary Brown Carbon Formation in Aqueous Droplets, Environ. Sci. Technol., 54, 13207–13216, https://doi.org/10.1021/acs.est.0c01239, 2020.
Kim, H., Collier, S., Ge, X., Xu, J., Sun, Y., Jiang, W., Wang, Y., Herckes, P., and Zhang, Q.: Chemical processing of water-soluble species and formation of secondary organic aerosol in fogs, Atmos. Environ., 200, 158–166, https://doi.org/10.1016/j.atmosenv.2018.11.062, 2019.
Kuwata, M., Zorn, S. R., and Martin, S. T.: Using elemental ratios to predict the density of organic material composed of carbon, hydrogen, and oxygen, Environ. Sci. Technol., 46, 787–794, https://doi.org/10.1021/es202525q, 2012.
Lambe, A. T., Cappa, C. D., Massoli, P., Onasch, T. B., Forestieri, S. D., Martin, A. T., Cummings, M. J., Croasdale, D. R., Brune, W. H., Worsnop, D. R., and Davidovits, P.: Relationship between oxidation level and optical properties of secondary organic aerosol, Environ. Sci. Technol., 47, 6349–6357, https://doi.org/10.1021/es401043j, 2013.
Laskin, A., Laskin, J., and Nizkorodov, S. A.: Chemistry of atmospheric brown carbon, Chem. Rev., 115, 4335–4382, https://doi.org/10.1021/cr5006167, 2015.
Lawaetz, A. J. and Stedmon, C. A.: Fluorescence intensity calibration using the Raman scatter peak of water, Appl. Spectrosc., 63, 936–940, https://doi.org/10.1366/000370209788964548, 2009.
Lee, H. J., Laskin, A., Laskin, J., and Nizkorodov, S. A.: Excitation-emission spectra and fluorescence quantum yields for fresh and aged biogenic secondary organic aerosols, Environ. Sci. Technol., 47, 5763–5770, https://doi.org/10.1021/es400644c, 2013.
Lei, L., Zhou, W., Chen, C., He, Y., Li, Z., Sun, J., Tang, X., Fu, P., Wang, Z., and Sun, Y.: Long-term characterization of aerosol chemistry in cold season from 2013 to 2020 in Beijing, China, Environ. Pollut., 268, 115952, https://doi.org/10.1016/j.envpol.2020.115952, 2021.
Lei, Y., Shen, Z., Zhang, T., Zhang, Q., Wang, Q., Sun, J., Gong, X., Cao, J., Xu, H., Liu, S., and Yang, L.: Optical source profiles of brown carbon in size-resolved particulate matter from typical domestic biofuel burning over Guanzhong Plain, China, Sci. Total Environ., 622–623, 244–251, https://doi.org/10.1016/j.scitotenv.2017.11.353, 2018.
Li, C., He, Q., Hettiyadura, A. P. S., Kafer, U., Shmul, G., Meidan, D., Zimmermann, R., Brown, S. S., George, C., Laskin, A., and Rudich, Y.: Formation of Secondary Brown Carbon in Biomass Burning Aerosol Proxies through NO3 Radical Reactions, Environ. Sci. Technol., 54, 1395–1405, https://doi.org/10.1021/acs.est.9b05641, 2020.
Li, H., Qin, X., Wang, G., Xu, J., Wang, L., Lu, D., Liu, C., Zheng, H., Liu, J., Huang, K., and Deng, C.: Conjoint impacts of continental outflows and marine sources on brown carbon in the East China sea: Abundances, optical properties, and formation processes, Atmos. Environ., 273, 118959, https://doi.org/10.1016/j.atmosenv.2022.118959, 2022.
Li, J., Zhang, Q., Wang, G., Li, J., Wu, C., Liu, L., Wang, J., Jiang, W., Li, L., Ho, K. F., and Cao, J.: Optical properties and molecular compositions of water-soluble and water-insoluble brown carbon (BrC) aerosols in northwest China, Atmos. Chem. Phys., 20, 4889–4904, https://doi.org/10.5194/acp-20-4889-2020, 2020.
Lin, P., Liu, J., Shilling, J. E., Kathmann, S. M., Laskin, J., and Laskin, A.: Molecular characterization of brown carbon (BrC) chromophores in secondary organic aerosol generated from photo-oxidation of toluene, Phys. Chem. Chem. Phys., 17, 23312–23325, https://doi.org/10.1039/c5cp02563j, 2015.
Lin, P., Aiona, P. K., Li, Y., Shiraiwa, M., Laskin, J., Nizkorodov, S. A., and Laskin, A.: Molecular Characterization of Brown Carbon in Biomass Burning Aerosol Particles, Environ. Sci. Technol., 50, 11815–11824, https://doi.org/10.1021/acs.est.6b03024, 2016.
Lin, P., Bluvshtein, N., Rudich, Y., Nizkorodov, S. A., Laskin, J., and Laskin, A.: Molecular Chemistry of Atmospheric Brown Carbon Inferred from a Nationwide Biomass Burning Event, Environ. Sci. Technol., 51, 11561–11570, https://doi.org/10.1021/acs.est.7b02276, 2017.
Liu, C., Liu, Y., Chen, T., Liu, J., and He, H.: Rate constant and secondary organic aerosol formation from the gas-phase reaction of eugenol with hydroxyl radicals, Atmos. Chem. Phys., 19, 2001–2013, https://doi.org/10.5194/acp-19-2001-2019, 2019.
Liu, J., Bergin, M., Guo, H., King, L., Kotra, N., Edgerton, E., and Weber, R. J.: Size-resolved measurements of brown carbon in water and methanol extracts and estimates of their contribution to ambient fine-particle light absorption, Atmos. Chem. Phys., 13, 12389–12404, https://doi.org/10.5194/acp-13-12389-2013, 2013.
Liu, J. M., Wang, P. F., Zhang, H. L., Du, Z. Y., Zheng, B., Yu, Q. Q., Zheng, G. J., Ma, Y. L., Zheng, M., Cheng, Y., Zhang, Q., and He, K. B.: Integration of field observation and air quality modeling to characterize Beijing aerosol in different seasons, Chemosphere, 242, 125195, https://doi.org/10.1016/j.chemosphere.2019.125195, 2020.
Matos, J. T. V., Freire, S. M. S. C., Duarte, R. M. B. O., and Duarte, A. C.: Natural organic matter in urban aerosols: Comparison between water and alkaline soluble components using excitation–emission matrix fluorescence spectroscopy and multiway data analysis, Atmos. Environ., 102, 1–10, https://doi.org/10.1016/j.atmosenv.2014.11.042, 2015.
McKnight, D. M., Boyer, E. W., Westerhoff, P. K., Doran, P. T., Kulbe, T., and Andersen, D. T.: Spectrofluorometric characterization of dissolved organic matter for indication of precursor organic material and aromaticity, Limnol. Oceanogr., 46, 38–48, https://doi.org/10.4319/lo.2001.46.1.0038, 2001.
Mei, Y., Wang, L., and Wu, F.: Effects of water chemistry and concentrations of dissolved organic matter on its fluorescence characteristics and molecular conformation, Chin. J. Geochem., 28, 413–420, https://doi.org/10.1007/s11631-009-0413-2, 2009.
Milne, C. J., Kinniburgh, D. G., and Tipping, E.: Generic NICA-Donnan model parameters for proton binding by humic substances, Environ. Sci. Technol., 35, 2049–2059, https://doi.org/10.1021/es000123j, 2001.
Minakata, D., Li, K., Westerhoff, P., and Crittenden, J.: Development of a group contribution method to predict aqueous phase hydroxyl radical (HO*) reaction rate constants, Environ. Sci. Technol., 43, 6220–6227, https://doi.org/10.1021/es900956c, 2009.
Mo, Y., Li, J., Jiang, B., Su, T., Geng, X., Liu, J., Jiang, H., Shen, C., Ding, P., Zhong, G., Cheng, Z., Liao, Y., Tian, C., Chen, Y., and Zhang, G.: Sources, compositions, and optical properties of humic-like substances in Beijing during the 2014 APEC summit: Results from dual carbon isotope and Fourier-transform ion cyclotron resonance mass spectrometry analyses, Environ. Pollut., 239, 322–331, https://doi.org/10.1016/j.envpol.2018.04.041, 2018.
Moise, T., Flores, J. M., and Rudich, Y.: Optical properties of secondary organic aerosols and their changes by chemical processes, Chem. Rev., 115, 4400–4439, https://doi.org/10.1021/cr5005259, 2015.
Mok, J., Krotkov, N. A., Arola, A., Torres, O., Jethva, H., Andrade, M., Labow, G., Eck, T. F., Li, Z., Dickerson, R. R., Stenchikov, G. L., Osipov, S., and Ren, X.: Impacts of brown carbon from biomass burning on surface UV and ozone photochemistry in the Amazon Basin, Sci. Rep., 6, 36940, https://doi.org/10.1038/srep36940, 2016.
Murphy, K. R., Stedmon, C. A., Graeber, D., and Bro, R.: Fluorescence spectroscopy and multi-way techniques. PARAFAC, Anal. Methods, 5, 6557-6566, https://doi.org/10.1039/c3ay41160e, 2013.
Ng, N. L., Canagaratna, M. R., Jimenez, J. L., Chhabra, P. S., Seinfeld, J. H., and Worsnop, D. R.: Changes in organic aerosol composition with aging inferred from aerosol mass spectra, Atmos. Chem. Phys., 11, 6465–6474, https://doi.org/10.5194/acp-11-6465-2011, 2011.
Ni, H., Huang, R. J., Pieber, S. M., Corbin, J. C., Stefenelli, G., Pospisilova, V., Klein, F., Gysel-Beer, M., Yang, L., Baltensperger, U., Haddad, I. E., Slowik, J. G., Cao, J., Prevot, A. S. H., and Dusek, U.: Brown Carbon in Primary and Aged Coal Combustion Emission, Environ. Sci. Technol., 55, 5701–5710, https://doi.org/10.1021/acs.est.0c08084, 2021.
Ni, H., Huang, R. J., Yao, P., Cosijn, M. M., Kairys, N., Zhong, H., and Dusek, U.: Organic aerosol formation and aging processes in Beijing constrained by size-resolved measurements of radiocarbon and stable isotopic 13C, Environ. Int., 158, 106890, https://doi.org/10.1016/j.envint.2021.106890, 2022.
Ohno, T.: Fluorescence inner-filtering correction for determining the humification index of dissolved organic matter, Environ. Sci. Technol., 36, 742–746, https://doi.org/10.1021/es0155276, 2002.
Phillips, S. M., Bellcross, A. D., and Smith, G. D.: Light Absorption by Brown Carbon in the Southeastern United States is pH-dependent, Environ. Sci. Technol., 51, 6782–6790, https://doi.org/10.1021/acs.est.7b01116, 2017.
Psichoudaki, M. and Pandis, S. N.: Atmospheric aerosol water-soluble organic carbon measurement: a theoretical analysis, Environ. Sci. Technol., 47, 9791–9798, https://doi.org/10.1021/es402270y, 2013.
Qin, J., Zhang, L., Zhou, X., Duan, J., Mu, S., Xiao, K., Hu, J., and Tan, J.: Fluorescence fingerprinting properties for exploring water-soluble organic compounds in PM2.5 in an industrial city of northwest China, Atmos. Environ., 184, 203–211, https://doi.org/10.1016/j.atmosenv.2018.04.049, 2018.
Qin, J., Zhang, L., Qin, Y., Shi, S., Li, J., Gao, Y., Tan, J., and Wang, X.: pH-Dependent Chemical Transformations of Humic-Like Substances and Further Cognitions Revealed by Optical Methods, Environ. Sci. Technol., 56, 7578–7587, https://doi.org/10.1021/acs.est.1c07729, 2022a.
Qin, J., Tan, J., Zhou, X., Yang, Y., Qin, Y., Wang, X., Shi, S., Xiao, K., and Wang, X.: Measurement report: Particle-size-dependent fluorescence properties of water-soluble organic compounds (WSOCs) and their atmospheric implications for the aging of WSOCs, Atmos. Chem. Phys., 22, 465–479, https://doi.org/10.5194/acp-22-465-2022, 2022b.
Qin, Y., Yang, Y., Qin, J., Zhang, L., Guo, S., Zhou, X., Chen, R., Tan, J., Xiao, K., and Wang, X.: pH-Responsive Fluorescence EEM to Titrate the Interaction between Fluorophores and Acid/Base Groups in Water-Soluble Organic Compounds of PM2.5, Environ. Sci. Technol. Lett., 8, 108–113, https://doi.org/10.1021/acs.estlett.0c00645, 2020.
Qin, Y., Qin, J., Wang, X., Xiao, K., Qi, T., Gao, Y., Zhou, X., Shi, S., Li, J., Gao, J., Zhang, Z., Tan, J., Zhang, Y., and Chen, R.: Measurement report: Investigation of pH- and particle-size-dependent chemical and optical properties of water-soluble organic carbon: implications for its sources and aging processes, Atmos. Chem. Phys., 22, 13845–13859, https://doi.org/10.5194/acp-22-13845-2022, 2022.
Raja, S., Raghunathan, R., Kommalapati, R. R., Shen, X., Collett, J. L., and Valsaraj, K. T.: Organic composition of fogwater in the Texas–Louisiana gulf coast corridor, Atmos. Environ., 43, 4214-4222, https://doi.org/10.1016/j.atmosenv.2009.05.029, 2009.
Saleh, R.: From Measurements to Models: Toward Accurate Representation of Brown Carbon in Climate Calculations, Curr. Pollut. Rep., 6, 90–104, https://doi.org/10.1007/s40726-020-00139-3, 2020.
Shan, Y., Guan, D., Hubacek, K., Zheng, B., Davis, S. J., Jia, L., Liu, J., Liu, Z., Fromer, N., Mi, Z., Meng, J., Deng, X., Li, Y., Lin, J., Schroeder, H., Weisz, H., and Schellnhuber, H. J.: City-level climate change mitigation in China, Sci. Adv., 4, eaaq0390, https://doi.org/10.1126/sciadv.aaq0390, 2018.
Song, C., Gyawali, M., Zaveri, R. A., Shilling, J. E., and Arnott, W. P.: Light absorption by secondary organic aerosol fromá-pinene: Effects of oxidants, seed aerosol acidity, and relative humidity, J. Geophys. Res.-Atmos., 118, 11741–711749, https://doi.org/10.1002/jgrd.50767, 2013.
Sumlin, B. J., Pandey, A., Walker, M. J., Pattison, R. S., Williams, B. J., and Chakrabarty, R. K.: Atmospheric Photooxidation Diminishes Light Absorption by Primary Brown Carbon Aerosol from Biomass Burning, Environ. Sci. Technol. Lett., 4, 540–545, https://doi.org/10.1021/acs.estlett.7b00393, 2017.
Sun, Y., Wang, Z., Fu, P., Jiang, Q., Yang, T., Li, J., and Ge, X.: The impact of relative humidity on aerosol composition and evolution processes during wintertime in Beijing, China, Atmos. Environ., 77, 927–934, https://doi.org/10.1016/j.atmosenv.2013.06.019, 2013.
Sun, Y., Du, W., Fu, P., Wang, Q., Li, J., Ge, X., Zhang, Q., Zhu, C., Ren, L., Xu, W., Zhao, J., Han, T., Worsnop, D. R., and Wang, Z.: Primary and secondary aerosols in Beijing in winter: sources, variations and processes, Atmos. Chem. Phys., 16, 8309–8329, https://doi.org/10.5194/acp-16-8309-2016, 2016.
Sun, Y. L., Zhang, Q., Schwab, J. J., Yang, T., Ng, N. L., and Demerjian, K. L.: Factor analysis of combined organic and inorganic aerosol mass spectra from high resolution aerosol mass spectrometer measurements, Atmos. Chem. Phys., 12, 8537–8551, https://doi.org/10.5194/acp-12-8537-2012, 2012.
Tan, J., Xiang, P., Zhou, X., Duan, J., Ma, Y., He, K., Cheng, Y., Yu, J., and Querol, X.: Chemical characterization of humic-like substances (HULIS) in PM2.5 in Lanzhou, China, Sci. Total Environ., 573, 1481–1490, https://doi.org/10.1016/j.scitotenv.2016.08.025, 2016.
Tang, J., Li, J., Su, T., Han, Y., Mo, Y., Jiang, H., Cui, M., Jiang, B., Chen, Y., Tang, J., Song, J., Peng, P., and Zhang, G.: Molecular compositions and optical properties of dissolved brown carbon in biomass burning, coal combustion, and vehicle emission aerosols illuminated by excitation–emission matrix spectroscopy and Fourier transform ion cyclotron resonance mass spectrometry analysis, Atmos. Chem. Phys., 20, 2513–2532, https://doi.org/10.5194/acp-20-2513-2020, 2020.
Tao, J., Zhang, Z., Zhang, L., Li, J., Wu, Y., Pei, C., and Nie, F.: Quantifying the relative contributions of aqueous phase and photochemical processes to water-soluble organic carbon formation in winter in a megacity of South China, Chemosphere, 300, 134598, https://doi.org/10.1016/j.chemosphere.2022.134598, 2022.
Vidovic, K., Lasic Jurkovic, D., Sala, M., Kroflic, A., and Grgic, I.: Nighttime Aqueous-Phase Formation of Nitrocatechols in the Atmospheric Condensed Phase, Environ. Sci. Technol., 52, 9722–9730, https://doi.org/10.1021/acs.est.8b01161, 2018.
Wang, H., Zhang, L., Huo, T., Wang, B., Yang, F., Chen, Y., Tian, M., Qiao, B., and Peng, C.: Application of parallel factor analysis model to decompose excitation-emission matrix fluorescence spectra for characterizing sources of water-soluble brown carbon in PM2.5, Atmos. Environ., 223, 117192, https://doi.org/10.1016/j.atmosenv.2019.117192, 2020.
Wang, J., Ye, J., Zhang, Q., Zhao, J., Wu, Y., Li, J., Liu, D., Li, W., Zhang, Y., Wu, C., Xie, C., Qin, Y., Lei, Y., Huang, X., Guo, J., Liu, P., Fu, P., Li, Y., Lee, H. C., Choi, H., Zhang, J., Liao, H., Chen, M., Sun, Y., Ge, X., Martin, S. T., and Jacob, D. J.: Aqueous production of secondary organic aerosol from fossil-fuel emissions in winter Beijing haze, P. Natl. Acad. Sci. USA, 118, e2022179118, https://doi.org/10.1073/pnas.2022179118, 2021.
Wang, X., Heald, C. L., Liu, J., Weber, R. J., Campuzano-Jost, P., Jimenez, J. L., Schwarz, J. P., and Perring, A. E.: Exploring the observational constraints on the simulation of brown carbon, Atmos. Chem. Phys., 18, 635–653, https://doi.org/10.5194/acp-18-635-2018, 2018.
Wang, Y., Hu, M., Lin, P., Tan, T., Li, M., Xu, N., Zheng, J., Du, Z., Qin, Y., Wu, Y., Lu, S., Song, Y., Wu, Z., Guo, S., Zeng, L., Huang, X., and He, L.: Enhancement in Particulate Organic Nitrogen and Light Absorption of Humic-Like Substances over Tibetan Plateau Due to Long-Range Transported Biomass Burning Emissions, Environ. Sci. Technol., 53, 14222–14232, https://doi.org/10.1021/acs.est.9b06152, 2019.
Washenfelder, R. A., Attwood, A. R., Brock, C. A., Guo, H., Xu, L., Weber, R. J., Ng, N. L., Allen, H. M., Ayres, B. R., Baumann, K., Cohen, R. C., Draper, D. C., Duffey, K. C., Edgerton, E., Fry, J. L., Hu, W. W., Jimenez, J. L., Palm, B. B., Romer, P., Stone, E. A., Wooldridge, P. J., and Brown, S. S.: Biomass burning dominates brown carbon absorption in the rural southeastern United States, Geophys. Res. Lett., 42, 653–664, https://doi.org/10.1002/2014gl062444, 2015.
Wen, H., Zhou, Y., Xu, X., Wang, T., Chen, Q., Chen, Q., Li, W., Wang, Z., Huang, Z., Zhou, T., Shi, J., Bi, J., Ji, M., and Wang, X.: Water-soluble brown carbon in atmospheric aerosols along the transport pathway of Asian dust: Optical properties, chemical compositions, and potential sources, Sci. Total Environ., 789, 147971, https://doi.org/10.1016/j.scitotenv.2021.147971, 2021.
Wu, G., Ram, K., Fu, P., Wang, W., Zhang, Y., Liu, X., Stone, E. A., Pradhan, B. B., Dangol, P. M., Panday, A. K., Wan, X., Bai, Z., Kang, S., Zhang, Q., and Cong, Z.: Water-Soluble Brown Carbon in Atmospheric Aerosols from Godavari (Nepal), a Regional Representative of South Asia, Environ. Sci. Technol., 53, 3471–3479, https://doi.org/10.1021/acs.est.9b00596, 2019.
Xu, J., Zhang, Q., Li, X., Ge, X., Xiao, C., Ren, J., and Qin, D.: Dissolved organic matter and inorganic ions in a central Himalayan glacier–insights into chemical composition and atmospheric sources, Environ. Sci. Technol., 47, 6181–6188, https://doi.org/10.1021/es4009882, 2013.
Xu, J., Zhang, Q., Chen, M., Ge, X., Ren, J., and Qin, D.: Chemical composition, sources, and processes of urban aerosols during summertime in northwest China: insights from high-resolution aerosol mass spectrometry, Atmos. Chem. Phys., 14, 12593–12611, https://doi.org/10.5194/acp-14-12593-2014, 2014.
Xu, J., Shi, J., Zhang, Q., Ge, X., Canonaco, F., Prévôt, A. S. H., Vonwiller, M., Szidat, S., Ge, J., Ma, J., An, Y., Kang, S., and Qin, D.: Wintertime organic and inorganic aerosols in Lanzhou, China: sources, processes, and comparison with the results during summer, Atmos. Chem. Phys., 16, 14937–14957, https://doi.org/10.5194/acp-16-14937-2016, 2016.
Xu, J., Ge, X., Zhang, X., Zhao, W., Zhang, R., and Zhang, Y.: COVID-19 Impact on the Concentration and Composition of Submicron Particulate Matter in a Typical City of Northwest China, Geophys. Res. Lett., 47, e2020GL089035, https://doi.org/10.1029/2020GL089035, 2020a.
Xu, J., Hettiyadura, A. P. S., Liu, Y., Zhang, X., Kang, S., and Laskin, A.: Regional Differences of Chemical Composition and Optical Properties of Aerosols in the Tibetan Plateau, J. Geophys. Res.-Atmos., 125, e2019JD031226, https://doi.org/10.1029/2019jd031226, 2020b.
Xu, J., Hettiyadura, A. P. S., Liu, Y., Zhang, X., Kang, S., and Laskin, A.: Atmospheric Brown Carbon on the Tibetan Plateau: Regional Differences in Chemical Composition and Light Absorption Properties, Environ. Sci. Tech. Lett., 9, 219–225, https://doi.org/10.1021/acs.estlett.2c00016, 2022.
Xu, J. Z., Zhang, Q., Wang, Z. B., Yu, G. M., Ge, X. L., and Qin, X.: Chemical composition and size distribution of summertime PM2.5 at a high altitude remote location in the northeast of the Qinghai–Xizang (Tibet) Plateau: insights into aerosol sources and processing in free troposphere, Atmos. Chem. Phys., 15, 5069–5081, https://doi.org/10.5194/acp-15-5069-2015, 2015.
Yan, G. and Kim, G.: Speciation and Sources of Brown Carbon in Precipitation at Seoul, Korea: Insights from Excitation-Emission Matrix Spectroscopy and Carbon Isotopic Analysis, Environ. Sci. Technol., 51, 11580–11587, https://doi.org/10.1021/acs.est.7b02892, 2017.
Yang, H., Xu, G., Mao, H., and Wang, Y.: Spatiotemporal Variation in Precipitation and Water Vapor Transport Over Central Asia in Winter and Summer Under Global Warming, Front. Earth Sci., 8, 297, https://doi.org/10.3389/feart.2020.00297, 2020.
Yang, Y., Qin, J., Qi, T., Zhou, X., Chen, R., Tan, J., Xiao, K., Ji, D., He, K., and Chen, X.: Fluorescence characteristics of particulate water-soluble organic compounds emitted from coal-fired boilers, Atmos. Environ., 223, 117297, https://doi.org/10.1016/j.atmosenv.2020.117297, 2020.
Ye, Z., Liu, J., Gu, A., Feng, F., Liu, Y., Bi, C., Xu, J., Li, L., Chen, H., Chen, Y., Dai, L., Zhou, Q., and Ge, X.: Chemical characterization of fine particulate matter in Changzhou, China, and source apportionment with offline aerosol mass spectrometry, Atmos. Chem. Phys., 17, 2573–2592, https://doi.org/10.5194/acp-17-2573-2017, 2017.
Yuan, W., Huang, R.-J., Yang, L., Ni, H., Wang, T., Cao, W., Duan, J., Guo, J., Huang, H., and Hoffmann, T.: Concentrations, optical properties and sources of humic-like substances (HULIS) in fine particulate matter in Xi'an, Northwest China, Sci. Total Environ., 789, 147902, https://doi.org/10.1016/j.scitotenv.2021.147902, 2021.
Yue, S., Ren, L., Song, T., Li, L., Xie, Q., Li, W., Kang, M., Zhao, W., Wei, L., Ren, H., Sun, Y., Wang, Z., Ellam, R. M., Liu, C. Q., Kawamura, K., and Fu, P.: Abundance and Diurnal Trends of Fluorescent Bioaerosols in the Troposphere over Mt. Tai, China, in Spring, J. Geophys. Res.-Atmos., 124, 4158–4173, https://doi.org/10.1029/2018jd029486, 2019.
Zeng, L., Zhang, A., Wang, Y., Wagner, N. L., Katich, J. M., Schwarz, J. P., Schill, G. P., Brock, C., Froyd, K. D., Murphy, D. M., Williamson, C. J., Kupc, A., Scheuer, E., Dibb, J., and Weber, R. J.: Global Measurements of Brown Carbon and Estimated Direct Radiative Effects, Geophys. Res. Lett., 47, e2020GL088747, https://doi.org/10.1029/2020GL088747, 2020.
Zeng, Y. L., Ning, Y. L., Shen, Z. X., Zhang, L. M., Zhang, T., Lei, Y. L., Zhang, Q., Li, G. H., Xu, H. M., Ho, S. S. H., and Cao, J. J.: The Roles of N, S, and O in Molecular Absorption Features of Brown Carbon in PM2.5 in a Typical Semi-Arid Megacity in Northwestern China, J. Geophys. Res.-Atmos., 126, e2021JD034791, https://doi.org/10.1029/2021JD034791, 2021.
Zhang, Q., Shen, Z., Zhang, L., Zeng, Y., Ning, Z., Zhang, T., Lei, Y., Wang, Q., Li, G., Sun, J., Westerdahl, D., Xu, H., and Cao, J.: Investigation of Primary and Secondary Particulate Brown Carbon in Two Chinese Cities of Xi'an and Hong Kong in Wintertime, Environ. Sci. Technol., 54, 3803–3813, https://doi.org/10.1021/acs.est.9b05332, 2020.
Zhang, X., Lin, Y. H., Surratt, J. D., and Weber, R. J.: Sources, composition and absorption Angstrom exponent of light-absorbing organic components in aerosol extracts from the Los Angeles Basin, Environ. Sci. Technol., 47, 3685–3693, https://doi.org/10.1021/es305047b, 2013.
Zhang, X., Ding, X., Talifu, D., Wang, X., Abulizi, A., Maihemuti, M., and Rekefu, S.: Humidity and PM2.5 composition determine atmospheric light extinction in the arid region of northwest China, J. Environ. Sci., 100, 279–286, https://doi.org/10.1016/j.jes.2020.07.007, 2021a.
Zhang, X., Xu, J., Kang, S., Sun, J., Shi, J., Gong, C., Sun, X., Du, H., Ge, X., and Zhang, Q.: Regional Differences in the Light Absorption Properties of Fine Particulate Matter Over the Tibetan Plateau: Insights From HR-ToF-AMS and Aethalometer Measurements, J. Geophys. Res.-Atmos., 126, e2021JD035562, https://doi.org/10.1029/2021jd035562, 2021b.
Zhang, Y., Xu, J., Shi, J., Xie, C., Ge, X., Wang, J., Kang, S., and Zhang, Q.: Light absorption by water-soluble organic carbon in atmospheric fine particles in the central Tibetan Plateau, Environ. Sci. Pollut. R., 24, 21386–21397, https://doi.org/10.1007/s11356-017-9688-8, 2017.
Zhang, Y., Shi, Z., Wang, Y., Liu, L., Zhang, J., Li, J., Xia, Y., Ding, X., Liu, D., Kong, S., Niu, H., Fu, P., Zhang, X., and Li, W.: Fine particles from village air in northern China in winter: Large contribution of primary organic aerosols from residential solid fuel burning, Environ. Pollut., 272, 116420, https://doi.org/10.1016/j.envpol.2020.116420, 2021.
Zhang, Y.-L., El-Haddad, I., Huang, R.-J., Ho, K.-F., Cao, J.-J., Han, Y., Zotter, P., Bozzetti, C., Daellenbach, K. R., Slowik, J. G., Salazar, G., Prévôt, A. S. H., and Szidat, S.: Large contribution of fossil fuel derived secondary organic carbon to water soluble organic aerosols in winter haze in China, Atmos. Chem. Phys., 18, 4005–4017, https://doi.org/10.5194/acp-18-4005-2018, 2018.
Zhao, R., Lee, A. K. Y., Huang, L., Li, X., Yang, F., and Abbatt, J. P. D.: Photochemical processing of aqueous atmospheric brown carbon, Atmos. Chem. Phys., 15, 6087–6100, https://doi.org/10.5194/acp-15-6087-2015, 2015.
Zhao, W., Zhang, X., Zhai, L., Shen, X., and Xu, J.: Chemical characterization and sources of submicron aerosols in Lhasa on the Qinghai–Tibet Plateau: Insights from high-resolution mass spectrometry, Sci. Total Environ., 815, 152866, https://doi.org/10.1016/j.scitotenv.2021.152866, 2022.
Zhou, Y., West, C. P., Hettiyadura, A. P. S., Niu, X., Wen, H., Cui, J., Shi, T., Pu, W., Wang, X., and Laskin, A.: Measurement report: Molecular composition, optical properties, and radiative effects of water-soluble organic carbon in snowpack samples from northern Xinjiang, China, Atmos. Chem. Phys., 21, 8531–8555, https://doi.org/10.5194/acp-21-8531-2021, 2021.
Zhou, Y., West, C. P., Hettiyadura, A. P. S., Pu, W., Shi, T., Niu, X., Wen, H., Cui, J., Wang, X., and Laskin, A.: Molecular Characterization of Water-Soluble Brown Carbon Chromophores in Snowpack from Northern Xinjiang, China, Environ. Sci. Technol., 56, 4173–4186, https://doi.org/10.1021/acs.est.1c07972, 2022.
Zhu, C. S., Cao, J. J., Huang, R. J., Shen, Z. X., Wang, Q. Y., and Zhang, N. N.: Light absorption properties of brown carbon over the southeastern Tibetan Plateau, Sci. Total Environ., 625, 246–251, https://doi.org/10.1016/j.scitotenv.2017.12.183, 2018.
Zou, C., Cao, T., Li, M., Song, J., Jiang, B., Jia, W., Li, J., Ding, X., Yu, Z., Zhang, G., and Peng, P.: Measurement report: Changes in light absorption and molecular composition of water-soluble humic-like substances during a winter haze bloom-decay process in Guangzhou, China, Atmos. Chem. Phys., 23, 963–979, https://doi.org/10.5194/acp-23-963-2023, 2023.
Zsolnay, A., Baigar, E., Jimenez, M., Steinweg, B., and Saccomandi, F.: Differentiating with fluorescence spectroscopy the sources of dissolved organic matter in soils subjected to drying, Chemosphere, 38, 45–50, https://doi.org/10.1016/s0045-6535(98)00166-0, 1999.