the Creative Commons Attribution 4.0 License.
the Creative Commons Attribution 4.0 License.
 | 05 Oct 2023
Vortex preconditioning of the 2021 sudden stratospheric warming: barotropic–baroclinic instability associated with the double westerly jets
Ji-Hee Yoo
Hye-Yeong Chun
Min-Jee Kang
This study explores the abrupt split of the polar vortex in the upper stratosphere prior to a recent sudden stratospheric warming event on 5 January 2021 (SSW21) and the mechanisms of vortex preconditioning by using the Modern-Era Retrospective Analysis for Research and Applications version 2 (MERRA2) global reanalysis data. SSW21 is preceded by the highly distorted polar vortex that was initially displaced from the pole but eventually split at the onset date. Vortex splitting is most significant in the upper stratosphere (1 hPa altitude) accompanied by the anomalous growth of westward-propagating planetary waves (PWs) of zonal wavenumber (ZWN) 2 (WPW2). While previous studies have suggested the East Asian trough as a potential source for the abnormal WPW2 growth, the prominent westward-propagating nature cannot be explained satisfactorily by the upward propagation of the quasi-stationary ZWN2 fluxes in the troposphere. More importantly, WPW2 exhibits an obvious in situ excitation signature within the barotropically and baroclinically destabilized stratosphere, dominated by the easterlies descending from the stratopause containing the WPW2 critical levels. This suggests that the vortex split is attributed to the WPW2 generated in situ within the stratosphere via instability. Vortex destabilization is achieved as the double-jet structure consisting of a subtropical mesospheric core and a polar stratospheric core develops into SSW21 by encouraging the anomalous dissipation of the upward-propagating tropospheric ZWN1 PWs. This double-jet configuration is likely a favorable precursor for SSW onset, not only for the SSW21 but generally for most SSWs, through promoting the anomalous growth of unstable PWs as well as the enhancement of the tropospheric PW dissipation.
- Article
(14057 KB) - Full-text XML
-
Supplement
(3512 KB) - BibTeX
- EndNote


Sudden stratospheric warming (SSW) is a dramatic stratospheric phenomenon when the cold and strong westerly polar night jet (PNJ) rapidly decelerates or even reverses to an easterly one with an enormous warming within 1 week (Matsuno, 1971). During SSW, the polar vortex is largely displaced away from the pole and/or split into two vortices (Charlton and Polvani, 2007; CP07). The impact of SSW is not limited to the polar stratosphere but extends into the mesosphere and above, causing significant changes in the residual circulations (Limpasuvan et al., 2016; Siskind et al., 2010), the distributions of chemical constituents such as ozone (Manney et al., 2009; Pedatella et al., 2018), and the atmospheric tides both in the Northern and Southern hemispheres. The dramatic temperature and wind perturbations during SSWs also descend into the troposphere, thereby altering the storm tracks which are closely tied to the surface weather patterns (Baldwin and Dunkerton, 2001; Hitchcock and Simpson, 2016).
SSW has been recognized as a manifestation of the interaction between the vertically propagating planetary waves (PWs) and stratospheric mean flow. This is primarily driven by the upward-propagating anomalous tropospheric wave pulses, which can provide sufficient wave forcings to break down the polar vortex (Matsuno, 1971), and/or by the preconditioning of the stratosphere that focuses the tropospheric wave fluxes – which do not need to be anomalously strong – into the polar stratosphere (Birner and Albers, 2017; Palmer, 1981). The preconditioning perspective has also been discussed in terms of the spontaneous wave explosion within the stratosphere (Plumb, 1981) as the polar vortex tunes itself toward the explosive wave-growth point, such as resonance (Albers and Birner, 2014; AB14) or barotropic–baroclinic (BT–BC) instability (Sato and Nomoto, 2015). Recent support for the vortex preconditioning has been identified from observational (AB14; Iida et al., 2014) and modeling (Rhodes et al., 2021; RLO21) studies on the split-type SSW of January 2009 (SSW09). Such self-tuned SSWs are characterized by nearly instantaneous wave amplification throughout the entire stratosphere at the SSW onset. Within this context, AB14 interpreted the explosive growth of stratospheric wave activities as a manifestation of vortex breakdown and not the cause of SSW.
The major SSW took place on 5 January 2021 (SSW21), exhibiting the highly distorted polar vortex that was initially displaced from the pole but eventually split at the onset date. During the prewarming period, an initial zonal wavenumber (ZWN) 1 pulse followed by a ZWN2 pulse was identified in the tropopause, suggesting their contributions to the observed vortex collapse (Cho et al., 2022; Lu et al., 2021; Rao et al., 2021). Lu et al. (2021) and Rao et al. (2021) related the intensification of the Aleutian low and the North Atlantic high in late December 2020 to the enhanced tropospheric ZWN1 flux and that of the East Asian trough developed in early January 2021 to the succeeding ZWN2 flux. By performing numerical experiments, Cho et al. (2022) showed that the tropospheric ZWN1 pulse is attributed primarily to the North Pacific bomb cyclones that deepened the Aleutian low with a minor contribution from the Ural blocking.
This study expands upon previous research on SSW21 by examining the prewarming evolution of the vortex throughout the entire stratosphere rather than solely in the region below 10 hPa, as done by most previous studies on SSW21. We found that the most significant vortex split occurs in the upper stratosphere (1 hPa). However, the anomalous stratospheric ZWN2 PW (PW2) amplification responsible for this split cannot be explained by the concomitantly enhanced tropospheric ZWN2 fluxes. Therefore, this study explores vortex preconditioning in the context of the spontaneous PW2 explosion while addressing two questions. (i) What is the source of the stratospheric PW2 amplification? (ii) How does the stratospheric vortex evolve toward the wave-growth point? To our knowledge, this is the first study to explore the role of vortex preconditioning in SSW21, providing more comprehensive accounts of the dynamics leading to SSW21.
2.1 The MERRA2 reanalysis data
We use the Modern-Era Retrospective analysis for Research and Applications, version 2 (MERRA2) reanalysis data with a horizontal resolution of 0.625∘ × 0.5∘ (longitude × latitude) and a temporal resolution of 3 h from the surface to an altitude of 0.1 hPa (Gelaro et al., 2017) covering 42 years (1980–2021). All results in this study are based on the daily average.
2.2 Analysis methods
The Eliassen–Palm flux (EP-flux) and its divergence (EPFD), representing the wave activity flux and wave forcing, respectively, are calculated based on the following formulation (Andrews et al., 1987):
where ϕ and z are the latitude and log-pressure height, respectively, ρ0 is the reference density, a is the mean Earth's radius, and f is the Coriolis parameter; u, v, and w are the zonal, meridional, and vertical wind components, respectively, and θ is the potential temperature. The overbar and prime represent the zonal mean and the departure from the zonal mean, respectively. F is the EP-flux vector, where Fϕ and Fz are the meridional and vertical components, respectively. EPFD corresponds to .
The BT–BC instability is evaluated by using the meridional gradient of the quasi-geostrophic potential vorticity (QGPV, Andrews et al., 1987):
where , β, and N denote the zonal-mean QGPV, the meridional derivative of f, and the Brunt–Väisälä frequency, respectively. The necessary condition for BT–BC instability is that the generally positive associated with the wintertime circulation becomes negative (Salby, 1996). In Sect. 3, we refer to the sum of the first two terms on the right-hand side as the “barotropic term” and to the third term as the “baroclinic term”.
A linearized disturbance QGPV equation in log-pressure coordinates is as follows (Andrew et al., 1987):
Here, λ is the longitude and q′ is the QGPV perturbation. X′ and Y′ denote the perturbation of the zonal and meridional components of gravity wave (GW) forcing from their zonal mean, respectively. Q′ is the perturbation diabatic heating rate, and ψ′ is the perturbation streamfunction (, where ϕ′ is the perturbation geopotential). The first bracketed term on the right-hand side of Eq. (4) is the non-conservative forcing term of the QGPV perturbation associated with the GW drag (GWD). In Sect. 3, we investigate whether the non-conservative GWD forcing defined by Z′ below is related to the rapid enhancement of PW2 by using the zonal and meridional components of the parameterized GWD data (McFarlane, 1987; Molod et al., 2015).
3.1 Wind and temperature changes during SSW21
Figure 1a shows the time evolutions of the zonal-mean zonal wind at 60∘ N and polar cap temperature over 60–90∘ N during the development of SSW21. Remarkably, a reversal of the zonal-mean westerlies appears first in the lower mesosphere on 1 January and descends to 10 hPa within 4 d, leading to the onset of major SSW21 (CP07). It is preceded by the enormous deceleration of PNJ by ∼ 108 m s−1 and a rapid 20 K warming in the upper stratosphere (∼ 1 hPa) within 8 d (28 December–4 January). Such a decrease (increase) in the zonal wind (temperature) is statistically significant at the 99 % confidence level. Anomalous easterlies and warming descend into the troposphere and persist for longer than 20 d, which is much longer than the average persistence (∼ 8 d) following SSWs in the reanalysis and CMIP models (Rao and Garfinkel, 2021).
3.2 Anomalous enhancement of the stratospheric PW2
SSW21 is manifested by the polar vortex being severely displaced from the pole and ultimately split into two just before the onset. Associated PW activities are revealed in Fig. 1b, which describes the time evolutions of the geopotential height (GPH) amplitudes of PW1 and PW2 at 60∘ N. As lag = −1 is approached, the predominant PW1 amplitude drastically decreases, while the PW2 amplitude appreciably increases having the statistically significant positive anomaly at the 95 % confidence level at 1–3 hPa. From lag = −2 to lag = 1, PW2 dominates in the mid- to upper stratosphere above 3 hPa. Given the prevalent dominance of PW1 in the high-latitude winter stratosphere (Andrews et al., 1987; Matsuno, 1970), predominant PW2 activity observed in this case and other split-type SSWs is a notable feature. Evidenced in Fig. 1c, which compares the polar-stereography series of the horizontal wind speed and the GPH anomaly at 1 and 10 hPa, the vortex split is more pronounced in the upper stratosphere than in the lower stratosphere, where PW1 has surpassed PW2 (Fig. 1b).
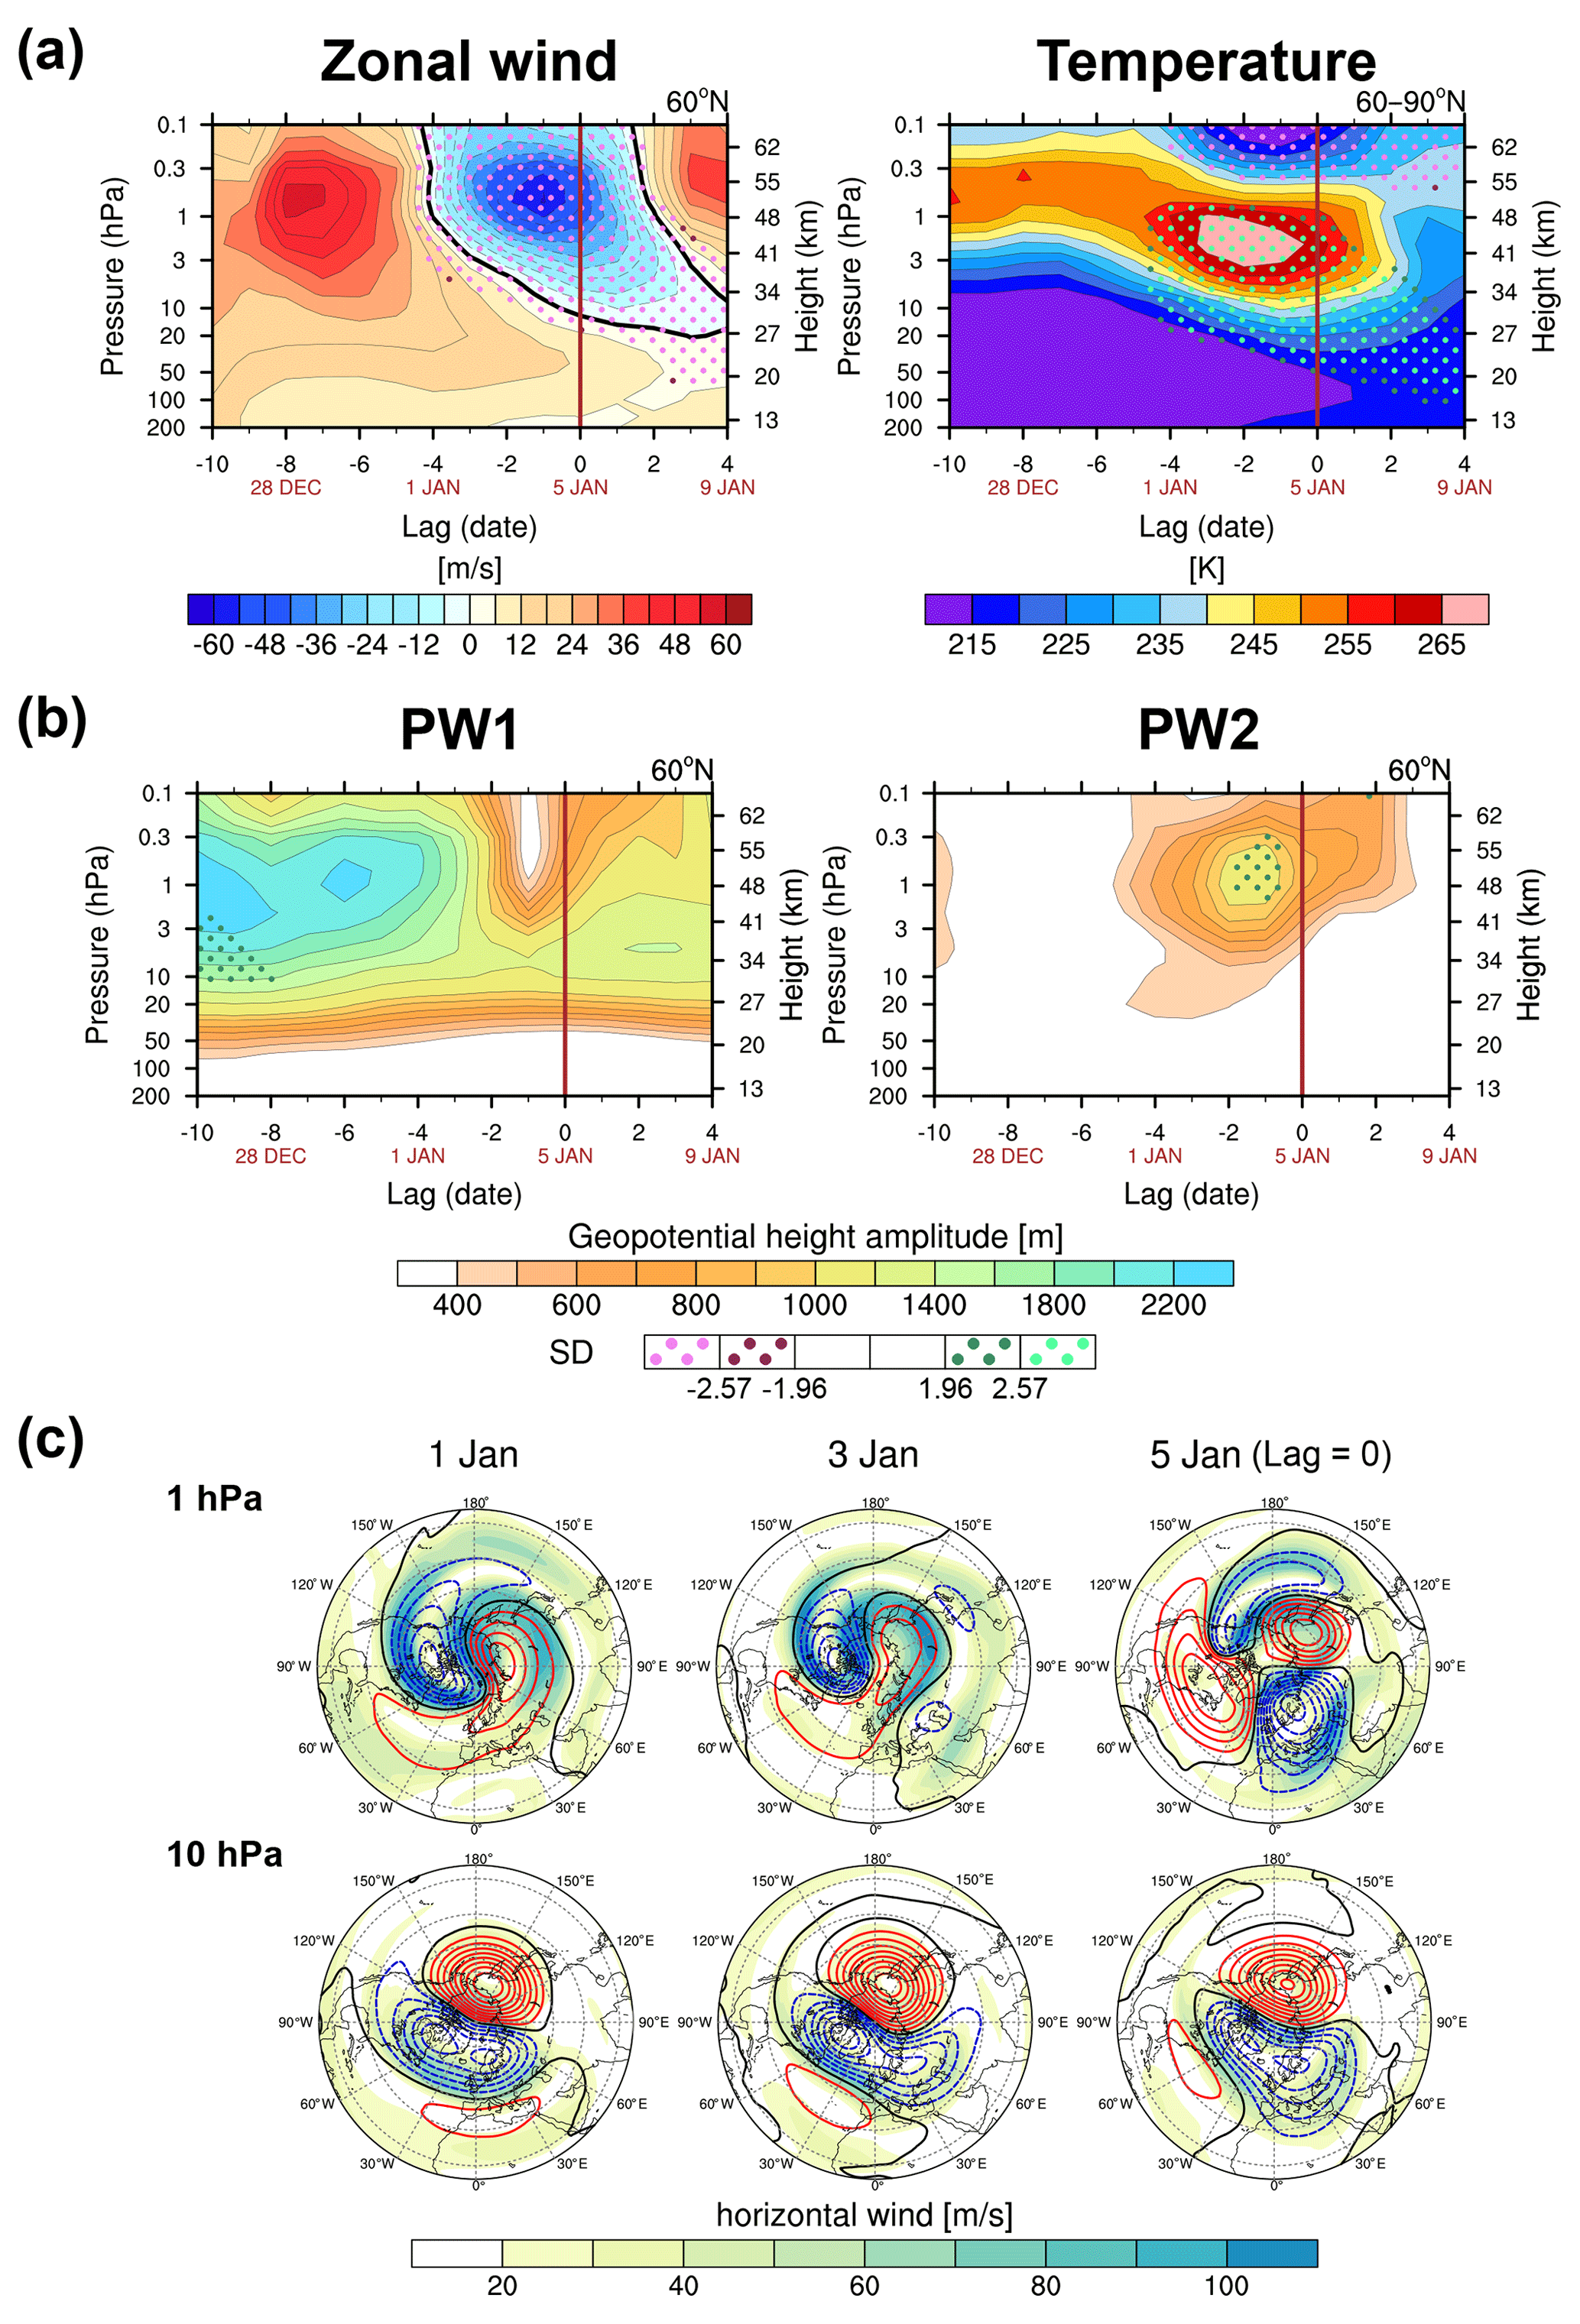
Figure 1Time–height cross sections of (a) the zonal-mean zonal wind at 60∘ N (left) and polar cap temperature averaged over 60–90∘ N (right) and (b) the geopotential height (GPH) amplitude of the planetary waves (PWs) with zonal wavenumbers (ZWN) 1 (PW1, left) and 2 (PW2, right) at 60∘ N. The dark and bright pink (green) dots denote regions where the analyzed variable is algebraically smaller (larger) than its 42-year climatology by more than 1.96 and 2.57 standard deviations (SDs), indicating that the variable is significantly anomalous at the 95 and 99 % confidence levels, respectively. (c) Polar stereography series of the horizontal wind speed (shading) and GPH anomalies from their zonal mean (contours) at 1 (upper) and 10 hPa (lower) on 1, 3, and 5 January. The red (blue) contours represent the positive (negative) value.
Previous studies have suggested that the vortex split is attributed to the enhanced tropospheric ZWN2 fluxes entering the stratosphere, as evidenced by peak pulses of the ZWN2 eddy heat flux averaged over 45–75∘ N at 100 hPa during 1–5 January. However, this period nearly coincides with that of remarkable PW2 amplification in the upper stratosphere (Fig. 1b). This implies that the increased tropospheric fluxes must have instantaneously propagated up to ∼ 28 km within the mid- to upper stratosphere, which is highly questionable. Therefore, we examine whether the large tropospheric pulses are traceable to the upper stratosphere at the standard group velocity for vertically propagating PW2. Figure 2a illustrates the time–height cross section of the vertical component of EP-flux (EPFz) of PW2 in 45–75∘ N and the three identical vectors with a slope of 5.5 km d−1 that correspond to the theoretical group velocity of the vertically propagating Rossby waves of ZWN2 (Esler and Scott, 2005). For comparison purpose with previous studies, the time series of the eddy heat flux ( of ZWN1 and ZWN2 in 45–75∘ N at 100 hPa are also presented below.
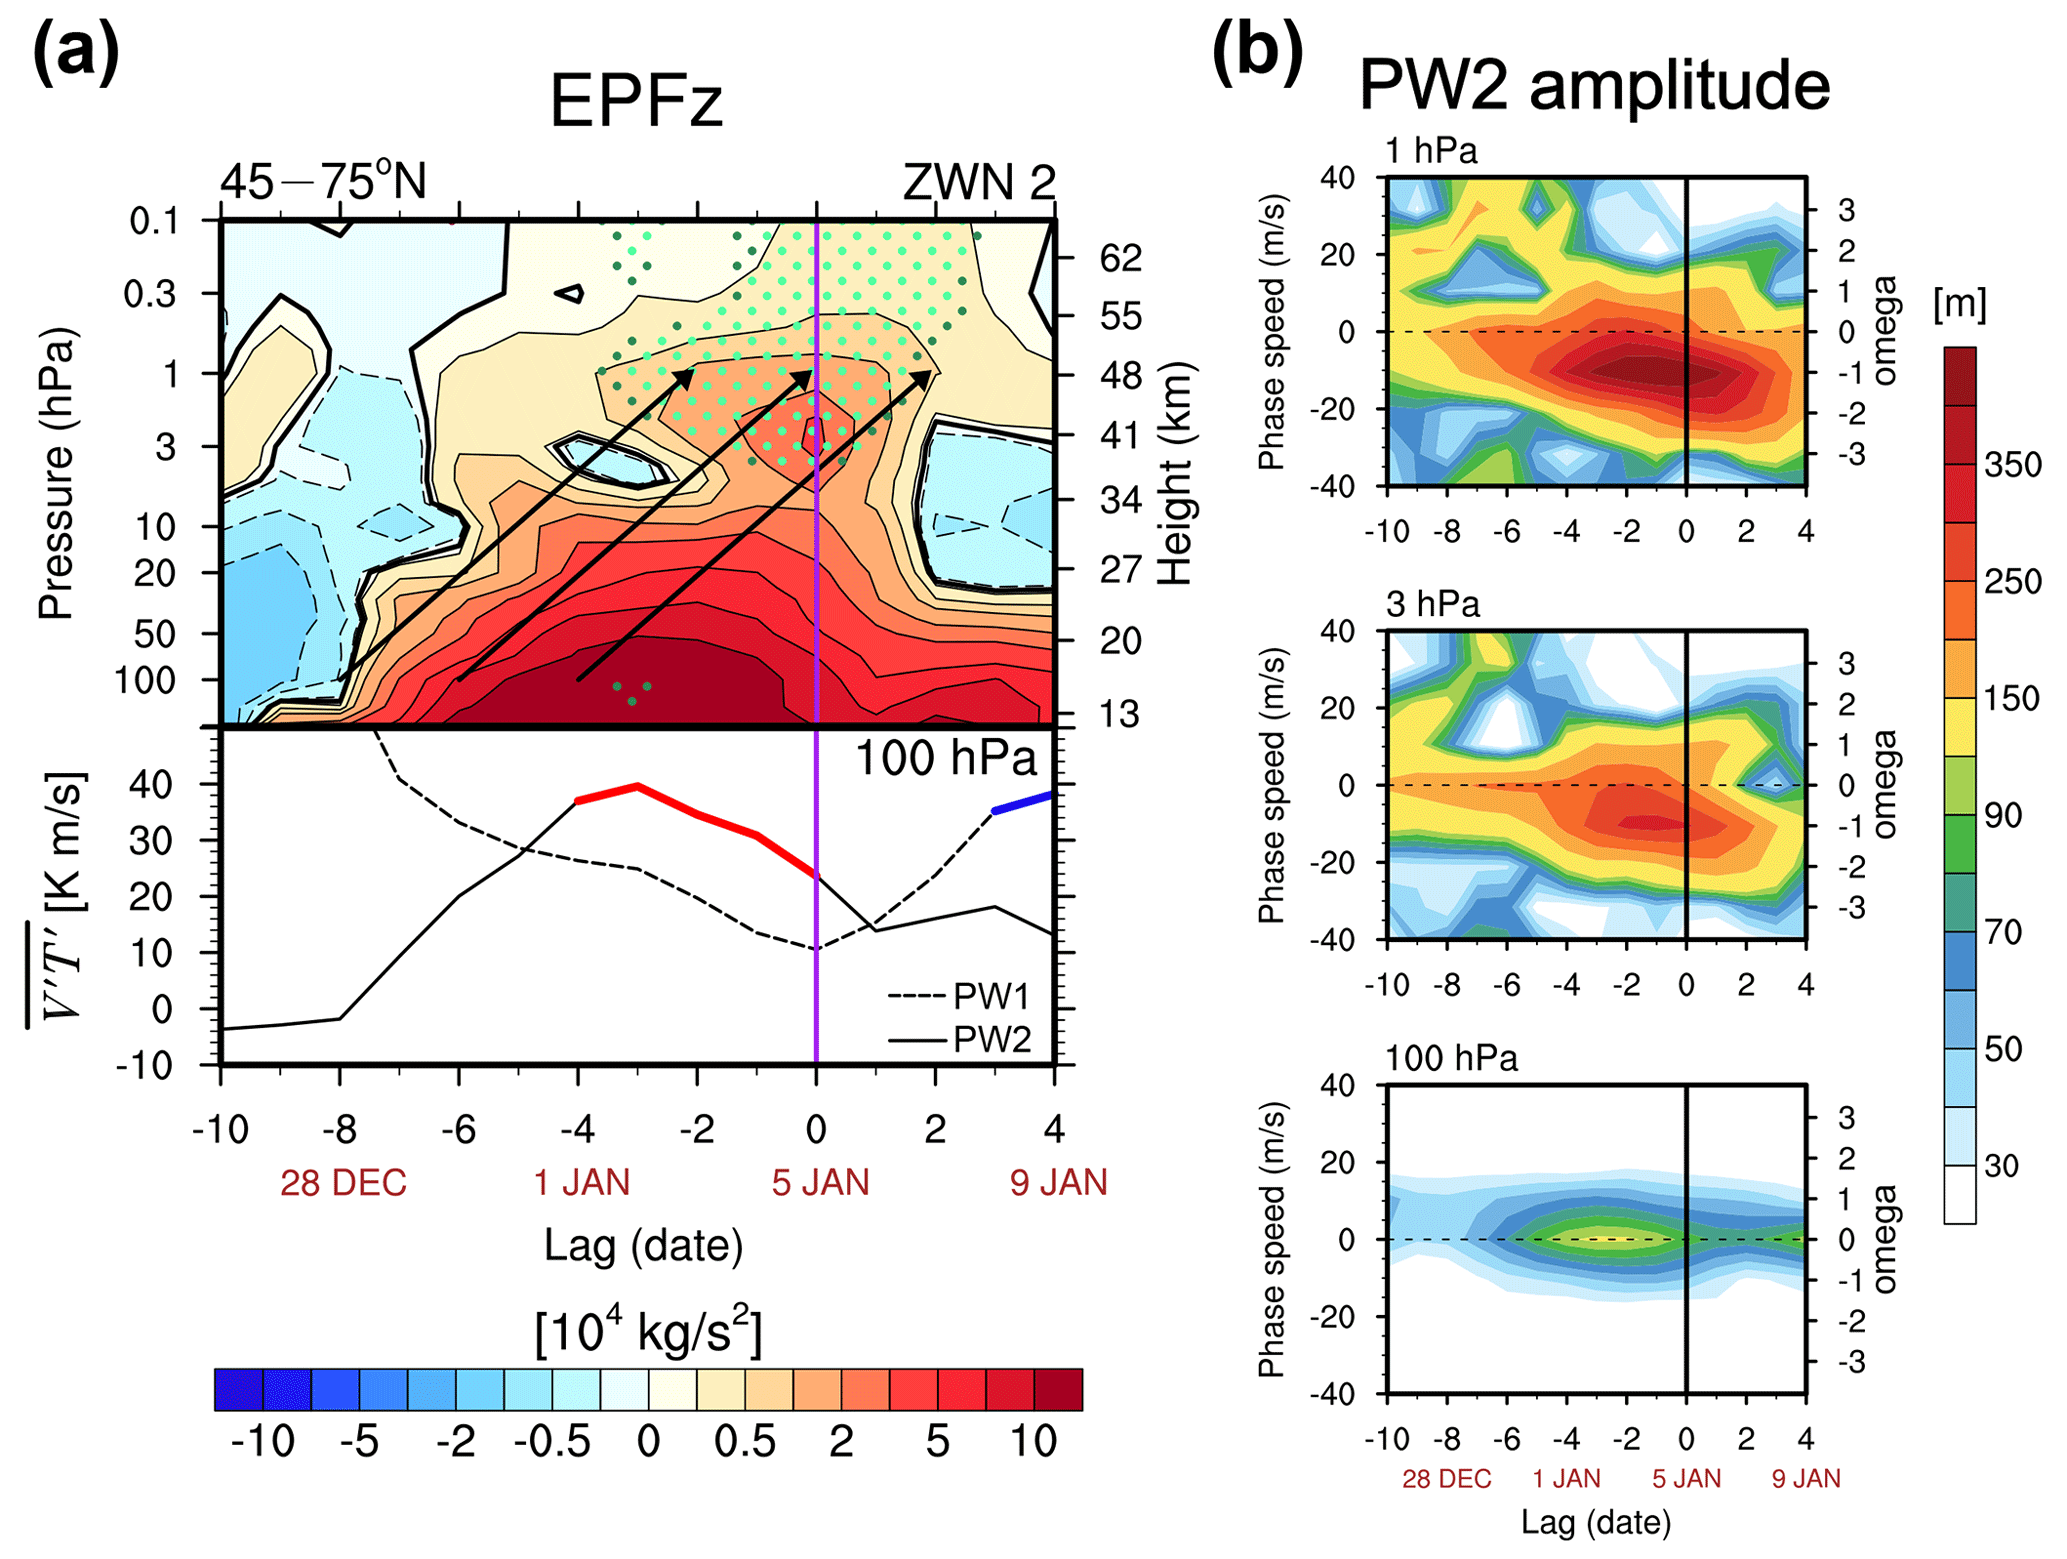
Figure 2(a) Time–height cross sections of the vertical component of Eliassen–Palm fluxes (EPFz) of PW2 (upper) and time series of eddy heat flux () of PW1 (dashed) and PW2 (solid) at 100 hPa (lower) averaged over 45–75∘ N. The overlaid blue (red) thick line denotes of PW1 (PW2) having a magnitude 1 SD greater than its climatology. The three identical arrows indicate the group velocity vectors of the vertically propagating Rossby waves of ZWN2 with a slope of 5.5 km d−1. (b) Time-zonal phase speed cross sections of the PW2 GPH amplitude at 1, 3, and 100 hPa averaged over 45–75∘ N. The purple and black vertical lines in (a) and (b), respectively, represent the onset date.
While of ZWN1 reduces, that of ZWN2 increases from 28 December (lag = −8), attaining a magnitude 1 SD greater than the climatology (but not significant) during 1–5 January. The theoretical prediction of Rossby waves' vertical propagation matches the vertical propagation of EPFz below 5 hPa well, indicating that the bulk of ZWN2 fluxes propagate upward (AB14). However, as evidenced by the third group velocity vector, these waves could approach the upper stratosphere ∼ 2 d after the onset date via upward propagation. This implies that the statistically significant PW2 amplification in the upper stratosphere in lag = −3–lag = −1 (Fig. 1b) cannot originate from the anomalous injection of the tropospheric wave activity during the same period.
More importantly, EPFz is not continuous above 5 hPa and exhibits apparent divergences with the downward EPFz (negative) below the region of upward EPFz (positive) around 3 hPa from lag = −5 to lag = −3. Despite the disappearance of downward EPFz after lag = −2, the divergence continues with the locally maximized upward EPFz above 5 hPa from lag = −1 to lag = 1. This feature cannot be explained by linear upward propagation, suggesting a potential for the in situ PW2 generation within the stratosphere. In this view, subsequent statistically significant enhancement in the upward EPFz (exceeding 99 % confidence level) above the divergence altitude could be a consequence of the upward propagation of the in situ generated PW2.
The evolution of the PW2 GPH in 45–75∘ N, as a function of zonal phase speed and time at the three altitudes depicted in Fig. 2b, supports this perspective. During the strengthening period of ZWN2 (lag = −8–0), the tropospheric PW2 (100 hPa) has a quasi-stationary nature, whereas the stratospheric PW2 (1–3 hPa) has prominent westward phase speeds of 10–30 m s−1 (WPW2). The stratospheric WPW2 cannot be explained solely by the upward propagation of the quasi-stationary tropospheric PWs.
3.3 In situ source of the stratospheric WPW2: BT–BC instability
To examine the potential source of the stratospheric PW2, we first investigate EP-fluxes and EPFD of PW2 during the WPW2 amplification period (1–5 January, Fig. 3a). In this analysis, the overall PW2 behavior is investigated but not exclusively for WPW2.
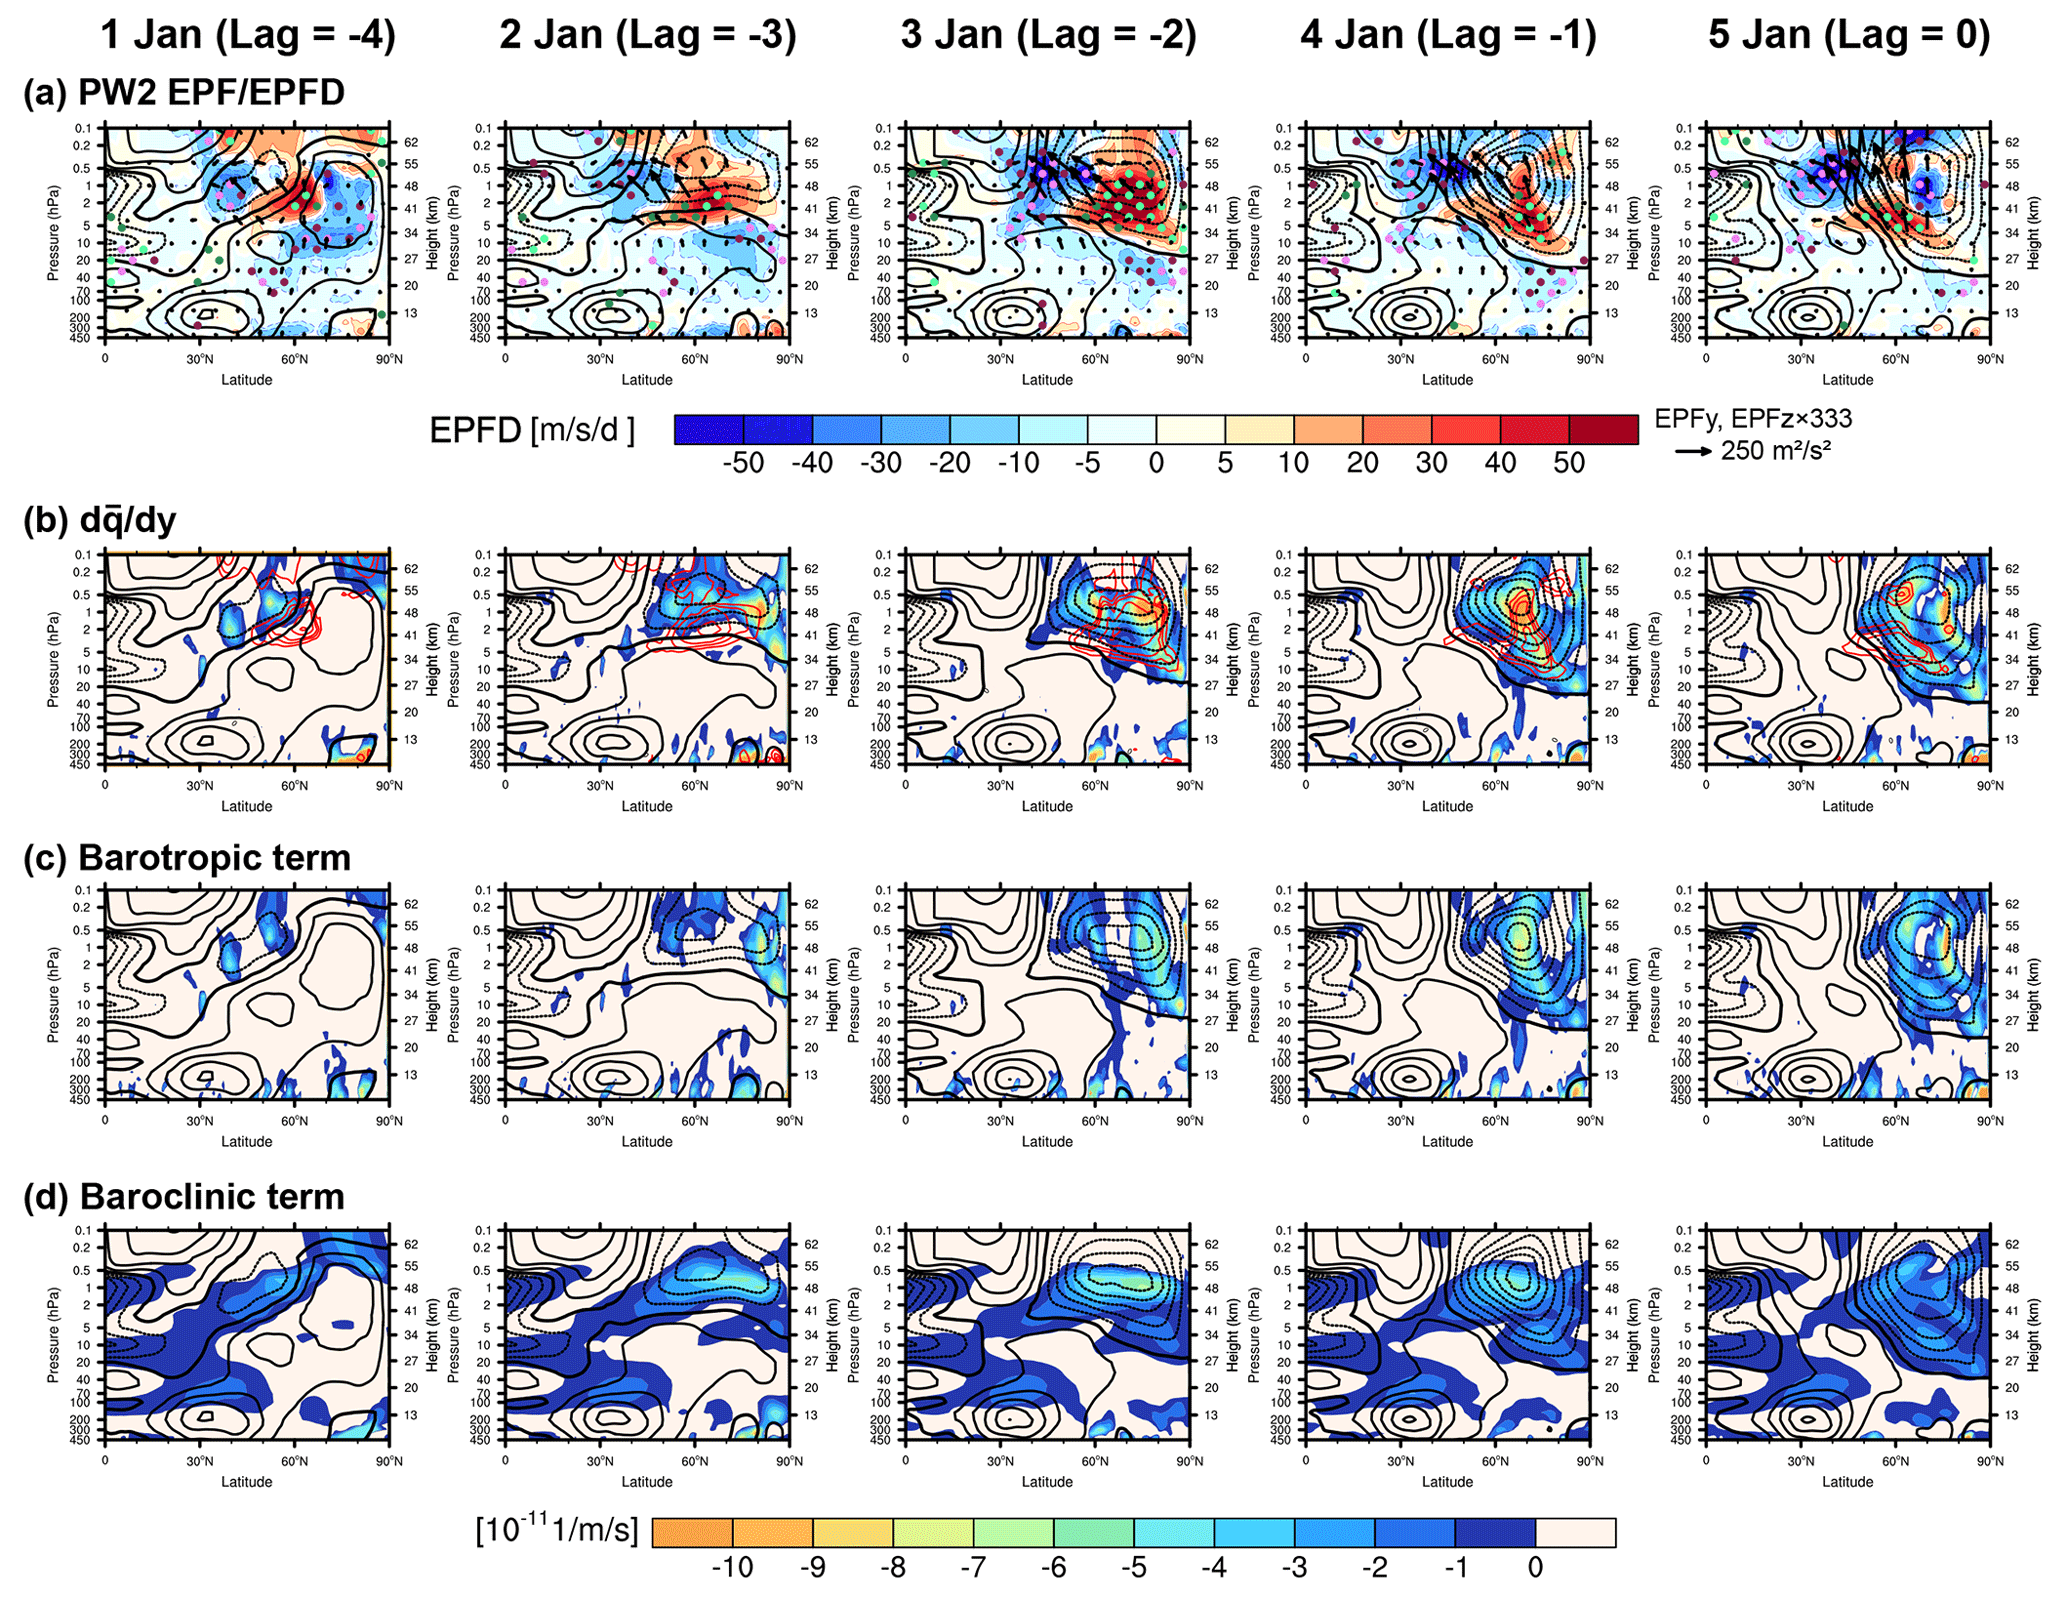
Figure 3Latitude–height cross sections of (a) Eliassen–Palm fluxes (EP-fluxes, vectors) overlaid on their divergences (EPFD, colors) from PW2, (b) the meridional gradient of the quasi-geostrophic potential vorticity (, colors) overlaid by the positive EPFD of PW2 (red contour), and (c) barotropic and (d) baroclinic terms of Eq. (3) in 1–5 January. The black contours represent the zonal-mean zonal winds. The solid, dashed, and thick solid lines indicate positive, negative, and zero wind, respectively.
Throughout the period, a significantly anomalous divergence of EP-fluxes (positive EPFD) appears, developing with the rapidly intensifying easterlies. This demonstrates the spontaneous PW2 emanation within the stratosphere, which is associated with the background flow: positive EPFD first appears between the easterlies extending from the equatorial stratosphere and the polar jet core (lag = −4). As the polar stratosphere becomes dominated by the descending stratopause easterlies, the divergence is also enlarged toward 10 hPa and simultaneously intensified, exceeding 50 m s−1 d−1 at lag = −2. While the easterlies further strengthen after that, the divergence area narrows below the jet core. Nevertheless, the PW2 fluxes evolving along their propagation have magnitudes comparable to or even greater than the previous ones. The upward-propagating tropospheric fluxes, on the other hand, converge before reaching the easterlies, imposing westward forcing. This is consistent with their quasi-stationary nature, which is inhibited by the zero-wind line.
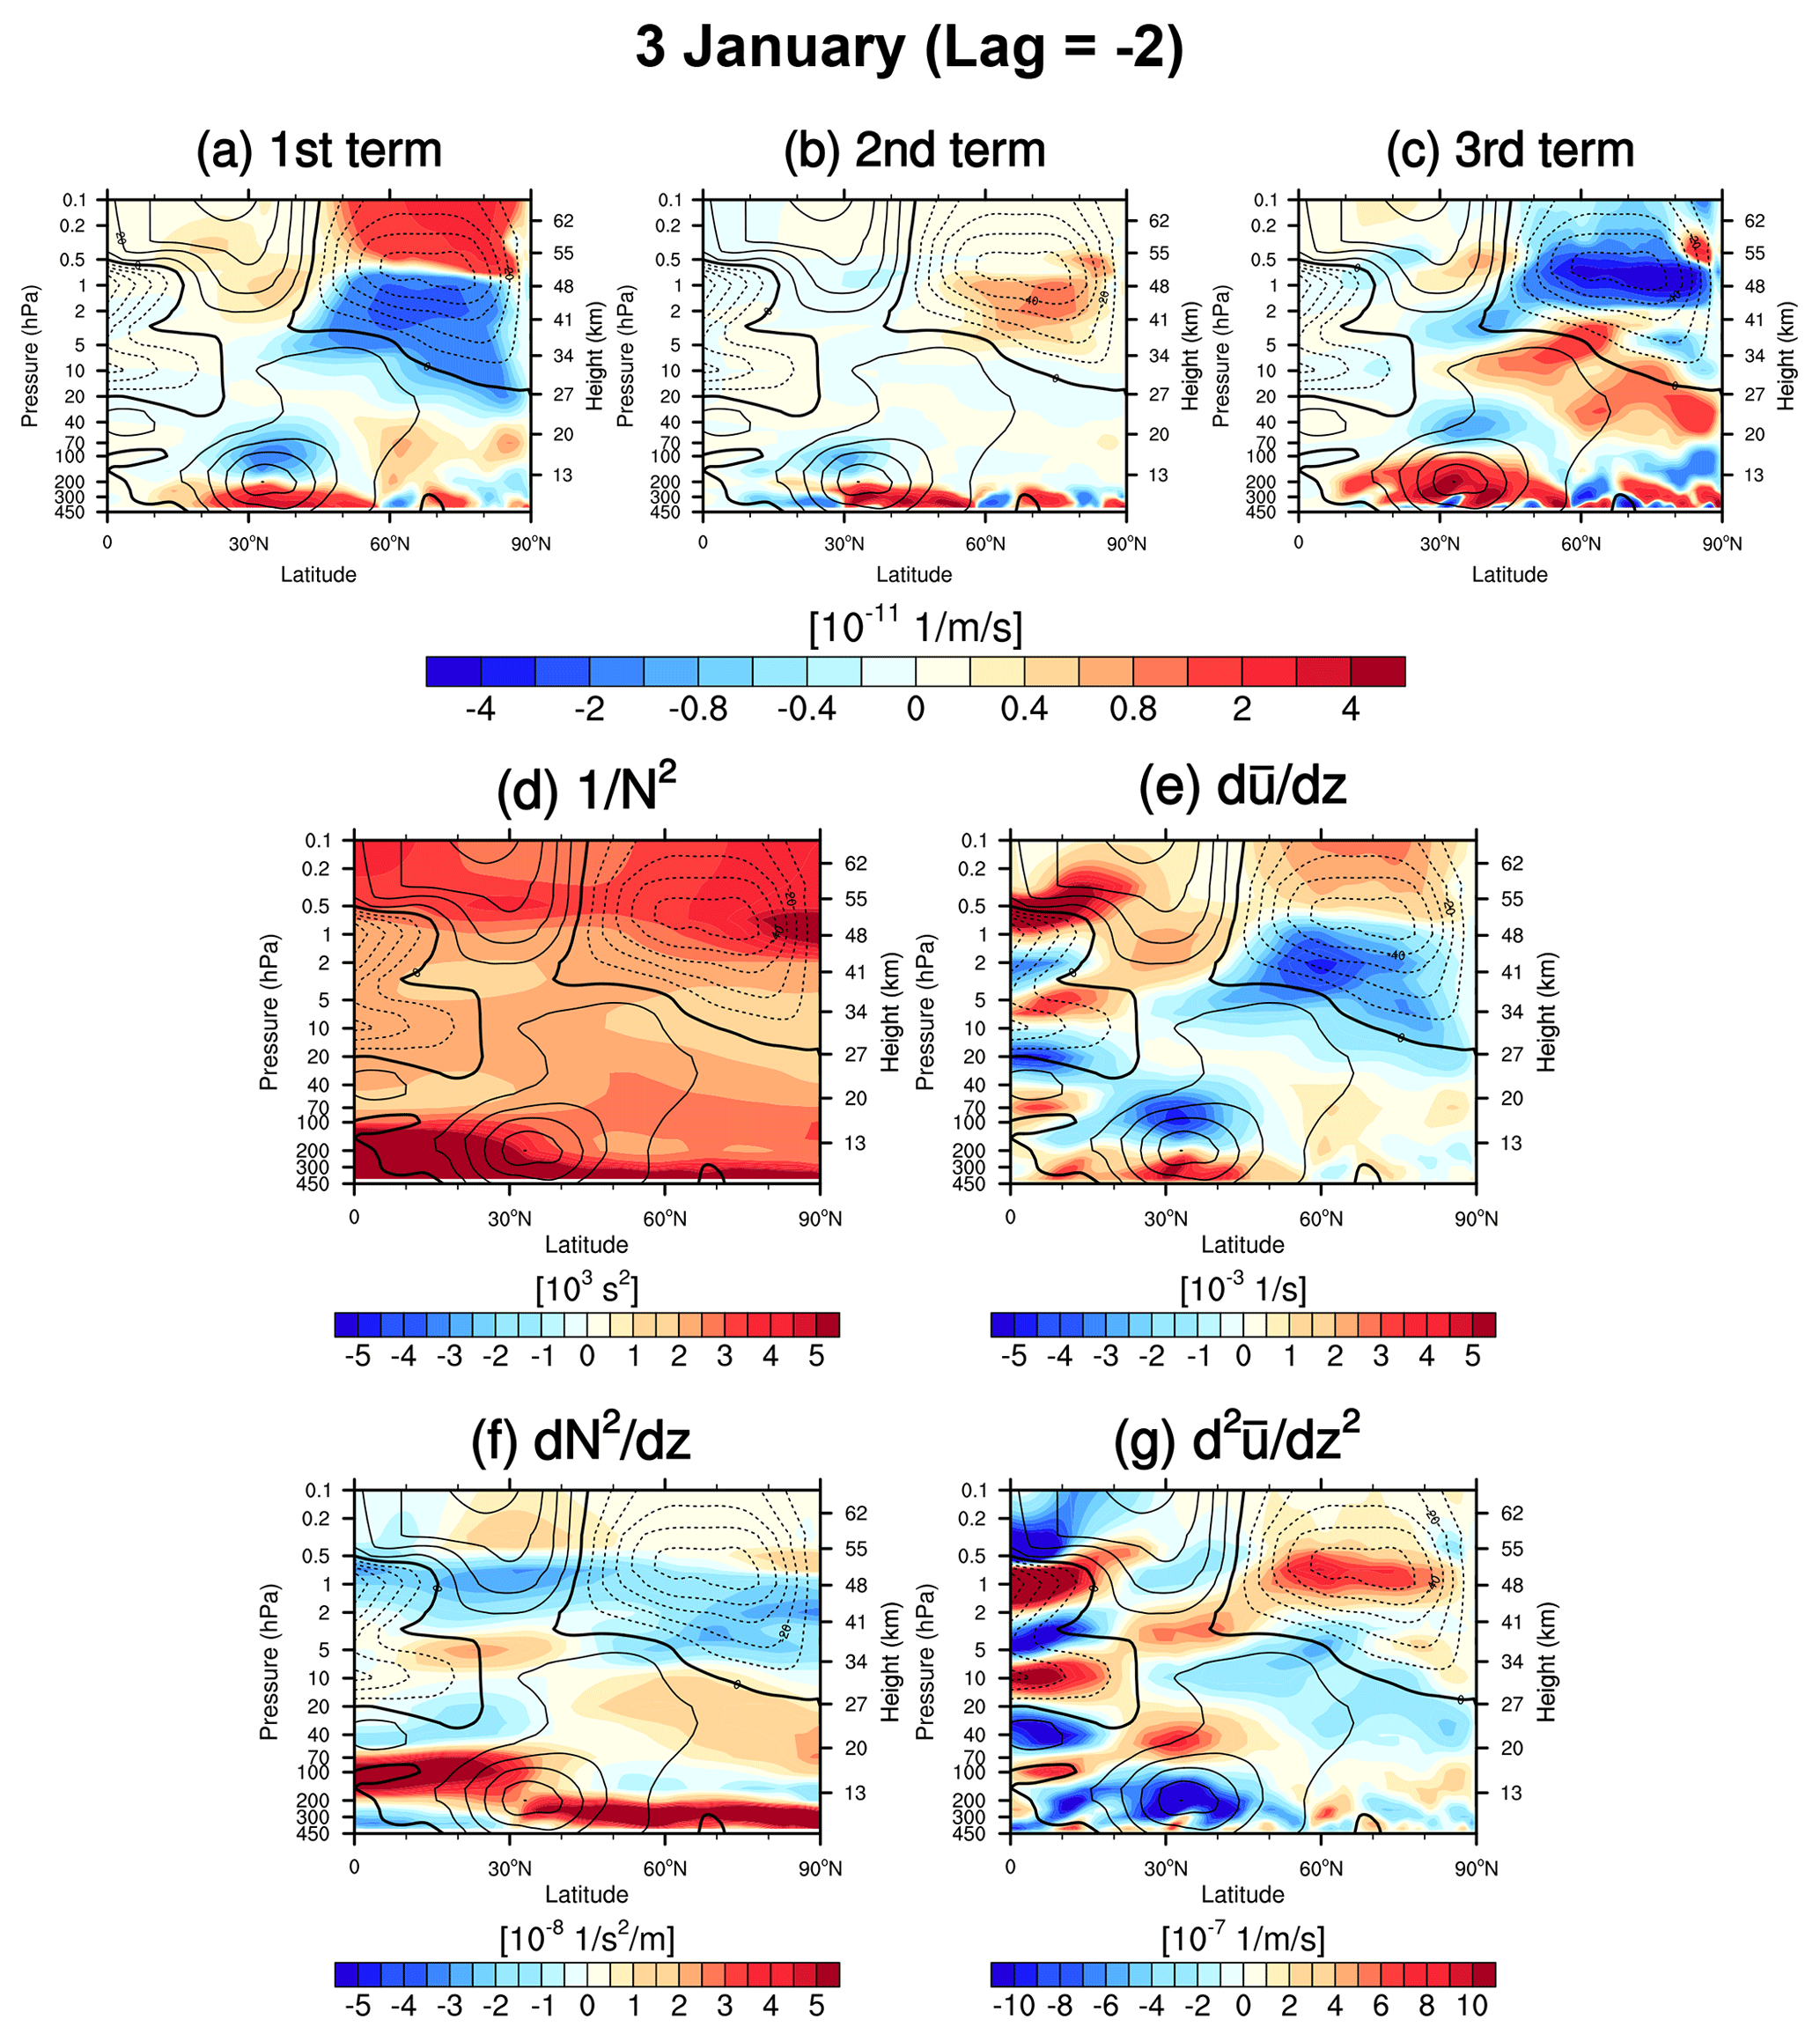
Figure 4Latitude–height cross sections of (a–c) the three terms on the right-hand side of Eq. (8) divided by f2, (d) the inverse of the squared Brunt–Väisälä frequency , (e) the vertical gradient of the zonal-mean zonal wind , (f) the vertical gradient of the squared Brunt–Väisälä frequency , and (g) the vertical curvature of the zonal-mean zonal wind on 3 January 2021. The black contours represent the zonal-mean zonal winds. The solid, dashed, and thick solid lines denote positive, negative, and zero wind, respectively.
As a plausible in situ source for the stratospheric PW2, the BT–BC instability is examined. Figure 3b–d present the latitude–height cross sections of and the barotropic and baroclinic terms of Eq. (3), respectively. Negative satisfying the BT–BC instability condition emerges around the positive EPFD areas during the overall period. Similar to the positive EPFD, this instability is exacerbated by the developing easterlies, attributed to both the barotropic and baroclinic terms. The strengthening easterlies induce the positive along their maxima, which dominates the positive β, leading to the vertically oriented negative barotropic term (Fig. 3c). Concurrently, the baroclinic term becomes negative from below the easterly core (Fig. 3d). To elucidate the dominant factors that make the baroclinic term negative, the third term of the right-hand side of Eq. (3) is expanded as follows:
where H is the scale height (7 km).
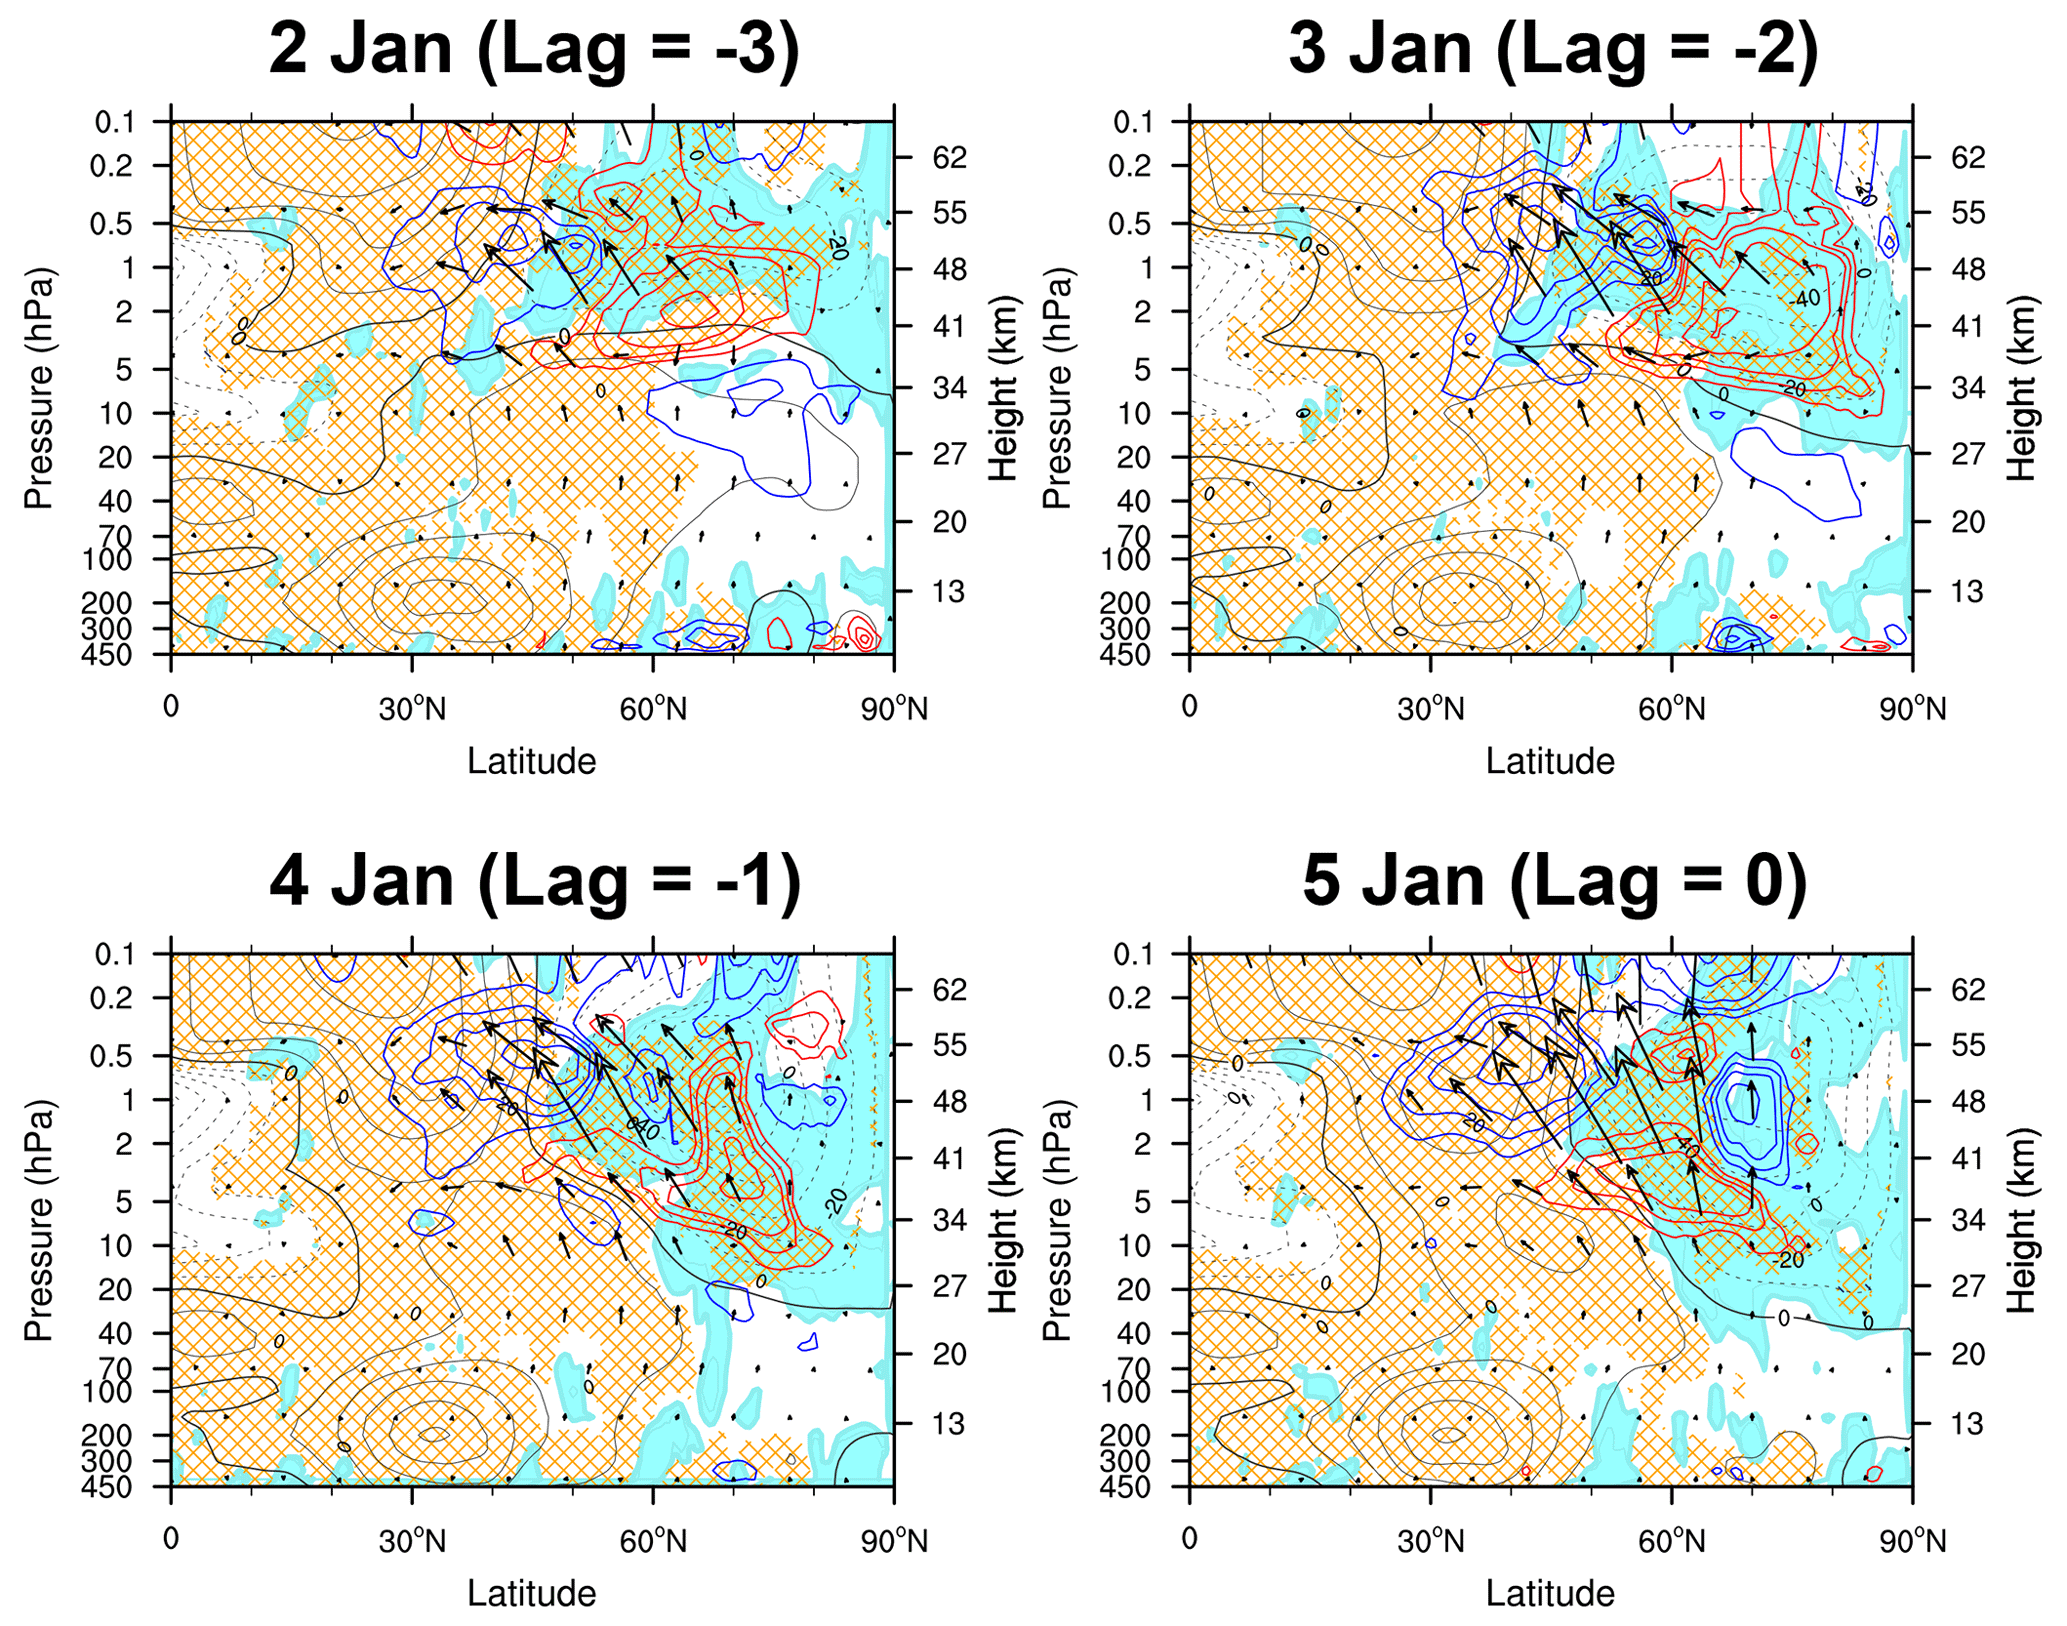
Figure 5Latitude–height cross sections of the negative (mint shading) and positive refractive index squared (n2, orange hatching) overlaid by PW2 EP-fluxes (vectors) and EPFD (contours, where the red and blue contours denote the positive and negative values, respectively) on 2–5 January 2021. The black contours represent the zonal-mean zonal winds. The solid, dashed, and thick solid lines denote positive, negative, and zero wind, respectively.
Figure 4a–c present the latitude–height cross sections of the first, second, and third terms of the right-hand side of Eq. (8), respectively, divided by f2 on 3 January as a representative case of the vortex destabilization period (1–5 January). It shows that the negative baroclinic term is attributed to both the first and third terms within the developing easterlies in the polar stratosphere, with an insignificant compensation by positive value from the second term.
Figure 4d–g show the latitude–height cross sections of the inverse of the squared Brunt–Väisälä frequency , the vertical gradient of the zonal-mean zonal wind , the vertical gradient of the Brunt–Väisälä frequency , and the vertical curvature of the zonal-mean zonal wind , respectively; those consist of the three terms on Eq. (8). The negative first term is induced by the negative (Fig. 4e) as the subtropical stratospheric easterlies that propagate to the polar stratopause descend into the lower stratosphere on 2–5 January (Fig. 3). This negative along with the negative (Fig. 4f) makes the second term positive below the easterly jet core. The negative third term, which is maximized above the easterly jet core, is caused by the strong positive (Fig. 4g) under a relatively small contribution by (Fig. 4d). Therefore, we conclude that the negative baroclinic term is attributed to the negative (positive below (centered at) the easterly jet core. The above findings suggest that the developing easterlies cause WPW2 excitation by encouraging strong shear instabilities. These findings align with the numerical study by Dickinson (1973): for the instability to serve as a source for PWs of a certain zonal phase speed Cx, the region must include a critical layer where the zonal-mean zonal wind matches Cx. The presence of WPW2 critical levels near the in situ PW2 generation region is confirmed by the range of easterlies (−40–0 m s−1) encompassing that of PW2's Cx in the mid- to upper stratosphere (1–3 hPa, Fig. 2b). The collocation of negative , the emergent PW2, and their critical levels demonstrate that WPW2 grows by extracting energy from the unstable flow.
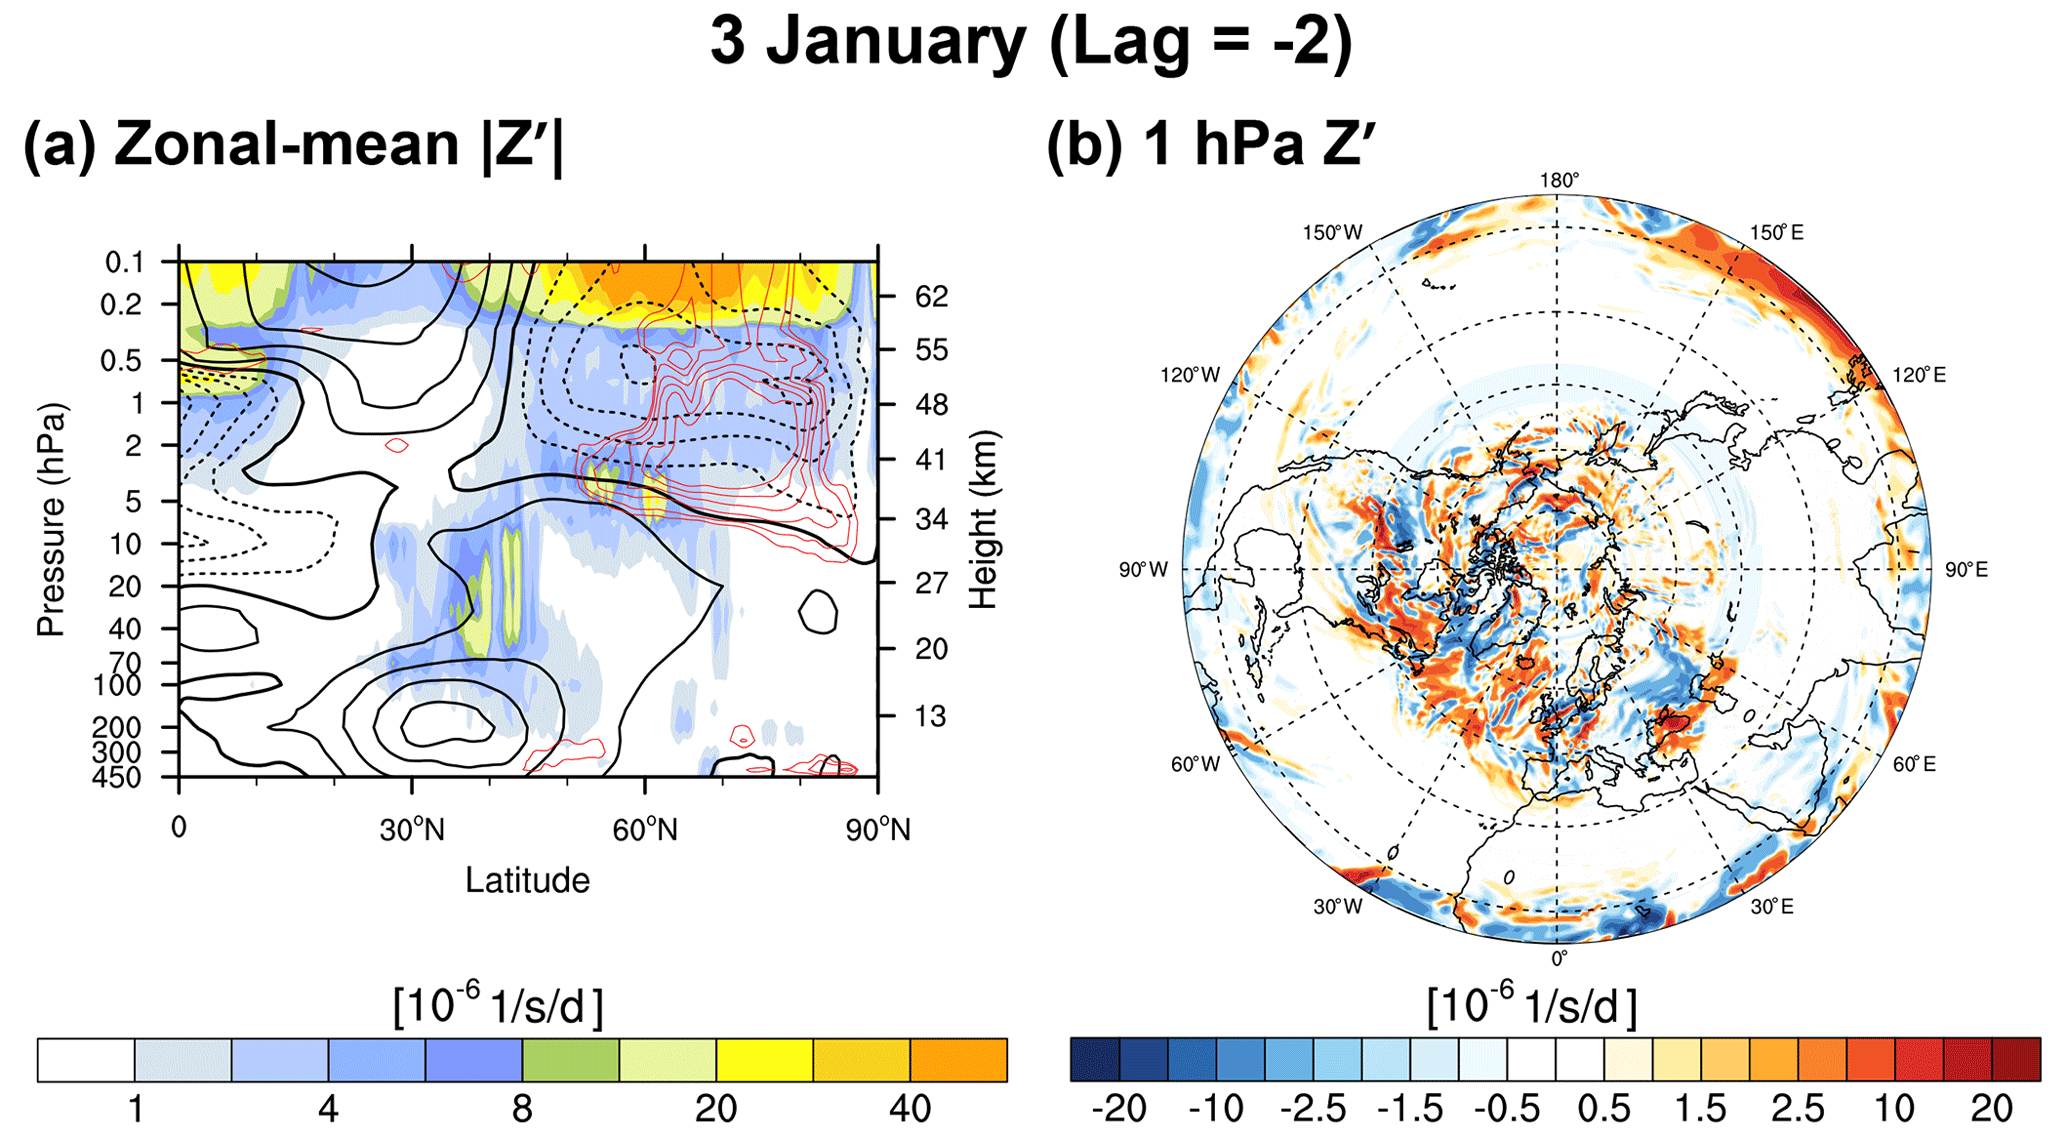
Figure 6(a) Latitude–height cross section of the zonal-mean magnitude of the non-conservative forcing (Z′, shading) overlaid by the positive EPFD of PW2 (red contours) on 3 January 2021. The black contours represent the zonal-mean zonal winds, where the solid, dashed, and thick solid lines denote positive, negative, and zero wind, respectively. (b) Polar stereography of Z′ at 1 hPa altitude on 3 January 2021.
Yamazaki et al. (2021) found similar bursts of quasi-4 d WPW2s originating from the unstable stratosphere beyond their critical level during the major SSWs in 2009, 2013, 2018, and 2019. Regarding the appearance of eastward-propagating PWs of ZWN2 (EPW2) in the mesosphere before the SSW09 onset, Iida et al. (2014) also suspected in situ generation via BT–BC instability in the westerly flow regime. RLO21 confirmed this possibility by identifying the existence of the EPW2 critical level, but they interpreted EPW2 emergence as the over-reflection of the tropospheric PW2 propagating upward. We explore the possibility of over-reflection for the amplified WPW2 by examining the squared refractive index (n2):
Here, we set the zonal wavenumber k=2 and the zonal phase speed m s−1, which corresponds to the identified WPW2 peak in Fig. 2b.
Figure 5 presents the latitude–height cross sections of the regions of negative and positive n2 with PW2 EP-fluxes and EPFD in 2–5 January 2021. On 2 January, the over-reflection signal that bears a resemblance to the illustration in Fig. 1 in RLO21 is identified. Following the waveguide (orange hatched areas), the upward-propagating WPW2 are allowed to reach the unstable region (mint shaded) where the critical level of WPW2 ( m s−1) is located. Leaving behind a strong EP-flux divergence region, downward PW2 EP-flux vectors point away from the evanescent region of negative n2 (areas without orange hatching), which is formed by the negative and positive . These downward vectors can be interpreted as the over-reflection of upward-propagating WPW2. This is consistent with the local downward EPFz below the upward EPFz in Fig. 2a. The positive n2 region associated with the transition from positive to negative under the negative from the evanescent region is suggestive of subsequent wave transmission. Transmitted waves propagating from the critical layer can deposit their momentum, creating a region of EP-flux convergence (westward acceleration). However, such over-reflection features become obscure from 3 January as the downward EPFz below the evanescent region disappears. Moreover, the region of positive EPFD shifts to higher latitudes (60–90∘ N) than the region which the upward-propagating WPW2 can reach (30–60∘ N). Therefore, the observed WPW2 amplifications are not satisfactorily explained through the over-reflection perspective.
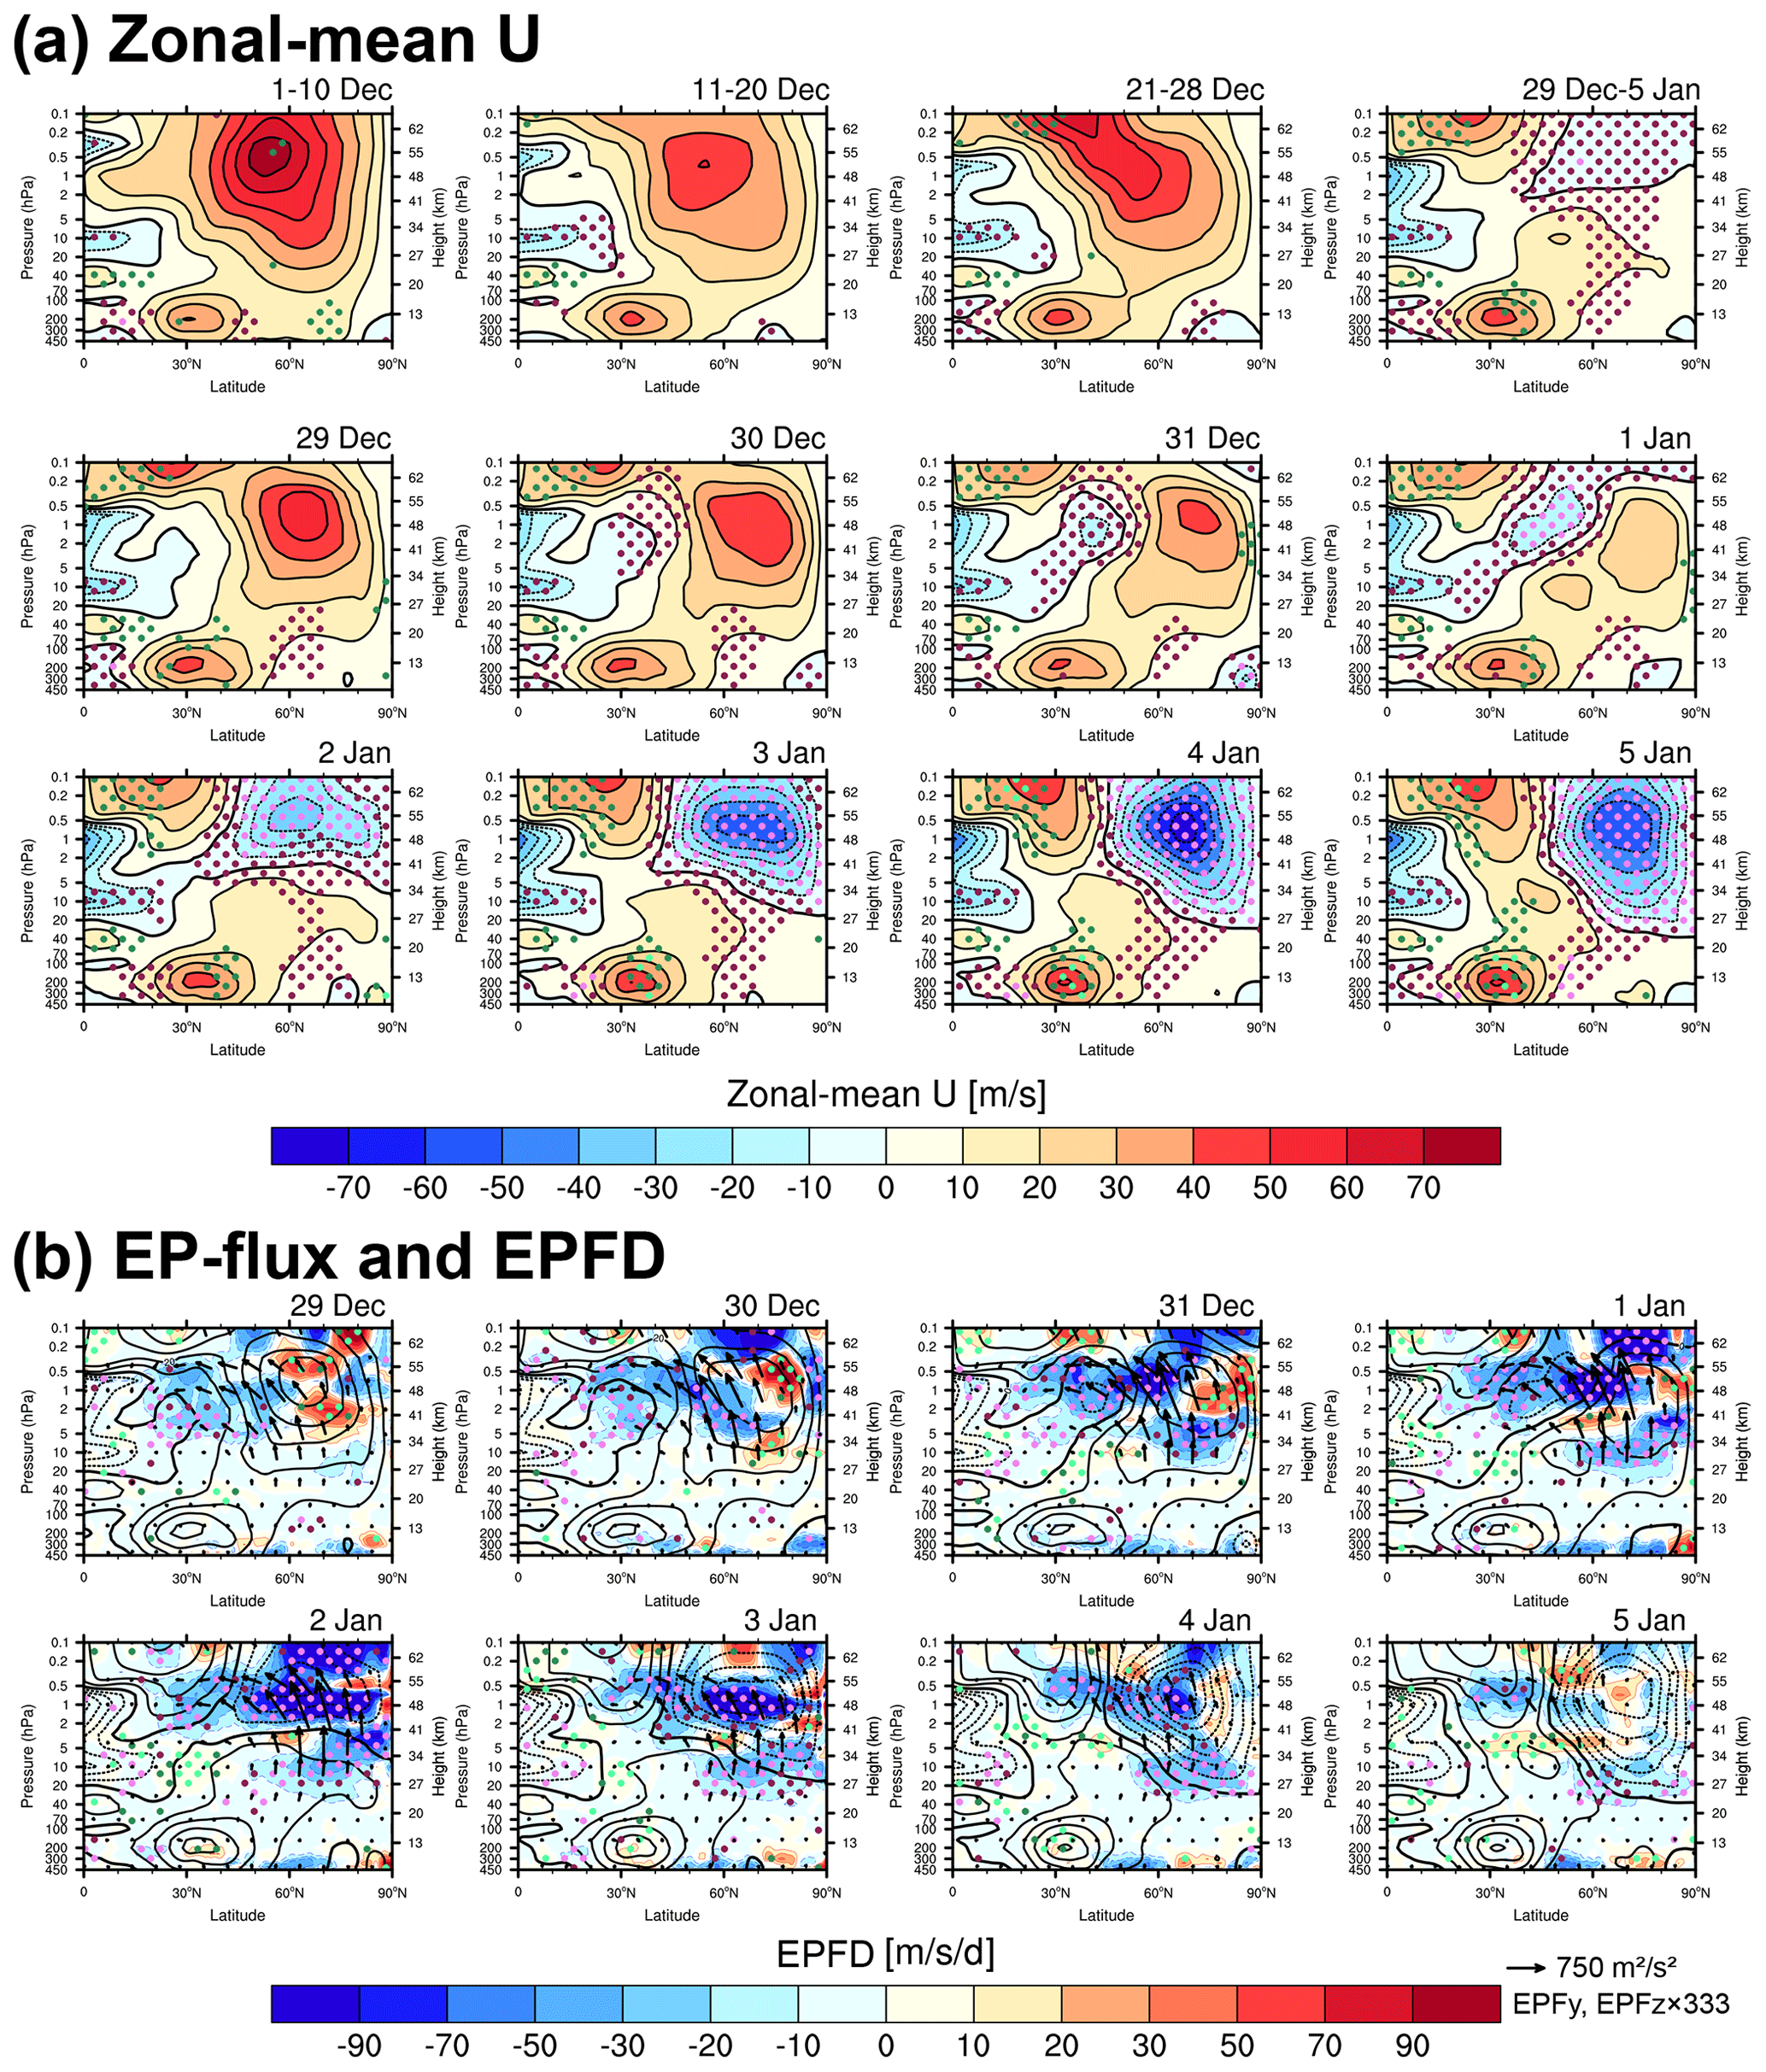
Figure 7Latitude–height cross sections of (a) the zonal-mean zonal winds averaged over 1–10, 11–20, and 21–28 December 2020 and 29 December 2020–5 January 2021 (first row) and daily from 29 December 2020 to 5 January 2021 (second to third row) and (b) EP-fluxes (vectors) overlaid on EPFD (colors) of the resolved waves. The black contours in (b) are the zonal-mean zonal winds. The contour specifications are the same as in Fig. 3.
Close inspection of the squared refractive index in Fig. 5 also confirms that the wave resonance suggested by AB14 is less likely for the observed WPW2 explosion. Resonant wave events require a three-sided cavity of vertically propagating PWs capable of trapping their energy. Such a cavity consists of two vertically oriented critical lines – one in the midlatitudes and another in the polar regions – and a third horizontal one across the upper stratosphere. While several localized regions of positive n2 exist within the instability areas, obvious features indicative of wave cavity are not identified. Furthermore, the characteristic EPFz behavior indicating wave resonance, that is, vertically instantaneous EPFz (AB14), is not identified in Fig. 2a.
Alternately, Song et al. (2020) demonstrated that the mesospheric EPW2 was generated by the zonally asymmetric GW forcing through the non-conservative source term (Z′) in the linearized perturbation QGPV equation in Eq. (4). We examine whether the rapid growth of the stratospheric WPW2 before the SSW21 onset is attributable to this mechanism by investigating Z′ in Eq. (7).
Figure 6a presents the latitude–height cross section of the zonally averaged Z′ magnitude () and the positive EPFD of PW2 on 3 January as a representative of the amplification period of WPW2 (1–5 January). The upward-propagating parameterized GWs are dissipated in regions with strong vertical shears of the zonal-mean zonal winds (see Fig. S1), yielding the zonally asymmetric GW forcings. Accordingly, the zonal-mean is also identified above the strong shear region, where the positive EPFD is located. However, due to the small magnitude of the GW forcing, above the positive EPFD region (1–5 hPa) is much smaller than in the upper stratosphere and lower mesosphere (above 0.5 hPa), where Z′ became significant enough to generate EPW2 in Song et al. (2020). More importantly, as evidenced from a polar stereography of Z′ shown in Fig. 6b, we cannot recognize an obvious ZWN2 structure. Therefore, we rule out the possibility of in situ WPW2 generation driven by zonally asymmetric GW forcing as a non-conservative source of QGPV perturbation. Thus, at least for the case of SSW21, our results support the idea that the BT–BC instability is the most likely source.
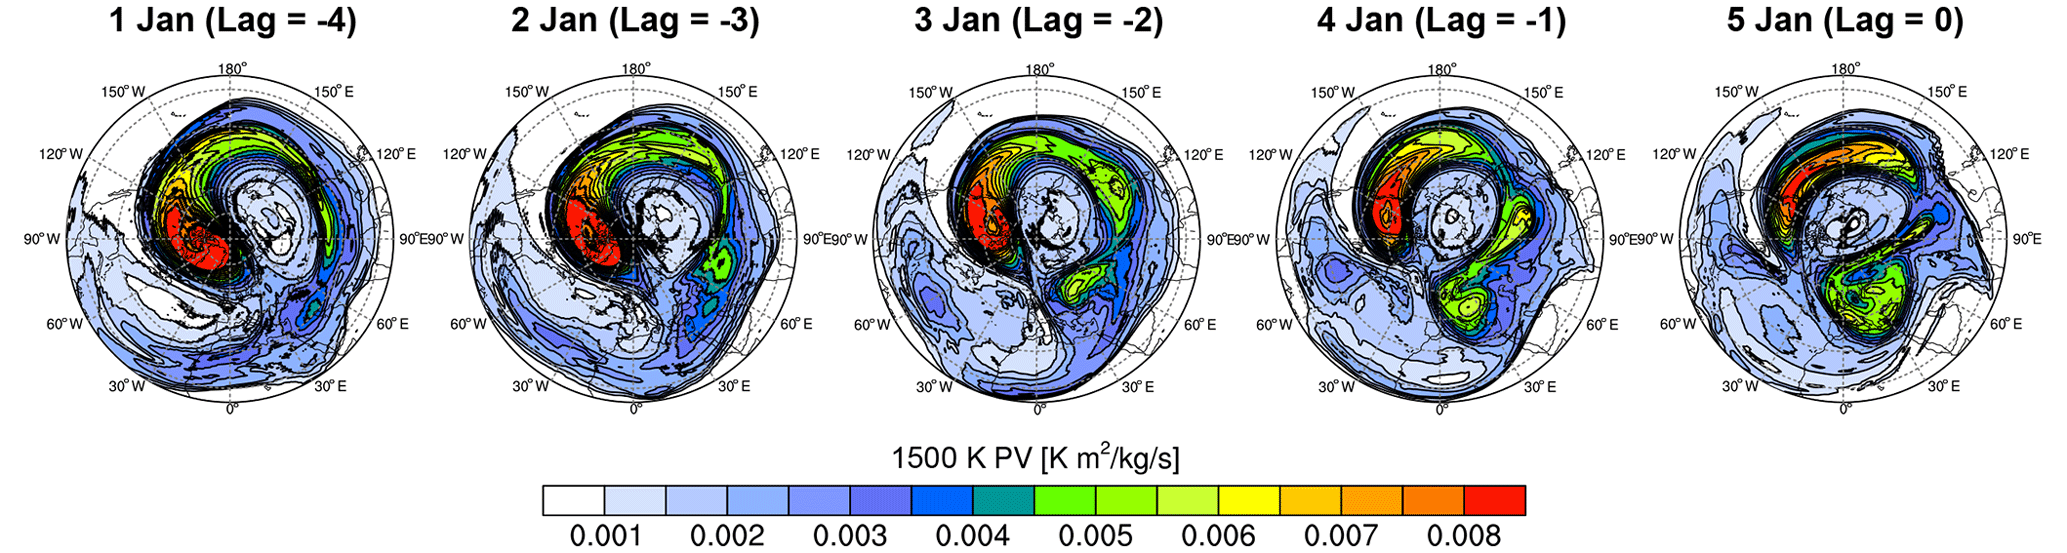
Figure 8Time series of Ertel's potential vorticity at the 1500 K isentropic surface (∼ 2 hPa).
3.4 Vortex preconditioning: double westerly jets
The above findings lead us to examine the prewarming evolution of PNJ, which adjusts the vortex conducive to instability. Figure 7a and b present the latitude–height cross sections of the zonal-mean zonal wind and the resolved wave (RW) activities, respectively.
On 1–10 December 2020, the wind structure is similar to climatology, with a single maximum in the high-latitude stratosphere. However, after the westerlies weaken over the following 10 d (11–20 December), the maximum moves to the subtropical upper mesosphere (21–28 December). On 29 December, the wind structure largely deviates from the climatology, consisting of two local maxima with comparable strength: one in the subtropical lower mesosphere and the other in the polar stratosphere. This so-called double-jet configuration was also identified before the SSW09 onset (Iida et al., 2014; RLO21). Between the two maxima, the subtropical easterly progresses toward the polar stratopause, which corresponds to a significant negative anomaly above the 95 % confidence level. This abnormal easterly completely separates the double jets on 1 January, initiating shear instability (Fig. 3b).
This is achieved through the critical-level interaction between the double westerly jets and RWs (Fig. 7b). Around the zero-wind line between the subtropical easterly and the polar westerly, RWs propagating from the midlatitude troposphere are critical-level filtered, exerting the statistically significant negative EPFD at the 99 % confidence level. This negative forcing migrates the subtropical easterly poleward, further separating the jets. Subsequent RWs cannot propagate equatorward any further and are filtered within the poleward-shifted intervening region between the two jets, again depositing the anomalously strong negative forcing. The polar stratopause easterlies attributed to this positive feedback rapidly descend into 10 hPa and intensify dramatically beyond 80 m s−1, causing exceptionally strong BT–BC instability. The negative RW forcing is mostly attributed to PW1 (Fig. S2), whereas RWs having ZWN greater than 1 contribute insignificantly or even counteract the negative forcing (not shown).
In summary, vortex preconditioning for SSW21 is characterized by the double-jet configuration. By facilitating the critical-level interaction with the tropospheric PW1, this wind structure migrates the subtropical stratospheric easterlies into the polar stratopause, thereby initiating catastrophic vortex deceleration and adjusting the vortex toward explosive unstable PW2 growth.
3.5 Destabilization of ZWN2 waves
While the westward-propagating nature of the unstable PW2 is explained in connection with the background easterlies, it remains unclear why ZWN2 perturbations are predominantly amplified. One possibility is that the prevailing ZWN2 fluxes forced from the troposphere may have been instantaneously destabilized at all altitudes, dominating over other waves. This speculation aligns with Hartmann's (1983) suggestion that predominant disturbances are more likely to be enhanced than those of higher ZWNs, despite their larger growth rates. However, this is not the case because the localized EPFz divergences in the stratosphere are decoupled from the troposphere (Fig. 2a). Furthermore, the quasi-stationary tropospheric PW 2 is not allowed to enter the stratosphere across their critical layer, as evidenced by their convergence near the zero-wind line (Fig. 3a).
The more probable explanation is that WPW2 arises in situ within the destabilized stratosphere that nonlinearly interacts with PW1. Hartmann (1983) found that with the presence of PW1, the barotropic instability of PNJ could enhance the growth rates of shorter waves with similar phase speeds. Manney et al. (1991) identified a similar destabilization of both waves 2 and 3 but of wave 2 in particular. Relevant features are identified in Fig. 8, which presents Ertel's potential vorticity (EPV) on the 1500 K isentropic surface (near 2 hPa). From 1 January, irreversible mixing associated with substantial PW1 dissipation (Fig. 7b) causes vortex filamentation along the vortex edge, yielding two additional high EPV cores. Concurrently, the initially localized negative EPV meridional gradient develops into a zonal-mean field, with the higher (lower) EPV advected toward the lower latitudes (pole). With growing instability, the two localized high EPV cores merge into one, exhibiting a ZWN2 pattern. Numerical experiments exploring the most unstable mode with respect to the given zonal flow can provide further convincing evidence, but that is beyond the scope of this study.
During the SSW21 onset, an anomalous WPW2 growth appears, which eventually splits the polar vortex. Previous studies have suggested that the enhanced ZWN2 fluxes originating from the tropospheric precursor events are responsible for this stimulation of PW2 activities. However, simultaneous enhancements in PW2 activities in the tropopause and the upper stratosphere are not explained solely by the vertical propagation of the tropospheric PW2. The prominent westward-propagating PW2 in the upper stratosphere that differs from the quasi-stationary tropospheric PW2 complements this view.
This study demonstrates that the explosive WPW2 amplification occurs in situ within the polar stratosphere driven toward BT–BC instability, where the easterlies rapidly descend from the stratopause including the critical layer of WPW2. Vortex destabilization is induced as the abnormal double-jet structure having subtropical mesospheric and polar stratospheric cores evolves toward SSW21 within just 7 d. Therefore, we suggest vortex preconditioning for SSW21 as the double-jet structure, which initiates vortex deceleration as well as tuning the vortex toward instability by facilitating the critical-level interaction with the tropospheric PWs.
Our findings provide some key insights into preconditioning of SSWs. First, vortex destabilization is an inevitable consequence of the zonal wind reversal to easterlies connected to the major SSWs. We found that all 26 major SSWs for 42 years (selected following the CP07 definition) exhibit BT–BC instability associated with the prevalent easterlies in the stratosphere at their onset (Fig. S3). Given that an unstable flow supports the in situ PW explosion, which can even shape the vortex geometry shortly before the SSW onset, we suggest looking in more detail into the influences of BT–BC instability on the characteristics of SSW, including its onset, intensity, and duration. Second, the double-jet structure is likely a stratospheric precursor that favors triggering SSW. Approximately 70 % (19 events) of 26 major SSWs exhibit this wind configuration within 2 weeks prior to their onset, despite variance in their occurrence timing (not shown). The present-case SSW21, which occurred under unfavorable tropical conditions (the westerly quasi-biennial oscillation and weak convections) for SSW, reinforces this perspective. RLO21 also reported that this wind structure and associated unstable PW generation are commonly identified in other SSW events. Therefore, the preceding double-jet structures are worth examining in SSW studies to improve our understanding and the predictability of SSWs. While this study focuses on the evolution of the double-jet structure toward SSW, it would also be fruitful to investigate the formation of such a wind structure considering the interplay among PWs, GWs, and mean flow (Iida et al., 2014; RLO21; Sato and Nomoto, 2015).
The MERRA2 data are available from the Global Modeling and Assimilation Office at NASA Goddard Space Flight Center through the NASA GES DISC online archive (available at https://doi.org/10.5067/QBZ6MG944HW0 and https://doi.org/10.5067/CWV0G3PPPWFW, GMAO, 2015a, b). All results from this study can be provided by the corresponding authors upon request.
The supplement related to this article is available online at: https://doi.org/10.5194/acp-23-10869-2023-supplement.
JHY, HYC, and MJK conceived of the study. JHY conducted formal analysis and visualized the results. JHY wrote the draft with a contribution from HYC and MJK.
The contact author has declared that none of the authors has any competing interests.
Publisher's note: Copernicus Publications remains neutral with regard to jurisdictional claims in published maps and institutional affiliations.
This research has been supported by the National Research Foundation of Korea (grant no. 2021R1A2C100710212). The first author is supported by the Global PhD Fellowship Program (grant no. 2019H1A2A1077307).
This paper was edited by Peter Haynes and reviewed by two anonymous referees.
Albers, J. R. and Birner, T.: Vortex preconditioning due to planetary and gravity waves prior to sudden stratospheric warmings, J. Atmos. Sci., 71, 4028–4054, https://doi.org/10.1175/JAS-D-14-0026.1, 2014.
Andrews, D. G., Holton, J. R., and Leovy, C. B.: Middle atmosphere dynamics, 1st Edn., Vol. 40, edited by: Dmowska, R., and Holton, J. R., San Diego, Calif., Academic Press Inc, p. 489, ISBN: 9780120585762, 1987.
Baldwin, M. P. and Dunkerton, T. J.: Stratospheric harbingers of anomalous weather regimes, Science, 294, 581–584, https://doi.org/10.1126/science.1063315, 2001.
Birner, T. and Albers, J. R.: Sudden Stratospheric Warmings and Anomalous Upward Wave Activity Flux, Scientific Online Letters on the Atmosphere, 13, 8–12, https://doi.org/10.2151/sola.13A-002, 2017.
Charlton, A. J. and Polvani, L. M.: A New Look at Stratospheric Sudden Warmings, Part I: Climatology and Modeling Benchmarks, J. Climate, 20, 449–469, https://doi.org/10.1175/JCLI3996.1, 2007.
Cho, H. O., Kang, M. J., Son, S. W., Hong, D. C., and Kang, J. M.: A critical role of the North Pacific bomb cyclones in the onset of the 2021 sudden stratospheric warming, Geophys. Res. Lett., 49, e2022GL099245, https://doi.org/10.1029/2022GL099245, 2022.
Dickinson, R. E.: Baroclinic instability of an unbounded zonal shear flow in a compressible atmosphere, J. Atmos. Sci., 30, 1520–1527, https://doi.org/10.1175/1520-0469(1973)030<1520:BIOAUZ>2.0.CO;2, 1973.
Esler, J. G. and Scott, R. K.: Excitation of transient Rossby waves on the stratospheric polar vortex and the barotropic sudden warming, J. Atmos. Sci., 62, 3661–3682, https://doi.org/10.1175/JAS3557.1, 2005.
Gelaro, R., McCarty, W., Suarez, M. J., Todling, R., Molod, A., Takacs, L., Randles, C. A., Darmenov, A., Bosilovich, M. G., Reichle, R., Wargan, K., Coy, L., Cullather, R., Draper, C., Akella, S., Buchard, V., Conaty, A., da Silva, A. M., Gu, W., Kim, G.-K., Koster, R., Lucchesi, R., Merkova, D., Nielsen, J. E., Partyka, G., Pawson, S., Putman,W., Rienecker, M., Schubert, S. D., Sienkiewicz, M., and Zhao, B.: The Modern-Era Retrospective Analysis for Research and Applications, Version 2 (MERRA-2), J. Climate, 30, 5419–5454, https://doi.org/10.1175/JCLI-D-16-0758.1, 2017.
GMAO (Global Modeling and Assimilation Office): MERRA-2 inst3_3d_asm_Np: 3d,3-Hourly, Instantaneous, Pressure-Level, Assimilation, Assimilated Meteorological Fields V5.12.4, Greenbelt, MD, USA, Goddard Earth Sciences Data and Information Services Center (GES DISC) [data set], https://doi.org/10.5067/QBZ6MG944HW0, 2015a.
GMAO (Global Modeling and Assimilation Office): MERRA-2 tavg3_3d_udt_Np: 3d,3-Hourly, Time-Averaged,Pressure-Level,Assimilation, Wind Tendencies V5.12.4, Greenbelt, MD, USA, Goddard Earth Sciences Data and Information Services Center (GES DISC), [data set], https://doi.org/10.5067/CWV0G3PPPWFW, 2015b.
Hartmann, D. L.: Barotropic instability of the polar night jet stream, J. Atmos. Sci., 40, 817–835, https://doi.org/10.1175/1520-0469(1983)040<0817:BIOTPN>2.0.CO;2, 1983.
Hitchcock, P. and Simpson, I. R.: Quantifying eddy feedbacks and forcings in the tropospheric response to stratospheric sudden warmings, J. Atmos. Sci., 73, 3641–3657, https://doi.org/10.1175/JAS-D-16-0056.1, 2016.
Iida, C., Hirooka, T., and Eguchi, N.: Circulation changes in the stratosphere and mesosphere during the stratospheric sudden warming event in January 2009, J. Geophys. Res.-Atmos., 119, 7104–7115, https://doi.org/10.1002/2013JD021252, 2014.
Limpasuvan, V., Orsolini, Y. J., Chandran, A., Garcia, R. R., and Smith, A. K.: On the composite response of the MLT to major sudden stratospheric warming events with elevated stratopause, J. Geophys. Res.-Atmos., 121, 4518–4537, https://doi.org/10.1002/2015JD024401, 2016.
Lu, Q., Rao, J., Liang, Z., Guo, D., Luo, J., Liu, S., Wang, C., and Wang, T.: The sudden stratospheric warming in January 2021, Environ. Res. Lett., 16, 084029, https://doi.org/10.1088/1748-9326/ac12f4, 2021.
Manney, G. L., Elson, L. S., Mechoso, C. R., and Farrara, J. D.: Planetary-scale waves in the Southern Hemisphere winter and early spring stratosphere: Stability analysis, J. Atmos. Sci., 48, 2509–2523, https://doi.org/10.1175/1520-0469(1991)048<2509:PSWITS>2.0.CO;2, 1991.
Manney, G. L., Schwartz, M. J., Krüger, K., Santee, M. L., Pawson, S., Lee, J. N., Daffer, W. H., Fuller, R. A., and Livesey, N. J.: Aura Microwave Limb Sounder observations of dynamics and transport during the record-breaking 2009 Arctic stratospheric major warming, Geophys. Res. Lett., 36, 12, https://doi.org/10.1029/2009GL038586, 2009.
Matsuno, T.: Vertical Propagation of Stationary Planetary Waves in the Winter Northern Hemisphere, J. Atmos. Sci., 27, 871–883, https://doi.org/10.1175/1520-0469(1970)027<0871:VPOSPW>2.0.CO;2, 1970.
Matsuno, T.: A dynamical model of the stratospheric sudden warming, J. Atmos. Sci., 28, 1479–1494, https://doi.org/10.1175/1520-0469(1971)028<1479:ADMOTS>2.0.CO;2, 1971.
McFarlane, N. A.: The effect of orographically excited gravity wave drag on the general circulation of the lower stratosphere and troposphere, J. Atmos. Sci., 44, 1775–1800, https://doi.org/10.1175/1520-0469(1987)044<1775:TEOOEG>2.0.CO;2, 1987.
Molod, A., Takacs, L., Suarez, M., and Bacmeister, J.: Development of the GEOS-5 atmospheric general circulation model: evolution from MERRA to MERRA2, Geosci. Model Dev., 8, 1339–1356, https://doi.org/10.5194/gmd-8-1339-2015, 2015.
Palmer, T. N.: Aspects of stratospheric sudden warmings studied from a transformed Eulerian-mean viewpoint, J. Geophys. Res., 86, 9679–9687, https://doi.org/10.1029/JC086iC10p09679, 1981.
Pedatella, N. M., Liu, H.-L., Marsh, D. R., Raeder, K., Anderson, J. L., Chau, J. L., Goncharenko, L. P., and Siddiqui, T. A.: Analysis and hindcast experiments of the 2009 sudden stratospheric warming in WACCMX + DART, J. Geophys. Res.-Space, 123, 3131–3153, https://doi.org/10.1002/2017JA025107, 2018.
Plumb, R. A.: Instability of the distorted polar night vortex: A theory of stratospheric warmings, J. Atmos. Sci., 38, 2514–2531, https://doi.org/10.1175/1520-0469(1981)038<2514:IOTDPN>2.0.CO;2, 1981.
Rao, J. and Garfinkel, C. I.: CMIP5/6 Models Project Little Change in the Statistical Characteristics of Sudden Stratospheric Warmings in the 21st Century, Environ. Res. Lett., 16, 034024, https://doi.org/10.1088/1748-9326/abd4fe, 2021.
Rao, J., Garfinkel, C. I., Wu, T., Lu, Y., Lu, Q., and Liang, Z.: The January 2021 sudden stratospheric warming and its prediction in subseasonal to seasonal models, J. Geophys. Res.-Atmos., 126, e2021JD035057, https://doi.org/10.1029/2021JD035057, 2021.
Rhodes, C. T., Limpasuvan, V., and Orsolini, Y. J.: Eastward-propagating planetary waves prior to the January 2009 sudden stratospheric warming, J. Geophys. Res.-Atmos., 126, e2020JD033696, https://doi.org/10.1029/2020JD033696, 2021.
Salby, M. L.: Fundamentals of atmospheric physics, no. v. 61 in International geophysics series, Academic Press, San Diego, 648 pp., ISBN 9780080532158, 1996.
Sato, K. and Nomoto, M.: Gravity wave–induced anomalous potential vorticity gradient generating planetary waves in the winter mesosphere, J. Atmos. Sci., 72, 3609–3624, https://doi.org/10.1175/JAS-D-15-0046.1, 2015.
Siskind, D. E., Eckermann, S. D., McCormack, J. P., Coy, L., Hoppel, K.W., and Baker, N. L.: Case studies of the mesospheric response to recent minor, major, and extended stratospheric warmings, J. Geophys. Res., 115, D00N03, https://doi.org/10.1029/2010JD014114, 2010.
Song, B. G., Chun, H. Y., and Song, I. S.: Role of gravity waves in a vortex-split sudden stratospheric warming in January 2009, J. Atmos. Sci., 77, 3321–3342, https://doi.org/10.1175/JAS-D-20-0039.1, 2020.
Yamazaki, Y., Matthias, V., and Miyoshi, Y.: Quasi-4-Day Wave: Atmospheric Manifestation of the First Symmetric Rossby Normal Mode of Zonal Wavenumber 2, J. Geophys. Res.-Atmos., 126, e2021JD034855, https://doi.org/10.1029/2021JD034855, 2021.