the Creative Commons Attribution 4.0 License.
the Creative Commons Attribution 4.0 License.
 | 04 Oct 2023
Ground-based noontime D-region electron density climatology over northern Norway
Mani Sivakandan
Juliana Jaen
Werner Singer
The bottom part of the Earth's ionosphere is the so-called D region, which is typically less dense than the upper regions. Despite the comparably lower electron density, the ionization state of the D region has a significant influence on signal absorption for propagating lower to medium radio frequencies. We present local noon climatologies of electron densities in the upper middle atmosphere (50–90 km) at high latitudes as observed by an active radar experiment. The radar measurements cover 9 years (2014–2022) from the solar maximum of cycle 24 to the beginning of cycle 25. Reliable electron densities are derived by employing signal processing, applying interferometry methods, and applying the Faraday-International Reference Ionosphere (FIRI) model. For all years a consistent spring–fall asymmetry of the electron density pattern with a gradual increase during summer as well as a sharp decrease at the beginning of October was found. These findings are consistent with very low frequency (VLF) studies showing equivalent signatures for nearby propagation paths. It is suggested that the meridional circulation associated with downwelling in winter could cause enhanced electron densities through NO transport. However, this mechanism can not explain the reduction in electron density in early October.
- Article
(1076 KB) - Full-text XML
- BibTeX
- EndNote


The lower part of the ionosphere is called the D region and generally refers to altitudes below 100 km (Mitra, 1968). The ionization of nitric oxide (NO) and meta-stable oxygen molecules (O2) in this region's electron concentration is mainly controlled by the Lyman-alpha line and UV radiation, respectively. It is also a region where cluster ions are prevalent. The D region also co-exists with the mesosphere, which is the most dynamic region of the Earth's atmosphere, where temperature decreases with altitude and most of the wave breaking occurs. Diurnal variation in the D-region electron density is primarily controlled by the changes in the solar zenith angle. Unlike in the E and F regions, ions and electron motion in the D region is mainly driven by the neutral winds because the collision frequency is higher than the gyro-frequency (< 80 km). Therefore, the variability in the D region is not only driven by solar radiation but also significantly affected by neutral atmospheric dynamics. For example, the so-called D-region winter anomaly (i.e., enhancement in the electron density during winter) is proposed to be caused by the atmosphere–ionosphere coupling process through the planetary wave, temperature, and composition changes by vertical and meridional transport. Changes in the D-region electron concentration impede the long-distance propagation of high-frequency (HF) radio waves through absorption. Thus, understanding and quantification of the D-region electron density variability and its causative mechanisms are essential.
Continuous observation of the D region is very challenging because of the low electron abundance. There are very few direct observational techniques such as sounding rockets (Mechtly, 1974), incoherent scatter radar (Chau and Woodman, 2005; Baumann et al., 2022), very low frequency (VLF) methods (Worthington and Cohen, 2021), and partial-reflection radars or medium-frequency (MF) radars (Belrose, 1970; Igarashi et al., 2000; Singer et al., 2008) that are effectively used to measure the D-region electron density (see. e.g., Friedrich and Rapp, 2009, for a review). Among them, the rocketborne in situ measurements (Faraday experiment) are highly accurate (capable of detecting even low electron density), but the data availability is comparably sparse because the launching costs are high. Using the available EISCAT radar data and rocket measurements, Friedrich et al. (2004) present the quiet auroral ionosphere and its neutral background. Particularly for the representation of the D region only a limited number of rocket measurements could be used.
In addition to the direct measurements, indirect information on the middle atmosphere ionization state can be obtained by proxies such as riometer absorption, which measures the reduction in incident galactic radio noise relative to a quiet-day curve (Friedrich et al., 2002). The quiet-day curve is typically derived from the previous interference-free days (see, e.g., Moro et al., 2012; Renkwitz et al., 2011). The observed absorption is an integrative parameter attributed to the electron density at altitudes between 80–90 km due to collisions between free electrons and neutrals. During polar cap absorption, the 55-ion Sodankylä model was applied in the inversion of the raw densities measured by the ultra-high-frequency (UHF) EISCAT radar, and that provided some realistic estimates of the actual electron density in the D region (del Pozo et al., 1999). Recently, long-distance sub-ionospheric VLF radio wave observation was also used as an indirect method to investigate the long-term climate change in the D region (Clilverd et al., 2017).
Apart from observations, based on the available data sets and Chapman's theory, there are some statistical (McNamara, 1979), empirical (Friedrich and Torkar, 1992; McKinnell and Friedrich, 2007; Friedrich et al., 2018a), semi-empirical (Friedrich and Torkar, 2001), physical, chemical, and theoretical models (Burns et al., 1991; Verronen et al., 2016; Zhu et al., 2023) that also exist in the literature, and they can reasonably well reproduce the quiet-time lower ionosphere. For example, incorporating several hundred rocket profiles, Friedrich and Torkar (2001) and Friedrich et al. (2018a) developed an empirical model called the Faraday-International Reference Ionosphere (FIRI) model. IMAZ is a neural-network-based empirical model for the lower ionosphere in the auroral zone (McKinnell and Friedrich, 2007) developed for the International Reference Ionosphere (IRI) global model community. Combining two chemical models, namely the Mitra–Rowe simplified 6-ion model and a 35-ion model developed at the Sodankylä Geophysical Observatory, Burns et al. (1991) developed a D- and E-region chemical model called Sodankylä Ion and neutral Chemistry (SIC) model. Later on, Verronen et al. (2005) pointed out that the SIC model could correctly estimate the ionization and electron densities during solar proton events (SPEs) in October–November 2003. A comparative study of electron densities observed from the VLF and rocket measurement with the OASIS (Originally Austrian Study of the IonoSphere) model showed that below 68–70 km the model data agree well with observations. However, above 68–70 km the OASIS model fails to reproduce the observation (Siskind et al., 2018). Overall, the models can be used as a climatological mean representative of the D region; when it comes to the observational dynamical changes, their reliability is questionable at least below 80 km because of the limited availability of the D-region observational data.
As mentioned earlier, the diurnal and seasonal variation in the D-region electron density is primarily caused by the variable solar zenith angle; the Lyman-alpha radiation; and by minor species, notably NO. In addition, D-region electron density also shows an asymmetrical behavior that can not be explained by the solar variation. For example, recently Baumann et al. (2022) reported the electron density is higher during sunset than sunrise. They postulate that the change in the recombination rates is a plausible reason for this observed asymmetry. Similarly, earlier investigations showed enhancement in the D-region electron density during winter (winter anomaly; Offermann, 1979a, b). In winter's absence of sunlight or a reduction in solar radiation, solar EPP (energetic particle precipitation) could be a primary cause of the observed winter anomaly. However, the winter anomaly is also observed in the absence of EPP, so-called “meteorological types” of winter anomaly (Offermann, 1980). There are several mechanisms proposed for the formation of the meteorological types of winter anomaly: changes in the NO due to the transport process associated with atmospheric planetary waves and sudden stratospheric warming events (Kawahira, 1985). Though there are several case studies and periodic campaigns carried out to explore the D-region electron density variations and their causative mechanisms, we are still unable to address the seasonal variation in D-region studies by continuous observations.
A recent study by Macotela et al. (2021) reported that during the fall equinox, there is an increase in the noontime mean amplitude of VLF radio waves in high and middle latitudes not relate to the solar zenith angle (SZA; see Fig. 3); they called this a fall effect. They showed that during that time a decrease in the background temperature and an increase in the semi-diurnal tide (S2) amplitude are observed. Thus, they postulate that the changes in the collision frequency associated with the background temperature could be a prime reason for the observed increase in the noontime VLF amplitude. It is well known that the VLF radio waves are drastically affected by the D-region electron density; however, Macotela et al. (2021) did not consider the electron density role (if any) in the fall effect. Therefore, this study focuses on exploring the altitudinal and seasonal variation in noontime electron density using partial-reflection radar observations from 2014 to 2022 at a high-latitude location.
In the following sections, we will introduce the instrument used in this study, followed by a brief description of the experiment and methods to derive electron densities in Sect. 2. This includes the advances we recently made in the processing and outlier removal by, e.g., applying the FIRI model as a quiet reference. It also includes the detection of EPP and splits the radar data into quiet and solar, geomagnetically active periods. In Sect. 3 the results, namely the annual noontime electron density profiles including the 9-year climatology, are presented. Furthermore, we discuss the specific features found and the probable connections to other phenomena. Finally, we conclude our findings in Sect. 4.
1.1 The Saura radar
The Saura radar is a modular partial-reflection radar built in 2002 on the island of Andøya (69∘ N, 16∘ E). The radar operates at 3.17 MHz, and due to the proximity to the medium frequencies, it is often referred to as an MF radar. The specialty of this instrument is the comparably large Mills Cross antenna array spreading over roughly 1×1 km (see Fig. 1). Each dipole antenna forming the sketched crossed dipoles is connected to an individual phase-controlled transceiver module capable of 2 kW peak power. This configuration allows for the emission of circularly polarized pulsed radio waves and beamforming for different pointing directions, which makes it unique for this frequency range.
One major scientific target of this instrument is the measurement of winds in the lower ionosphere, namely the D region. Such measurements are widely performed by a Doppler beam swinging (DBS) experiment, measuring the radial velocity components for distinct vertical and four oblique beam-pointing directions. The horizontal resolution for DBS is typically less than 10 km at 80 km altitude.
Alternatively, full correlation analysis (FCA; e.g., Briggs, 1984) can be applied and is especially advantageous for higher-altitude imaging Doppler interferometry (IDI; e.g., Palmer et al., 1995; Roper and Brosnahan, 1997); see Renkwitz et al. (2018) for more details and its application with the Saura radar. For the last few years the Saura radar wind measurements have been performed with a resolution of at best 4 min, and the same cadence is applicable for electron density measurements. However, larger windows of up to 12 min are often used to reduce the uncertainty.
The latest upgrades to the radar included the introduction of pulse code capability and the addition of three digital receiver channels to improve the signal-to-noise ratio and strengthen interferometric methods.
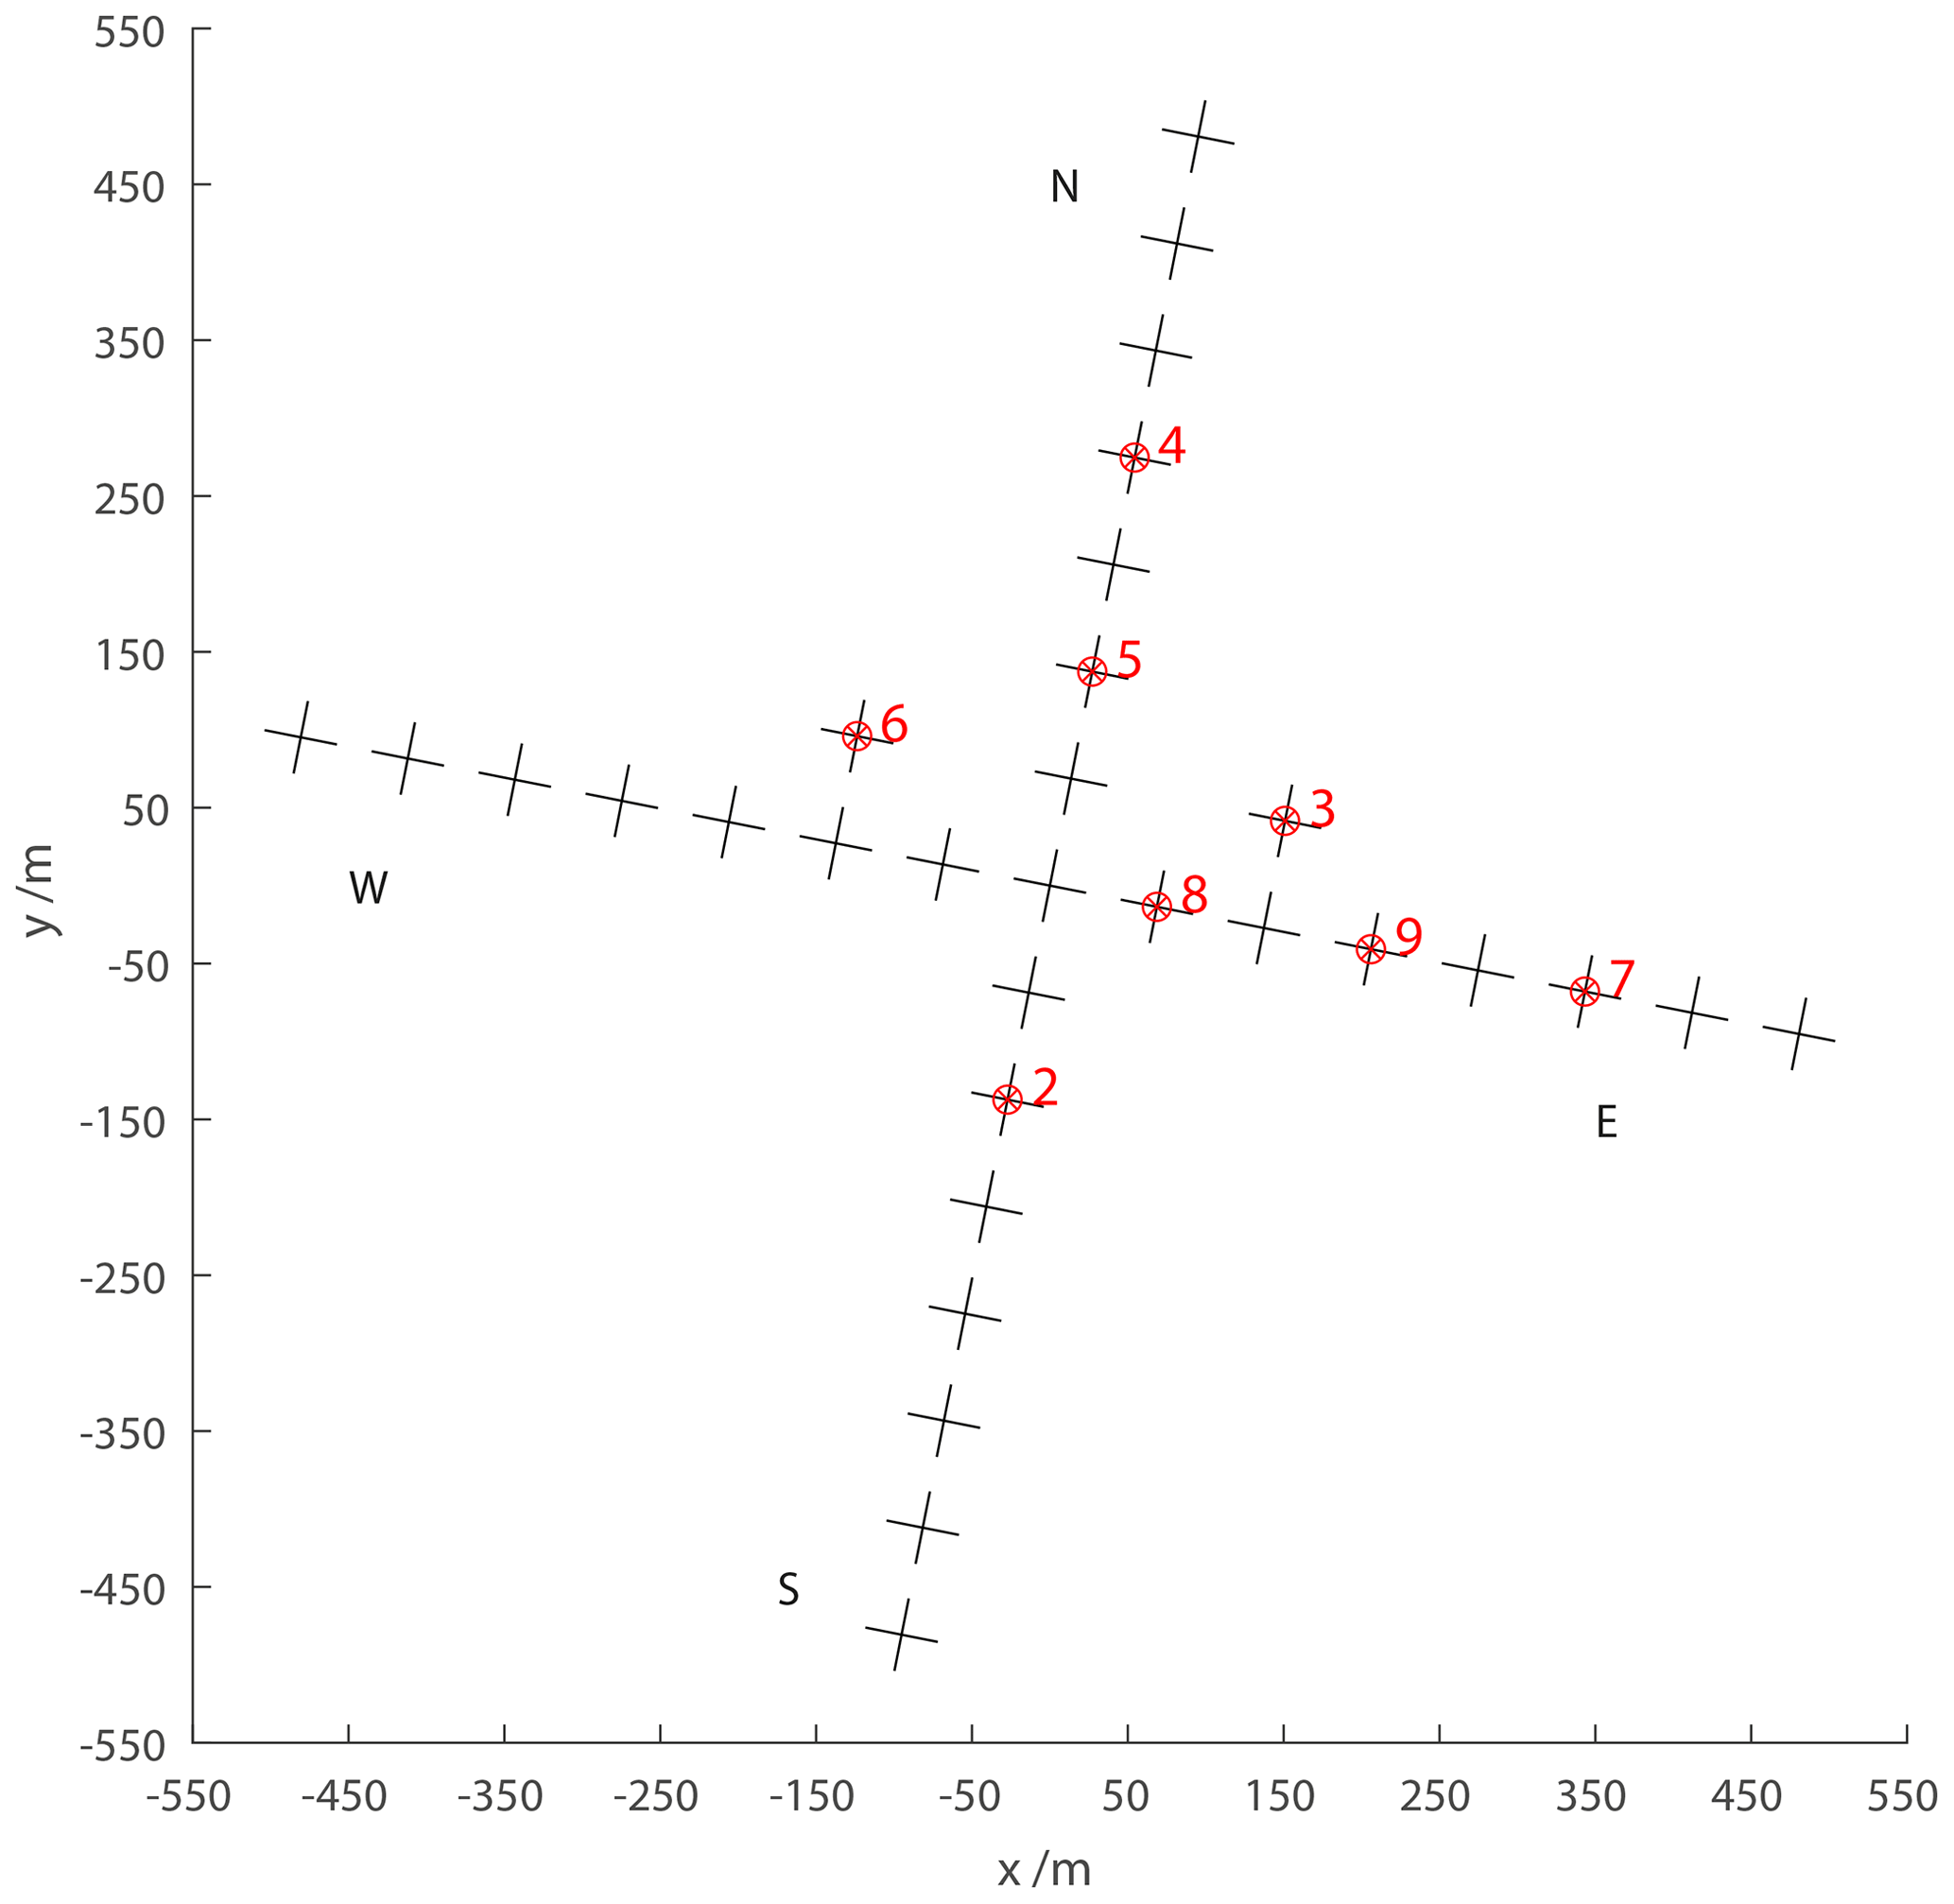
Figure 1Sketch of the Saura radar antenna array; marked antennas are connected to individual receiver channels used for interferometry.
Two methods may be used with sufficiently large MF radars to deduce electron densities in the D region, making use of observing the wave absorption and Faraday rotation. They are normally referred as differential phase experiments (DPEs) and differential amplitude experiments (DAEs), analyzing the radar echoes from alternating transmission of both magneto-ionic modes. These techniques were described by, e.g., Sen and Wyller (1960), Belrose (1970), Budden (1983), and more recently Vuthaluru (2003) and were also applied by, e.g., Grant et al. (2004), Osepian et al. (2008), or Liu et al. (2020) and Zhu et al. (2023) to the MAI and Kunming radar systems.
Equation (1) describes the relation of the amplitude ratio to the ratio of reflection coefficients for the height interval Δh for DAEs, in which kx and ko are the absorption indices and are related to the imaginary part of the complex refractive indices by a factor for both magneto-ionic modes. For DPEs the differential phases of the two modes and the reflection coefficients are compared and normalized by the real part of the refractive indices, μx and μo, per height interval (Eq. 2):
For this study, we restrict where we apply the high-latitude approximation of the Sen–Wyller refractive index to DPEs after Flood (1980). For the Saura radar, equivalent experiments have been carried out not only by Singer et al. (2008, 2011) and Renkwitz et al. (2021) but also, e.g., with the Buckland Park radar by Holdsworth et al. (2002). The pressure and temperature profiles are taken from CIRA-86 for consistency because, e.g., rocketborne falling-sphere experiments did not cover the winter period. Lübken (1999) found the deviations from CIRA-86 to be within about ±5 % for altitudes below 80 km. We tend to rely on CIRA-86 as we also work on comparable experiments for the middle-latitude station Juliusruh (54.6∘ N, 13.4∘ E) for which no rocketborne data exist. For the magnetic field, T after IGRF-13 (International Geomagnetic Reference Field; Alken et al., 2021) and θ=11.9∘ are used for the radar location.
Electron densities have been derived from two different experiments that have probed the atmosphere with alternating circular polarization, matching both magneto-ionic components (ordinary, extraordinary). The vert-ox experiment is an uncoded vertical-only experiment, whereas the sd-07ox-4c experiment is a 4 bit complementary-code Doppler beam swinging (DBS) experiment probing five different directions primarily intended for wind measurements (see Table 1 for more experiment details). The experiments have durations of 215 and 235 s for the vertical-only and DBS experiments, respectively, which cover multiples of the typical correlation time of the observed structures. The shorter runtime of the vertical experiment is chosen to allow a short high-range monitor experiment, which is not used here. Thus for most of the measurements, almost continuous sampling is maintained without larger gaps. The pulse repetition frequency is adapted for day and night measurements in order to prevent clutter from multiple ionosphere–ground reflections. The lower number of data points in the DBS experiment per beam-pointing direction is partly compensated for by the 4 bit complementary code. This pulse coding improves the signal-to-noise ratio as the averaged transmitted power increases, and received power from random noise and interference is reduced as it does not match the code. After decoding the multi-beam DBS experiment, we only analyze the vertical measurements for electron density estimations. Equivalent-electron-density measurements with the Saura radar have lately also been used to investigate, e.g., so-called polar mesosphere winter echoes (PMWEs) and study their occurrence (Renkwitz et al., 2021). Furthermore, Saura electron density profiles have been partly validated by rocketborne in situ measurements during a PMWE campaign (Strelnikov et al., 2021; Staszak et al., 2021).
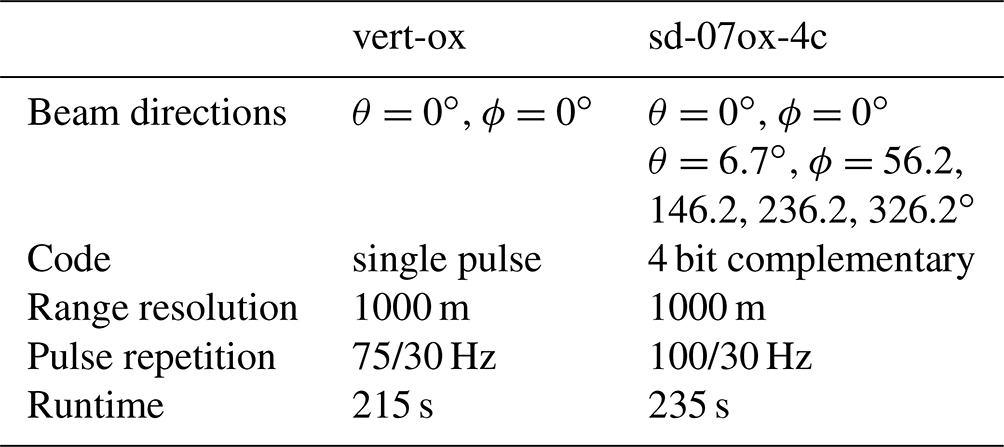
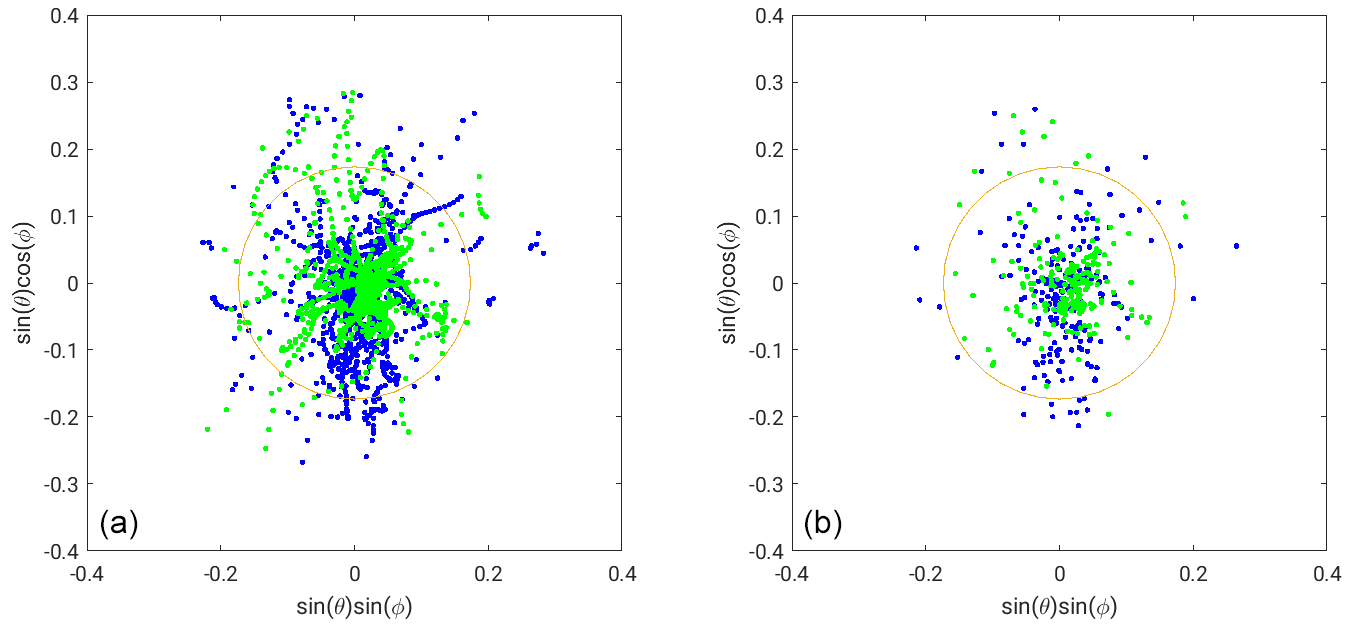
Figure 2Example of derived angle-of-arrival (AOA) positions for O and X mode, depicted in blue and green, respectively. (a) Original resolution. (b) With 1 s integration time. The orange circle marks the selected 10∘ area of interest.
2.1 Amendment of the electron density estimates
The typically observed rather large variability in electron density profiles gives rise to multiple potential sources within the probed volume. Assuming a 6∘ wide transmit beam, the illuminated area corresponds to a diameter of ≈ 8.5 km at 80 km altitude, neglecting side lobes. The horizontal variability in gradients in the electron density for this size is likely caused by the presence and superposition of propagating small-scale waves. Since the earlier electron density measurements with the Saura radar (Singer et al., 2011), the fundamental technique has been combined with additional signal processing methods and interferometry.
First, we split the complex times series into four blocks; then the correlation length of the detected echoes for each block and range is derived. The correlation length is used to apply a sufficient amount of coherent integration to reduce the variability in the raw data in order to stabilize the angle-of-arrival (AOA) estimates.
To improve the individual electron density estimates for each experiment run, we remove radar echoes that are received most likely through the side lobes of the antenna array. Given the sparse character of the Mills Cross-like antenna layout, imperfections in the radiation pattern, namely side lobes along the axes of the antenna array, exist. For situations when much larger electron density gradients exist in the orientation of these side lobes rather than in the nominal main beam-pointing direction, echoes from these unwanted directions are received and will impair the results.
Therefore, we apply interferometric methods to discriminate the location of the scattering structures. For localizing the scattering structures, we generally make use of four individual antennas, marked in Fig. 1 as receiver channels 3–6. With this arrangement, six individual and non-redundant baselines can be used for AOA estimates, covering up to 25∘ given its shortest baselines of 1.48λ (≈ 140 m) (see, e.g., Renkwitz et al., 2018; Renkwitz and Latteck, 2019). The same arrangement and basic methodology were already applied using IDI to make use of the ionospheric inhomogeneity for Saura wind measurements (see Renkwitz et al., 2018). The required phase information of the receiving channels is estimated based on AOA statistics for all beam positions for the course of months.
An example of derived instantaneous AOA positions for a single vertical sounding experiment of less than 4 min runtime is shown in Fig. 2 for a range of 89 km from the radar. Two scenarios are shown, the native resolution and after applying an integration of 1s before solving for AOA. From that plot, it is obvious that many positions are still outside the marked 10∘ area of interest. Furthermore, as the radar echoes are measured in range gates, basically a position on the spherical shell, it will result in vertical smearing without proper conversion and selection. For each of the four time series blocks, the AOA positions are used to potentially discard the derived differential phase between the ordinary and extraordinary wave for the same chunks.
Another important point is a suitable unwrapping of the differential phases. Even though a progressively increasing radial phase difference is expected with increasing electron density over altitude, we also allow for minor negative estimated phases to cope with measurement errors. Larger negative phases, however, are interpreted as positive phase wraps. Note that a reduction in electron density may occur for electron bite-out situations during the charging of ice particles in the summer mesosphere (Rapp et al., 2003; Rapp and Lübken, 2004; Friedrich et al., 2011). Note that these scenarios should not affect the altitudes below 80 km that are mostly investigated.
The first cleaning of the data is done by removing isolated data points, like potential erroneous data at the lowermost captured altitudes. Additionally, outliers based on the typically observed variability in values adjacent in time and altitude are flagged.
In the next step, we aim to reject suspicious electron density profiles that show excessively small or large values. For this, we use FIRI (Friedrich et al., 2018b) profiles that are selected for the nearest latitude (60∘) as well as solar flux and then interpolated for the day of year (DOY) and solar zenith angle (SZA; see Fig. 3). The interpolated FIRI local noontime electron densities for low-solar-flux conditions (sfu = 90) are depicted in Fig. 4. We are aware FIRI is not explicitly meant to be representative of polar latitudes, but we apply the profiles as a coarse reference for geomagnetic quiet times.
For the evaluation of the Saura electron density profiles for quiet conditions, we allow for deviations between of and 4 times the reference profile. The same methodology is used for geomagnetically disturbed times, but we allow for much larger densities (100 times the FIRI profile). For the main target of this study, namely deriving daily noon averages, we average the remaining profiles for both scenarios between 09:00–13:00 UT.
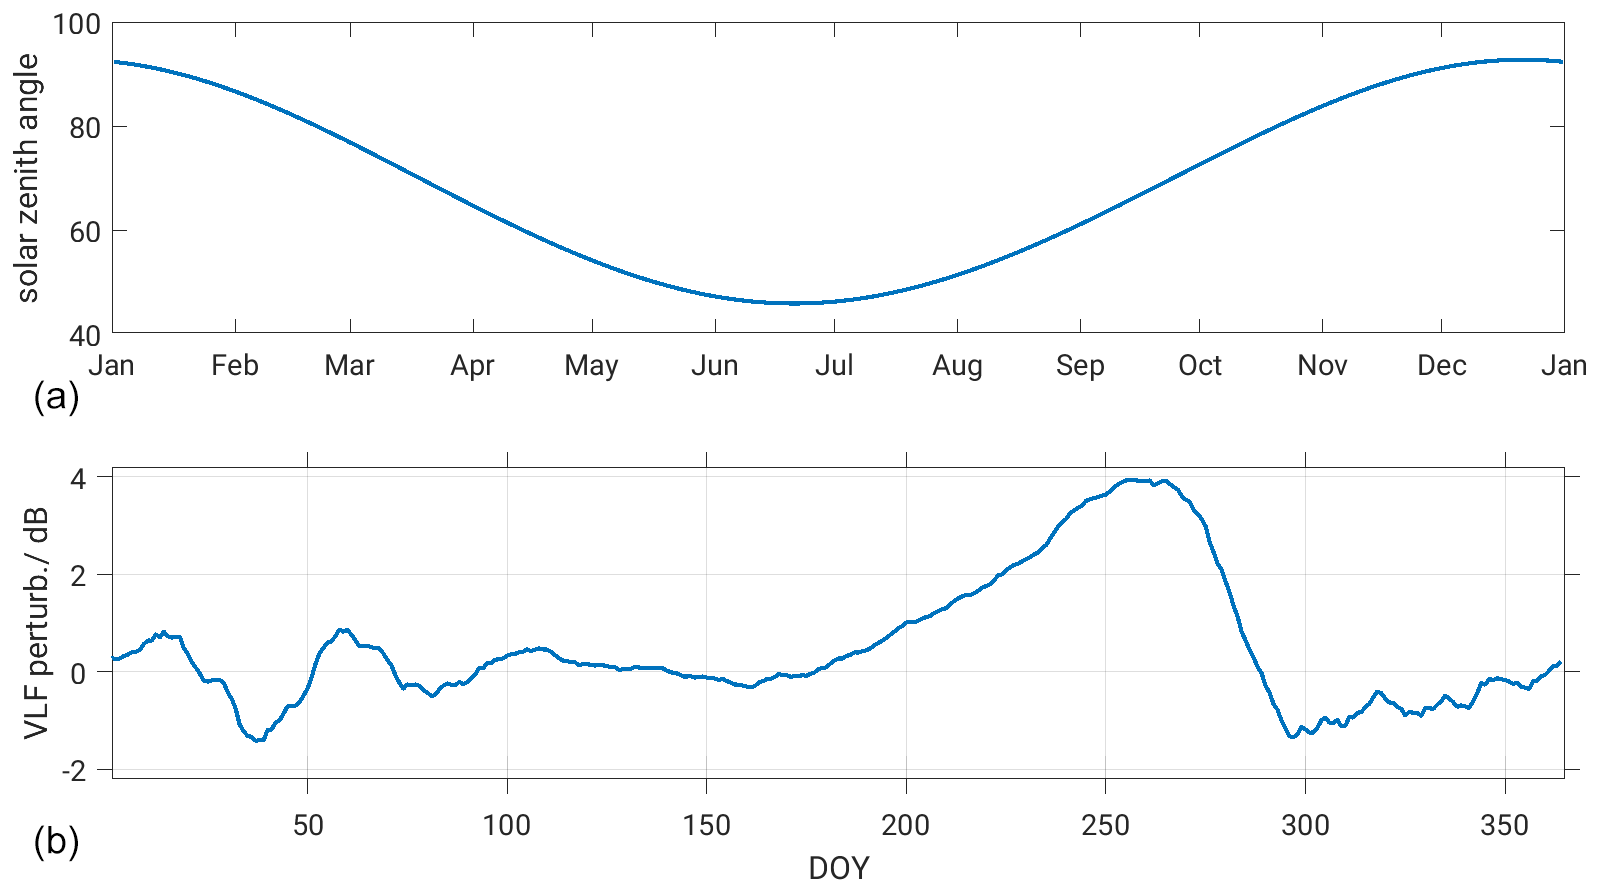
Figure 3(a) Daily noon solar zenith angle for the Saura location. (b) Detected mean VLF amplitude perturbations for the transmitter Cutler (USA, NAA) and receiver Sodankylä (Finland, SOD), after Macotela et al. (2021).
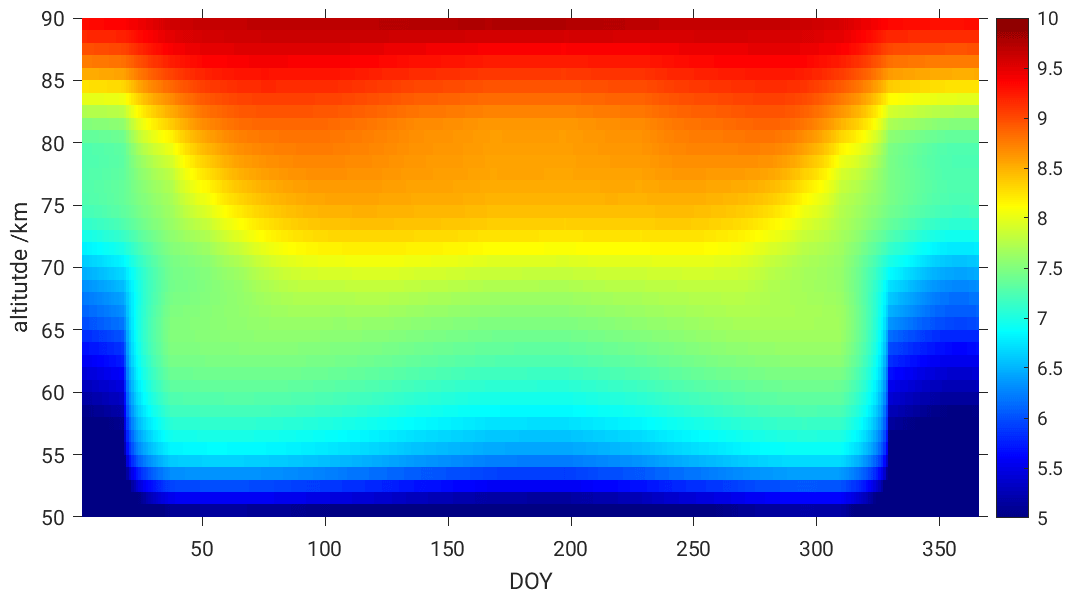
Figure 4Electron densities as derived from FIRI for 60∘ N during low-solar-flux conditions (sfu = 90), interpolated for the SZA at noontime for each DOY. The color bar represents densities as log10(ne) m−3.
2.2 Discrimination between quiet and disturbed conditions
As already mentioned, enhanced solar and geomagnetic activity will alter the current state of the lowermost ionospheric layer until it settles down and recombination is completed. For our purpose of deriving climatologies for not only quiet but also disturbed conditions, these different conditions need to be separated. One obvious and frequently used way to evaluate the geomagnetic conditions is to use proxies derived from, e.g., magnetometer data like K or Hpo indices or riometer data. Often, these parameters are then analyzed in combination for multiple locations. Depending on the distribution of these locations, the proxies might be more relevant for mid-latitudes and as planetary indices. Additionally to this and solar radiation like F10.7 and F30 flux, solar wind parameters are useful to describe the current influx. Particle detectors on board GOES and POES satellites and comparable instrumentations may also discriminate between certain energy bands of precipitating particles.
Fortunately, the Saura radar itself is very sensitive to electron density enhancements occurring in the radar's field of view; see Renkwitz and Latteck (2017). Significantly enhanced electron densities, e.g., caused by EPP, form virtually isolated layers in the echo power profiles as the radar signal is strongly absorbed for the altitudes above. The first observations of such virtual layers have been reported and named ILMEs (isolated lower mesospheric echoes; Hall et al., 2006) and have been widely attributed to events of precipitating protons during solar flares. The time series of such isolated layers for the years 2003 to 2022 as detected by Saura (extended data set by Renkwitz and Latteck, 2017) is used in the following to flag disturbed conditions and treat the electron density data for both scenarios separately.
Based on the ILME detections using the Saura radar, periods of EPP events are flagged and thus excluded from further processing of the quiet periods' profiles. To prevent contamination from undetected events and to cover the recombination time, we use a window of ±1 h around the individual EPP detections. In the next step, the daily noon medians for all data and quiet times only are calculated for each altitude from all valid measurements during the period of 09:00–13:00 UT, and they are stored for the corresponding DOY.
An example of a successful differentiation for both disturbed and quiet ionospheric conditions and corresponding annual noon electron densities is shown for the year 2019 in Fig. 5. In the upper panel, all valid data including active periods (e.g., EPP and SPEs) are shown, where enhanced electron densities are clearly visible around March–April and September–October for altitudes of 60–70 km. Such enhancements near the equinoxes are commonly related to the Russell–McPherron cycle (Russell and McPherron, 1973). The visible vertically aligned gaps are caused by the rejection of long-lasting EPP events rather than observational gaps. The bottom panel depicts the quiet-time (excluding EPP and SPEs) D-region electron densities during the year 2019. Interestingly, even after removing the geomagnetic-disturbance effect, the enhancement in the electron density during the spring and fall equinox is prominent; the probable cause and effect of these enhancements will be discussed in the following.
The composite means of 9 years (2014–2022) of electron densities during geomagnetically disturbed and quiet conditions are provided in Fig. 6, top and bottom panels, respectively. The general picture of the electron densities in the lower ionosphere is governed by the dominating incident solar radiation. As an indicator of incident radiation, not only the flux of UV (Lyman-alpha line and X-rays in the case of solar flares) but also the solar zenith angle (SZA) are used. Assuming a rather constant flux and a symmetrical SZA for spring and fall (see Fig. 3), a symmetric electron density is also expected, neglecting other contributing factors like dynamics. This assumed symmetry of spring and fall electron densities is not observed in our data, but increasing D-region electron densities below 75 km altitude from spring towards fall are shown for 2019 in Fig. 5.
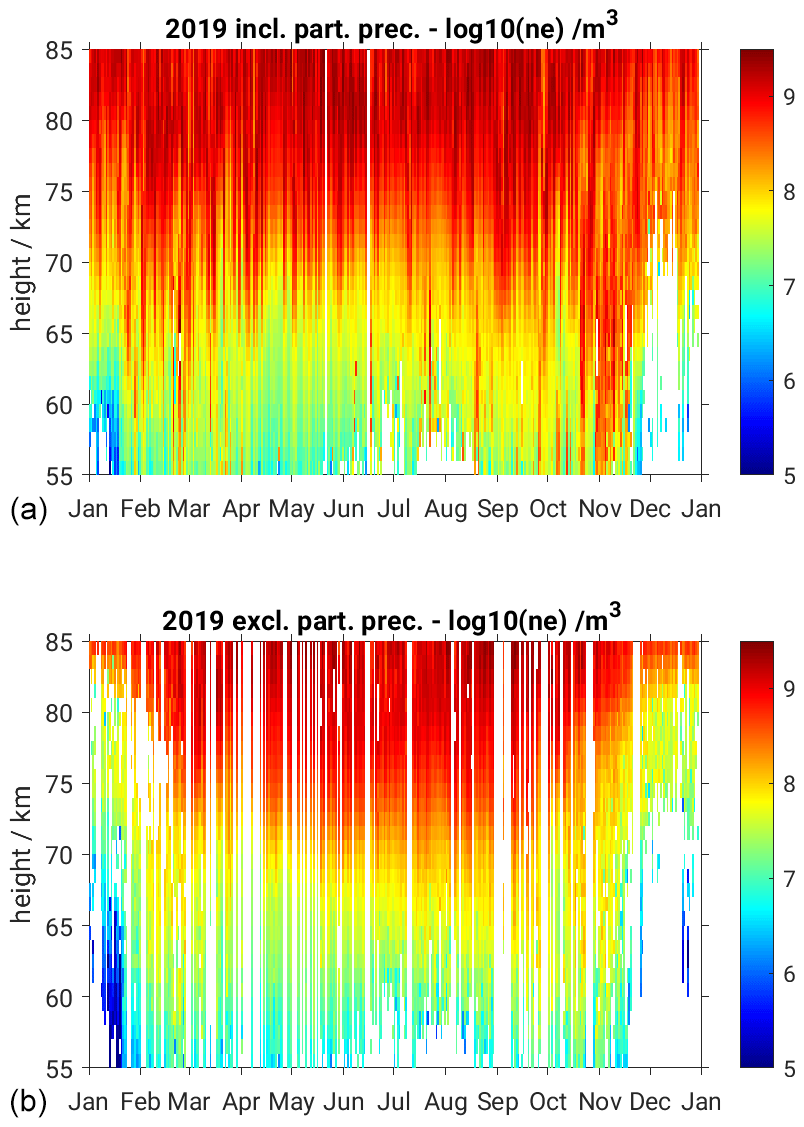
Figure 5Observed Saura electron densities during 2019, for all conditions (a) and excluding active periods (b).
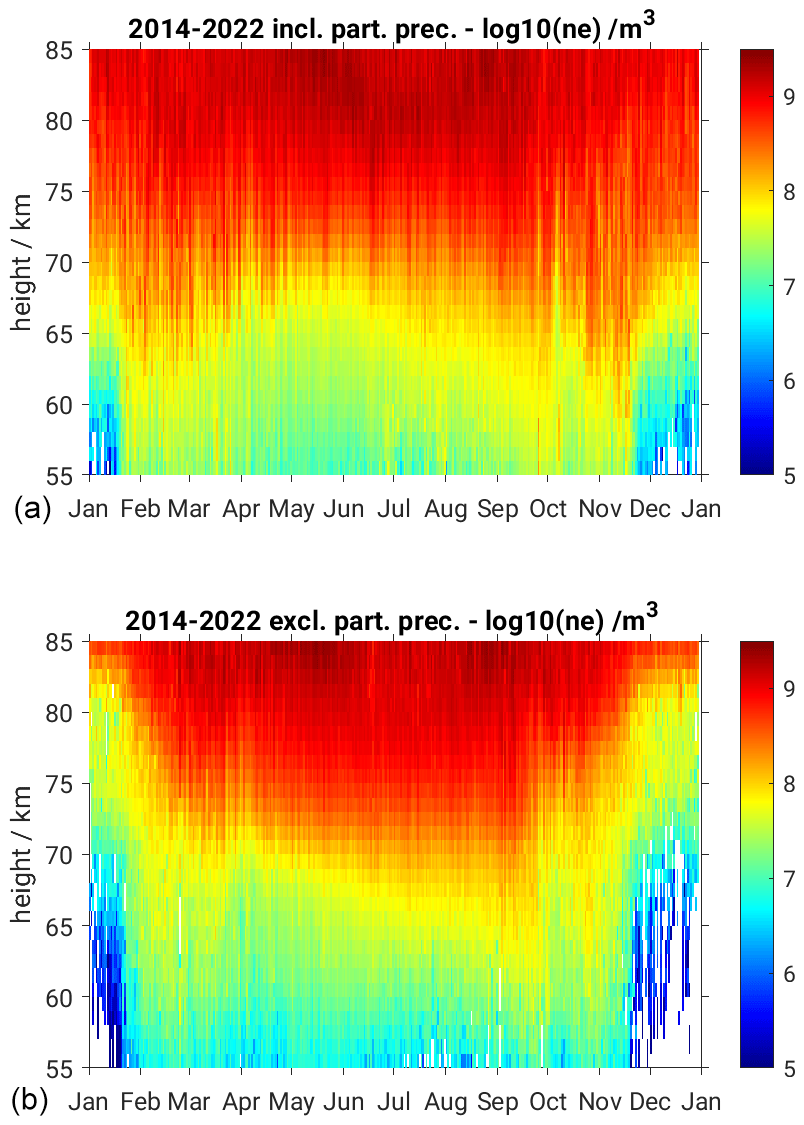
Figure 6Climatology of electron density including (a) and excluding (b) particle precipitation events for the years 2014–2022.
It has to be noted that 2019 was characterized by generally extremely low solar and geomagnetic activity and might therefore represent an extreme case. Therefore we also applied the same methods to years of enhanced solar activity, from 2014 (the maximum of solar cycle 24) until the end of 2022 (onset of solar cycle 25). The analysis covers a total of 9 consecutive years since the last major radar upgrade, spanning a rather poor solar maximum to extreme solar-minimum conditions, represented by monthly smoothed solar sunspot numbers of 130 down to 0 and a corresponding 10.7 cm solar flux of 150 to 67 sfu (see NOAA, 2023).
For all data of each year, the 2-hourly solar flux is used to derive FIRI profiles that are then employed to reject obvious outliers from the radar measurements. For a climatological picture, we calculated median electron densities for each DOY over all years, which is shown for both, all and quiet, conditions in Fig. 6. Even though we are averaging over fairly different solar and geomagnetic conditions, the general asymmetry which was already found for the year 2019 prevails also for this climatology. For a constant number electron density of 100 electrons cm−3, an almost linear slope from the beginning of April to the end of September is visible for 72 to 66 km, respectively. Such a slope was already visible for the 2019 data shown in Fig. 5.
Noteworthily, in February and March as well as in September and November, enhanced electron densities are visible below 65 km altitude. One plausible cause for these enhancements might be undetected EPP events creating a bias in the medians shown. However, enhancements are also seen in the FIRI output for altitudes as low as 55 km from April to November (see Fig. 4). Furthermore, there might be dynamics-driven causes for the observed variability as it is in a rather unstable period with its proximity to sudden stratospheric warmings (SSWs) during winter.
Note that the abrupt changes at the end of January and November appear artificial and are likely caused by the FIRI reference applied to reject too large values of the measurements. The mentioned period actually describes the time of lowest SZA, when the sun is basically below the horizon the whole day, and represents the most challenging scenario to derive reliable electron densities. One obvious reason for this is the generally very low ionization and steep gradient near 85 km altitude (cf. Fig. 4) that does not allow for much range for radar measurements, keeping in mind a minimum range resolution of 1 km. The upper panel of Fig. 6 depicts the median of all valid data including EPP events. Enhancements around the equinoxes are visible, especially during the winter period. Even though the frequency of strong and long-lasting events is rather low in wintertime, their contribution may still be significant as they typically occur near noontime.
The ratio of observed quiet-time median electron densities smoothed with a 30 d window to the very SZA-symmetric FIRI is shown in Fig. 7. Data covered by less than 4 years of quiet-time observations are blanked as they may not be representative (see EPP around the equinoxes). For altitudes above 75 km, the pattern appears symmetric to the SZA. Specifically interesting are the altitudes near 70 km, which show enhanced densities from June to mid-September.
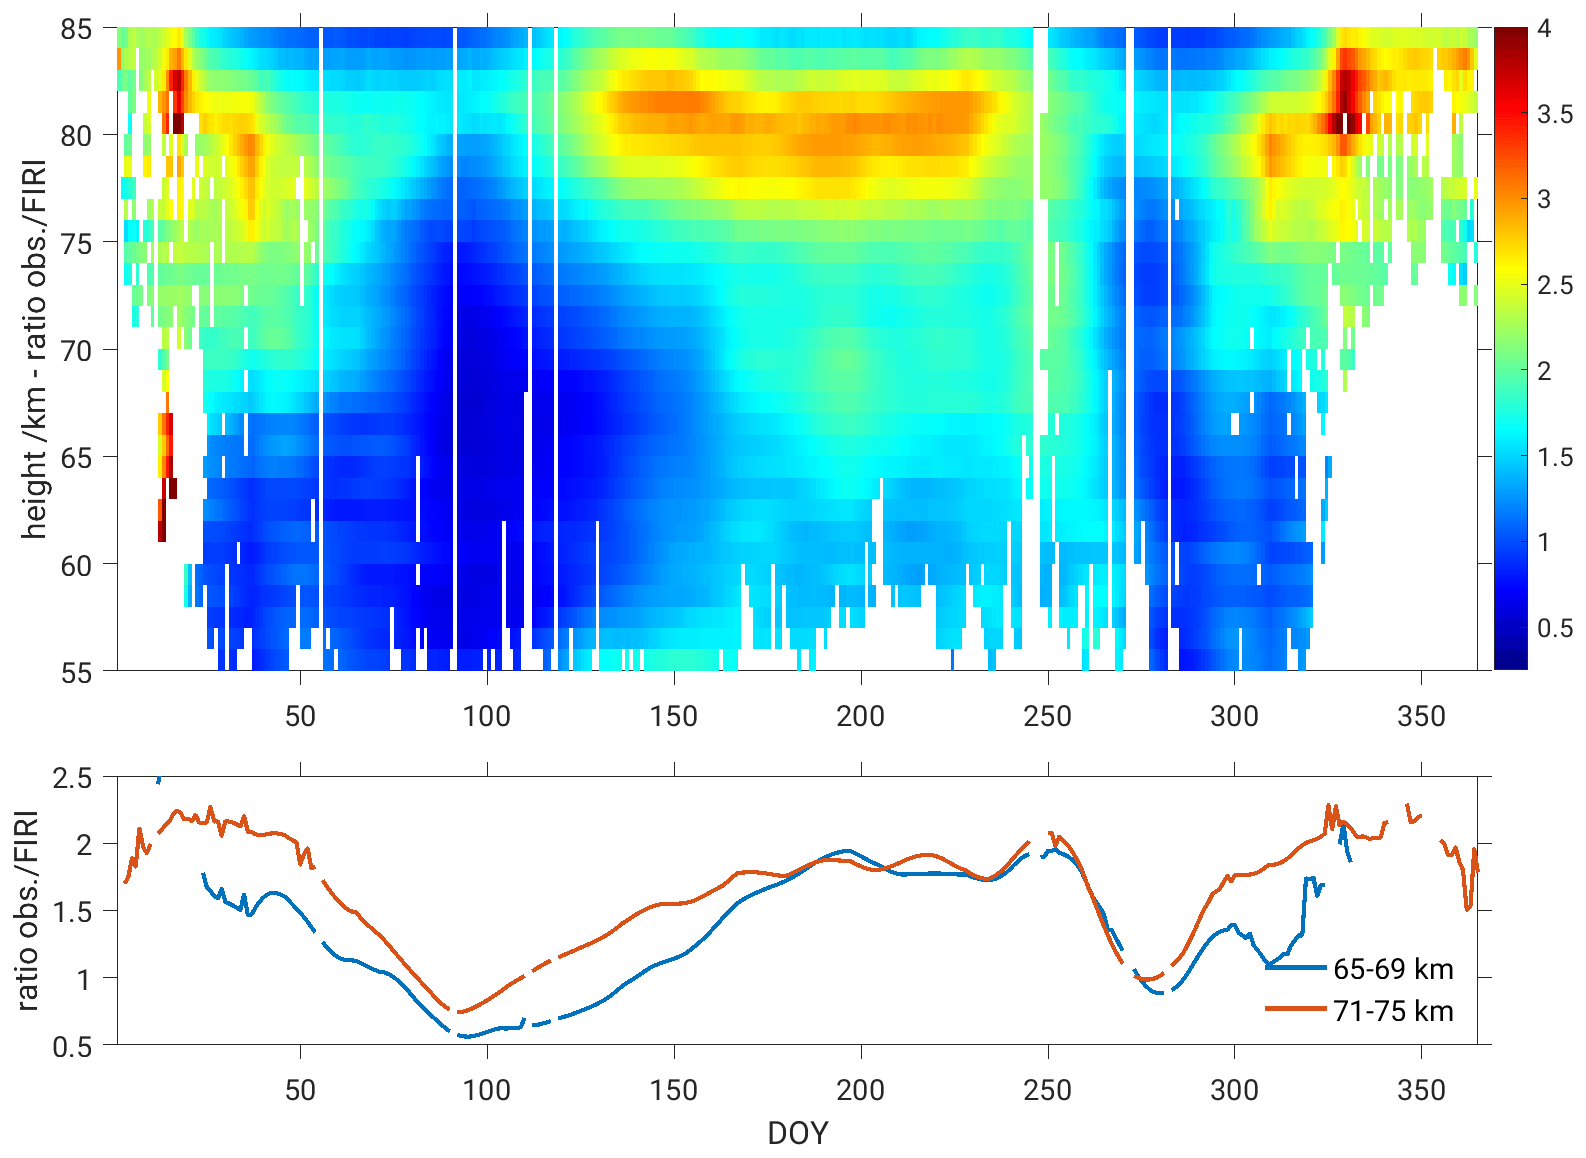
Figure 7Linear ratio of observed median electron densities after 30 d smoothing to FIRI. Bottom: median ratio for the altitude bins 65–69 km and 71–75 km.
As we initially highlighted, the focus of this study is on the asymmetry between spring and fall as previous studies indicated such behavior in the detected VLF amplitudes of long-distance transmissions (Macotela et al., 2021; see bottom panel of Fig. 3). This asymmetry of spring and fall is also clearly visible in the electron density measurements as depicted in the bottom panel of Fig. 7.
Generally, the period from the end of summer and middle of fall is a rather dynamical time of the year, for which we will introduce some presumably related observations. Macotela et al. (2021) argued that changes in the temperature and semi-diurnal tidal amplitude (see Conte et al., 2018) could be a cause for the fall effect. However, their study did not include electron density's role in the observed fall effect (if any). It should be noted that the VLF amplitude is highly influenced by the electron density gradient in the D-region ionosphere (Silber and Price, 2017). Thus, the present results suggest that in addition to the dynamical effects, enhancement in the electron density could also contribute to the observed fall effect in the VLF amplitude. Iimura et al. (2021) investigated the quasi-2 d wave (Q2DW) structure for multiple latitudes using ground-based and satellite measurements. Notably, they found enhanced Q2DW activity during summertime between 75–95 km altitude for 60∘ N. This enhancement fades towards the zonal wind reversal (DOY 260), which is also coincident with the decrease in the semi-diurnal tides. Another interesting result also noted in our electron density profiles is that, at the beginning of October, a rather sharp and sudden decrease in electron densities is visible, which can be related to the so-called October effect (Pancheva and Mukhtarov, 1996). A challenging aspect of the present result is what could be the source of these electron density enhancements (reduction) during the fall (October) conditions. One of our current understandings and hypotheses is that, during the late summer and fall period, downwelling occurs at mesospheric altitudes as part of mean meridional circulations. Such downwelling will transport more NO from the lower thermosphere to the observed altitudes, and planetary wave circulations transport NO-rich air equatorward to mid-latitudes, where it is ionized to produce high electron densities through ionization (Garcia et al., 1987). The meridional wind climatology of the radar's position for the same years is shown in Fig. 8, including a 16 d smoothing window and rejecting sparse data. For the period of observed electron density enhancements (April to September), the meridional wind magnitude is continuously very small. However, from October to April, intensified northward winds dominate below 75 km altitude. If the meridional circulation associated with downwelling is the cause of the enhanced electron densities, then one should observe the high electron densities in October as well. Thus, it gives an indication that there could be some other process also involved in the noted changes in the electron densities during the fall conditions. Coincidentally, Conte et al. (2018) reported a decrease in the S2 amplitude during October for middle and high latitudes. During this period, a very pronounced and consistent feature occurs in the mesosphere, namely the zonal wind reversal (see, e.g., Keuer et al., 2007; Hoffmann et al., 2010; Jaen et al., 2022). This raises the questions of whether the changes in the S2 amplitude and zonal wind reversal have any impact on the D-region electron density and, if so, how?
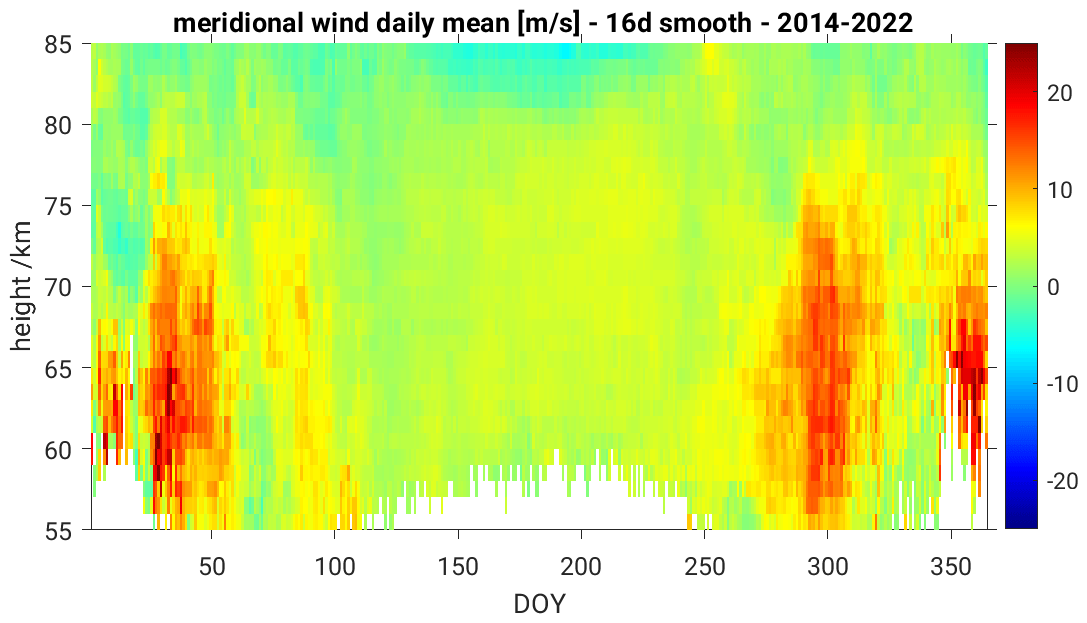
Figure 8Climatology of Saura meridional winds (2014–2022) showing low magnitudes below 80 km during summer months.
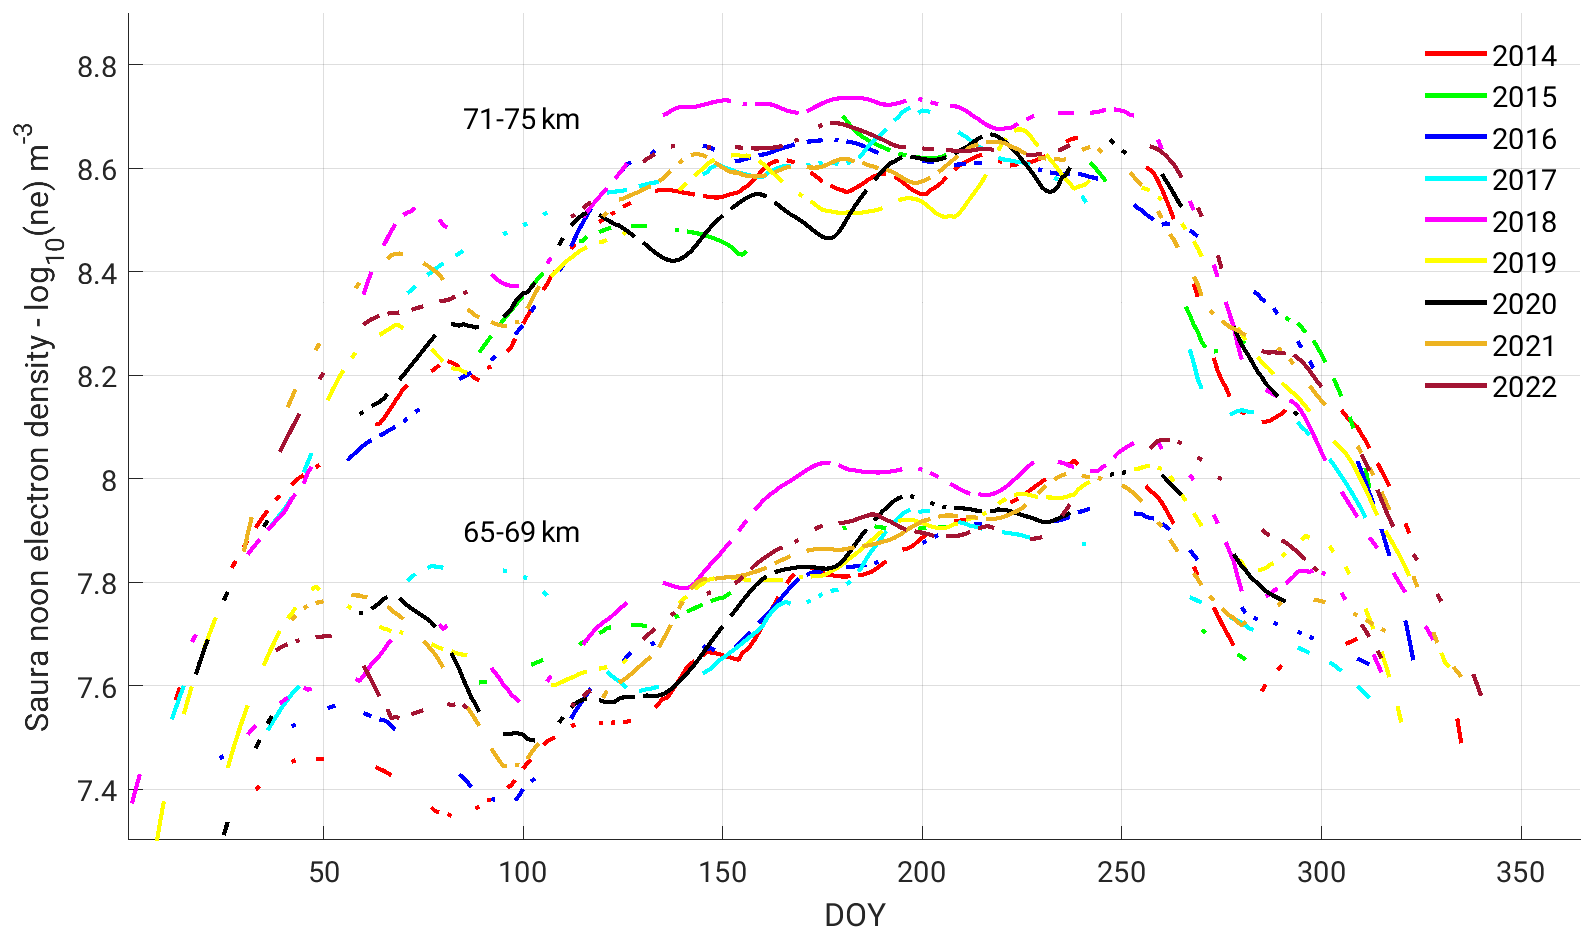
Figure 9Averaged electron densities for the altitude bins 65–69 km and 71–75 km including a 30 d smoothing. The gaps each year correspond to periods of enhanced geomagnetic activity which are excluded, equivalent to Fig. 5.
For a better interannual analysis, the median electron densities for 65–69 km and 71–75 km over DOY are shown separately for each year in Fig. 9 after smoothing with a 30 d window. The annual asymmetry is seen for both altitude bins but is very pronounced for the lower altitudes, where an increase by a factor of at least 3 is seen from day 100 to 250. The sudden decrease in electron density occurs around day 265 but differs by about 10 d between the higher- and lower-altitude bins. The exact timing of both the increase around day 110 and the decrease around day 250 shows comparably little variability throughout the years for the higher-altitude window, whereas it seems less stable for the lower altitudes, with spreads of 20 d, giving rise to potentially larger sensitivity to other phenomena like dynamics. An important point here is that the fall effect is present in all the years with minor year-to-year variations in the onset time, irrespective of solar activity.
Despite the general increase for the lower altitudes from DOY 100 to 250 for most of the years, especially for 2018, an early rampant behavior until DOY 170 and a rather continuous noon electron density level until DOY 270 are seen. A similar peculiarity is prominent for the upper-altitude bin. Given 2018 was a year with extremely low solar activity, the annual development of electron densities found seems rather surprising. Basically, the opposite is seen for 2014, near the solar maximum of cycle 24, where low electron densities in spring and a steady increase until DOY 250 are observed. The tendency for somewhat larger electron densities below 70 km altitude during low solar flux, 70 sfu for the solar minimum and 150 sfu for the 2014 solar maximum, is also visible in FIRI, while the contrary is found for the altitudes above. In the previous study of Macotela et al. (2021), the majority of the year 2018 did not show any significant deviation from other years. However, slightly enhanced VLF amplitudes were seen for the second week of October. Noteworthily, these detected amplitudes are derived for the propagation path between the most northeastern part of the USA (Cutler, ME) and northern Finland (Sodankylä). Thus, the electron density profiles of the entire path need to be taken into consideration, and the local Saura profile might have only little influence. Thus, more local phenomena could have caused the observed higher electron densities in 2018. However, these need further investigation to explore the exact reason.
In this study, we present local noontime climatologies of electron density in the middle atmosphere at high latitudes not only for solar and geomagnetically quiet periods but also including disturbed periods. The data were derived by active high-frequency radar experiments exploiting the phase information of radar echoes that correspond to Faraday rotation caused by electron density in the Earth's magnetic field. To improve the long-established methods, we applied further signal processing as well as interferometry techniques. The latter is used to reject radar echoes from far off the beam-pointing direction. We furthermore involved the FIRI model output to exclude obvious outliers from further processing, which proved to be very useful for SZA below 90∘. Geomagnetically active periods including EPP events as well as SPEs were detected with the radar, and these periods were treated separately from the quiet times. Finally, local noontime electron density profiles were derived for both situations.
We found a clear asymmetry between spring and fall, which is not explainable by the SZA, nor is it visible in the ionospheric models. However, recent VLF experiments have shown a comparable asymmetry in detected VLF amplitudes. Furthermore, we found a consistent and steep decrease in electron densities around DOY 265.
Our current understanding is that downwelling is associated with the meridional circulation during the fall and winter seasons and could be responsible for the enhanced electron density through the transport of NO from the lower thermosphere, while the enhanced meridional winds and tidal activity at the lower altitudes might explain the sudden reduction in the electron density during the first week of October. During the late summer and fall periods, a temperature reduction and an increase in semi-diurnal tide could also play a significant role in the observed electron density changes.
The pattern of asymmetric spring–fall and a steep decrease in October was found for all 9 years of data analyzed in this study, while the interannual variability is restricted to a few days, which might be surveyed in more detail at a later point.
We plan to investigate the peculiarities found, like the enhanced densities of 2018, in more depth in a successive study, where we aim to incorporate both methods, absorption and phase rotation measurements, and incorporate additional modeling efforts. Furthermore, we plan to extend the measurements to the technologically rather similar, but smaller, radar system in Juliusruh at middle latitudes, which in the past has mostly been used for the study of dynamics (see, e.g., Hoffmann et al., 2010; Jaen et al., 2022).
The data needed to reproduce the electron density figures including the observations are shared through https://doi.org/10.22000/993 (Renkwitz, 2023).
TR had the main responsibility of the radar experiment, its data analysis, and the writing of the article. SM and JJ helped to develop the concept, interpret data, and discuss results. WS contributed to the fundamental electron density analysis and discussions of results. All authors read, corrected, and agreed to the submitted version of the manuscript.
The contact author has declared that none of the authors has any competing interests.
Publisher’s note: Copernicus Publications remains neutral with regard to jurisdictional claims in published maps and institutional affiliations.
We appreciate suggestions by Jorge L. Chau and the support of the Andøya Space Center for Saura radar operations.
This research has been supported by the Deutsches Zentrum für Luft- und Raumfahrt (AMELIE project (grant no. D/921/67286532)), the Deutsche Forschungsgemeinschaft (VACILT project (grant no. PO 2341/2-1)), and the Bundesministerium für Bildung und Forschung (TIMA-2 project in the frame of ROMIC-II (grant no. 01 LG 1902A)).
The publication of this article was funded by the Open Access Fund of the Leibniz Association.
This paper was edited by John Plane and reviewed by Martin Friedrich and one anonymous referee.
Alken, P., Thébault, E., Beggan, C. D., Amit, H., ubert, J., Baerenzung, J., Bondar, T. N., Brown, W. J., aliff, S., Chambodut, A., Chulliat, A., Cox, G. A., Finlay, C. C., Fournier, A., Gillet, N., Grayver, A., Hammer, M. D., Holschneider, M., Huder, L., Hulot, G., Jager, T., Kloss, C., Korte, M., Kuang, W., Kuvshinov, A., Langlais, B., Léger, J.-M., Lesur, V., Livermore, P. W., Lowes, F. J., Macmillan, S., Magnes, W., Mandea, M., Marsal, S., Matzka, J., Metman, M. C., Minami, T., Morschhauser, A., Mound, J. E., Nair, M., Nakano, S., Olsen, N., Pavón-Carrasco, F. J., Petrov, V. G., Ropp, G., Rother, M., Sabaka, T. J., Sanchez, S., Saturnino, D., Schnepf, N. R., Shen, X., Stolle, C., Tangborn, A., Tøffner-Clausen, L., Toh, H., Torta, J. M., Varner, J., Vervelidou, F., Vigneron, P., Wardinski, I., Wicht, J., Woods, A., Yang, Y., Zeren, Z., and Zhou, B.: International Geomagnetic Reference Field: the thirteenth generation, Earth Planet. Space, 73, 49, https://doi.org/10.1186/s40623-020-01288-x, 2021. a
Baumann, C., Kero, A., Raizada, S., Rapp, M., Sulzer, M. P., Verronen, P. T., and Vierinen, J.: Arecibo measurements of D-region electron densities during sunset and sunrise: implications for atmospheric composition, Ann. Geophys., 40, 519–530, https://doi.org/10.5194/angeo-40-519-2022, 2022. a, b
Belrose, J. S.: Radio wave probing of the ionosphere by the partial reflection of radio waves (from heights below 100 km), J. Atmos. Terrest. Phys., 32, 567–596, https://doi.org/10.1016/0021-9169(70)90209-6, 1970. a, b
Briggs, B. H.: The analysis of spaced sensor records by correlation techniques, MAP Handbook, 13, 166–186, 1984. a
Budden, K.: Approximations in magnetoionic theory, J. Atmos. Terrest. Phys., 45, 213–218, https://doi.org/10.1016/S0021-9169(83)80043-9, 1983. a
Burns, C., Turunen, E., Matveinen, H., Ranta, H., and Hargreaves, J.: Chemical modelling of the quiet summer D- andE-regions using EISCAT electron density profiles, J. Atmosp. Terrest. Phys., 53, 115–134, https://doi.org/10.1016/0021-9169(91)90026-4, 1991. a, b
Chau, J. L. and Woodman, R. F.: D and E region incoherent scatter radar density measurements over Jicamarca, J. Geophys. Res.-Space Phys., 110, A12314, https://doi.org/10.1029/2005JA011438, 2005. a
Clilverd, M. A., Duthie, R., Rodger, C. J., Hardman, R. L., and Yearby, K. H.: Long-term climate change in the D-region, Sci. Rep., 7, 16683, https://doi.org/10.1038/s41598-017-16891-4, 2017. a
Conte, J. F., Chau, J. L., Laskar, F. I., Stober, G., Schmidt, H., and Brown, P.: Semidiurnal solar tide differences between fall and spring transition times in the Northern Hemisphere, Ann. Geophys., 36, 999–1008, https://doi.org/10.5194/angeo-36-999-2018, 2018. a, b
del Pozo, C. F., Turunen, E., and Ulich, T.: Negative ions in the auroral mesosphere during a PCA event around sunset, Ann. Geophys., 17, 782–793, https://doi.org/10.1007/s00585-999-0782-1, 1999. a
Flood, W. A.: A D region mid- and high-latitude approximation to the Sen-Wyller refractive index equations, Radio Sci., 15, 797–799, https://doi.org/10.1029/RS015i004p00797, 1980. a
Friedrich, M. and Rapp, M.: News from the Lower Ionosphere: A Review of Recent Developments, Surv. Geophys., 30, 525–559, https://doi.org/10.1007/s10712-009-9074-2, 2009. a
Friedrich, M. and Torkar, K. M.: An empirical model of the nonauroral D Region, Radio Sci., 27, 945–953, https://doi.org/10.1029/92RS01929, 1992. a
Friedrich, M. and Torkar, K. M.: FIRI: A semiempirical model of the lower ionosphere, J. Geophys. Res-.Space Phys., 106, 21409–21418, https://doi.org/10.1029/2001JA900070, 2001. a, b
Friedrich, M., Harrich, M., Torkar, K., and Stauning, P.: Quantitative measurements with wide-beam riometers, J. Atmos. Solar-Terrest. Phys., 64, 359–365, 2002. a
Friedrich, M., Harrich, M., Steiner, R., Torkar, K., and Lübken, F.-J.: The quiet auroral ionosphere and its neutral background, Adv. Space Res., 33, 943–948, https://doi.org/10.1016/j.asr.2003.08.006, 2004. a
Friedrich, M., Rapp, M., Plane, J. M., and Torkar, K. M.: Bite-outs and other depletions of mesospheric electrons, J. Atmos. Solar-Terrest. Phys., 73, 2201–2211, https://doi.org/10.1016/j.jastp.2010.10.018, 2011. a
Friedrich, M., Pock, C., and Torkar, K.: FIRI-2018, an Updated Empirical Model of the Lower Ionosphere, J. Geophys. Res.-Space Phys., 123, 6737–6751, https://doi.org/10.1029/2018JA025437, 2018a. a, b
Friedrich, M., Pock, C., and Torkar, K.: FIRI-2018, an Updated Empirical Model of the Lower Ionosphere, J. Geophys. Res.-Space Phys., 123, 6737–6751, https://doi.org/10.1029/2018JA025437, 2018b. a
Garcia, R. R., Solomon, S., Avery, S. K., and Reid, G. C.: Transport of nitric oxide and the D region winter anomaly, J. Geophys. Res.-Atmos., 92, 977–994, https://doi.org/10.1029/JD092iD01p00977, 1987. a
Grant, J., Grainger, R., Lawrence, B., Fraser, G., von Biel, H., Heuff, D., and Plank, G.: Retrieval of mesospheric electron densities using an optimal estimation inverse method, J. Atmos. Solar-Terrest. Phys., 66, 381–392, https://doi.org/10.1016/j.jastp.2003.12.006, 2004. a
Hall, C. M., Manson, A. H., Meek, C. E., and Nozawa, S.: Isolated lower mesospheric echoes seen by medium frequency radar at 70∘ N, 19∘ E, Atmos. Chem. Phys., 6, 5307–5314, https://doi.org/10.5194/acp-6-5307-2006, 2006. a
Hoffmann, P., Becker, E., Singer, W., and Placke, M.: Seasonal variation of mesospheric waves at northern middle and high latitudes, J. Atmos. Solar-Terrest. Phys., 72, 1068–1079, https://doi.org/10.1016/j.jastp.2010.07.002, 2010. a, b
Holdsworth, D., Vuthaluru, R., Reid, I. M., and Vincent, R. A.: Differential absorption measurements of mesospheric and lower thermospheric electron densities using the Buckland Park MF radar, J. Atmos. Solar-Terrest. Phys., 64, 2029–2042, https://doi.org/10.1016/S1364-6826(02)00232-8, 2002. a
Igarashi, K., Murayama, Y., Nagayama, M., and Kawana, S.: D-region electron density measurements by MF radar in the middle and high latitudes, Adv. Space Res., 25, 25–32, https://doi.org/10.1016/S0273-1177(99)00893-5, 2000. a
Iimura, H., Fritts, D. C., Lieberman, R. S., Janches, D., Mitchell, N. J., Franke, S. J., Singer, W., Hocking, W. K., Taylor, M. J., and Moffat-Griffin, T.: Climatology of quasi-2-day wave structure and variability at middle latitudes in the northern and southern hemispheres, J. Atmos. Solar-Terrest. Phys., 221, 105690, https://doi.org/10.1016/j.jastp.2021.105690, 2021. a
Jaen, J., Renkwitz, T., Chau, J. L., He, M., Hoffmann, P., Yamazaki, Y., Jacobi, C., Tsutsumi, M., Matthias, V., and Hall, C.: Long-term studies of mesosphere and lower-thermosphere summer length definitions based on mean zonal wind features observed for more than one solar cycle at middle and high latitudes in the Northern Hemisphere, Ann. Geophys., 40, 23–35, https://doi.org/10.5194/angeo-40-23-2022, 2022. a, b
Kawahira, K.: The D region winter anomaly at high and middle latitudes induced by planetary waves, Radio Sci., 20, 795–802, https://doi.org/10.1029/RS020i004p00795, 1985. a
Keuer, D., Hoffmann, P., Singer, W., and Bremer, J.: Long-term variations of the mesospheric wind field at mid-latitudes, Ann. Geophys., 25, 1779–1790, https://doi.org/10.5194/angeo-25-1779-2007, 2007. a
Liu, T., Yang, G., Zhao, Z., Liu, Y., Zhou, C., Jiang, C., Ni, B., Hu, Y., and Zhu, P.: Design of Multifunctional Mesosphere-Ionosphere Sounding System and Preliminary Results, Sensors, 20, 2664, https://doi.org/10.3390/s20092664, 2020. a
Lübken, F.-J.: Thermal structure of the Arctic summer mesosphere, J. Geophys. Res.-Atmos., 104, 9135–9149, https://doi.org/10.1029/1999JD900076, 1999. a
Macotela, E. L., Clilverd, M., Renkwitz, T., Chau, J., Manninen, J., and Banys, D.: Spring-Fall Asymmetry in VLF Amplitudes Recorded in the North Atlantic Region: The Fall-Effect, Geophys. Res. Lett., 48, e2021GL094581, https://doi.org/10.1029/2021GL094581, 2021. a, b, c, d, e, f
McKinnell, L.-A. and Friedrich, M.: A neural network-based ionospheric model for the auroral zone, J. Atmos. Solar-Terrest. Phys., 69, 1459–1470, https://doi.org/10.1016/j.jastp.2007.05.003, 2007. a, b
McNamara, L. F.: Statistical model of the D region, Radio Sci., 14, 1165–1173, https://doi.org/10.1029/RS014i006p01165, 1979. a
Mechtly, E. A.: Accuracy of rocket measurements of lower ionosphere electron concentrations, Radio Sci., 9, 373–378, https://doi.org/10.1029/RS009i003p00373, 1974. a
Mitra, A.: A review of D-region processes in non-polar latitudes, J. Atmos. Terrest. Phys., 30, 1065–1114, https://doi.org/10.1016/S0021-9169(68)80001-7, 1968. a
Moro, J., Denardini, C. M., Correia, E., Abdu, M. A., Schuch, N. J., and Makita, K.: A comparison of two different techniques for deriving the quiet day curve from SARINET riometer data, Ann. Geophys., 30, 1159–1168, https://doi.org/10.5194/angeo-30-1159-2012, 2012. a
NOAA: Space weather conditions – solar cycle progression, https://www.swpc.noaa.gov/products/solar-cycle-progression (last access: 15 August 2023), 2023. a
Offermann, D.: An integrated GBR campaign for the study of the D-region winter anomaly in western Europe 1975/76, J. Atmos. Terrest. Phys., 41, 1047–1050, https://doi.org/10.1016/0021-9169(79)90080-1, 1979a. a
Offermann, D.: Recent advances in the study of the D-region winter anomaly, J. Atmos. Terrest. Phys., 41, 735–752, https://doi.org/10.1016/0021-9169(79)90121-1, 1979b. a
Offermann, D.: A Winter Anomaly Campaign in Western Europe, Philos. T. R. Soc. A, 296, 261–268, 1980. a
Osepian, A., Tereschenko, V., Dalin, P., and Kirkwood, S.: The role of atomic oxygen concentration in the ionization balance of the lower ionosphere during solar proton events, Ann. Geophys., 26, 131–143, https://doi.org/10.5194/angeo-26-131-2008, 2008. a
Palmer, R. D., Huang, X., Fukao, S., Yamamoto, M., and Nakamura, T.: High-resolution wind profiling using combined spatial and frequency domain interferometry, Radio Sci., 30, 1665–1679, https://doi.org/10.1029/95RS02594, 1995. a
Pancheva, D. V. and Mukhtarov, P. Y.: Modelling of the electron density height profiles in the mid-latitude ionospheric D-region, Annals of Geophysics, http://hdl.handle.net/2122/1713 (last access: 10 July 2023), 1996. a
Rapp, M. and Lübken, F.-J.: Polar mesosphere summer echoes (PMSE): Review of observations and current understanding, Atmos. Chem. Phys., 4, 2601–2633, https://doi.org/10.5194/acp-4-2601-2004, 2004. a
Rapp, M., Lübken, F.-J., and Blix, T.: The role of charged ice particles for the creation of PMSE: A review of recent developments, Adv. Space Res., 31, 2033–2043, https://doi.org/10.1016/S0273-1177(03)00226-6, 2003. a
Renkwitz, T.: RenkwitzACP2023. Leibniz Institute of Atmospheric Physics at the University of Rostock, RADAR [data set], https://doi.org/10.22000/993, 2023. a
Renkwitz, T. and Latteck, R.: Variability of virtual layered phenomena in the mesosphere observed with medium frequency radars at 69∘ N, J. Atmos. Solar-Terrest. Phys., 163, 38–45, https://doi.org/10.1016/j.jastp.2017.05.009, 2017. a, b
Renkwitz, T. and Latteck, R.: Angle of Arrival study of atmospheric high frequency radar echoes, in: 2019 6th International Conference on Space Science and Communication (IconSpace), 230–234, https://doi.org/10.1109/IconSpace.2019.8905934, 2019. a
Renkwitz, T., Singer, W., Latteck, R., and Rapp, M.: Multi beam observations of cosmic radio noise using a VHF radar with beam forming by a Butler matrix, Adv. Radio Sci., 9, 1–9, https://doi.org/10.5194/ars-9-349-2011, 2011. a
Renkwitz, T., Tsutsumi, M., Laskar, F. I., Chau, J. L., and Latteck, R.: On the role of anisotropic MF/HF scattering in mesospheric wind estimation, Earth, Planet. Space, 70, 158, https://doi.org/10.1186/s40623-018-0927-0, 2018. a, b, c
Renkwitz, T., Latteck, R., Strelnikova, I., Johnsen, M. G., and Chau, J. L.: Characterization of polar mesospheric VHF radar echoes during solar minimum winter 2019/2020. Part I: Ionisation, J. Atmos. Solar-Terrest. Phys., 221, 105684, https://doi.org/10.1016/j.jastp.2021.105684, 2021. a, b
Roper, R. G. and Brosnahan, J. W.: Imaging Doppler interferometry and the measurement of atmospheric turbulence, Radio Sci., 32, 1137–1148, https://doi.org/10.1029/97RS00089, 1997. a
Russell, C. T. and McPherron, R. L.: Semiannual variation of geomagnetic activity, J. Geophys. Res., 78, 92, https://doi.org/10.1029/JA078i001p00092, 1973. a
Sen, H. K. and Wyller, A. A.: On the generalization of the Appleton-Hartree magnetoionic formulas, J. Geophys. Res. (1896–1977), 65, 3931–3950, https://doi.org/10.1029/JZ065i012p03931, 1960. a
Silber, I. and Price, C.: On the Use of VLF Narrowband Measurements to Study the Lower Ionosphere and the Mesosphere–Lower Thermosphere, Surv. Geophys., 38, 407–441, https://doi.org/10.1007/s10712-016-9396-9, 2017. a
Singer, W., Latteck, R., and Holdsworth, D. A.: A new narrow beam Doppler radar at 3 MHz for studies of the high-latitude middle atmosphere, Adv. Space Res., 41, 1488–1494, https://doi.org/10.1016/j.asr.2007.10.006, 2008. a, b
Singer, W., Latteck, R., Friedrich, M., Wakabayashi, M., and Rapp, M.: Seasonal and solar activity variability of D-region electron density at 69∘ N, J. Atmos. Solar-Terrest. Phys., 73, 925–935, https://doi.org/10.1016/j.jastp.2010.09.012, 2011. a, b
Siskind, D. E., Zawdie, K. A., Sassi, F., Drob, D. P., and Friedrich, M.: An Intercomparison of VLF and Sounding Rocket Techniques for Measuring the Daytime D Region Ionosphere: Theoretical Implications, J. Geophys. Res.-Space Phys., 123, 8688–8697, https://doi.org/10.1029/2018JA025807, 2018. a
Staszak, T., Strelnikov, B., Latteck, R., Renkwitz, T., Friedrich, M., Baumgarten, G., and Lübken, F.-J.: Turbulence generated small-scale structures as PMWE formation mechanism: Results from a rocket campaign, J. Atmos. Solar-Terrest. Phys., 217, 105559, https://doi.org/10.1016/j.jastp.2021.105559, 2021. a
Strelnikov, B., Staszak, T., Latteck, R., Renkwitz, T., Strelnikova, I., Lübken, F.-J., Baumgarten, G., Fiedler, J., Chau, J. L., Stude, J., Rapp, M., Friedrich, M., Gumbel, J., Hedin, J., Belova, E., Hörschgen-Eggers, M., Giono, G., Hörner, I., Löhle, S., Eberhart, M., and Fasoulas, S.: Sounding rocket project ”PMWE” for investigation of polar mesosphere winter echoes, J. Atmos. Solar-Terrest. Phys., 218, 105596, https://doi.org/10.1016/j.jastp.2021.105596, 2021. a
Verronen, P. T., Seppälä, A., Clilverd, M. A., Rodger, C. J., Kyrölä, E., Enell, C.-F., Ulich, T., and Turunen, E.: Diurnal variation of ozone depletion during the October-November 2003 solar proton events, J. Geophys. Res.-Space Phys., 110, A09S32, https://doi.org/10.1029/2004JA010932, 2005. a
Verronen, P. T., Andersson, M. E., Marsh, D. R., Kovács, T., and Plane, J. M. C.: WACCM-D—Whole Atmosphere Community Climate Model with D-region ion chemistry, J. Adv. Model. Earth Syst., 8, 954–975, https://doi.org/10.1002/2015MS000592, 2016. a
Vuthaluru, R.: MF radar observations of D-region electron densities at Adelaide, PhD thesis, University Adelaide, 2003. a
Worthington, E. R. and Cohen, M. B.: The Estimation of D-Region Electron Densities From Trans-Ionospheric Very Low Frequency Signals, J. Geophys. Res.-Space Phys., 126, e2021JA029256, https://doi.org/10.1029/2021JA029256, 2021. a
Zhu, M., Xu, T., Sun, S., Zhou, C., Hu, Y., Ge, S., Li, N., Deng, Z., Zhang, Y., and Liu, X.: Physical Model of D-Region Ionosphere and Preliminary Comparison with IRI and Data of MF Radar at Kunming, Atmosphere, 14, 235, https://doi.org/10.3390/atmos14020235, 2023. a, b