the Creative Commons Attribution 4.0 License.
the Creative Commons Attribution 4.0 License.
 | 21 Sep 2023
Air pollution reductions caused by the COVID-19 lockdown open up a way to preserve the Himalayan glaciers
Bernd Heinold
T. P. Sabin
Anne Kubin
Katty Huang
Alexandru Rap
Rolf Müller
The rapid melting of glaciers in the Hindu Kush Himalayas (HKH) during recent decades poses an alarming threat to water security for larger parts of Asia. If this melting persists, the entirety of the Himalayan glaciers are estimated to disappear by end of the 21st century. Here, we assess the influence of the spring 2020 COVID-19 lockdown on the HKH, demonstrating the potential benefits of a strict emission reduction roadmap. Chemistry–climate model simulations, supported by satellite and ground measurements, show that lower levels of gas and aerosol pollution during lockdown led to changes in meteorology and to a reduction in black carbon in snow (2 %–14 %) and thus a reduction in snowmelt (10 %–40 %). This caused increases in snow cover (6 %–12 %) and mass (2 %–20 %) and a decrease in runoff (5 %–55 %) over the HKH and Tibetan Plateau, ultimately leading to an enhanced snow-equivalent water (2 %–55 %). We emphasize the necessity for immediate anthropogenic pollution reductions to address the hydro-climatic threat to billions of people in southern Asia.
- Article
(9601 KB) - Full-text XML
-
Supplement
(1159 KB) - BibTeX
- EndNote


The Hindu Kush Himalayan (HKH) mountains and the Tibetan Plateau constitute the largest snow-clad region outside the poles (Fig. 1). This region is also referred to as High Mountain Asia, although that includes the Tien Shan and some other northern ranges. The HKH meltwater feeds rivers in India and China that drive the agriculture, hydropower generation, and economy of these countries (Hussain et al., 2019; Sabin et al., 2020; S. S. Lee et al., 2021). The Himalayan snowmelt in spring provides ∼50 % of the annual freshwater to ∼4 billion people in southern Asia and eastern Asia (Sarangi et al., 2019; Sabin et al., 2020). Rapid Himalayan snowmelt has caused a loss of ∼40 % of the Himalayan glacier area compared to the Little Ice Age, 400 to 700 years ago, i.e. ∼0.92 to 1.38 mm sea-level equivalent (E. Lee et al., 2021). The snow mass over the Himalayas has generally decreased over the last 30 years (except for a few Karakoram glaciers that show an increasing trend in snow mass) (Hussain et al., 2019). The alarming rate of snowmelt at 0.02 to 0.6 cm ∘C−1 d−1 raised concerns about the sustainability of water supply (Tiwari et al., 2015) and the loss of glaciers in the region (Hussain et al., 2019; E. Lee et al., 2021). Model simulations for extreme scenarios show that Himalayan snowmelt could cause the glaciers to disappear by the end of the 21st century (Cruz et al., 2007; Hock et al., 2019).
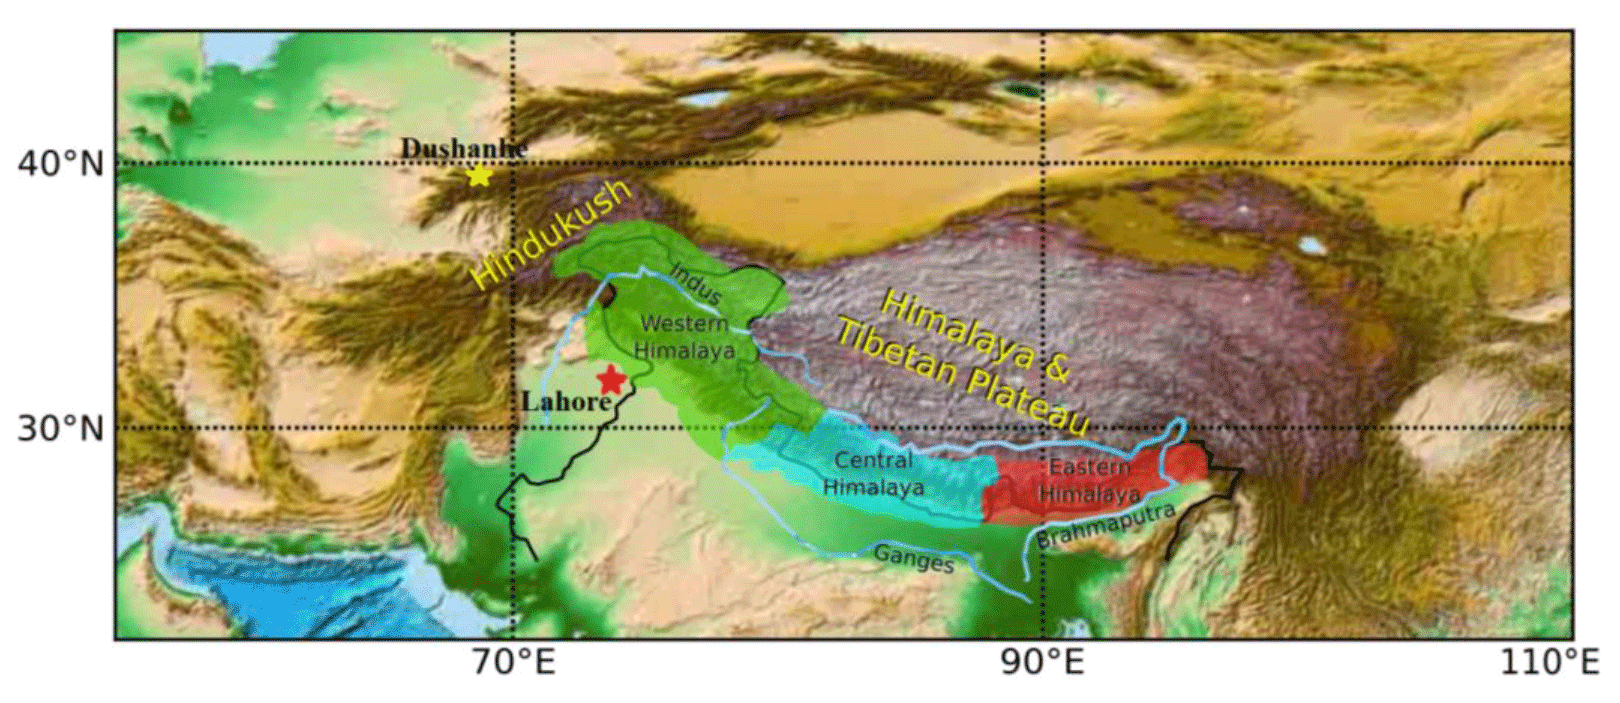
Figure 1Map of the Hindu Kush Himalayas region with the western (30–35∘ N, 70–80∘ E), central (28–30∘ N, 80–87∘ E), and eastern Himalayas (26–30∘ N, 88–95∘ E). A yellow star and a red star indicate the locations of the AERONET sun photometer stations of Dushanbe (38.553∘ N, 68.858∘ E) and Lahore ( 31.480∘ N, 74.264∘ E), respectively.
The accelerated thinning of Himalayan glaciers is attributed to climate change causing shifts in air temperature and precipitation, as well as in the atmospheric distribution and deposition of light-absorbing particles, i.e. dust and black carbon (BC) (IPCC Climate Change, 2013; Krishnan et al., 2019). Among the aforementioned factors, snow darkening due to the deposition of absorbing aerosols is an integral component of Himalayan snowmelt and runoff (Lau et al., 2010). The snow-melting efficacy of BC is higher than that of greenhouse gases (Qian et al., 2011; Nair et al., 2013; Ma et al., 2019; Sarangi et al., 2019). The increasing energy demand of the densely populated southern Asian region has increased the emission of greenhouse gases and BC aerosol in the last few decades (Fadnavis et al., 2017; Krishnan et al., 2020), leading to enhanced darkening and snow melting (Usha et al., 2021).
The economic slowdown caused by the COVID-19 pandemic measures led to a drastic reduction in public and freight transportation, industrial emissions, and energy use (Fadnavis et al., 2021a). This resulted in a substantial decline in the emissions of several atmospheric pollutants, including greenhouse gases and black carbon aerosol (Forster et al., 2020; Kanniah et al., 2020; Le Quéré et al., 2020), and potentially reduced deposition of dark aerosols on snow and ice (Bair et al., 2021). Remote sensing approaches show cleaner snow, with ∼30 % less light-absorbing impurities in snow during the lockdown period over Asia between March and May 2020 (Bair et al., 2021). This led to decreased snowmelt by 25–70 mm in 2020 compared to the last 20-year mean for March–May over the western Himalayas due to decreased radiative forcing induced by BC and dust deposition on snow and ice surfaces and related changes in snow absorption and surface albedo (Bair et al., 2021). Bair et al. (2021) also found that 6.6 km−3 of meltwater stayed in the Indus Basin. Gauge and reservoir data for this part of the world, however, are not freely available. The impacts of reduced levels of air pollution on changes in the snow mass, surface water runoff, and water reservoir over the HKH are not reported hitherto. Here, we provide a detailed analysis of the impact of reduced pollution over the HKH and Tibetan plateau region during the COVID-19 lockdown period between March and May 2020. We used global simulations with the chemistry–climate model ECHAM6-HAMMOZ (Schultz et al., 2018; Tegen et al., 2019), updated with an improved BC-in-snow parametrization (Huang, 2018), in order to contrast the 2020 COVID-19 (COVID) with the typical, unchanged (control, CTL) air pollution conditions. The COVID simulations are performed using a COVID-19 emission inventory where emissions are reduced based on Google and Apple mobility data (Forster et al., 2020; details in Sect. 2.2).
2.1 Observational data
We used monthly snow cover fraction from NASA's Moderate Resolution Imaging Spectroradiometer (MODIS) satellite product on a resolution (version 6, level 3; Hall et al., 2006) for the years 2000–2020 (https://nsidc.org/data/MOD10CM/versions/6, last access: 1 April 2022). For aerosol information we used monthly mean satellite aerosol optical depth (AOD) at resolution from the MODIS Terra level-3 dark-target and deep-blue retrievals at 550 nm wavelength for 2001–2020 (https://giovanni.gsfc.nasa.gov, last access: 1 March 2022). Uncertainties in MODIS AOD data over snow are documented by Huang et al. (2020). We also used ground-based sun photometer observations of AOD from the Aerosol Robotic Network (AERONET) (Martonchik et al., 2004) at the stations Dushanbe ( 38.553∘ N, 68.858∘ E) and Lahore ( 31.480∘ N, 74.264∘ E), situated in HKH region, for the periods of 2010–2020 and 2006-2020, respectively (https://aeronet.gsfc.nasa.gov, last access: 10 April 2022).
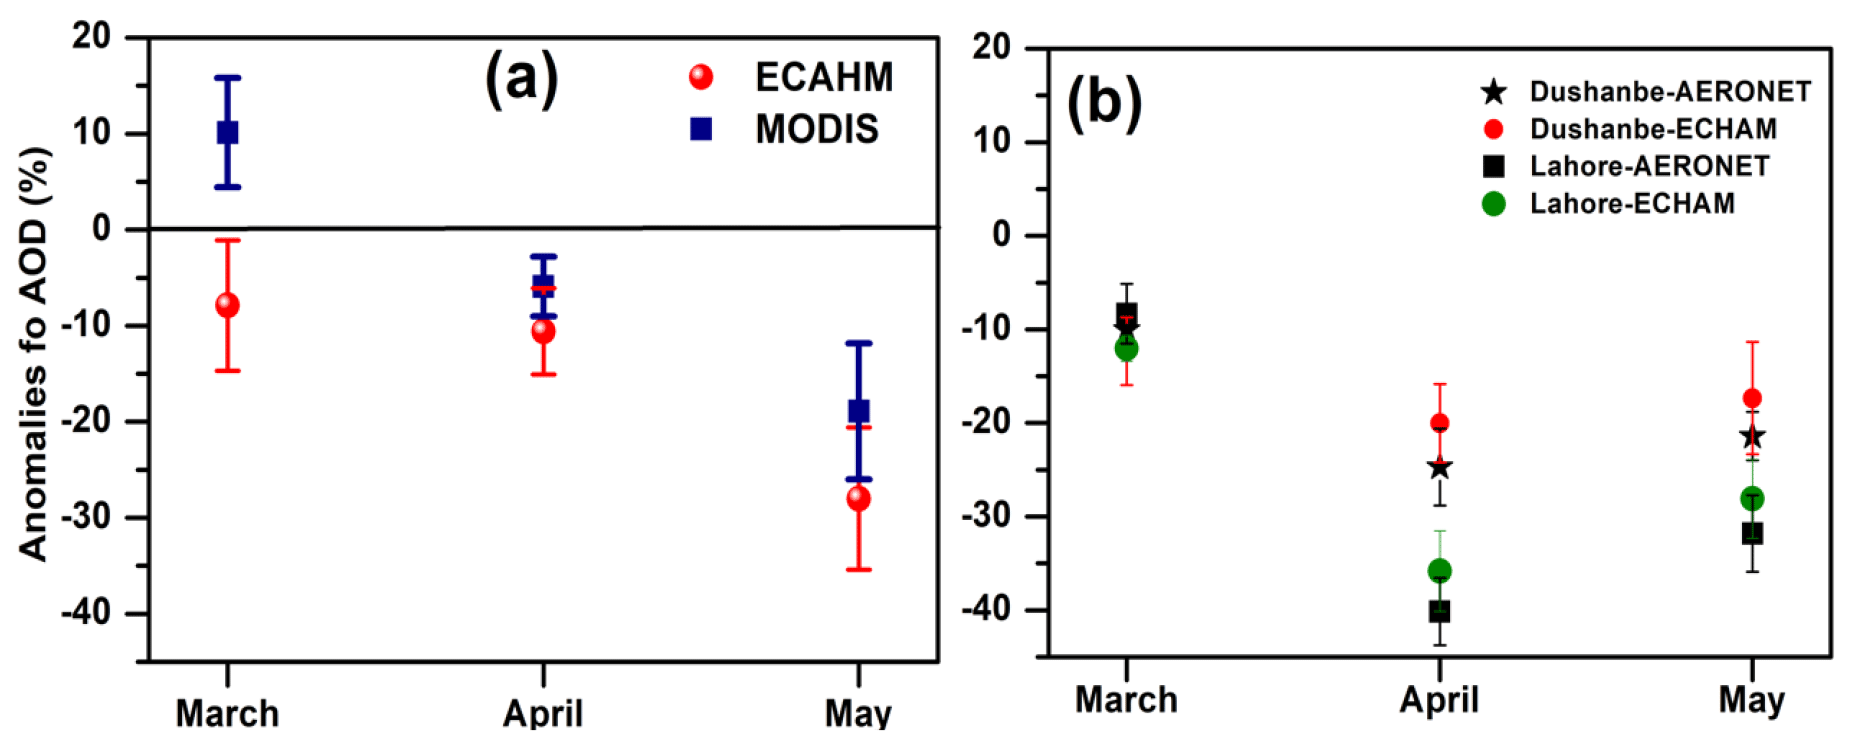
Figure 2(a) Changes in monthly mean AOD (%) during March–May 2020 from MODIS in comparison to mean of 2001–2019 and ECHAM-HAMMOZ (COVID minus CTL) averaged over the Hindu Kush Himalayas (HKH) and Tibetan Plateau region (75∘ N, 95∘ E; 30–35∘ N). (b) Same as (a) but for AOD from AERONET observations and ECHAM-HAMMOZ model results at Dushanbe (38.553∘ N, 68.858∘ E; climatology 2010–2019) and Lahore ( 31.480∘ N, 74.264∘ E; climatology 2006–2019). Vertical bars in (a)–(b) indicate the standard deviation within 10 members of model simulations and within monthly mean anomalies from MODIS for years 2001–2019.
2.2 The ECHAM6-HAMMOZ model description and experimental set-up
We performed 10-member ensemble experiments using the state-of-the-art aerosol–chemistry–climate model ECHAM6-HAMMOZ (version echam6.3-ham2.3-moz1.0; Schultz et al., 2018; Tegen et al., 2019). The model comprises the atmospheric general circulation model ECHAM6 (Stevens et al., 2013), the atmospheric chemistry module MOZ (Schultz et al, 2018), and the Hamburg Aerosol Model (HAM; Stier et al., 2005; Zhang et al., 2012). The HAM component predicts the nucleation, growth, evolution, and sinks of sulfate (SO, black carbon (BC), particulate organic matter (POM), sea salt (SS), and mineral dust (DU) aerosols. Seven log-normal modes describe the size distribution of the aerosol population with a prescribed variance in the aerosol module. The MOZ submodule describes the trace gas chemistry from the troposphere to the lower thermosphere. The chemical mechanism includes the Ox, NOx, HOx, ClOx, and BrOx chemical families, along with CH4 and its degradation products. Several primary non-methane hydrocarbons (NMHCs) and related oxygenated organic compounds are also described. The MOZ module contains 108 species, 71 photolytic processes, 218 gas-phase reactions, and 18 heterogeneous reactions with aerosol (Schultz et al., 2018). Details of emissions (anthropogenic, biomass burning, biogenic, fossil fuel, etc.) and model parametrization and other details are reported in the past studies of Fadnavis et al. (2017, 2019a, b, 2021b). Anthropogenic and biomass burning emissions of sulfate, black carbon (BC), and organic carbon (OC) are based on the AEROCOM-ACCMIP-II emission inventory for the year 2020 (Lamarque et al., 2010; Textor et al., 2006). Additional consideration for the reduction in snow albedo due to BC in snow is implemented but extended for the MOZ module. The model also accounts for changes in snow albedo due to airborne BC deposited in the top layer of snow, while the effect of other in-snow aerosol particles (e.g. dust, OC) is not simulated in the model. Influxes of BC in snow include below-cloud and in-cloud wet scavenging, as well as dry deposition and sedimentation. Snowmelt and glacier runoff remove the in-snow BC at a reduced efficiency, leading to enhanced concentrations, while fresh and pristine snowfall leads to reductions in BC concentration.
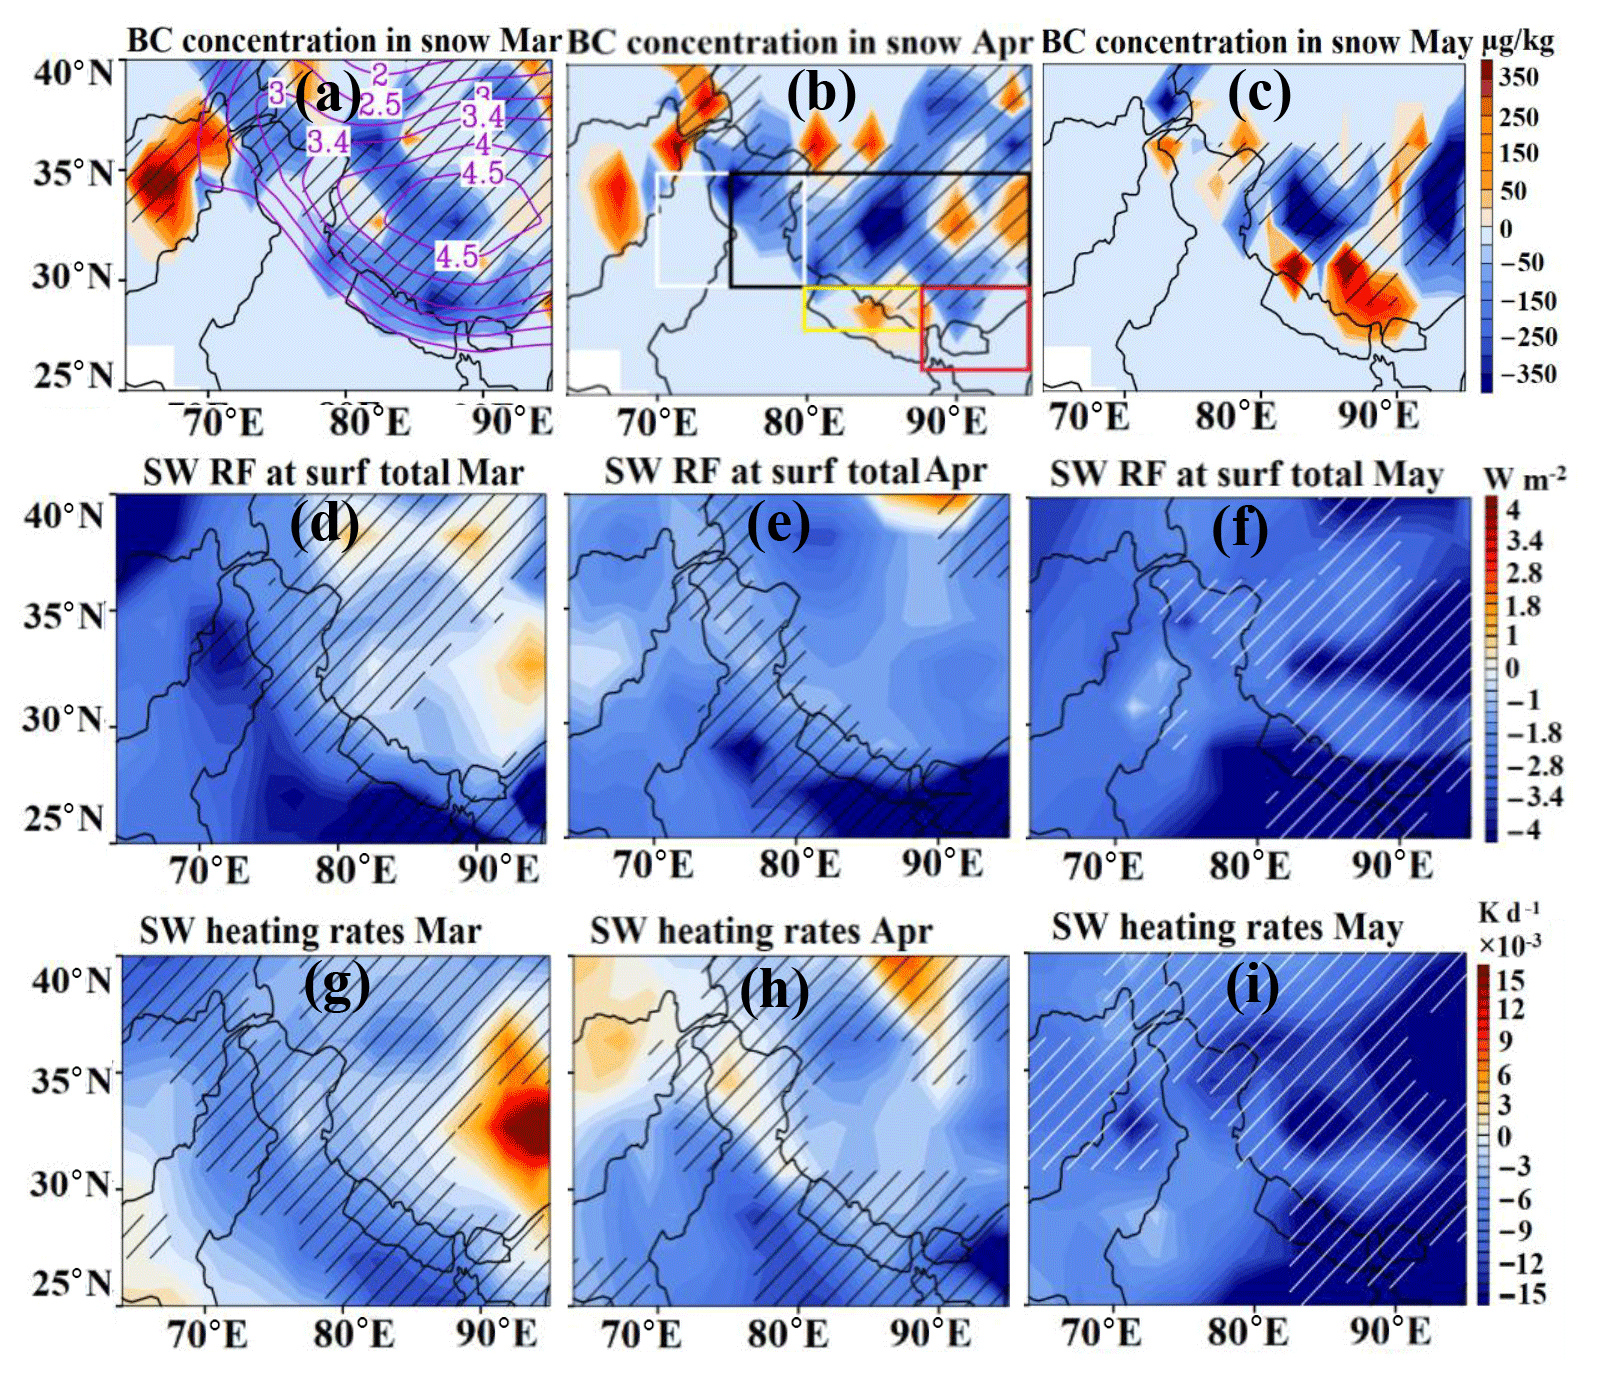
Figure 3Spatial distribution of anomalies (COVID minus CTL) of BC concentration in snow (µg kg−1) for (a) March, (b) April, and (c) May 2020; (d–f) shortwave radiative forcing (W m−2) at the surface; and (e–g) tropospheric heating rates (K d−1) due to changes in BC concentration in snow (COVID minus CTL). Hatched areas indicate the 95 % significance level. Contours in (a) indicate topography in kilometres. Boxes in (b) indicate boundaries of the western Himalayas (WH, white), the central Himalayas (CH, yellow), the eastern Himalayas (EH, red), and the Tibetan Plateau (black).
The model simulations were performed at T63 horizontal resolution () with 47 levels in the vertical from the surface to 0.01 hPa (corresponding to approx. 80 km) and with a time step of 20 min. To understand the effect of the COVID-19 restrictions on snow over the Himalayas and the Tibetan plateau region, we conducted a control (CTL) and a COVID-19 (COVID) simulation. We adopted an ensemble approach (with 10 ensemble members) for the above two experiments. A total of 10 spin-up simulations were performed from 1 to 31 December 2019 to generate stabilized initial fields for the 10 ensemble members. Emissions were the same in each of the 10 members during the spin-up period. Control simulations were extended with the same set-up until 1 June 2020. On the other hand, for the COVID simulations (10 ensemble members each), the anthropogenic emissions of all gases and aerosols were changed from 1 January 2020 according to Google and Apple mobility data, as in Forster et al. (2020). The COVID-19 emissions were prepared by deriving scaling factors between the input4MIPS SSP245 baseline and version 5 of the Forster et al. (2020) 2-year blip scenario separately for each species and each grid point (see Fig. S5a in the Supplement). Subsequently, these scaling factors were applied to the AeroCom-II ACCMIP emissions. This ensures consistency of the drop in emissions independent of the absolute emission values in the AeroCom-II ACCMIP and the input4MIPS SSP245 data sets. The global mean emission changes in carbon monoxide (CO, 2 %–24 %), black carbon (BC, 3 %–23 %), organic carbon (OC, 2 %–17 %), sulfur dioxide (SO2, 3 %–23 %), nitrogen oxides (NOx, 2 %–30 %), methane (CH4, 2 %–5 %), and ammonia (NH3, 0 %–3 %) during the period of January 2020 to 1 July 2020 (COVID–CTL) are in agreement with the previous studies of Forster et al. (2020) and Le Quéré et al. (2020) (Fig. S5b). Our model experiments follow the CovidMIP protocol (Jones et al., 2021). The COVID and CTL simulations ended on 1 June 2020. To investigate the effects of COVID-19 emissions in spring (i.e. since 1 March 2020), we analysed the difference between COVID and CTL simulations for the spring season in 2020. The same dust parametrization was employed in the CTL and COVID simulations.
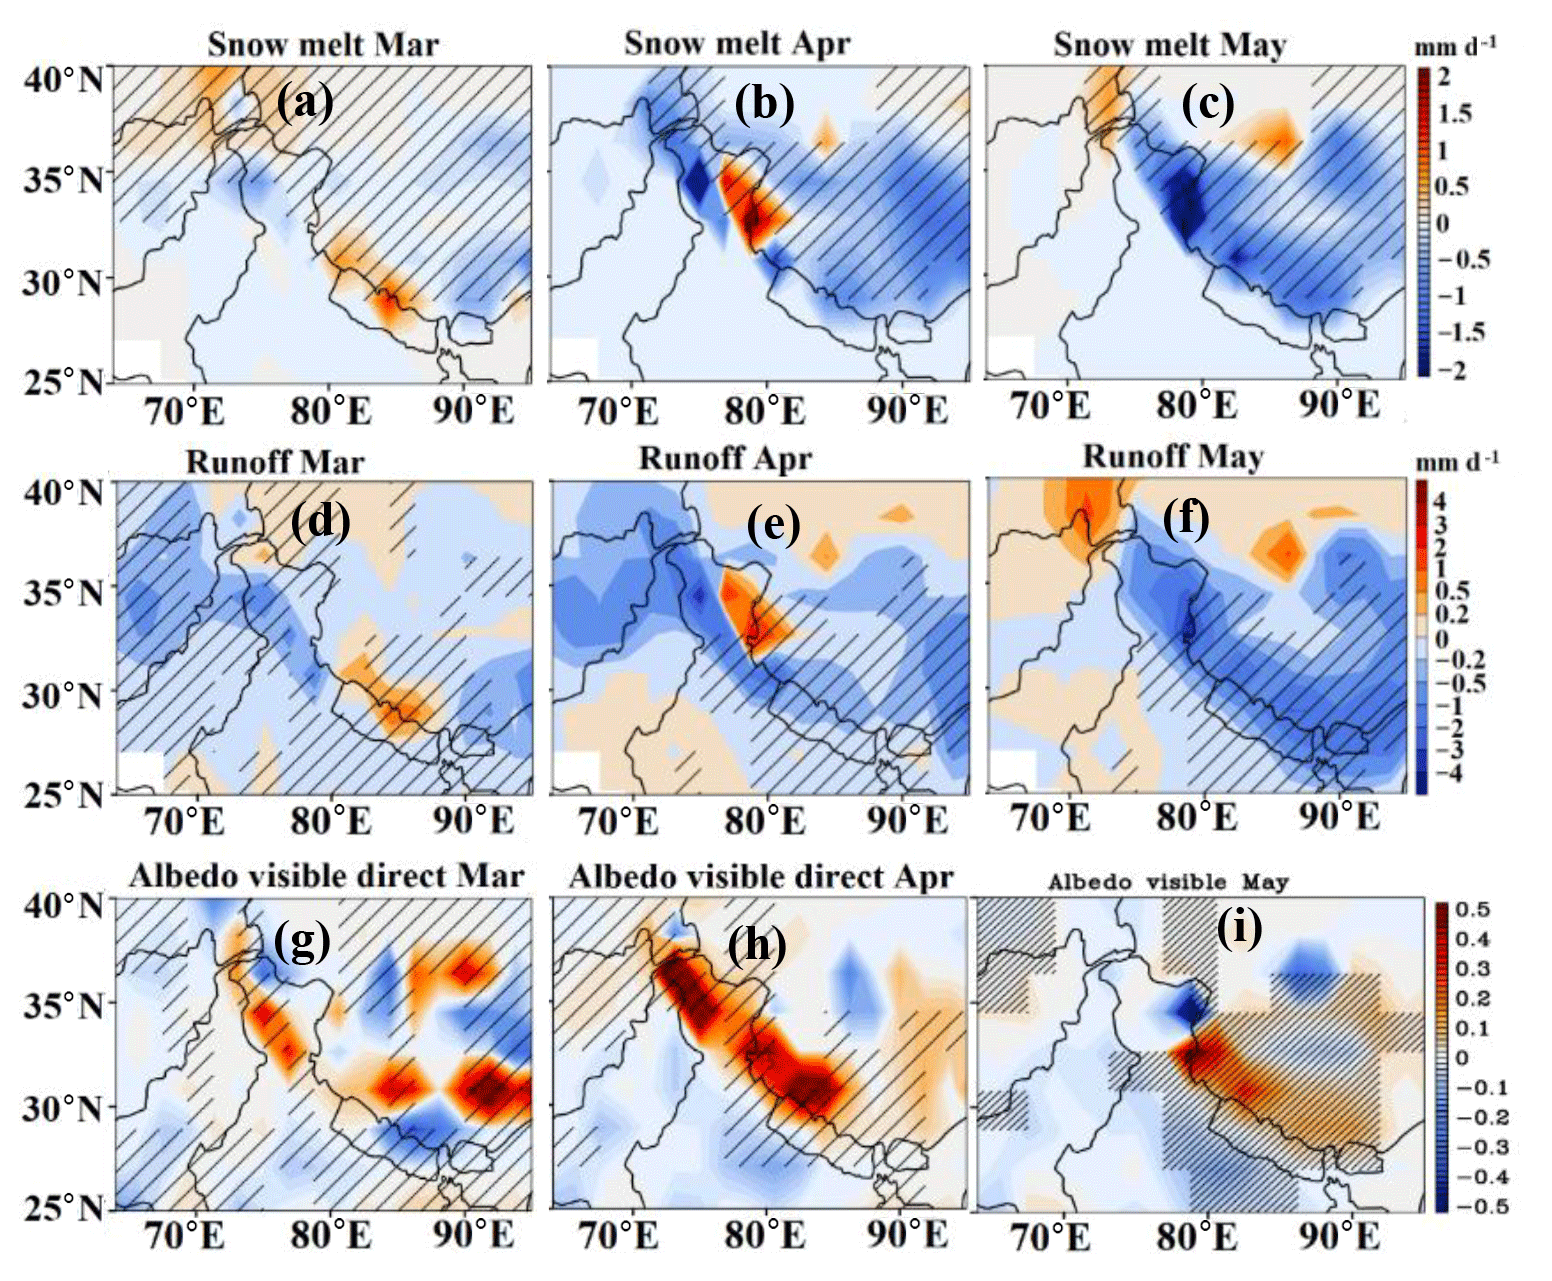
Figure 4Spatial distribution of anomalies of (a–c) snowmelt (mm d−1), (d–f) surface water runoff (mm d−1) for March to May 2020 (COVID minus CTL), and (g–i) surface albedo mean in the visible range. Hatched areas indicate the 95 % significance level.
A limitation of our simulation is the relatively coarse spatial resolution in the ECHAM6-HAMMOZ model (). Other studies used a finer spatially resolved regional model; for example, Sarangi et al. (2020) used a 12×12 km () grid in the regional WRF-Chem-SNICAR model over the same region. In our model grid of 1.875∘, many of the Himalayan subranges are smaller than a pixel, and, hence, the topographic influences, which are substantial in the mountains, are limited. One effect may be that snowfall and snow on the ground are underestimated (e.g. Liu et al., 2022). The coarse grid size can impact the anomalies found here as the changes in snow mass are small, at most +16 mm, and the bias in the likely underestimated snow mass may change between the control and COVID simulations. Biases are, however, the same in the control and COVID simulations, and, thus, their effects will be diluted when we compute the anomalies.
We elaborate on the comparison of MODIS AOD with our model simulations over the western, central, and eastern Himalaya and Tibetan Plateau regions (Fig. S6). Both MODIS and the model show a reduction in AOD during spring 2020 over the aforementioned regions of the HKH. The estimated differences in AOD during March to May 2020 vary between 0.8 %–11 % over the western and central Himalayas and between 8 %–16 % over the eastern Himalayas. Over the Tibetan Plateau region, in contrast to the model simulations, MODIS shows an enhancement (2 %–16 %) in AOD (Fig. S6). This may be due to dust aerosols, which are transported during spring from western Asia and locally, generating dust piles over the Tibetan Plateau (Fadnavis et al., 2017, 2021a). The simulated dust aerosol concentration in spring 2020 over the Tibetan Plateau region is smaller in the COVID than in the non-COVID (i.e. CTL) situation (Fig. S1c). The changes in simulated dust are a response to meteorology differences between the COVID and CTL simulations (Fig. S7).
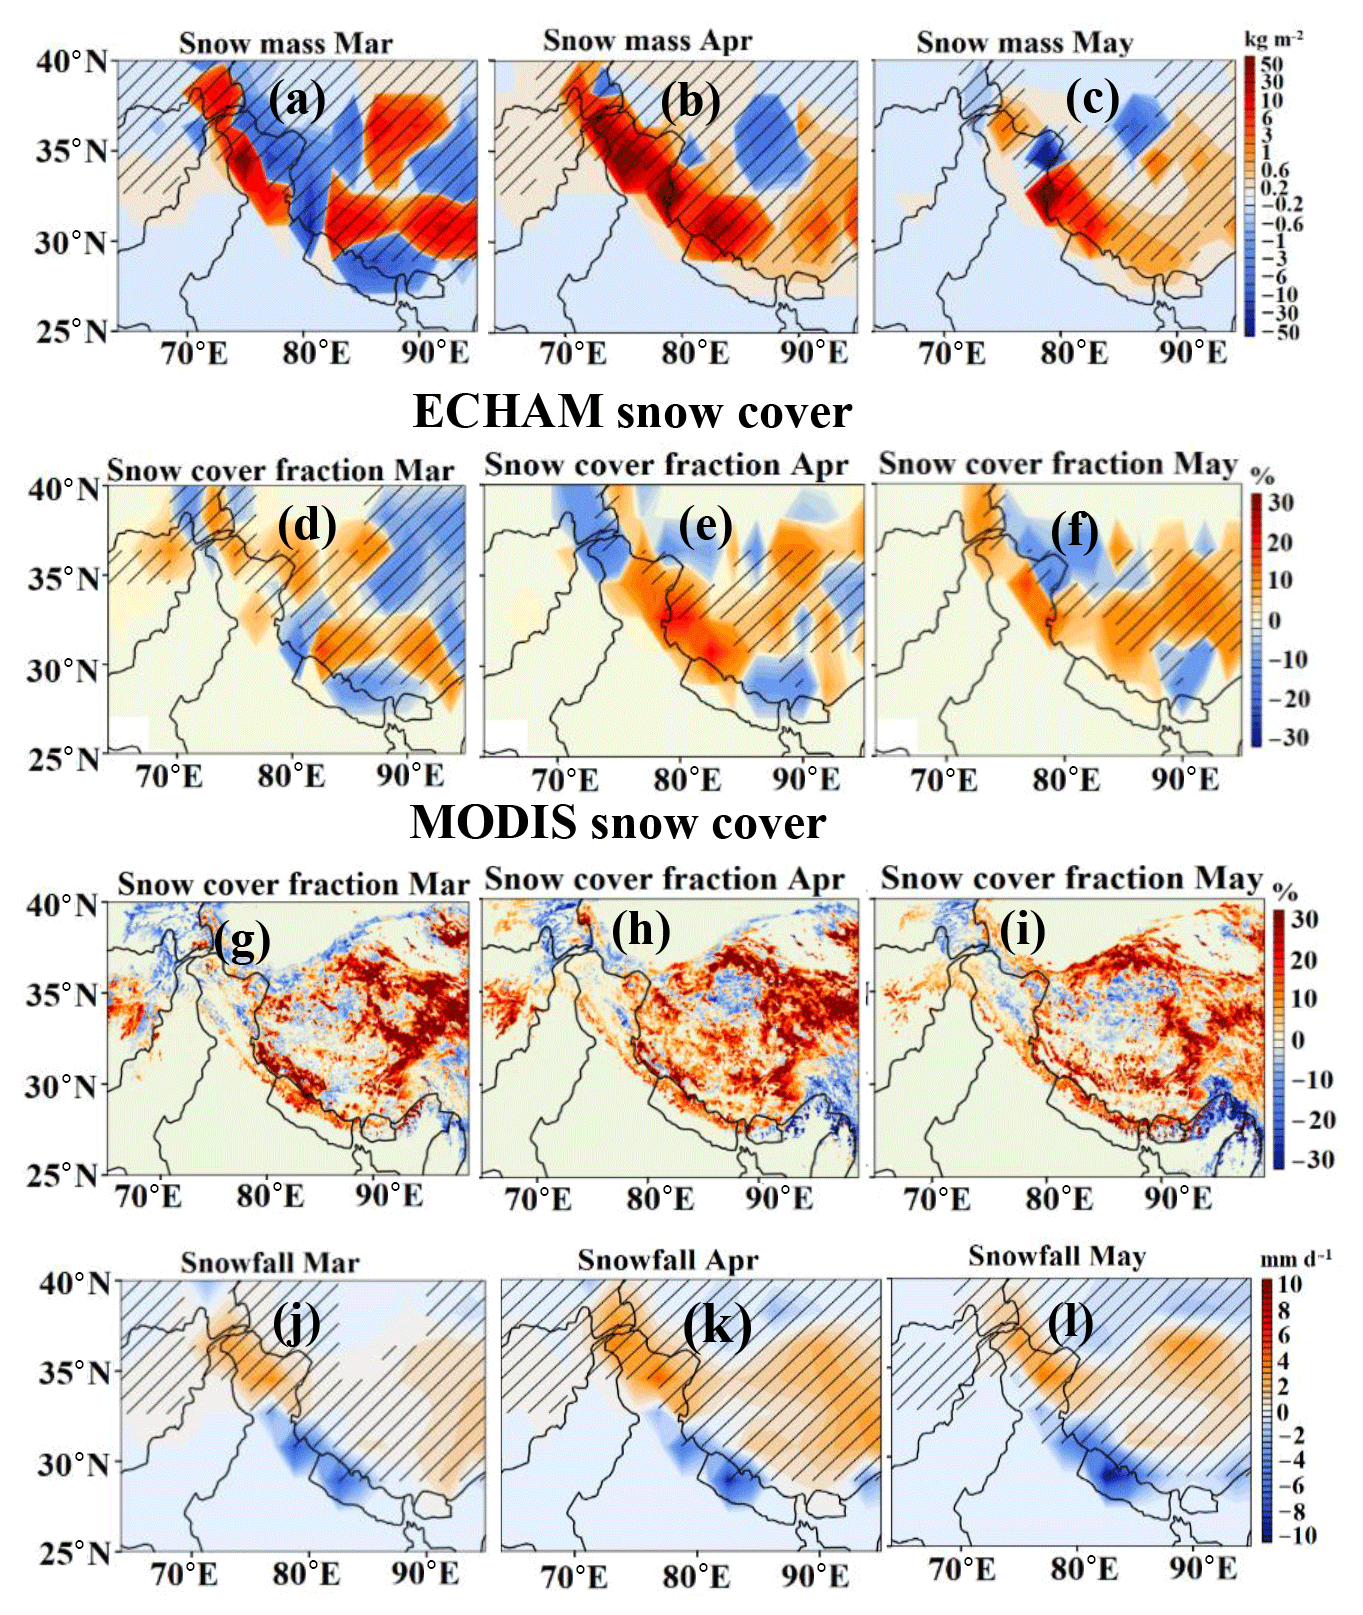
Figure 5Monthly mean anomalies (COVID minus CTL) for March to May 2020 of (a–c) the snow mass (kg m−2), (d–f) snow cover fraction (%) as modelled by ECHAM6-HAMMOZ, (g–i) snow cover fraction from MODIS satellite measurements (%) with respect to the climatological average of 2000–2019, and (j–l) snowfall as modelled by ECHAM6-HAMMOZ. Hatched areas indicate the 95 % significance level.
4.1 Reduction of airborne aerosols and in-snow BC concentration over the Himalayas
The COVID-19 lockdown restrictions in spring 2020 decreased the anthropogenic aerosol amounts over the HKH ranges (western, central, and eastern Himalayas) and the Tibetan Plateau region. The ECHAM6-HAMMOZ model simulations show that the COVID lockdown resulted in a cleaner atmosphere during March–May 2020 over the HKH ranges and the Tibetan Plateau region. There is a reduction in the level of aerosol optical depth (AOD) over the region throughout spring 2020 of % in March, % in April, and % in May compared to the CTL (non-COVID) simulation (Fig. 2a). This is supported by NASA's Moderate Resolution Imaging Spectroradiometer (MODIS) measurements, which also show a reduction in AOD in April ( %) and May ( %) 2020 compared to the mean over the last 20 years (Fig. 2a). Thus, both model simulations and MODIS AOD show a reduction in aerosol pollution in April–May 2020. For March 2020, MODIS measurements show AOD enhancement by 10.2±4.8 %, which is due to increased dustiness over the HKH region (see Sect. 3 for a detailed discussion). AOD measurements at two Aerosol Robotic Network (AERONET) sun photometer stations in Dushanbe (38.553∘ N, 68.858∘ E) and Lahore (31.480∘ N, 74.264∘ E) show an AOD reduction in agreement with our model simulations (Fig. 2b). There are differences among MODIS, AERONET, and the model. The changes in AOD during COVID compared to during the no-COVID period are less in the model than in the MODIS observations by 4.2 %–9.8 % and higher than the AERONET observations by 1.8 %–4.2 %. These differences are due to the fact that the simulated AOD change is in response to the reduction of anthropogenic aerosols and associated circulation responses, while MODIS and AERONET measurements show the effect of all atmospheric processes. Also, note that the MODIS AOD values are spatial averages representative of a relatively large area, while the AERONET values are point measurements. Importantly, changes in simulated AOD in 2020 fall within the standard deviation of satellite and ground-based measurements, indicating the reliability of our simulations (except for March 2020 with respect to MODIS). Our model simulations also show a reduction in BC burden of 15 %–55 % (Fig. S1a) and a reduction in sulfate burden of 22 %–24 % over the HKH and Tibetan Plateau regions in spring 2020 (Fig. S1b). Interestingly, dust burden also shows a reduction over these regions (Figs. S1c, S2a–c) except over the central Himalaya in March and April 2020. The lower dust load is related to the interactive change in atmospheric dynamics in the model, which also leads to changes in the wet and dry deposition rates of dust (Fig. S2d–i) (details in Sect. 3). A drop in BC is also observed in the ground-based measurements of the Aerosol Radiative Forcing Over India Network (ARFINET) over the Indo-Gangetic Plain (>50 %), northeastern India (>30 %), the Himalaya regions (16 %–60 %), and Tibet (70 %) during spring 2020 (Gogoi et al., 2021; Liu et al., 2021). A similar impact of the reduction of energy consumptions on the decrease in AOD during the COVID-19 lockdown period, i.e. in spring 2020, compared to the 2010–2019 climatology is also seen over southern and eastern Asia (40 %) and the Indo-Gangetic Plain (IGP) by 30 %–40 % in satellite measurements (Fadnavis et al., 2021a; Srivastava et al., 2021; Pandey et al., 2021; Shafeeque et al., 2021).
The reduction in anthropogenic air pollution widely leads to a reduction of approximately 25–350 µg kg−1 (by 12 %–35 %) in BC concentration in the snow during spring 2020 (Fig. 3a–c), which reduces the snow-darkening effect by embedded aerosol impurities. At most, this amounts to an increase of about 1.6 % in visible snow albedo. Sporadically, however, the in-snow BC concentrations have also increased in some areas of the Hindu Kush, the eastern Himalayas, and the Kunlun Mountains. There are many factors at play that may lead to an increase in BC concentration in snow in some locations. For instance, this includes increases in the deposition of BC following shifts in the atmospheric circulation (Fig. S3), accumulation of BC on surface snow following partial snowmelt and minimal fresh snowfall, and less frequent occurrences of complete snowmelt which would otherwise remove all accumulated BC in snow. Our simulations reveal that the decrease in the in-snow BC concentration and the overall reduction in atmospheric pollution, as well as the associated radiative effects, decreased the shortwave radiative forcing at the surface by 0.2–2 W m−2 in March–May 2020 (Fig. 3d–f), leading to a decrease in tropospheric heating by solar radiation of 0.001 to 0.015 K d−1 (Fig. 3g–i). The reduced anthropogenic BC over the HKH and Tibetan Plateau region resulted in less absorption and re-emission of longwave radiation, and, as a consequence, there is a reduction in longwave radiative forcing in the atmosphere, leading to a lower atmospheric heating (Fig. S4). This decreased heating of the snowpack and tropospheric column is the combined effect of the reductions of BC in snow and the changes in atmospheric concentrations of sulfate, OC, and BC.
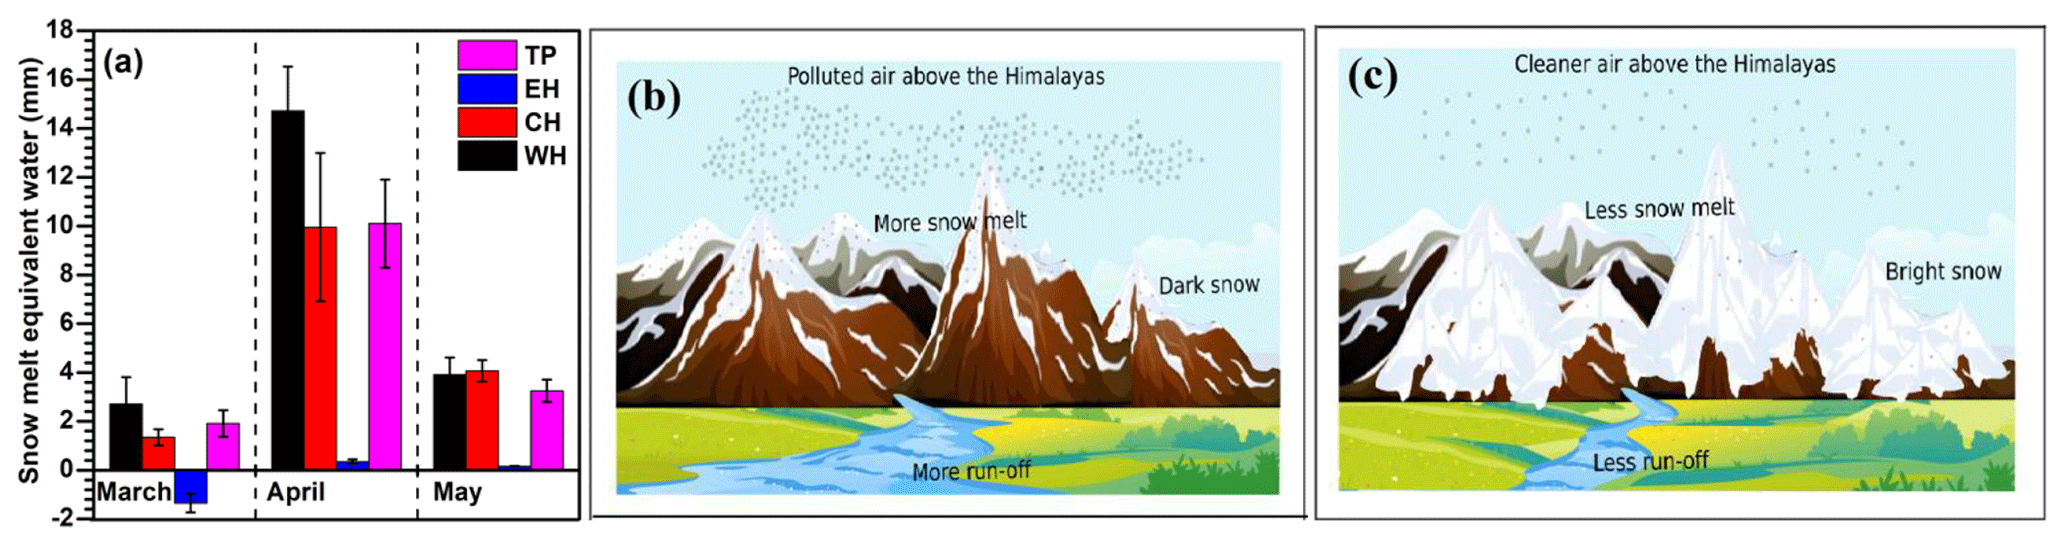
Figure 6(a) Change in water content (mm) of the Himalayan surface reservoirs (COVID minus CTL) from March to May 2020 over the western Himalayas (WH), the central Himalayas (CH), the eastern Himalayas (EH), and the Tibetan Plateau (TP). Vertical bars indicate the standard deviation within 10 members of the model simulations. Schematic illustrating the impacts of (b) air pollution on snow darkening in the Himalayas and surface water runoff for the usual polluted case and (c) the impacts of reduced pollution on snow brightening in the Himalayas and reduced surface water runoff, as observed during the 2020 COVID-19 lockdown period.
4.2 Impacts on snowmelt, surface water runoff, and snow cover
Further, we show that the decrease in aerosol pollution reduced the snowmelt in spring 2020 by 0.2 to 2.5 mm d−1, corresponding to 10 %–50 % (Fig. 4a–c). The reduction in snowmelt was pronounced over the western Himalayas in May. As a result of a reduction in snowmelt, surface water runoff was drastically reduced by 2–4 mm–yr−1 (5 %–55 %) (Fig. 4d–f). The reduction in the runoff was most pronounced in May over the entirety of the Himalayas and the central Tibetan Plateau region. Estimates from remote sensing measurements also show the reduction of 6.5 km3 in runoff of melted water in the Indus River basin (Bair et al., 2020). In the past, studies have shown that elevated levels of light-absorbing aerosols (elemental carbon – 13 to 75 ng g−1, dust – 32 to 217 µg g−1) can contribute to about 3 to 10 mm d−1 of snowmelt over the western Himalayas (Thind et al., 2019). A sensitivity analysis by Santra et al. (2019) using a glacier mass balance model shows that BC-induced snow albedo reduction leads to an increase in annual runoff of 4 %–18 %. In contrast to the impacts of rising anthropogenic emissions during the past decades, emission reductions during the 2020 COVID-19 lockdown period caused a brighter snow albedo and therefore an enhanced surface reflection with albedo increases of 0.2–0.5 (see Fig. 4g–i), leading to less atmospheric heating, as well as associated reduced snowmelt and surface water runoff in spring 2020.
Our simulations also indicate that these changes lead to an increase in snow mass of 0.2–50 kg m−2, i.e. 10 %–40 % (Fig. 5a–c), and an increase in snow cover fraction of 2 %–30 % during spring 2020 (Fig. 5d–f). MODIS measurements also show a remarkable agreement with the model simulations (especially during April–May 2020), with increased snow cover of about 15 %–30 % over parts of the western and central Himalayas and the Tibetan Plateau region and decreased snow cover of about 5 %–12 % over parts of the northeastern Himalayas, especially in April and May 2020 (Fig. 5g–i). However, there are also some differences in terms of the exact regions of snow cover enhancement or reduction since the MODIS observations include the influence of real-time meteorology, while meteorology in the model ensemble includes internal variability and does not replicate the exact conditions observed by MODIS. Our model simulations show that air pollution reductions in the COVID-19 lockdown period and associated changes in radiative forcing caused changes in the tropospheric circulation and thermodynamics (see Fadnavis et al., 2021b, for a detailed analysis). These changes in meteorology have increased snowfall by 2–5 mm d−1 (3 %–20 %) over the western Himalayas and the Tibetan Plateau region (Fig. 5j–l). The increase in snowfall over these regions contribute to an enhancement in snow mass and snow cover (Fig. 5a–f) and albedo (Fig. 4g–i). In a few areas, however, this also contributes to a more efficient BC deposition on snow, as described above (Fig. 3). However, this BC enrichment in snow at a few locations has no influence on the fact that, overall, the COVID-19 measures reduced the in-snow BC concentration and thus increased the visible snow albedo (see Fig. 4g–i).
Himalayan snow is the largest source of freshwater for southern Asia (Bolch et al., 2012). The impact of reduced pollution on the surface water content in the Himalayas from our model simulations is illustrated in Fig. 6a. The snow mass enhancement led to an increase in the snow-equivalent water of 2 to 14.7 mm (2.5 % to 55 %). The western Himalayas show the highest increase in snow-equivalent water of 14.7 mm (55 %) followed by the Tibetan Plateau with an increase of 12 mm (by 22 %) and the central Himalayas with an increase of 10 mm (by 18 %) in April, while the eastern Himalayas show a decrease in March (−1.3 mm; 10 %) and a small enhancements in April and May 2020 of 1.1 mm (2.3 %) and 1.3 mm (2.7 %), respectively, due to pollution reduction. Thus, human-induced pollution reduction during the COVID-19 lockdown benefitted the HKH in many ways. A schematic shows the COVID-19 lockdown-induced effects in Fig. 6b–c: increased snow surface reflectivity, reduced snowmelt and surface water runoff, and enhanced water content in the reservoir and snow.
A rising trend in Asian air pollution and associated climate change over the last few decades has had a detrimental impact on snow melting over the Hindu Kush Himalayas (HKH) and the Tibetan Plateau region (Wester et al., 2019). Black carbon from increasing emissions of biomass burning, industrial and domestic combustion, and transport is deposited on snow, reducing its albedo (i.e. darkening) (Bolch et al., 2019). A snow-darkening effect along with pollution reduction, compounded by other climate change effects, accelerates the melting of snow and the disappearance of ice cover over the HKH and Tibetan Plateau region at an extraordinary rate (Usha et al., 2021). The drop in anthropogenic air pollution emissions, e.g. from energy production, during the COVID-19 lockdown period in spring 2020 reduced air pollutant levels worldwide (Forster et al., 2020). Our model simulations indicate that the associated reduction in anthropogenic aerosols and greenhouse gases in spring 2020 has benefited the HKH snow reservoirs. It caused an enhancement in the snow cover fraction (6 %–12 %) and in the snow mass (2 %–20 %), corresponding to a decrease in snowmelt (10 %–40 %) and in surface water runoff (0.2–3 mm d−1). As a consequence, the water content of the reservoir increased considerably by 4 % to 59 %.
Our findings highlight that, out of the two processes causing a retreat of Himalayan glaciers – (1) a slow response to global climate change and (2) a fast response to local air pollution (especially black carbon) – a policy action on the latter is more likely to be within the reach of possible policy action on a shorter-term timescale and a more regional spatial scale. Even if we stopped CO2 emissions immediately, temperatures would not start decreasing. Our findings confirm the importance of reducing short-lived climate forcers (black carbon) and their complementary role in CO2 mitigation (Rogelj et al., 2014). The reduction of air pollution to levels similar with those recorded during the 2020 COVID-19 lockdown period could safeguard HKH glaciers, which are otherwise under the threat of disappearing by the end of the 21st century. Since 2000, Himalayan glaciers have been losing nearly half a metre of ice per year (Wester et al., 2019). Our estimates indicate that air pollution reduction during the COVID-19 lockdown in spring 2020 caused a reduction in snow melt of 0.5 to 1.5 mm d−1, indicating large benefits to HKH glaciers. Even if global warming is kept below 1.5 ∘C, one-third of the glaciers in the HKH region and more than half of those in the eastern Himalayas will likely be lost by the end of this century (Bolch et al., 2019). The speedily retreating glaciers and the snowpack loss are already posing a threat to domestic sustainable water resources for billions of people in Asia (Wood et al., 2021). However, if new economically and technically feasible policies reduce the emissions of air pollutants (in particular, black carbon) to at least lockdown period levels, snowmelt could be reduced by 10 %–50 %. Such policies will therefore bring substantial benefits for sustained water supply, agriculture, and ecosystems in large parts of Asia.
The ECHAM-HAMMOZ model source code and all required input data are available to the scientific community according to the HAMMOZ Software License Agreement through the project website: https://redmine.hammoz.ethz.ch/projects/hammoz (last access: 14 March 2022). The data that support the findings of this study are openly available on Zenodo at https://doi.org/10.5281/zenodo.6783077 (Fadnavis, 2022).
The supplement related to this article is available online at: https://doi.org/10.5194/acp-23-10439-2023-supplement.
SF initiated the idea of the study. SF and BH performed model simulations. AR and AK prepared the Google-based emission inventory. TPS, AA, and RM performed the data analysis and contributed to the overall design. All the authors contributed to discussions of the results and the writing of the paper.
At least one of the (co-)authors is a member of the editorial board of Atmospheric Chemistry and Physics. The peer-review process was guided by an independent editor, and the authors also have no other competing interests to declare.
Publisher’s note: Copernicus Publications remains neutral with regard to jurisdictional claims in published maps and institutional affiliations.
The authors thank the staff of the High Power Computing Centre (HPC) in IITM, Pune, India, for providing computer resources and the team members of MODIS for providing data. We thank Sabur F. Abdullaev and Brent Holben for their efforts in establishing and maintaining the Dushanbe and Lahore AERONET sites, respectively. The work done in this paper was not supported by any funding agency.
This paper was edited by Peter Haynes and James Allan and reviewed by Edward Bair and one anonymous referee.
Bair, E., Stillinger, T., Rittger, K., and Skiles, M.: COVID-19 lockdowns show reduced pollution on snow and ice in the Indus River Basin, P. Natl. Acad. Sci. USA, 118, 19–21, https://doi.org/10.1073/pnas.2101174118, 2021.
Bolch, T., Shea, J. M., Liu, S., Azam, M. F., Gao, Y., Gruber, S., Immerzeel, W. W., Kulkarni, A. V., Li, H., Tahir, A. A., Zhang, G., and Zhang, Y.: Status and Change of the Cryosphere in the Extended Hindu Kush Himalaya Region, in: The Hindu Kush Himalaya Assessment: Mountains, Climate Change, Sustainability and People, edited by: Wester, P., Mishra, A., Mukherji, A., and Shrestha, A. B., Springer International Publishing, 209–255, https://doi.org/10.1007/978-3-319-92288-1_7, 2019.
Cruz, R. V., Harasawa, H., Lal, M., Wu, S, Anokhin, Y., Punsalmaa, B., Honda, Y., Jafari, M., Li, C., and Huu, N.: Climate change 2001: impacts, adaptation, and vulnerability, Choice Rev. Online, 39, 3433–3433, 2007.
Fadnavis, S. S.: Model simulation to study Air pollution over Himalayas, Zenodo [data set], https://doi.org/10.5281/zenodo.6783077, 2022.
Fadnavis, S., Kalita, G., Kumar, K. R., Gasparini, B., and Li, J.-L. F.: Potential impact of carbonaceous aerosol on the upper troposphere and lower stratosphere (UTLS) and precipitation during Asian summer monsoon in a global model simulation, Atmos. Chem. Phys., 17, 11637–11654, https://doi.org/10.5194/acp-17-11637-2017, 2017.
Fadnavis, S., Müller, R., Kalita, G., Rowlinson, M., Rap, A., Li, J.-L. F., Gasparini, B., and Laakso, A.: The impact of recent changes in Asian anthropogenic emissions of SO2 on sulfate loading in the upper troposphere and lower stratosphere and the associated radiative changes, Atmos. Chem. Phys., 19, 9989–10008, https://doi.org/10.5194/acp-19-9989-2019, 2019a.
Fadnavis, S., Sabin, T. P., Roy, C., Rowlinson, M., Rap, A., Vernier, J.-P., and Sioris, C. E.: Elevated aerosol layer over South Asia worsens the Indian droughts, Sci. Rep., 9, 1–12, https://doi.org/10.1038/s41598-019-46704-9, 2019b.
Fadnavis, S., Müller, R., Chakraborty, T., Sabin, T. P., Laakso, A., Rap, A., Griessbach, S., Vernier, J.-P., and Tilmes, S.: The role of tropical volcanic eruptions in exacerbating Indian droughts, Sci. Rep., 11, 1–13, https://doi.org/10.1038/s41598-021-81566-0, 2021a.
Fadnavis, S., Sabin, T. P., Rap, A., Müller, R., Kubin, A., and Heinold, B.: The impact of COVID-19 lockdown measures on the Indian summer monsoon, Environ. Res. Lett., 16, 074054, https://doi.org/10.1088/1748-9326/ac109c, 2021b.
Forster, P. M., Forster, H. I., Evans, M. J., Gidden, M. J, Jones, C. D., Keller, C. A., Lamboll, R. D., Quéré, C. L., Rogelj, J., Rosen, D., Schleussner, C.-F, Richardson, T. B., Smith, C. J., and Turnock, S. T.: Current and future global climate impacts resulting from COVID-19, Nat. Clim. Change, 10, 913–919, 2020.
Gogoi, M. M, Babu, S. S., Arun, B. S., Moorthy, K. K., Aravindakshan, A., Parottil, A., Suryavanshi, A., Borgohain, A., Guha, A., Shaikh, A. A., Pathak, B., Gharai, B., Boopathy, R., Gugamsetty, B., Menon, H. B., Kuniyal, J. C., Raja Mani, M., Balakrishnan, J., Gopal, K. R., Maheswari, M., Naja, M., Kaur, P., Bhuyan, P., Gupta, P., Singh, P., Srivastava, P., Singh R. S., Kumar, R., Rastogi, S., Kundu, S. S., Kompalli, S. K., Panda, S., Rao, T. C., Das, T., and Kant, Y.: Response of Ambient BC Concentration Across the Indian Region to the Nation-Wide Lockdown: Results from the ARFINET Measurements of ISRO-GBP, Curr. Sci., 120, 120, 341, https://doi.org/10.18520/cs/v120/i2/341-351, 2021.
Hall, D. K., Salomonson, V. V., and Riggs, G. A.: MODIS/Terra Snow Cover 5-Min L2 Swath 500 m, Version 5, Boulder, Colorado USA. NASA National Snow and Ice Data Center Distributed Active Archive Center, https://doi.org/10.5067/ACYTYZB9BEOS, 2006.
Hock, R., Rasul, G., Adler, C., Cáceres, B., Gruber, S., et al.: Chapter 2: High Mountain Areas, IPCC Special Report on the Ocean and Cryosphere in a Changing Climate, IPCC Spec. Rep. Ocean Cryosph. Chang. Clim., 131–202, https://doi.org/10.1017/9781009157964.004, 2019.
Huang, W. T. K.: Aerosol effects on climate, with an emphasis on the Arctic, ETH Zurich, https://doi.org/10.3929/ethz-b-000319114, 2018.
Hussain, A., Sarangi, G. K., Pandit, A., Ishaq, S., Mamnun, N., Ahmad, B., and Jamil, M. K.: Hydropower development in the Hindu Kush Himalayan region: Issues, policies and opportunities, Renew. Sustain. Energy Rev., 107, 446–461, https://doi.org/10.1016/j.rser.2019.03.010, 2019.
IPCC, 2013: Climate Change 2013: The Physical Science Basis. Contribution of Working Group I to the Fifth Assessment Report of the I ntergovernmental Panel on Climate Change, edite by: Stocker, T. F., Qin, D., Plattner, G.-K., Tignor, M., Allen, S. K., Boschung, J., Nauels, A., Xia, Y., Bex, V., and Midgley, P. M., Cambridge University Press, Cambridge, United Kingdom and New York, NY, USA, 1535 pp., 2013.
Jones, C. D., Hickman, J. E., Rumbold, S. T., Walton, J., Lamboll, R. D., Skeie, R. B., Fiedler, S., Forster, P. M., et al.: The climate response to emissions reductions due to COVID-19: Initial results from CovidMIP, Geophys. Res. Lett., 48, e2020GL091883, https://doi.org/10.1029/2020GL091883, 2021.
Kanniah, K. D., Kamarul, Z. N. A. F., Kaskaoutis, D. G., and Latif, M. T.: COVID-19's impact on the atmospheric environment in the Southeast Asia region, Sci. Total Environ., 736, 139658, https://doi.org/10.1016/j.scitotenv.2020.1396580048-9697, 2020.
Krishnan, R., Sanjay, J., Gnanaseelan, C., Mujumdar, M., Kulkarni, A., and Chakraborty, S.: Assessment of climate change over the Indian region: A report of the ministry of earth sciences (MOES), government of India, Assessment of Climate Change over the Indian Region: A Report of the Ministry of Earth Sciences (MoES), Government of India, Springer Singapore, https://doi.org/10.1007/978-981-15-4327-2, 2020.
Krishnan, R., Shrestha, A., Ren, G., Rajbhandari, R., Saeed, S., and Sanjay, J.: Unravelling Climate Change in the Hindu Kush Himalaya: Rapid Warming in the Mountains and Increasing Extremes. The Hindu Kush Himalaya Assessment, Springer Singapore, https://doi.org/10.1007/978-3-319-92288-1_3, 2019.
Lamarque, J.-F., Bond, T. C., Eyring, V., Granier, C., Heil, A., Klimont, Z., Lee, D., Liousse, C., Mieville, A., Owen, B., Schultz, M. G., Shindell, D., Smith, S. J., Stehfest, E., Van Aardenne, J., Cooper, O. R., Kainuma, M., Mahowald, N., McConnell, J. R., Naik, V., Riahi, K., and van Vuuren, D. P.: Historical (1850–2000) gridded anthropogenic and biomass burning emissions of reactive gases and aerosols: methodology and application, Atmos. Chem. Phys., 10, 7017–7039, https://doi.org/10.5194/acp-10-7017-2010, 2010.
Lau, W. K. M., Kim, M. K., Kim, K. M., and Lee, W. S.: Enhanced surface warming and accelerated snow melt in the Himalayas and Tibetan Plateau induced by absorbing aerosols, Environ. Res. Lett., 5, 025204, https://doi.org/10.1088/1748-9326/5/2/025204, 2010.
Le Quéré, C., Jackson, R. B., Jones, M. W., Smith, A. J. P., Abernethy, S., Andrew, R. M., De-Gol, A. J., Willi, D. R., Shan, Y., Canadell J. G., Friedlingstein, P., Creutzig, F., and Peters, G. P.: Temporary reduction in daily global CO2 emissions during the COVID-19 forced confinement, Nat. Clim. Change, 10, 647–653, https://doi.org/10.1038/s41558-020-0797-x, 2020.
Lee, E., Carrivick, J. L., Quincey, D. J., Cook, S. J., James, W. H. M., and Brown, L. E.: Accelerated mass loss of Himalayan glaciers since the Little Ice Age, Sci. Rep., 11, 1–8, https://doi.org/10.1038/s41598-021-03805-8, 2021.
Lee, S. S., Chu, J. E., Timmermann, A., Chung, E. S., and Lee, J. Y.: East Asian climate response to COVID-19 lockdown measures in China, Sci. Rep., 11, 1–9, 2021.
Liu, Y., Wang, Y., Cao, Y., Yang, X., Zhang, T., Luan, M., Lyu, D., Hansen, A. D. A., Liu, B., Liu, Y., Fang, Y., Li, D., and Margulis, S. A.: How Well do Global Snow Products Characterize Snow Storage in High Mountain Asia?, Geophys. Res. Lett., 49, e2022GL100082, https://doi.org/10.1029/2022GL100082, 2022.
Ma, J., Zhang, T., and Guan, X.: The dominant role of snow/ice Albedo feedback strengthened by black carbon in the enhanced warming over the Himalayas, J. Climate, 32, 5883–5899, https://doi.org/10.1175/JCLI-D-18-0720.s1.2019.
Martonchik, J. V., Diner, D. J., Kahn, R., Gaitley, B., and Holben, B. N.: Comparison of MISR and AERONET aerosol optical depths over desert sites, Geophys. Res. Lett., 31, 1–4, https://doi.org/10.1029/2004GL019807, 2004.
Nair, V. S., Babu, S. S., Moorthy, K. K., Sharma, A. K., Marinoni, A., and Ajai, N.: Black carbon aerosols over the Himalayas: Direct and surface albedo forcing, Tellus B, 468, 19738, https://doi.org/10.3402/tellusb.v65i0.19738, 2013.
Pandey, S. K. and Vinoj, V.: Surprising changes in aerosol loading over india amid covid-19 lockdown, Aerosol Air Qual. Res., 21, 1–12, https://doi.org/10.4209/aaqr.2020.07.0466, 2021.
Qian, Y., Flanner, M. G., Leung, L. R., and Wang, W.: Sensitivity studies on the impacts of Tibetan Plateau snowpack pollution on the Asian hydrological cycle and monsoon climate, Atmos. Chem. Phys., 11, 1929–1948, https://doi.org/10.5194/acp-11-1929-2011, 2011.
Rogelj, J., Schaefferc, M., Meinshausene, M., Shindell, D. T., Harec, W., Klimontb, Z., Veldersh, G. J. M., Amannb, M., and Schellnhuberr, H. J.: Disentangling the effects of CO2 and short lived climate forcer mitigation, P. Natl. Acad. Sci. USA, 111, 16325–16330, https://doi.org/10.1073/pnas.1415631111, 2014.
Sabin, T., Krishnan, R., Vellore, R., Priya, P., Borgaonkar, H., Singh, B., and Sagar, A.: Droughts and floods, Climate Change Over the Himalayas, Assessment Of Climate Change Over The Indian Region, https://doi.org/10.1007/978-981-15-4327-2_11, 2020.
Santra, S., Verma, S., Fujita, K., Chakraborty, I., Boucher, O., Takemura, T., Burkhart, J. F., Matt, F., and Sharma, M.: Simulations of black carbon (BC) aerosol impact over Hindu Kush Himalayan sites: validation, sources, and implications on glacier runoff, Atmos. Chem. Phys., 19, 2441–2460, https://doi.org/10.5194/acp-19-2441-2019, 2019.
Sarangi, C., Qian, Y., Rittger, K., Bormann, K. J., Liu, Y., Wang, H., Wan, H., Lin, G., and Painter, T. H.: Impact of light-absorbing particles on snow albedo darkening and associated radiative forcing over high-mountain Asia: high-resolution WRF-Chem modeling and new satellite observations, Atmos. Chem. Phys., 19, 7105–7128, https://doi.org/10.5194/acp-19-7105-2019, 2019.
Sarangi, C., Qian, Y., Rittger, K., Ruby, L., Chand, D., Bormann, K. J., and Painter, T. H.: Dust dominates high-altitude snow darkening and melt over high-mountain Asia, Nat. Clim. Change, 10, 1045–1051, https://doi.org/10.1038/s41558-020-00909-3, 2020.
Schultz, M. G., Stadtler, S., Schröder, S., Taraborrelli, D., Franco, B., Krefting, J., Henrot, A., Ferrachat, S., Lohmann, U., Neubauer, D., Siegenthaler-Le Drian, C., Wahl, S., Kokkola, H., Kühn, T., Rast, S., Schmidt, H., Stier, P., Kinnison, D., Tyndall, G. S., Orlando, J. J., and Wespes, C.: The chemistry–climate model ECHAM6.3-HAM2.3-MOZ1.0, Geosci. Model Dev., 11, 1695–1723, https://doi.org/10.5194/gmd-11-1695-2018, 2018.
Shafeeque, M., Arshad, A., Elbeltagi, A., Sarwar, A., Pham, Q. B., Khan, S. N., Dilawar, A., and Al-Ansari, N.: Understanding temporary reduction in atmospheric pollution and its impacts on coastal aquatic system during COVID-19 lockdown: a case study of South Asia, Geomatics, Nat. Hazards Risk, 12, 560–580, https://doi.org/10.1080/19475705.2021.1885503, 2021.
Srivastava, A. K., Bhoyar, P. D., Kanawade, V. P., Devara, P. C. S., Thomas, A., and Soni, V. K.: Improved air quality during COVID-19 at an urban megacity over the Indo-Gangetic Basin: From stringent to relaxed lockdown phases, Urban Clim., 36, 100791, https://doi.org/10.1016/j.uclim.2021.100791, 2021.
Stevens, B., Giorgetta, M., Esch, M., Mauritsen, T., Crueger, T., Rast, S., Salzmann, M., Schmidt, H., Bader, J., Block, K., Brokopf, R., Fast, I., Kinne, S., Kornblueh, L., Lohmann, U., Pincus, R., Reichler, T., and Roeckner, E.: Atmospheric component of the MPI-M earth system model: ECHAM6., J. Adv. Model. Earth Syst., 5, 146–172, https://doi.org/10.1002/jame.20015, 2013.
Stier, P., Feichter, J., Kinne, S., Kloster, S., Vignati, E., Wilson, J., Ganzeveld, L., Tegen, I., Werner, M., Balkanski, Y., Schulz, M., Boucher, O., Minikin, A., and Petzold, A.: The aerosol-climate model ECHAM5-HAM, Atmos. Chem. Phys., 5, 1125–1156, https://doi.org/10.5194/acp-5-1125-2005, 2005.
Tegen, I., Neubauer, D., Ferrachat, S., Siegenthaler-Le Drian, C., Bey, I., Schutgens, N., Stier, P., Watson-Parris, D., Stanelle, T., Schmidt, H., Rast, S., Kokkola, H., Schultz, M., Schroeder, S., Daskalakis, N., Barthel, S., Heinold, B., and Lohmann, U.: The global aerosol–climate model ECHAM6.3–HAM2.3 – Part 1: Aerosol evaluation, Geosci. Model Dev., 12, 1643–1677, https://doi.org/10.5194/gmd-12-1643-2019, 2019.
Textor, C., Schulz, M., Guibert, S., Kinne, S., Balkanski, Y., Bauer, S., Berntsen, T., Berglen, T., Boucher, O., Chin, M., Dentener, F., Diehl, T., Easter, R., Feichter, H., Fillmore, D., Ghan, S., Ginoux, P., Gong, S., Grini, A., Hendricks, J., Horowitz, L., Huang, P., Isaksen, I., Iversen, I., Kloster, S., Koch, D., Kirkevåg, A., Kristjansson, J. E., Krol, M., Lauer, A., Lamarque, J. F., Liu, X., Montanaro, V., Myhre, G., Penner, J., Pitari, G., Reddy, S., Seland, Ø., Stier, P., Takemura, T., and Tie, X.: Analysis and quantification of the diversities of aerosol life cycles within AeroCom, Atmos. Chem. Phys., 6, 1777–1813, https://doi.org/10.5194/acp-6-1777-2006, 2006.
Thind, P. S., Chandel, K. K., Sharma, S. K., Mandal, T. K., and John, S.: Light-absorbing impurities in snow of the Indian Western Himalayas: impact on snow albedo, radiative forcing, and enhanced melting, Environ. Sci. Pollut. Res., 26, 7566–7578, https://doi.org/10.1007/s11356-019-04183-5, 2019.
Tiwari, S., Kar, S. C., and Bhatla, R.: Snowfall and Snowmelt Variability over Himalayan Region in Inter-annual Timescale, Aquat. Procedia, 4, 942–949, https://doi.org/10.1016/j.aqpro.2015.02.118, 2015.
Usha, K. H., Nair, V. S., and Babu, S. S.: Effect of aerosol-induced snow darkening on the direct radiative effect of aerosols over the Himalayan region, Environ. Res. Lett., 16, 064004, https://doi.org/10.1088/1748-9326/abf190, 2021.
Wester, P., Mishra, A., Mukherji, A., and Shrestha, A. B.: The Hindu Kush Himalaya Assessment – Mountains, Climate Change, Sustainability and People, Springer Nature Switzerland AG, Cham., https://doi.org/10.1007/978-3-319-92288-1, 2019.
Wood, L. R., Neumann, K., Nicholson, K. N., Bird, B. W., Dowling, C. B., and Sharma, S.: Melting Himalayan Glaciers Threaten Domestic Water Resources in the Mount Everest Region, Nepal, Front. Earth Sci., 8, 1–8, https://doi.org/10.3389/feart.2020.00128, 2020.
Zhang, K., O'Donnell, D., Kazil, J., Stier, P., Kinne, S., Lohmann, U., Ferrachat, S., Croft, B., Quaas, J., Wan, H., Rast, S., and Feichter, J.: The global aerosol-climate model ECHAM-HAM, version 2: sensitivity to improvements in process representations, Atmos. Chem. Phys., 12, 8911–8949, https://doi.org/10.5194/acp-12-8911-2012, 2012.
Zheng, M.: Impacts of COVID-19 on Black Carbon in Two Representative Regions in China: Insights Based on Online Measurement in Beijing and Tibet, Geophys. Res. Lett., 48, 1–11, https://doi.org/10.1029/2021GL092770, 2021.