the Creative Commons Attribution 4.0 License.
the Creative Commons Attribution 4.0 License.
 | 20 Sep 2023
High potential for CH4 emission mitigation from oil infrastructure in one of EU's major production regions
Foteini Stavropoulou
Katarina Vinković
Bert Kers
Marcel de Vries
Steven van Heuven
Piotr Korbeń
Martina Schmidt
Julia Wietzel
Pawel Jagoda
Jaroslav M. Necki
Jakub Bartyzel
Hossein Maazallahi
Malika Menoud
Carina van der Veen
Sylvia Walter
Béla Tuzson
Jonas Ravelid
Randulph Paulo Morales
Lukas Emmenegger
Dominik Brunner
Michael Steiner
Arjan Hensen
Ilona Velzeboer
Pim van den Bulk
Hugo Denier van der Gon
Antonio Delre
Maklawe Essonanawe Edjabou
Charlotte Scheutz
Marius Corbu
Sebastian Iancu
Denisa Moaca
Alin Scarlat
Alexandru Tudor
Ioana Vizireanu
Andreea Calcan
Magdalena Ardelean
Sorin Ghemulet
Alexandru Pana
Aurel Constantinescu
Lucian Cusa
Alexandru Nica
Calin Baciu
Cristian Pop
Andrei Radovici
Alexandru Mereuta
Horatiu Stefanie
Alexandru Dandocsi
Bas Hermans
Stefan Schwietzke
Daniel Zavala-Araiza
Ambitious methane (CH4) emission mitigation represents one of the most effective opportunities to slow the rate of global warming over the next decades. The oil and gas (O&G) sector is a significant source of methane emissions, with technically feasible and cost-effective emission mitigation options. Romania, a key O&G producer within the EU, with the second highest reported annual CH4 emissions from the energy sector in the year 2020 (Greenhouse Gas Inventory Data - Comparison by Category, 2022), can play an important role towards the EU's emission reduction targets. In this study, we quantify CH4 emissions from onshore oil production sites in Romania at source and facility level using a combination of ground- and drone-based measurement techniques. Measured emissions were characterized by heavily skewed distributions, with 10 % of the sites accounting for more than 70 % of total emissions. Integrating the results from all site-level quantifications with different approaches, we derive a central estimate of 5.4 kg h−1 per site of CH4 (3.6 %–8.4 %, 95 % confidence interval) for oil production sites. This estimate represents the third highest when compared to measurement-based estimates of similar facilities from other production regions. Based on our results, we estimate a total of 120 kt CH4 yr−1 (range: 79–180 kt yr−1) from oil production sites in our studied areas in Romania. This is approximately 2.5 times higher than the reported emissions from the entire Romanian oil production sector for 2020. Based on the source-level characterization, up to three-quarters of the detected emissions from oil production sites are related to operational venting. Our results suggest that O&G production infrastructure in Romania holds a massive mitigation potential, specifically by implementing measures to capture the gas and minimize operational venting and leaks.
- Article
(2772 KB) - Full-text XML
-
Supplement
(1334 KB) - BibTeX
- EndNote


CH4, a potent greenhouse gas, is more effective at trapping radiation than CO2 but has a shorter lifetime. CH4 is responsible for at least 25 % of current global warming (Ocko et al., 2021; Szopa et al., 2021). A 45 % reduction in anthropogenic CH4 emissions by 2030 would avoid 0.25 ∘C in global warming by mid-century (Ocko et al., 2021), increasing the feasibility of achieving the Paris Agreement goal.
CH4 is emitted from a variety of anthropogenic and natural sources. Anthropogenic sources account for 50 %–65 % of total CH4 emissions (Saunois et al., 2020), with approximately one-third of global anthropogenic CH4 emissions originating from the fossil fuel sector (i.e., emissions from extraction, transport, and processing of coal, oil, and natural gas) (IEA, 2022). Although it is important to tackle all sources of CH4, emission reductions in the oil and gas (O&G) sector are considered attractive, no-regret solutions. The International Energy Agency (IEA) estimates that 75 % of emission reductions from the energy sector can be achieved at no net monetary cost and could even result in economic savings, given that CH4 is the main component of natural gas and has commercial value (IEA, 2022). Thus, reducing CH4 emissions from O&G operations is one of the most substantial, easily accessible, and affordable mitigation actions governments can take to address climate change.
Recent measurement-based studies in O&G production regions, mostly in North America, have consistently shown that across years, scales, and methods, estimates of O&G CH4 emissions often exceed emission inventory estimates (Zavala-Araiza et al., 2015; Shen et al., 2021; Gorchov Negron et al., 2020; Robertson et al., 2020; Alvarez et al., 2018; Tyner and Johnson, 2021; MacKay et al., 2021) with a few exceptions (e.g., Yacovitch et al., 2018; Foulds et al., 2022). Inventory estimates tend to be based on outdated generic emission factors, which may not reflect actual technologies and practices. Also, counts and location of facilities and equipment used in inventories may be inaccurate or incomplete. Lastly, current inventories do not capture the statistical characteristics of emission distributions that are found across the O&G supply chain, which are usually heavy tailed and positively skewed (Alvarez et al., 2018; Zavala-Araiza et al., 2017).
Romania is one of the oldest O&G producers in Europe with the first exploration dating back to 1857. In 2021, Romania was the second largest oil producer and natural gas producer in the EU (BP, 2022). The recent gas discoveries in the Black Sea have the potential to hold significant natural gas reserves, presenting an opportunity for the country to enter a new phase of development. The EU announced an ambitious plan to urgently tackle CH4 emissions across all sectors by 2030 under the EU methane strategy (European Commission, 2020). Underpinning this strategy, the EU recently announced draft regulations for the oil and gas sector, focusing on robust measurement reporting and verification and leak detection and repair, as well as minimizing venting and flaring (European Commission, 2021). In the case of Romania, the uncertainty in current emission estimates and the lack of empirical data make the implementation of methane mitigation strategies challenging.
The Romanian Methane Emissions from Oil and Gas (ROMEO) project aimed to address this gap in knowledge (Röckmann and the The ROMEO team, 2020). From 30 September to 20 October 2019, a measurement campaign took place in southern Romania with up to 70 participants from 14 research institutes. The goal of this project was to characterize CH4 emissions at a component, facility, and basin scale using a variety of measurement platforms, e.g., vehicles, uncrewed aerial vehicles (UAVs or commonly referred to as drones), and crewed aircraft. Through the use of a range of emission quantification methods, the ROMEO campaign aimed to provide a comprehensive quantification of CH4 emissions related to onshore O&G production in Romania.
In this paper we analyze, integrate, and synthesize CH4 emission estimates collected by vehicles and UAVs during the ROMEO campaign, mainly focused on the characterization of oil production sites. We (i) provide a comprehensive overview of the aggregated ground- and drone-based CH4 emission data, (ii) characterize the emission distributions and discuss the differences between the quantification methods, (iii) present estimated emission factors derived from the ground- and drone-based measurements, (iv) identify major equipment components of detected emissions across the O&G production sector, and (v) compare these results to CH4 emissions from emission inventories and production sites across other regions.
2.1 Investigated area
The 2019 ROMEO campaign covered the southern part of Romania around the cities of Bucharest, Ploieşti, Piteşti, Târgovişte, and Craiova. Figure 1 shows that the O&G production infrastructure is concentrated in smaller clusters that cover areas between 2 and 120 km2, each containing 10 to 582 oil- and gas-related sites such as oil wells, gas wells, compressor stations, and oil parks. Different measurement teams visited different sites and clusters in order to quantify as many O&G production sites as possible and to avoid a spatial sampling bias. We note that most of the measurements presented here were individually described and discussed in Delre et al. (2022) and Korbeń et al. (2022). Here we add the measurements carried out from uncrewed aerial vehicle (UAV) platforms and integrate all ground- and drone-based data to upscale emissions to the national scale.
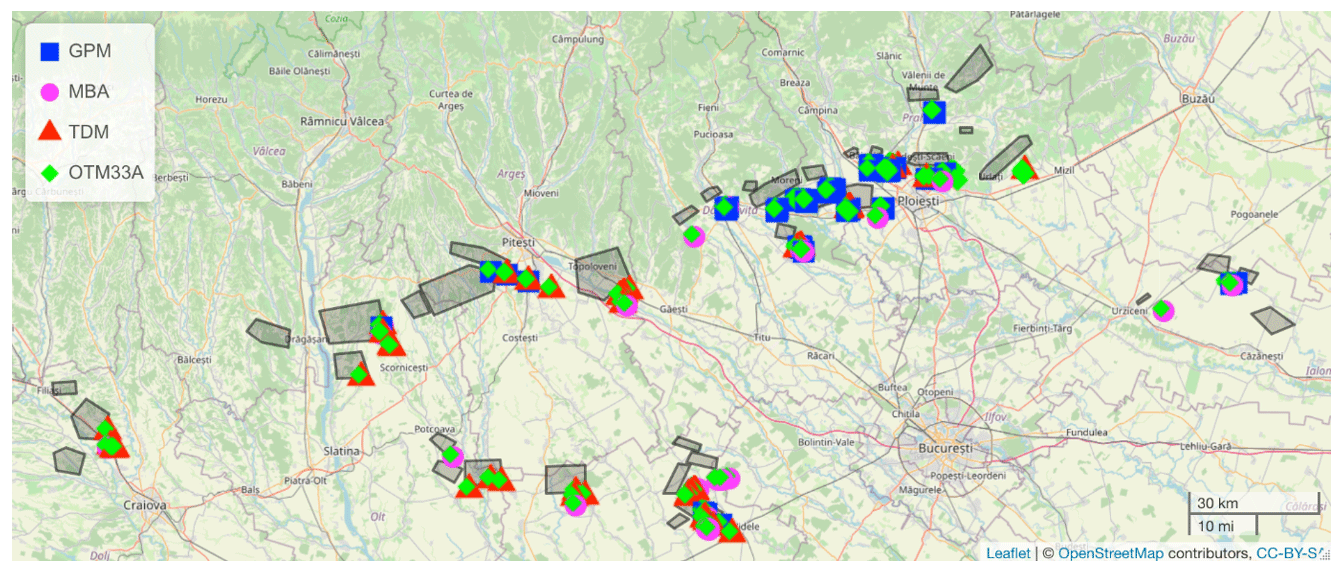
Figure 1Map of the oil production sites that were quantified with four different measurement approaches during the ROMEO campaign. The different symbols distinguish the different quantification methods. Blue squares: Gaussian plume method (GPM); pink circles: mass balance approach (MBA); red triangles: tracer dispersion method (TDM); green diamonds: Other Test Method 33A (OTM-33A). The grey shaded areas indicate clusters with a high density of production facilities (number of facilities ranging between 10 to 582), and in some cases the symbols hide the areas.
The largest operator of O&G infrastructure in southern Romania, OMV Petrom, provided a list of production infrastructure coordinates and auxiliary information, such as type of equipment, age, and for selected sites also production rate. Using this information, we assessed the representativeness of our sampled sites in terms of production and age characteristics (see Sect. S13 of Supplement). A few additional emission points were found that were not included in the infrastructure list provided by the operator. In these cases, the site type was assigned based on visual inspection; in some cases, it could not be identified. In our analysis we will combine the quantifications from all regions.
The majority of Romania's oil reservoirs are located in the southern part of the country. With Romania producing about 3.3×10⁶ t of oil in 2021 (BP, 2022), the southern region is the most important part of the country's oil production sector. Most measurements during the ROMEO campaign were collected from oil production sites; hence our analysis will focus on this specific subset of sites. The oil production sites included in the study were usually relatively simple, consisting of pump jacks and additional production equipment.
2.2 Emission quantification
Facility-scale measurements were divided into two phases: screening and quantification. During the screening phase, the vehicles drove from site to site, circling the target site if possible and recording CH4 mole fractions above background. Screenings were performed from public roads, and the goal was to identify potential emissions at the site and check site accessibility, considering factors such as road condition, time limitations, and local restrictions imposed by operators. To prevent any potential bias in the measured emissions, the operators were not informed in advance about our visit to the facility, resulting in occasional restricted site access. Additionally, the screenings aimed to determine whether off-site sources such as other O&G infrastructure and farms could interfere with subsequent emission quantification, thereby ensuring the proper implementation of the quantification methods. Also, a simplified Gaussian plume algorithm was applied for all locations where mole fraction enhancements were observed to locate the sources based on the list of production infrastructure provided by the operator and to determine normalized CH4 enhancements (see Sect. S10). A total of 1043 sites were screened using five cars. A total of 85 % of these sites were oil production sites, and we focus on these for the following evaluation.
For quantification of CH4 emission rates, four methods were used, namely the tracer dispersion method (TDM), Other Test Method 33A (OTM-33A), Gaussian plume modeling (GPM) using plume measurements from vehicles, and a mass balance method (MBA) using uncrewed aerial vehicle (UAV)-based measurements (see Table S1). Here we provide a brief description of each measurement method. Delre et al. (2022) provide additional information on the deployment of TDM and GPM during the ROMEO campaign, while Korbeń et al. (2022) offer details specifically on the deployment of OTM-33A and GPM.
The tracer gas dispersion method (TDM) or tracer release method (Lamb et al., 1995) has been widely used to quantify CH4 emissions in the O&G sector (Allen et al., 2013; Zavala-Araiza et al., 2018; Yacovitch et al., 2017; Roscioli et al., 2015). TDM involves the release of a tracer gas at a controlled rate. When the tracer gas is released close to an emission point of the target gas (CH4), both gases undergo the same atmospheric transport processes. Therefore, even when the plume dilutes, the ratio of their observed enhancements remains the same as the ratio of their emission rates. Atmospheric concentrations of both the target gas and the tracer gas can then be measured downwind to determine the unknown emission rate of the target gas (CH4). In this study, acetylene (C2H2) and nitrous oxide (N2O) were used as tracer gases.
Two vehicles equipped with laser gas analyzers were used to quantify CH4 emissions with the TDM. The first vehicle was equipped with two cavity ring-down spectroscopy analyzers. One instrument measured CH4 (G2401, Picarro, Inc., Santa Clara, CA), and the other one measured acetylene (C2H2) and nitrous oxide (N2O) (S/N JADS2001, Picarro, Inc., Santa Clara, CA). The second vehicle used a dual laser trace gas monitor based on tunable infrared laser direct absorption spectroscopy to detect CH4, C2H6, N2O, CO2, and CO simultaneously (Aerodyne Research Inc., Billerica, MA). Measurements of CH4 and tracer gas concentrations were carried out by performing on average nine downwind plume traverses. The site-representative methane emission rate was then calculated by averaging the emission rates estimated from the multiple traverses across the plume. A total of 50 quantifications were performed at different sites using mobile and, in a few cases, static TDM.
The Gaussian plume method (GPM) uses an idealized calculation for the average local-scale CH4 dispersion, assuming constant meteorological conditions in time and space over a flat region, to derive emission rate estimates from plume observations (Hanna et al., 1982). The emission rate can then be calculated from measurements downwind of a source using information about the height of the source, wind speed, and wind dispersion parameters (Riddick et al., 2017). During the ROMEO campaign, multiple car transects were carried out downwind from the source at locations suitable for GPM. The emission rate for each location was estimated based on the comparison between the results of the actual measured concentrations and the results of the GPM. A total of 111 measurements were performed at a variety of sites using GPM. GPM subsets from ROMEO have been investigated in Delre et al. (2022) and Korbeń et al. (2022). In our analysis, we combine the GPM evaluation from the different teams into one subset of emission quantifications.
Delre et al. (2022) compared emission rates derived from TDM and GPM evaluation methods at 41 O&G sites. They found lower estimates from GPM evaluations compared to TDM and applied a correction of a factor of 2 or more to the GPM quantifications (Delre et al., 2022). We do not apply a correction to GPM measurements as done in Delre et al. (2022), since a comparison to TDM is not possible for the other measurement teams (Korbeń et al., 2022). Including the correction would lead to higher emission rate estimates. We also use a different (parametric) statistical evaluation as described below.
Other Test Method 33A (OTM-33A) is one of the geospatial measurement of air pollution remote emission quantification (GMAP-REQ) approaches developed by the United States Environmental Protection Agency (EPA) (Thoma and Squier, 2014). This method uses measurements with stationary analyzers to detect and quantify emissions from a variety of sources located near-field and at ground level (Robertson et al., 2020). Measurements were performed by two vehicles equipped with in situ CH4 analyzers. The first vehicle was equipped with a high-precision optical feedback cavity-enhanced absorption spectroscopy analyzer (Li-7810, LI-COR, Inc.) and detected CH4 and CO2 concentrations in ambient air. The second vehicle was equipped with a cavity ring-down spectrometer (CRDS, model G1301, Picarro Inc.). A total of 77 quantifications were performed at different sites using OTM-33A.
The mass balance approach (MBA) has been applied widely to aircraft-based measurements of CH4 and other trace gases from the facility scale up to the basin scale (Karion et al., 2013; O'Shea et al., 2014; Baray et al., 2018; Pitt et al., 2019). This method involves flying at multiple heights downwind of and/or around a region containing a possible emitting source and measuring trace gas concentration and wind speed. Emission rates of the net surface flux within that volume are then estimated from the difference between downwind and upwind measurements (Morales et al., 2022).
Uncrewed aerial vehicles (UAVs) are an emerging platform to investigate CH4 emissions from various sources such as landfills, dairy farms, and natural gas compressor stations (Allen et al., 2019; Vinković et al., 2022; Nathan et al., 2015; Andersen et al., 2018; Morales et al., 2022; Shah et al., 2020; Shi et al., 2022). UAVs allow transecting the plume over its entire vertical and horizontal extent by flying at numerous heights, compared to ground-based measurements that typically capture only part of the plume only at one height (Andersen et al., 2018). Two different UAV-based systems were used to obtain atmospheric mole fraction measurements downwind of oil and gas facilities during ROMEO: (i) an active AirCore system from the University of Groningen (UG) (Vinković et al., 2022) and (ii) a lightweight fast-response quantum cascade laser absorption spectrometer (QCLAS) developed at the Swiss Federal Institute for Materials Science and Technology (EMPA) (Tuzson et al., 2020; Morales et al., 2022). A total of 125 flights (65 UG; 60 EMPA) were performed downwind of 43 different facilities (19 UG; 24 EMPA). Both UAV-based techniques use an MBA to quantify the emission rates from sampled oil and gas facilities, but there are certain differences in the MBA between UG and EMPA applications, including factors such as the treatment of wind, which are presented in the Supplement.
Several studies of CH4 emissions from O&G infrastructure have found that emission distributions are typically heavy tailed and positively skewed with a small fraction of sites (i.e., super-emitters) accounting for a disproportionate fraction of emissions. These distributions often become symmetric and normal when plotted as the logarithm of emissions. To account for this behavior, lognormal distributions have been widely used in the literature to more accurately characterize emissions (Alvarez et al., 2018; Zavala-Araiza et al., 2015, 2017, 2018; Robertson et al., 2020; Omara et al., 2016; Brandt et al., 2016; Yacovitch et al., 2017). We examine whether our sampled data with emissions from oil production sites follow a lognormal distribution by using two statistical tests (see Sect. S3). Table S2 shows that the null hypothesis of lognormality is accepted by both the Shapiro–Wilk and Lilliefors tests for all four measurement methods.
Several studies have evaluated site-level measurements from the O&G infrastructure using non-parametric bootstrapping methods to derive emission factors (Rella et al., 2015; Brantley et al., 2014; Robertson et al., 2017; Omara et al., 2016; Riddick et al., 2019). The previous publications that evaluated subsets of the measurements reported here (Delre et al., 2022; Korbeń et al., 2022) also used non-parametric approaches to estimate emission factors for a systematic literature comparison. Non-parametric approaches typically derive emission factors (EFs) significantly lower than the ones using parametric approaches. The parametric approaches take into account the skewed distribution of the emission rates, particularly the disproportionate contribution of emissions from the heavy tail of emission distributions. In particular, they include the possibility that in the full distribution of sites, emission rates exist which are above the maximum of the sampled subset. Therefore, parametric approaches and lognormal fits have been used for upscaling (Alvarez et al., 2018; Zavala-Araiza et al., 2015; Robertson et al., 2020). As the emission distribution in this work is highly positively skewed (see below), we apply the parametric approach for scaling up to the total population of oil production sites in Romania.
To this end, we calculate probability density functions (pdfs) of measured emission rates that follow a lognormal distribution using maximum likelihood estimation (MLE) (Zavala-Araiza et al., 2015, 2018; Alvarez et al., 2018; Robertson et al., 2020). These pdfs are then used to derive representative site-level EFs which consider the low probability of high-emitting sites that describe skewed distributions. The mathematical formalism of this statistical estimator is described in Sect. S4, and we refer to this approach as our reference method (A1).
The implementation of the lognormal fits requires information about the detection limit of each method and the number of sites with emissions below this value (referred to as non-detects). However, even when using the same analytical platform to measure emissions, the lowest detectable emission rate will be affected by the distance between the emission point and the analyzer and by the meteorological conditions for a given measurement (Delre et al., 2017). For our analysis, the detection limit for OTM-33A, GPM, and MBA was empirically determined to be equal to 0.11 kg h−1 and for TDM equal to 0.07 kg h−1. Delre et al. (2022) and Korbeń et al. (2022) determined the fraction of sites with emission rates below these detection limits as 27 % for TDM and 35 % for OTM-33A and GPM; the latter value is also adopted for MBA.
On the component scale, the combination of an optical gas imaging (OGI) camera for the detection of potential leak sources and a hi-flow sampler (HFS) device for the quantification of the emissions was implemented. A total number of 181 sites including 155 oil production sites were visited and screened with a forward-looking infrared (FLIR) GasFindIR infrared camera, the majority of them from the fence line. A total of 231 individual leaks were detected with the OGI camera, but because of limited site access, the emission rates of only 62 leaking components were measured using the HFS method. IR videos of the leaking components were recorded to document detected emissions. These videos were reviewed to verify the number of emission points and identify the type of emitting equipment.
From the OGI surveys we determined that a small but significant fraction of sites had no emissions. While these surveys could potentially miss sources of emissions since they were performed from the fence line (vs. on-site), it allows us to derive a more conservative site-level estimate, where we only add one-third of the non-detects to the main distribution of emitters. The other two-thirds of the non-detects are considered a separate mode of non-emitters with an EF of 0. These sites will also not be considered in the upscaling (see below). The final parameters that are considered for the determination of the emission rate are provided in Table 2. A detailed discussion on the determination of non-detects and the detection limits of the different techniques is provided in Sect. S5. The effect of the fraction of non-detects and the detection limit on the lognormal fits and the final EFs is further explored by testing several different values (Sect. S5). We find that reducing the detection limit or increasing the fraction of non-detects leads to higher estimated EFs due to the widening of the distribution towards the lower end. This emphasizes the importance and need of conducting a thorough investigation when selecting the values for these two parameters.
Additionally, in Sect. S7 we present a sensitivity analysis with alternative upscaling approaches to explore upper and lower limits of the EF estimate for oil production sites. The main differences between these approaches are the choice of the detection limit and fraction of non-detects, the separation of the data into west and east regions, and the separation by measurement method.
The combination of site-level emission estimates and component-level OGI surveys provided insights into the magnitude of emissions from oil production sites as well as key mitigation opportunities.
3.1 Site-level quantifications of oil production sites
Approximately 887 oil production sites were screened, and emission rates were quantified from a total of 178 oil production sites. Table 1 provides basic statistics of the results obtained with the different measurement methods. The difference between the arithmetic mean and median estimates and the high positive values of skewness and kurtosis parameters demonstrate that the emission rates were positively skewed with a heavy tail for all methods. We find that the OTM-33A and GPM show the highest values of skewness and kurtosis, whereas the TDM and MBA present the least skewed and heavy-tailed distributions. Figure 2 illustrates the boxplots of the distributions of the quantified emission rates per method. It is important to note that the sampled oil production sites are different for each method (and sampled at different points in time); thus Fig. 2 summarizes the sampled emission distributions, and the observed differences in Fig. 2 may be influenced by factors such as variations in emission magnitude and variability at each specific oil production site.
Table 1Basic statistics of measured CH4 emission rates by method.
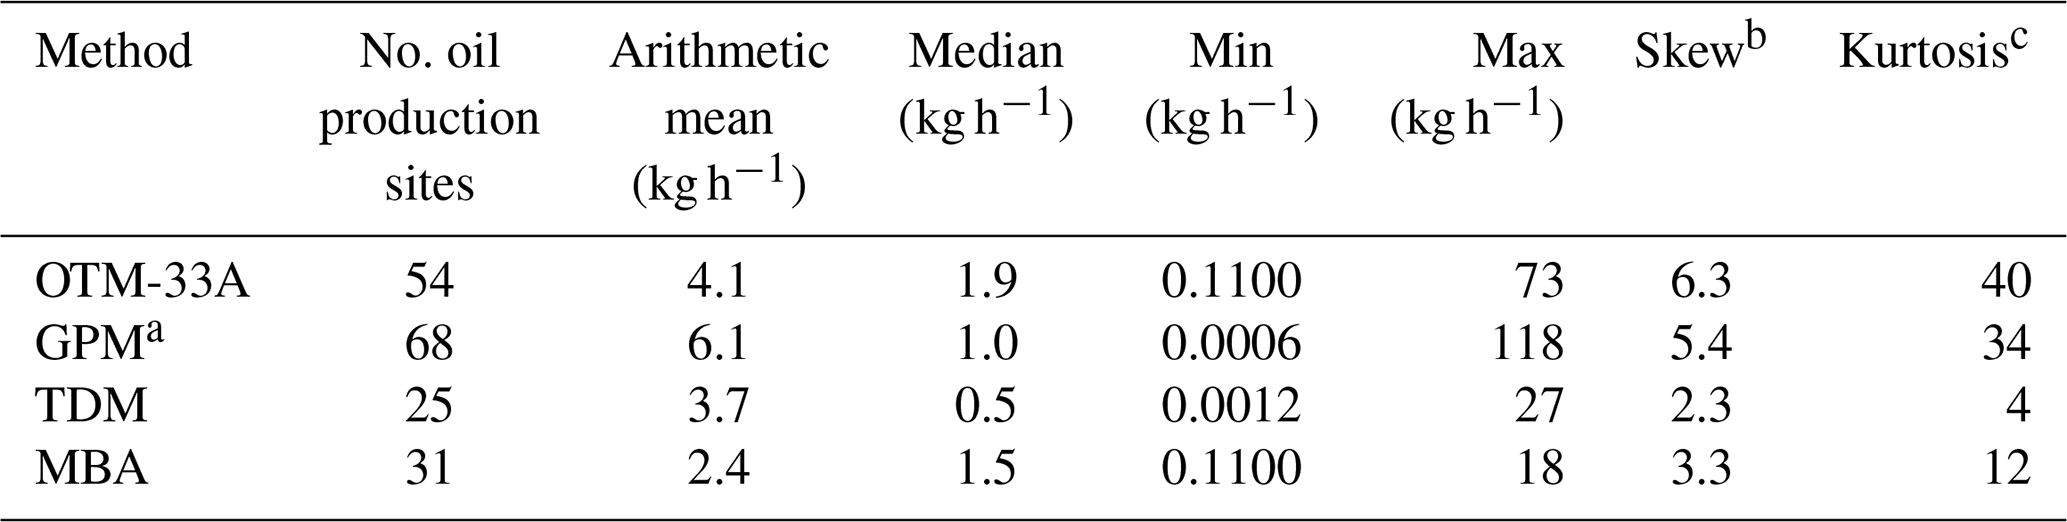
a Including the oil production sites evaluated as “Estimate” in Delre et al. (2022) using only one concentration record (see Sect. S2: “Gaussian Plume Method”). b Skewness is a measure of the asymmetry of a data distribution. Skewness of zero represents a normal distribution. Positive (negative) values indicate that the data is positively (negatively) skewed. c Kurtosis is a measure indicating whether the data distribution is heavy tailed or light tailed relative to a normal distribution. Kurtosis of zero represents a normal distribution. Positive (negative) kurtosis indicates a heavy-tailed (light-tailed) distribution.
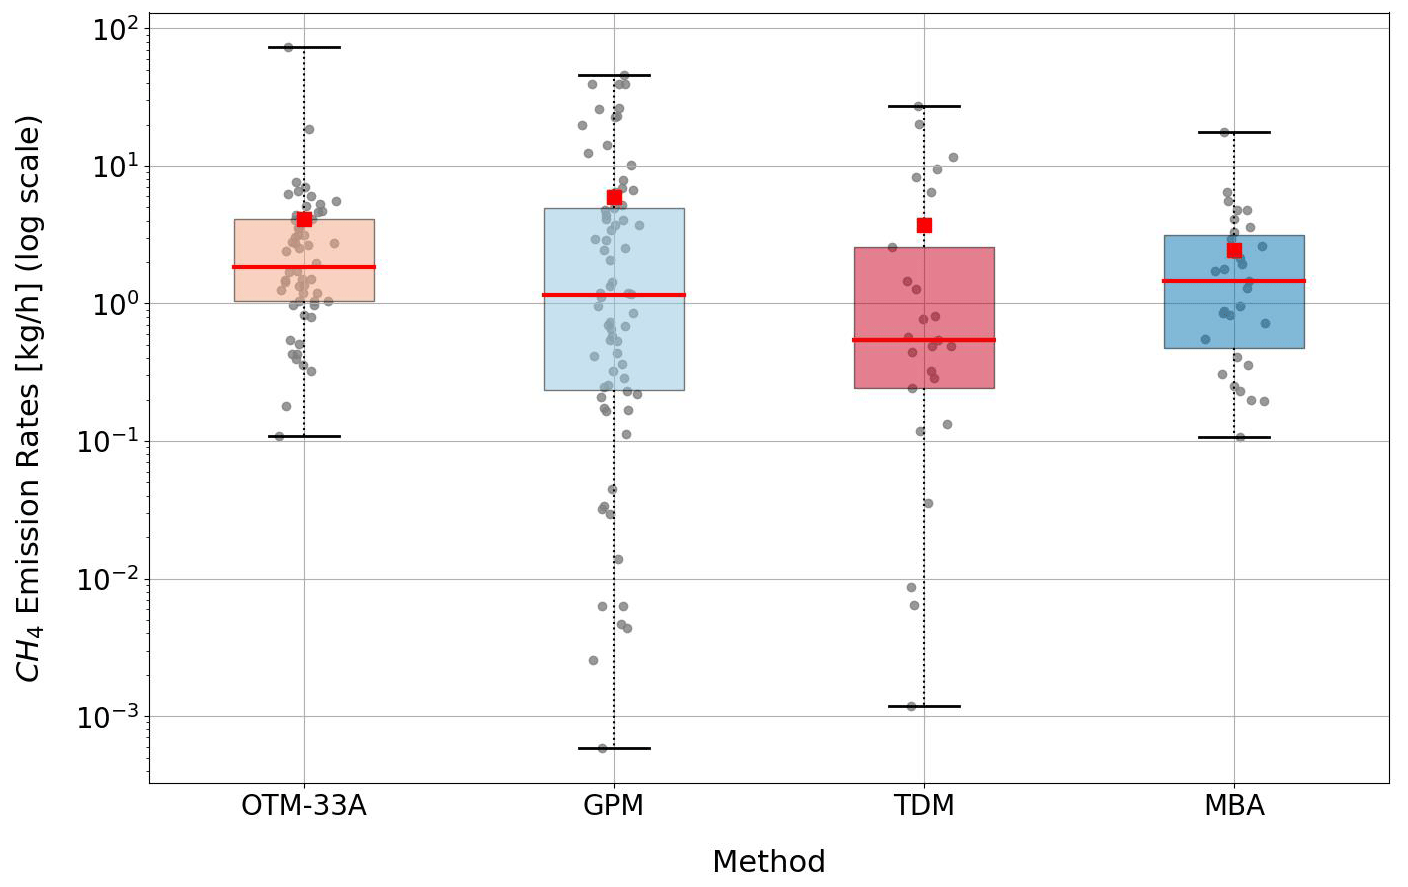
Figure 2Boxplots of the distributions of quantified emission rates from oil production sites per method. In each box the red horizontal line signifies the median, and the red squares show the mean. The box extends to the 25th and 75th percentiles. The whiskers extend from the minimum to the maximum value. The data points are overlaid on top of the boxplots (grey dots). Note the logarithmic y axis.
3.2 Emission distributions and emission factors
Figure 3 shows the pdfs generated from fitting the quantified emission rates to lognormal distributions. In Table 2 we summarize key parameters and derived EFs that characterize these distributions. Across methods, best estimates for EFs range from 2.9 to 8.8 kg h−1 of CH4 per site. The pdf of GPM shows the widest distribution and a large confidence interval (CI). The effect of the small sample size is reflected in the large 95 % CI of TDM relative to the other methods. When we combine all the quantifications (solving for one single maximum likelihood estimation; see the Supplement), we obtain a central estimate of mean site-level emissions equal to 5.4 kg h−1 of CH4 per site (3.6 %–8.4 %, 95 % CI). For information, histograms and fitted pdfs for each method used are shown in Fig. S7 in the Supplement.
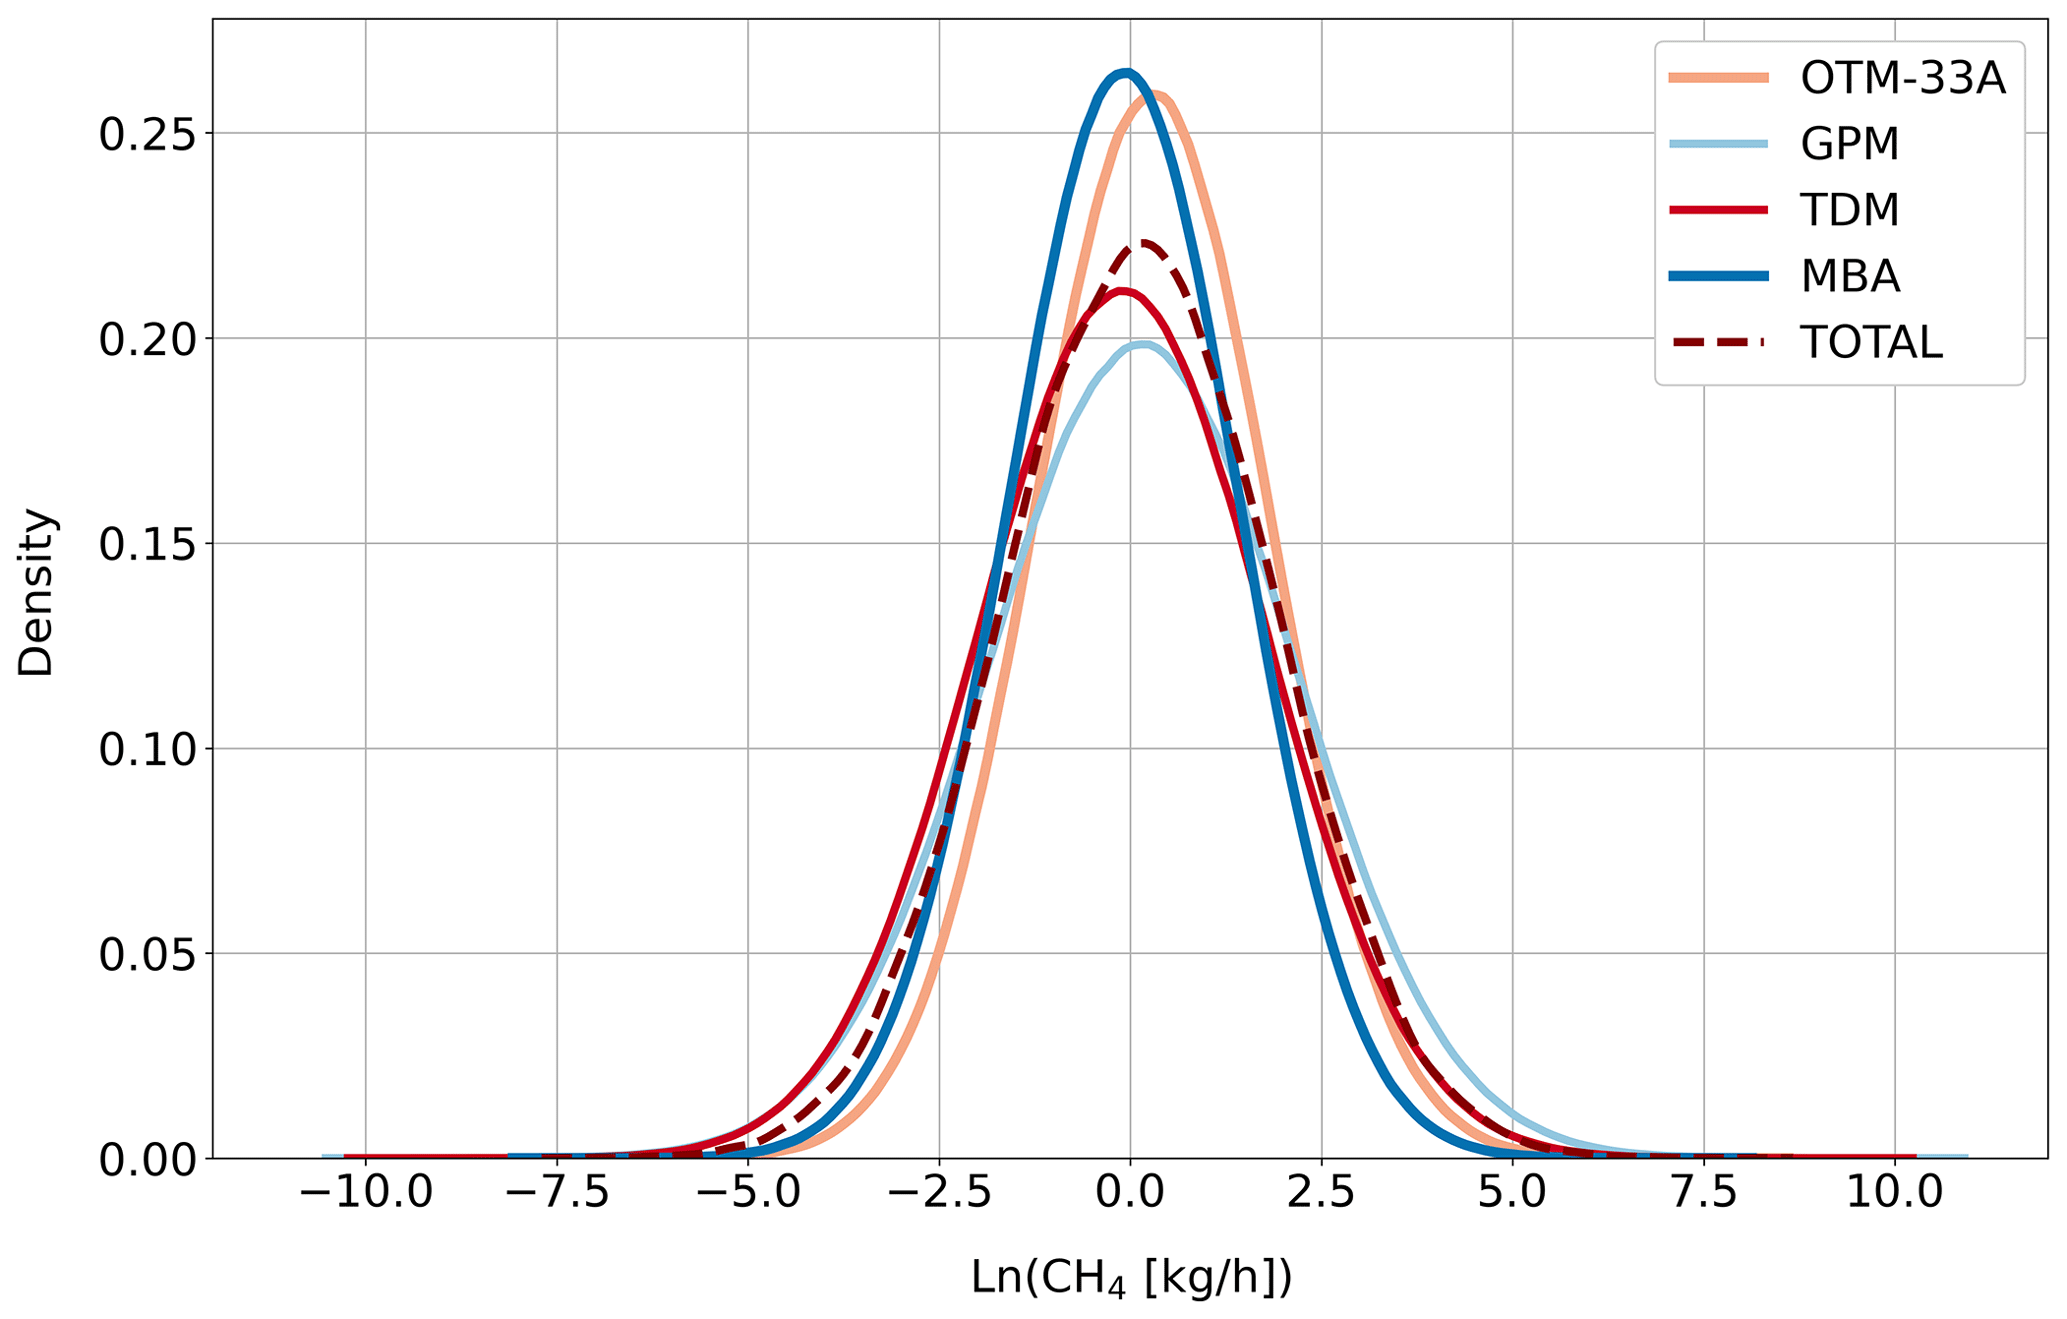
Table 2Summary of parameters from the statistical estimator.
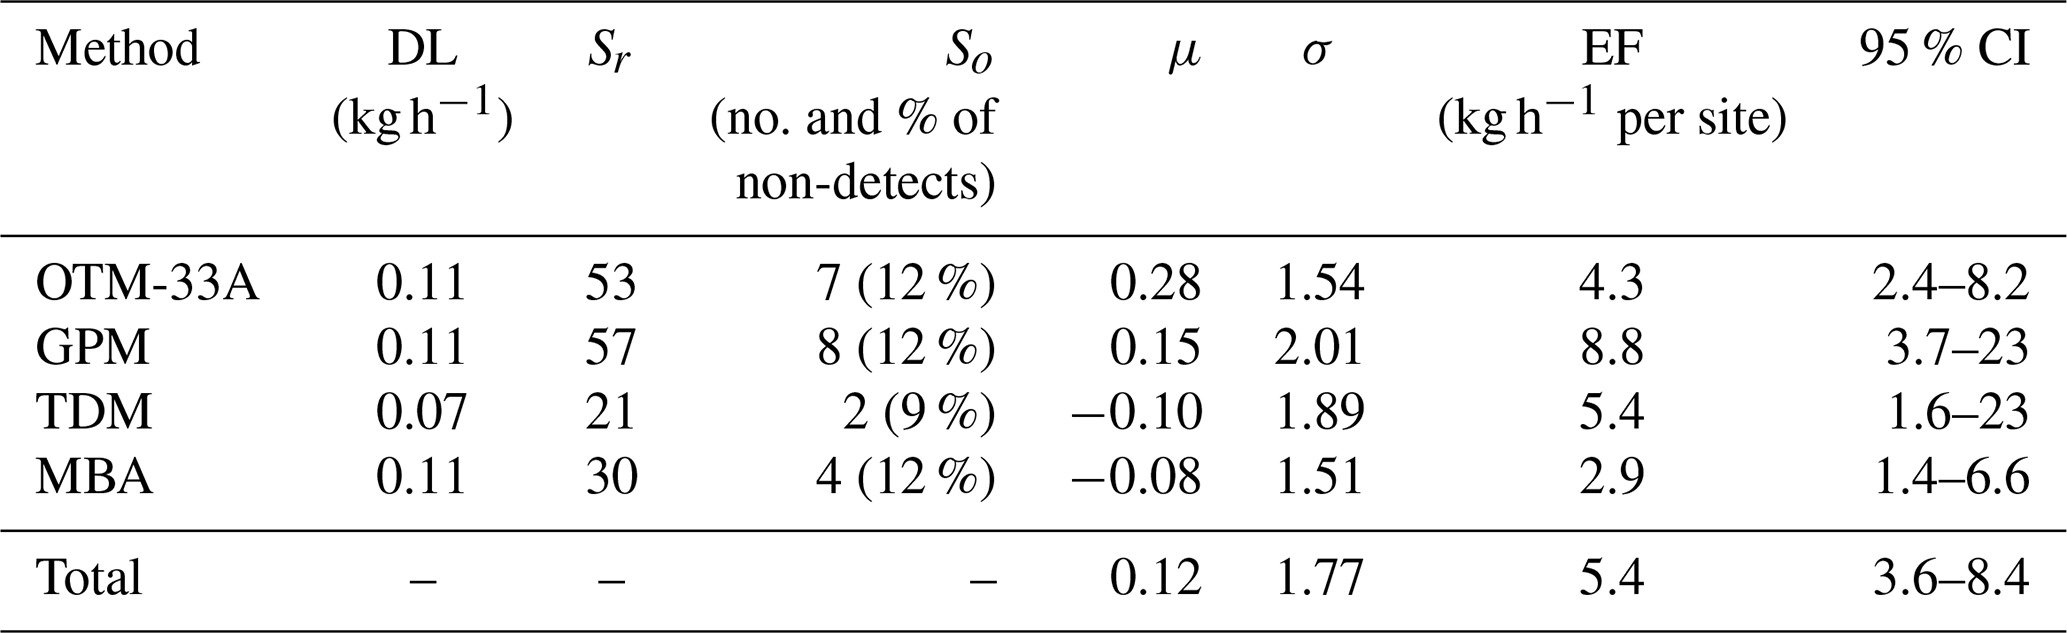
DL is the assigned detection limit for each measurement method, Sr is the number of measurements above the detection limit, and So is the number of measurements at or below the detection limit (included as censored data). Note that in actual measurements even emission rates below this limit are sometimes detected (see Fig. 2). In our statistical approach these measurements are replaced by the fraction of non-detects So. Therefore, the numbers for Sr are different from the total number of oil production sites visited given in Table 1. EF is the emission factor estimated as , and “total” presents the results of the statistical estimator considering all four measurement methods.
The cumulative distribution functions and Lorenz curves from all measurement methods using the statistical estimator (Fig. 4) verify once more that the distributions are highly skewed. For the quantified population of oil production sites, we find that 10 % of emitters had emissions greater than 10 kg h−1 and were responsible for over 70 % of total emissions. The estimates from the different methods reflect the qualitative illustration in Fig. 3: the results obtained with GPM show the most skewed distribution, with the 10 % of the oil production sites with the highest emissions contributing 77 % of total emissions, whereas for the oil production sites measured with the MBA, 60 % of cumulative CH4 emissions are attributed to 10 % of oil production sites.
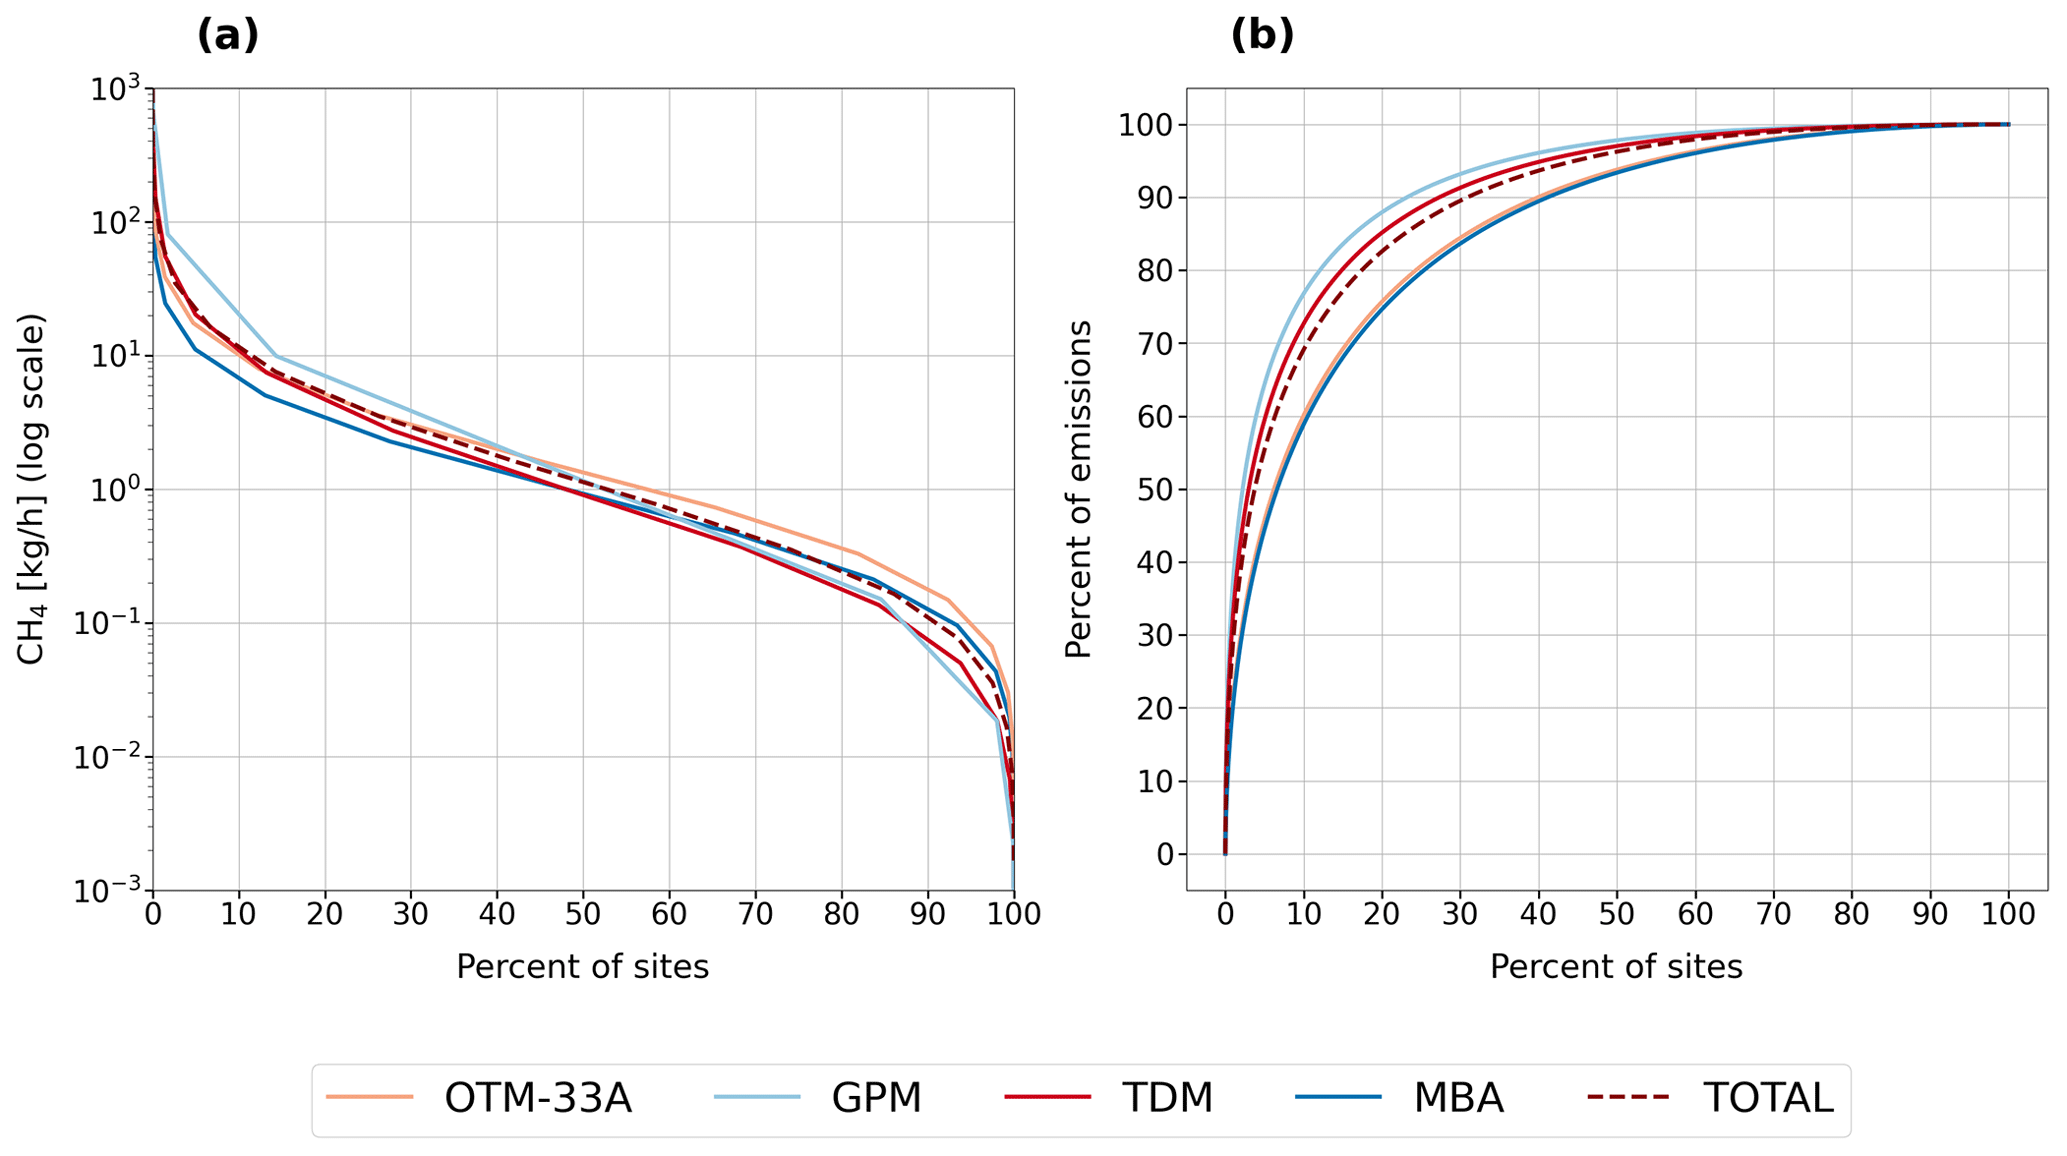
Figure 4(a) Cumulative distribution functions, (b) Lorenz curves: percent of emissions as a function of percent of sites. For both graphs, oil production sites are sorted from high to low emission rates (descending order).
In the Supplement (Sect. S7) we provide additional estimates of the total CH4 basin EFs calculated using modifications of the reference statistical approach in order to explore the sensitivity to the chosen parameters. By using the same reference approach and including a higher fraction of non-detects, ranging between 27 % and 35 %, the derived EF is 53 % higher. Compared to the EF calculated with the reference approach, the EFs calculated using the alternative approaches are between 35 % and 83 % higher. All of these estimates agree within the ranges of uncertainty, confirming that the high EFs are not due to details of the statistical treatment. For comparison of our values to other studies (see below) we use the reference scenario (A1) discussed in the previous sections which is our lowest and most conservative estimate and includes a separate mode of non-emitters (zero mode) and a correspondingly lower fraction of non-detects for the main mode of emitters (9 %–12 %).
3.3 Identification of leaking components
By using the recorded videos of the leaking components, emission sources could be attributed to specific major equipment types across the O&G production sector. A total of 155 oil production sites were screened with the infrared camera, corresponding to approximately 3 % of the total population of oil production sites provided by the operator. CH4 emissions were detected from approximately half (49 %) of these sites. At least one leak was detected at 74 out of the 155 screened oil production sites with an average of 1.2 leaks detected per site. A total of 86 individual leaks were identified at the oil production sites. The HFS method was used to measure emissions from a small subset of leaks (i.e., when access to the leaky component was possible), and results are summarized in the Supplement (see Sect. S11) but were not used as part of the main analysis since they do not represent a complete assessment of the magnitude of emissions.
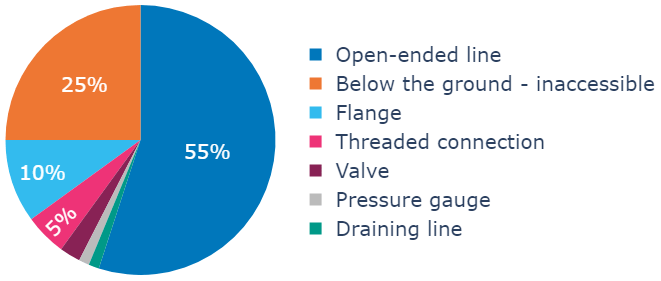
Figure 5 shows the distribution of the identified leaking components for oil production sites. The most frequently detected sources were open-ended lines, accounting for more than half (55 %) of the detected components. An open-ended line refers to a pipe or tubing that is not sealed at one end and therefore remains open to the atmosphere, allowing all gas to be vented to the atmosphere. Following open-ended lines, inaccessible components located below the ground comprised 25 % of the detected sources, while malfunctioning equipment such as flanges and threaded connections accounted for 20 %. It should be noted that the inaccessible and, as a result, non-identified components below the ground may consist of valves, pumps, connectors, or potentially open-ended lines.
3.4 Other types of facilities
In addition to oil production sites, we also visited other types of infrastructure (gas production sites, oil parks, compressor stations, etc.) during the ROMEO campaign. Due to the low number of quantifications for these types of infrastructure, a statistically robust quantitative evaluation is impossible, but we provide here some qualitative information. The largest emission rates were observed from an oil park at 138 kg h−1, while the average emission rate from 17 oil parks was 17 kg h−1. An oil park is a facility designed to gather, store, and distribute oil produced from multiple individual wells in the surrounding area. The most important sources of CH4 emissions from oil parks were leaks in storage tanks and other malfunctioning equipment, such as valves or flanges. We visited two compressor stations and found 58 and 27 leaks, approximately half of which were quickly repaired in 1 d by the technicians from the operator. The complete list of all quantifications is provided in Sect. S14.
To compare our results with the reported emissions from national inventories, we assume that the measured oil production sites in this study are representative of oil production sites basinwide. We scale up our emissions to the country level by using our central estimate of 5.4 kg h−1 per site for the evaluation including a separate mode of non-emitters, as explained above. This leads to an activity factor of N ≈2500 for the year 2019. Assuming that these emissions continue year-round, this results in an annual emission estimate of 120 kt CH4 (min =79 kt and max =180 kt, 95 % CI).
In Fig. 6, our measurement-based estimates are compared to inventory reports. Methane emissions from Romania for the year 2020 reported to the United Nations Framework Convention on Climate Change (UNFCCC) in category 1.B.2.a (CH4 from oil – sub-category i: exploration; sub-category ii: production) and category 1.B.2.c (venting and flaring) sum up to 46 kt of CH4 (Greenhouse Gas Inventory Data - Comparison by Category, 2022). The IEA estimate for Romanian emissions from the categories onshore oil and other from oil and gas for the year 2019 is 23 kt of CH4 (Methane Tracker Data Explorer, 2022). Thus, the emission rates derived in our study are approximately 2.5 times higher than the UNFCCC inventory and more than 5 times higher than the IEA estimate. Note that our reference statistical approach is a conservative one as shown in the sensitivity study in the Supplement. Our estimates also only include producing oil production sites and not even the total population of oil production sites in Romania. Documented emissions from other types of sites, e.g., oil parks with our documented emissions from leaking tanks, and the entire gas production infrastructure were not included. Non-producing oil production sites were also neglected for the derivation of country-level annual emissions, although emissions were still detected from nine oil production sites that were characterized as non-operating by the operator.
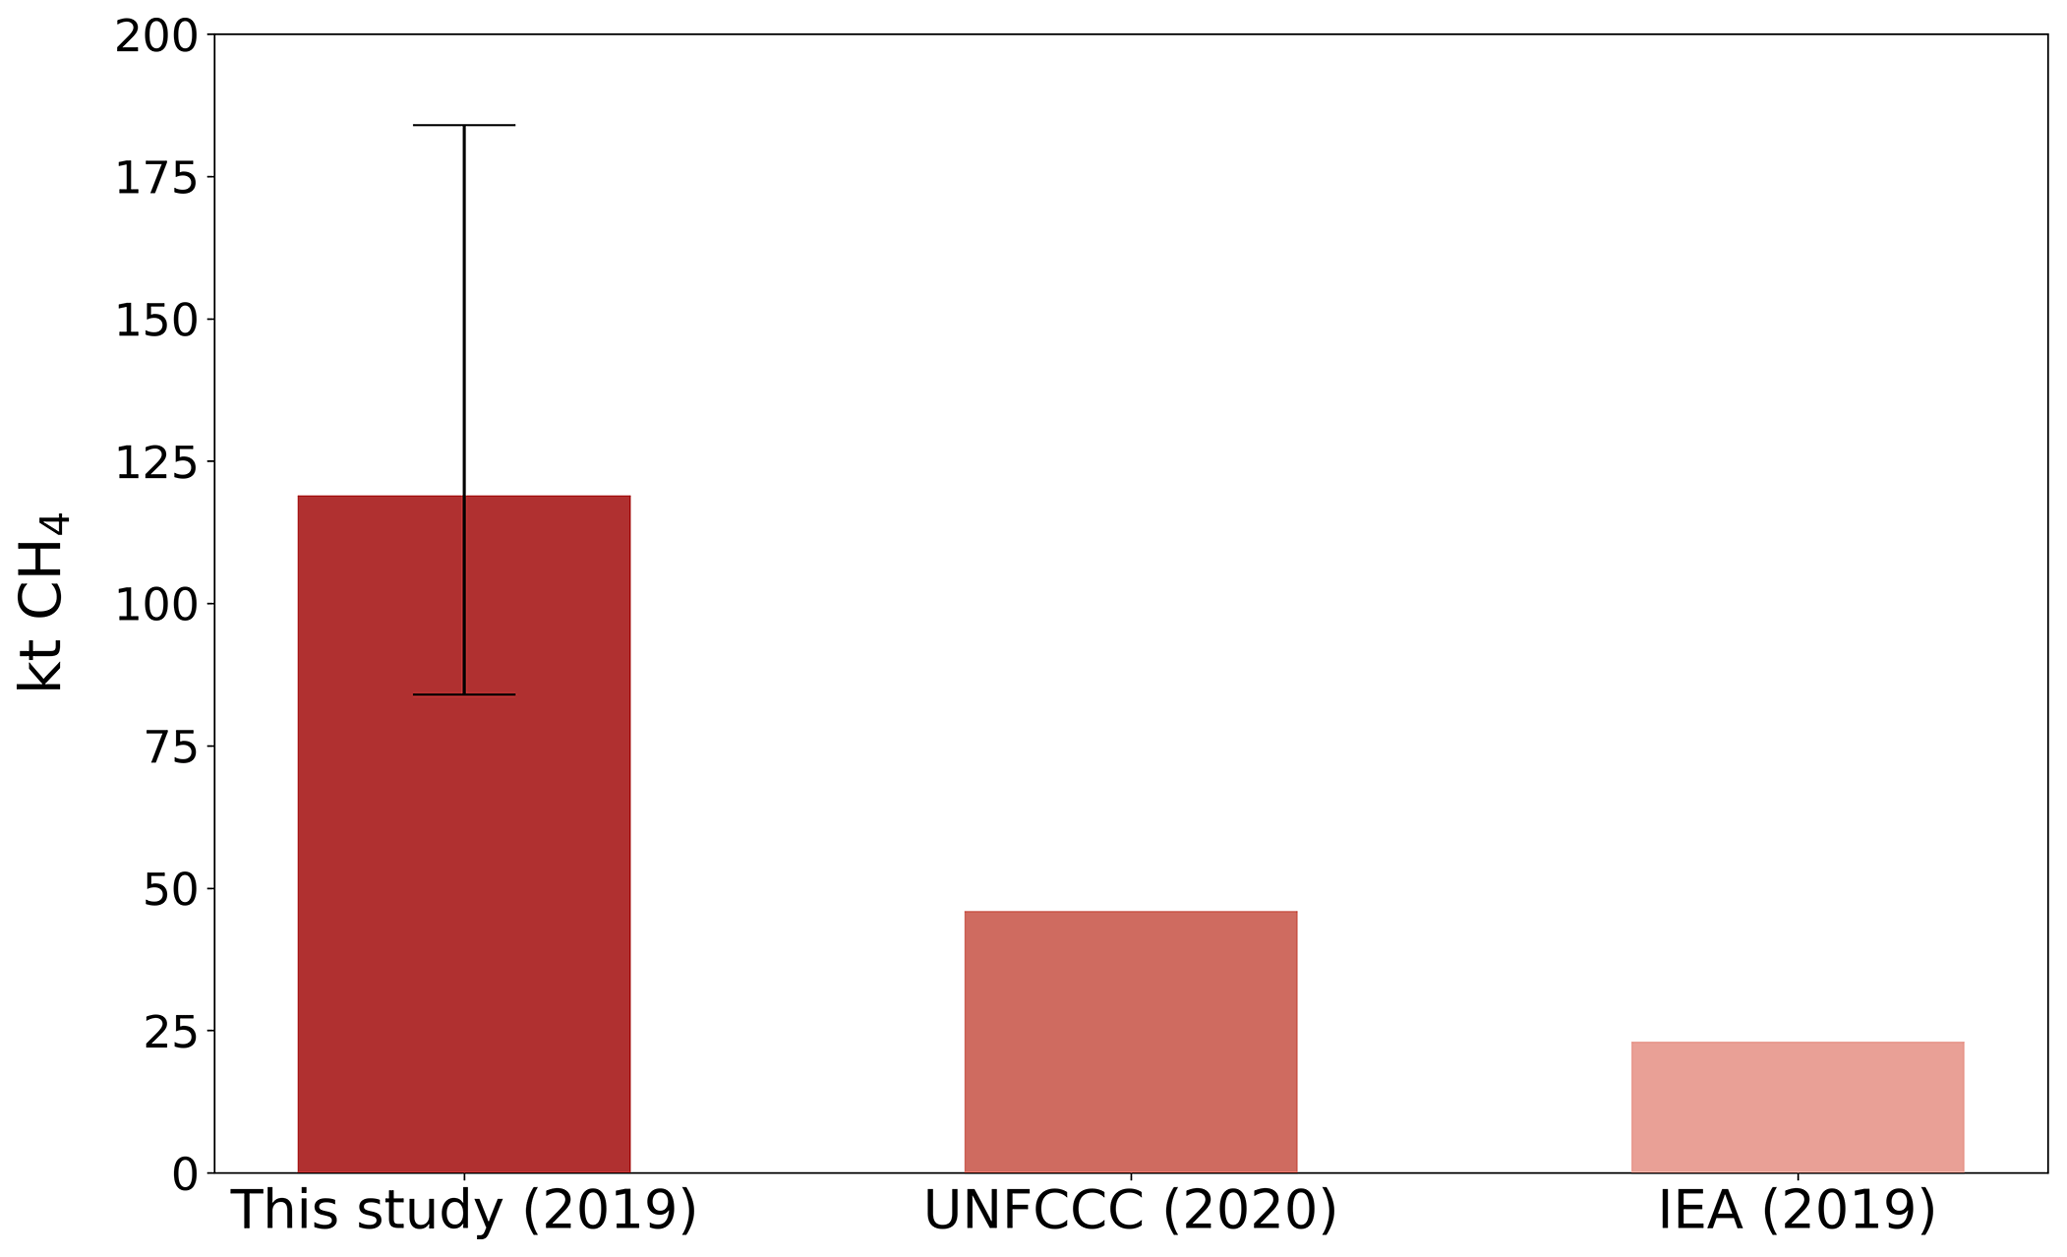
Figure 6Comparison of annual CH4 emissions estimated in our study for 2019 with emissions reported to the UNFCCC in category 1.B.2.a (CH4 from oil – sub-category i: exploration; sub-category ii: production) and category 1.B.2.c (venting and flaring) for the year 2020 and derived by the IEA for categories onshore oil and other from oil and gas for the year 2019. Error bar extends from the lower bound (i.e., 79 kt yr−1) to the upper bound (i.e., 180 kt yr−1) of the 95 % CI.
The total emission rate from all oil production sites that were quantified in this study was 810 kg h−1, whereas the sum of quantifications of all types of infrastructure visited during the ROMEO campaign was 2100 kg h−1. Although we do not have a sufficient statistical basis for a thorough quantification of other types of infrastructure, this indicates that the total CH4 emissions from the O&G infrastructure in Romania could be at least a factor 2 higher than our estimate from oil production sites.
Discrepancies between available inventory estimates and directly measured CH4 emissions have been indicated by numerous studies in other areas (Robertson et al., 2020; MacKay et al., 2021; Alvarez et al., 2018; Zavala-Araiza et al., 2015; Tyner and Johnson, 2021; Rutherford et al., 2021), and we now confirm this discrepancy is large for Romania. One reason for these discrepancies is the use of outdated and highly uncertain EFs for the derivation of inventory estimates. This is especially relevant for Romania since their published estimates are based on the basic Tier 1 method, which relies on multiplying default EF applicable for all countries by country-specific activity data following the IPCC 2006 guidelines (Eggleston et al., 2006). Thus, these reported emissions do not consider the characteristics of the actual O&G infrastructure of Romania, such as its age and state of maintenance or current operational practices. For example, emission reduction by gas flaring has been almost eliminated as a practice in Romania. Additionally, infrastructure for the collection and economical utilization of the natural gas that would otherwise be flared or vented is inadequate or non-existent in the sampled areas, as illustrated by the high fraction of surveyed sites, where direct venting was the main source of emission.
To place the results from the ROMEO campaign in perspective, we compare them to studies performed in O&G production areas in the US and Canada (Robertson et al., 2020, 2017; Zavala-Araiza et al., 2015, 2018; Omara et al., 2016). We use the reported datasets from these studies to derive the EFs using the statistical approach used in this paper. In this way we eliminate inconsistencies from data treatment and can consistently compare the results between the different regions.
The CH4 EF estimated for Romania is 5.4 kg h−1 per site (3.6 %–8.4 %, 95 % CI). EFs estimated for the studies used for our comparison range between 1.2 and 8.2 kg h−1 per site for O&G production sites (e.g., oil well and/or gas well sites), with the majority of the EFs being below 3 kg h−1 per site (see Table S13). Specifically, our estimated CH4 EF from Romania is the third highest EF calculated from a variety of production regions in North America. The differences between production characteristics, age of sites, geologic features, and operational procedures in each region could have a significant impact on the various levels of skewness and the EFs.
Figure 7 shows the derived cumulative distribution functions of each production region. All studies show heavy-tailed distributions; however, Romania presents the fourth highest level of skewness indicating the disproportionate contribution of high-emitting sites to the total emissions. Our results show that 10 % of sites are responsible for more than 70 % of emissions. By identifying and mitigating these high-emitting sites or “super-emitters”, a large share of total emission reduction can be achieved.
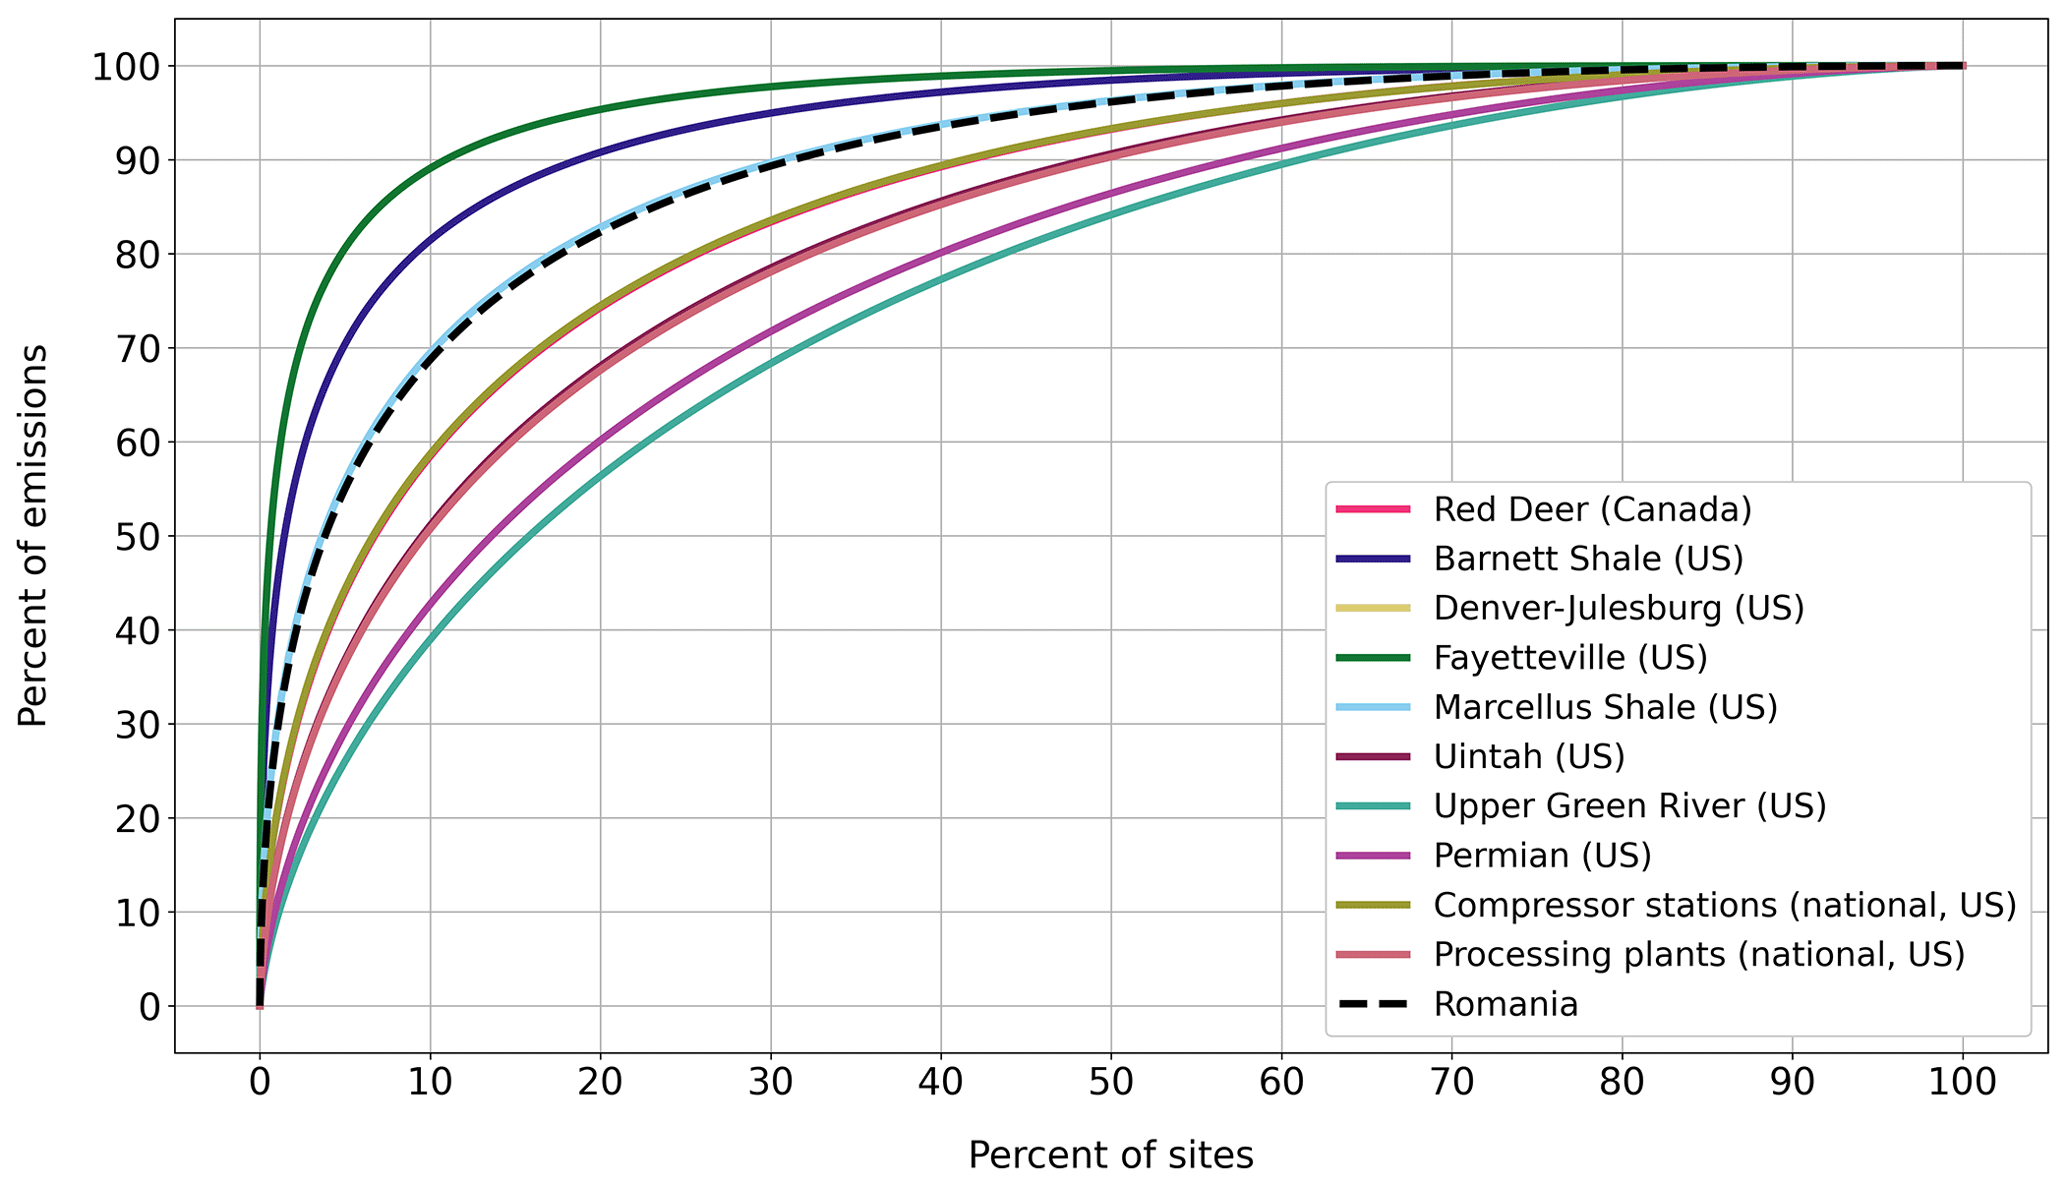
Figure 7Lorenz curve: cumulative percentage of emissions as a function of cumulative percentage of sites (sorted from high to low emissions) for different North American production regions, including the results from this study. The dashed black line shows the results of the statistical estimator for the ROMEO campaign, considering all four measurement methods. It overlaps with the one from the Marcellus Shale basin. The Red Deer line overlaps with the compressor stations line, and the Uintah line overlaps with the processing plants line.
On the component scale, 55 % of emission points from oil production sites are from open-ended lines and another 25 % from non-identified components below the ground, which are possibly open outlets as well. These vents are thus part of the operational practices and can be avoided by prioritizing gas capture infrastructure.
An important finding of the OGI dataset analysis is the much lower percentage of emitting oil production sites in a production cluster, where the produced oil is associated with emissions of hydrogen sulfide (H2S) gas (Fig. 8). H2S is a by-product that is formed in some fossil fuel reservoirs through natural processes or due to some methods employed in the O&G upstream production (Marriott et al., 2016). It is highly toxic to humans and animals, causing serious health problems even at low concentrations (Doujaiji and Al-Tawfiq, 2010). The lower fraction of emitting oil production sites in this cluster indicates that sites associated with the H2S component are better maintained to avoid harmful H2S emissions. This demonstrates that it is feasible to reduce emissions by improved practices and better maintenance of facilities. These findings are consistent with the research conducted by Lavoie et al. (2022), which showed that reduction strategies focusing on olfactory compounds in Peace River have proven beneficial in reducing and maintaining lower CH4 emissions despite not being specifically designed for CH4 reduction purposes (Lavoie et al., 2022). However, it is important to note that further research is needed to establish a clear relationship between CH4 and H2S emission rates.
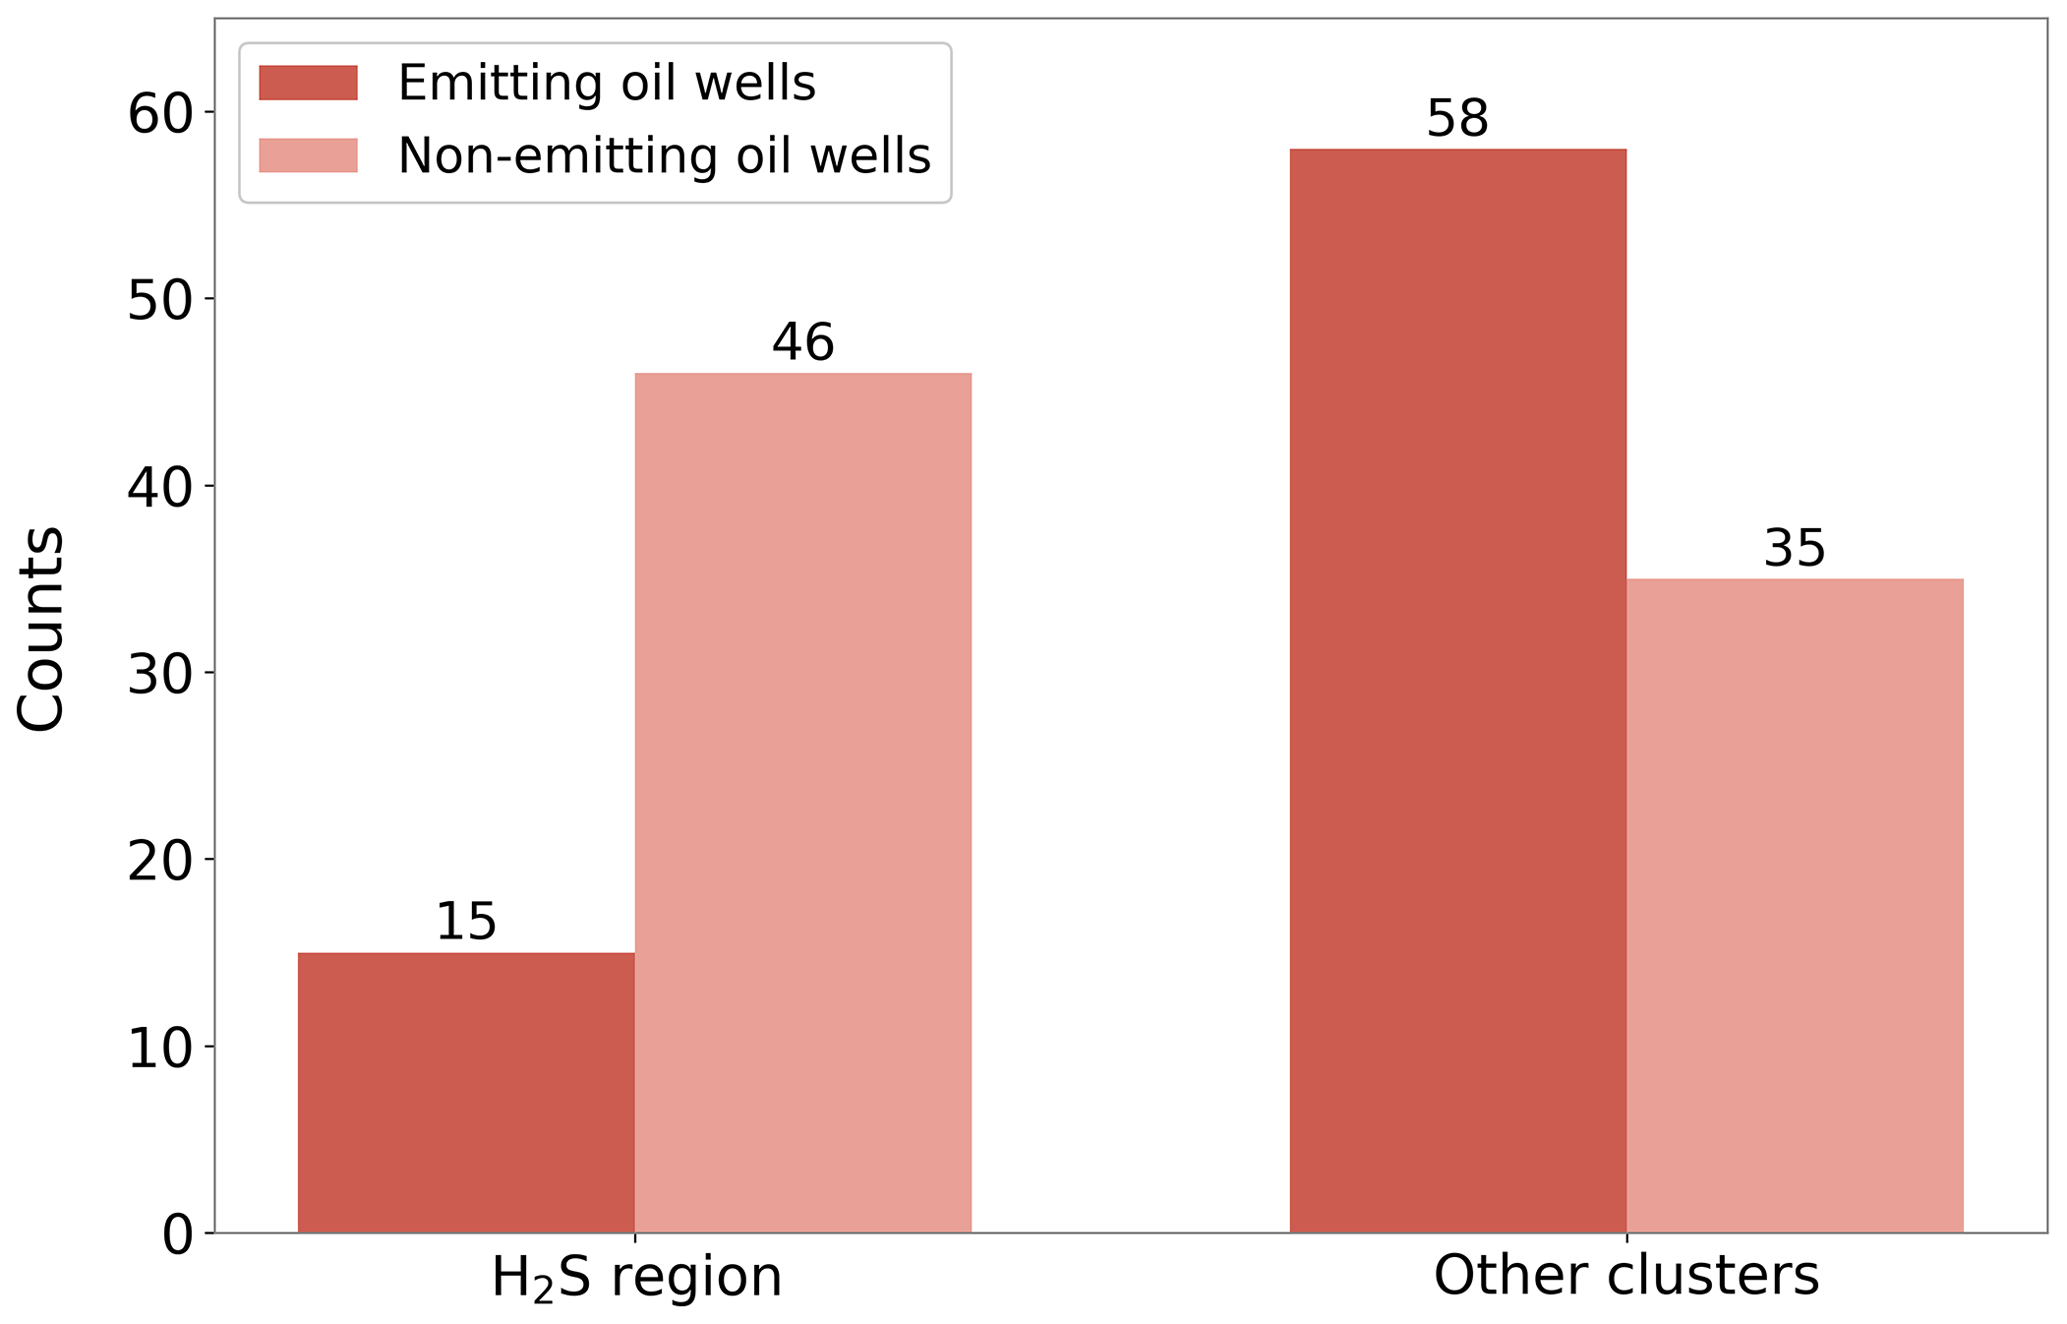
Figure 8Number of screened oil production sites, divided by sites with identified leaks and sites without identified leaks, from the H2S region in comparison to other clusters.
An independent line of evidence for large-scale venting in Romania is that 70 % of the screened oil production sites and more than 50 % of measured oil production sites are listed with zero gas production in the database of the operator. Evidently, when associated gas is vented via open vents immediately at the well head, it will not be metered and thus cannot be quantified and reported.
Our results have great implications not only for the accuracy of current national inventories but also for the feasibility of reaching EU emission reduction targets. The total CH4 emissions from the O&G sector in Romania reported to the UNFCCC decreased by 93 % between 1989 and 2020 (Greenhouse Gas Inventory Data - Comparison by Category, 2022). However, this significant reduction is primarily due to the change in the Tier 1 emission factor from the one for developing countries to the one for developed countries in the year 2000. It is a consequence of a decrease in production and changes in reporting methodology and is not indicative of changes in operations that would result in lower emissions. The lack of gas flaring and gas collection infrastructure across oil production sites in Romania is evidence of the relatively high emissions. Additionally, a large number of countries rely on the Tier 1 method, rather than direct site-level measurements, for the derivation of their national emission estimates from the energy sector. However, since technological and operating conditions vary significantly between countries, these estimates are associated with large uncertainties and might not reflect actual emissions.
Our work highlights the need for better understanding of the level of emissions in the O&G industry. Due to the significant regional differences in age, site design, and operational practices, the O&G production region in one country, such as southern Romania, may not be representative of other production regions around the world. Therefore, emission factor estimates and mitigation options cannot be generalized. Our work, however, illustrates how empirical data collected at both facility and component scales can significantly reduce the uncertainty in the magnitude of emissions and identify key mitigation opportunities specific to a country's local conditions.
In this work, we provide a thorough characterization of CH4 emissions from oil production sites in Romania by integrating a variety of ground- and drone-based quantification methods. The main findings are summarized as follows:
-
Emission rates from oil production sites were represented by a mean EF equal to 5.4 kg h−1 per site (3.6 %–8.4 %, 95 % CI). The derived EF for Romania is one of the highest EFs found in previous studies.
-
The CH4 emission rate distribution is highly skewed, with 10 % of sites contributing to more than 70 % of the total CH4 emissions.
-
Oil production sites associated with emissions of H2S are better maintained and had a lower number of detected emission points compared to oil production sites without H2S emissions. Thus, effective mitigation of emissions can be achieved by improved practices.
-
The Romanian national inventory underestimates O&G CH4 emissions by at least a factor of 2 – and likely more. Given the importance of mitigating CH4 emissions in the near-term future, as well as the ambitious mitigation targets announced by governments and industry, the improvement of emission reporting based on measurements is key to track changes in emissions over time.
-
Major drivers of CH4 emissions from oil production sites in Romania are the venting of gas through open-ended lines followed by technical malfunctioning equipment.
-
Our results highlight significant opportunities for emission mitigation. Development of infrastructure for the capture and utilization of natural gas combined with the replacement and upgrade of equipment would address the primary sources of Romanian O&G emissions. Further reductions can be achieved by identifying and repairing equipment leaks through frequent monitoring of methane emissions and implementation of leak detection and repair programs. Focusing on these mitigation actions would be an effective and efficient strategy to achieve substantial methane reductions.
The emission rate dataset used in this study is presented in Table S16 in the Supplement.
The supplement related to this article is available online at: https://doi.org/10.5194/acp-23-10399-2023-supplement.
Study design: TR, HC, MS, JMN, and AnC.
Execution and planning of ground- and drone-based measurements: KV, BK, MdV, SvH, PK, MS, JW, PJ, JMN, JB, HM, MM, CvdV, BT, JR, RPM, LE, DB, MS, AH, IV, PvdB, HDvdG, AnD, MEE, CS, MC, SI, DM, AS, AT, IV, AnC, MA, SG, AP, AuC, LC, AN, CB, CP, AR, AM, HS, AlD, BH, SS, DZA, HC, TR, and SW.
Data evaluation: FS, KV, PK, MS, PJ, JMN, JB, HM, BT, JR, RPM, LE, AH, IV, HDvdG, AnD, CS, AnC, SS, DZA, HC, and TR.
Preparation of manuscript: FS, DZA, KV, HC, and TR with input from PK, MS, PJ, JMN, JB, HM, BT, LE, AH, IV, HDvdG, AnD, CS, AnC, and SS.
The contact author has declared that none of the authors has any competing interests.
Publisher’s note: Copernicus Publications remains neutral with regard to jurisdictional claims in published maps and institutional affiliations.
Our collected data, funded by UNEP's International Methane Emissions Observatory (IMEO), is part of a science studies program that aims to support methane emission mitigation strategies, actions, and policies.
The Romanian Methane Emission from Oil and Gas (ROMEO) campaign was initiated and largely carried out by participants of the European H2020 project MEMO2 (MEthane goes MObile – MEasurements and Modelling), which was funded by the European Union's Horizon 2020 research and innovation program under the Marie Skłodowska-Curie grant agreement no. 722479. Additional funding was provided by the Climate and Clean Air Coalition (CCAC) Oil and Gas Methane Science Studies (MSS), administered through United Nations Environment Programme (UNEP) under grant no. PCA/CCAC/UU/DTIE19-EN652.
This paper was edited by Tanja Schuck and reviewed by two anonymous referees.
Allen, D. T., Torres, V. M., Thomas, J., Sullivan, D. W., Harrison, M., Hendler, A., Herndon, S. C., Kolb, C. E., Fraser, M. P., Hill, A. D., Lamb, B. K., Miskimins, J., Sawyer, R. F., and Seinfeld, J. H.: Measurements of methane emissions at natural gas production sites in the United States, P. Natl. Acad. Sci. USA, 110, 17768–17773, https://doi.org/10.1073/pnas.1304880110, 2013.
Allen, G., Hollingsworth, P., Kabbabe, K., Pitt, J. R., Mead, M. I., Illingworth, S., Roberts, G., Bourn, M., Shallcross, D. E., and Percival, C. J.: The development and trial of an unmanned aerial system for the measurement of methane flux from landfill and greenhouse gas emission hotspots, Waste Manag., 87, 883–892, https://doi.org/10.1016/j.wasman.2017.12.024, 2019.
Alvarez, R. A., Zavala-Araiza, D., Lyon, D. R., Allen, D. T., Barkley, Z. R., Brandt, A. R., Davis, K. J., Herndon, S. C., Jacob, D. J., Karion, A., Kort, E. A., Lamb, B. K., Lauvaux, T., Maasakkers, J. D., Marchese, A. J., Omara, M., Pacala, S. W., Peischl, J., Robinson, A. L., Shepson, P. B., Sweeney, C., Townsend-Small, A., Wofsy, S. C., and Hamburg, S. P.: Assessment of methane emissions from the U.S. oil and gas supply chain, Science, 361, 186–188, https://doi.org/10.1126/science.aar7204, 2018.
Andersen, T., Scheeren, B., Peters, W., and Chen, H.: A UAV-based active AirCore system for measurements of greenhouse gases, Atmos. Meas. Tech., 11, 2683–2699, https://doi.org/10.5194/amt-11-2683-2018, 2018.
Baray, S., Darlington, A., Gordon, M., Hayden, K. L., Leithead, A., Li, S.-M., Liu, P. S. K., Mittermeier, R. L., Moussa, S. G., O'Brien, J., Staebler, R., Wolde, M., Worthy, D., and McLaren, R.: Quantification of methane sources in the Athabasca Oil Sands Region of Alberta by aircraft mass balance, Atmos. Chem. Phys., 18, 7361–7378, https://doi.org/10.5194/acp-18-7361-2018, 2018.
BP: Statistical Review of World Energy 2022, 71st edn., BP, https://www.bp.com/content/dam/bp/business-sites/en/global/corporate/pdfs/energy-economics/statistical-review/bp-stats-review-2022-full-report.pdf (last access: 4 September 2023), 2022.
Brandt, A. R., Heath, G. A., and Cooley, D.: Methane Leaks from Natural Gas Systems Follow Extreme Distributions, Environ. Sci. Technol., 50, 12512–12520, https://doi.org/10.1021/acs.est.6b04303, 2016.
Brantley, H. L., Thoma, E. D., Squier, W. C., Guven, B. B., and Lyon, D.: Assessment of Methane Emissions from Oil and Gas Production Pads using Mobile Measurements, Environ. Sci. Technol., 48, 14508–14515, https://doi.org/10.1021/es503070q, 2014.
Delre, A., Mønster, J., and Scheutz, C.: Greenhouse gas emission quantification from wastewater treatment plants, using a tracer gas dispersion method, Sci. Total Environ., 605–606, 258–268, https://doi.org/10.1016/j.scitotenv.2017.06.177, 2017.
Delre, A., Hensen, A., Velzeboer, I., van den Bulk, P., Edjabou, M. E., and Scheutz, C.: Methane and ethane emission quantifications from onshore oil and gas sites in Romania, using a tracer gas dispersion method, Elementa: Science of the Anthropocene, 10, 000111, https://doi.org/10.1525/elementa.2021.000111, 2022.
Doujaiji, B. and Al-Tawfiq, J. A.: Hydrogen sulfide exposure in an adult male, Ann. Saudi Med., 30, 76–80, 2010.
Eggleston, H. S., Buendia, L., Miwa, K., Ngara, T., and Tanabe, K. (Eds.): 2006 IPCC Guidelines for National Greenhouse Gas Inventories, Institute for Global Environmental Strategies (IGES), ISBN 4-88788-032-4, 2006.
European Commission: COMMUNICATION FROM THE COMMISSION TO THE EUROPEAN PARLIAMENT, THE COUNCIL, THE EUROPEAN ECONOMIC AND SOCIAL COMMITTEE AND THE COMMITTEE OF THE REGIONS on an EU strategy to reduce methane emissions, https://eur-lex.europa.eu/legal-content/EN/ALL/?uri=CELEX:52020DC0663 (last access: 4 September 2023), 2020.
European Commission: Proposal for a REGULATION OF THE EUROPEAN PARLIAMENT AND OF THE COUNCIL on methane emissions reduction in the energy sector and amending Regulation (EU) 2019/942, https://eur-lex.europa.eu/legal-content/EN/ALL/?uri=COM:2021:805:FIN (last access: 4 September 2023), 2021.
Foulds, A., Allen, G., Shaw, J. T., Bateson, P., Barker, P. A., Huang, L., Pitt, J. R., Lee, J. D., Wilde, S. E., Dominutti, P., Purvis, R. M., Lowry, D., France, J. L., Fisher, R. E., Fiehn, A., Pühl, M., Bauguitte, S. J. B., Conley, S. A., Smith, M. L., Lachlan-Cope, T., Pisso, I., and Schwietzke, S.: Quantification and assessment of methane emissions from offshore oil and gas facilities on the Norwegian continental shelf, Atmos. Chem. Phys., 22, 4303–4322, https://doi.org/10.5194/acp-22-4303-2022, 2022.
Gorchov Negron, A. M., Kort, E. A., Conley, S. A., and Smith, M. L.: Airborne Assessment of Methane Emissions from Offshore Platforms in the U.S. Gulf of Mexico, Environ. Sci. Technol., 54, 5112–5120, https://doi.org/10.1021/acs.est.0c00179, 2020.
Greenhouse Gas Inventory Data - Comparison by Category: https://di.unfccc.int/comparison_by_category, last access: 2 November 2022.
Hanna, S. R., Briggs, G. A., and Hosker, J.: Handbook on atmospheric diffusion, National Oceanic and Atmospheric Administration, Oak Ridge, TN, USA, Atmospheric Turbulence and Diffusion Lab., https://doi.org/10.2172/5591108, 1982.
IEA: Global Methane Tracker 2022, https://www.iea.org/reports/global-methane-tracker-2022, last access: 2 November 2022.
Karion, A., Sweeney, C., Pétron, G., Frost, G., Michael Hardesty, R., Kofler, J., Miller, B. R., Newberger, T., Wolter, S., Banta, R., Brewer, A., Dlugokencky, E., Lang, P., Montzka, S. A., Schnell, R., Tans, P., Trainer, M., Zamora, R., and Conley, S.: Methane emissions estimate from airborne measurements over a western United States natural gas field, Geophys. Res. Lett., 40, 4393–4397, https://doi.org/10.1002/grl.50811, 2013.
Korbeń, P., Jagoda, P., Maazallahi, H., Kammerer, J., Nęcki, J. M., Wietzel, J. B., Bartyzel, J., Radovici, A., Zavala-Araiza, D., Röckmann, T., and Schmidt, M.: Quantification of methane emission rate from oil and gas wells in Romania using ground-based measurement techniques, Elementa: Science of the Anthropocene, 10, 00070, https://doi.org/10.1525/elementa.2022.00070, 2022.
Lamb, B. K., McManus, J. B., Shorter, J. H., Kolb, C. E., Mosher, B., Harriss, R. C., Allwine, E, Blaha, D., Howard, T., Guenther, A., Lott, R. A., Siverson, R., Westburg, H., and Zimmerman, P.: Development of Atmospheric Tracer Methods To Measure Methane Emissions from Natural Gas Facilities and Urban Areas, Environ. Sci. Technol., 29, 1468–1479, https://doi.org/10.1021/es00006a007, 1995.
Lavoie, M., Baillie, J., Bourlon, E., O'Connell, E., MacKay, K., Boelens, I., and Risk, D.: Sweet and sour: A quantitative analysis of methane emissions in contrasting Alberta, Canada, heavy oil developments, Sci. Total Environ., 807, 150836, https://doi.org/10.1016/j.scitotenv.2021.150836, 2022.
MacKay, K., Lavoie, M., Bourlon, E., Atherton, E., O'Connell, E., Baillie, J., Fougère, C., and Risk, D.: Methane emissions from upstream oil and gas production in Canada are underestimated, Sci. Rep.-UK, 11, 8041, https://doi.org/10.1038/s41598-021-87610-3, 2021.
Marriott, R. A., Pirzadeh, P., Marrugo-Hernandez, J. J., and Raval, S.: Hydrogen sulfide formation in oil and gas, Can. J. Chem., 94, 406–413, https://doi.org/10.1139/cjc-2015-0425, 2016.
Methane Tracker Data Explorer: https://www.iea.org/data-and-statistics/data-tools/methane-tracker-data-explorer, last access: 2 November 2022.
Morales, R., Ravelid, J., Vinkovic, K., Korbeń, P., Tuzson, B., Emmenegger, L., Chen, H., Schmidt, M., Humbel, S., and Brunner, D.: Controlled-release experiment to investigate uncertainties in UAV-based emission quantification for methane point sources, Atmos. Meas. Tech., 15, 2177–2198, https://doi.org/10.5194/amt-15-2177-2022, 2022.
Nathan, B. J., Golston, L. M., O'Brien, A. S., Ross, K., Harrison, W. A., Tao, L., Lary, D. J., Johnson, D. R., Covington, A. N., Clark, N. N., and Zondlo, M. A.: Near-Field Characterization of Methane Emission Variability from a Compressor Station Using a Model Aircraft, Environ. Sci. Technol., 49, 7896–7903, https://doi.org/10.1021/acs.est.5b00705, 2015.
Ocko, I. B., Sun, T., Shindell, D., Oppenheimer, M., Hristov, A. N., Pacala, S. W., Mauzerall, D. L., Xu, Y., and Hamburg, S. P.: Acting rapidly to deploy readily available methane mitigation measures by sector can immediately slow global warming, Environ. Res. Lett., 16, 054042, https://doi.org/10.1088/1748-9326/abf9c8, 2021.
Omara, M., Sullivan, M. R., Li, X., Subramanian, R., Robinson, A. L., and Presto, A. A.: Methane Emissions from Conventional and Unconventional Natural Gas Production Sites in the Marcellus Shale Basin, Environ. Sci. Technol., 50, 2099–2107, https://doi.org/10.1021/acs.est.5b05503, 2016.
O'Shea, S. J., Allen, G., Gallagher, M. W., Bower, K., Illingworth, S. M., Muller, J. B. A., Jones, B. T., Percival, C. J., Bauguitte, S. J.-B., Cain, M., Warwick, N., Quiquet, A., Skiba, U., Drewer, J., Dinsmore, K., Nisbet, E. G., Lowry, D., Fisher, R. E., France, J. L., Aurela, M., Lohila, A., Hayman, G., George, C., Clark, D. B., Manning, A. J., Friend, A. D., and Pyle, J.: Methane and carbon dioxide fluxes and their regional scalability for the European Arctic wetlands during the MAMM project in summer 2012, Atmos. Chem. Phys., 14, 13159–13174, https://doi.org/10.5194/acp-14-13159-2014, 2014.
Pitt, J. R., Allen, G., Bauguitte, S. J.-B., Gallagher, M. W., Lee, J. D., Drysdale, W., Nelson, B., Manning, A. J., and Palmer, P. I.: Assessing London CO2, CH4 and CO emissions using aircraft measurements and dispersion modelling, Atmos. Chem. Phys., 19, 8931–8945, https://doi.org/10.5194/acp-19-8931-2019, 2019.
Rella, C. W., Tsai, T. R., Botkin, C. G., Crosson, E. R., and Steele, D.: Measuring Emissions from Oil and Natural Gas Well Pads Using the Mobile Flux Plane Technique, Environ. Sci. Technol., 49, 4742–4748, https://doi.org/10.1021/acs.est.5b00099, 2015.
Riddick, S. N., Connors, S., Robinson, A. D., Manning, A. J., Jones, P. S. D., Lowry, D., Nisbet, E., Skelton, R. L., Allen, G., Pitt, J., and Harris, N. R. P.: Estimating the size of a methane emission point source at different scales: from local to landscape, Atmos. Chem. Phys., 17, 7839–7851, https://doi.org/10.5194/acp-17-7839-2017, 2017.
Riddick, S. N., Mauzerall, D. L., Celia, M. A., Kang, M., Bressler, K., Chu, C., and Gum, C. D.: Measuring methane emissions from abandoned and active oil and gas wells in West Virginia, Sci. Total Environ., 651, 1849–1856, https://doi.org/10.1016/j.scitotenv.2018.10.082, 2019.
Robertson, A. M., Edie, R., Snare, D., Soltis, J., Field, R. A., Burkhart, M. D., Bell, C. S., Zimmerle, D., and Murphy, S. M.: Variation in Methane Emission Rates from Well Pads in Four Oil and Gas Basins with Contrasting Production Volumes and Compositions, Environ. Sci. Technol., 51, 8832–8840, https://doi.org/10.1021/acs.est.7b00571, 2017.
Robertson, A. M., Edie, R., Field, R. A., Lyon, D., McVay, R., Omara, M., Zavala-Araiza, D., and Murphy, S. M.: New Mexico Permian Basin Measured Well Pad Methane Emissions Are a Factor of 5–9 Times Higher Than U.S. EPA Estimates, Environ. Sci. Technol., 54, 13926–13934, https://doi.org/10.1021/acs.est.0c02927, 2020.
Röckmann, T. and the The ROMEO team: ROMEO - ROmanian Methane Emissions from Oil and Gas, EGU General Assembly 2020, Online, 4–8 May 2020, EGU2020-18801, https://doi.org/10.5194/egusphere-egu2020-18801, 2020.
Roscioli, J. R., Yacovitch, T. I., Floerchinger, C., Mitchell, A. L., Tkacik, D. S., Subramanian, R., Martinez, D. M., Vaughn, T. L., Williams, L., Zimmerle, D., Robinson, A. L., Herndon, S. C., and Marchese, A. J.: Measurements of methane emissions from natural gas gathering facilities and processing plants: measurement methods, Atmos. Meas. Tech., 8, 2017–2035, https://doi.org/10.5194/amt-8-2017-2015, 2015.
Rutherford, J. S., Sherwin, E. D., Ravikumar, A. P., Heath, G. A., Englander, J., Cooley, D., Lyon, D., Omara, M., Langfitt, Q., and Brandt, A. R.: Closing the methane gap in US oil and natural gas production emissions inventories, Nat. Commun., 12, 4715, https://doi.org/10.1038/s41467-021-25017-4, 2021.
Saunois, M., Stavert, A. R., Poulter, B., Bousquet, P., Canadell, J. G., Jackson, R. B., Raymond, P. A., Dlugokencky, E. J., Houweling, S., Patra, P. K., Ciais, P., Arora, V. K., Bastviken, D., Bergamaschi, P., Blake, D. R., Brailsford, G., Bruhwiler, L., Carlson, K. M., Carrol, M., Castaldi, S., Chandra, N., Crevoisier, C., Crill, P. M., Covey, K., Curry, C. L., Etiope, G., Frankenberg, C., Gedney, N., Hegglin, M. I., Höglund-Isaksson, L., Hugelius, G., Ishizawa, M., Ito, A., Janssens-Maenhout, G., Jensen, K. M., Joos, F., Kleinen, T., Krummel, P. B., Langenfelds, R. L., Laruelle, G. G., Liu, L., Machida, T., Maksyutov, S., McDonald, K. C., McNorton, J., Miller, P. A., Melton, J. R., Morino, I., Müller, J., Murguia-Flores, F., Naik, V., Niwa, Y., Noce, S., O'Doherty, S., Parker, R. J., Peng, C., Peng, S., Peters, G. P., Prigent, C., Prinn, R., Ramonet, M., Regnier, P., Riley, W. J., Rosentreter, J. A., Segers, A., Simpson, I. J., Shi, H., Smith, S. J., Steele, L. P., Thornton, B. F., Tian, H., Tohjima, Y., Tubiello, F. N., Tsuruta, A., Viovy, N., Voulgarakis, A., Weber, T. S., van Weele, M., van der Werf, G. R., Weiss, R. F., Worthy, D., Wunch, D., Yin, Y., Yoshida, Y., Zhang, W., Zhang, Z., Zhao, Y., Zheng, B., Zhu, Q., Zhu, Q., and Zhuang, Q.: The Global Methane Budget 2000–2017, Earth Syst. Sci. Data, 12, 1561–1623, https://doi.org/10.5194/essd-12-1561-2020, 2020.
Shah, A., Ricketts, H., Pitt, J. R., Shaw, J. T., Kabbabe, K., Leen, J. B., and Allen, G.: Unmanned aerial vehicle observations of cold venting from exploratory hydraulic fracturing in the United Kingdom, Environ. Res. Commun., 2, 021003, https://doi.org/10.1088/2515-7620/ab716d, 2020.
Shen, L., Zavala-Araiza, D., Gautam, R., Omara, M., Scarpelli, T., Sheng, J., Sulprizio, M. P., Zhuang, J., Zhang, Y., Qu, Z., Lu, X., Hamburg, S. P., and Jacob, D. J.: Unravelling a large methane emission discrepancy in Mexico using satellite observations, Remote Sens. Environ., 260, 112461, https://doi.org/10.1016/j.rse.2021.112461, 2021.
Shi, T., Han, Z., Han, G., Ma, X., Chen, H., Andersen, T., Mao, H., Chen, C., Zhang, H., and Gong, W.: Retrieving CH4-emission rates from coal mine ventilation shafts using UAV-based AirCore observations and the genetic algorithm–interior point penalty function (GA-IPPF) model, Atmos. Chem. Phys., 22, 13881–13896, https://doi.org/10.5194/acp-22-13881-2022, 2022.
Szopa, S., Naik, V., Adhikary, B., Artaxo, P., Berntsen, T., Collins, W. D., Fuzzi, S., Gallardo, L., Kiendler-Scharr, A., Klimont, Z., Liao, H., Unger, N., and Zanis, P.: Short-Lived Climate Forcers, in: Climate Change 2021: The Physical Science Basis. Contribution of Working Group I to the Sixth Assessment Report of the Intergovernmental Panel on Climate Change, edited by: Masson-Delmotte, V., Zhai, P., Pirani, A., Connors, S. L., Péan, C., Berger, S., Caud, N., Chen, Y., Goldfarb, L., Gomis, M. I., Huang, M., Leitzell, K., Lonnoy, E., Matthews, J. B. R., Maycock, T. K., Waterfield, T., Yelekçi, O., Yu, R., and Zhou, B., Cambridge University Press, Cambridge, United Kingdom and New York, NY, USA, 817–922, https://doi.org/10.1017/9781009157896.008, 2021.
Thoma, E. and Squier, B.: OTM 33 geospatial measurement of air pollution, remote emissions quantification (gmap-req) and OTM33A geospatial measurement of air pollution-remote emissions quantification-direct assessment (GMAP-REQ-DA), US Environ. Prot. Agency Cincinnati, OH, https://cfpub.epa.gov/si/si_public_record_report.cfm?Lab=NRMRL&dirEntryId=309632 (last access: 4 September 2023), 2014.
Tuzson, B., Graf, M., Ravelid, J., Scheidegger, P., Kupferschmid, A., Looser, H., Morales, R. P., and Emmenegger, L.: A compact QCL spectrometer for mobile, high-precision methane sensing aboard drones, Atmos. Meas. Tech., 13, 4715–4726, https://doi.org/10.5194/amt-13-4715-2020, 2020.
Tyner, D. R. and Johnson, M. R.: Where the Methane Is–Insights from Novel Airborne LiDAR Measurements Combined with Ground Survey Data, Environ. Sci. Technol., 55, 9773–9783, https://doi.org/10.1021/acs.est.1c01572, 2021.
Vinković, K., Andersen, T., de Vries, M., Kers, B., van Heuven, S., Peters, W., Hensen, A., van den Bulk, P., and Chen, H.: Evaluating the use of an Unmanned Aerial Vehicle (UAV)-based active AirCore system to quantify methane emissions from dairy cows, Sci. Total Environ., 831, 154898, https://doi.org/10.1016/j.scitotenv.2022.154898, 2022.
Yacovitch, T. I., Daube, C., Vaughn, T. L., Bell, C. S., Roscioli, J. R., Knighton, W. B., Nelson, D. D., Zimmerle, D., Pétron, G., and Herndon, S. C.: Natural gas facility methane emissions: measurements by tracer flux ratio in two US natural gas producing basins, Elementa: Science of the Anthropocene, 5, 69, https://doi.org/10.1525/elementa.251, 2017.
Yacovitch, T. I., Neininger, B., Herndon, S. C., van der Gon, H. D., Jonkers, S., Hulskotte, J., Roscioli, J. R., and Zavala-Araiza, D.: Methane emissions in the Netherlands: The Groningen field, Elementa: Science of the Anthropocene, 6, 57, https://doi.org/10.1525/elementa.308, 2018.
Zavala-Araiza, D., Lyon, D. R., Alvarez, R. A., Davis, K. J., Harriss, R., Herndon, S. C., Karion, A., Kort, E. A., Lamb, B. K., Lan, X., Marchese, A. J., Pacala, S. W., Robinson, A. L., Shepson, P. B., Sweeney, C., Talbot, R., Townsend-Small, A., Yacovitch, T. I., Zimmerle, D. J., and Hamburg, S. P.: Reconciling divergent estimates of oil and gas methane emissions, P. Natl. Acad. Sci. USA, 112, 15597–15602, https://doi.org/10.1073/pnas.1522126112, 2015.
Zavala-Araiza, D., Alvarez, R. A., Lyon, D. R., Allen, D. T., Marchese, A. J., Zimmerle, D. J., and Hamburg, S. P.: Super-emitters in natural gas infrastructure are caused by abnormal process conditions, Nat. Commun., 8, 14012, https://doi.org/10.1038/ncomms14012, 2017.
Zavala-Araiza, D., Herndon, S. C., Roscioli, J. R., Yacovitch, T. I., Johnson, M. R., Tyner, D. R., Omara, M., and Knighton, B.: Methane emissions from oil and gas production sites in Alberta, Canada, Elementa: Science of the Anthropocene, 6, 27, https://doi.org/10.1525/elementa.284, 2018.