the Creative Commons Attribution 4.0 License.
the Creative Commons Attribution 4.0 License.
 | 19 Sep 2023
Measurement report: Source apportionment and environmental impacts of volatile organic compounds (VOCs) in Lhasa, a highland city in China
Shuzheng Guo
Weili Lin
Fangjie Tian
Jianshu Wang
Chong Zhang
Suzhen Chi
Yi Chen
Yingjie Zhang
Limin Zeng
Duo Bu
Jiacheng Zhou
Weixiong Zhao
Hypoxia and adverse health outcomes might be affected by O3 pollution in the highland city of Lhasa. NOx emissions can amplify the role of volatile organic compounds (VOCs) in the secondary production of O3 under the conditions of high ultraviolet (UV) radiation levels and unfavourable dispersion patterns in the Lhasa River valley. Here, online C2–C11 VOC measurements, accompanied by other parameters concerning the O3 chemical budget, were first obtained and employed to identify the key VOC species and key sources of VOCs in terms of the loss rate against OH radicals (LOH), ozone formation potential (OFP), secondary organic aerosol potential (SOAP), and toxicity. Oxygenated VOCs (OVOCs) not only were the most abundant VOCs but also dominated LOH, OFP, and toxicity. Isoprene and anthropogenic VOCs were further identified as precursors of these OVOCs. Aromatics accounted for 5 % of the total VOCs (TVOCs) but contributed 88 % to the SOAP and 10 % to the toxicity. As the primary oxidative intermediates of aromatics were not well characterized by our measurements, the environmental impact of aromatics could be underestimated by our data. Source appointment and ternary analysis of benzene, toluene, and ethylbenzene confirmed the combined contribution of traffic emissions, solvent usage, and biomass burning. This suggests that O3 precursors are mainly from sources associated with residents' lives, except for solvent usage emissions which contribute to aromatics. Preliminary comparisons between source spectrums of transport sector emissions with positive matrix factorization (PMF)-decomposed ones and our measured ones suggest that vehicle emission patterns of VOCs at high altitude generally follow the ground-level impression. More quantitative data are required to further confirm this point though. Emission reduction strategy analysis for O3 pollution control highlighted multiple benefits of the simultaneous reduction in NOx originating from diesel vehicle emissions, biomass burning, and background sources (possibly dominated by incense burning). The notable biogenic emission contribution to the OFP was also first confirmed in our study, and this highlights the side effects of the government's pursuit of a greener city.
- Article
(2065 KB) - Full-text XML
-
Supplement
(709 KB) - BibTeX
- EndNote


Over 3 million residents live in highland cities across the Tibetan Plateau (TP) with an average altitude over 4 km. Hypoxia and adverse health outcomes (Bigham and Lee, 2014) pose a threat to local residents and tourists. Moreover, economic development has inevitably led to the emission of anthropogenic pollutants, and the air quality has consequently deteriorated in the absence of carefully designed and effectively complemented air pollution control strategies. Air pollution, complexed with O2 deficiency, might interfere with human high-altitude adaptation and cause more serious health issues for the human body. Proper attention should be given to the emission sources and their contributions to air pollution. However, very sparse measurement data are available for high-altitude regions, with fewer research efforts and the complex logistics required as causes. A review summarized pollutant measurements at background mountain sites and concluded that very weak natural and anthropogenic perturbations occur in local photochemistry but underlined the long-range transport of long-lived species (Okamoto and Tanimoto, 2016). However, in highland cities, notable anthropogenic perturbations in photochemistry and air pollution occur. Among these studies in highland cities, the distribution of aerosol and long-lived source tracers and their linkage with industrial and constructive activities have been extensively examined, whereas the sources, photochemical fate, and roles of reactive species, such as NOx and volatile organic compounds (VOCs), in O3 pollution accumulation have been notably less considered.
Pollutant measurements at background TP sites have suggested low abundances of reactive species, which is a key feature of the background atmosphere. A mixing ratio of NOx ranging from tens to the low hundreds of parts per trillion by volume has been recorded thus far only at the Waliguan (WLG) Global Baseline Watch Station along the edge of the northeastern boundary of the TP (Ma et al., 2013; Xue et al., 2013). At the same pristine station on the TP, the most abundant VOCs are long-lived VOCs, whose concentrations are comparable to those at other alpine background sites worldwide, while reactive VOCs are less abundant than those at other alpine background sites (Xue et al., 2013). These measurements of both NOx and short-lived VOCs across the TP strengthened the impression of weak perturbations in local photochemistry by natural and anthropogenic emissions. Later, the characterization of regional VOCs across the TP clearly demonstrated the increasing influence of long-range transport along the edge of the TP boundary (Li et al., 2017; Zhao et al., 2020). The promotion of the O3 photochemistry by transported VOCs has not been carefully explored. However, the net O3 photochemical production established at even background sites on the TP might be associated with transported VOC sources (Xue et al., 2013; Zhao et al., 2020).
Lhasa is the largest city on the TP and has been progressively growing in size and population over the last 2 decades. Surrounded by mountains with elevations over 5500 m above sea level (a.s.l.), the city resides in the Lhasa River Basin at 3600 m a.s.l., trapping and accumulating locally emitted pollutants within the surrounding atmosphere. The city is not green or hot, and high biogenic emissions are therefore not notably considered. Pollution involving concentrations of fine particulate matter (PM2.5), O3, and their primary precursors, such as NOx and VOCs, originating from anthropogenic sources (such as vehicles, religious activities, and cooking and coal combustion processes) have drawn research attention. Primary emissions of aerosols stemming from biomass burning, fossil fuel combustion, and suspension dust have been the major sources of PM2.5 pollution in Lhasa ever since the first aerosol dataset became available for the urban district 2 decades ago (Huang et al., 2010; Liu et al., 2013; Li et al., 2019; Zhao et al., 2022). Old aerosol sources, such as the burning of wood, agriculture residuals, and cow dung cakes, as well as waste incineration, have been largely suppressed since the Action Plan for the Prevention and Control of Air Pollution issued in 2013. Dust components are another major fraction of PM2.5 but have not experienced a similar reduction like biomass burning. The secondary chemical composition of aerosols includes a small mass fraction of PM2.5 in this highland city in contrast to other areas of China (Cong et al., 2011; Li et al., 2019). Consequently, the annual mean mass concentration of PM2.5 of 20 µg m−3 has experienced a slow declining trend (Yin et al., 2019), although extremely high PM2.5 concentrations have not been observed since 2013. Overall, pollution measurements in Lhasa have recorded atmospheric change from relatively low anthropogenic emissions to intensive unregulated anthropogenic emissions and finally to emission reduction over the last 2–3 decades (Yu et al., 2001; Ran et al., 2014; Guo et al., 2022; Yu et al., 2022a). Compared to the levels 3 decades ago, enhanced photochemical production of O3 and therefore aggravated O3 pollution were recorded in 2012 (Ran et al., 2014). Aggravated O3 pollution even lasts to the present day, with a slower increasing slope over the last few years (Yin et al., 2019). While comprehensive reactive VOC measurements were not available until recently, the increased abundance of NOx from the sub-parts per billion volume (ppbv) level in 1998 to a level higher than 10 ppbv in 2012 was identified as the major cause of promoted O3 production. The sporadic availability of O3 and NOx observations from 1998 to 2015 has impeded our understanding of the historic trend of O3 and NOx and therefore the O3 chemical regime. In contrast to the past, recent changes in the emission inventory and pollutant abundance are more traceable. Since the implementation of effective pollution control policies in 2013, such as eliminating yellow-label vehicles and old vehicles and providing liquefied petroleum gas (LPG)-fuelled central heating alternatives to replace small coal-fired boilers, the emission inventory of O3 precursors might dramatically shift from past levels. For example, LPG-fuelled combustion processes might promote the high-temperature generation of NOx while reducing the emissions of primary aerosols and VOCs originating from biomass burning. Moreover, the government has organized continuous monitoring of various air pollutants including SO2, NO2, CO, O3, PM2.5, and particulate matter with an aerodynamic diameter of 10 µm or smaller (PM10) since 2015, also providing a potential opportunity to better understand the current trend of O3 and its precursors and their relationships (Ministry of Ecology And Environment of the People's Republic of China, Report on the State of the Environment in China 2015, http://english.mee.gov.cn/Resources/Reports/soe/Report/201706/P020170614504782926467.pdf, last access: 12 June 2023). VOC measurements in Lhasa, especially since 2014, have been reviewed to compile a comprehensive dataset for detailed O3 photochemistry analysis. Three measurements of this kind have been documented thus far, to our knowledge. The 2 h resolution canister sampling and gas chromatography–mass spectrometry (GC-MS) analysis of VOCs from 09:00 to 19:00 local time (UTC+6) facilitated O3 chemical regime analysis with an emphasis on anthropogenic VOC emission reduction (Yu et al., 2022b). Silica cartridge measurements of oxygenated VOC (OVOC) photochemical tracers, such as formaldehyde, acetone, glyoxal, and methylglyoxal, confirmed the large OH reactivity contribution of VOCs and the production of OVOC intermediates in the urban atmosphere of Lhasa (Li et al., 2022). The only online VOC measurement study employed the headspace technique with GC and detection via a photoionization detector and flame ionization detector (GC-PID-FID) to accurately measure C2–C12 alkanes, alkenes, and aromatics at the city centre (Guo et al., 2022). Further source apportionment using the positive matrix factorization (PMF) model indicated that the traffic sector and background biomass burning are two major sources of the measured VOCs. However, OVOC intermediates were not measured via offline GC-MS or online GC-PID-FID methods.
Under the umbrella of the second Tibetan Plateau Scientific Expedition and Research Program (STEP), a series of field campaigns, referred to as @Tibet campaigns, were carried out from 2019 to 2022. The major objectives of @Tibet campaigns were characterizing the atmospheric chemistry over the TP and exploring its impacts on climate and air quality. In the summer of 2021, a comprehensive field campaign was conducted at Lhasa, referred to herein as @Tibet 2021, to understand the atmospheric oxidative capacity, O3 pollution, and secondary aerosol formation in the urban environments in the TP. During @Tibet 2021, a comprehensive dataset including NOx, CO, O3, individual NOy species, VOCs, brown carbon (BC), and chemical composition of PM2.5 was collected. Herein, VOC tracers together with other source tracers including NOx, CO, and BC were intensively examined to identify key VOCs, major sources of VOCs, and their diel profiles in terms of the loss rate against OH radicals (LOH), ozone formation potential (OFP), secondary organic aerosol potential (SOAP), and toxicity.
Summary
Enhanced anthropogenic NOx and VOC emissions in the urban area of the highland city of Lhasa promote local ozone photochemical generation potential and increase the risk of photochemical pollution. Online C2–C11 VOC measurements by GC-MS, accompanied by other parameters concerning the O3 chemical budget, were first employed to identify the key VOC species and key sources.
The concentrations of the total VOCs (TVOCs; 18.70 ± 8.35 ppb) and major anthropogenic alkanes and aromatics measured in this study are approximately half of those measured in the megacity of Beijing but are several folds or even more than 1 order of magnitude higher than those measured at most regional measurement sites across the TP, confirming the anthropogenic contribution to VOCs. OVOCs were the most abundant (52 % of the TVOCs), and acetaldehyde was even comparable to the megacity. Alkenes (mainly isoprene) and OVOCs accounted for over 90 % of the LOH and over 80 % of the OFP, suggesting their key role in perturbing the photochemistry of O3. Aromatics further contributed 13 % to the OFP and dominated SOAP. PMF decomposed six factors, namely diesel vehicle emissions, solvent usage, sunlight-impacted factor, natural gas (NG)/LPG, gasoline vehicle emissions, and biomass burning and background.
Source appointment and ternary analysis of benzene, toluene, and ethylbenzene confirmed their combined contribution by traffic emissions, solvent usage, and biomass burning. Transport sector emissions and biomass burning and background emissions should be targeted for their contributions to VOCs, NOx, and BC. Solvent usage emission control is meaningful for the reduction in the aromatic concentration.
2.1 Measurement site
Continuous online observations were conducted from 22 May to 10 June 2021 in the yard of the Lhasa branch of the Institute of Qinghai–Tibetan Plateau Research, Chinese Academy of Sciences (29.63∘ N, 91.02∘ E; 3640 m a.s.l.). The observational site is located west of urban Lhasa (Fig. S1 in the Supplement), approximately 8.0 km east of the famous Potala Palace. To the north of the observational site is Jinzhu Road, a major road in Lhasa, which runs from east to west and is separated from the site by buildings and green spaces. Farms and green spaces are located to the south of the observational site. During the observation period, the dominant wind direction was from the west.
2.2 Measurement of VOCs and other pollutants
VOCs in ambient air were measured online with a temporal resolution of 1 h using a GC-MS and FID analytical system (Shimadzu GCMS2010, Japan) coupled with low-temperature preconcentration equipment (Peng Yu Chang Ya, Beijing, China). Among the VOCs, C2–C5 compounds (13 species) were separated in a PLOT Al2O3 chromatographic column (15 m × 0.32 mm inner diameter (i.d.) × 3 µm; J&W Scientific, USA) and then analysed via FID measurement; the other compounds (85 species) were separated using a DB-624 column (60 m × 0.25 mm i.d. × 1.4 µm; J&W Scientific, USA) and then analysed via single-quadrupole MS detection (electron impact (EI) source, 70 eV) in the selected ion monitoring (SIM) mode. One complete cycle of the analytical process includes preparation, sampling and preconcentration, injection and analysis, and back-blowing, and its detailed principle is described in Wang et al. (2014). During the preparation period, the air sample was continuously pumped through the sampling pipe to maintain fresh air. Before VOC enrichment, the sampling air was passed through an H2O trap at −60 ∘C and CO2 trap and O3 trap separately. After 30 min of preconcentration at a sampling flow rate of 10 mL min−1, the trap was heated to 110 ∘C within 3 min, and the released VOC samples were injected into the columns for 1 min. The ramp-up procedure for the column temperature included initial maintenance at 35 ∘C for 3 min, followed by heating at a rate of 6 ∘C min−1 to 180 ∘C and maintenance at 180 ∘C for 2 min. After analysis completion, N2 was purged in reverse into the trap at a flow rate of 100 mL min−1 for 1.6 min, and the preparation period for the next cycle was then started.
The C2–C5 compounds detected via FID were quantified through the external standard method, and the other components detected via MS were quantified through the internal standard method. Four compounds, namely bromochloromethane, 1,4-difluorobenzene, chlorobenzene-d5, and bromofluorobenzene, were used as internal standards. Multipoint calibrations were performed involving a mixture of 57 Photochemical Assessment Monitoring Station (PAMS) compounds (Linde Co., Germany), Environmental Protection Agency (EPA) TO-15 OVOCs, and halogenated hydrocarbons (Spectra Gases Inc., USA) at five concentrations. The R2 values of the calibration curve for the VOCs ranged from 0.995 to 1.000, indicating that the integrated areas of the peaks are proportional to the corresponding concentrations of the target compounds. A mixing gas with a 2 ppbv concentration was used for daily span assessment.
BC was measured using an AE33 Aethalometer (Magee Scientific Corporation, Berkeley, CA, USA) with a temporal resolution of 1 min. Surface NO NOx, O3, and CO were measured with TE42itl, TE49i, and TE48itl instruments (ThermoFisher Scientific, Waltham, MA, USA), respectively. Meteorological parameters, including the temperature and relative humidity (RH), were measured by a meteorological sensor (HMP155A, Vaisala, Finland), and the wind speed and wind direction were recorded by a sensor (010C-1/020C-1, Metone, USA).
2.3 Canister sampling of VOCs and measurement
Summa canisters (Entech Instruments Inc., USA) were also used for VOC sampling and measurement. Prior to sampling, the cleaning and pretreatment of the canisters were performed in accordance with the EPA TO-15 method using a cleaning device (Entech Instruments Inc., USA) and humidified nitrogen. After that, all evacuated containers were refilled with pure nitrogen, stored in the laboratory for at least 24 h, and then analysed using the same methods as the field samples to evaluate contamination in the containers. Teflon membrane filters (with a pore size of 4.5 µm) were used in front of the inlet to protect the steel canisters from dust and airborne particles. Negative-pressure sampling of whole-air samples was performed at Lhasa in different locations, including tunnels, diesel vehicle emission-impacted roadsides, refuelling stations, renovation sites, and incense burning locations. The samples were analysed via GC-MS within 10 d.
2.4 LOH, OFP, SOAP, and toxicity assessment
LOH for each component of the VOCs can be calculated as follows:
where KOH is the rate constant for the reaction of VOCs with OH (Atkinson and Arey, 2003).
The OFP of each VOC component was calculated using the maximum incremental reactivity (MIR) method to assess the contribution of VOCs to O3 generation. The OFP can be calculated as follows:
where MIR is the maximum incremental reactivity constant obtained from the California Code of Regulations 2010 (Carter, 2010), and [VOC]i is the concentration of each VOC component in parts per billion.
The SOAP for the generation of secondary organic aerosols from each component of VOCs can be calculated as follows (Derwent et al., 2010):
This method selects toluene as the basic compound for the SOAP, which is an index expressed relative to toluene = 100, and the SOAP for other compounds is expressed relative to toluene.
The relative toxicity effect and integrated effect assessment can be expressed as follows (Niu et al., 2016):
where toxicity grades for VOC species adopt the definition by Niu et al. (2016), in which four toxicity grades are classified on the basis of information on the carcinogenic, teratogenic, and mutagenic properties of different VOC species originating from both the European Commission and the International Agency for Research on Cancer (IARC). Toxicity grade 1 represents IARC group 3; grade 2 corresponds to IARC group 2B, i.e. what is possibly carcinogenic to humans; grade 3 represents IARC group 2A, i.e. what is probably carcinogenic to humans; and grade 4 represents group 1 carcinogens, mutagens, and teratogens, i.e. what is highly toxic to humans. The toxicity grades and concentrations were multiplied to estimate the relative toxic effect of VOCs.
According to Niu et al. (2016), the integrated effect was calculated by Eq. (5). The weightings of these adverse effects of OFP, SOAP, and toxicity were assigned by expert scoring. OFP and SOAP are crucial for the formation of O3 and PM2.5 and were assigned 40 % weight each. The weighting of the VOC relative toxicity effect was assigned 20 % in view of the error.
2.5 Source apportionment via PMF
The PMF model 5.0 of the US EPA with a multivariate multi-linear engine 2 (ME-2) platform was used to perform VOC source apportionment, similar to Guo et al. (2022).
In PMF, the input files consist of two matrices: the observed concentration of xij and the uncertainty uij (i denotes the observed samples, and j denotes the species). The uncertainty in the data can be calculated according to Eq. (6), where the data with concentrations higher than and below the method detection limit (MDL) involve different calculations. Based on Eq. (7), PMF calculates the following parameters: (1) the source number, p; (2) the chemical composition of each source factor, f; (3) the contribution of each source factor to the sample, g; and (4) the residual eij of each species to each sample. In Eq. (7), g and f should be higher than 0.
The goal of PMF is to minimize the function residual Q (Eq. 8), where n and m are the number of samples and the number of species, respectively.
After the files were entered, species with ratios lower than 0.2 or with more than 80 % of the data below the MDL were defined as bad data and excluded from the model. Species with an ratio ranging from 0.2 to 2 or with more than 20 % of the data below the MDL were defined as weak data. A total of 3 to 10 factors were estimated to obtain the best resolution based on statistical indicators, such as the Q value, change rate of , residual distribution, and coefficient of determination. Possible source explanations were also considered to obtain reasonable results. The Fpeak value was set to range from −5 to 5, and the lowest change in Q was returned at Fpeak = 0. No visible correlations were produced between factors through the inspection of G-space plots.
3.1 General description
The surface wind field follows the orientation of the Lhasa River valley along the east–west direction. West winds dominated over east winds during our measurements, affecting our measurement site upwind of the Lhasa city centre for most of the measurement time (Figs. 1 and S1). The wind speed mostly did not exceed 4 m s−1. No precipitation except for that on 8 June was recorded. Horizontal transport and vertical mixing, but not abrupt wet deposition, were therefore responsible for the removal of local pollutants. The topography of the Lhasa River valley also promotes the accumulation of secondary pollutants in the surrounding atmosphere.
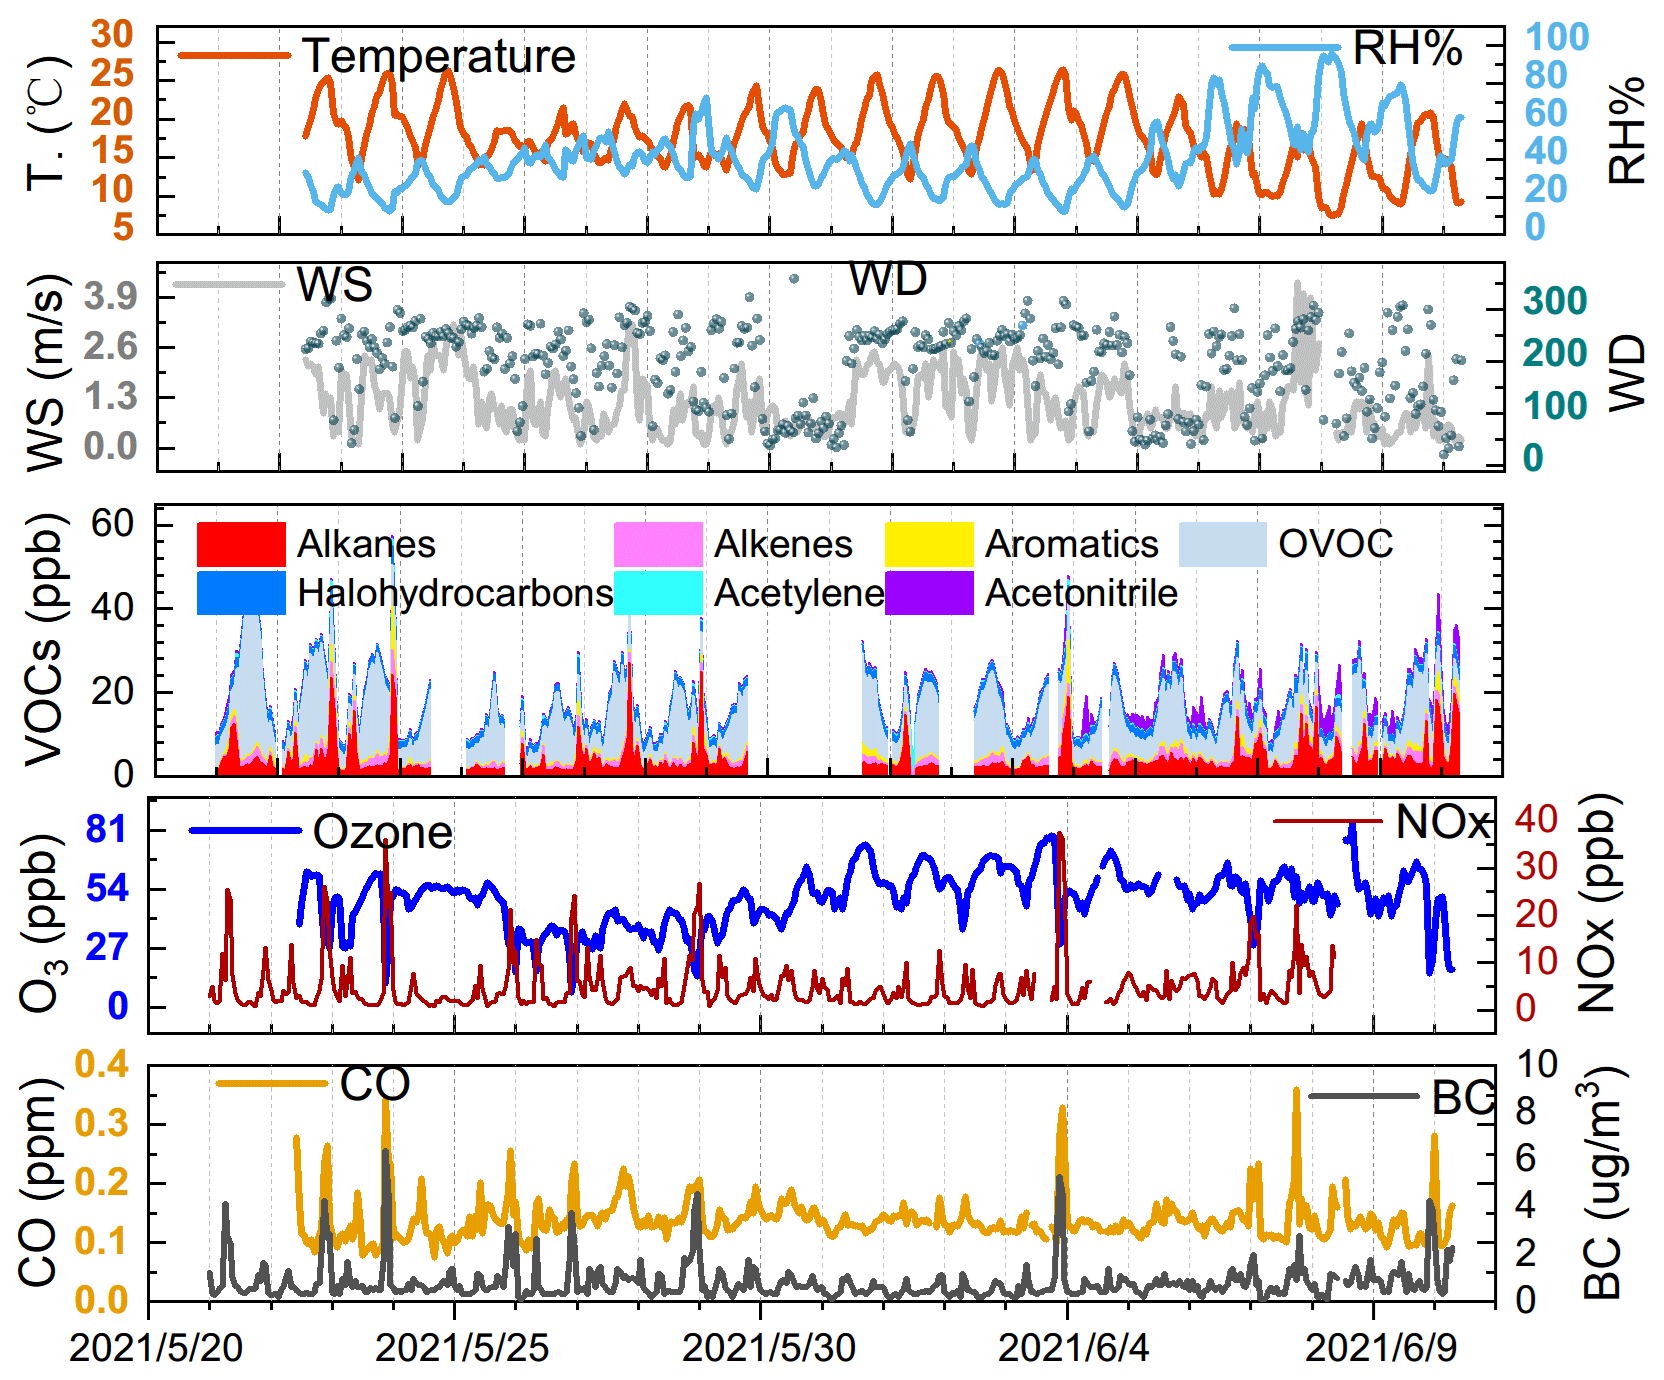
Figure 1Time-series variations in hourly-averaged meteorological parameters, VOCs, and inorganic tracers during the 3 weeks of measurements in Lhasa. Dashed lines mark midnight of the day.
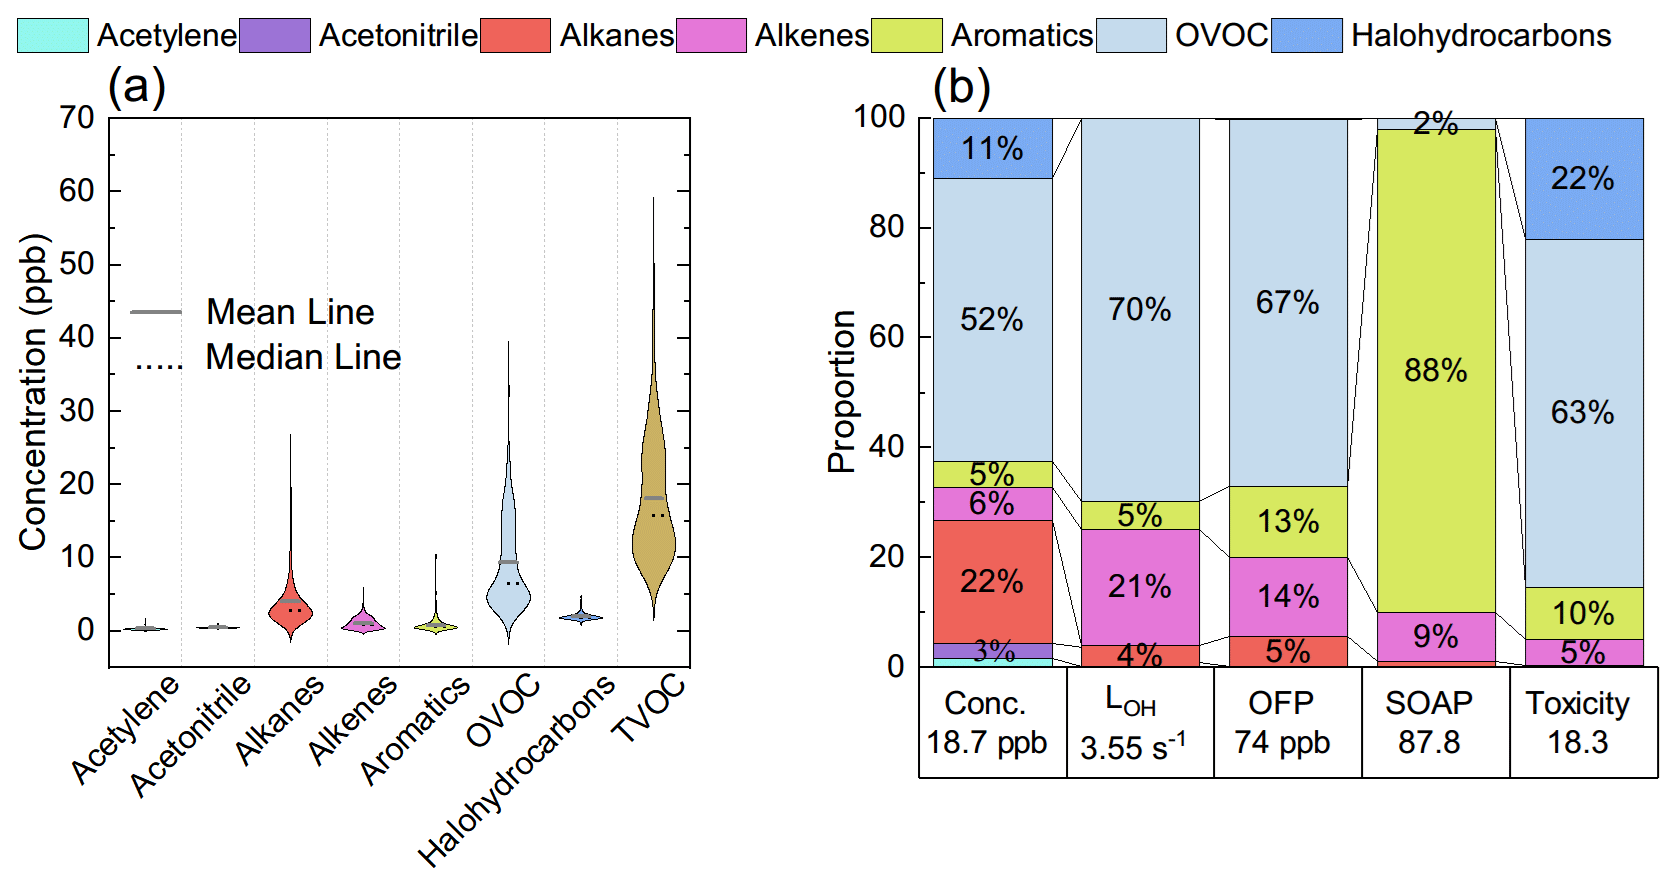
Figure 2Concentrations of key types of VOC species (a) and their contribution to TVOCs, LOH, OFP, SOAP, and toxicity (b).
Table 1Comparison of OVOC concentrations in different sites (ppb).
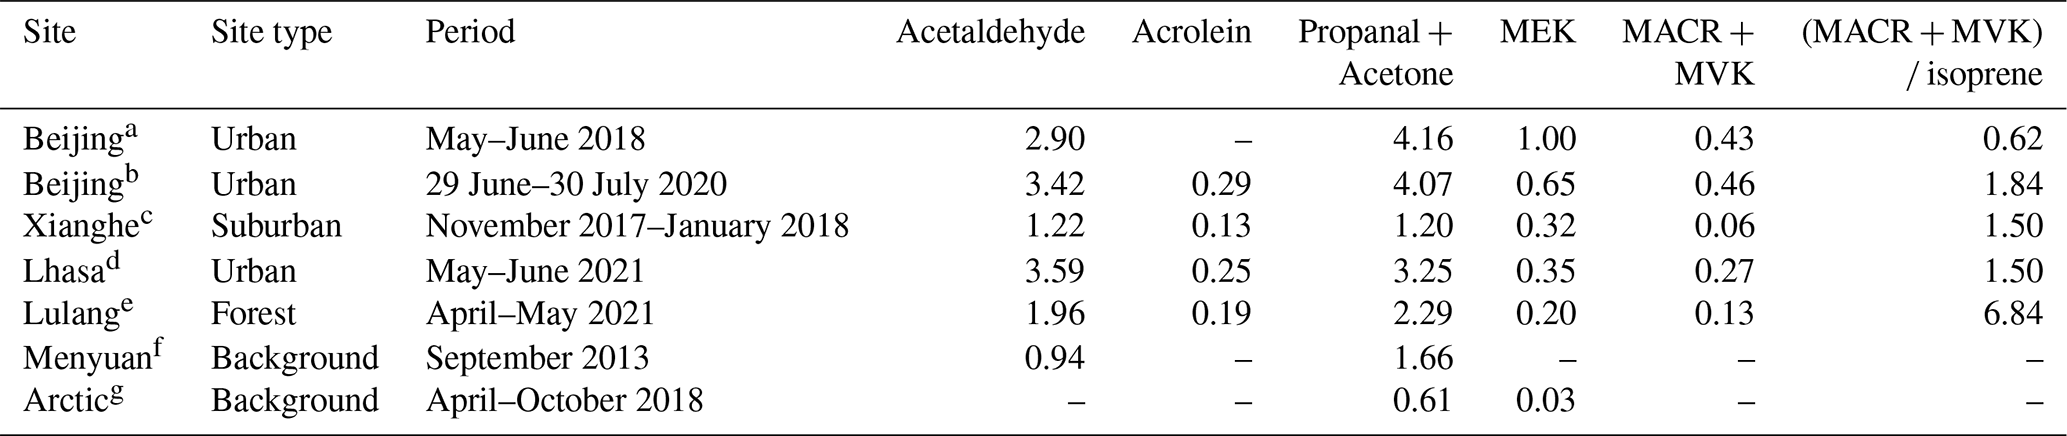
a Huang et al. (2020). b Zhang et al. (2022). c Yang et al. (2019). d This study. e Our measurement in 2021. f Zhao et al. (2020). g Pernov et al. (2021).
Abbreviations: MEK: methyl ethyl ketone; MVK: methyl vinyl ketone; MACR: methacrolein.
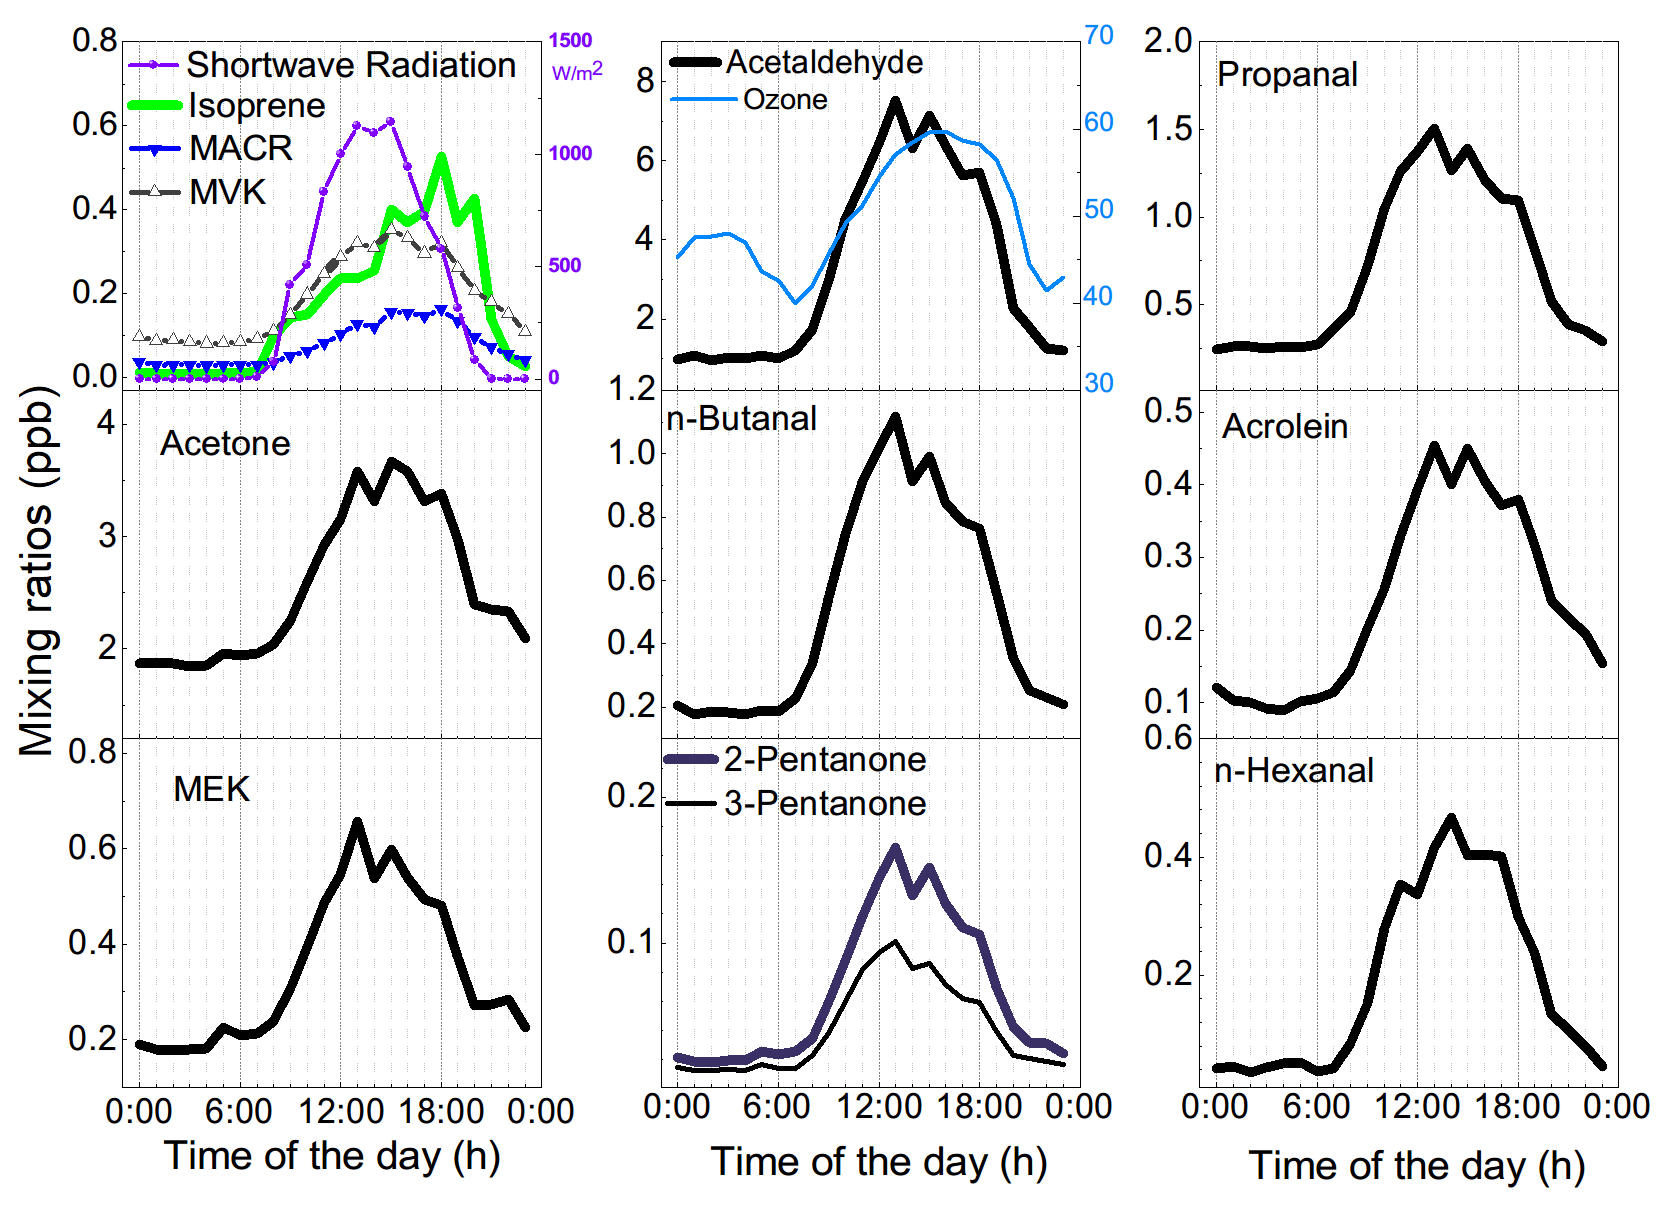
O3 varied between 15.6 and 84.0 ppb with an hourly mean value of 49.6 ± 12.9 (±1 SD) ppb and a median value of 51.5 ppb. A typical noontime peak at approximately 58.5 ppb was observed, suggesting that the notable photochemical production of ozone occurred. O3 precursors are not only abundant but also reactive in this highland city. The NOx concentration varied between 0.73 and 37.58 ppb, with a noontime NO2 minimum of 0.45 ppb and a noontime NO2 photolysis lifetime of 2–11 min. Early morning and later afternoon peaks of NOx indicated the major contribution of traffic emissions. Both the CO of 137.7 ± 35.5 ppb and BC levels of 0.8 ± 0.6 µg m−3 were much higher than background levels (Zheng et al., 2017; Zhao et al., 2020), confirming the influence of the transport sector and biomass burning. The TVOC concentration reached 18.70 ± 8.35 ppb. The online GC-MS VOC measurements highlighted that a considerable fraction of the total VOCs (TVOCs) comprised OVOCs (Figs. 1 and 2a). Specifically, OVOCs accounted for the largest proportion (52 %) of the TVOCs (Fig. 2b), while alkanes, alkenes, aromatics, and halohydrocarbons accounted for 22 %, 6 %, 5 %, and 11 %, respectively. The major OVOCs, except for methyl tert-butyl ether (MTBE), are listed in Table 1. Most OVOCs were the photochemical intermediates of alkanes and less abundant alkenes, such as isoprene (Atkinson and Arey, 2003; Mellouki et al., 2015). The much higher abundance of OVOCs than that of their precursors suggests that the photochemical decay of alkenes and long-chain alkanes in the highland environment leads to the effective photochemical accumulation of these measured OVOCs. The concentration of acetaldehyde is comparable to that in Beijing summer, but the (MVK + MACR) isoprene ratio of 1.5 is also comparable to or higher than those values in Beijing summer (Table 1). A high abundance of reactive OVOCs could also promote the photochemical production of O3 and SOA, in addition to these primary VOCs. In our case, only small OVOC molecules (C ≤ 6) were recorded via online GC-MS; hence, O3 production, rather than SOA formation, could be better induced, even though the considerable abundance of aromatics and expected photochemical intermediates of aromatics (not fully measured here) also indicated a high potential for SOA production.
The LOH, OFP, SOAP, and toxicity of VOCs were evaluated. As shown in Fig. 2b, alkenes and OVOCs accounted for over 90 % of the LOH and over 80 % of the OFP, suggesting their key role in perturbing the photochemistry of O3. Acetaldehyde and acetone were the top two OVOC species (Table S1), and their concentrations reached 3.59 ± 3.44 and 2.53 ± 0.83 ppb, respectively, accounting for 19.2 % and 13.5 % of the TVOCs. Due to the relatively high reactivity of aldehydes, C3–C6 acetaldehydes were also the most important species in terms of LOH and OFP. The concentrations of alkenes were lower than those of alkanes but contributed more to LOH, OFP, SOAP, and toxicity. For example, due to its high activity, isoprene ranked second in terms of LOH. Although halohydrocarbons and biomass burning tracers of acetonitrile also comprised a considerable fraction of the TVOCs (14 %), their inert nature inhibits their perturbation effects on the O3 photochemistry. While aromatics further contributed 13 % to the OFP, it absolutely dominated the SOAP. Alkenes, mainly isoprene, also contributed 9 % to the SOAP. Therefore, alkenes, OVOCs, and aromatics are the key VOCs perturbing the photochemistry. It was alkenes, OVOCs, and aromatics that also contributed more than 78 % to the toxicity. Specifically, the contributions of benzene, toluene, ethylbenzene, m,p-xylene, o-xylene (BTEX), and isoprene-derived OVOCs to both the SOAP and toxicity were high. The contribution of each important VOC species to TVOCs, LOH, OFP, SOAP, and toxicity is shown in Fig. 3.
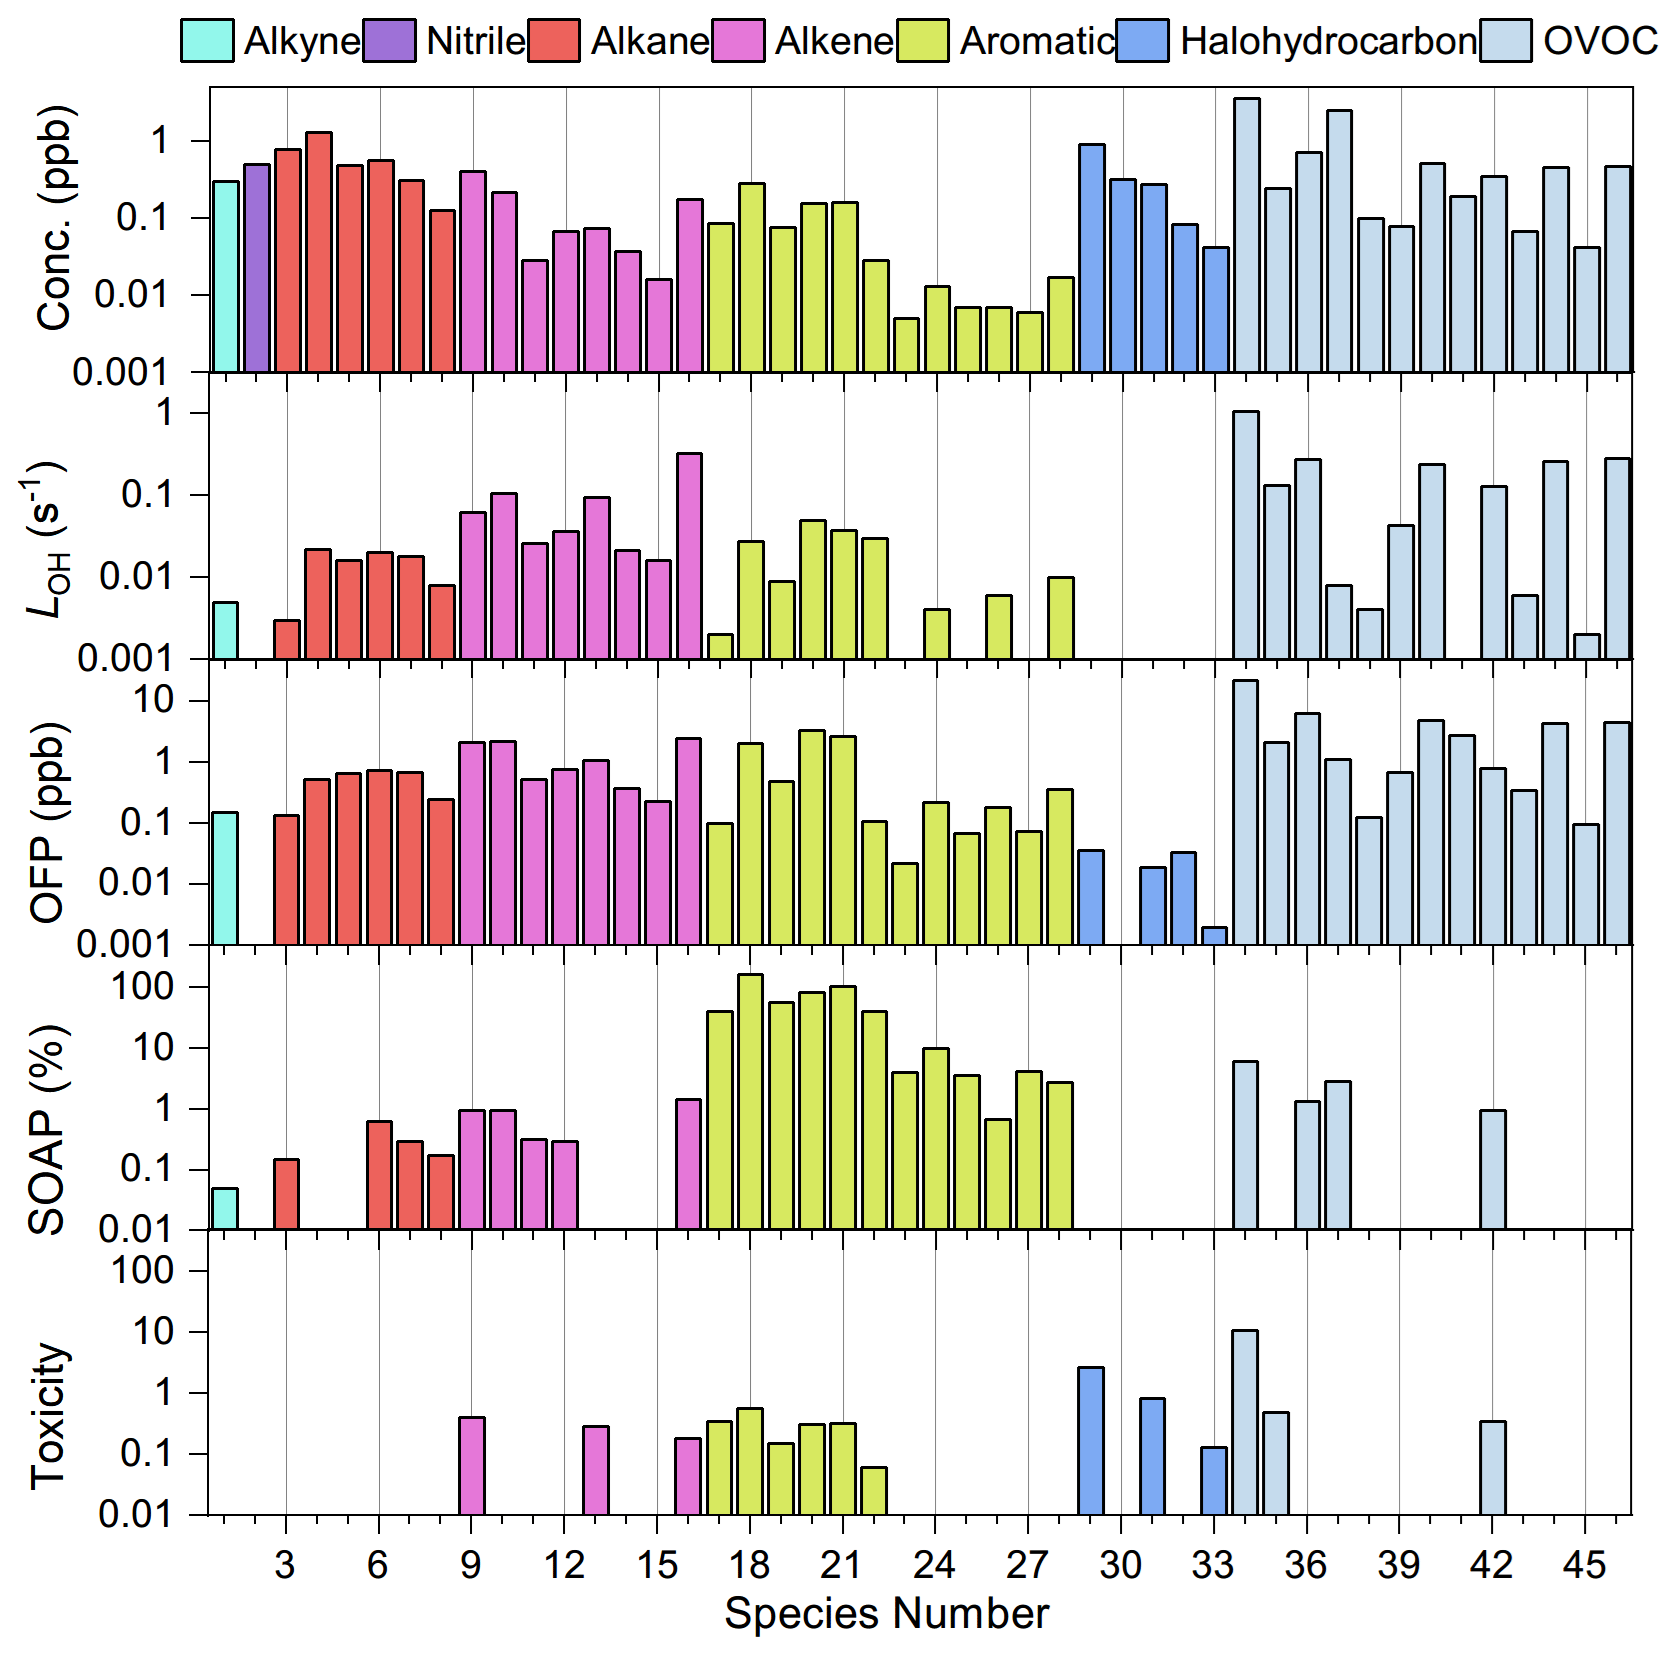
Figure 3The 46 VOC tracers selected for source appointment for PMF analysis and their contribution to TVOCs, LOH, OFP, SOAP, and toxicity if available. At least one tracer for typical VOC emission sources and one VOC tracer from each type of VOCs were included. These selected VOCs contribute over 90 % to TVOCs, LOH, OFP, SOAP, and toxicity. Species number is listed in Table S1.
The concentrations of the TVOCs and major anthropogenic alkanes and aromatics measured in this study are approximately twice as low as those measured in the megacity of Beijing (Li et al., 2020) but are several folds or even more than 1 order of magnitude higher than those measured at most other regional measurement sites across the TP (Xue et al., 2013; Xu et al., 2022) (Table 2), confirming the anthropogenic contribution to VOCs. The levels of alkenes, especially isoprene, are comparable to measurements in the megacity of Beijing (Li et al., 2020) or at a forested site in Lulang (another measurement study within the @Tibet field campaigns), suggesting a possible biogenic contribution to VOCs in addition to anthropogenic emissions. The OVOCs measured in this study were among the most abundant at all the urban, suburban, background, and forested station sites listed in Table 1. As stated above, both the topography and high ultraviolet (UV) irradiation, accompanied by NOx emissions, could encourage the accumulation of OVOCs in the Lhasa River valley. Compared to the three previous measurements of VOCs in Lhasa (Yu et al., 2001, 2022a; Guo et al., 2022), we measured more abundant OVOCs and therefore higher OVOC proportions. The relatively high abundance of alkanes was captured by all VOC measurements in Lhasa. Specific OVOCs and aromatics were also comparable in concentration in all the measurements in Lhasa when these species were included (Table S2). Our online GC-MS deployment, with more comprehensive VOC measurements, represent the VOC pollution for Lhasa well.
Table 2Comparison of VOCs concentrations in different sites (ppb).
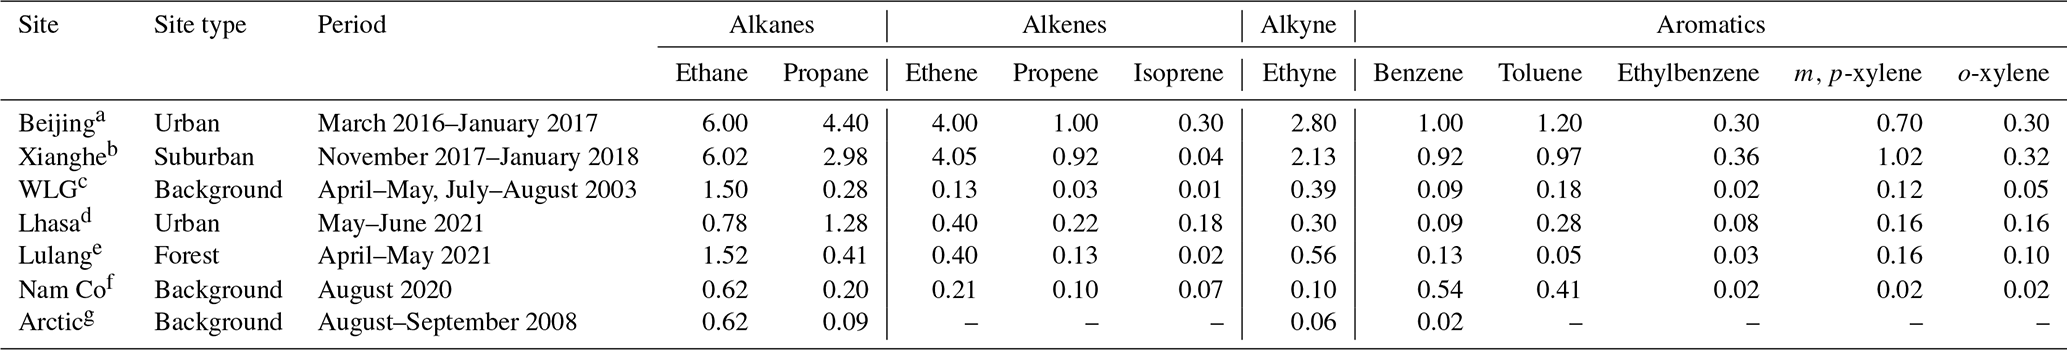
a Li et al. (2020). b Yang et al. (2019). c Xue et al. (2013). d This study. e Our measurement in 2021. f Xu et al. (2022). g Hellen et al. (2012).
3.2 Source apportionment of VOCs
A total of 37 out of 98 VOC species were measured with a signal-to-noise ratio over 2, and another 31 species were measured with a signal-to-noise ratio between 0.2–2. Apart from the signal-to-noise ratio, more considerations were applied for PMF VOC selection. The most abundant species of alkanes, alkenes, OVOCs, and aromatics were selected and further weighted by their contribution to LOH, OFP, SOAP, and toxicity; most importantly their tracing role was to identify typical sources of VOCs (Fig. 3 and Table S1). Specifically, the 13 most abundant OVOCs are selected, with acetaldehyde, acetone, propanal, and n-butanal being the top four species. Among them, intermediate oxidation products of isoprene, MACR and MVK, are key tracers for biogenic sources (Guenther et al., 2012; Mo et al., 2018), and MTBE is a tracer of gasoline emissions (McCarthy et al., 2013; Li et al., 2018). The 12 most abundant aromatics are selected following OVOCs. Among them, benzene, toluene, and ethylbenzene are tracers of biomass burning, vehicle emissions, industrial emissions, and solvent usage (Liu et al., 2008; Yuan et al., 2010). A selected series of BTEX is the source tracer of solvent usage (Yuan et al., 2010; Liu et al., 2020). The seven most abundance alkenes and six most abundant alkanes are further selected. Among them, ethane, propane, and ethylene are important components of combustion emission plumes (Baudic et al., 2016). Isopentane and n-pentane are tracers of gasoline evaporation (Baudic et al., 2016; Liu et al., 2008). A series of tracers were also selected from halohydrocarbons. For example, 1,2-dichloroethane and chloroform are associated with industrial solvents or additives (Cai et al., 2010). Ozone-depleting substances such as freon 11 were recognized as background compounds, which were formerly used as refrigerants but are now largely banned (Saeaw and Thepanondh, 2015). Together with acetonitrile and acetylene, chloromethane is a tracer of biomass burning (Liu et al., 2008; Chen et al., 2017). Finally, 46 out of 98 VOC species were selected for PMF analysis. These species contributed 94.8 % to the TVOCs, 96.8 % to LOH, 96.9 % to the OFP, 98.3 % to the SOAP, and 97.5 % to the toxicity. Inorganic species BC, NOx, NO, and CO were also included to help to discriminate the transport sector from biomass burning and solvent usage, as distinct emission ratios of these inorganic species are well documented for these types of emission sources (Chen et al., 2017; Gentner et al., 2017). Finally, 50 chemical species were selected and included in PMF analysis, and these 50 species could inform us of both the source identity and environmental significance of VOCs in the city of Lhasa (Fig. 3).
PMF decomposed six factors (Fig. 4). The tracers of emission sources were normally described well by one to three of the factors. Factor one accounted for over 60 % of BC and NOx but contributed much less to CO, leaving diesel vehicle emissions as the source identity (Gentner et al., 2017). A series of lines of evidence further support this appointment. A considerable contribution to ethylene, propene, and some aromatics agrees with the source spectrum of diesel vehicle emissions (Mo et al., 2016). The source spectrum of the decomposed diesel vehicle emissions resembles the typical spectrum collected from on-road sampling (Fig. 5). As shown Fig. 6, ternary analysis of the benzene series also confirmed the contribution of diesel vehicle emissions to VOCs (Zhang et al., 2016). Finally, the diel profile of the decomposed diesel vehicle emissions reflected the early morning and later evening rush hours with heavy-duty trucks crossing the city, as the daytime prohibition policy of trucks has been implemented in Lhasa (Fig. 7). The overall contribution of diesel vehicle emissions to the TVOCs was minor, reminding us of the benefits of the effective management of diesel vehicle emissions in Lhasa. Meanwhile, its contributions to aromatics, BC, and NOx were considerable or even important. Although the daytime prohibition policy of trucks allocates diesel vehicle emissions to the early morning and the later afternoon, i.e. a pattern to minimize its perturbation effect on the photochemistry of O3 and SOAs, the overall contribution of diesel vehicle emissions to the OFP, SOAP, and toxicity underlines the need to further reduce these emissions. There is an ongoing discussion on the replacement of diesel vehicles by electric cars. While we still do not see the progress of this replacement in real life, electric trucks could surely reduce the emissions of BC, NOx, and aromatics and therefore should be encouraged in the highland city of Lhasa with strong solar radiation.
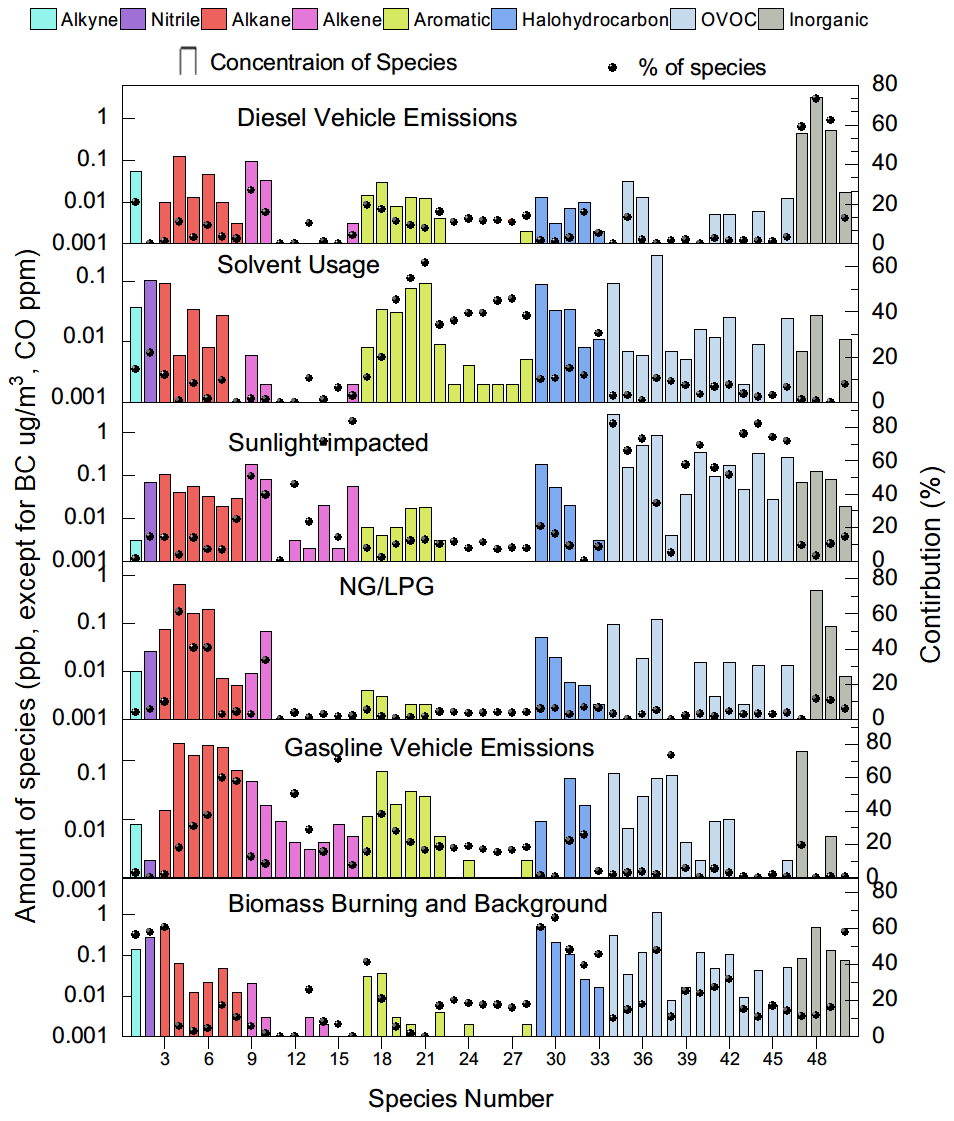
Figure 4Source factors by PMF decomposition and source identity attribution for the 4 inorganic tracers and 46 VOC tracers. (The concentration units for BC and CO are µg m−3 and ppm.)
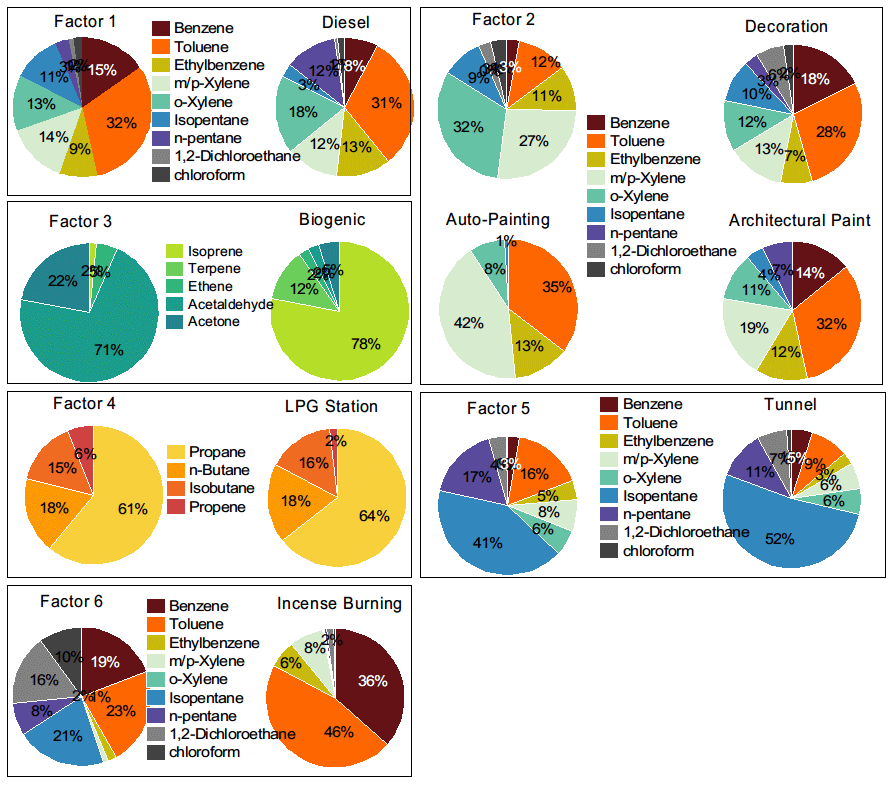
Figure 5Comparison of source spectrums decomposed by PMF with the typical source spectrum measured in our study and reported in the literature. The data of auto-painting and architectural paint were from Yuan et al. (2010).
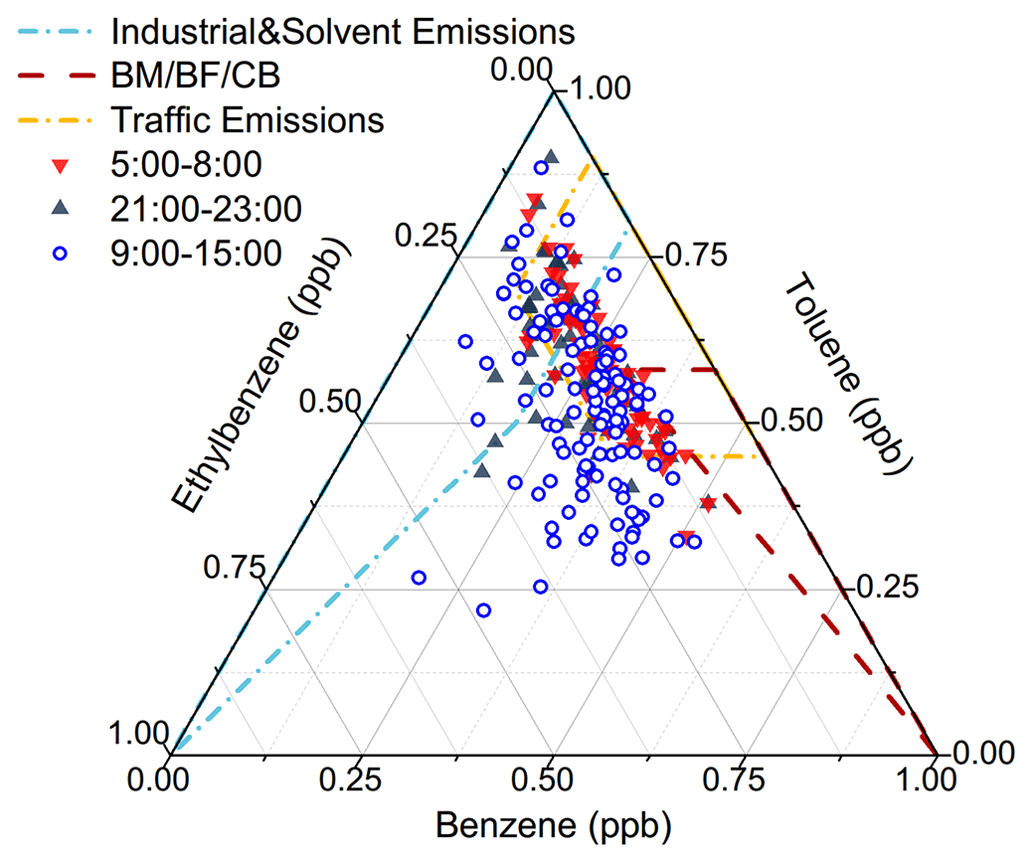
Figure 6Ternary diagram of benzene, toluene, and ethylbenzene. Plot suggests the combined contribution to aromatics from vehicle emissions, solvent usage, and biomass burning. BM/BF/CB indicates biomass/biofuel/coal burning. The wireframes include more than 90 % of the scatter collected from references (Zhang et al., 2016).
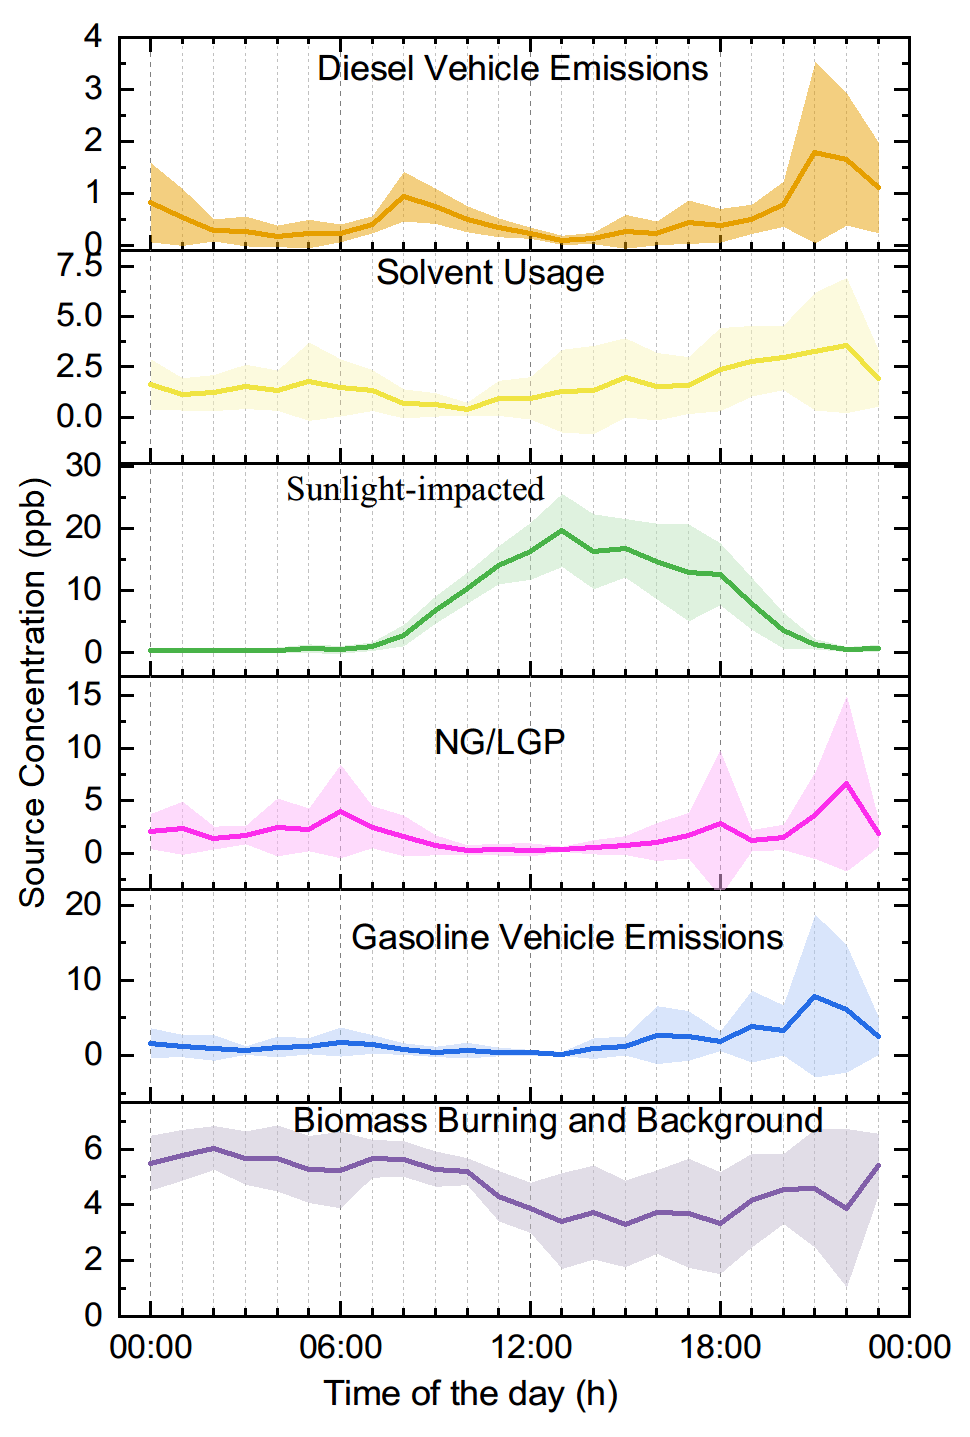
Factor two featured a considerable contribution to aromatics and nearly no contribution to inorganic tracers (Fig. 4). The source spectrum was comparable to that of solvent usage emissions (Fig. 5) and consistent with the source profile of various solvent usages (Yuan et al., 2010; von Schneidemesser et al., 2016; Baudic et al., 2016). The ternary diagram of benzene, toluene, and ethylbenzene highlighted the contribution of solvent usage to aromatics. The diel profile of solvent usage emissions exhibited a nighttime peak (Fig. 7) as a result of the continuous emission and boundary layer regulation of VOC species. Although aromatics are not as reactive as alkenes or OVOCs, the associated SOAP, OFP, and toxicity currently indicate less effective management of solvent usage in Lhasa. Multiple painting activities in small businesses are observed in the city. The low pressure further increases the evaporation rate of solvents in this highland city. This requires strict implementation of regulation measures and workplace evaporation confinement techniques to effectively reduce the emission strength of aromatics and also to protect the health of workers.
Factor three accounted for isoprene and most of the OVOCs. Acetaldehyde and acetone are photochemical intermediates of many VOC precursors (Mellouki et al., 2015). The other selected OVOCs, except for MTBE, retained a double-bond feature, indicating that alkenes were their key precursors (Fig. 4) (Baudic et al., 2016). The typical daytime peak of OVOCs, as confirmed in Figs. 7–8, supported the source identity of the sunlight-impacted factor. Notably, several alkanes, alkenes, and aromatics are not only tracers of anthropogenic sources but also suspected precursors of these OVOCs. The contribution of anthropogenic sources to the sunlight-impacted factor could thus not be excluded. A detailed budget analysis might be helpful to further identify the source of these OVOCs.
Factor four featured a heavy contribution to propane, isobutene, n-butane, and propene, which indicated the combustion of LPG for traffic and cooking (Fig. 4). A low contribution of LPG combustion to NOx also seemed reasonable, as central heating services cease at this time of the year (Liu et al., 2008; Lyu et al., 2016). The source spectrum of the decomposed LPG combustion resembled that sampled at the LPG station (Fig. 5). The diel profile of factor four also reflected the intensive usage of LPG from later in the night to the early morning, likely for cooking purposes (Fig. 7). The low contribution of LPG combustion to most of these reactive VOCs verifies the effectiveness of the government policy to replace small coal-fired boilers with LPG-fuelled central heating systems in the city. Notably, the considerable contribution of the LPG factor to NOx underlines the side effect of LPG-fuelled central heating.
Factor five featured a heavy contribution to a series of alkanes and a considerable contribution to several alkenes, MTBE, and nearly all aromatics (Fig. 4). Gasoline vehicle emissions were therefore suspected (Liu et al., 2008; Lyu et al., 2016). Daytime tunnel sampling of the source spectrum confirmed this appointment (Fig. 5). The diel profile of gasoline vehicle emissions reflected the afternoon pattern of leisure life activities and the long rush hour in Lhasa (Fig. 7). The negligible contribution to NOx was unexpected, which could be attributed to the uncertainty in this analysis. Further measurement of the vehicle emission ratio of NOx at this high altitude is encouraged. The vehicle population has increased sharply in Lhasa. As a recognized issue in air quality control, gasoline vehicle emissions and related fuel evaporation need better management. In contrast to electric trucks, electric cars have been a practical option to reduce the emissions of both BC and all aromatics.
Factor six represented the last important source, which contributed evenly to inorganic tracers, alkanes, alkenes, aromatics, and OVOCs. While this indicates a mixture of varied source contributions, the heavy contributions to acetylene and acetonitrile highlighted biomass burning emissions (Fig. 4) (Akagi et al., 2011; Pernov et al., 2021). The diel profile suggested boundary layer regulation and further indicated a background feature of factor six. In fact, a series of regional sources could not be decomposed in our PMF analysis. Biomass burning has been a regional source of both VOCs and BC (Li et al., 2017). Our interview with local residents suggests the abandonment of biomass in household heating. However, biomass burning in the suburban area was observed. In addition, incense burning in Lhasa is another source of VOCs and BC (Cui et al., 2018; Lu et al., 2020). A comparison of the decomposed source spectrum to our measurements of the incense burning emission spectrum indicates the potential contribution of this source to factor six. We therefore identified factor six as biomass burning and a background source. This source contributed considerably to BC, NOx, and aromatics and therefore must not be negligible.
A previous source appointment by Guo et al. (2022) confirmed the contribution of diesel vehicle emissions, solvent usage, NG/LPG, gasoline vehicle emissions, and biomass burning and background sources. However, due to the failure of OVOC measurements therein, the sunlight-impacted factor was not decomposed. This led to the underestimation of the TVOCs, LOH, OFP, SOAP, and toxicity and negligence concerning biogenic emissions. A more comprehensive understanding of the key species and key source of VOCs should be updated according to our analysis.
Our results confirmed the anthropogenic contribution to VOCs in Lhasa. Both the topography and high ultraviolet (UV) irradiation, accompanied by anthropogenic NOx emissions, could encourage the accumulation of OVOCs in the Lhasa River valley. As a matter of fact, OVOCs accounted for the largest proportion of the TVOCs and the total OH reactivity. The much higher abundance and stronger contribution to the total OH reactivity of OVOCs than that of their precursors also characterized the photochemical decaying features of, for example, alkenes and long-chain alkanes in the Lhasa River valley. Effective photochemical production and accumulations of these measured OVOCs would perturb the budget of radicals and promote the photochemical production of O3 and SOA, in addition to these primary emissions of those VOC precursors. Our measurement and source appointment based on online GC-MS of VOCs clearly showed the contribution of six typical sources to their concentration, environmental impact, and health effect. Figure 9 further shows the diel profiles of the contributions of the six decomposed VOC sources. TVOC shows bi-peak patterns at noontime and in the later afternoon. The former was dominated by OVOCs, and the latter was dominated by the combination of LPG, solvent usage, and gasoline vehicle emissions. Due to the chemical reactivity of OVOCs and alkenes, the sunlight-impacted factor dominated LOH, OFP, and toxicity and contributed to the SOAP (Fig. 10). In regard to O3 production, not only the absolute contribution but also the diel profiles of the sources are important. The overlap of the abundant OVOCs and alkenes with the photochemical production of O3 during the daytime further amplifies the role of the sunlight-impacted factor in O3 pollution in Lhasa. Nighttime and early morning accumulation of other OVOC precursors, such as alkanes and aromatics, could also contribute to the daytime accumulation of OVOC and O3 production via photochemical oxidation. However, the role of these photochemical oxidation reactions could not be determined in PMF analysis. A full O3 budget analysis with a chemical model is planned to better quantify the role of various VOC sources in O3 production. Aromatics were the major contributors to the SOAP. Source appointment suggested the combined contribution of solvent usage, diesel vehicle emissions, and biomass burning and background sources. While boundary layer development during the daytime could dilute aromatics and other VOCs, the SOAP of these three sources could not be fully determined. Deduced based on the accumulation of these abundant OVOCs, the accumulation of the oxidative intermediates of aromatics was also expected but was not measured by our GC-MS instrument. The suppression of aromatics contribution into the SOAP due to boundary layer dilution could potentially be offset by the accumulation of the oxidative intermediates of aromatics. This assumption will also be further examined via MS aerosol chemical component analysis and chemical model examination. In contrast, OVOC contributions to the SOAP were confirmed, although photochemical intermediates of aromatics, at least these primary intermediates, were not measured by GC-MS.
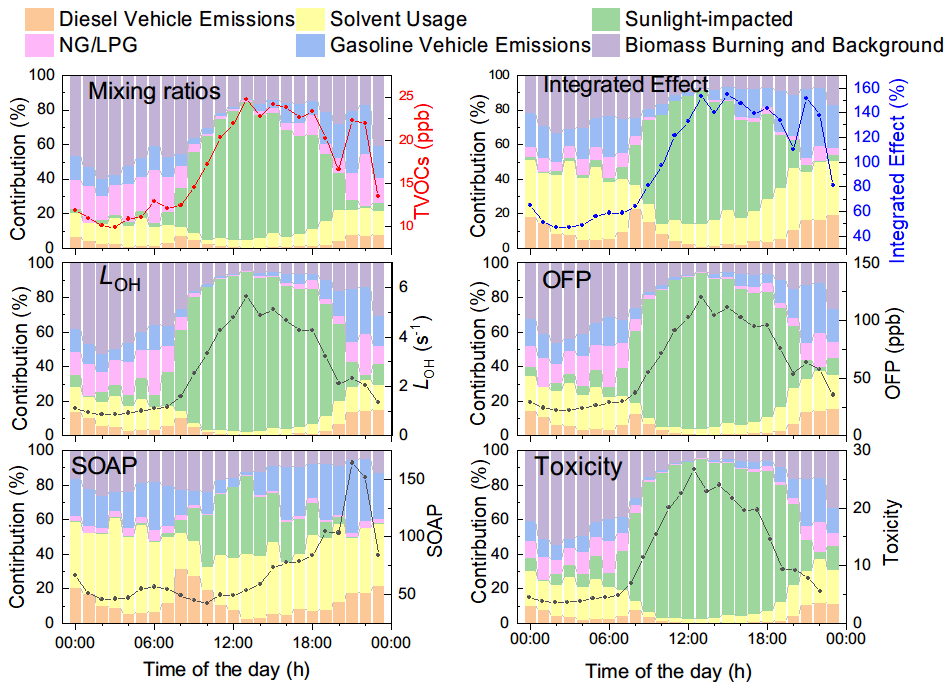
Figure 9Diel profiles of key sources of VOCs and their contributions to TVOCs, LOH, SOAP, toxicity, OFP, and integrated effect.
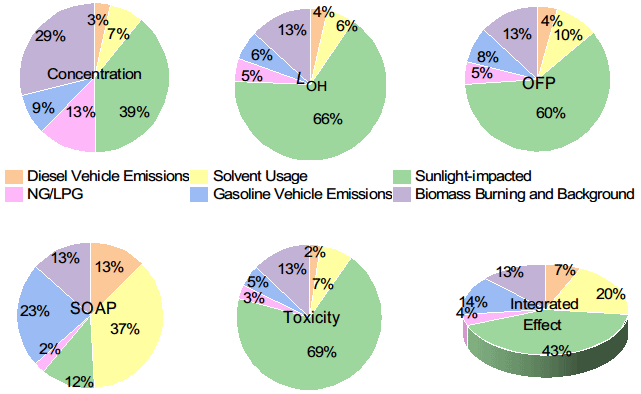
Figure 10Average contributions of key sources to TVOCs, LOH, SOAP, toxicity, OFP, and integrated effect.
The role of OVOCs highlights that photochemical oxidation of primarily emitted VOCs in the highland city of Lhasa further amplifies the role of primary sources in O3 photochemical production. Especially in the highland city of Lhasa located in the Lhasa River valley, both active photochemistry powered by high UV and high NOx levels and the topography are favourable conditions for the accumulation of OVOCs but unfavourable conditions for O3 pollution control. There has been an ongoing discussion on how the natural cycle of VOCs is amplified by the anthropogenic emission of NOx in terms of the SOA yield (Ziemann and Atkinson, 2012; Priestley et al., 2021; Luo et al., 2021; Zhan et al., 2021). Our data show that not only the SOAP but also LOH, OFP, and toxicity are amplified by the mutual feedback among the biogenic and anthropogenic emissions of VOCs and anthropogenic emissions of NOx. As such, simultaneous emission reduction in VOCs and NOx should be considered. Transport sector emissions and biomass burning and background emissions should be targeted for their contributions to VOCs, NOx, and BC. Due to the potential contribution of biogenic alkenes to OVOCs, the benefits of biogenic emission reduction could be high. Presently, Lhasa city is devoted to planting trees and managing dust pollution along the Lhasa River Valley. Side effects of biogenic emission and O3 pollution controls should be considered.
All data used in this paper were collected during the @Tibet campaigns in 2021 and are publicly available. The merged dataset is managed by the authors and the TP data centre and can be downloaded currently at https://doi.org/10.11888/Cryosphere.tpdc.300006 (Ye, 2022).
The supplement related to this article is available online at: https://doi.org/10.5194/acp-23-10383-2023-supplement.
CY and WL designed the research. SG, JW, CZ, and YC carried out the field measurements. SG performed data analysis and interpreted the data. CY, SG, WL, and JW prepared the manuscript with contributions from all co-authors.
The contact author has declared that none of the authors has any competing interests.
Publisher’s note: Copernicus Publications remains neutral with regard to jurisdictional claims in published maps and institutional affiliations.
This article is part of the special issue “In-depth study of the atmospheric chemistry over the Tibetan Plateau: measurement, processing, and the impacts on climate and air quality (ACP/AMT inter-journal SI)”. It is not associated with a conference.
We thank the staff in the Lhasa Branch of the Institute of Qinghai–Tibetan Plateau Research, Chinese Academy of Sciences, for their help.
This research has been supported by the National Natural Science Foundation of China (grant nos. 41875151 and 21876214) and the Second Tibetan Plateau Scientific Expedition and Research Program (grant no. 2019QZKK0604).
This paper was edited by Lisa Whalley and reviewed by Daniel Blomdahl and one anonymous referee.
Akagi, S. K., Yokelson, R. J., Wiedinmyer, C., Alvarado, M. J., Reid, J. S., Karl, T., Crounse, J. D., and Wennberg, P. O.: Emission factors for open and domestic biomass burning for use in atmospheric models, Atmos. Chem. Phys., 11, 4039–4072, https://doi.org/10.5194/acp-11-4039-2011, 2011.
Atkinson, R. and Arey, J.: Atmospheric degradation of volatile organic compounds, Chem. Rev., 103, 4605–4638, https://doi.org/10.1021/cr0206420, 2003.
Baudic, A., Gros, V., Sauvage, S., Locoge, N., Sanchez, O., Sarda-Estève, R., Kalogridis, C., Petit, J.-E., Bonnaire, N., Baisnée, D., Favez, O., Albinet, A., Sciare, J., and Bonsang, B.: Seasonal variability and source apportionment of volatile organic compounds (VOCs) in the Paris megacity (France), Atmos. Chem. Phys., 16, 11961–11989, https://doi.org/10.5194/acp-16-11961-2016, 2016.
Bigham, A. W. and Lee, F. S.: Human high-altitude adaptation: forward genetics meets the HIF pathway, Genes. Dev., 28, 2189–2204, https://doi.org/10.1101/gad.250167.114, 2014.
Cai, C., Geng, F., Tie, X., Yu, Q., and An, J.: Characteristics and source apportionment of VOCs measured in Shanghai, China, Atmos. Environ., 44, 5005–5014, https://doi.org/10.1016/j.atmosenv.2010.07.059, 2010.
Carter, W. P. L.: Development of the SAPRC-07 chemical mechanism, Atmos. Environ., 44, 5324–5335, 2010.
Chen, J., Li, C., Ristovski, Z., Milic, A., Gu, Y., Islam, M. S., Wang, S., Hao, J., Zhang, H., He, C., Guo, H., Fu, H., Miljevic, B., Morawska, L., Thai, P., Lam, Y. F., Pereira, G., Ding, A., Huang, X., and Dumka, U. C.: A review of biomass burning: Emissions and impacts on air quality, health and climate in China, Sci. Total Environ., 579, 1000–1034, https://doi.org/10.1016/j.scitotenv.2016.11.025, 2017.
Cong, Z., Kang, S., Luo, C., Li, Q., Huang, J., Gao, S., and Li, X.: Trace elements and lead isotopic composition of PM10 in Lhasa, Tibet, Atmos. Environ., 45, 6210–6215, https://doi.org/10.1016/j.atmosenv.2011.07.060, 2011.
Cui, Y. Y., Liu, S., Bai, Z., Bian, J., Li, D., Fan, K., McKeen, S. A., Watts, L. A., Ciciora, S. J., and Gao, R.-S.: Religious burning as a potential major source of atmospheric fine aerosols in summertime Lhasa on the Tibetan Plateau, Atmos. Environ., 181, 186–191, https://doi.org/10.1016/j.atmosenv.2018.03.025, 2018.
Derwent, R. G., Jenkin, M. E., Utembe, S. R., Shallcross, D. E., Murrells, T. P., and Passant, N. R.: Secondary organic aerosol formation from a large number of reactive man-made organic compounds, Sci. Total Environ., 408, 3374–3381, https://doi.org/10.1016/j.scitotenv.2010.04.013, 2010.
Gentner, D. R., Jathar, S. H., Gordon, T. D., Bahreini, R., Day, D. A., El Haddad, I., Hayes, P. L., Pieber, S. M., Platt, S. M., de Gouw, J., Goldstein, A. H., Harley, R. A., Jimenez, J. L., Prevot, A. S. H., and Robinson, A. L.: Review of Urban Secondary Organic Aerosol Formation from Gasoline and Diesel Motor Vehicle Emissions, Environ. Sci. Technol., 51, 1074–1093, https://doi.org/10.1021/acs.est.6b04509, 2017.
Guenther, A. B., Jiang, X., Heald, C. L., Sakulyanontvittaya, T., Duhl, T., Emmons, L. K., and Wang, X.: The Model of Emissions of Gases and Aerosols from Nature version 2.1 (MEGAN2.1): an extended and updated framework for modeling biogenic emissions, Geosci. Model Dev., 5, 1471–1492, https://doi.org/10.5194/gmd-5-1471-2012, 2012.
Guo, S., Wang, Y., Zhang, T., Ma, Z., Ye, C., Lin, W., Yang Zong, D. J., and Yang Zong, B. M.: Volatile organic compounds in urban Lhasa: variations, sources, and potential risks, Front. Environ. Sci., 10, 941100, https://doi.org/10.3389/fenvs.2022.941100, 2022.
Hellen, H., Leck, C., Paatero, J., Virkkula, A., and Hakola, H.: Summer concentrations of NMHCs in ambient air of the Arctic and Antarctic, Boreal. Environ. Res., 17, 385–397, 2012.
Huang, J., Kang, S., Shen, C., Cong, Z., Liu, K., Wang, W., and Liu, L.: Seasonal variations and sources of ambient fossil and biogenic-derived carbonaceous aerosols based on 14C measurements in Lhasa, Tibet, Atmos. Res., 96, 553–559, https://doi.org/10.1016/j.atmosres.2010.01.003, 2010.
Huang, X.-F., Zhang, B., Xia, S.-Y., Han, Y., Wang, C., Yu, G.-H., and Feng, N.: Sources of oxygenated volatile organic compounds (OVOCs) in urban atmospheres in North and South China, Environ. Pollut., 261, 114152, https://doi.org/10.1016/j.envpol.2020.114152, 2020.
Li, C., Han, X., Kang, S., Yan, F., Chen, P., Hu, Z., Yang, J., Ciren, D., Gao, S., Sillanpää, M., Han, Y., Cui, Y., Liu, S., and Smith, K. R.: Heavy near-surface PM2.5 pollution in Lhasa, China during a relatively static winter period, Chemosphere, 214, 314–318, https://doi.org/10.1016/j.chemosphere.2018.09.135, 2019.
Li, H., He, Q., Song, Q., Chen, L., Song, Y., Wang, Y., Lin, K., Xu, Z., and Shao, M.: Diagnosing Tibetan pollutant sources via volatile organic compound observations, Atmos. Environ., 166, 244–254, https://doi.org/10.1016/j.atmosenv.2017.07.031, 2017.
Li, J., Zhai, C., Yu, J., Liu, R., Li, Y., Zeng, L., and Xie, S.: Spatiotemporal variations of ambient volatile organic compounds and their sources in Chongqing, a mountainous megacity in China, Sci. Total Environ., 627, 1442–1452, https://doi.org/10.1016/j.scitotenv.2018.02.010, 2018.
Li, Q., Su, G., Li, C., Liu, P., Zhao, X., Zhang, C., Sun, X., Mu, Y., Wu, M., Wang, Q., and Sun, B.: An investigation into the role of VOCs in SOA and ozone production in Beijing, China, Sci. Total Environ., 720, 137536, https://doi.org/10.1016/j.scitotenv.2020.137536, 2020.
Li, Q., Gong, D., Wang, H., Wang, Y., Han, S., Wu, G., Deng, S., Yu, P., Wang, W., and Wang, B.: Rapid increase in atmospheric glyoxal and methylglyoxal concentrations in Lhasa, Tibetan Plateau: Potential sources and implications, Sci. Total Environ., 824, 153782, https://doi.org/10.1016/j.scitotenv.2022.153782, 2022.
Liu, J., Li, J., Lin, T., Liu, D., Xu, Y., Chaemfa, C., Qi, S., Liu, F., and Zhang, G.: Diurnal and nocturnal variations of PAHs in the Lhasa atmosphere, Tibetan Plateau: Implication for local sources and the impact of atmospheric degradation processing, Atmos. Res., 124, 34–43, https://doi.org/10.1016/j.atmosres.2012.12.016, 2013.
Liu, Y., Shao, M., Fu, L., Lu, S., Zeng, L., and Tang, D.: Source profiles of volatile organic compounds (VOCs) measured in China: Part I, Atmos. Environ., 42, 6247–6260, https://doi.org/10.1016/j.atmosenv.2008.01.070, 2008.
Liu, Y., Song, M., Liu, X., Zhang, Y., Hui, L., Kong, L., Zhang, Y., Zhang, C., Qu, Y., An, J., Ma, D., Tan, Q., and Feng, M.: Characterization and sources of volatile organic compounds (VOCs) and their related changes during ozone pollution days in 2016 in Beijing, China, Environ. Pollut., 257, 113599, https://doi.org/10.1016/j.envpol.2019.113599, 2020.
Lu, F., Li, S., Shen, B., Zhang, J., Liu, L., Shen, X., and Zhao, R.: The emission characteristic of VOCs and the toxicity of BTEX from different mosquito-repellent incenses, J. Hazard. Mater., 384, 121428, https://doi.org/10.1016/j.jhazmat.2019.121428, 2020.
Luo, H., Chen, J., Li, G., and An, T.: Formation kinetics and mechanisms of ozone and secondary organic aerosols from photochemical oxidation of different aromatic hydrocarbons: dependence on NOx and organic substituents, Atmos. Chem. Phys., 21, 7567–7578, https://doi.org/10.5194/acp-21-7567-2021, 2021.
Lyu, X. P., Chen, N., Guo, H., Zhang, W. H., Wang, N., Wang, Y., and Liu, M.: Ambient volatile organic compounds and their effect on ozone production in Wuhan, central China, Sci. Total Environ., 541, 200–209, https://doi.org/10.1016/j.scitotenv.2015.09.093, 2016.
Ma, W.-L., Qi, H., Baidron, S., Liu, L.-Y., Yang, M., and Li, Y.-F.: Implications for long-range atmospheric transport of polycyclic aromatic hydrocarbons in Lhasa, China, Environ. Sci. Pollut. Res., 20, 5525–5533, https://doi.org/10.1007/s11356-013-1577-1, 2013.
McCarthy, M. C., Aklilu, Y.-A., Brown, S. G., and Lyder, D. A.: Source apportionment of volatile organic compounds measured in Edmonton, Alberta, Atmos. Environ., 81, 504–516, https://doi.org/10.1016/j.atmosenv.2013.09.016, 2013.
Mellouki, A., Wallington, T. J., and Chen, J.: Atmospheric Chemistry of Oxygenated Volatile Organic Compounds: Impacts on Air Quality and Climate, Chem. Rev., 115, 3984–4014, https://doi.org/10.1021/cr500549n, 2015.
Mo, Z., Shao, M., and Lu, S.: Compilation of a source profile database for hydrocarbon and OVOC emissions in China, Atmos. Environ., 143, 209–217, https://doi.org/10.1016/j.atmosenv.2016.08.025, 2016.
Mo, Z. W., Shao, M., Wang, W. J., Liu, Y., Wang, M., and Lu, S. H.: Evaluation of biogenic isoprene emissions and their contribution to ozone formation by ground-based measurements in Beijing, China, Sci. Total Environ., 627, 1485–1494, https://doi.org/10.1016/j.scitotenv.2018.01.336, 2018.
Niu, H., Mo, Z., Shao, M., Lu, S., and Xie, S.: Screening the emission sources of volatile organic compounds (VOCs) in China by multi-effects evaluation, Front. Environ. Sci., 10, 1–11, https://doi.org/10.1007/s11783-016-0828-z, 2016.
Okamoto, S. and Tanimoto, H.: A review of atmospheric chemistry observations at mountain sites, Prog. Earth Planet. Sci., 3, 34, https://doi.org/10.1186/s40645-016-0109-2, 2016.
Pernov, J. B., Bossi, R., Lebourgeois, T., Nøjgaard, J. K., Holzinger, R., Hjorth, J. L., and Skov, H.: Atmospheric VOC measurements at a High Arctic site: characteristics and source apportionment, Atmos. Chem. Phys., 21, 2895–2916, https://doi.org/10.5194/acp-21-2895-2021, 2021.
Priestley, M., Bannan, T. J., Le Breton, M., Worrall, S. D., Kang, S., Pullinen, I., Schmitt, S., Tillmann, R., Kleist, E., Zhao, D., Wildt, J., Garmash, O., Mehra, A., Bacak, A., Shallcross, D. E., Kiendler-Scharr, A., Hallquist, Å. M., Ehn, M., Coe, H., Percival, C. J., Hallquist, M., Mentel, T. F., and McFiggans, G.: Chemical characterisation of benzene oxidation products under high- and low-NOx conditions using chemical ionisation mass spectrometry, Atmos. Chem. Phys., 21, 3473–3490, https://doi.org/10.5194/acp-21-3473-2021, 2021.
Ran, L., Lin, W. L., Deji, Y. Z., La, B., Tsering, P. M., Xu, X. B., and Wang, W.: Surface gas pollutants in Lhasa, a highland city of Tibet – current levels and pollution implications, Atmos. Chem. Phys., 14, 10721–10730, https://doi.org/10.5194/acp-14-10721-2014, 2014.
Saeaw, N. and Thepanondh, S.: Source apportionment analysis of airborne VOCs using positive matrix factorization in industrial and urban areas in Thailand, Atmos. Pollut. Res.,, 6, 644–650, https://doi.org/10.5094/apr.2015.073, 2015.
von Schneidemesser, E., Coates, J., Denier van der Gon, H. A. C., Visschedijk, A. J. H., and Butler, T. M.: Variation of the NMVOC speciation in the solvent sector and the sensitivity of modelled tropospheric ozone, Atmos. Environ., 135, 59–72, https://doi.org/10.1016/j.atmosenv.2016.03.057, 2016.
Wang, M., Zeng, L., Lu, S., Shao, M., Liu, X., Yu, X., Chen, W., Yuan, B., Zhang, Q., Hu, M., and Zhang, Z.: Development and validation of a cryogen-free automatic gas chromatograph system (GC-MS/FID) for online measurements of volatile organic compounds, Anal. Methods, 6, 9424–9434, https://doi.org/10.1039/c4ay01855a, 2014.
Xu, Y., Yan, Y., Duan, X., Peng, L., Wu, J., Zhang, X., Niu, Y., Liu, Z., Zhang, D., and Wei, X.: Diurnal variation and source analysis of NMHCs at a background site of Nam Co (4730 m a.s.l.) in the interior area of Tibetan Plateau, Atmos. Pollut. Res., 13, 101520, https://doi.org/10.1016/j.apr.2022.101520, 2022.
Xue, L. K., Wang, T., Guo, H., Blake, D. R., Tang, J., Zhang, X. C., Saunders, S. M., and Wang, W. X.: Sources and photochemistry of volatile organic compounds in the remote atmosphere of western China: results from the Mt. Waliguan Observatory, Atmos. Chem. Phys., 13, 8551–8567, https://doi.org/10.5194/acp-13-8551-2013, 2013.
Yang, Y., Ji, D., Sun, J., Wang, Y., Yao, D., Zhao, S., Yu, X., Zeng, L., Zhang, R., Zhang, H., Wang, Y., and Wang, Y.: Ambient volatile organic compounds in a suburban site between Beijing and Tianjin: Concentration levels, source apportionment and health risk assessment, Sci. Total Environ., 695, 133889, https://doi.org/10.1016/j.scitotenv.2019.133889, 2019.
Ye, C.: Meteorological, O3, NOx, CO, BC and VOCs data from May to June 2021 in Lhasa (Institute of Tibetan Plateau Research, Chinese Academy of Sciences), National Tibetan Plateau Data Center [data set], https://doi.org/10.11888/Cryosphere.tpdc.300006, 2022.
Yin, X., de Foy, B., Wu, K., Feng, C., Kang, S., and Zhang, Q.: Gaseous and particulate pollutants in Lhasa, Tibet during 2013–2017: Spatial variability, temporal variations and implications, Environ. Pollut., 253, 68–77, https://doi.org/10.1016/j.envpol.2019.06.113, 2019.
Yu, J., Han, Y., Chen, M., Zhang, H., Chen, Y., and Liu, J.: Characteristics and Source Apportionment of Ambient VOCs in Lhasa, Environm. Sci., 43, 113–122, https://doi.org/10.13227/j.hjkx.202104038, 2022a (in Chinese).
Yu, J., Meng, L., Chen, Y., Zhang, H., and Liu, J.: Ozone Profiles, Precursors, and Vertical Distribution in Urban Lhasa, Tibetan Plateau, Remote Sens., 14, 2533, https://doi.org/10.3390/rs14112533, 2022b.
Yu, X. L., Tang, J., Zhou, L. X., Xue, H. S., and Xue, X. J.: Emission Characteristics and Sources of Non-methane Hydrocarbons at Lhasa Area, Acta Scientiae Circumstantiae, 21, 203–207, 2001 (in Chinese).
Yuan, B., Shao, M., Lu, S., and Wang, B.: Source profiles of volatile organic compounds associated with solvent use in Beijing, China, Atmos. Environ., 44, 1919–1926, https://doi.org/10.1016/j.atmosenv.2010.02.014, 2010.
Zhan, J., Feng, Z., Liu, P., He, X., He, Z., Chen, T., Wang, Y., He, H., Mu, Y., and Liu, Y.: Ozone and SOA formation potential based on photochemical loss of VOCs during the Beijing summer, Environ. Pollut., 285, 117444, https://doi.org/10.1016/j.envpol.2021.117444, 2021.
Zhang, Z., Zhang, Y. L., Wang, X. M., Lu, S. J., Huang, Z. H., Huang, X. Y., Yang, W. Q., Wang, Y. S., and Zhang, Q.: Spatiotemporal patterns and source implications of aromatic hydrocarbons at six rural sites across China's developed coastal regions, J. Geophys. Res.-Atmos., 121, 6669–6687, https://doi.org/10.1002/2016jd025115, 2016.
Zhang, Z., Man, H., Duan, F., Lv, Z., Zheng, S., Zhao, J., Huang, F., Luo, Z., He, K., and Liu, H.: Evaluation of the VOC pollution pattern and emission characteristics during the Beijing resurgence of COVID-19 in summer 2020 based on the measurement of PTR-ToF-MS, Environ. Res. Lett., 17, 024002, https://doi.org/10.1088/1748-9326/ac3e99, 2022.
Zhao, R. J., Dou, X. Y., Zhang, N., Zhao, X. Y., Yang, W., Han, B., Yu, H., Azzi, M., Wang, Y., and Bai, Z. P.: The characteristics of inorganic gases and volatile organic compounds at a remote site in the Tibetan Plateau, Atmos. Res., 234, 104740, https://doi.org/10.1016/j.atmosres.2019.104740, 2020.
Zhao, W., Zhang, X., Zhai, L., Shen, X., and Xu, J.: Chemical characterization and sources of submicron aerosols in Lhasa on the Qinghai–Tibet Plateau: Insights from high-resolution mass spectrometry, Sci. Total Environ., 815, 152866, https://doi.org/10.1016/j.scitotenv.2021.152866, 2022.
Zheng, J., Hu, M., Du, Z., Shang, D., Gong, Z., Qin, Y., Fang, J., Gu, F., Li, M., Peng, J., Li, J., Zhang, Y., Huang, X., He, L., Wu, Y., and Guo, S.: Influence of biomass burning from South Asia at a high-altitude mountain receptor site in China, Atmos. Chem. Phys., 17, 6853–6864, https://doi.org/10.5194/acp-17-6853-2017, 2017.
Ziemann, P. J. and Atkinson, R.: Kinetics, products, and mechanisms of secondary organic aerosol formation, Chem. Soc. Rev., 41, 6582–6605, https://doi.org/10.1039/c2cs35122f, 2012.