the Creative Commons Attribution 4.0 License.
the Creative Commons Attribution 4.0 License.
 | 19 Sep 2023
Cyclones enhance the transport of sea spray aerosols to the high atmosphere in the Southern Ocean
Jun Shi
Shanshan Wang
Shuhui Zhao
Miming Zhang
Suqing Xu
Qi Lin
Hang Yang
Siying Dai
Cyclones are expected to increase the vertical transport of sea spray aerosols (SSAs), which may significantly impact the climate by increasing the population of cloud condensation nuclei (CCN) and the cloud droplet number concentration (Nd). In this study, a high-time-resolution (1 h) aerosol monitoring was carried out in the middle and high Southern Hemisphere from 23 February to 4 March 2018. The characteristics of SSAs during three cyclones were observed during the cruise. The results showed that SSA level in the low atmosphere did not increase with the wind speed during cyclone processes, which was different from the anticipated scenario that SSA concentration would increase with wind speed. However, the size of SSA particles during cyclones was larger than that in the no-cyclone periods. It seems that the generation of SSAs was enhanced during cyclones, but SSA concentration near the sea surface increased scarcely. The upward-transport proportion was calculated according to the wind stress and sea salt flux between cyclone and non-cyclone periods. It indicated that more than 23.4 % of the SSAs were transported upwards by cyclone processes during event 1, and 36.2 % and 38.9 % were transported upwards in event 2 and event 3, respectively. The upward transport of SSAs was the main reason why SSA concentration did not increase in the low atmosphere. The transport of SSAs to the high atmosphere during cyclones may additionally increase the CCN burden in the marine boundary layer, which may affect the regional climate. This study highlights the importance of SSA transport to the high atmosphere by cyclones and extends the knowledge of SSA generation and the impact factor during the cyclone period in marine atmosphere.
- Article
(2760 KB) - Full-text XML
-
Supplement
(1256 KB) - BibTeX
- EndNote


Sea spray aerosols (SSAs) were one of the largest sources of primary aerosols in the marine atmosphere, making a significant contribution to aerosols in the marine atmosphere (McInnes et al., 1996). It is reported that the annual global SSA flux was estimated to be 1.01 × 10⁴ Tg yr−1 (Gong et al., 2002). Pure sea salt mostly consisted of NaCl and a mixture of one or more other salts, such as Mg, K, Ca and sulfates, and traces of organic materials (Thomas et al., 2022). SSAs were considered to be the most important contributor to aerosol light scattering in the marine boundary layer (MBL) (Quinn and Coffman, 1999; Takemura et al., 2002). In addition, as the source of cloud condensation nuclei (CCN), SSAs can alter solar radiation reflection, extend the lifetime of clouds and further impact the global climate (Pierce and Adams, 2006). The influence of SSAs on cloud properties was thought to be particularly intense over remote ocean regions devoid of continental particles. Studies have found that the largest SSA CCN number fractions, up to 65 %, were observed in the high southern latitudes (40 to 70∘ S) at low supersaturation (0.1 %) (Quinn et al., 2017).
SSAs are generated predominantly by the action of wind on the ocean (Stokes et al., 2013) as the major mechanism of SSA production is bubble bursting at the sea surface as a result of wind stress (Monahan and Muircheartaigh, 1980). Wind stress on the sea surface forms waves. Then bubbles are generated and return to the sea surface, creating whitecaps. Subsequently, the bubble bursts and jets droplets into the atmosphere. Hence, the sea salt particle size and the concentration of SSAs were significantly dependent on the wind speed (McDonald et al., 1982). However, some studies have shown that wind speed was not the sole impact factor of SSA production as humidity, temperature and the sea–air temperature would also impact SSA generation (Cole et al., 2003; Shi et al., 2022; Liu et al., 2021). The generation of SSAs in the marine atmosphere has been investigated in previous studies, but we are still lacking knowledge of the production of SSAs during extreme weather (such as cyclones) in the middle and high Southern Hemisphere.
Westerlies in the Southern Hemisphere fundamentally control regional patterns of air temperature and also regulate ocean circulation, heat transport and carbon uptake (Goyal et al., 2021). Moreover, the zone of westerlies is prone to cyclones, which dominate the precipitation pattern of the middle and high Southern Hemisphere (MyCoy et al., 2020). The Southern Ocean (SO) plays an important role in global carbon cycles and climate changes (Gruber et al., 2019). Furthermore, the SO is scarcely affected by human activities, so the influence of SSAs on CCN is particularly strong in this region.
Cyclones may carry large water volumes and impose strong winds, which have a significant impact on marine aerosols, especially on SSAs (Fang et al., 2009). Air convergence due to the reduction of pressure caused by cyclones may also affect SSA concentration. Typically, there is a higher frequency of cyclones during the summer season than in other seasons. It is reported that 959 cyclones occurred in the SO during the summertime from 2004 to 2008 (Liu et al., 2012).
In summary, the impact of cyclones on the emission of SSAs cannot be ignored. SSAs can direct the absorbing and scattering of solar radiation. Additionally, sea spray aerosol is an important source of CCN, which plays a significant role in regulating global warming, but it remains unclear how cyclones impact SSA emissions. Cyclones developing in the westerlies and SO result in the decrease of pressure, air convergence, strong winds and heavy precipitation, which alter the emission of SSAs and thus affect regional climate in the middle and high latitudes of the Southern Hemisphere. However, the lack of direct observations makes it a challenge to gain deeper insight into this question. Generally, the observation of cyclones is commonly performed at fixed points on land (Badarinath et al., 2008), but such observations cannot be used to investigate the effect of cyclones on SSAs over remote ocean regions. However, high-time-resolution observation technology is now available on research vessels for carrying out the SSA monitoring and for understanding the SSA behavior during cyclone processes.
In this study, SSA characteristics were observed with a high time resolution during three cyclones in the SO to determine the transport of SSAs to the high atmosphere by cyclones. The concentrations and particle sizes of SSAs were measured simultaneously for the first time with a high time resolution (1 h) in the middle and high Southern Hemisphere from 23 February to 4 March 2018. The results provide new insight into the effect of cyclones on the generation and vertical transport of SSAs in the middle and high latitudes of the Southern Hemisphere.
2.1 Observational sites
Observations were carried out on board the R/V Xuelong during the 34th Chinese Antarctica Expedition Research Cruise from 23 February and 4 March 2018. The observations covered a large portion of the SO (40 to 73∘ S, 170∘ E to 124∘ W; seen in Fig. S1 in the Supplement).
2.2 SSA measurements
Aerosol composition was monitored with a temporal resolution of 1 h using an in situ gas and aerosol composition monitoring system (IGAC, Model S-611, https://www.zj-env.com/, last access: 2 May 2023). To minimize the impact of ship emissions, the sampling inlet connected to the monitoring instruments was fixed on a mast (20 m above the sea surface) located at the bow of the research vessel. Note that the major pollutants were from the chimney, which is located at the stern of the R/V and about 25 m above the sea level. Hence, the pollution emissions from the vessel were mainly located downwind of the sampling inlet, especially when the vessel was running forwards. As high-time-resolution observations were used in this study, the self-contaminations from the vessel have been eliminated from the measurement results. The wind speed and wind directions were also monitored during the observation period, and these were used to determine whether the observations were affected by the self-contaminations or not. A total suspended particulate sample inlet was also positioned at the top of the mast. All aerosol observational instruments were connected by conductive silicone tubing with an inner diameter of 1.0 cm.
The IGAC monitoring system consisted of three main units, including a wet annular denuder (WAD), a scrub and impact aerosol collector (SIAC), and an ion chromatograph with a sampling flow of 16.7 LPM. The collection of acidic and basic gases relies on the diffusion and absorption of gases into a downward-flowing aqueous solution. The SIAC was positioned at an angle to facilitate the collection of enlarged particles. Ultrapure water was fed continuously into the nozzle at 1.2 mL min−1 and heated to 140 ∘C to generate stream, which was sprayed directly towards the particle-laden air to improve the humidity of flue gases. Fine particles were enlarged and subsequently accelerated through a conical-shaped impaction nozzle and were collected on the impaction plate. The gas and aerosol liquid samples from the WAD and SIAC were drawn separately by a pair of syringe pumps. The samples were then analyzed for anions and cations by an online ion chromatography (IC) system (Dionex ICS-3000). The injection loop size was 500 µL for both anions and cations (Young et al., 2016). Six to eight concentrations of standard solutions were used for calibration purposes, depending on the target concentration (R2 values above 0.997). The detection limit for the Na+ concentration was 0.03 µg L−1 (aqueous solution).
2.3 SSA particle size measurement
A single particle mass spectrometer (SPAMS) was used to measure the SSA particle size distribution. A Nafion tube dryer was placed at the inlet of the SPAMS to remove the moisture of the sampling gas. Details of the methods used for aerosol detection and the operational procedure for the onboard SPAMS have been described carefully in a previous study (Li et al., 2014). The performance of particle size distribution determination using SPAMS has been confirmed (Yan et al., 2016; Li et al., 2014; Ma et al; 2016). A PM2.5 collector was deployed to remove particles larger than 2.5 µm. Fine particles were drawn into the vacuum system through a critical orifice and then accelerated and focused to form a particle beam. Particles with specific velocities then passed through two Nd:YAG lasers (532 nm). The aerodynamic diameter of a single particle was calculated by means of the particle velocity. The particle size detected by the SPAMS was calibrated using polystyrene latex spheres (PSL, Duke Scientific Corp., Palo Alto) with diameters of 0.2, 0.3, 0.5, 0.75, 1.0, 2.0 and 2.5 µm (Li et al., 2011).
2.4 Meteorological parameters
Meteorological parameters such as wind speed (WS), wind direction and temperature were measured continuously using an automated meteorological station mounted on the R/V Xuelong. Weather map data, including sea surface pressure and total precipitation, were obtained from the fifth-generation ECMWF reanalysis for the global climate and weather (ERA5, https://cds.climate.copernicus.eu/, last access: 23 April 2023). Satellite cloud maps were obtained from the Level-1 and Atmosphere Archive and Distribution System Distributed Active Archive Center (LAADS DAAC) data product MOD021KM. https://ladsweb.modaps.eosdis.nasa.gov/, last access: 18 April 2023).
2.5 Undisturbed SSA concentration estimates during the cyclone period
Undisturbed SSAs (U-SSAs) are defined as the SSA generation without cyclone impact in the marine boundary layer during the cyclone process, which was determined by the wind stress and sea salt flux. The upward-transport proportion of SSAs was estimated by comparing U-SSA concentration with the concentration of SSAs during the cyclone period. U-SSA concentrations during the cyclone period were estimated in the following two ways.
The momentum flux at the air–sea interface, also called wind stress, is an important part of the interaction between the ocean and atmosphere, reflecting the friction and drag effect between the two fluids. Wind stress is the energy source of SSA generation. The momentum flux at the air–sea interface can be calculated using the following equation (Toffoli et al., 2012):
where ρa is the air density; U10 is the wind speed measured at 10 m above the sea surface; and Cd is a drag coefficient, which can be expressed as follows:
where a is 0.96, and b is 0.06.
According to the difference in terms of wind stress between cyclonic and non-cyclonic periods, combined with the concentration of SSAs during non-cyclonic periods, U-SSA(wind stress) concentration can be obtained.
For the indirect production of SSAs through the formation and bursting of bubbles, the SSA flux function d (particles m−2 s−1 mm−1), which expresses the rate of sea water droplet generation per unit area of sea surface per increment of particle radius, is given by Monahan et al. (1986) with Eq. (4):
where , r is the particle radius.
Then, U-SSA(Sea salt flux) concentration can be obtained as follows:
3.1 Meteorology and cyclone events
The observation region in the SO was defined by the outermost closed isobar surrounding the cyclone area center (Wernli and Schwierz, 2006). Rainfall has numerous aspects that impact SSA production. Generally, raindrops falling onto the sea surface can produce SSA particles directly or indirectly, either from bubbles entrained by the drop or through the splashing of the drops (Blanchard and Woodcock, 1957). However, raindrops can also function as an efficient scavenger of particles in the atmosphere (Lewis and Schwartz, 2004). Hence, the precipitation period was extracted when the transport of SSAs by cyclones was discussed in this study. As it is known that the relative humidity also has an impact on SSAs, high relative humidity was presented in this study, basically reaching the deliquescence point (RH of about 75 %) of NaCl (Cole et al, 2003). In this case, the change of relative humidity has little effect on the particle size. Three cyclone events were observed during the cruise (Fig. S2). Na+ derived from SSAs is an important component of marine atmospheric aerosols (Teinila et al., 2014) and is generally considered to be a marker of SSAs in the marine atmosphere (Yeatman et al., 2001). Hence, the relationships between Na+ concentrations and meteorological factors were discussed in this study, as seen in Fig. 1.
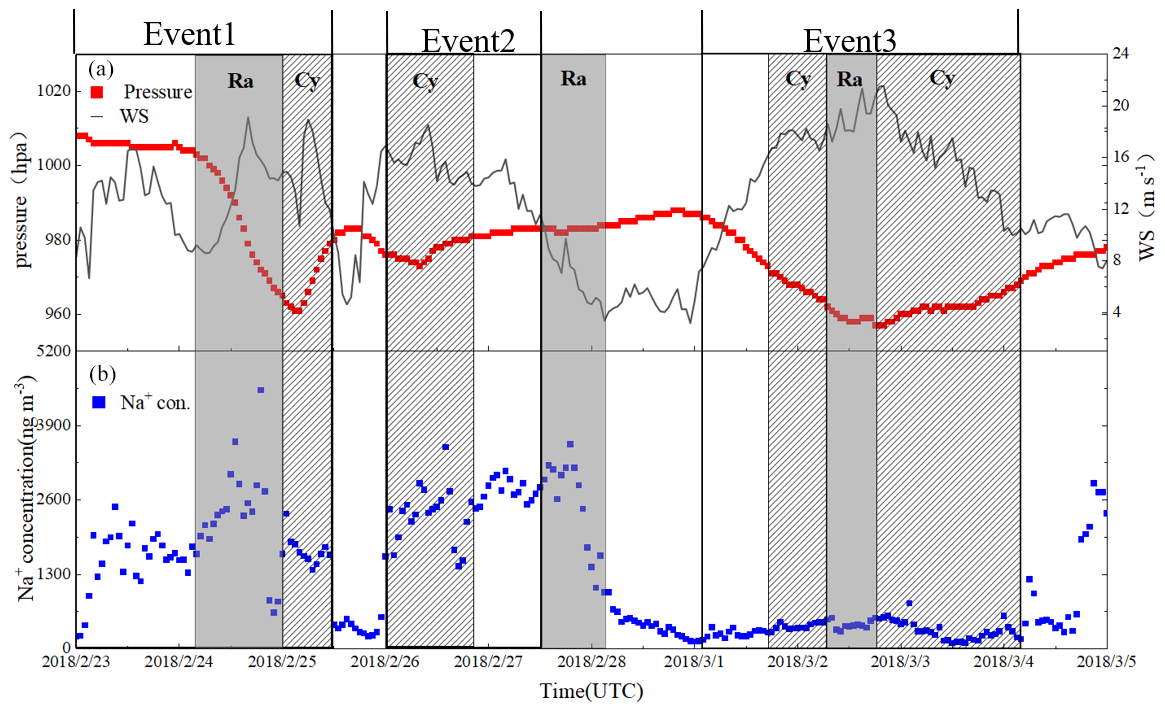
Figure 1Temporal distributions of Na+ and relevant meteorological parameters obtained during the period of 23 February to 4 March 2018 in the cyclone area of the Southern Ocean. (a) Time series of atmospheric pressure (hpa) and wind speed (WS m s−1). (b) Time series of Na+ concentrations (ng m−3). Shading indicates Ra (precipitation periods) and Cy (cyclone periods). No shading corresponds to non-cyclone periods.
The first cyclone was generated in the middle Southern Hemisphere (45∘ S, 150∘ E) and gradually moved eastwards (Fig. 2). As the cyclone approached, the R/V Xuelong sampled a northwest warm and humid air mass followed by precipitation. As the research vessel entered the cyclone area (event 1 – shadowed area in Fig. 1) at about 15:00 UTC on 24 February 2018, the air pressure suddenly dropped from 1003 to 961 hpa, and the wind speed was significantly enhanced in comparison to the non-cyclone area (average wind speed increased from 11.7 to 14.8 m s−1). However, the average Na+ concentration during this cyclone event remained relatively constant as the WS increased, changing from 1529 to 1706 ng m−3. At about 23:00 UTC on 25 February 2018, the research vessel left the cyclone area. Note that wind speed dropped sharply between 13:00 and 23:00 UTC on 25 February 2018 (average wind speed decreased from 14.8 to 9.3 ms−1), and this was matched by a rapid decrease in the SSA concentration (from 1706 to 343 ng m−3, as seen in Fig. 1b).
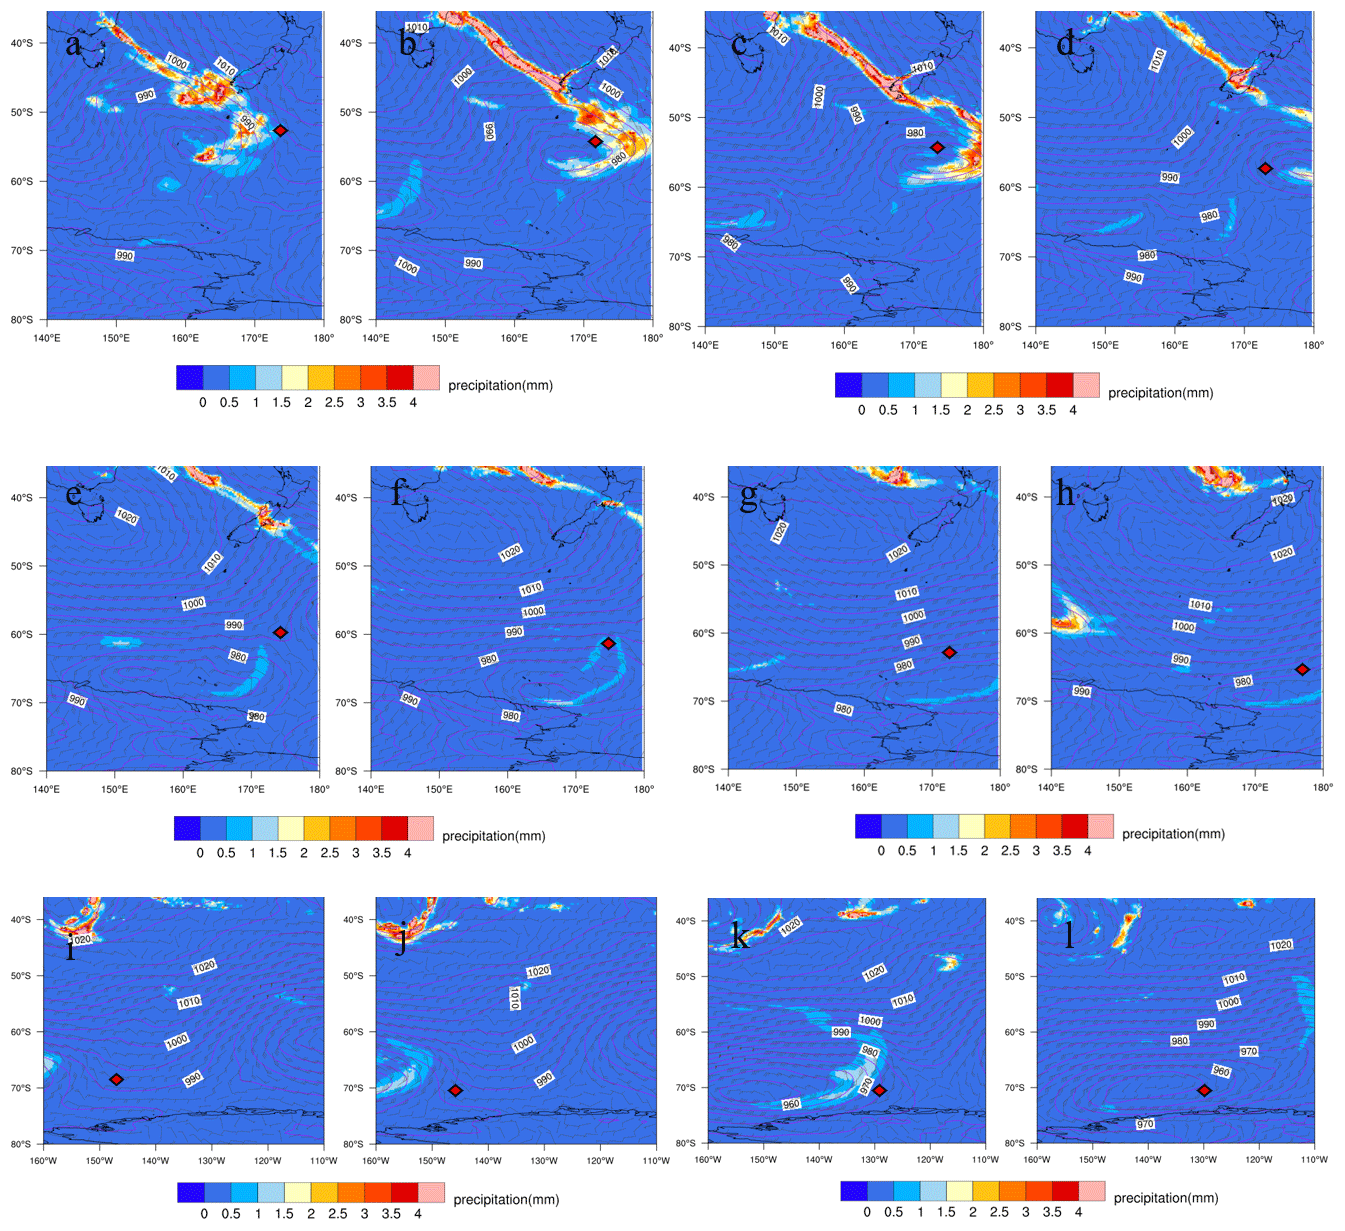
Figure 2Sea surface pressure (hpa) and total precipitation (mm) maps for the three observed cyclone events. Event 1: (a) 14:00, 24 February 2018; (b) 20:00, 24 February 2018; (c) 01:00, 25 February 2018; (d) 08:00, 25 February 2018. Event 2: (e) 16:00, 25 February 2018; (f) 00:00, 26 February 2018; (g) 20:00, 26 February 2018; (h) 18:00, 26 February 2018. Event 3: (i) 01:00, 1 March 2018; (j) 18:00, 1 March 2018; (k) 13:00, 2 March 2018; (l) 22:00, 2 March 2018. The red diamond represents the position of the research ship. All times are UTC. The coastline of Antarctica is seen at the bottom of each figure.
The vessel encountered another cyclone area at 10:00 UTC on 26 February 2018 and immediately turned to the southeast, leaving the cyclone area at 22:00 UTC on 26 February 2018 (event 2, seen in Fig. 1). During event 2, the research vessel did not pass through the center of the cyclone. However, it was also affected by the cyclone as the atmospheric pressure dropped from 983 to 973 hpa, and the average wind speed increased from 13.5 to 15.5 m s−1. Similarly to event 1, the average Na+ concentration during the cyclone period remained relatively constant or even decreased from 2810 to 2354 ng m−3 as the WS increased. During event 2, the dominant air flow was cold and westerly; thus, there was only a little precipitation (Fig. 2).
When the research vessel moved southeast and arrived at the sea ice edge of the high SO, the Na+ concentration was much lower than the value during the first two cyclone events, which suggested that low air temperature and sea ice coverage reduced SSA generation (Fig. S3) (Yan et al., 2020). Between 18:00 UTC on 1 March 2018 and 04:00 UTC on 4 March 2018, the research vessel encountered the third cyclone (event 3). The wind speed increased from 7.5 to 21.5 m s−1, and the air pressure dropped from 986 to 960 hpa (lowest). Similarly, the average Na+ concentration during this cyclone period showed little increase (changing from 255 to 335 ng m−3). The third cyclone was relatively stable and moved slowly, but the cyclone only brought a small amount of precipitation in the wind shear region.
3.2 SSA properties during cyclone processes
Correlation coefficients between different compositions of sea spray aerosols in the atmospheric are shown in Table S1. Na+ correlated well with Mg2+, K+, Ca2+ and SO, implying that Na+ has a good representation of SSAs. The variation of Na+ concentrations in different latitude regions is presented in Fig. S4. Positive correlations between Na+ concentrations and wind speeds were found in the low–middle latitudes (20–40∘ S) (R=0.59, Fig. S4), where the atmospheric pressure remained stable (Fig. S5). This suggests that SSA generation was greatly influenced by the wind speed. However, the correlation between Na+ concentrations and wind speed was relatively low in middle–high latitudes (40–60∘ S) and in the polar region (60–74∘ S) (R=0.45 and 0.05, respectively), where unstable atmosphere states or cyclones occurred frequently (Fig. S5), suggesting that cyclones may affect the relationship between wind speed and SSA concentration in the marine atmosphere.
The relationship between WS and Na+ concentration in different meteorological conditions is illustrated in Fig. 3. To further investigate the influence of cyclones on SSA concentrations in the middle and high Southern Hemisphere, a non-cyclone period (5 and 6 April) with stable pressure and relative humidity but without precipitation was selected as a control period (defined as a normal period).
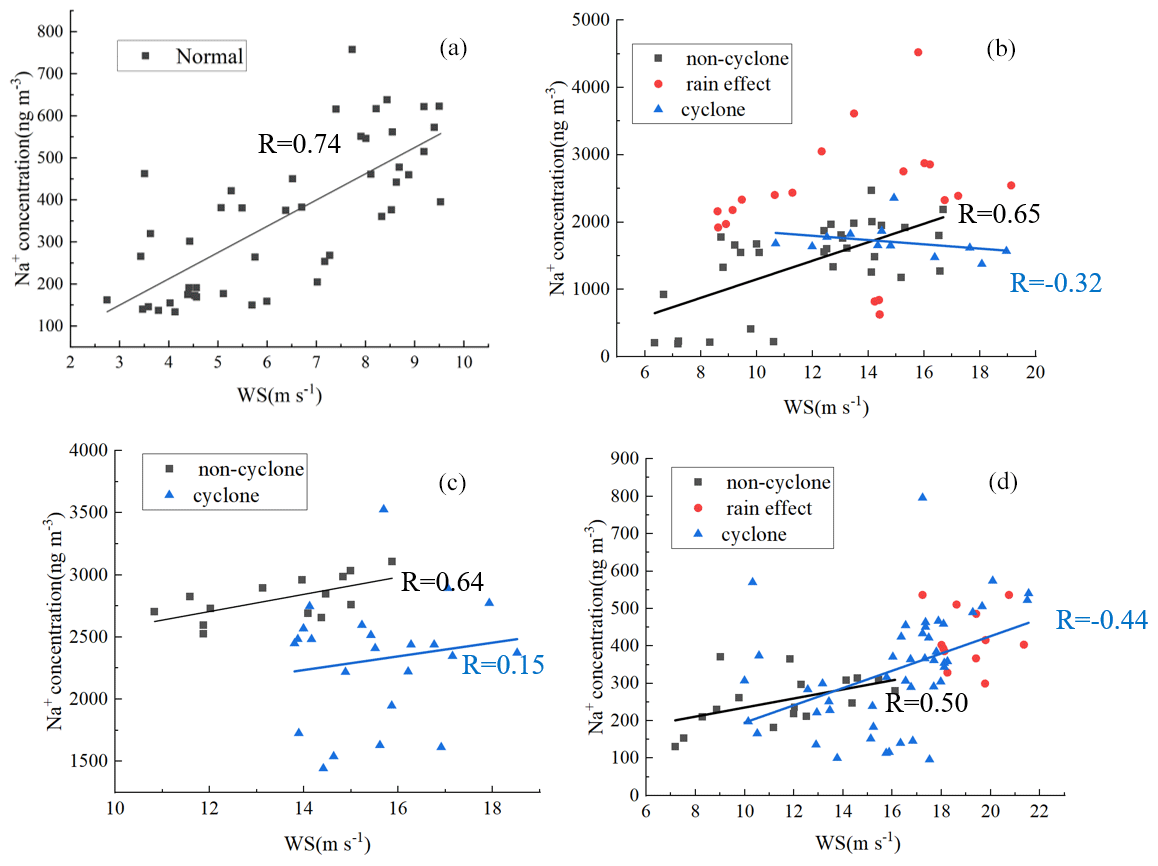
Figure 3Correlation between Na+ concentration and wind speed under different meteorological conditions. (a) A non-cyclone (normal) period (i.e., stable air pressure and relative humidity, constant air mass, and no precipitation). (b) Event 1 (cyclone, non-cyclone and raining periods). (c) Event 2 (cyclone and non-cyclone periods). (d) Event 3 (cyclone, non-cyclone and raining periods).
It is readily apparent that Na+ concentrations and SSAs increased with the WS during the control period (Fig. 3a, R=0.74). Positive correlations between Na+ concentrations and WS were also presented during non-cyclone events in event 1, event 2 and event 3 (R=0.65, 0.64 and 0.50, respectively; seen in Fig. 3b, c and d), which was in good agreement with a previous study (O'Dowd and de Leeuw, 2007). It is worth noting that the correlations between Na+ concentration and WS during event 3 were lower than the values during the other two cyclone events. This was caused by the low temperature and sea ice coverage in the high SO, which weakened the influence of WS on SSA generation (Yan et al., 2020).
In contrast, poor correlations between Na+ concentration and wind speed were found during all three cyclone periods (, 0.15 and 0.44) and precipitation periods (R=0.08 and −0.02; see Fig. 3b, c and d). During the cyclone periods, Na+ concentration changed irregularly as the WS increased, suggesting that rainfall altered the effect of wind stress on SSA generation. The effect of precipitation on the formation of SSAs was complicated, and WS may not have been the critical factor that affected SSA emission during precipitation processes. Further studies of how precipitation affects SSAs are required.
It is interesting that an obvious correlation between WS and Na+ concentration was not present during cyclone processes with high wind speed. Na+ concentrations during cyclone periods were even lower than those during non-cyclone periods. This means that the generation of SSAs was not enhanced during the cyclone process or that the SSAs were transported by the cyclone. The generation and transport of SSAs during cyclone processes are further discussed in the following section.
3.3 SSA particle size distribution
Generally, SSA generation increased with wind speed; however, in this study, it was found that higher wind speeds did not result in higher levels of SSAs during cyclone processes. It seems that the generation of SSAs was suppressed during cyclones. It is necessary to determine whether the emission of SSAs in the cyclonic periods was higher than that in the non-cyclone periods. Feng et al. (2017) and Liu et al. (2021) reported that both SSA particle size and the concentration increased with increasing wind speed. As the WS increased from 3.4 to 10 m s−1, a 7–10-fold increase in atmospheric sea salt concentration was observed. Log-normal distributions predicted a 30-fold increase in the concentration (µg m−3) of particles larger than g (10 µm radius) and a 50-fold increase in the concentration of particles larger than g (20 µm radius) (McDonald et al., 1982). If the particle size of SSAs increased with increasing wind speed, it indirectly confirmed that the concentration of SSAs also increased.
The size distributions of SSAs observed during the three cyclone events are presented in Table S2 and Fig. 4. During event 1, the difference between the number of SSA particles larger than 1.2 µm observed in cyclone and non-cyclone periods was about 11 %. The change of the SSA size distribution during event 2 and event 3 was consistent with that observed during event 1 (about 6 % and 5 %, respectively). The mean size of SSA particles was larger during cyclone periods than that during non-cyclones. These results revealed that cyclones in the middle and high Southern Hemisphere enhanced SSA generation. However, the increase in SSA concentration was not presented as expected when high wind speeds occurred during the cyclone period, suggesting that SSAs may be transported or diluted in the lower atmosphere.
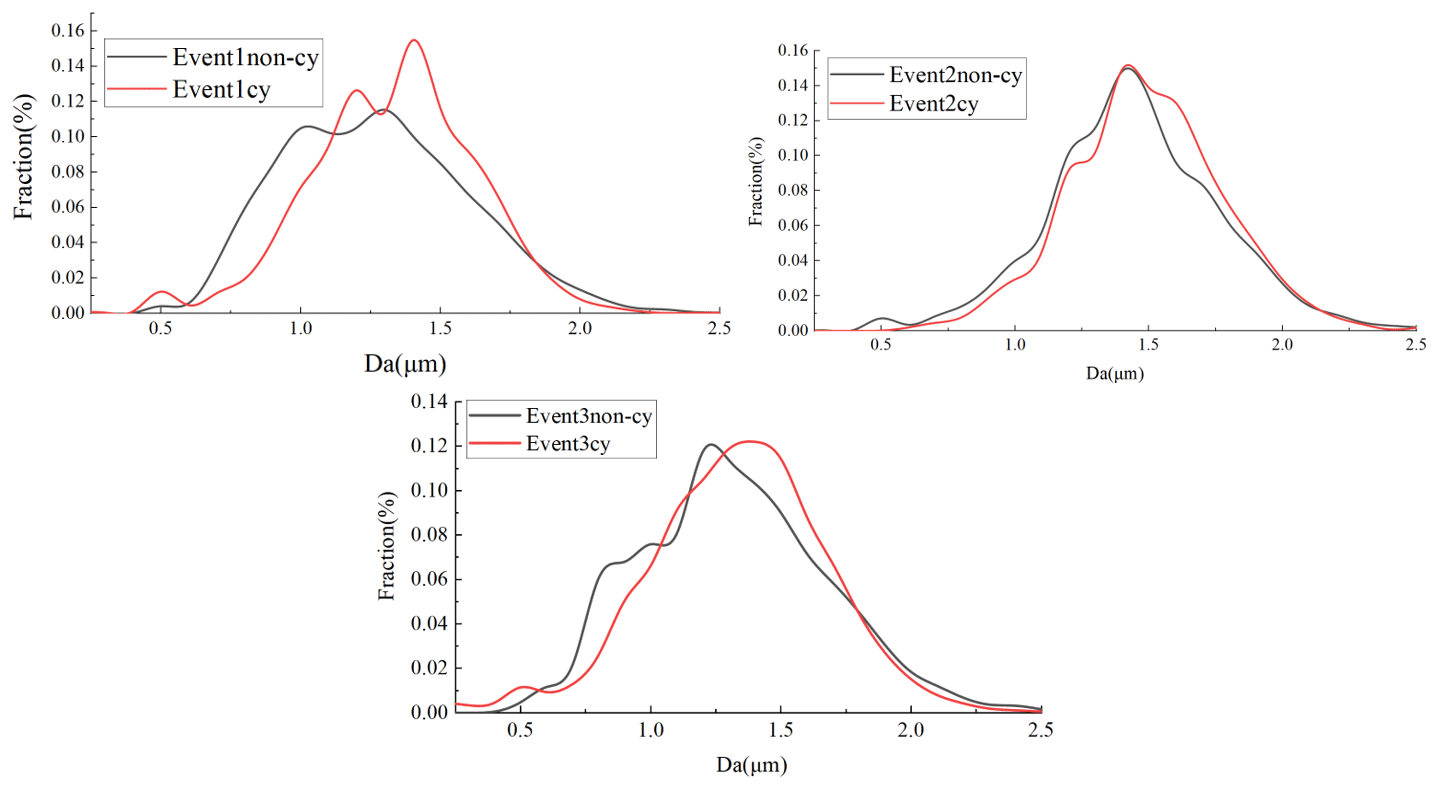
Figure 4SSA size distributions (in terms of fractional percent) for cyclone and non-cyclone periods during the three observed events.
3.4 Estimation of the upward-transport proportion of SSAs by cyclones
The middle and high latitudes of the Southern Hemisphere, especially in the Antarctic region, are of the most pristine in the world and serve as important proxies for the pre-industrial atmosphere, which was less affected by human activity. Hence, anthropogenic aerosols account for a small proportion of the total aerosol population. In the SO, aerosols are typically derived from natural sources, including primary particles (sea spray and bursting bubbles), which make up the vast majority of the aerosol mass. In this region, cyclones tend to occur in summer, generating more SSAs due to high WS. The observation results suggested that air convergence caused by the cyclone may result in considerable quantities of SSAs being transported vertically to the high atmosphere, which can partly explain why the mean number concentrations of CCN and cloud droplets (Nd) in the SO in summer are much higher than those in winter (MyCoy et al., 2020).
As mentioned above, the size of SSAs was larger during cyclone events than that in the no-cyclone period. However, the level of SSAs in the low atmosphere hardly increased with wind speed during the cyclone process. It is likely that a amount of considerable SSAs were transported upwards by air convergence due to the cyclone. When a large amount of SSAs were transported to the upper air, the SSAs in the high atmosphere enhanced the solar radiation reflected back to space by modulating the Nd, which in turn changed cloud reflectivity even without any changes in the cloud macrostructure (Twomey, 1977). Furthermore, cloud microphysical processes were also altered with changing CCN/Nd (Albrecht, 1989). These two effects, summarized in Fig. 5, can ultimately affect the radiation balance of the Earth system in the middle and high latitudes of the Southern Hemisphere (Quinn and Bates, 2011). Thus the effect of cyclones on SSA generation, especially in the polar region, cannot be neglected.
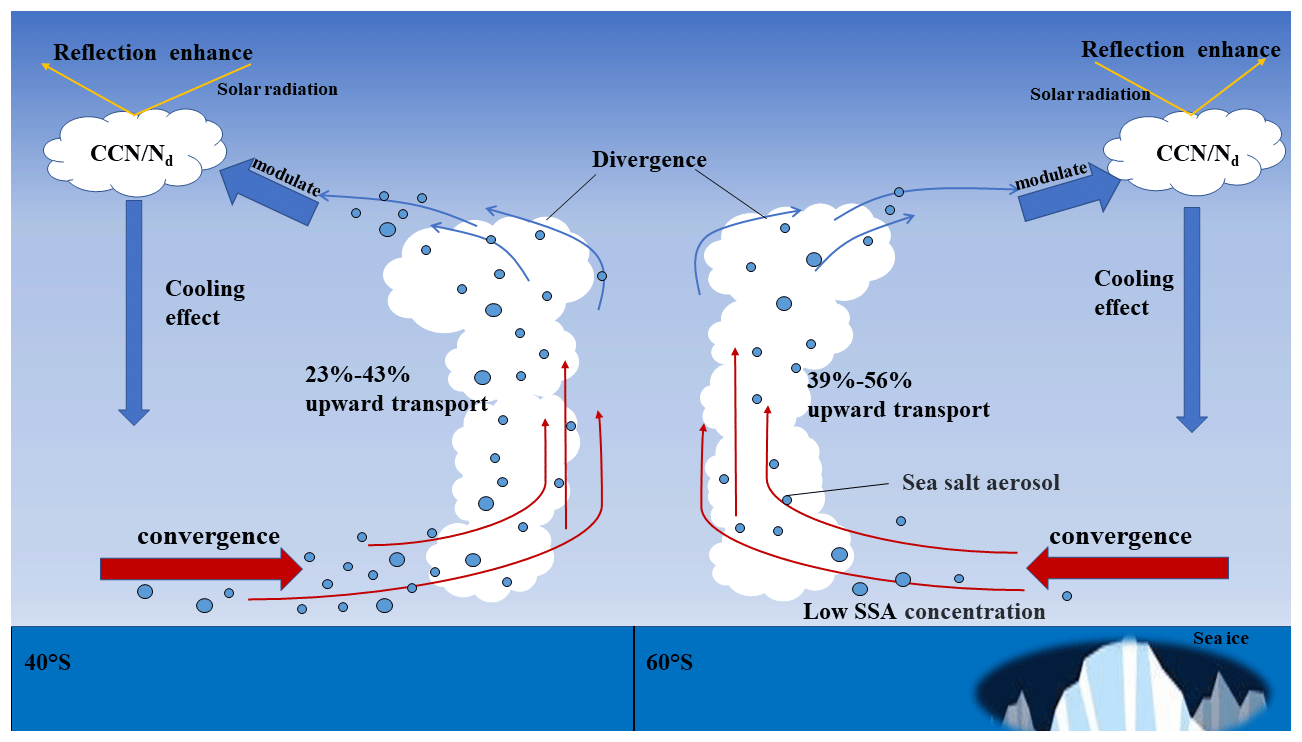
Figure 5Schematic diagram illustrating the impact of cyclones on SSA generation and transport and the resulting climate effects.
It is difficult to precisely estimate the proportion of SSAs directly transported vertically. However, the differences in terms of wind stress and sea salt flux between cyclone and non-cyclone periods can be used to calculate the undisturbed concentrations of Na+ (U-SSA concentration) during the cyclone period. This can be used to quantify the upward-transport proportion of SSAs.
Figures S6 and S7 show the differences in terms of wind stress and sea salt flux between cyclone and non-cyclone periods. The estimated proportions of vertically transported SSAs, using the wind stress method and the sea salt flux method, are presented in Table 1. According to the calculation results, more than 23.4 % of the SSAs were transported upwards by cyclone processes during event 1, and 36.2 % and 38.9 % were transported upwards by cyclone processes in event 2 and event 3, respectively. The upward-transport proportions of SSAs estimated using the bubble method were higher than those estimated using the wind stress method for all three cyclone events. As the research vessel was located at the high SO and close to Antarctica during event 3, the upward-transport proportion estimated using the bubble method was the highest, reaching 56.6 %, which was much higher than the results estimated for event 1 (39.9 %) and event 2 (42.8 %).
Table 1Estimation of SSA vertical-transport proportion by assessing the differences in terms of of wind stress and sea salt flux.
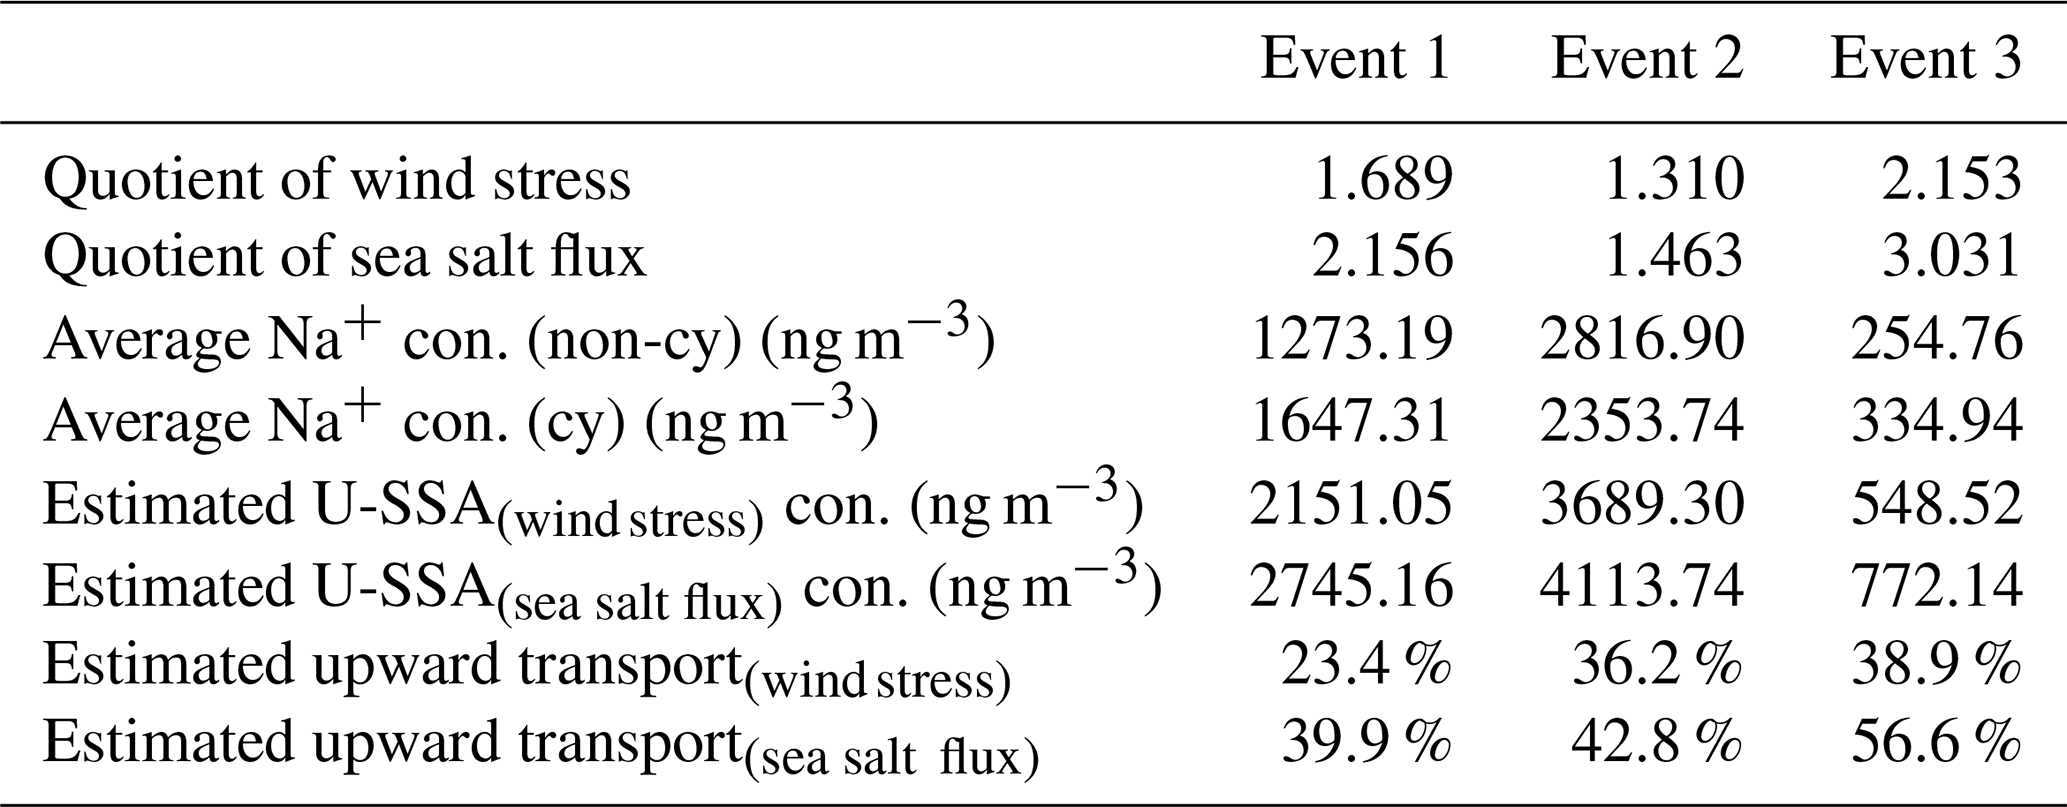
The high transportation ratio in event 3 was in good agreement with the results of the previous study which reported that the largest contribution of SSAs to CCN (up to 65 %) was observed in the high southern latitudes (Quinn et al., 2017). Another factor affecting the estimated result in event 3 was that R/V Xuelong was located in the high SO. As the sea state was typically not fully developed in such a situation, the energy flux from the air to the ocean may have differed from that under steady-state conditions, which may have affected wave breaking and SSA production (Lewis and Schwartz, 2004). These circumstances can lead to the overestimation of the vertical-transport proportion of SSAs. In summary, the results suggested that, in the middle and high Southern Hemisphere, a significant proportion of SSAs were transported upwards and subsequently potentially affected the regional climate change.
The influence of cyclones on SSAs in the tropics, characterized by stronger and more intricate cyclonic systems, was not covered by this paper. Further studies of how SSA concentration changes in the tropical cyclone area are required. However, the observational results presented in this study extend the current knowledge of the impact of cyclones on marine aerosol emissions in the middle and high Southern Hemisphere and their potential climate effects.
An underway aerosol monitoring system was used to determine the aerosol composition and size distribution during different cyclone events in the middle and high Southern Hemisphere in order to access the potential effects of cyclones on SSA emissions. Three cyclone events were observed during the 34th Chinese Antarctica Expedition Research Cruise from 23 February to 4 March 2018.
It was expected that the high wind speeds produced during the cyclone events would increase the generation of SSAs. However, the SSA level increases in the low atmosphere were not observed during these cyclone events. It is indicated that considerable SSAs were transported upwards to the high atmosphere due to the cyclones. According to the wind stress and sea salt flux between cyclone and non-cyclone periods, the calculation indicated that more than 23 % of SSAs were transported upwards to the high atmosphere, with the highest proportion being observed in the Southern Ocean (ranging from 39 % to 55 %). Vertical transport of SSAs can be regarded as an important source of CCN in the marine boundary layer.
The effect of cyclones on SSA emissions was indirect and complicated. Therefore, future work is required to investigate the effect of the varying intensities of the cyclones on SSA emissions and the SSA generation mechanism during precipitation, as well as their potential climate effects in different regions.
The data discussed in this paper are available from the following website: https://doi.org/10.5281/zenodo.7912911 (Shi, 2023).
The supplement related to this article is available online at: https://doi.org/10.5194/acp-23-10349-2023-supplement.
SJ analyzed the results and wrote the paper. JY conducted the observations, proposed the research ideas and wrote the paper. SW and SZ contributed considerably to the interpretation of the results. MZ and QL conducted the onboard observations and data analyses. SX applied the calculations of sea ice distribution and meteorological data. HY and SD contributed to the observation data analyses.
The contact author has declared that none of the authors has any competing interests.
Publisher's note: Copernicus Publications remains neutral with regard to jurisdictional claims in published maps and institutional affiliations.
The authors gratefully acknowledge the Guangzhou Hexin Analytical Instrument Company Ltd. for the onboard observation technical assistance and the Zhangjia Instrument Company Ltd. for the IGAC technical assistance and data analysis.
This research has been supported by the National Natural Science Foundation of China (grant no. 42376038), the Qingdao National Laboratory for Marine Science and Technology (grant no. QNLM2016ORP0109), the Response and Feedback of the Southern Ocean to Climate Change (grant no. RFSOCC2020-2025), and the Chinese Projects for Investigations and Assessments of the Arctic and Antarctic (grant no. CHINARE2017-2020).
This paper was edited by Armin Sorooshian and reviewed by two anonymous referees.
Albrecht, B. A.: Aerosols, Cloud Microphysics, and Fractional Cloudiness, Science, 245, 1227–1230, https://doi.org/10.1126/science.245.4923.1227, 1989.
Badarinath, K. V. S., Kharol, S. K., Krishna Prasad, V., Kaskaoutis, D. G., and Kambezidis, H. D.: Variation in aerosol properties over Hyderabad, India during intense cyclonic conditions, Int. J. Remote Sens., 29, 4575–4597, https://doi.org/10.1080/01431160801950170, 2008.
Blanchard, D. C. and Woodcock, A. H.: Bubble formation and modification in the sea and its meteorological significance, Tellus, 9, 145–158, https://doi.org/10.3402/tellusa.v9i2.9094, 1957.
Cole, I. S., Paterson, D. A., and Ganther, W. D.: Holistic model for atmospheric corrosion Part 1 – theoretical framework for production, transportation and deposition of marine salts, Corros. Eng. Sci. Techn., 38, 129–134, https://doi.org/10.1179/147842203767789203, 2003.
Fang, G., Lin, S., Chang, S., and Chou, C.: Effect of typhoon on atmospheric particulates in autumn in central Taiwan, Atmos. Environ., 43, 6039e6048, https://doi.org/10.1016/j.atmosenv.2009.08.033, 2009.
Feng, L., Shen, H., Zhu, Y., Gao, H., and Yao, X.: Insight into Generation and Evolution of Sea-Salt Aerosols from Field Measurements in Diversified Marine and Coastal Atmospheres, Sci. Rep., 7, 41260, https://doi.org/10.1038/srep41260, 2017.
Goyal, R., Sen Gupta, A., Jucker, M., and England, M. H.: Historical and projected changes in the Southern Hemisphere surface westerlies, Geophys. Res. Lett., 48, e2020GL090849, https://doi.org/10.1029/2020GL090849, 2021.
Gong, S. L., Barrie, L. A., and Lazare, M.: Canadian Aerosol Module (CAM): A size-segregated simulation of atmospheric aerosol processes for climate and air quality models – 2. Global sea-salt aerosol and its budgets, J. Geophys. Res.-Atmos., 107, 4779, https://doi.org/10.1029/2001jd002004, 2002.
Gruber, N., Landschutzer, P., and Lovenduski, N. S.: The variable Southern Ocean carbon sink, Ann. Rev. Mar. Sci., 11, 159–186, https://doi.org/10.1146/annurev-marine-121916-063407, 2019.
Lewis, E. R. and Schwartz, S. E.: Sea Salt Aerosol Production: Mechanisms, Methods, Measurements, and Models, Geophysical Monograph Series (152), John Wiley & Sons, New York, America, 432 pp., ISBN: 978-0-87590-417-7, 2004.
Li, L., Huang, Z., Dong, J., Li, M., Gao, W., Nian, H., Fu, Z., Zhang, G., Bi, X., Cheng, P., and Zhou, Z.: Real time bipolar time-of-flight mass spectrometer for analyzing single aerosol particles, Int. J. Mass Spectrom., 303, 118e124, https://doi.org/10.1016/j.ijms.2011.01.017, 2011.
Li, L., Li, M., Huang, Z., Gao, W., Nian, H., Fu, Z., Gao, J., Chai, F., and Zhou, Z.: Ambient particle characterization by single particle aerosol mass spectrometry in an urban area of Beijing, Atmos. Environ., 94, 323–331, https://doi.org/10.1016/j.atmosenv.2014.03.048, 2014.
Liu, N., Fu, G., and Kuo, Y.-H.: Statistical characteristics of austral summer cyclones in Southern Ocean, J. Ocean U. China, 11, 118–128, https://https://doi.org/10.1007/s11802-012-1828-7, 2012.
Liu, S., Liu, C.-C., Froyd, K. D., Schill, G. P., Murphy, D. M., Bui, T. P., Dean-Day, J. M., Weinzierl, B., Dollner, M., Diskin, G. S., Chen, G., and Gao, R.-S.: Sea spray aerosol concentration modulated by sea surface temperature, P. Natl. Acad. Sci. USA, 118, e2020583118, https://doi.org/10.1073/pnas.2020583118, 2021.
Ma, L., Li, M., Zhang, H., Li, L., Huang, Z., Gao, W., Chen, D., Fu, Z., Nian, H., Zou, L., Gao, J., Chai, F., and Zhou, Z. :Comparative analysis of chemical composition and sources of aerosol particles in urban Beijing during clear, hazy, and dusty days using single particle aerosol mass spectrometry, J. Clean. Prod., 112, 1319–1329, https://doi.org/10.1016/j.jclepro.2015.04.054, 2016.
McCoy, I. L., McCoy, D. T., Wood, R., Regayre, L., Watson-Parris, D., Grosvenor, D. P., Mulcahy, J. P., Hu, Y., Bender, F. A.-M., Field, P. R., Carslaw, K. S., and Gordon, H.: The hemispheric contrast in cloud microphysical properties constrains aerosol forcing, P. Natl. Acad. Sci. USA, 117, 18998–19006, https://doi.org/10.1073/pnas.1922502117, 2020.
McDonald, R. L., Unni, C. K., and Duce, R. A. Estimation of atmospheric sea salt dry deposition: Wind speed and particle size dependence, J. Geophys. Res., 87, 1246, https://doi.org/10.1029/JC087iC02p01246, 1982.
McInnes, L. M., Quinn, P. K., Covert, D. S., and Anderson, T. L.: Gravimetric analysis, ionic composition, and associated water mass of the marine aerosol, Atmos. Environ., 30, 869–884, https://doi.org/10.1016/1352-2310(95)00354-1, 1996.
Monahan, E. C. and Muircheartaigh, I. O.: Optimal power-law description of oceanic whitecap coverage dependence on wind-speed, J. Phys. Oceanogr., 10, 2094–2099, https://doi.org/10.1175/1520-0485(1980)010<2094:Opldoo>2.0.Co;2, 1980.
Monahan, E. C., Spiel, D. E., and Davidson, K. L.: Oceanic whitecaps and their role in air-sea exchange, A model of marine aerosol generation via whitecaps and wave disruption. Oceanographic Sciences Library,Oceanic Whitecaps, 167–174, Springer, https://doi.org/10.1007/978-94-009-4668-2_16, 1986.
O'Dowd, C. D. and de Leeuw, G.: Marine aerosol production: A review of the current knowledge, Philos. T. R. Soc. A, 365, 1753–1774, https://doi.org/10.1098/rsta.2007.2043, 2007.
Pierce, J. R. and Adams, P. J.: Global evaluation of CCN formation by direct emission of sea salt and growth of ultrafine sea salt, J. Geophys. Res., 111, D06203, https://doi.org/10.1029/2005jd006186, 2006.
Quinn, P. K. and Coffman, D. J.: Comment on “Contribution of different aerosol species to the global aerosol extinction optical thickness: estimates from model results” by Tegen et al., J. Geophys. Res., 104, 4241–4248, https://doi.org/10.1029/1998JD200066, 1999.
Quinn, P. K. and Bates, T. S.: The case against climate regulation via oceanic phytoplankton sulphur emissions, Nature, 480, 51–56, https://doi.org/10.1038/nature10580, 2011.
Quinn, P. K., Coffman, D. J., Johnson, J. E., Upchurch, L. M., and Bates, T. S.: Small fraction of marine cloud condensation nuclei made up of sea spray aerosol, Nat. Geosci., 10, 674–679, https://doi.org/10.1038/ngeo3003, 2017.
Shi, J., Yan, J., Wang, S., Zhao, S., Zhang, M., Xu, S., Lin, Q., and Yang, H.: Determinant of sea salt aerosol emission in the Southern Hemisphere in summer time, Earth Space Sci., 9, e2022EA002529, https://doi.org/10.1029/2022ea002529, 2022.
Shi, J.: Cyclones enhance the transport of sea salt aerosols to the high atmosphere in the Southern Ocean, Zenodo [data set], https://doi.org/10.5281/zenodo.7912911, 2023.
Stokes, M. D., Deane, G. B., Prather, K., Bertram, T. H., Ruppel, M. J., Ryder, O. S., Brady, J. M., and Zhao, D.: A marine aerosol reference tank system as a breaking wave analogue for the production of foam and sea-spray aerosols, Atmos. Meas. Tech., 6, 1085–1094, https://doi.org/10.5194/amt-6-1085-2013, 2013.
Takemura, T., Nakajima, T., Dubovik, O., Holben, B. N., and Kinne, S.: single-scattering albedo and radiative forcing of various aerosol species with a global three-dimensional model, J. Clim., 15, 333–352, https://doi.org/10.1175/1520-0442(2002)015<0333:ssaarf>2.0.co;2, 2002.
Teinila, K., Frey, A., Hillamo, R., Tulp, H. C., and Weller, R.: A study of the sea-salt chemistry using size-segregated aerosol measurements at coastal Antarctic station Neumayer, Atmos. Environ., 96, 11–19, https://doi.org/10.1016/j.atmosenv.2014.07.025, 2014.
Twomey, S.: The Influence of Pollution on the Shortwave Albedo of Clouds, J. Atmos. Sci., 34, 1149–1152, https://doi.org/10.1175/1520-0469(1977)034<1149:tiopot>2.0.co;2, 1977.
Toffoli, A., Loffredo, L., Le Roy, P., Lefèvre, J.-M., and Babanin, A. V.: On the variability of sea drag in finite water depth, J. Geophys. Res.-Ocean., 117, C00J25, https://doi.org/10.1029/2011jc007857, 2012.
Wernli, H. and Schwierz, C.: Surface Cyclones in the ERA-40 Dataset (1958–2001), Part I: Novel Identification Method and Global Climatology, J. Atmos. Sci., 63, 2486–2507, https://doi.org/10.1175/JAS3766.1, 2006.
Yan, J., Chen, L., Lin, Q., Zhao, S., and Zhang, M.: Effect of typhoon on atmospheric aerosol particle pollutants accumulation over Xiamen, China, Chemosphere, 159, 244–255, https://doi.org/10.1016/j.chemosphere.2016.06.00, 2016.
Yan, J., Jung, J., Lin, Q., Zhang, M., Xu, S., and Zhao, S.: Effect of sea ice retreat on marine aerosol emissions in the Southern Ocean, Antarctica, Sci. Total Environ., 745, 140773, https://doi.org/10.1016/j.scitotenv.2020.140773, 2020.
Yeatman, S. G., Spokes, L. J., and Jickells, T. D.: Comparisons of coarse-mode aerosol nitrate and ammonium at two polluted coastalsites, Atmos. Environ., 35, 1321–1335, https://doi.org/10.1016/S1352-2310(00)00452-0, 2001.
Young, L. H., Li, C. H., Lin, M. Y., Hwang, B. F., Hsu, H. T., Chen, Y. C., Jung, C. R., Chen, K. C., Cheng, D. H., Wang, V. S., Chiang, H. C., and Tsai, P. J.: Field performance of a semi-continuous monitor for ambient PM2.5 water-soluble inorganic ions and gases at a suburban site, Atmos. Environ., 144, 376–388, https://doi.org/10.1016/j.atmosenv.2016.08.062, 2016.