the Creative Commons Attribution 4.0 License.
the Creative Commons Attribution 4.0 License.
 | 15 Sep 2023
Source apportionment study on particulate air pollution in two high-altitude Bolivian cities: La Paz and El Alto
Valeria Mardoñez
Marco Pandolfi
Lucille Joanna S. Borlaza
Jean-Luc Jaffrezo
Andrés Alastuey
Jean-Luc Besombes
Isabel Moreno R.
Noemi Perez
Griša Močnik
Patrick Ginot
Radovan Krejci
Vladislav Chrastny
Alfred Wiedensohler
Paolo Laj
Marcos Andrade
Gaëlle Uzu
La Paz and El Alto are two fast-growing, high-altitude Bolivian cities forming the second-largest metropolitan area in the country. Located between 3200 and 4050 m a.s.l. (above sea level), these cities are home to a burgeoning population of approximately 1.8 million residents. The air quality in this conurbation is heavily influenced by urbanization; however, there are no comprehensive studies evaluating the sources of air pollution and their health impacts. Despite their proximity, the substantial variation in altitude, topography, and socioeconomic activities between La Paz and El Alto result in distinct sources, dynamics, and transport of particulate matter (PM). In this investigation, PM10 samples were collected at two urban background stations located in La Paz and El Alto between April 2016 and June 2017. The samples were later analyzed for a wide range of chemical species including numerous source tracers (OC, EC, water-soluble ions, sugar anhydrides, sugar alcohols, trace metals, and molecular organic species). The United States Environmental Protection Agency (U.S. EPA) Positive Matrix Factorization (PMF v.5.0) receptor model was employed for the source apportionment of PM10. This is one of the first source apportionment studies in South America that incorporates an extensive suite of organic markers, including levoglucosan, polycyclic aromatic hydrocarbons (PAHs), hopanes, and alkanes, alongside inorganic species. The multisite PMF resolved 11 main sources of PM. The largest annual contribution to PM10 came from the following two major sources: the ensemble of the four vehicular emissions sources (exhaust and non-exhaust), accountable for 35 % and 25 % of the measured PM in La Paz and El Alto, respectively; and dust, which contributed 20 % and 32 % to the total PM mass. Secondary aerosols accounted for 22 % (24 %) in La Paz (El Alto). Agricultural smoke resulting from biomass burning in the Bolivian lowlands and neighboring countries contributed to 9 % (8 %) of the total PM10 mass annually, increasing to 17 % (13 %) between August–October. Primary biogenic emissions were responsible for 13 % (7 %) of the measured PM10 mass. Additionally, a profile associated with open waste burning occurring from May to August was identified. Although this source contributed only to 2 % (5 %) of the total PM10 mass, it constitutes the second largest source of PAHs, which are compounds potentially hazardous to human health. Our analysis additionally resolved two different traffic-related factors, a lubricant source (not frequently identified), and a non-exhaust emissions source. Overall, this study demonstrates that PM10 concentrations in La Paz and El Alto region are predominantly influenced by a limited number of local sources. In conclusion, to improve air quality in both cities, efforts should primarily focus on addressing dust, traffic emissions, open waste burning, and biomass burning.
- Article
(3535 KB) - Full-text XML
-
Supplement
(2184 KB) - BibTeX
- EndNote


Outdoor air pollution has undeniably proven to be an important threat for public health and is responsible for about 4.2 million yearly premature deaths around the world (WHO, 2021a). The exposure to air pollution becomes more complex at higher altitudes due to the decrease in oxygen per volume of air, as people have developed a higher lung capacity in order to fulfill the body's oxygen demand (Frisancho, 1977, 2013; Frisancho et al., 1999; Madueño et al., 2020; US EPA, 2011).
Many of the high-altitude large cities in the world (>2000 m a.s.l., above sea level; 2 million inhabitants) are located in Latin American low- and middle-income countries, among which are Mexico City, Bogotá, and Quito. These cities are also subjected to a developing industry and a growing vehicular fleet that results in a constantly increasing energy consumption, which is heavily dependent on non-renewable energy sources (Pardo-Martínez, 2015; Molina et al., 2019; Castro-Verdezoto et al., 2019). Most of the cities in this region for which data are available face air quality that has deteriorated, with particulate matter (PM) concentrations that exceed the World Health Organization (WHO) guidelines (Gutiérrez-Castillo et al., 2005; Mugica et al., 2009; Ramírez et al., 2018; Zalakeviciute et al., 2020; WHO, 2021b).
High-altitude cities exhibit distinct characteristics due to complex topography and associated meteorology, which influences the transport, accumulation, and dispersion of air pollution. Moreover, a high altitude is linked to strong solar radiation that favors photochemical activity and high daily temperature variations. Compared to other regions at similar latitudes, high-altitude cities in South America experience lower temperature, lower atmospheric pressure, and lower saturation vapor pressures, as well as complex wind patterns and reduced precipitation (Zalakeviciute et al., 2018; Vega et al., 2010). Previous studies have shown that these specific high-altitude atmospheric and thermodynamic conditions can strongly favor new aerosol particle formation (NPF; Boulon et al., 2010; Brines et al., 2015; Hallar et al., 2011; Sellegri et al., 2019; Singla et al., 2018; Sorribas et al., 2015). Additionally, it has been observed that low-oxygen environments alter the performance and reduce the efficiency of combustion engines (Martínez et al., 2022; Wang et al., 2013a), thus changing the vehicular emissions of gaseous and particulate pollutants (Bishop et al., 2001; Giraldo and Huertas, 2019; He et al., 2011; Nagpure et al., 2011; Wang et al., 2013b).
Listed amongst the highest metropolitan areas in the world, La Paz (LP; between 3200 and 3600 m a.s.l.) and El Alto (EA; 4050 m a.s.l.) are two Bolivian cities constituting a conurbation with a population of approximately 1.8 million people. Despite their close proximity, significant topographical, meteorological, and socioeconomic differences exist between them. While Bolivian legislation regulates the concentrations of certain pollutants (CO, SO2, NO2, O3, TSPs (total suspended particles), PM10, and Pb; Table S1 in the Supplement), very few air quality studies which include long-term measurements at a moderate time resolution have been performed in the country or in the region. The few previous existing studies have reported PM10 mass concentrations ranging from 10 to 100 µg m−3 and were measured at urban and urban background stations in La Paz and El Alto (Red MoniCA, 2016a, b, 2017, 2018; Wiedensohler et al., 2018). However, no particle chemical speciation has been conducted to identify the major sources contributing to the high PM concentrations. Furthermore, measurements taken at the nearby Chacaltaya Global Atmosphere Watch (CHC-GAW) monitoring station (16.350500∘ S, 68.131389∘ W; 5240 m a.s.l.) show that the emissions of the city not only impact the local environment but also act as a point source influencing regional atmospheric composition (Aliaga et al., 2021).
While little is known about the sources of PM in the country, since industry is not largely developed, vehicular emissions potentially represent an important contributor to air pollution, particularly considering the absence of restrictions on the age of the vehicle fleet. Statistics indicate that 43 % of the circulating vehicles are less than 10 years old, 15 % are 10–20 years old, and another 24 % are 20–30 years old (INE, 2020a, b). At a regional scale, agricultural biomass burning in the Bolivian and Brazilian valleys and rainforests constitutes an important seasonal source of particulate pollutants (Mataveli et al., 2021). The latter has a significant impact on the air quality of the cities close to where the fires take place (Nawaz and Henze, 2020) and can be transported over large distances. Studies have shown that air masses coming from the Amazon can traverse the Andes, carrying pollutants and ultimately reaching the Bolivian Altiplano (Chauvigne et al., 2019; Magalhães et al., 2019; Segura et al., 2020; Bourgeois et al., 2015). Additionally, previous studies based on emission inventories adapted to the data availability in LP–EA pointed out that road dust, food industry, cooking, and vehicle emissions are the major sources of PM10, whereas for Cochabamba (the third-largest urban area in Bolivia), estimations showed mobile sources to be responsible for almost 90 % of PM10 emissions (Herbst, 2007; Pareja et al., 2011). Although there are some indications of the most outstanding sources of particulate matter in La Paz and El Alto, currently there is no comprehensive study on the composition and sources of particulate matter air pollution. Therefore, the aim of this study is to apportion and characterize the sources of PM that affect air quality in the metropolis of La Paz–El Alto, which can be used as a baseline for future policy-making.
To achieve this goal, the United States Environmental Protection Agency (U.S. EPA) Positive Matrix Factorization (PMF v.5.0) receptor model was applied on the PM10 chemical speciation obtained from 24 h filter samples collected simultaneously in La Paz and El Alto over a 15-month campaign. This study represents one of the few studies conducting PM characterization in Bolivia over an extended period. Given the limited number of studies in this region, identifying the sources and chemical profiles of PM in the study sites proved to be more challenging. The analysis included a comprehensive chemical speciation, encompassing ionic species, monosaccharide anhydrides, polyols, metals, polycyclic aromatic hydrocarbons (PAHs), alkanes, and hopanes. To the best of our knowledge, this is the first study on source apportionment at high-altitude cities that incorporates such a large set of organic and inorganic species.
2.1 Sampling sites
Significant topographical differences exist between the two study sites, La Paz (LP) and El Alto (EA), in addition to the notable disparity in altitude and pressure. While the city of El Alto lies on the open and flat Altiplano plateau, the city of La Paz sprawls along the mountain valleys formed below the Altiplano in a closed area with steep and complex topography. The meteorological conditions throughout the year are governed by the seasonal transition between a dry and a wet season, which is typical of tropical regions. Temperature and wind patterns vary substantially between the two cities due to the differences in altitude and local topography.
Moreover, the city of El Alto originally developed as a peri-urban zone of the city of La Paz, welcoming migrants from nearby towns, who formed communities and settled on the outskirts of the city of La Paz (Fernández, 2021). This gave rise to significant economic and social disparities between the cities that, to some extent, persist and are evident among the general population (Foster and Irusta, 2003). Such differences could have an impact on air pollutant emissions, due to the different practices in each of the cities, in addition to the daily commute of a significant part of the population of El Alto towards the city of La Paz.
The few existing industries are mostly located within or in the surrounding area of El Alto, and the vehicular fleet observed in both cities is not homogeneous. The density of heavy vehicle traffic – trucks and buses – is more prevalent in El Alto, since it is the main regional and international connection from and to the metropolis. These factors uphold the need for having independent representative sampling sites for each city rather than relying on a single site, despite both being part of the same conurbation.
The sampling campaign was carried out between April 2016 and June 2017. Several ambient and meteorological parameters were measured simultaneously at two urban background sites, with one in each city. The sampling sites were located 7 km apart, with an altitude difference of over 400 m, and located at approximately 20 km from the Chacaltaya Global Atmosphere Watch (CHC-GAW) monitoring station (Fig. 1).
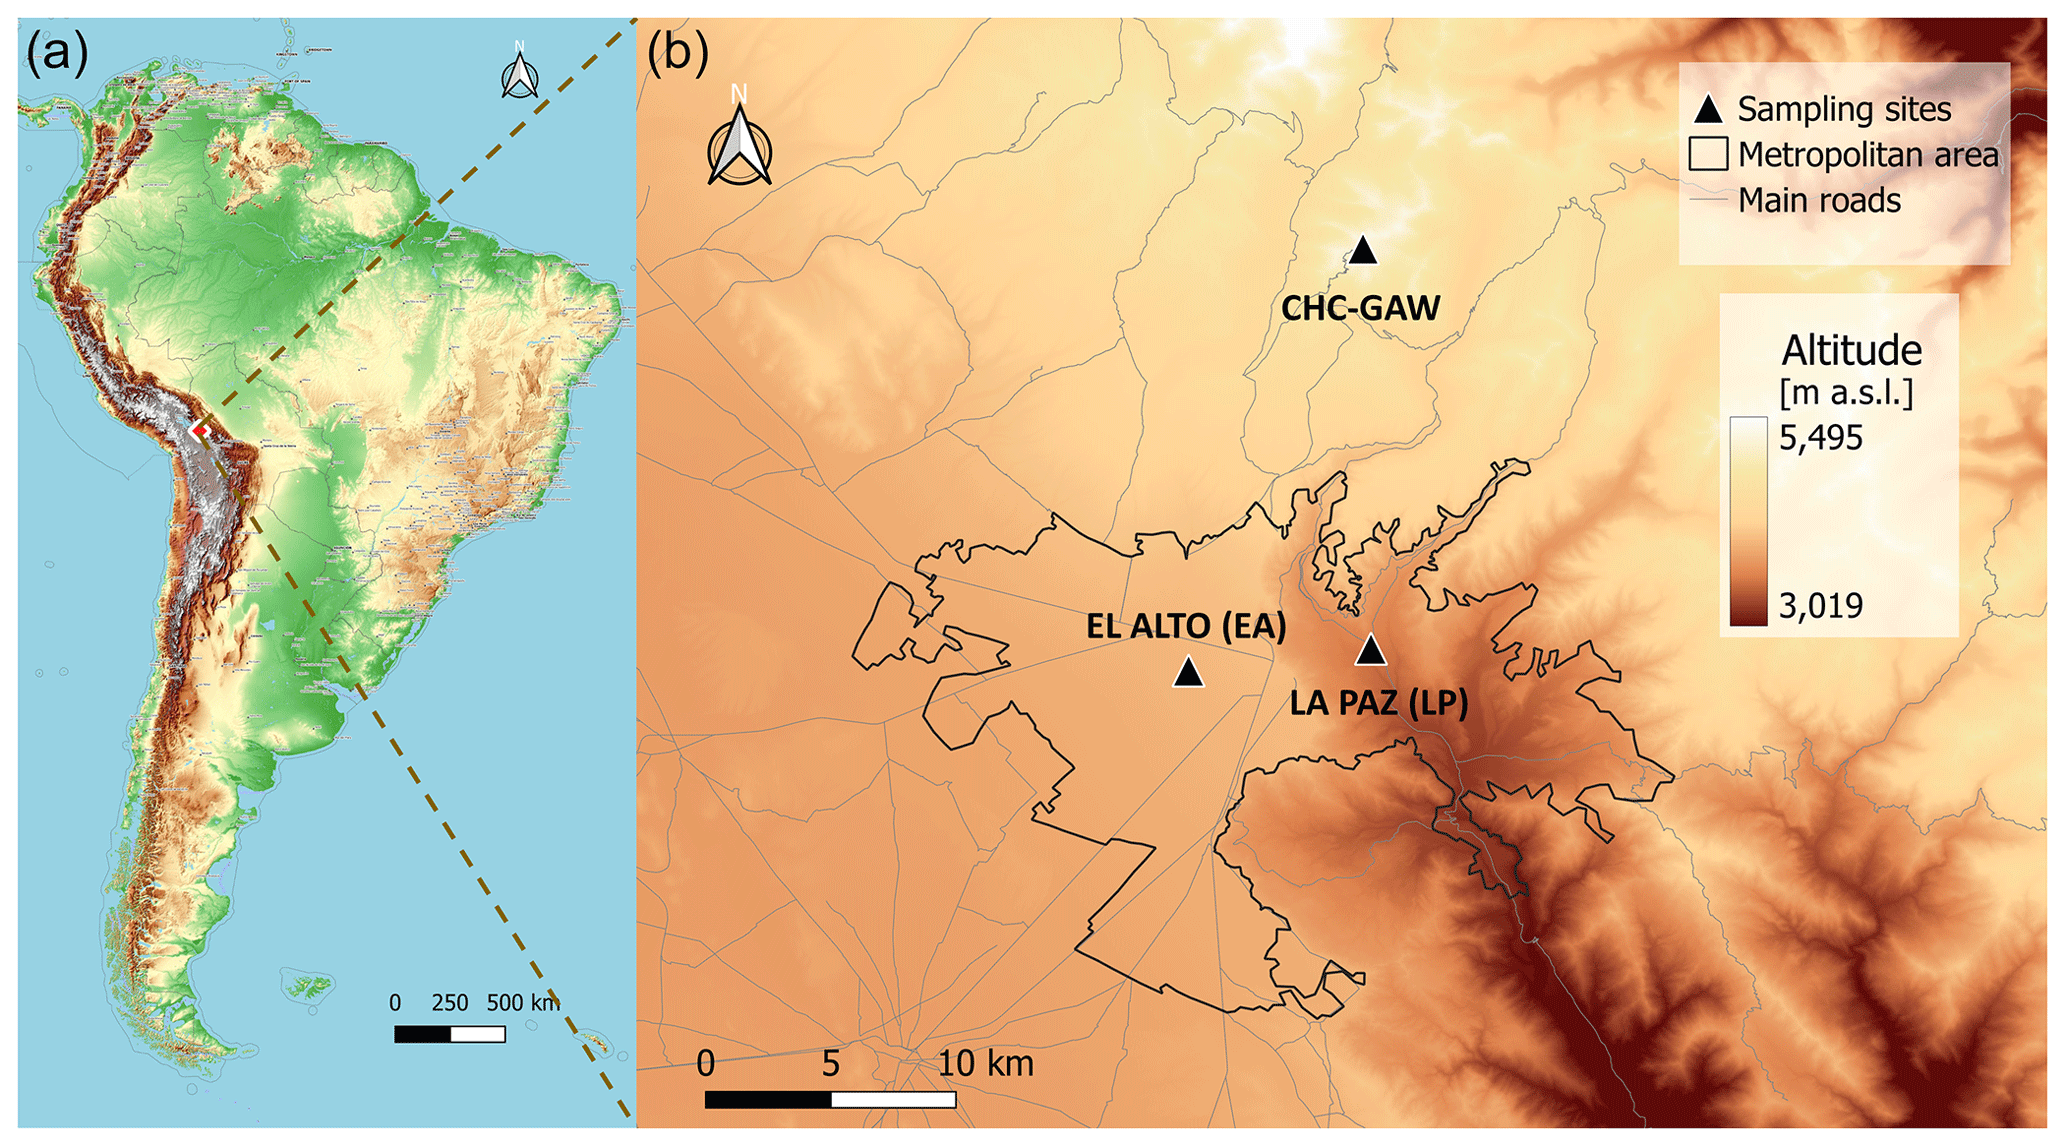
Figure 1(a) Geographical location of the sampling sites. (b) The locations of La Paz (LP) and El Alto (EA) have been enlarged and positioned with respect to the regional Chacaltaya GAW monitoring station (CHC-GAW). The color scale represents the altitude above sea level.
The El Alto measurement site forms part of the facilities of the meteorological observatory (16.5100∘ S, 68.1987∘ W; 4025 m a.s.l.) at the El Alto International Airport. The observatory is situated at a distance of approximately 250 m from the airport runway and 500 m from the nearest major road and has been described elsewhere (Wiedensohler et al., 2018). Pre-campaign measurements were conducted to assess whether the takeoff and landing of airplanes had any significant influence on the measurements and revealed no substantial impact on CO2, PM1, and PM2.5 during each airplane arrival and departure. Road traffic within the airport was minimal. The area around the sampling site is unpaved, hence dusty, and there are no other buildings in the proximity of the observatory. In March 2016, just prior to the beginning of the sampling, the airport administration cleared the ground within the perimeter fence of the meteorological observatory, leaving the site dustier than the rest of the airport.
The La Paz measurement site (LP) was placed on the rooftop of the Pipiripi Museum (Espacio Interactivo Memoria y Futuro Pipiripi; 16.5013∘ S, 68.1259∘ W; 3600 m a.s.l.). This municipal building is located atop a small hill in downtown La Paz. Unlike the EA site, the LP site is surrounded by many busy roads and dense residential areas within a 1 km radius, with a horizontal and vertical minimum distance to the nearest road of approximately 70 and 45 m, respectively. Otherwise, the site's immediate surroundings (∼100 m radius) are covered by green areas and a parking lot for the municipality's buses at the base of the hill.
2.2 Sampling methods
High-volume samplers (MCV CAV-A/mb with an MCV PM1025UNE (PM10) head) were employed to collect 24 h filter samples of PM on every third day at both sites. Sampling started at 09:00 LT, and the flow was automatically maintained at 30 m3 h−1. To avoid the interference of near-ground particle resuspension, the samplers were placed on the rooftop of the buildings. Throughout the analyzed period of the present study, an impactor with a 50 % collection efficiency for aerosol particles with an aerodynamic equivalent diameter of 10 µm was installed at the inlet of the samplers at both sites to establish an upper size cut.
The mass concentrations measured at both sampling sites are hereafter reported in ambient conditions (EA, with K and hPa; LP, with K and hPa), unless stated otherwise (e.g., when compared to concentrations reported in the literature). To convert to standard conditions of temperature and pressure (STP; K; hPa) the concentrations must be multiplied by a factor of 1.66 and 1.60 in El Alto and La Paz, respectively. Since the difference in ambient concentrations between the sites resulting from a difference in mean temperature and pressure is of approximately 4 %, the ambient concentrations are directly compared between the sites in the subsequent sections.
The aerosol particles were collected on preheated (8 h at 500 ∘C) and preweighted 150 mm diameter quartz fiber filters (Pallflex 2500 QAT-UP). After sampling, the filters were folded and wrapped in aluminum foil, sealed in impermeable plastic bags, and stored in a cool environment prior to transportation for analysis. This factor is predominantly identified by MSA (methanesulfonic acid), accounting for 100 % of the MSA present in the samples. Mass concentrations were initially determined gravimetrically, and then the samples were divided for chemical analysis among three European laboratories. The resulting chemical speciation comprised elemental carbon (EC); organic carbon (OC); sugar anhydrides (including levoglucosan and mannosan), sugar alcohols (including arabitol and mannitol); water-soluble ions (including SO, NO, Cl−, MSA−, NH, Na+, K+, Mg2+, and Ca2+) measured at IGE (Institut des Géosciences de l'Environnement), Grenoble, France; metals (including Al, Ca, K, Na, Mg, Fe, Ti, V, Mn, Cu, Zn, Rb, Sn, Sb, and Pb) measured at IDAEA (Institute of Environmental Assessment and Water Research), CSIC (Spanish National Research Council ), Barcelona, Spain; polycyclic aromatic hydrocarbons (PAHs including Fla, Pyr, Tri, BaA, Chr, BaP, BghiP, IP, BbF, and Cor); alkanes (including C21–C26); methyl PAHs; thiophenes; hopanes (including HP3–HP4); alkane methoxyphenols; and methyl-nitrocatechols measured at EDYTEM, Chambéry, France (an extensive list of the analyzed compounds can be found in Table S2). A total of 92 and 103 filter samples were collected in the cities of El Alto and La Paz, respectively, excluding samples having sampling flow issues or being influenced by specific events (e.g., San Juan local festivity, Christmas, and New Year's Eve). In addition, laboratory blank filters were used to calculate the limits of quantification (QL). The average concentrations measured from the laboratory blanks were then subtracted from the atmospheric concentrations measured from the filter samples.
2.3 Source apportionment (PMF)
The Positive Matrix Factor PMF 5.0 tool (Norris et al., 2014; Paatero and Tapper, 1994), developed by the U.S. Environmental Protection Agency (EPA), was used to apportion the sources that contribute to the observed particulate material in the collected samples at both sites. This non-negative multivariate factor analysis seeks to solve the chemical mass balance equation (Eq. 1) by applying a weighted least squares fit algorithm, with xij representing each of the elements of the concentration matrix (with n number of samples and m number of chemical species measured). gik values are the contributions of each k factor to the ith sample, fkj values are the chemical profile of the factors, and eij values are the residuals (i.e., the difference between the calculated and the measured concentration).
The optimal solution is then achieved by minimizing the function Q defined as follows:
where uij values are the uncertainties associated with each measurement.
2.3.1 Sample and chemical species selection
Out of the 197 PM10 samples initially included, 12 of them were later excluded from the analysis for having over six species with missing values (EA on 19 September 2016 and 11 January 2017; LP on 14 May 2016, 7 June 2016, 12 September 2016, and 2 May 2017) or because they presented unusual concentrations of PM or multiple species (LP on 4 April 2016, 22 May 2017, 30 May 2017, 11 June 2017, 15 May 2017, and 19 June 2017). A total of 178 chemical species were measured for each filter. Species displaying irregularities in their time series were excluded from the analysis, as were those with over 25 % of the data falling below the quantification limit (< QL, which is defined as the mean field blank concentrations measured per species, plus 2 times the standard deviation). From the remaining 86 species, the ones that were measured through both ion chromatography (IC) and inductive coupled plasma–mass spectrometry (ICP-MS), only the ICP-MS metals were included in order to avoid duplicative counting, except for K+, for which the IC measurements were used, since water-soluble K+ is a known tracer for biomass burning (BB), soil resuspension, and fertilizers (Li et al., 2021; Urban et al., 2012). Galactosan and sorbitol were deemed unnecessary tracers for biomass burning and primary biogenic aerosols, respectively, as other specific tracers such as levoglucosan, mannosan, mannitol, and arabitol were present. Consequently, they were excluded from the analysis. Additionally, other non-specific-tracer metal species were excluded after several attempts to include them in the PMF input data, as they introduced instability to the solution. Following the findings of Samaké et al. (2019a), arabitol and mannitol were added as one representative polyol species, given that they are emitted by the same source and have a Pearson correlation of r>0.7, at both sites. The same was done for PAHs that presented a r>0.9 (PAH_1: [BghiP] + [IP] + [BbF]; PAH_2: [Fla] + [Pyr]). Finally, in the PMF analysis, OC was substituted with OC*, which represents the difference between the measured OC concentrations and the carbon mass concentration of all the included organic compounds to avoid double counting (e.g., Weber et al., 2019).
2.3.2 Uncertainty calculation and species weight assignment
In the uncertainty matrix, a 10 % uncertainty was assigned to PM mass concentrations. The uncertainty calculation for polyols, monosaccharide anhydrides, and ions was followed, using the formula proposed by Gianini et al. (2012), employing the variation coefficients (CV) and the additional coefficients of variation (a) proposed and used by Weber et al. (2019), with the average QL associated with each species instead of the detection limit (DL). The uncertainties associated with EC, OC, and metals were calculated following the method proposed by Amato et al. (2009) and Escrig Vidal et al. (2009). Furthermore, the uncertainties assigned to the molecular organic species were calculated according to the formulas proposed by Polissar et al. (1998) and Reff et al. (2007), with the substitution of DL values by QL.
Values below the QL in the concentration matrix were replaced by the average of QL divided by 2 for each species. The corresponding uncertainties were then set to QL (Norris et al., 2014). The outliers encountered in the time series of some species (a total of four values) were set as missing values. Subsequently, the missing values in the input file were set to be replaced in the software by the median value of the corresponding species, and their associated uncertainty was automatically set to 4 times the species-specific median.
The weight of the species in the factor analysis was determined based on their signal-to-noise ratio (). Species with a were set as strong. Species with a signal-to-noise ratio of were defined as weak, resulting in a down-weighing of their influence in the analysis by triplicating their uncertainties. Species with a were not included in the analysis. Finally, PM was set as total variable, thus setting it as a weak variable. After conducting several tests, certain variables were also set as weak (K+ and V) because setting them as strong variables resulted in the creation of artificial factors that were without any geochemical meaning. The PAHs, alkanes, and hopanes were set as weak species to prevent them from driving the solution.
2.3.3 Solution evaluation criteria
A range of solutions, spanning from 8 to 13 factors, was examined to determine the suitable number of factors contributing to each site. Subsequently, a final solution was chosen based on the evaluation of various statistical and geochemical control parameters, as described by Belis et al. (2019):
-
;
-
residuals per species were centered and exhibited a symmetrical distribution around 0, falling within the range of −3 and 3, with a few exceptions for outliers;
-
a bootstrap (BS) evaluation of the statistical robustness of the selected base-run, with correlation coefficients > 0.8 for every factor after 100 iterations, before and after the base solution was constrained;
-
a displacement (DISP) analysis was performed to evaluate the rotational ambiguity and the solution's tolerance to minor perturbations (no rotations were observed for dQmax=4, 8); and
-
the geochemical consistency of the obtained factor chemical profiles evaluated on the basis of the existing literature and prior knowledge of the study site.
2.3.4 Multisite PMF
Initial parallel runs of single-site PMF analysis revealed similar main sources contributing to particulate matter. Increasing the number of factors showed the potential for the separation of the traffic profile, although this meant compromising on the statistical stability of the solution. Motivated by these findings, a multisite PMF analysis was conducted. Such an approach has proven its ability to reduce the rotational ambiguity in factor analyses (Dai et al., 2020; Hopke, 2021; Pandolfi et al., 2020; Hernández-Pellón and Fernández-Olmo, 2019), increasing the statistical robustness through an increased number of samples.
To combine both datasets into a single dataset (EA–LP) the dates in the La Paz dataset were shifted in time by 2 years and then appended to El Alto's dataset. Thus, duplicated dates were avoided, while composing a single input matrix for PMF that respected the natural seasonal variability in the original datasets was made possible. The dimensions of the resulting matrix were 185 rows (samples) × 40 columns (species). The multisite approach is based on the hypothesis that the major sources contributing to PM10 in both sites are similar and exhibit similar chemical profiles, which has been verified within the single-site solutions.
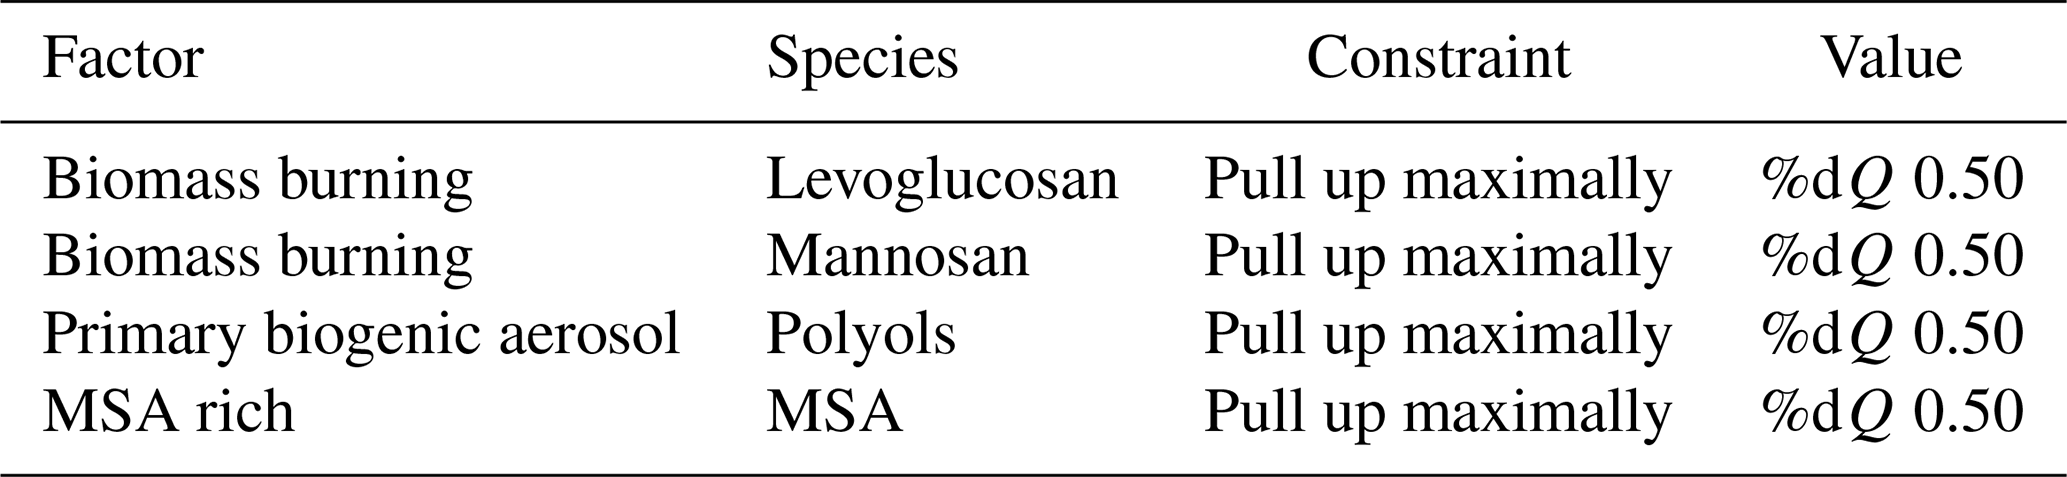
2.3.5 Set of constraints
Once the optimum number of factors was selected in the multisite base solution, a set of “soft” constraints (Table 1) was applied to the selected solution, based on previous studies (Borlaza et al., 2021; Samaké et al., 2019b; Weber et al., 2019).
2.3.6 Additional analysis of one local specific source: fuel chemical fingerprint
To further investigate the differences between the two main types of fuel used in LP–EA, three samples each of gasoline and diesel were taken at three randomly chosen gasoline stations located in different areas of the city. The main metal composition of these samples was subsequently analyzed, using the following procedure: 1 mL of sample (gasoline and diesel) was transferred into a Teflon microwave vessel (Anton Paar microwave laboratory unit). Then, 10 mL of HNO3 (double distilled and suprapure level) were added, and the solution was decomposed by increasing the temperature and pressure (175 ∘C and 1000 kPa. In the microwave, the EPA 3051A method was run twice to ensure that the solutions were indeed decomposed (US EPA, 2007). After cooling down the vessels, the solutions were diluted by a factor of 10 and directly measured using inductively coupled plasma–mass spectrometer (ICP-MS). A complete descriptive table of the analyzed species can be found in the Supplement (Table S3).
3.1 Seasonal variations in the chemical components of PM10
A yearly alternation between the dry and the wet season (as presented in Fig. 2) shows an annual maximum of PM10 concentrations coinciding with the middle of the dry season (Southern Hemisphere winter). During this season, negligible wet deposition occurs, and favorable conditions for particle resuspension are prevalent. Maximum daily ambient PM10 concentrations of 37.2±10.5 and 33.2±7.5 µg m−3 were measured during this period (May–August) in El Alto and La Paz, respectively. Conversely, the wet season (Southern Hemisphere summer from December–March) exhibits frequent precipitation events and the highest daily minimum temperatures.
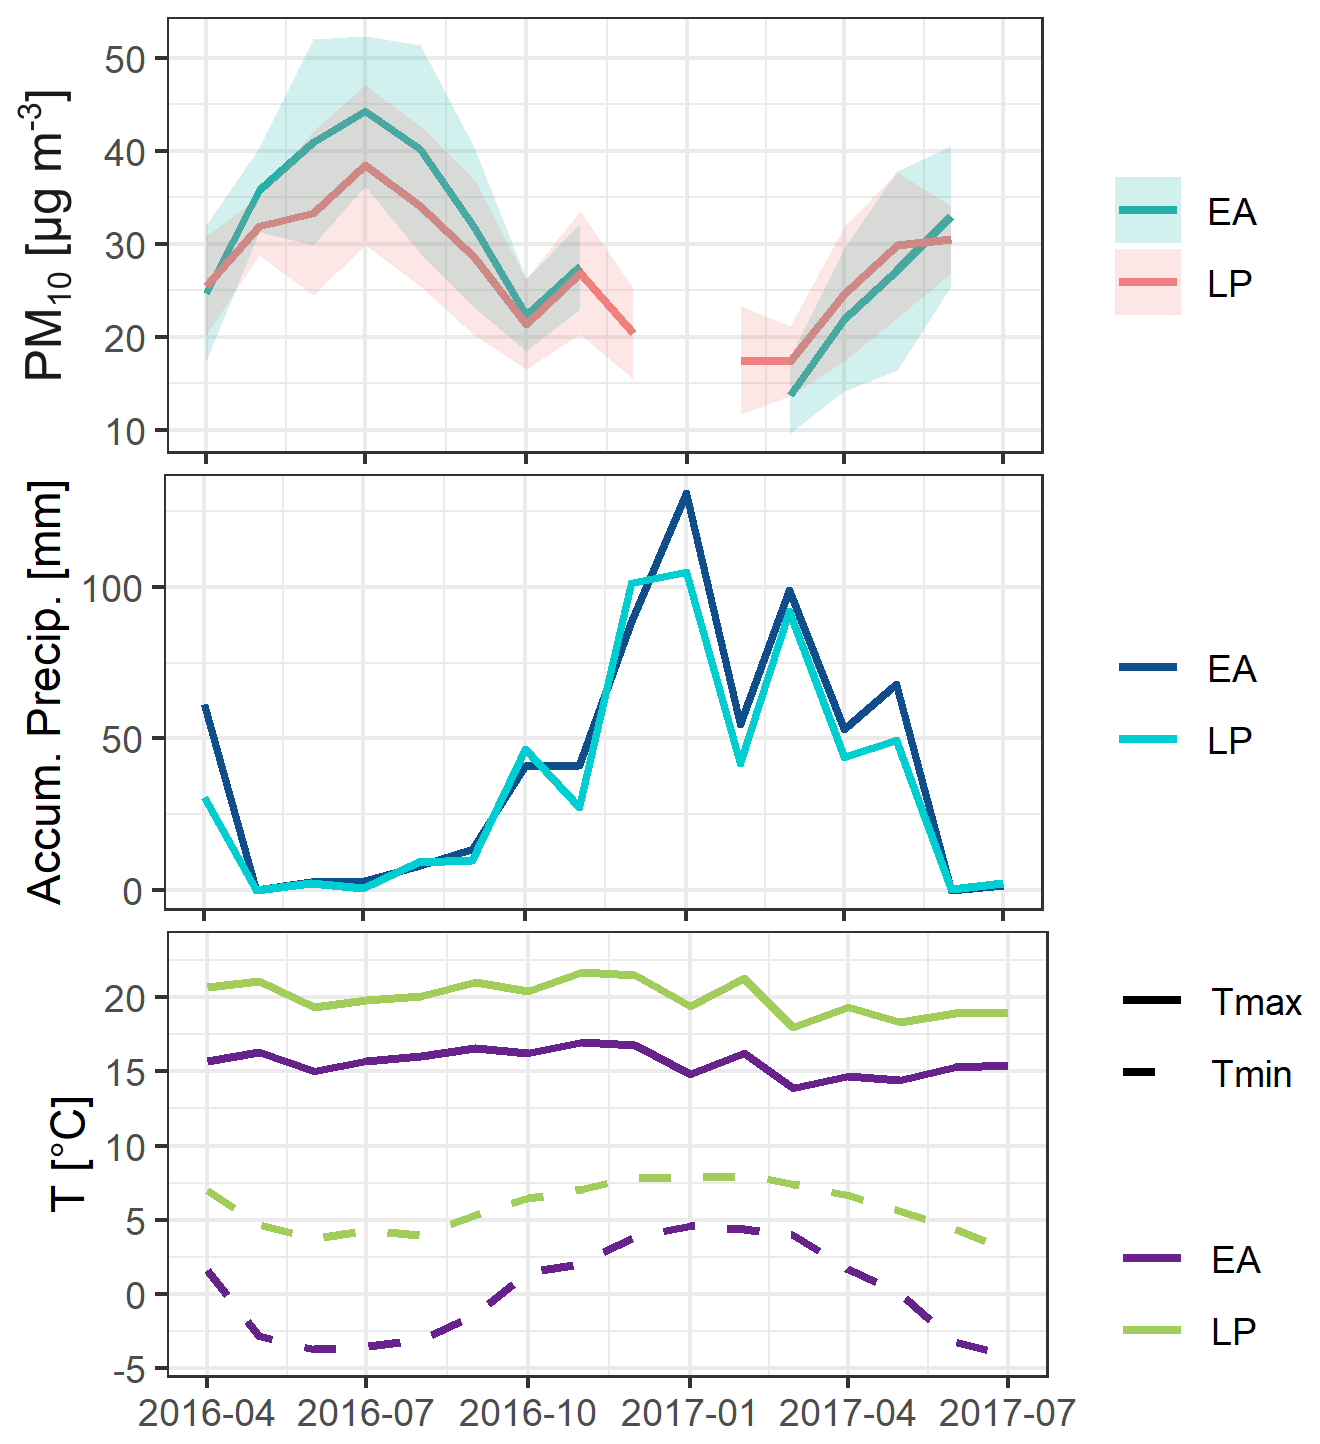
Figure 2Monthly PM10 mean concentrations (µg m−3), monthly accumulated precipitation (mm), and monthly mean maximum and minimum temperatures (∘C).
Similar PM10 variability and concentrations were observed at the El Alto International Airport, using the C14 beta attenuation technique, between 2011 and 2015 (ranging between ca. 10–50 µg m−3 throughout the year; Red MoniCA, 2016b). In the case of La Paz, the variability observed while also using the C14 beta attenuation technique was similar to the one observed in the present study. However, the reported PM10 concentrations were higher (Red MoniCA, 2016a, 2017, 2018). The discrepancy in the measured concentrations in the case of La Paz can likely be attributed to the different measurement site locations, as the sampling site in La Paz, described in the reports of Red MoniCA (2016a, 2017, 2018), was located in the downtown area, next to a busy avenue.
Among all the samples collected during the measurement campaign, 5 % and 12 % of the daily samples collected in La Paz and El Alto exceeded, respectively, the 24 h PM10 concentration of 45 µg m−3, which is not to be exceeded for more than 3–4 d yr−1, according to the short-term PM10 air quality guideline (AQG) level recommended by the World Health Organization (WHO, 2021b). Moreover, the annual PM10 concentrations in both cities are at least 1.2 times higher than the PM10 maximum yearly average exposure levels of 15 µg m−3 recommended in the annual AQG by the same organization (WHO, 2021b). Average measured PM10 concentrations were found to be 29.9±12.0 µg m−3 (STP 49.6±19.9 µg m−3) in El Alto and 27.2±8.9 µg m−3 in La Paz (STP 43.5±14.2 µg m−3). However, the annual average values can be relatively lower due to the undersampling during the wet season.
The observed concentrations are lower compared to those reported for Mexico City, a high-altitude (2850 m a.s.l.) Latin American megacity (Table 2), but higher than those observed in the cities of Bogotá and Quito. The average concentrations found in La Paz–El Alto are nearly double the reported average concentrations for most suburban and urban background sites in Europe and similar to those measured in Turkey and certain regions in Poland (Rybnik; 44.1 µg m−3), Bulgaria (Vidin; 41.3 µg m−3), the Republic of North Macedonia (Skopje; 48.7 µg m−3), and Italy (Naples; 46.9 µg m−3) in 2019 (EEA, 2020, 2022).
Table 2Air quality studies at high-altitude Latin American cities.
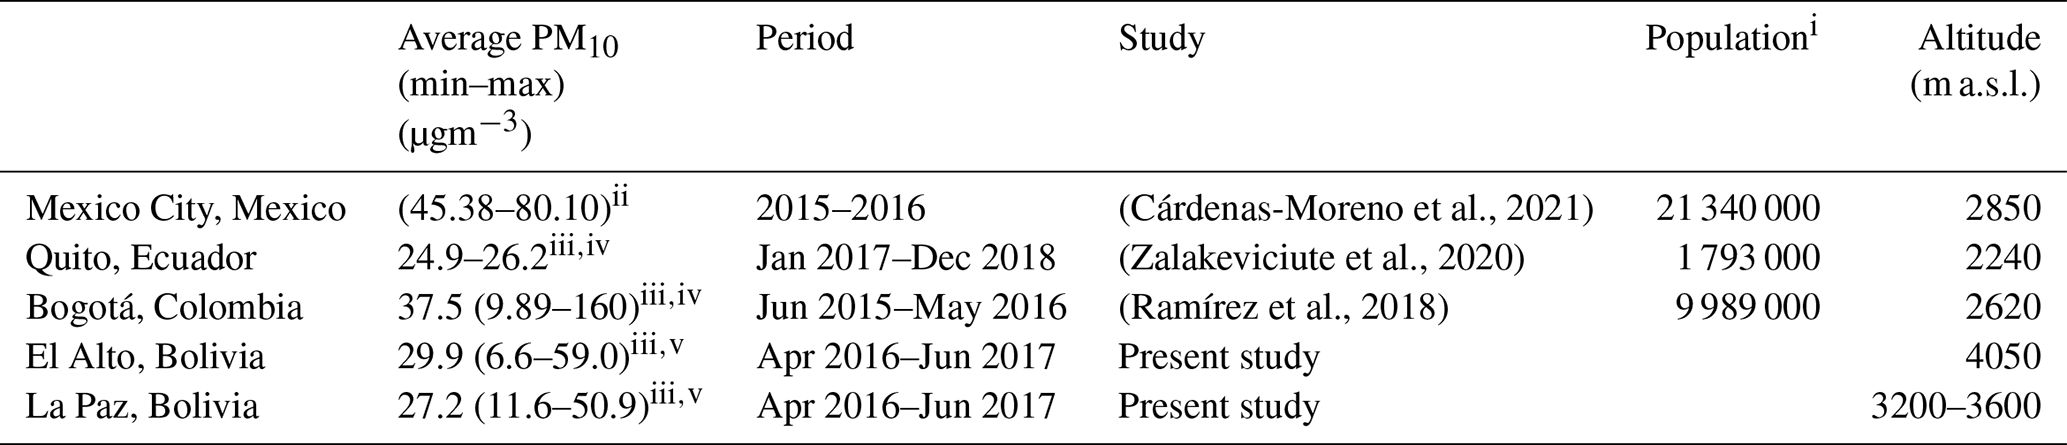
i https://populationstat.com/ (last access: 14 August 2023). ii Range of the spatial variation. iii Range of the seasonal variation. iv Concentrations reported in standard conditions of temperature and pressure. v Campaign-averaged PM10 concentrations that could slightly overestimate annual mean values due to a low number of samples collected during the wet season, during which the minimum mass concentrations are expected.
The reconstruction of the measured PM10 mass resulted from the mass closure of the major components of PM, as described in Favez et al. (2010), Putaud et al. (2004), Seinfeld and Pandis (1998), Chan et al. (1997), Pérez et al. (2008), and Cesari et al. (2016). Thus, in the following:
where the first curly bracket expression accounts for the organic matter, the third one accounts for the sum of the mass of secondary inorganic aerosol particles (non-sea-salt sulfate, nitrate, and ammonium), the fourth accounts for sea salt, and the fifth curly bracket accounts for the mass of the main components of crustal material, namely Al2O3, SiO2, TiO2, CaO, K2O, FeO, and Fe2O3 (multiplied by 1.15 to take sodium and magnesium oxides into account), and the mass of the unmeasured carbonates.
Average PM10 (reconstructed) PM10 (measured) ratios of 0.91 in El Alto and 0.82 in La Paz were found. The remaining unidentified mass fraction may be attributed to the loss of volatile organic matter and secondary aerosols post-weighing and during the transport of the filter fractions to be analyzed. The difference can also be associated with the presence of non-measured species (i.e., carbonates) or to the adsorption of water in the aerosol particles or the filter (Pio et al., 2013). Moreover, the 10 % uncertainty associated with the gravimetry measurements could also have a role in the observed difference.
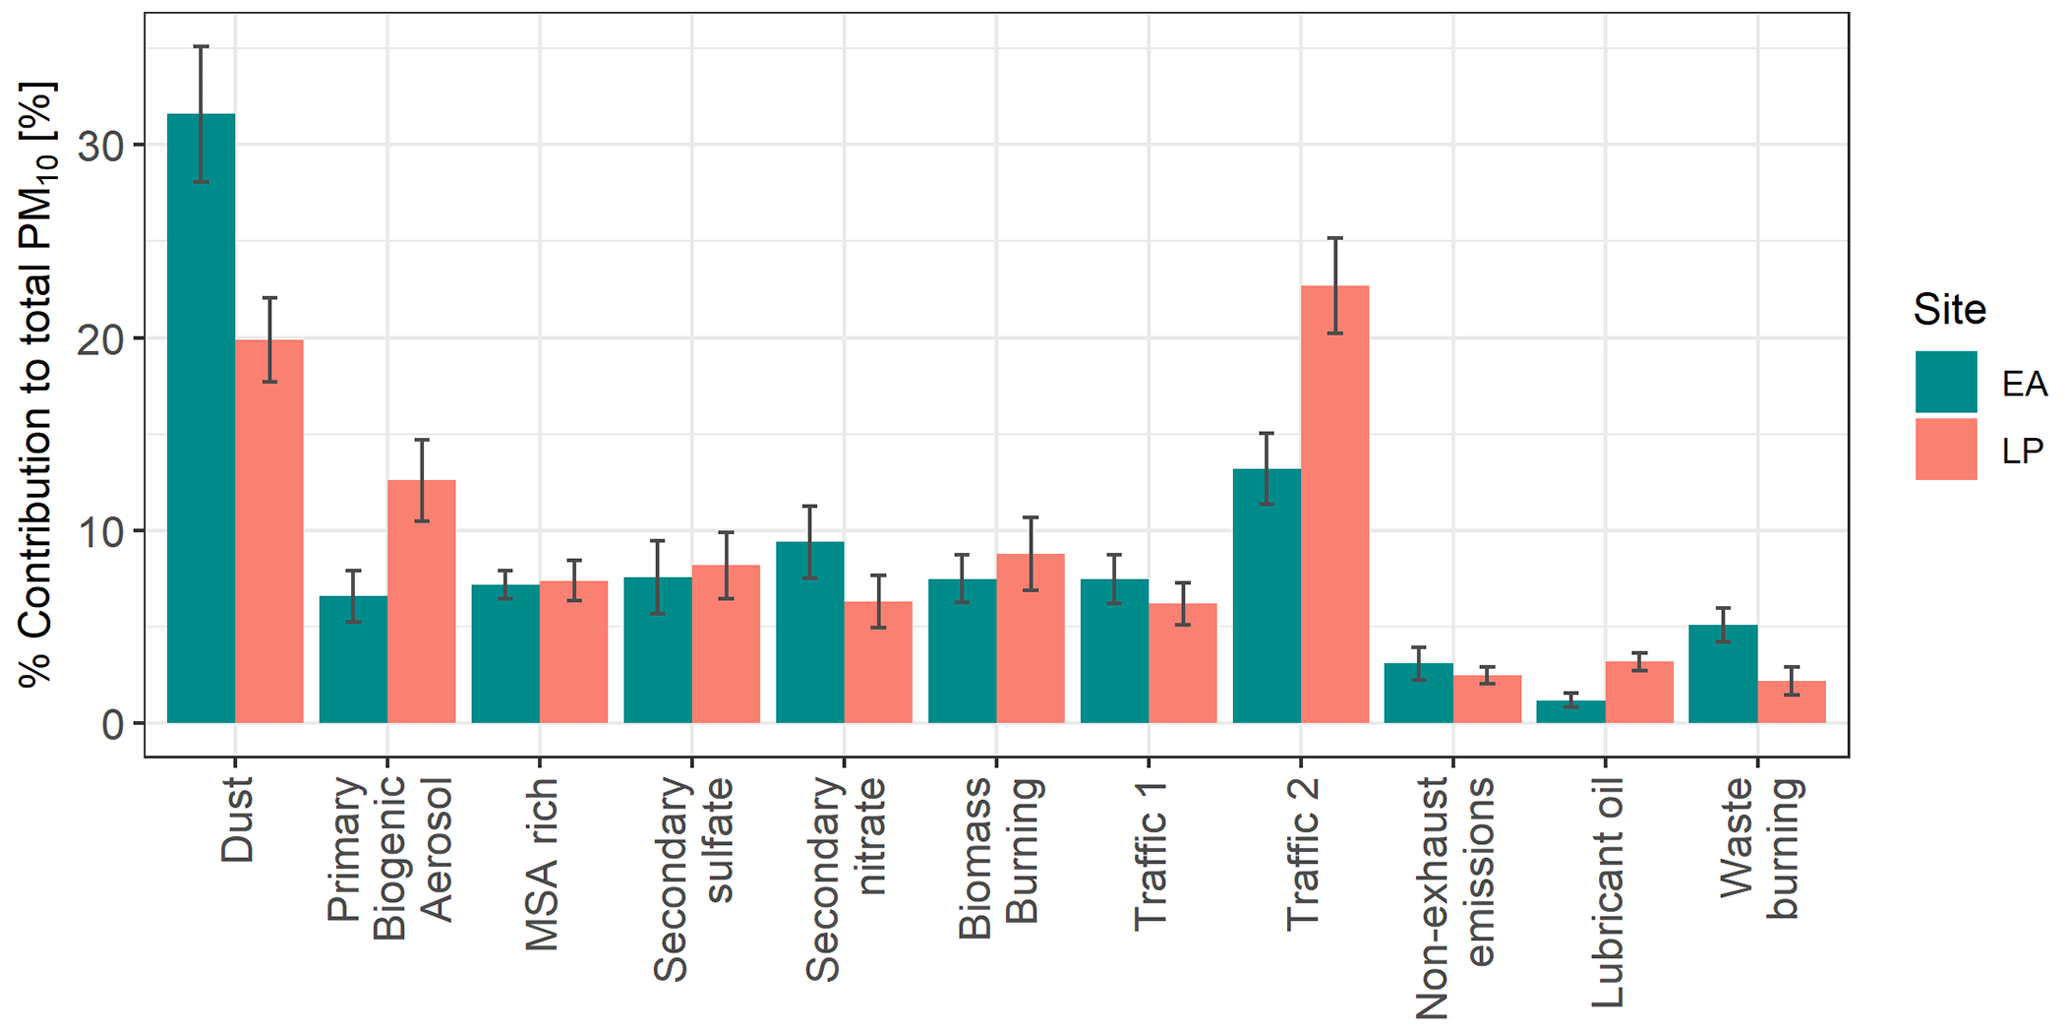
Figure 3Average factor contributions to total PM10 at each site, resulting from the multisite PMF. The bars represent the 95 % confidence interval of the mean values.
The average percentage contribution of the chemical species that significantly contribute to the measured PM10 concentrations in El Alto was 22±5 % OM (organic matter; i.e., 1.8⋅OC), 5±2 % EC, 9±5 % secondary inorganic aerosols (NH, NO, and SO), and 12±3 % crustal material (Al, Fe, Ti, Ca, K, Mg, Mn, and P). In La Paz, we found 25±5 % OM, 6±2 % EC, 8±5 % secondary inorganic aerosols, and 10±2 % crustal material. Moreover, Fig. S3 shows the monthly behavior of the principal species contributing to PM, along with certain specific source tracers.
Mean mass ratios of 2.6±1.1 and 2.8±1.6 were found for El Alto and La Paz, respectively, during the measurement period. This average ratio results from the combination of various sources, including vehicle emissions and other primary and secondary local and regional sources of carbonaceous particles (such as biomass burning, primary biogenic emissions, and secondary organic aerosols or SOA). The highest ratios, with the largest standard deviation, were observed between August and October, with maximum values in September. The mean ratios during this period is 3.5±1.3 for El Alto and 3.8±1.6 for La Paz, indicating the long-range influence of biomass burning emissions at the end of the agricultural year and the influence of primary organic emissions (Brines et al., 2019; Hays et al., 2002; Robert et al., 2007a, b; Samaké et al., 2019a, b; Waked et al., 2014). It was observed that biomass burning tracers peak in August, while polyols display an increase in concentrations, reaching its maximum in September. In contrast, minimum ratios that display a smaller dispersion around the mean were observed between March and April, with 1.9±0.6 and 2.0±0.6 in El Alto and in La Paz, respectively.
3.2 Source apportionment
After approaching the analysis individually for each site and observing that both sites shared similar sources, as well as considering the proximity of both cities, the multisite approach allowed us to overcome the challenge posed by the relatively low number of samples compared to the number of species included in the single-site analysis. This approach immediately provided a solution with greater stability, maintaining the previously observed profiles and making it possible to achieve a stable 11-factor solution. Figure 3 displays the percentage contribution attributed by the PMF analysis to each of the resolved sources after applying the constraints described in the previous section.
The measured PM10 concentrations versus the modeled PM10 concentrations through the multisite approach exhibited a linear relationship with a slope of 1.01 and an R2=0.95, indicating that the factor analysis adequately reproduced the measured concentrations. The 11 resolved sources include dust, secondary sulfate, secondary nitrate, primary biogenic aerosol (PBA), MSA rich, biomass burning (BB), traffic 1 (TR1), traffic 2 (TR2), lubricant, non-exhaust emissions, and waste burning (Fig. 3). Most of the resolved sources are consistent with the emission sources observed in previous studies performed in other sites (Weber et al., 2019; Waked et al., 2014; Yang et al., 2016; Chevrier, 2016). A comparison of the chemical profile of the sources resolved in the present study and the chemical profile of the sources resolved by Borlaza et al. (2021) and Weber et al. (2019), using the Pearson distance and standardized identity distance metric (PD-SID) described in Belis et al. (2015) and Pernigotti and Belis (2018), can be found in the Supplement. Furthermore, a separation of the traffic exhaust emissions (TR1 and TR2) linked to the type of fuel used will also be presented in the following sections.
Dust and the ensemble of vehicular contributions (i.e., traffic 1, traffic 2, lubricant, and non-exhaust emissions) together account for 55 % and 57 % of the measured PM10 mass concentrations in La Paz and El Alto, respectively. The dust factor exhibits outstanding contributions of 32 % in the city of El Alto, making it the dominant source in this city. Although the volume sampler was placed on the roof of the observatory building, it cannot be excluded that the samples were influenced by the local dust. In La Paz, the vehicular emissions take the lead in terms of percentage contributions (35 %). The factors associated with secondary aerosol particles (secondary sulfate, secondary nitrate, and MSA rich) were responsible for nearly 22 % and 24 % of total PM (La Paz and El Alto, respectively), and only a slight difference can be observed between the cities, except for the nitrate-rich profile. Finally, the biomass burning factor was responsible for an average of 9 % and 8 % of the total measured PM10 (in LP and EA, respectively). The chemical profiles and seasonality of each factor are displayed in Figs. 4 and 5, respectively, and one of the advantages of performing a multisite PMF in the present study is the possibility of differentiating between two traffic profiles that could hardly be observed in the individual solutions. Similarly, some factor profiles that remained mixed in the single-site solution for one site were polished as a result of combining both datasets. That was the case for the dust, MSA-rich, traffic 2, and non-exhaust profiles (single-site solutions can be found in the Supplement for comparison with the multisite solution).

Figure 4Source mass contribution monthly variations (n = number of modeled data points included in the average) between April 2016 and July 2017.
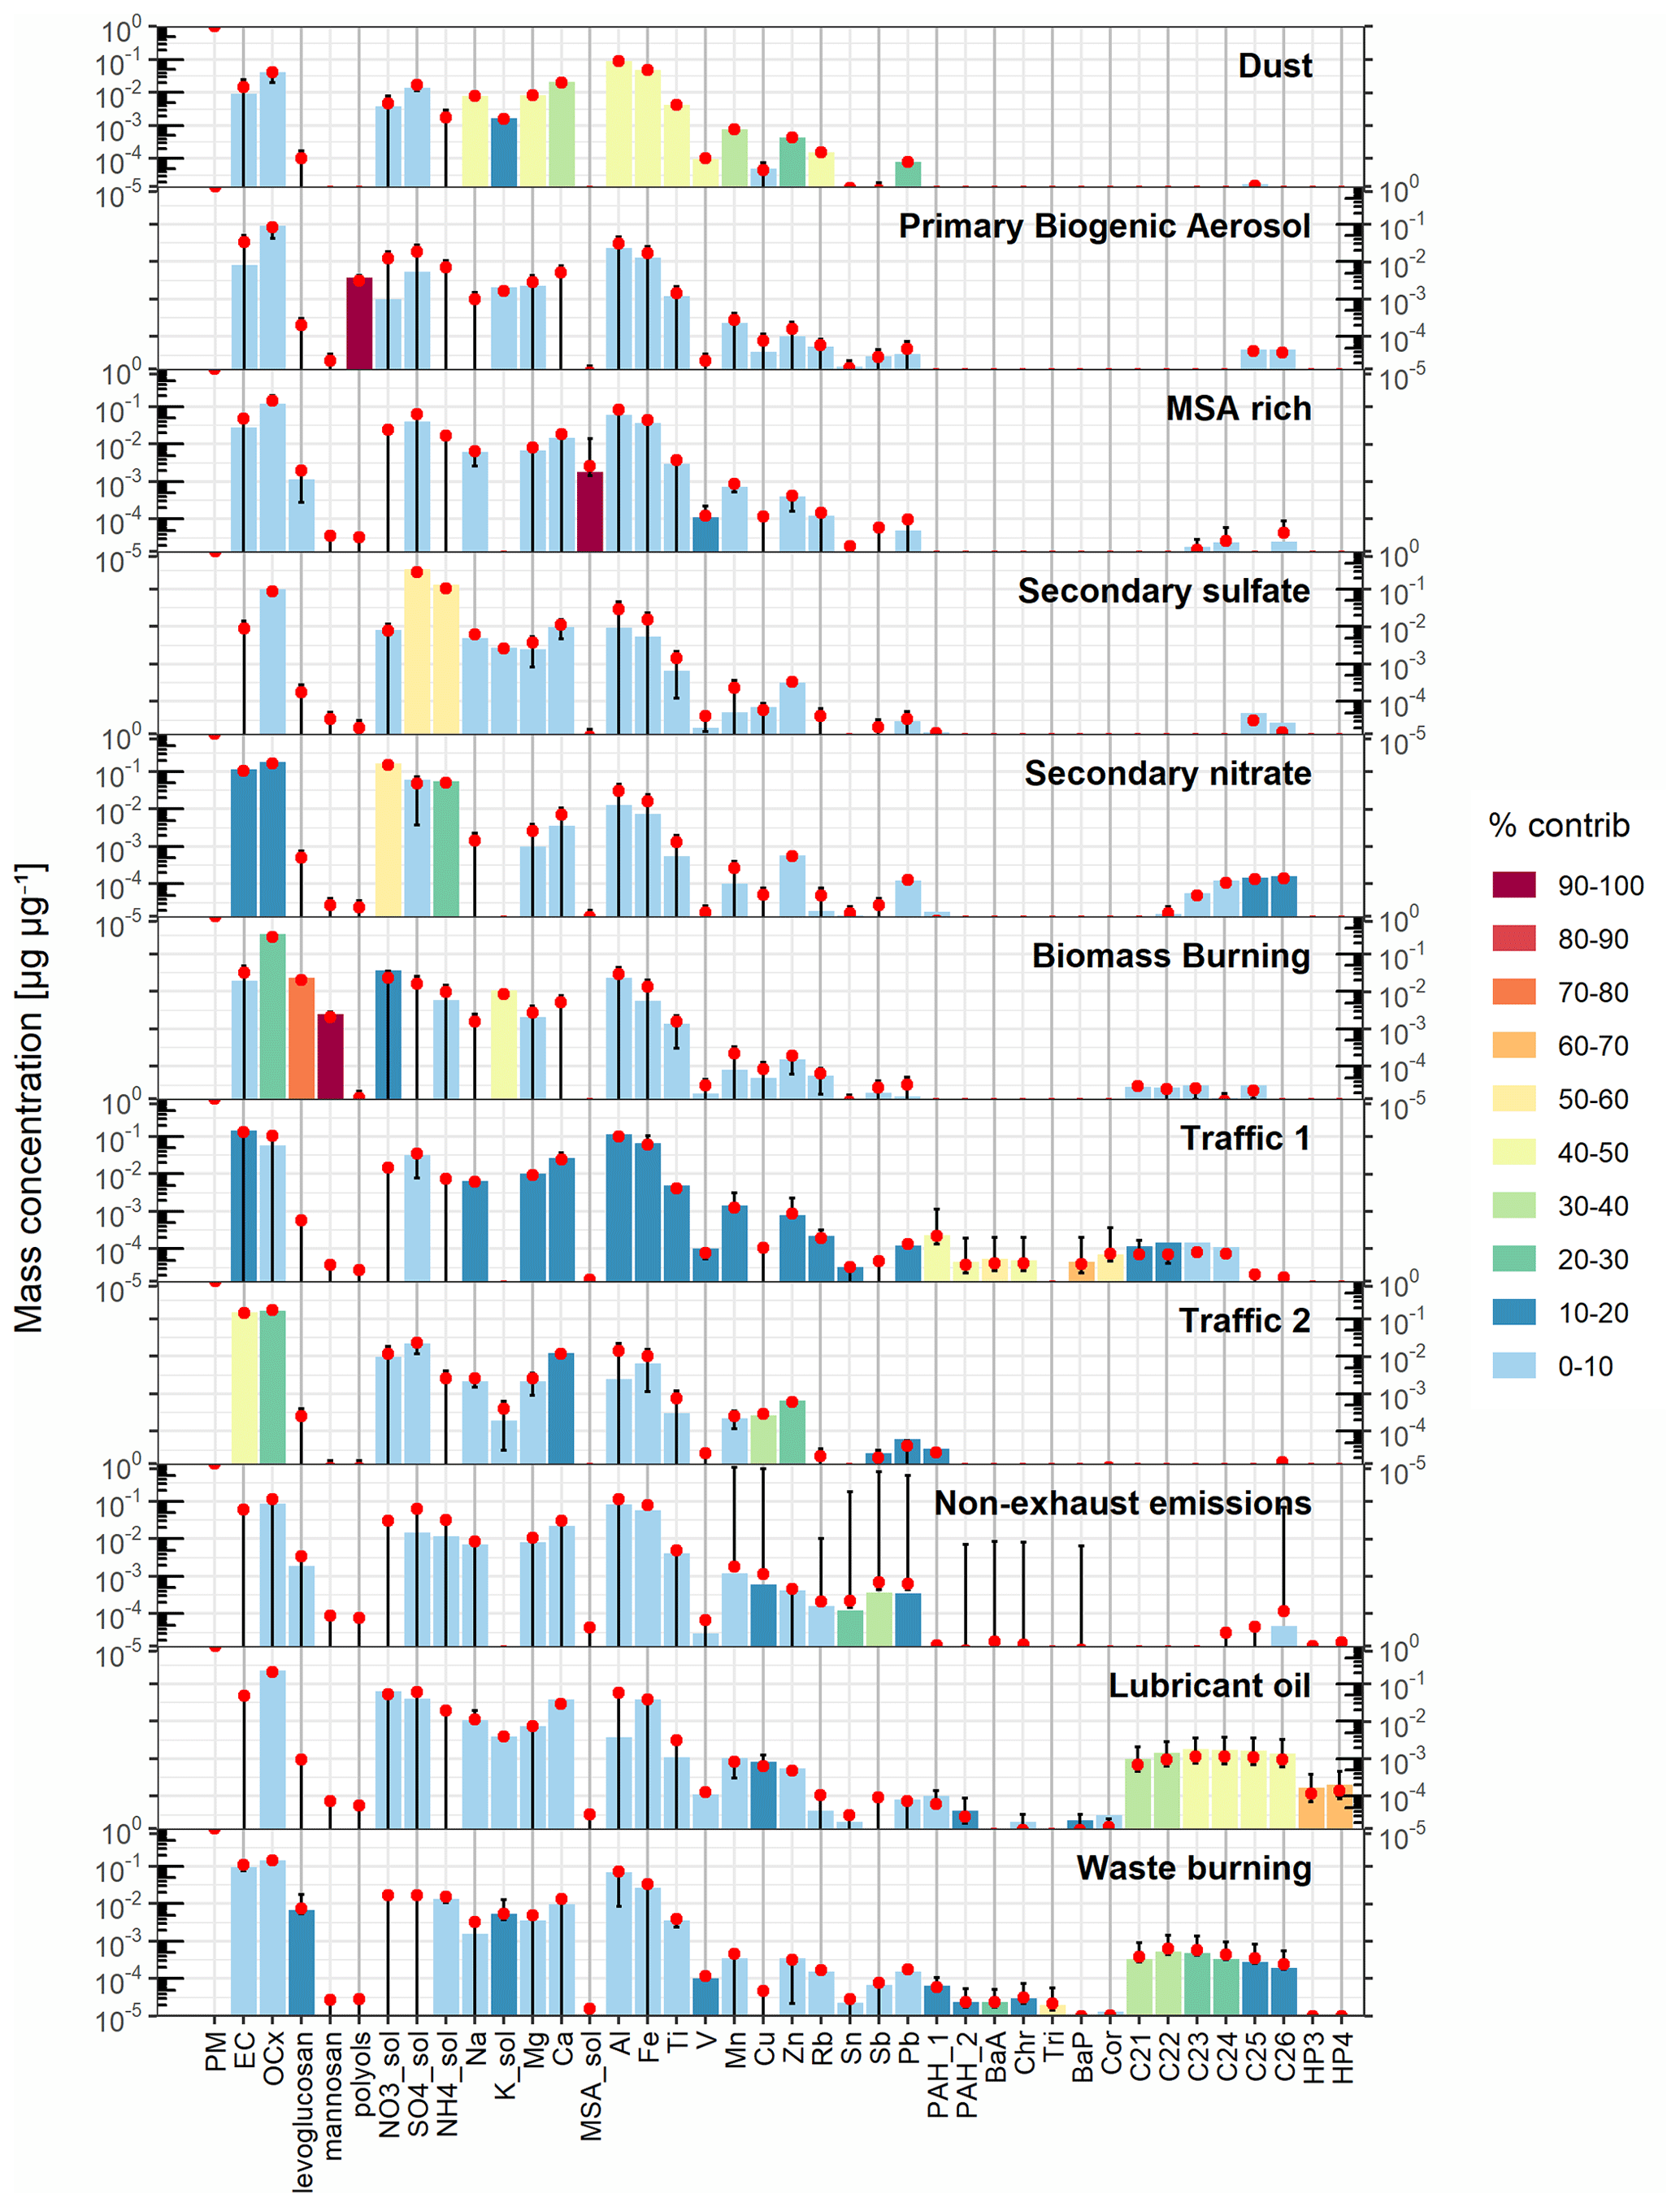
Figure 5Source chemical profiles. Bars represent the bootstrap median mass contributions of each species per microgram of PM mass that are attributed to each resolved source. Red dots represent mean DISP values. Error bars represent DISP confidence intervals, and the color scale represents the percentage contribution of each source to the average measured concentrations of each species. The name of each source is further described and developed in the individual factor descriptions (PAH_1: [BghiP] + [IP] + [BbF]; PAH_2: [Fla] + [Pyr]).
3.2.1 Dust
This factor is the major contributor to the observed PM10 mass at both sites and is traced by crustal elements, such as Al, Fe, Ti, Mg, Mn, Ca, Na, K, V, and Rb. The confidence interval for these species is narrow around the average displacement value, indicating that these species are mainly the ones that define this source profile. The presence of other elements, including sulfate, OC, Zn, and Pb (with a tight confidence interval), along with EC and Cu (with confidence intervals that allow negligible concentrations), supports the influence of road traffic in this source through road dust resuspension. This factor has an average contribution of 32 % (ambient concentrations 10.6±7.6 µg m−3; STP concentrations 15.7±11.2 µg m−3) to the total PM10 mass observed in El Alto during the measurements period and 20 % (ambient concentrations 5.5±4.1 µg m−3; STP concentrations 8.0±5.7 µg m−3) in the city of La Paz. This factor significantly contributes to the difference in PM mass concentrations observed between La Paz and El Alto. The factor contribution can rise up to 46 % of the mass in El Alto during wintertime (specifically in June), whereas its percentage contribution in La Paz reached a maximum during the transition month of October (27 %).
The difference in the contribution between these two sites can be attributed to the difference in the characteristics of La Paz and El Alto. El Alto, in particular, is a fast-growing city located on the edge of the Altiplano region. It is a dry and arid area with mostly unpaved streets and active construction work. On the other hand, the city of La Paz appears to be less influenced by this factor, likely due to a higher fraction of paved roads compared to El Alto. Additionally, La Paz is situated at a lower elevation, surrounded by mountains and hillsides, which reduces the impact of strong winds from the Altiplano. Although both stations were considered to represent the urban background, the terrain surrounding the two stations is very different. The El Alto station is located in the middle of airport facilities, which is in a rather dusty area, while the La Paz station is located on the rooftop of a building located in the middle of the city. Nevertheless, after combining the time series obtained from the PMF analysis for this factor and the meteorological information from both sites, it was observed that the highest contributions from this factor were associated with higher wind speeds coming from the northwest (NW). The seasonality observed in this factor is also consistent with the variation in precipitation that favors the main removal mechanism of dust in air (i.e., wet deposition). Similar contributions of dust to PM10 (with comparable or lower mass concentrations) have been reported by other studies in South America, like Sao Paulo, with 25.7 % (11.3 µg m−3, Pereira et al., 2017a); Bogotá, with 28 % (10.5 µg m−3 (STP); Ramírez et al., 2018); and Quito, with 19.11 %–20.79 % (4.8–5.3 µg m−3, Zalakeviciute et al., 2020). The absolute mass concentrations of dust (µg m−3) in the previously mentioned studies were calculated based on the reported percentage contributions of this factor to total PM and the reported average PM mass concentrations.
3.2.2 Primary biogenic aerosol (PBA)
The primary biogenic aerosol (PBA) factor is associated with the highest fraction of polyols, which serve as tracers of soil and fungi activity, as well as plant debris (Elbert et al., 2007; Samaké et al., 2019a, b). The following most important contributors to this factor, with narrow confidence intervals, are OC, K+, and heavier alkanes, which are species that have been observed to accompany this source in other similar studies (Borlaza et al., 2021; Chevrier, 2016). On average, PBA contributes 7 % and 13 % (1.5±1.0 and 2.8±1.8 µg m−3) to the annual PM10 mass observed in El Alto and La Paz, respectively. However, its contribution increased up to 11 % and 17 % (2.1±1.1 and 3.4±1.7 µg m−3) of the mass concentrations during the early autumn (March–April). Minimum concentrations were observed during winter. Similar results were found in France by Chevrier (2016) and Samaké et al. (2019b), where maximum concentrations of primary biogenic tracers were observed between late spring and early autumn. The highest contribution of this factor was observed in late summer (February) in La Paz 4.4±2.4 µg m−3, making it the second-largest source in terms of mass during this month (28 %). However, it should be noted that fewer samples were collected in the rest of the summer months. Higher contributions of this factor were consistently observed in LP compared to EA, most likely due to its closer proximity to vegetation (both local and in the valleys to the east).
3.2.3 MSA rich
This factor is predominantly identified by MSA, accounting for 100 % of the MSA present in the samples. A small fraction of OC, V, Mn, Zn, and certain heavy alkanes is also present in this factor, suggesting a potential minor contribution from anthropogenic sources. It contributes 7 % (2.0±0.9 and 2.0±1.4 µg m−3) to the observed PM10 mass in El Alto and La Paz. MSA is known to result from the oxidation of the primary emissions of dimethylsulfide (DMS) typically produced by marine phytoplankton; however, studies have shown other possible sources of DMS as terrestrial biogenic sources, forest biota, or lacustrine phytoplankton (Saltzman et al., 1983; Jardine et al., 2015; Du et al., 2017; Ganor et al., 2000). No clear seasonality was observed, except for the slight decrease in concentrations in the months of March and October.
Neither back-trajectory analysis nor association with the local wind direction helped to elucidate the specific origin of this factor. However, Aliaga et al. (2021) showed that air masses passing by Lake Titicaca formed part of the third main air mass pathway arriving at the nearest GAW station (CHC-GAW) between December 2017 and May 2018. Moreover, Scholz et al. (2023) showed that the observed DMS in CHC-GAW during the same period was mostly linked to the long-range transport of marine air masses, with a smaller contribution from Lake Titicaca. Considering that air masses originating from the coast do not represent an important source of PM in the conurbation, terrestrial or lacustrine sources could be a more likely origin of this factor. Lake Titicaca, the largest freshwater lake in South America, is located about 50 km outside the metropolitan area (about 50 km), and long-range transport of air masses from the Amazon can also be observed at the sampling sites.
3.2.4 Secondary sulfate
This factor contributes to 8 % of the total observed mass concentrations at both sites (1.9±2.1 and 2.0±2.1 µg m−3 in El Alto and La Paz, respectively) and is characterized by the presence of sulfate and ammonium. This factor is generally associated with the long-range transport of air masses in preceding European studies (Amato et al., 2016; Borlaza et al., 2021; Waked et al., 2014), due to the timescales and conditions necessary to form ammonium sulfate from its gaseous precursors, which are sulfuric acid (H2SO4) and ammonia (NH3; Viana et al., 2008). Additionally, a small fraction of other inorganic elements such as Na, K, Mg, and Ca are also found, with tight confidence intervals in this factor. These elements have been observed to be associated with sulfate-rich factors in previous European studies and are occasionally linked to long-range transport factors (aged sea salt; Weber et al., 2019; Veld et al., 2021; Borlaza et al., 2021; Dai et al., 2020). Nevertheless, the small contribution of Zn and some heavy alkanes in the factor shows that there could also be an influence of local sources on this factor. This could be attributed to the relaxed regulations of sulfur concentrations in imported fuels (<5000 ppm for diesel and <500 ppm for gasoline; decree 1499 of the Bolivian government in 2013), which represents 41 % to 46 % of the national fuel consumption (Correo del Sur Bolivia, 2022). Furthermore, this factor also includes a small fraction of OC that could originate either from anthropogenic emissions or from biogenic SOA formation (Borlaza et al., 2021).
The highest contributions from this factor were observed during October and November (local spring), where favorable conditions for ammonium sulfate formation are met, including strong solar radiation, moderate temperature, and relative humidity (Korhonen et al., 1999; Karamchandani and Seigneur, 1999). A similar temporal variability was observed in the city of Arequipa (Peru; Olson et al., 2021), which is the closest urban high-altitude large agglomeration (ca. 2300 m a.s.l.; ∼1 million inhabitants) located 300 km to the west of LP–EA. The aforementioned study found urban combustion emissions to be the main sources of sulfate aerosols in the city (50 %), followed by dust (20 %), despite its proximity to the coast and the central Andes volcanic region. However, it is important to highlight that an increase in the sulfur concentrations associated with an increase in the regional volcanism activity occurred during the same period (Manrique et al., 2018; Masías et al., 2016), which could contribute to the observed seasonality. Nonetheless, the fact that the average contributions of this factor to total PM10 are nearly identical in both cities indicates an even distribution of this factor throughout the metropolitan region. Although the overall contribution of this factor to total PM is relatively low compared to other factors, it accounts for 14 %–15 % of the observed mass in both sites during spring, while comprising only 3 %–4 % of the total mass during winter.
3.2.5 Secondary nitrate
This factor is responsible for 53 % of the nitrate found in the samples and represents the second-largest source for the ammonium found at both sites (23 %). This factor also exhibits a secondary contribution, with a narrow confidence interval for EC, OC, Zn, Pb, and heavy alkanes, which are tracers of traffic emissions. This shows that the main source of the nitrates observed in La Paz and El Alto is linked to the combustion of fossil fuels and is mostly locally produced from the oxidation of NOx emitted from traffic. Previous studies of emission inventories in the country have also estimated that mobile (transportation-related) sources are the main source of NOx (Herbst, 2007; Pareja et al., 2011).
The contribution of this factor to total PM10 was 9 % and 6 % (2.3±2.0 and 1.6±1.6 µg m−3) in El Alto and La Paz, respectively. Higher concentrations are observed in El Alto compared to La Paz. Since NOx concentrations were not monitored at either of the stations, we can only speculate that the difference between La Paz and El Alto is partly attributed to the difference in the ambient temperature between both cities, as colder temperatures favor the partitioning of nitrate in particulate phase.
3.2.6 Biomass combustion
The main source of for biomass burning pollution in tropical South America is agricultural practices and land use change (Mataveli et al., 2021). Although it is not a common practice in the Andean region, long-range transport of air masses coming from the Bolivian lowlands and neighboring countries contributes to PM at both sites. The main species represented in this factor are OC, levoglucosan, mannosan, and K+, which are typical tracers of biomass burning (Simoneit and Elias, 2000; Simoneit, 2002; Li et al., 2021). While 100 % of mannosan is explained by this factor, only 76 % of the levoglucosan present in the samples can be explained by this source (despite the applied constraint). Low contributions of EC to this factor produce a median ratio of 17.8. This factor exhibits similar annual contributions of 9 % and 8 % to PM10 concentrations in La Paz and El Alto, with maximum average contributions of 17 % and 13 % (6.4±5.4 and 5.4±4.7 µg m−3) in the middle of the dry season (July–September), with maximum concentration in August. In contrast, concentrations during autumn are much lower (1.0±1.0 and 1.3±0.9 µg m−3). The median levoglucosan-to-mannosan ratios () of this profile were found to be close to ratios previously reported for sugarcane burning (one of the main plantations in the Brazilian region of the Amazon) in laboratory and field studies (Hall et al., 2012, ; Pereira et al., 2017a, ; Pereira et al., 2017b, ; Zhang et al., 2015). The difference between the cities in the observed concentrations assigned to this factor during the biomass burning season might be explained by the fact that EA, located higher up on Altiplano, is potentially less influenced by long-range transport from the lowlands.
Although agricultural biomass burning practiced in the Andean valleys and the Amazon region of Bolivia and its neighboring countries has a relatively low annual contribution, it is important during the dry season. On days when PM10 concentrations exceeded the short-term exposure AQG recommended by the WHO (45 µg m−3 in 24 h), the biomass burning factor accounted for 13 % of the total mass in EA (7.0±5.9 µg m−3) and 23 % in LP (11.9±7.4 µg m−3), making biomass burning the second most important source of PM after dust during those episodes.
3.2.7 Non-exhaust vehicular emissions
This factor is identified by the presence of metals such as Cu, Sn, Sb, and Pb, along with a significant contribution of Fe in terms of mass. These species have been previously identified as tracers for brake and tire wear (Amato et al., 2011; Charron et al., 2019; Fukuzaki et al., 1986), which is generated by vehicles through mechanical abrasion. However, some studies have also found these tracers to be associated with industrial emissions (La Colla et al., 2021), for which we could not entirely neglect the possibility of having an influence of industrial emissions masked within this factor. This factor appeared at an early stage in the single-site PMF in El Alto, but it was not observable in La Paz. The multisite PMF allowed the clear identification of this factor in La Paz, splitting it from another traffic-related source. This factor contributes 3 % to the total PM10 mass at both sites, with slightly higher contributions during the dry season, following a similar seasonality pattern to that of the dust factor. However, this factor frequently presents high-concentration spikes in El Alto that are not observed in La Paz.
3.2.8 Open waste burning
With the inclusion of PAHs and alkanes into the PMF analysis, a specific factor tentatively associated with waste burning was identified. This factor is characterized by the presence of levoglucosan, K+, EC, OC, metal species such as Al, Ti, V, Rb, Pb, and PAHs, and alkanes. It accounts for 57 % of the triphenylene observed in the samples. This factor also contributes in median to 10 %–20 % of the observed concentrations of PAH_1, PAH_2, BaA, and Chr and 15 % to 35 % of the measured alkanes. It represents the second major source of the observed alkanes. Although Cl− was not included in the final PMF solution due to the instability, it was added to all the explored solutions; preliminary runs indicated a significant fraction of total Cl− associated with this factor. A Spearman correlation > 0.67 was found between the concentrations of Cl− and the PM concentrations attributed to this factor (Table S6). These elements are typical byproducts of the combustion of plastic mixed with vegetation or wood (Simoneit, 2002; Cash et al., 2021; Kumar et al., 2018; Rivellini et al., 2017; Lanz et al., 2008; Guttikunda et al., 2013, 2019; Christian et al., 2010; Singh et al., 2008). Similar factors have been observed in prior studies (Pereira et al., 2017a; Zíková et al., 2016; Rai et al., 2020), although only few of these studies were able to distinguish it as a separate factor from biomass burning or traffic, given the ubiquity of some of the tracers.
On an annual average, the total mass of PM10 attributed to this factor amounts to only 5 % and 2 % (1.8±1.8 and 0.8±1.2 µg m−3) in El Alto and La Paz, respectively. However, during winter, its contribution can increase to 9 % and 6 % (3.4±1.6 and 2.1±1.2 µg m−3). The seasonality of this factor is evident, with higher contributions in May and decreasing contributions in August. Although the exact source of this factor remains unidentified, the higher contributions in El Alto compared to La Paz suggest the presence of local sources within the El Alto area. An analysis of wind characteristics shows that higher concentrations of this factor are linked to low wind speeds blowing from the north in the case of El Alto and from the northwest, with higher wind speeds, in the case of La Paz (Fig. S7). The local emissions could originate from punctual sources of waste burning, or the emissions of industrial and open commercial areas in El Alto, which are later transported to the city of La Paz. Similar behavior was observed when associating Cl− with wind speed and wind direction (not presented here).
3.2.9 Traffic sources 1 and 2 (gasoline and diesel)
The first resolved traffic factor (TR1) is annually responsible for 6 % and 8 % of the observed PM mass in La Paz and El Alto, respectively (1.9±2.0 and 2.3±2.0 µg m−3). The main tracers of this factor are a small fraction of EC and OC, the presence of metals such as Na, Ca, Mg, Al, Fe, Ti, V, Mn, Zn, Rb, and Pb, and over 40 % of most PAH concentrations, which is consistent with previously observed vehicular emission factor profiles (Amato et al., 2011; Waked et al., 2014; Charron et al., 2019). Some traces of sulfate and lighter alkanes can also be observed in the chemical profile of this factor.
The second traffic factor (TR2) contributed with an average of 23 % and 13 % to total PM10 in La Paz and El Alto, respectively (5.7±3.5 and 3.6±2.5 µg m−3). The chemical species identified in this factor are similar to those found in TR1, including EC, OC, Zn, PAH_1, and Cor, with small contributions of sulfate, Na, Ca, Mg, and Mn. It is noteworthy that no alkanes and almost no hopanes are found in TR2, even if these compounds are, in principle, emitted by road traffic.
The median ratios obtained from the traffic chemical profiles of TR1 and TR2 are 0.4 and 1.1, respectively. The low ratios observed in high-altitude conditions are not surprising, as combustion processes are less efficient under low O2 availability (Wang et al., 2013a). However, because of the very different conditions for combustion, the literature values of the ratio (>1 for gasoline and <1 for diesel; Brito et al., 2013; Cheng et al., 2010, 2021; Wong et al., 2020; Yang et al., 2019) were not useful for identifying which of the traffic factors can be associated with gasoline- or diesel-powered vehicles, as both have ratios close to 1 in the present study.
A key distinction between the two traffic factors is the ratio, with TR1 exhibiting a ratio greater than 1 and TR2 showing the opposite trend. The fuel analysis (pre-combustion) revealed that the largest difference in the chemical composition between the local gasoline and diesel fuels was the relative abundance of Mn compared to Zn. While the measured pre-combustion ratios of are not preserved, the ratio remains a characteristic feature of each profile. Additionally, the TR1 factor has higher PAH concentrations, whereas in the TR2 factor, much lower contributions of PAHs are observed. Previous studies have demonstrated that gasoline-powered vehicles indeed emit more long-chain PAHs than diesel fuel (IFP, 2021; Leotz-Garziandia et al., 1999; Zielinska et al., 2004a). While gasoline-powered vehicles represent over 80 % of the vehicle fleet in Bolivia, the literature has shown that diesel-powered vehicles can emit 10 to 30 times more particles than gasoline-powered vehicles (Zielinska et al., 2004b).
In terms of contribution, TR2 has a greater overall influence than TR1 in La Paz and is almost twice as influential as TR2 in El Alto. This difference could be related to the difference in the topography, as previous studies have shown that steep slopes can significantly increase the vehicle fuel consumption (Carrese et al., 2013; Wang and Boggio-Marzet, 2018). Additionally, the proximity of the LP sampling site to the nearest main avenue (∼100 m) and to the parking lot of the municipality's buses (∼100 m horizontal distance; ∼45 m vertical distance), which are diesel-powered vehicles, may play an important role in the respective influences of TR1 and TR2 in LP.
The PD-SID comparison of both traffic factors with the road traffic profiles of several urban or urban background French sites, as presented in Borlaza et al. (2021) and Weber et al. (2019; see the Supplement), revealed that there is a significant similarity between TR2 and the French road traffic factors (where diesel is the dominant fuel used). However, TR1 exhibits PD values outside of the similarity thresholds established by Pernigotti and Belis (2018).
Based on the previous description of factors TR1 and TR2, we consider it likely that TR1 is related to the emissions from gasoline-powered vehicles, whereas TR2 is most likely associated with diesel-powered vehicles. However, the number of registered cars reported by the local municipal tax administration in 2011 showed that the number of gasoline-powered vehicles in the city of La Paz (∼90 % of the registered vehicle fleet in La Paz) was 2.4 times greater than for the ones registered in El Alto (∼80 % of the registered vehicle fleet in El Alto). In contrast, a similar number of diesel-powered vehicles were registered at both sites. If these numbers were directly related to the flow of vehicles in the metropolitan area, then they could imply the opposite of what can be concluded from the chemical profiles (i.e., TR1 would be associated with diesel-powered vehicles, and TR2 would be associated with gasoline-powered vehicles). However, it should be noted that vehicle registration does not necessarily imply that those are operational vehicles. This could be the case, especially for trucks and buses that move between La Paz and El Alto. In addition, it is known that large contributions of emissions could come from a small number of vehicles (Ježek et al., 2015; La Colla et al., 2021; Brito et al., 2013). These factors make it challenging to estimate the contribution of the different types of vehicles circulating in the metropolitan area to the measurements obtained from the filters.
Together, TR1 and TR2 constitute a major source of particulate matter in La Paz and the second-largest source of PM10 particles in El Alto. TR1 displays a slight seasonality, with higher concentrations during the dry season of 2016. On the other hand, TR2 does not display significant seasonality, except for higher concentrations observed between April–May 2016 and May–June 2017. Although one might expect a similar variability for traffic-related profiles, this is not the first study to observe a difference in the yearly variability in the gasoline and diesel emissions (Squizzato et al., 2018, for a study in New York State).
3.2.10 Lubricant oil
The inclusion of molecular organic species (PAH, alkanes, and hopanes) enabled the identification of a factor associated with lubricant combustion, likely originating from vehicle emissions. This factor is marked by the presence of hopanes and alkanes in the chemical profile, which serve as unequivocal tracers of oil combustion (Charron et al., 2019; El Haddad et al., 2009). This factor contributes 36 %–47 % to the total mass of alkanes present in the samples and constitutes the major source of hopanes, accounting for 65 % of their total mass. Additionally, this factor presents smaller percentage contributions of OC, K+, Na, Ca, V, Mn, Cu, Zn, and certain PAHs, which are elements commonly present in fuel combustion emissions. The contribution of this source to the annual PM10 mass is of 3 % and 1 % (0.9±0.8 and 0.4±0.6 µg m−3) in La Paz and El Alto, respectively. A clear increase in the contributions during the coldest months of the year can be observed in the variability in this factor. A similar evolution of the hopanes, with maximum concentrations during winter, was observed in Marnaz (France) by Chevrier (2016). Likewise, a study in three cities of the United States of America (USA) observed an increase in the concentrations of hopanes and alkanes during the coldest months of the year (Kioumourtzoglou et al., 2013). This seasonality could be associated with the cold start of vehicle engines in the early morning and late-night hours, which is the period when minimum temperatures decrease.
Overall, the contribution of this factor is greater in the city of La Paz compared to El Alto. This discrepancy can be attributed to the additional strain experienced by vehicle engines while navigating the steep streets of La Paz, which is a challenge that is less pronounced in El Alto due to its flat topography. Although the contributions of this factor to total PM10 mass are relatively low, its significance in terms of air quality should not be underestimated, as it represents one of the major sources of alkanes and hopanes. The latter compound is considered hazardous for human health, since it has proven to be associated with systemic inflammation biomarkers (Delfino et al., 2010).
3.3 Methodology discussions
The sampling strategy, the complete chemical characterization, and the multisite PMF, coupled with the specific geographical patterns, enabled this rather unique study to offer an extensive characterization of PM sources in high-altitude cities. The present investigation provides important information that can help shift policy-making towards ensuring better air quality in the region; however, we are aware of some limitations.
3.3.1 PMF limitations
Having enough samples in the multisite approach and a fairly large chemical speciation including organic tracers allowed the identification of 11 factors in the PMF analysis. It is noteworthy that only a few studies have been able to resolve a similar number of sources with good statistical indicators (Chevrier, 2016; Pandolfi et al., 2020; Waked et al., 2014; Weber et al., 2019; Borlaza et al., 2021). Nevertheless, attempting a larger number of factors generated instability in the otherwise geochemically stable profiles. Several factors may contribute to this limitation, including the following:
-
Possible collinearity between sources, which could result in mixed factors. The presence of OC in both secondary sulfate and primary biogenic emissions could speak of a possible mixing of these factors with biogenic secondary organic aerosol (BSOA). A detachment of BSOAs was not possible due to the lack of the specific tracers of this source (3-MBTCA, cellulose, or methyltetrols).
-
Although the industrial sector is not highly developed, there are factories within and around the vicinity of the metropolitan area that were not resolved by the PMF (e.g., cement plants, brickyards, and PVC manufactory plants). This could be due to the lack of specific tracers for these sources in the analysis, a similarity of the chemical profile, and the temporal variability in the emissions compared to the resolved sources or simply because they represent a very small fraction of PM10.
-
The exclusion of chloride from the analysis for which it added instability to the solution. This instability was likely associated with the large variability expected for this volatile compound.
3.3.2 Multisite approach limitations
While the multisite approach has enhanced the findings compared to a single-site approach, it is important to note that a priori this method cannot be directly applied to sites that differ greatly from each other. It was important to verify the similarity of the single-site solution. However, one drawback of the multisite approach is that it enforces the similarity of the common factors found between the two sites and smooths out the specificity of them. Examples of this forced similarity are as follows:
-
The multisite approach successfully separated EC (a traffic tracer) from the dust profile. However, considering that the Altiplano is a major source of dust and that the only path that the air masses take when transporting dust from the Altiplano to La Paz is traversing both cities, it is not surprising that the dust factor in the city of La Paz (single-site solution) is highly influenced by traffic tracers. For the multisite solution, the indirect information of the mixing of sources during transport is lost.
-
The average molar ratio of sulfate and ammonia concentrations differs between the two cities (2.05 and 1.63 in El Alto and La Paz, respectively), indicating a lower availability of ammonium to neutralize the sulfate and nitrate ions in the city of La Paz. However, this distinction is no longer evident in the multisite analysis, which yields a median molar ratio of 1.96 that is representative of both cities.
-
The MSA-rich profile in El Alto exhibits strong mixing with metallic species, among them crustal material, which hinted at its path through the Altiplano towards the city of El Alto. This mixing pattern is no longer evident in the multisite analysis.
Considering that the advantages of a more specific characterization of sources provided by the multisite approach outweigh the associated drawbacks, we believe it was the most appropriate technique to apply in the metropolitan region of La Paz and El Alto with such a database at hand.
This study presents innovative information and a unique analysis of air pollution sources in the high-altitude urban environment of the fast-growing cities of La Paz and El Alto in Bolivia. It also provides a detailed description of the chemical profiles of 11 identified source types, resolved by the multisite PMF method, along with their temporal and spatial variability. The extensive and comprehensive dataset, combined with the inclusion of inorganic and organic species in the analysis, enabled an advanced source apportionment beyond classical solutions, allowing for the identification of several biogenic and combustion-related factors that would have remained unresolved otherwise. Notably, waste burning was separated from biomass burning, and traffic exhaust emissions were separated into two independent profiles.
On average, vehicular emissions represent 35 % and 25 % of the PM10 concentrations measured in La Paz and El Alto, respectively. Then, dust emerges as one of the two main sources, contributing 20 % and 32 %. Factors associated with secondary inorganic aerosols account for 22 % and 24 %, and the primary biogenic emissions account for 7 % and 13 % annually. Although one of the smallest factors in terms of contribution to the total mass, the non-regulated burning of waste, predominantly occurring in El Alto between May and August, is the second most significant factor responsible for observed PAH concentration levels.
The observations in this study were made at urban background sites, thereby representing wider regional pollution levels in La Paz and El Alto. Locally, especially near roads or landfills, the mass concentrations are expected to be higher. While most of the resolved sources are associated with local activities (dust resuspension, primary and secondary vehicular emissions, and waste burning), there is a significant contribution of regional natural and anthropogenic sources of PM (primary and secondary biogenic emissions, and biomass burning).
Based on our findings, we can outline the following relevant actions towards the improvement of air quality in La Paz and El Alto:
-
Regulation of vehicular emissions has to be improved. As the metropolitan area continues to grow, more efficient means of transportation and stricter policies and control on combustion practices are needed to ensure that the air quality is not further degraded.
-
Waste burning should be prohibited. It is a major source of PAHs and other pollutants, with a high human health risk factor.
-
Agricultural biomass burning is a seasonal source; hence, a decrease in their emissions would result in a significant improvement in the air quality during the most polluted season, not only for the metropolis but also for the rest of the country.
-
Dust is an important source in terms of mass that has an anthropogenic component (e.g., vehicle resuspension, construction activities, and mining) and should be addressed.
-
Updated policies of pollutant emissions are essential to also regulate the growing industry sector.
In order to have a comprehensive understanding of the pollution sources in the metropolitan area of La Paz and El Alto, information on the gaseous components is of utmost importance. A longer sampling time period, together with an updated emissions inventory of the resolved sources, would be beneficial for a better understanding of the resolved sources and their evolution in time. Furthermore, analyzing the potential impact of the resolved sources on human health is crucial to efficiently target the most hazardous sources of PM.
The software code and the chemical and PMF datasets are available upon request to the corresponding author.
The supplement related to this article is available online at: https://doi.org/10.5194/acp-23-10325-2023-supplement.
GU, MA, PL, JLJ, AA, JLB, RK, IM, NP, and AW participated in the conceptualization of the experimental setup and design. IM participated in the data curation. VM, MP, and LJB participated in the formal analysis and the development of the methodology. GU, MA, PL, JLJ, AA, JLB, RK, and PG were involved in the funding and resource acquisition. JLB, IM, NP, and VC contributed to the investigation by organizing the sample collection and performing the experiments. GU, MA, PL, MP, LJB, GM, and JLJ helped with mentoring, supervision, and validation of the methodology, techniques, and results. VM was responsible for the data processing and the writing of the original draft. GU, PL, and JLB revised the original draft. All co-authors reviewed and edited the paper.
Griša Močnik is employed by Haze Instruments d.o.o., the manufacturer of the aerosol instrumentation. The peer-review process was guided by an independent editor, and the authors also have no other competing interests to declare.
Publisher's note: Copernicus Publications remains neutral with regard to jurisdictional claims in published maps and institutional affiliations.
The authors wish to thank all of the many people from the different laboratories (LFA, Idaea-CSIC, IGE, Air-O Sol analytical platform, and EDYTEM), who actively contributed to filter sampling and/or analysis over the years. We specifically thank Samuel Weber, Federico Bianchi, Claudia Mohr, and Diego Aliaga for the active participation in the discussions of the obtained results. Our gratitude goes to Jean-Charles Franconny and Mathieu Pin, who carried out the organic compounds analysis by the gas chromatograph mass spectrometer on the PTAL analytical platform of EDYTEM; the engineers Fanny Masson, Fanny Donaz, Claire Vérin, Anthony Vella, Rhabira El Azzouzi, and many other technicians, who performed EC/OC, ionic chromatography, and HPLC-PAD (high-performance liquid chromatography with pulsed amperometric detection) analyses on the Air-O Sol analytical platform; Sergio Rios and Erika Miranda (deceased) of GAMLP (Gobierno Autónomo Municipal de La Paz), who provided access and facilitated tasks at Pipiripi; the IIF personnel that helped with the logistics during the campaign; and the undergraduate students Yaneth Laura, Grover Salvatierra, Manuel Roca, Dayana Calasich, Ever Huanca, Zarela Tuco, Santiago Herrera, Mónica Vicente, Monserrat Zapata, and Roxana Copa, who collected samples.
This research has been supported by the Institute de Recherche pour le Développement (IRD) France and IRD delegation in Bolivia, Javna Agencija za Raziskovalno Dejavnost RS (grant no. P1-0385) and the Grant Agency of the Czech Republic (grant no. 19-15405S). The Labex OSUG@2020 (ANR10 LABX56) provided some financial support for instruments on the Air-O Sol analytical platform, as part of the EU H2020 MSCA-RISE project PAPILA (grant no. 777544).
This paper was edited by Samara Carbone and reviewed by two anonymous referees.
Aliaga, D., Sinclair, V. A., Andrade, M., Artaxo, P., Carbone, S., Kadantsev, E., Laj, P., Wiedensohler, A., Krejci, R., and Bianchi, F.: Identifying source regions of air masses sampled at the tropical high-altitude site of Chacaltaya using WRF-FLEXPART and cluster analysis, Atmos. Chem. Phys., 21, 16453–16477, https://doi.org/10.5194/acp-21-16453-2021, 2021.
Amato, F., Pandolfi, M., Escrig, A., Querol, X., Alastuey, A., Pey, J., Perez, N., and Hopke, P. K.: Quantifying road dust resuspension in urban environment by Multilinear Engine: A comparison with PMF2, Atmos. Environ., 43, 2770–2780, https://doi.org/10.1016/j.atmosenv.2009.02.039, 2009.
Amato, F., Viana, M., Richard, A., Furger, M., Prévôt, A. S. H., Nava, S., Lucarelli, F., Bukowiecki, N., Alastuey, A., Reche, C., Moreno, T., Pandolfi, M., Pey, J., and Querol, X.: Size and time-resolved roadside enrichment of atmospheric particulate pollutants, Atmos. Chem. Phys., 11, 2917–2931, https://doi.org/10.5194/acp-11-2917-2011, 2011.
Amato, F., Alastuey, A., Karanasiou, A., Lucarelli, F., Nava, S., Calzolai, G., Severi, M., Becagli, S., Gianelle, V. L., Colombi, C., Alves, C., Custódio, D., Nunes, T., Cerqueira, M., Pio, C., Eleftheriadis, K., Diapouli, E., Reche, C., Minguillón, M. C., Manousakas, M.-I., Maggos, T., Vratolis, S., Harrison, R. M., and Querol, X.: AIRUSE-LIFE+: a harmonized PM speciation and source apportionment in five southern European cities, Atmos. Chem. Phys., 16, 3289–3309, https://doi.org/10.5194/acp-16-3289-2016, 2016.
Belis, C. A., Pernigotti, D., Karagulian, F., Pirovano, G., Larsen, B., Gerboles, M., and Hopke, P.: A new methodology to assess the performance and uncertainty of source apportionment models in intercomparison exercises, Atmos. Environ., 119, 35–44, https://doi.org/10.1016/j.atmosenv.2015.08.002, 2015.
Belis, C. A., Favez, O., Mircea, M., Diapouli, E., Manousakas, M.-I., Vratolis, S., Gilardoni, S., Paglione, M., Decesari, S., Mocnik, G., Mooibroek, D., Salvador, P., Takahama, S., Vecchi, R., and Paatero, P., European guide on air pollution source apportionment with receptor models – Revised version 2019, EUR 29816, Publications Office of the European Union, Luxembourg, JRC117306, ISBN 978-92-76-09001-4, https://doi.org/10.2760/439106, 2019.
Bishop, G. A., Morris, J. A., Stedman, D. H., Cohen, L. H., Countess, R. J., Countess, S. J., Maly, P., and Scherer, S.: The effects of altitude on heavy-duty diesel truck on-road emissions, Environ, Sci. Technol., 35, 1574–1578, https://doi.org/10.1021/es001533a, 2001.
Borlaza, L. J. S., Weber, S., Uzu, G., Jacob, V., Cañete, T., Micallef, S., Trébuchon, C., Slama, R., Favez, O., and Jaffrezo, J. L.: Disparities in particulate matter (PM10) origins and oxidative potential at a city scale (Grenoble, France) – Part 1: Source apportionment at three neighbouring sites, Atmos. Chem. Phys., 21, 5415–5437, https://doi.org/10.5194/acp-21-5415-2021, 2021.
Boulon, J., Sellegri, K., Venzac, H., Picard, D., Weingartner, E., Wehrle, G., Collaud Coen, M., Bütikofer, R., Flückiger, E., Baltensperger, U., and Laj, P.: New particle formation and ultrafine charged aerosol climatology at a high altitude site in the Alps (Jungfraujoch, 3580 m a.s.l., Switzerland), Atmos. Chem. Phys., 10, 9333–9349, https://doi.org/10.5194/acp-10-9333-2010, 2010.
Bourgeois, Q., Ekman, A. M. L., and Krejci, R.: Aerosol transport over the andes from the amazon basin to the remote Pacific Ocean: A multiyear CALIOP assessment, J. Geophys. Res., 120, 8411–8425, https://doi.org/10.1002/2015JD023254, 2015.
Brines, M., Dall'Osto, M., Beddows, D. C. S., Harrison, R. M., Gómez-Moreno, F., Núñez, L., Artíñano, B., Costabile, F., Gobbi, G. P., Salimi, F., Morawska, L., Sioutas, C., and Querol, X.: Traffic and nucleation events as main sources of ultrafine particles in high-insolation developed world cities, Atmos. Chem. Phys., 15, 5929–5945, https://doi.org/10.5194/acp-15-5929-2015, 2015.
Brines, M., Dall'Osto, M., Amato, F., Minguillón, M. C., Karanasiou, A., Grimalt, J. O., Alastuey, A., Querol, X., and van Drooge, B. L.: Source apportionment of urban PM1 in Barcelona during SAPUSS using organic and inorganic components, Environ. Sci. Pollut., 26, 32114–32127, https://doi.org/10.1007/s11356-019-06199-3, 2019.
Brito, J., Rizzo, L. V., Herckes, P., Vasconcellos, P. C., Caumo, S. E. S., Fornaro, A., Ynoue, R. Y., Artaxo, P., and Andrade, M. F.: Physical–chemical characterisation of the particulate matter inside two road tunnels in the São Paulo Metropolitan Area, Atmos. Chem. Phys., 13, 12199–12213, https://doi.org/10.5194/acp-13-12199-2013, 2013.
Cárdenas-Moreno, P. R., Moreno-Torres, L. R., Lovallo, M., Telesca, L., and Ramírez-Rojas, A.: Spectral, multifractal and informational analysis of PM10 time series measured in Mexico City Metropolitan Area, Physica A, 565, 125545, https://doi.org/10.1016/j.physa.2020.125545, 2021.
Carrese, S., Gemma, A., and La, S. Impacts of driving behaviours, slope and vehicle load factor on bus fuel consumption and emissions: a real case study in the city of Rome, Procd. Soc. Behv., 87, 211–221, https://doi.org/10.1016/j.sbspro.2013.10.605, 2013.
Cash, J. M., Langford, B., Di Marco, C., Mullinger, N. J., Allan, J., Reyes-Villegas, E., Joshi, R., Heal, M. R., Acton, W. J. F., Hewitt, C. N., Misztal, P. K., Drysdale, W., Mandal, T. K., Shivani, Gadi, R., Gurjar, B. R., and Nemitz, E.: Seasonal analysis of submicron aerosol in Old Delhi using high-resolution aerosol mass spectrometry: Chemical characterisation, source apportionment and new marker identification, Atmos. Chem. Phys., 21, 10133–10158, https://doi.org/10.5194/acp-21-10133-2021, 2021.
Castro-Verdezoto, P. L., Vidoza, J. A., and Gallo, W. L. R.: Analysis and projection of energy consumption in Ecuador: Energy efficiency policies in the transportation sector, Energ. Policy, 134, 110948, https://doi.org/10.1016/j.enpol.2019.110948, 2019.
Cesari, D., Amato, F., Pandolfi, M., Alastuey, A., Querol, X., and Contini, D.: An inter-comparison of PM10 source apportionment using PCA and PMF receptor models in three European sites, Environ. Sci. Pollut., 23, 15133–15148, https://doi.org/10.1007/s11356-016-6599-z, 2016.
Chan, Y. C., Simpson, R. W., Mctainsh, G. H., and Vowles, P. D.: Characterization of chemical species in PM2.5 and PM10 aerosols in Brisbane, Australia, Atmos. Environ., 31, 3773–3785, 1997.
Charron, A., Polo-Rehn, L., Besombes, J., Golly, B., Buisson, C., Chanut, H., Marchand, N., Guillaud, G., Jaffrezo, J., Savoie, U., Blanc, M., Velin, V., Auvergne-rhône-alpes, A., and Université, A.: Identification and quantification of particulate tracers of exhaust and non-exhaust vehicle emissions, Atmos. Chem. Phys., 19, 5187–5207, https://doi.org/10.5194/acp-19-5187-2019, 2019.
Chauvigne, A., Aliaga, D., Sellegri, K., Montoux, N., Krejci, R., Mocnik, G., Moreno, I., Müller, T., Pandolfi, M., Velarde, F., Weinhold, K., Ginot, P., Wiedensohler, A., Andrade, M., and Laj, P.: Biomass burning and urban emission impacts in the Andes Cordillera region based on in situ measurements from the Chacaltaya observatory, Bolivia (5240 m a.s.l.), Atmos. Chem. Phys., 19, 14805–14824, https://doi.org/10.5194/acp-19-14805-2019, 2019.
Cheng, Y., Lee, S. C., Ho, K. F., Chow, J. C., Watson, J. G., Louie, P. K. K., Cao, J. J., and Hai, X.: Chemically-speciated on-road PM2.5 motor vehicle emission factors in Hong Kong, Sci. Total Environ., 408, 1621–1627, https://doi.org/10.1016/j.scitotenv.2009.11.061, 2010.
Cheng, Y., Chow, J. C., Watson, J. G., Zhou, J., Liu, S., and Cao, J.: Decreasing concentrations of carbonaceous aerosols in China from 2003 to 2013, Sci. Rep., 11, 1–10, https://doi.org/10.1038/s41598-021-84429-w, 2021.
Chevrier, F.: Chauffage au bois et qualité de l'air en Vallée de l'Arve: définition d'un système de surveillance et impact d'une politique de rénovation du parc des appareils anciens, PhD thesis, Institut des Géosciences de l'Environnement, Université Grenoble Alpes, France, https://tel.archives-ouvertes.fr/tel-01527559/document (last access: 29 October 2020), 2016.
Christian, T. J., Yokelson, R. J., Cárdenas, B., Molina, L. T., Engling, G., and Hsu, S. C.: Trace gas and particle emissions from domestic and industrial biofuel use and garbage burning in central Mexico, Atmos. Chem. Phys., 10, 565–584, https://doi.org/10.5194/acp-10-565-2010, 2010.
Correo del Sur Bolivia: Importación de combustibles alcanza récord histórico, Correo del Sur, https://correodelsur.com/capitales/20220201_bolivia-importacion-de-combustibles-alcanza-record-historico.html (last access: 1 February 2022), 2022.
Dai, Q., Hopke, P. K., Bi, X., and Feng, Y.: Improving apportionment of PM2.5 using multisite PMF by constraining G-values with a priori information, Sci. Total Environ., 736, 139657, https://doi.org/10.1016/j.scitotenv.2020.139657, 2020.
Decree 1499/2013: February 20, 2013, Reglamento de Calidad de Carburantes, 485NEC, La Paz, http://www.gacetaoficialdebolivia.gob.bo/edicions/view/485NEC (last access: 17 August 2023), 2013.
Delfino, R. J., Staimer, N., Tjoa, T., Arhami, M., Polidori, A., and Gillen, D. L.: Association of Biomarkers of Systemic Inflammation with Organic Components and Source Tracers in Quasi-Ultrafine Particles, Environ. Health Perspect., 118, 756–762, https://doi.org/10.1289/ehp.0901407, 2010.
Du, Q., Mu, Y., Zhang, C., Liu, J., Zhang, Y., and Liu, C.: Photochemical production of carbonyl sulfide, carbon disulfide and dimethyl sulfide in a lake water, J. Environ. Sci.-China, 51, 146–156, https://doi.org/10.1016/j.jes.2016.08.006, 2017.
EEA – Enviromental European Agency: Air quality in Europe – 2020 report, https://doi.org/10.2800/786656, 2020.
EEA – Environmental European Agency: Air quality statistics – AQ eReporting – Annual, https://www.eea.europa.eu/data-and-maps/dashboards/air-quality-statistics (last access: 23 September 2022), 2022.
Elbert, W., Taylor, P. E., Andreae, M. O., and Pöschl, U.: Contribution of fungi to primary biogenic aerosols in the atmosphere: Wet and dry discharged spores, carbohydrates, and inorganic ions, Atmos. Chem. Phys., 7, 4569–4588, https://doi.org/10.5194/acp-7-4569-2007, 2007.
El Haddad, I., Marchand, N., Dron, J., Temime-roussel, B., Quivet, E., Wortham, H., Luc, J., Baduel, C., Voisin, D., Luc, J., and Gille, G.: Comprehensive primary particulate organic characterization of vehicular exhaust emissions in France, Atmos. Environ., 43, 6190–6198, https://doi.org/10.1016/j.atmosenv.2009.09.001, 2009.
Escrig Vidal, A., Monfort, E., Celades, I., Querol, X., Amato, F., Minguillón, M. C., and Hopke, P. K.: Application of optimally scaled target factor analysis for assessing source contribution of ambient PM10, J. Air Waste Manage., 59, 1296–1307, https://doi.org/10.3155/1047-3289.59.11.1296, 2009.
Favez, O., El Haddad, I., Piot, C., Boréave, A., Abidi, E., Marchand, N., Jaffrezo, J. L., Besombes, J. L., Personnaz, M. B., Sciare, J., Wortham, H., George, C., and D'Anna, B.: Inter-comparison of source apportionment models for the estimation of wood burning aerosols during wintertime in an Alpine city (Grenoble, France), Atmos. Chem. Phys., 10, 5295–5314, https://doi.org/10.5194/acp-10-5295-2010, 2010.
Fernández, J.: Así nació El Alto, 2nd Edn., edited by: Imaña F., FOCAPACI, https://www.elaltodigital.com/wp-content/uploads/2021/05/Asi-Nacio-El-Alto.pdf (last access: 24 October 2022), 2021.
Foster, V. and Irusta, O.: Does Infrastructure Reform Work for the Poor? A Case Study on the Cities of La Paz and El Alto in Bolivia, The World Bank, 1–29, https://doi.org/10.1596/1813-9450-3177, 2003.
Frisancho, A. R.: Developmental adaptation to high altitude hypoxia. Int. J. Biometeorol., 21, 135–146, https://doi.org/10.1007/BF01553707, 1977.
Frisancho, A. R.: Developmental functional adaptation to high altitude: Review, Am. J. Hum. Biol., 25, 151–168, https://doi.org/10.1002/ajhb.22367, 2013.
Frisancho, A. R., Juliao, P. C., Barcelona, V., Kudyba, C. E., Amayo, G., Davenport, G., Knowles, A., Sanchez, D., Villena, M., Vargas, E., and Soria, R.: Developmental components of resting ventilation among high- and low- altitude Andean children and adults, Am. J. Phys. Anthropol., 109, 295–301, https://doi.org/10.1002/(SICI)1096-8644(199907)109:3<295::AID-AJPA2>3.0.CO;2-U, 1999.
Fukuzaki, N., Yanaka, T., and Urushiyama, Y.: Effects of studded tires on roadside airborne dust pollution in Niigata, Japan, Atmos. Environ., 20, 377–386, https://doi.org/10.1016/0004-6981(86)90041-7, 1986.
Ganor, E., Foner, H. A., Bingemer, H. G., Udisti, R., and Setter, I.: Biogenic sulphate generation in the Mediterranean Sea and its contribution to the sulphate anomaly in the aerosol over Israel and the Eastern Mediterranean, Atmos. Environ., 34, 3453–3462, https://doi.org/10.1016/S1352-2310(00)00077-7, 2000.
Gianini, M. F. D., Fischer, A., Gehrig, R., Ulrich, A., Wichser, A., Piot, C., Besombes, J. L., and Hueglin, C.: Comparative source apportionment of PM10 in Switzerland for 2008/2009 and 1998/1999 by Positive Matrix Factorisation, Atmos. Environ., 54, 149–158, https://doi.org/10.1016/j.atmosenv.2012.02.036, 2012.
Giraldo, M. and Huertas, J. I.: Real emissions, driving patterns and fuel consumption of in-use diesel buses operating at high altitude, Transport. Res. D-Tr. E., 77, 21–36, https://doi.org/10.1016/j.trd.2019.10.004, 2019.
Gutiérrez-Castillo, M. E., Olivos-Ortiz, M., De Vizcaya-Ruiz, A., and Cebrián, M. E.: Chemical characterization of extractable water soluble matter associated with PM10 from Mexico City during 2000, Chemosphere, 61, 701–710, https://doi.org/10.1016/j.chemosphere.2005.03.063, 2005.
Guttikunda, S. K., Kopakka, R. V., Dasari, P., and Gertler, A. W.: Receptor model-based source apportionment of particulate pollution in Hyderabad, India, Environ. Monit. Assess., 185, 5585–5593, https://doi.org/10.1007/s10661-012-2969-2, 2013.
Guttikunda, S. K., Nishadh, K. A., Gota, S., Singh, P., Chanda, A., Jawahar, P., and Asundi, J.: Air quality, emissions, and source contributions analysis for the Greater Bengaluru region of India, Atmos. Pollut. Res., 10, 941–953, https://doi.org/10.1016/j.apr.2019.01.002, 2019.
Hall, D., Wu, C. Y., Hsu, Y. M., Stormer, J., Engling, G., Capeto, K., Wang, J., Brown, S., Li, H. W., and Yu, K. M.: PAHs, carbonyls, VOCs and PM2.5 emission factors for pre-harvest burning of Florida sugarcane, Atmos. Environ., 55, 164–172, https://doi.org/10.1016/j.atmosenv.2012.03.034, 2012.
Hallar, A. G., Lowenthal, D. H., Chirokova, G., Borys, R. D., and Wiedinmyer, C.: Persistent daily new particle formation at a mountain-top location, Atmos. Environ., 45, 4111–4115, https://doi.org/10.1016/j.atmosenv.2011.04.044, 2011.
Hays, M. D., Geron, C. D., Linna, K. J., Smith, N. D., and Schauer, J. J.: Speciation of gas-phase and fine particle emissions from burning of foliar fuels, Environ. Sci. Technol., 36, 2281–2295, https://doi.org/10.1021/es0111683, 2002.
He, C., Ge, Y., Ma, C., Tan, J., Liu, Z., Wang, C., Yu, L., and Ding, Y.: Emission characteristics of a heavy-duty diesel engine at simulated high altitudes, Sci. Total Environ., 409, 3138–3143, https://doi.org/10.1016/j.scitotenv.2011.01.029, 2011.
Herbst, N. S.: Inventario de Emisiones del Municipio de La Paz, Swisscontact, http://www.asocam.org/sites/default/files/publicaciones/files/b515562bd7cf36c0874c12731a36943c.pdf (last access: 25 January 2022), 2007.
Hernández-Pellón, A. and Fernández-Olmo, I.: Using multi-site data to apportion PM-bound metal(loid)s: Impact of a manganese alloy plant in an urban area, Sci. Total Environ., 651, 1476–1488, https://doi.org/10.1016/j.scitotenv.2018.09.261, 2019.
Hopke, P. K.: Approaches to reducing rotational ambiguity in receptor modeling of ambient particulate matter, Chemometrics and Intelligent Laboratory Systems, 210 pp., https://doi.org/10.1016/j.chemolab.2021.104252, 2021.
IFP: Light vehicle gas and particle emissions: results of the Rhapsodie project, https://www.ifpenergiesnouvelles.com/article/light-vehicle-gas-and-particle-emissions-results-rhapsodie-project (last access: 11 August 2022), 2021.
INE – Instituto Nacional de Estadística: Boletín Estdístico Parque Automotor 2020, https://www.ine.gob.bo/index.php/estadisticas-economicas/transportes/parque-automotor-boletines/ (last access: 15 April 2022), 2020a.
INE – Instituto Nacional de Estadística: Bolivia: Parque Automotor, Según Departamento Y Tipo De Servicio, 2003–2020, https://www.ine.gob.bo/index.php/estadisticas-economicas/transportes/parque-automotor-cuadros-estadisticos/ (last access: 15 April 2022), 2020b.
Jardine, K., Yañez-Serrano, A. M., Williams, J., Kunert, N., Jardine, A., Taylor, T., Abrell, L., Artaxo, P., Guenther, A., Hewitt, C. N., House, E., Florentino, A. P., Manzi, A., Higuchi, N., Kesselmeier, J., Behrendt, T., Veres, P. R., Derstroff, B., Fuentes, J. D., Martin, S. T. and Andreae, M. O.: Dymethyl sulfide in the Amazon rain forest, Global Biogeochem. Cy., 29, 19–32, https://doi.org/10.1002/2014GB004969, 2015.
Ježek, I., Katrašnik, T., Westerdahl, D., and Mocnik, G.: Black carbon, particle number concentration and nitrogen oxide emission factors of random in-use vehicles measured with the on-road chasing method, Atmos. Chem. Phys., 15, 11011–11026, https://doi.org/10.5194/acp-15-11011-2015, 2015.
Karamchandani, P. and Seigneur, C.: Simulation of sulfate and nitrate chemistry in power plant plumes, J. Air Waste Manage., 49, 175–181, https://doi.org/10.1080/10473289.1999.10463885, 1999.
Kioumourtzoglou, M., Zanobetti, A., Schwartz, J. D., Coull, B. A., Dominici, F., and Suh, H. H.: The effect of primary organic particles on emergency hospital admissions among the elderly in 3 US cities, Environ. Health-Glob., 12, 1–10, https://doi.org/10.1186/1476-069X-12-68, 2013.
Korhonen, P., Kulmala, M., Laaksonen, A., Viisanen, Y., Mcgraw, R., and Seinfeld, J. H.: Ternary nucleation of HSO4, NH3, and H2O in the atmosphere, J. Geophys. Res., 104, 26349–26353, 1999.
Kumar, S., Aggarwal, S. G., Sarangi, B., Malherbe, J., Barre, J. P. G., Berail, S., Séby, F., and Donard, O. F. X.: Understanding the influence of open-waste burning on urban aerosols using metal tracers and lead isotopic composition, Aerosol Air Qual. Res., 18, 2433–2446, https://doi.org/10.4209/aaqr.2017.11.0510, 2018.
La Colla, N. S., Botté, S. E., and Marcovecchio, J. E.: Atmospheric particulate pollution in South American megacities, Environ. Rev., 29, 415–429, https://doi.org/10.1139/er-2020-0105, 2021.
Lanz, V. A., Weingartner, E., Baltensperger, U. R. S., Sandradewi, J., Prévôt, A. S. H., Szidat, S., Perron, N., and Alfarra, M. R.: Using aerosol light absorption measurements for the quantitative determination of wood burning and traffic emission contributions to particulate matter, Environ, Sci. Technol., 42, 3316–3323, 2008.
Leotz-Gartziandia, E., Tatry, V., and Carlier, P: Sampling and analysis of polycyclic aromatic hydrocarbons (PAH) and oxygenated PAH in diesel exhaust and ambient air, in: International Symposium on Polycyclic Aromatic Compounds, Oct 1999, Bordeaux, France, https://hal-ineris.archives-ouvertes.fr/ineris-00972185 (last access: 11 August 2022), 1999.
Li, W., Ge, P., Chen, M., Tang, J., Cao, M., Cui, Y., Hu, K., and Nie, D.: Tracers from biomass burning emissions and identification of biomass burning, Atmosphere-Basel, 12, 1401, https://doi.org/10.3390/atmos12111401, 2021.
Madueño, L., Kecorius, S., Andrade, M., and Wiedensohler, A.: Exposure and respiratory tract deposition dose of equivalent black carbon in high altitudes, Atmosphere-Basel, 11, 1–14, https://doi.org/10.3390/atmos11060598, 2020.
Magalhães, N. de, Evangelista, H., Condom, T., Rabatel, A., and Ginot, P.: Amazonian Biomass Burning Enhances Tropical Andean Glaciers Melting, Sci. Rep., 9, 1–12, https://doi.org/10.1038/s41598-019-53284-1, 2019.
Manrique, N., Lazarte, I., Rivera, M., Cueva, K., Japura, S., and Aguilar, R.: Actividad del volcán Sabancaya (Perú) 2016–2017: observaciones petrográficas y geoquímicas de los depósitos de tefras del 2017, https://repositorio.ingemmet.gob.pe/bitstream/20.500.12544/1324/1/Manrique-Actividad_del_volcan_Sabancaya...2016-2017.pdf (last access: 7 June 2023), 2018.
Martínez, J., Robles, L., Montalvo, F., Baño Morales, D., and Zambrano, I.: Effects of altitude in the performance of a spark ignition internal combustion engine, Mater. Today-Proc., 49, 72–78, https://doi.org/10.1016/j.matpr.2021.07.475, 2022.
Masías, P., Lazarte, I., Apaza, F., Alvarez, M., Calderon, J., Gironda, A., Mamani, J., and Ramos, D.: monitoreo visual del volcán Ubinas durante la actividad eruptiva 2013–2016, in: Congreso Peruano de Geología, 16–19 October 2016, Lima, PE, 18 pp., https://repositorio.ingemmet.gob.pe/handle/20.500.12544/1138 (last access: 9 November 2022), 2016.
Mataveli, G. A. V., de Oliveira, G., Seixas, H. T., Pereira, G., Stark, S. C., Gatti, L. V., Basso, L. S., Tejada, G., Cassol, H. L. G., Anderson, L. O., and Aragão, L. E. O. C.: Relationship between biomass burning emissions and deforestation in amazonia over the last two decades, Forests, 12, 1217, https://doi.org/10.3390/f12091217, 2021.
Molina, L. T., Velasco, E., Retama, A., and Zavala, M.: Experience from integrated air quality management in the Mexico City Metropolitan Area and Singapore, Atmosphere-Basel, 10, 512, https://doi.org/10.3390/atmos10090512, 2019.
Mugica, V., Ortiz, E., Molina, L., De Vizcaya-Ruiz, A., Nebot, A., Quintana, R., Aguilar, J., and Alcántara, E.: PM composition and source reconciliation in Mexico City, Atmos. Environ., 43, 5068–5074, https://doi.org/10.1016/j.atmosenv.2009.06.051, 2009.
Nagpure, A. S., Gurjar, B. R., and Kumar, P.: Impact of altitude on emission rates of ozone precursors from gasoline-driven light-duty commercial vehicles, Atmos. Environ., 45, 1413–1417, https://doi.org/10.1016/j.atmosenv.2010.12.026, 2011.
Nawaz, M. O. and Henze, D. K.: Premature deaths in Brazil associated with long-term exposure to PM2.5 from Amazon fires between 2016 and 2019, GeoHealth, 4, e2020GH000268, https://doi.org/10.1029/2020GH000268, 2020.
Norris, G., Duvall, R., Brown, S., and Bai, S.: EPA Positive Matrix Factorization (PMF) 5.0 Fundamentals and User guide, Environmental Protection Agency, EPA/600/R-14/108, https://www.epa.gov/sites/default/files/2015-02/documents/pmf_5.0_user_guide.pdf (last access: 2 February 2022), 2014.
Olson, E., Michalski, G., Welp, L., Larrea Valdivia, A. E., Reyes Larico, J., Salcedo Peña, J., Fang, H., Magara Gomez, K., and Li, J.: Mineral dust and fossil fuel combustion dominate sources of aerosol sulfate in urban Peru identified by sulfur stable isotopes and water-soluble ions, Atmos. Environ., 260, 118482, https://doi.org/10.1016/j.atmosenv.2021.118482, 2021.
Paatero, P. and Tapper, U.: Positive matrix factorization: A non-negative factor model with optimal utilization of error estimates of data values, Environmetrics, 5, 111–126, https://doi.org/10.1002/env.3170050203, 1994.
Pandolfi, M., Mooibroek, D., Hopke, P., Van Pinxteren, D., Querol, X., Herrmann, H., Alastuey, A., Favez, O., Hüglin, C., Perdrix, E., Riffault, V., Sauvage, S., Van Der Swaluw, E., Tarasova, O., and Colette, A.: Long-range and local air pollution: What can we learn from chemical speciation of particulate matter at paired sites?, Atmos. Chem. Phys., 20, 409–429, https://doi.org/10.5194/acp-20-409-2020, 2020.
Pardo-Martínez, C. I.: Energy and sustainable development in cities: A case study of Bogotá, Energy, 92, 612–621, https://doi.org/10.1016/j.energy.2015.02.003, 2015.
Pereira, G. M., Teinilä, K., Custódio, D., Gomes Santos, A., Xian, H., Hillamo, R., Alves, C. A., Bittencourt de Andrade, J., Olímpio da Rocha, G., Kumar, P., Balasubramanian, R., Andrade, M. D. F., and de Castro Vasconcellos, P.: Particulate pollutants in the Brazilian city of São Paulo: 1-year investigation for the chemical composition and source apportionment, Atmos. Chem. Phys., 17, 11943–11969, https://doi.org/10.5194/acp-17-11943-2017, 2017a.
Pereira, G. M., De Oliveira Alves, N., Caumo, S. E. S., Soares, S., Teinilä, K., Custódio, D., Hillamo, R., Alves, C., and Vasconcellos, P. C.: Chemical composition of aerosol in São Paulo, Brazil: influence of the transport of pollutants, Air Qual. Atmos. Health, 10, 457–468, https://doi.org/10.1007/s11869-016-0437-9, 2017b.
Pareja, A., Hinojosa, M., and Marcos, L.: Inventario de Emisiones Atmosféricas Contaminantes de la Ciudad de Cochabamba, Bolivia, año 2008, Acta Nova, 5, 344–374, http://www.scielo.org.bo/pdf/ran/v5n3/v5n3a02.pdf (last access: 19 April 2022), 2011.
Pérez, N., Pey, J., Querol, X., Alastuey, A., López, J. M., and Viana, M.: Partitioning of major and trace components in PM10-PM2.5-PM1 at an urban site in Southern Europe, Atmos. Environ., 42, 1677–1691, https://doi.org/10.1016/j.atmosenv.2007.11.034, 2008.
Pernigotti, D. and Belis, C. A.: DeltaSA tool for source apportionment benchmarking, description and sensitivity analysis, Atmos. Environ., 180, 138–148, https://doi.org/10.1016/j.atmosenv.2018.02.046, 2018.
Pio, C., Mirante, F., Oliveira, C., Matos, M., Caseiro, A., Oliveira, C., Querol, X., Alves, C., Martins, N., Cerqueira, M., Camões, F., Silva, H., and Plana, F.: Size-segregated chemical composition of aerosol emissions in an urban road tunnel in Portugal, Atmos. Environ., 71, 15–25, https://doi.org/10.1016/j.atmosenv.2013.01.037, 2013.
Polissar, A. V., Hopke, P. K., Paatero, P., Malm, W. C., and Sisler, J. F.: Atmospheric aerosol over Alaska 2. Elemental composition and sources, J. Geophys. Res.-Atmos., 103, 19045–19057, https://doi.org/10.1029/98JD01212, 1998.
Putaud, J. P., Raes, F., Van Dingenen, R., Brüggemann, E., Facchini, M. C., Decesari, S., Fuzzi, S., Gehrig, R., Hüglin, C., Laj, P., Lorbeer, G., Maenhaut, W., Mihalopoulos, N., Müller, K., Querol, X., Rodriguez, S., Schneider, J., Spindler, G., Ten Brink, H., Tørseth, K., and Wiedensohler, A.: A European aerosol phenomenology – 2: Chemical characteristics of particulate matter at kerbside, urban, rural and background sites in Europe, Atmos. Environ., 38, 2579–2595, https://doi.org/10.1016/j.atmosenv.2004.01.041, 2004.
Rai, P., Furger, M., El Haddad, I., Kumar, V., Wang, L., Singh, A., Dixit, K., Bhattu, D., Petit, J. E., Ganguly, D., Rastogi, N., Baltensperger, U., Tripathi, S. N., Slowik, J. G., and Prévôt, A. S. H.: Real-time measurement and source apportionment of elements in Delhi's atmosphere, Sci. Total Environ., 742, 140332, https://doi.org/10.1016/j.scitotenv.2020.140332, 2020.
Ramírez, O., Sánchez de la Campa, A. M., Amato, F., Catacolí, R. A., Rojas, N. Y., and De la Rosa, J.: Chemical composition and source apportionment of PM10 at an urban background site in a highealtitude Latin American megacity (Bogota, Colombia), Environ. Pollut., 233, 142–155, https://doi.org/10.1016/j.envpol.2017.10.045, 2018.
Red MoniCA – Red de Monitoreo de la Calidad del Aire: Informe Nacional de Calidad de Aire-2015, http://snia.mmaya.gob.bo/web/modulos/PNGCA/# (last access: 7 June 2023), 2016a.
Red MoniCA – Red de Monitoreo de la Calidad del Aire – El Alto: Informe Municipal de Calidad del Aire – Gestión 2016, http://snia.mmaya.gob.bo/web/modulos/PNGCA/publicaciones/Items/04012018_12018_34/Inf_RedMoniCA_ElAlto_2016.zip (last access: 7 June 2023), 2016b.
Red MoniCA – Red de Monitoreo de la Calidad del Aire: Informe Nacional de Calidad del Aire de Bolivia, Gestión 2016, http://snia.mmaya.gob.bo/web/modulos/PNGCA/# (last access: 7 June 2023), 2017.
Red MoniCA – Red de Monitoreo de la Calidad del Aire, Informe Nacional de Calidad del Aire de Bolivia, Gestión 2017, http://snia.mmaya.gob.bo/web/modulos/PNGCA/# (last access: 7 June 2023), 2018.
Reff, A., Eberly, S. I., and Bhave, P. V.: Receptor modeling of ambient particulate matter data using positive matrix factorization: Review of existing methods, J. Air Waste Manage., 57, 146–154, https://doi.org/10.1080/10473289.2007.10465319, 2007.
Rivellini, L. H., Chiapello, I., Tison, E., Fourmentin, M., Feron, A., Diallo, A., N'Diaye, T., Goloub, P., Canonaco, F., Prevet, A. S. H., and Riffault, V.: Chemical characterization and source apportionment of submicron aerosols measured in Senegal during the 2015 SHADOW campaign, Atmos. Chem. Phys., 17, 10291–10314, https://doi.org/10.5194/acp-17-10291-2017, 2017.
Robert, M. A., VanBergen, S., Kleeman, M. J., and Jakober, C. A.: Size and composition distributions of particulate matter emissions: Part 1 – Light-duty gasoline vehicles, J. Air Waste Manage., 57, 1414–1428, https://doi.org/10.3155/1047-3289.57.12.1414, 2007a.
Robert, M. A., Kleeman, M. J., and Jakober, C. A.: Size and composition distributions of particulate matter emissions: Part 2 – Heavy-duty diesel vehicles, J. Air Waste Manage., 57, 1429–1438, https://doi.org/10.3155/1047-3289.57.12.1429, 2007b.
Saltzman, E. S., Savoie, D. L., Zika, R. G., and Prospero, J. M.: Methane sulfonic acid in the marine atmosphere, J. Geophys. Res., 88, 10897–10902, https://doi.org/10.1029/JC088iC15p10897, 1983.
Samaké, A., Jaffrezo, J. L., Favez, O., Weber, S., Jacob, V., Canete, T., Albinet, A., Charron, A., Riffault, V., Perdrix, E., Waked, A., Golly, B., Salameh, D., Chevrier, F., Oliveira, D. M., Besombes, J. L., Martins, J. M. F., Bonnaire, N., Conil, S., Guillaud, G., Mesbah, B., Rocq, B., Robic, P. Y., Hulin, A., Le Meur, S., Descheemaecker, M., Chretien, E., Marchand, N., and Uzu, G.: Arabitol, mannitol, and glucose as tracers of primary biogenic organic aerosol: The influence of environmental factors on ambient air concentrations and spatial distribution over France, Atmos. Chem. Phys., 19, 11013–11030, https://doi.org/10.5194/acp-19-11013-2019, 2019a.
Samaké, A., Jaffrezo, J. L., Favez, O., Weber, S., Jacob, V., Albinet, A., Riffault, V., Perdrix, E., Waked, A., Golly, B., Salameh, D., Chevrier, F., Miguel Oliveira, D., Bonnaire, N., Besombes, J. L., Martins, J. M. F., Conil, S., Guillaud, G., Mesbah, B., Rocq, B., Robic, P. Y., Hulin, A., Le Meur, S., Descheemaecker, M., Chretien, E., Marchand, N., and Uzu, G.: Polyols and glucose particulate species as tracers of primary biogenic organic aerosols at 28 French sites, Atmos. Chem. Phys., 19, 3357–3374, https://doi.org/10.5194/acp-19-3357-2019, 2019b.
Scholz, W., Shen, J., Aliaga, D., Wu, C., Carbone, S., Moreno, I., Zha, Q., Huang, W., Heikkinen, L., Jaffrezo, J. L., Uzu, G., Partoll, E., Leiminger, M., Velarde, F., Laj, P., Ginot, P., Artaxo, P., Wiedensohler, A., Kulmala, M., Mohr, C., Andrade, M., Sinclair, V., Bianchi, F., and Hansel, A.: Measurement report: Long-range transport and the fate of dimethyl sulfide oxidation products in the free troposphere derived from observations at the high-altitude research station Chacaltaya (5240 m a.s.l.) in the Bolivian Andes, Atmos. Chem. Phys., 23, 895–920, https://doi.org/10.5194/acp-23-895-2023, 2023.
Segura, H., Espinoza, J. C., Junquas, C., Lebel, T., Vuille, M., and Garreaud, R.: Recent changes in the precipitation-driving processes over the southern tropical Andes/western Amazon, Clim. Dynam., 54, 2613–2631, https://doi.org/10.1007/s00382-020-05132-6, 2020.
Seinfeld, J. H. and Pandis, S. N.: From air pollution to climate change, Atmospheric chemistry and physics, John Wiley & Sons, New York, 1326 pp. ISBN 0-471-17815-2, 1998.
Sellegri, K., Rose, C., Marinoni, A., Lupi, A., Wiedensohler, A., Andrade, M., Bonasoni, P., and Laj, P.: New particle formation: A review of ground-based observations at mountain research stations, Atmosphere-Basel, 10, 1–26, https://doi.org/10.3390/atmos10090493, 2019.
Simoneit, B. R. T.: Biomass burning – A review of organic tracers for smoke from incomplete combustion, Appl. Geochem., 17, 129–162, https://doi.org/10.1016/S0883-2927(01)00061-0, 2002.
Simoneit, B. R. T. and Elias, V. O.: Organic tracers from biomass burning in atmospheric particulate matter over the ocean, Mar. Chem., 69, 301–312, https://doi.org/10.1016/S0304-4203(00)00008-6, 2000.
Singh, K. P., Malik, A., Kumar, R., Saxena, P., and Sinha, S.: Receptor modeling for source apportionment of polycyclic aromatic hydrocarbons in urban atmosphere, Environ. Monit. Assess., 136, 183–196, https://doi.org/10.1007/s10661-007-9674-6, 2008.
Singla, V., Mukherjee, S., Kristensson, A., Pandithurai, G., Dani, K. K., and Anil Kumar, V.: New Particle Formation at a High Altitude Site in India: Impact of Fresh Emissions and Long Range Transport, Atmos. Chem. Phys. Discuss. [preprint], https://doi.org/10.5194/acp-2018-637, 2018.
Sorribas, M., Adame, J. A., Olmo, F. J., Vilaplana, J. M., Gil-Ojeda, M., and Alados-Arboledas, L.: A long-term study of new particle formation in a coastal environment: Meteorology, gas phase and solar radiation implications, Sci. Total Environ., 511, 723–737, https://doi.org/10.1016/j.scitotenv.2014.12.011, 2015.
Squizzato, S., Masiol, M., Rich, D. Q., and Hopke, P. K.: A long-term source apportionment of PM2.5 in New York State during 2005–2016, Atmos. Environ., 192, 35–47, https://doi.org/10.1016/j.atmosenv.2018.08.044, 2018.
Urban, R. C., Lima-Souza, M., Caetano-Silva, L., Queiroz, M. E. C, Nogueira, R. F. P., Andrew, A. G., Cardoso, A. A., Held, G., Campos, M. L. A. M.: Use of levoglucosan, potassium, and water-soluble organic carbon to characterize the origins of biomass-burning aerosols, Atmos. Environ., 61, 562–569, https://doi.org/10.1016/j.atmosenv.2012.07.082, 2012.
U.S. EPA: Method 3051A (SW-846): Microwave Assisted Acid Digestion of Sediments, Sludges, and Oils, Revision 1, Washington, DC, https://www.epa.gov/esam/us-epa-method-3051a (last access: 17 August 2023), 2007.
US EPA: Exposure Factors Handbook 2011 Edition, Final Report, EPA/600/R-09/052F, US Environmental Protection Agency, Washington, DC, https://www.epa.gov/sites/default/files/2015-09/documents/efh-chapter06.pdf (last access: 13 April 2022), 2011.
Vega, E., Eidels, S., Ruiz, H., López-Veneroni, D., Sosa, G., Gonzalez, E., Gasca, J., Mora, V., Reyes, E., Sánchez-Reyna, G., Villaseñor, R., Chow, J. C., Watson, J. G., and Edgerton, S. A.: Particulate air pollution in Mexico city: A detailed view, Aerosol Air Qual. Res., 10, 193–211, https://doi.org/10.4209/aaqr.2009.06.0042, 2010.
Veld, M. in t., Alastuey, A., Pandolfi, M., Amato, F., Pérez, N., Reche, C., Via, M., Minguillón, M. C., Escudero, M., and Querol, X.: Compositional changes of PM2.5 in NE Spain during 2009–2018: A trend analysis of the chemical composition and source apportionment, Sci. Total Environ., 795, 148728, https://doi.org/10.1016/j.scitotenv.2021.148728, 2021.
Viana, M., Kuhlbusch, T. A. J., Querol, X., Alastuey, A., Harrison, R. M., Hopke, P. K., Winiwarter, W., Vallius, M., Szidat, S., Prévôt, A. S. H., Hueglin, C., Bloemen, H., Wåhlin, P., Vecchi, R., Miranda, A. I., Kasper-Giebl, A., Maenhaut, W., and Hitzenberger, R.: Source apportionment of particulate matter in Europe: A review of methods and results, J. Aerosol Sci., 39, 827–849, https://doi.org/10.1016/j.jaerosci.2008.05.007, 2008.
Viana, M., Kuhlbusch, T. A. J., Querol, X., Alastuey, A., Harrison, R. M., Hopke, P. K., Winiwarter, W., Vallius, M., Szidat, S., Prévôt, A. S. H., Hueglin, C., Bloemen, H., Wåhlin, P., Vecchi, R., Miranda, A. I., Kasper-Giebl, A., Maenhaut, W., and Hitzenberger, R.: Source apportionment of particulate matter in Europe: A review of methods and results, J. Aerosol Sci., 39, 827–849, https://doi.org/10.1016/j.jaerosci.2008.05.007, 2008.
Waked, A., Favez, O., Alleman, L. Y., Piot, C., Petit, J. E., Delaunay, T., Verlinden, E., Golly, B., Besombes, J. L., Jaffrezo, J. L., and Leoz-Garziandia, E.: Source apportionment of PM10 in a north-western Europe regional urban background site (Lens, France) using positive matrix factorization and including primary biogenic emissions, Atmos. Chem. Phys., 14, 3325–3346, https://doi.org/10.5194/acp-14-3325-2014, 2014.
Wang, X., Ge, Y., Yu, L., and Feng, X.: Effects of altitude on the thermal efficiency of a heavy-duty diesel engine, Energy, 59, 543–548, https://doi.org/10.1016/j.energy.2013.06.050, 2013a.
Wang, X., Yin, H., Ge, Y., Yu, L., Xu, Z., Yu, C., Shi, X., and Liu, H.: On-vehicle emission measurement of a light-duty diesel van at various speeds at high altitude, Atmos. Environ., 81, 263–269, https://doi.org/10.1016/j.atmosenv.2013.09.015, 2013b.
Wang, Y. and Boggio-Marzet, A.: Evaluation of Eco-Driving Training for Fuel Efficiency and Emissions Reduction According to Road Type, Sustainability-Basel, 10, 1–16, https://doi.org/10.3390/su10113891, 2018.
Weber, S., Salameh, D., Albinet, A., Alleman, L. Y., Waked, A., Besombes, J. L., Jacob, V., Guillaud, G., Meshbah, B., Rocq, B., Hulin, A., Dominik-Sègue, M., Chrétien, E., Jaffrezo, J. L., and Favez, O.: Comparison of PM10 sources profiles at 15 french sites using a harmonized constrained positive matrix factorization approach, Atmosphere-Basel, 10, 1–22, https://doi.org/10.3390/atmos10060310, 2019.
WHO – World Health Organization: Ambient (outdoor) air pollution, https://www.who.int/news-room/fact-sheets/detail/ambient-(outdoor)-air-quality-and-health (last access: 25 January 2022), 2021a.
WHO – World Health Organization: WHO global air quality guidelines. Particulate matter (PM2.5 and PM10), ozone, nitrogen dioxide, sulfur dioxide and carbon monoxide, World Health Organization, Geneva, 273 pp., ISBN 978-92-4-003422-8, 2021b.
Wiedensohler, A., Andrade, M., Weinhold, K., Müller, T., Birmili, W., Velarde, F., Moreno, I., Forno, R., Sanchez, M. F., Laj, P., Ginot, P., Whiteman, D. N., Krejci, R., Sellegri, K., and Reichler, T.: Black carbon emission and transport mechanisms to the free troposphere at the La Paz/El Alto (Bolivia) metropolitan area based on the Day of Census (2012), Atmos. Environ., 194, 158–169, https://doi.org/10.1016/j.atmosenv.2018.09.032, 2018.
Wong, Y. K., Huang, X. H. H., Louie, P. K. K., Yu, A. L. C., Chan, D. H. L., and Yu, J. Z.: Tracking separate contributions of diesel and gasoline vehicles to roadside PM2.5 through online monitoring of volatile organic compounds and PM2.5 organic and elemental carbon: a 6-year study in Hong Kong, Atmos. Chem. Phys., 20, 9871–9882, https://doi.org/10.5194/acp-20-9871-2020, 2020.
Yang, H., Chen, J., Wen, J., Tian, H., and Liu, X.: Composition and sources of PM2.5 around the heating periods of 2013 and 2014 in Beijing: Implications for efficient mitigation measures, Atmos. Environ., 124, 378–386, https://doi.org/10.1016/j.atmosenv.2015.05.015, 2016.
Yang, H. H., Dhital, N. B., Wang, L. C., Hsieh, Y. S., Lee, K. T., Hsu, Y. T., and Huang, S. C.: Chemical characterization of fine particulate matter in gasoline and diesel vehicle exhaust, Aerosol Air Qual. Res., 19, 1439–1449, https://doi.org/10.4209/aaqr.2019.04.0191, 2019.
Zalakeviciute, R., López-Villada, J., and Rybarczyk, Y.: Contrasted effects of relative humidity and precipitation on urban PM2.5 pollution in high elevation urban areas. Sustainability-Basel, 10, 2064, https://doi.org/10.3390/su10062064, 2018.
Zalakeviciute, R., Rybarczyk, Y., Granda-Albuja, M. G., Diaz Suarez, M. V., and Alexandrino, K.: Chemical characterization of urban PM10 in the Tropical Andes, Atmos. Pollut. Res., 11, 343–356, https://doi.org/10.1016/j.apr.2019.11.007, 2020.
Zhang, Z., Gao, J., Engling, G., Tao, J., Chai, F., Zhang, L., Zhang, R., Sang, X., Chan, C. Y., Lin, Z., and Cao, J.: Characteristics and applications of size-segregated biomass burning tracers in China's Pearl River Delta region, Atmos. Environ., 102, 290-301, https://doi.org/10.1016/j.atmosenv.2014.12.009, 2015.
Zielinska, B., Sagebiel, J., Arnott, W. P., Rogers, C. F., Kelly, K. E., Wagner, D. A., Lighty, J. S., Sarofim, A. F., and Palmer, G.: Phase and size distribution of polycyclic aromatic hydrocarbons in diesel and gasoline vehicle emissions, Environ. Sci. Technol., 38, 2557–2567, https://doi.org/10.1021/es030518d, 2004a.
Zielinska, B., Sagebiel, J., Mcdonald, J. D., Whitney, K., and Lawson, D. R.: Emission Rates and Comparative Chemical Composition from Selected In-Use Diesel and Gasoline-Fueled Vehicles, J. Air Waste Manage., 54, 1138–1150, https://doi.org/10.1080/10473289.2004.10470973, 2004b.
Zíková, N., Wang, Y., Yang, F., Li, X., Tian, M., and Hopke, P. K.: On the source contribution to Beijing PM2.5 concentrations, Atmos. Environ., 134, 84–95, https://doi.org/10.1016/j.atmosenv.2016.03.047, 2016.