the Creative Commons Attribution 4.0 License.
the Creative Commons Attribution 4.0 License.
 | 08 Sep 2023
The underappreciated role of transboundary pollution in future air quality and health improvements in China
Jun-Wei Xu
Dan Tong
Lulu Chen
Studies assessing the achievability of future air quality goals in China have focused on the role of reducing China's domestic emissions, yet the influence of transboundary pollution of foreign origins has been largely underappreciated. Here, we assess the extent to which future changes in foreign transboundary pollution would affect the achievability of air quality goals in 2030 and 2060 for China. We find that in 2030, under the current-policy scenario in China, transboundary contributions to population-weighted PM2.5 in China would be reduced by 29 % (1.2 µg m−3) as foreign countries transition from the fossil-fuel-intensive to the low-carbon pathway. By 2060, the difference would be increased to 45 % (1.8 µg m−3). Adopting the low-carbon instead of the fossil-fuel-intensive pathway in foreign countries would prevent 10 million Chinese people from being exposed to PM2.5 concentrations above China's ambient air quality standard (35 µg m−3) in 2030 and 5 million Chinese people from being exposed to PM2.5 concentrations above the World Health Organization air quality guideline (5 µg m−3) in 2060. Meanwhile, China adopting the carbon-neutral pathway rather than its current pathway would also be helpful to reduce transboundary PM2.5 produced from the chemical interactions between foreign-transported and locally emitted pollutants. In 2060, adopting a low-carbon pathway in China and foreign countries coincidently would prevent 63 % of transboundary pollution and 386 000 associated premature deaths in China, relative to adopting a fossil-fuel-intensive pathway in both regions. Thus, the influence of transboundary pollution should be carefully considered when making future air quality expectations and pollution mitigation strategies.
- Article
(2487 KB) - Full-text XML
-
Supplement
(2013 KB) - BibTeX
- EndNote


Long-term exposure to ambient fine particulate matter (PM2.5, particulate matter smaller than 2.5 µm in aerodynamic diameter) is the largest environmental risk factor for human health, with an estimated 4.1 million attributable deaths worldwide (7.3 % of the number of global deaths in 2019; GBD 2019 Risk Factors Collaborators, 2020). Countries have taken diverse actions to improve air quality and public health, including setting ambitious future air quality and/or climate goals. The European Commission set the 2030 air quality goal as reducing the number of PM2.5-attributable premature deaths by at least 55 % compared with 2005 levels, equivalent to reducing PM2.5 concentrations to below 10 µg m−3 EU-wide (European Commission, 2022). The United States aims for a 50 %–52 % reduction of greenhouse gas emissions relative to 2005 levels by 2030, which would prevent tens of thousands of premature deaths associated with PM2.5 as a co-benefit (Burtraw et al., 2022). However, the achievability of air quality goals or the extent of health co-benefits of climate strategies is subject to large uncertainties as it is affected by a wide range of factors such as the domestic and global socioeconomic development pathways, energy choices, and air pollution control measures (Cheng et al., 2021b; O'Neill et al., 2020; Rao et al., 2017).
China is a key country to examine factors affecting the achievability of future air quality goals. On the one hand, China suffers from serious air pollution and adverse health effects, with more than a quarter of the world's total PM2.5-associated premature deaths in 2015 estimated to occur in China (Zhang et al., 2019). Despite remarkable achievements of the 5-year Clean Air Action since 2013 (Zhang et al., 2019; Zheng et al., 2018a), annual mean PM2.5 concentration in China still exceeded the newly revised World Health Organization (WHO) air quality guideline (AQG; 5 µg m−3; WHO, 2021) by 8 times by the end of the Clean Air Action in 2017. On the other hand, China has set the most challenging air quality and climate goals among all the developing countries in the world (Ascensão et al., 2018). In 2018, the Chinese government proposed the roadmap for the Beautiful China Initiative (The State Council of the People's Republic of China, 2016), which requires all cities to achieve the national ambient air quality standards (NAAQS, 35 µg m−3) between 2030 and 2035 (The State Council of the People's Republic of China, 2016). In 2019, China further announced an ambitious climate commitment to achieve carbon neutrality by 2060. These policies have been regarded as interim steps towards the WHO AQG. Therefore, investigating potential pathways and factors shaping the future air quality in China could provide an excellent reference for other countries facing the dual challenges of economic development and environmental protection.
A number of studies seek to answer whether the air quality goals in China can be achieved in the future. These studies have been primarily focused on potential mitigation pathways to reduce China's domestic emissions. Cheng et al. (2021b) found that the nation's current emission control measures could reduce China's PM2.5 levels to below 30 µg m−3 by 2030, yet the benefits of such measures would be mostly exhausted by then (Cheng et al., 2021b; Xing et al., 2020). Xing et al. (2020) and Tang et al. (2022) suggested that the co-benefits of climate targets alone (even the most ambitious target of 1.5 ∘C limit in global warming) were not able to help China achieve the 35 µg m−3 target by 2035. Instead, Cheng et al. (2021b) proposed that a combination of stringent clean air policies and ambitious climate targets (i.e., carbon neutrality by 2060 or a global warming limit of 1.5 ∘C) could successfully reduce PM2.5 to below 35 µg m−3 by 2030 and to below 10 µg m−3 (WHO interim target 4) by 2060. This would require a fundamental transformation of China's economic–environmental development pathway by phasing out polluting industries and moving towards renewable energy while implementing strict end-of-pipe emission control.
However, these previous studies have largely neglected how the future changes in foreign transboundary pollution would affect air quality in China, likely due to the perception that the relatively short lifetime of PM2.5 (a few days) does not permit long-distance transport. This negligence would put into question the confidence of their estimated achievability of air quality goals in China. Due to large uncertainties in the future socioeconomic development pathways, environmental commitments, financial support and technology capabilities, future emissions from China's neighboring countries might be highly variable, leading to different levels of transboundary impacts to China's air quality. For example, emissions in South Asia, Central Asia and Southeast Asia have been estimated to increase in the future by various projections (International Energy Agency, 2021; Koplitz et al., 2017), due to their rapid economic growth and a lack of clear commitments on energy choices, climate actions and air pollution control efforts. In this case, transboundary pollution from neighboring countries to China could potentially become increasingly important and affect the achievability of air quality goals in China. Alternatively, these surrounding countries may undergo a sustainable development pathway, facilitated in part by external financial aid and technology support, leading to lowered transboundary pollution to China. Thus, the different prospects of transboundary pollution could be a significant yet highly uncertain factor in the achievement of future air quality goals in China.
In addition, the mechanism of transboundary pollution poses additional complexity to its impacts on China's air quality. Foreign emissions can affect air quality in China through direct transboundary transport in the atmosphere. Moreover, portions of foreign-transported pollution can also interact chemically with China's locally emitted pollutants. Xu et al. (2023) found that the transport and transformation of non-methane volatile organic compounds (NMVOCs) from foreign countries could enhance the atmospheric oxidizing capacity and facilitate the oxidation of Chinese nitrogen oxides (NOx) to form nitric acid (HNO3) and nitrate over northern China (referred to as eastern China in that study), leading to considerable foreign contributions to China's air pollution.
The chemical interactions mean that the extent of transboundary pollution will depend on emission changes in China as well. Therefore, the influence of transboundary pollution on China's air quality in the future is a complex result of future emissions in China and in foreign countries, along with their interactions. However, whether the changes in transboundary pollution via direct transport and chemical interactions could affect the achievement of future air quality goals in China and to what extent the influence could be remain poorly understood.
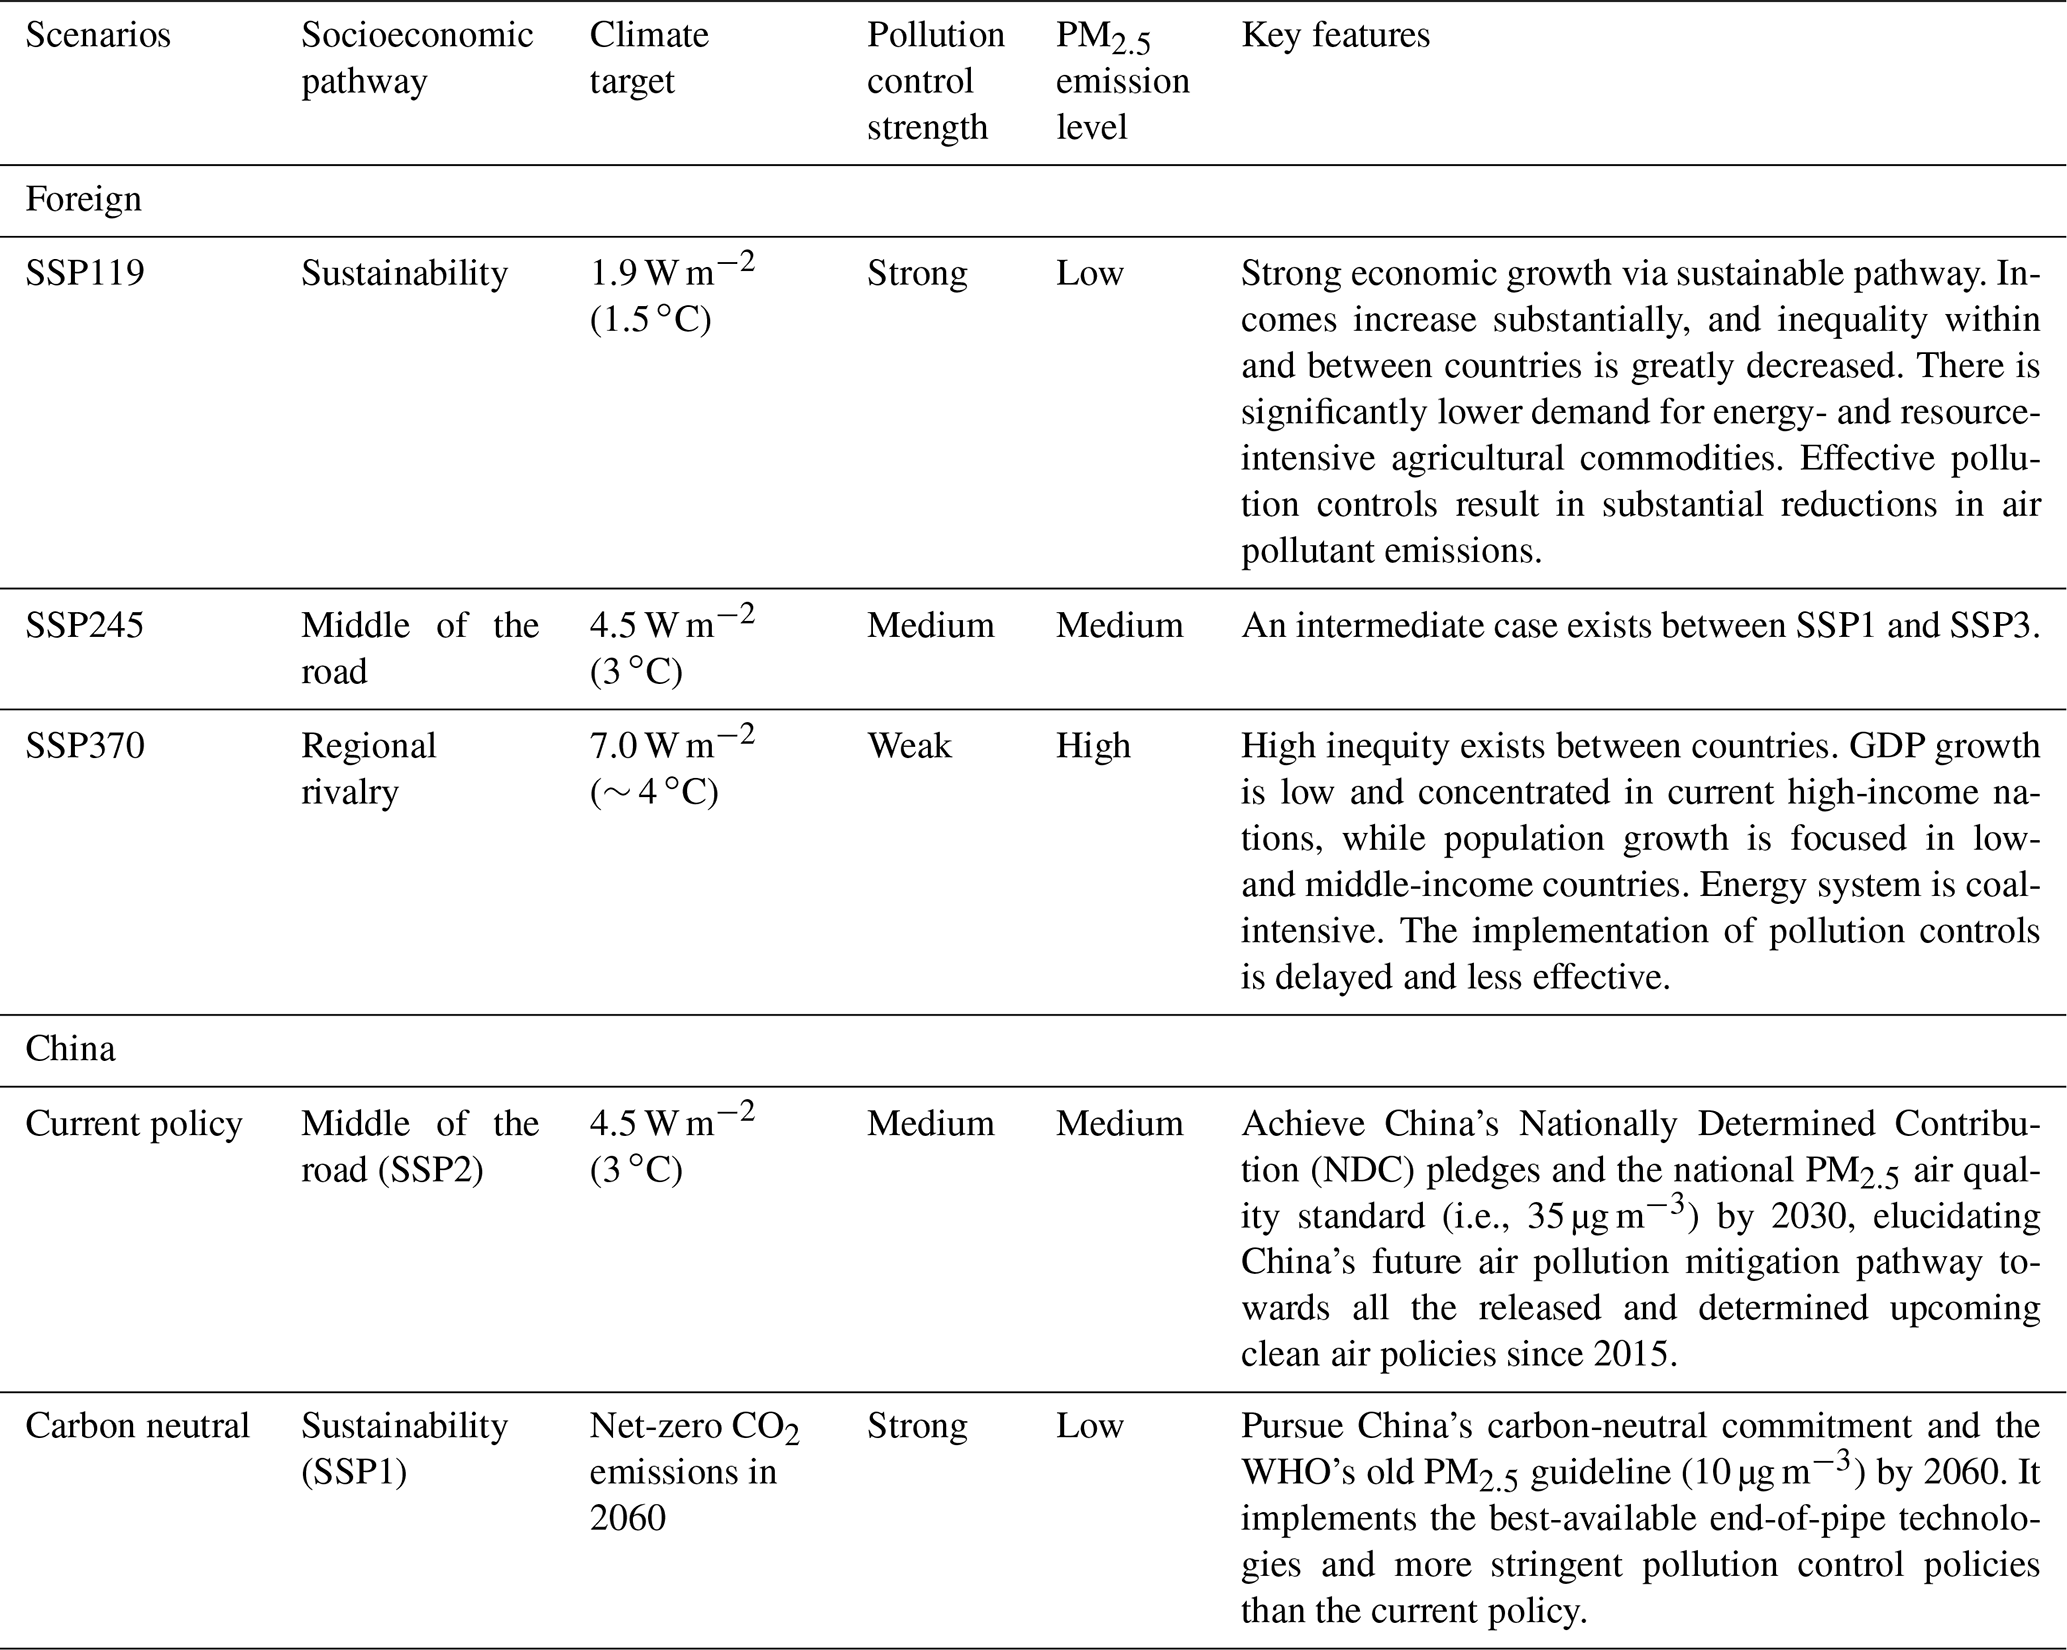
Here, we assess the potential influences that transboundary pollution could make on the achievement of future air quality goals in China, considering the changes in direct pollution transport and in the interactions between transported and China's locally emitted pollution. We regard the air quality goal stated in the Beautiful China Initiative, which is that all cities have annual mean PM2.5 concentrations below 35 µg m−3 between 2030–2035 (The State Council of the People's Republic of China, 2016), as China's 2030 air quality goal. We also regard the WHO AQG (annual mean PM2.5 below 5 µg m−3) as China's 2060 air quality goal. We then discuss the likelihood of the achievement under currently proposed development pathways in China and foreign countries. As detailed in the Method section, given the large uncertainties on future emissions of a country (Rao et al., 2017), we consider three anthropogenic emission scenarios in the Shared Socioeconomic Pathways Representative Concentration Pathways (low: SSP119, medium: SSP245, and high: SSP370; O'Neill et al., 2014) for foreign countries and two anthropogenic emission scenarios (current-policy and carbon-neutral scenarios; Cheng et al., 2021b; Tong et al., 2020) for China (Table 1), so as to understand transboundary pollution in China from the present (2015) to the future (2030 and 2060) under a wide range of plausible futures. We do not consider the effects of physical climate change (e.g., temperature and precipitation) on future transboundary pollution because Liu et al. (2021) found that future PM2.5 changes in China driven by anthropogenic emission reduction were 7 times more than the changes due to meteorological fields by 2050 in both SSP126 and SSP585 scenarios. Other studies have also indicated that the impacts of climate change on future PM2.5 were smaller than those of anthropogenic emissions of pollutants (Hong et al., 2019; Jiang et al., 2013; Silva et al., 2017).
For each combination of foreign and Chinese anthropogenic emission scenarios, we simulate PM2.5 concentrations at a 0.5∘ × 0.625∘ resolution using a chemical transport model (GEOS-Chem; http://www.geos-chem.org, last access: 6 September 2023) that can represent the complex pollutant emissions and chemical reactions across a large spatial domain. Then, we correct the systematic bias in the model simulated PM2.5 concentrations using a large set of ground-based observations of PM2.5 in China; the same correction factor is applied to all present and future concentrations. Finally, we quantify the transboundary impacts on Chinese PM2.5 under each emission scenario. We further quantify the corresponding transboundary impacts on public health in China, measured by premature deaths, using socio-demographic projections consistent with SSPs and the state-of-the-art concentration–response relationships (the Global Exposure Mortality Model, GEMM, model; Burnett et al., 2018).
In this study, we use a set of data and models to investigate future air quality and health burden in China. Projected air pollutant emissions for foreign countries under SSP–RCP (representative concentration pathway) scenarios are obtained from the International Institute for Applied Systems Analysis (IIASA; Rao et al., 2017; Riahi et al., 2017) with updates on base year emissions and the harmonization year in this study. Projected air pollutant emissions for China are developed by Tong et al. (2020) and Cheng et al. (2021b). Ambient PM2.5 concentrations under each scenario are simulated by the GEOS-Chem chemical transport model (http://www.geos-chem.org) and further corrected for systematic bias by a suite of ground-based observations (Xu et al., 2023). PM2.5-associated mortalities are calculated using the Global Exposure Mortality Model (GEMM; Burnett et al., 2018).
2.1 Scenarios of future anthropogenic air pollutant emissions
The future pollutant emission outcome is a cumulative result of a range of variables including socio-economic development, technological change, efficiency improvements and policies directed at pollution control as well as alternative concerns including climate change, energy access and agricultural production (Rao et al., 2017). The shared socioeconomic pathways (SSPs) include five distinctly different pathways about how the future might unfold in terms of major socioeconomic, demographic, technological, lifestyle, policy and institutional trends (O'Neill et al., 2014; van Vuuren et al., 2017). We select three scenarios to represent low-, medium- and high-emission cases: SSP1 – sustainability, SSP2 – middle of the road and SSP3 – regional rivalry. An assumption about the degree of air pollution control (strong, medium or weak) is included on top of the baseline pathway. Weak air pollution controls occur in SSP3, with medium controls in SSP2 and strong controls in SSP1 (Turnock et al., 2020). However, SSP scenarios do not include explicit climate policies (O'Neill et al., 2020). Instead, the RCPs generate climate projections targeting at a range of climate forcing levels, such as 1.9 W m2 (1.5 ∘C warming), 4.5 W m2 (3 ∘C) and 7.0 W m2 (4 ∘C) in 2100. Thus, the combination of SSP–RCP scenario framework depicts societal and climate futures in parallel and explores plausible futures of human activities, the changing climate and emissions (O'Neill et al., 2020).
Here, we use anthropogenic aerosol emissions projected under SSP–RCP scenarios for foreign countries. We select three scenarios to represent low, middle and high air pollutant emissions in plausible futures: SSP119 (a sustainable development pathway targeting at a rise of the global mean surface temperature below 1.5 ∘C from the pre-industrial levels by the end of the century), SSP245 (a business-as-usual development pathway with 3 ∘C warming) and SSP370 (a regional-rivalry development pathway with 4 ∘C warming). Table 1 summarizes the scenario settings in more detail.
The original SSP–RCP anthropogenic emission future projection starts from 2015. Here, we update the start year to 2019, which is the latest year that anthropogenic emissions from the Community Emissions Data System (CEDS; Hoesly et al., 2018) are available. Because CEDS historical emissions and SSP–RCP future emissions were developed upon different assumptions and methods, it is important to harmonize the two datasets to ensure smooth transitions between the two sets of emission trajectories (Gidden et al., 2019). The update of the harmonization year from 2015 to 2019 in this study could better represent the actual emission trajectory between 2015 and 2019. We also use the most recently developed CEDS version 2 (https://data.pnnl.gov/dataset/CEDS-4-21-21, last access: 6 September 2023; Smith et al., 2023) to harmonize the future SSP–RCP emission projections as the new emissions can better represent the historical trend of pollutant emissions (https://github.com/JGCRI/CEDS/blob/master/documentation/Version_comparison_figures_v_2021_04_21_vs_v_2016_07_16(CMIP6).pdf, last access: 6 September 2023). The final future SSP–RCP emissions for foreign countries used in this study are presented in Fig. S1a in the Supplement.
Future scenarios of anthropogenic pollutant emissions for China were developed by Tong et al. (2020) and Cheng et al. (2021b). We adopt these emissions instead of SSP–RCP emissions because Tong et al. (2020) and Cheng et al. (2021b) developed the emissions specifically to meet China's recent climate goals (i.e., 2030 carbon peak and 2060 carbon neutrality) and used parameters (e.g., emission factors, energy use) to reflect the most up-to-date pollutant control policies (i.e., the Clean Air Action since 2013) and technologies in China. Their emissions have been suggested to better capture China's PM2.5 concentration decline during 2015–2019 than those driven by SSP–RCP emissions (Cheng et al., 2021a). We select two plausible scenarios: the current-policy scenario and the carbon-neutral scenario. The current-policy scenario seeks to achieve China's Nationally Determined Contribution (NDC) pledges and the national PM2.5 air quality goal (i.e., 35 µg m−3) by 2030, elucidating China's future air pollution mitigation pathway towards all the released and determined upcoming clean air policies since 2015. The carbon-neutral scenario pursues China's carbon-neutral commitment and the WHO's old PM2.5 guideline (10 µg m−3) by 2060. It implements the best-available end-of-pipe technologies and more stringent pollution control policies than the current-policy scenario. Future anthropogenic pollutant emissions for China under these scenarios are developed by firstly simulating China's future energy and socioeconomic evolution using the Global Change Assessment Model (GCAM-China) and then translating it into pollutant emissions by the Dynamic Projection model for Emissions in China (DPEC; Tong et al., 2020). More details are summarized in Table 1. The actual future air pollutant emissions for China used in this study are presented in Fig. S1b.
2.2 Simulations of ambient PM2.5 concentrations
We use the GEOS-Chem model to simulate PM2.5 concentrations in China and other Asian countries under each emission scenario and year. Detailed descriptions of the model configurations can be found in Xu et al. (2023). Briefly, we use the flex-grid capability of the GEOS-Chem classic model v13.2.1 to simulate PM2.5 concentrations over Asia and its adjacent regions (11∘ S–60∘ N, 30–150∘ E; covering the entire Asia, eastern Africa and eastern Europe regions). We use MERRA-2-assimilated meteorological data provided by the Global Modeling and Assimilation Office (GMAO) at the NASA Goddard Space Flight Center to drive the model. Our simulation is conducted at a horizontal resolution of 0.5∘ latitude × 0.625∘ longitude with 47 vertical levels between the surface and ∼ 0.01 hPa. Chemical boundary conditions are taken from corresponding global simulations under each emission scenario in Table 2 at a resolution of 2∘ latitude × 2.5∘ longitude. The regeneration of boundary conditions under each emission scenario could ensure the inclusion of pollution transported from countries both within and outside the flex-grid domain as transboundary pollution to China. We spin up every simulation for 1 month to remove the effects of initial conditions.
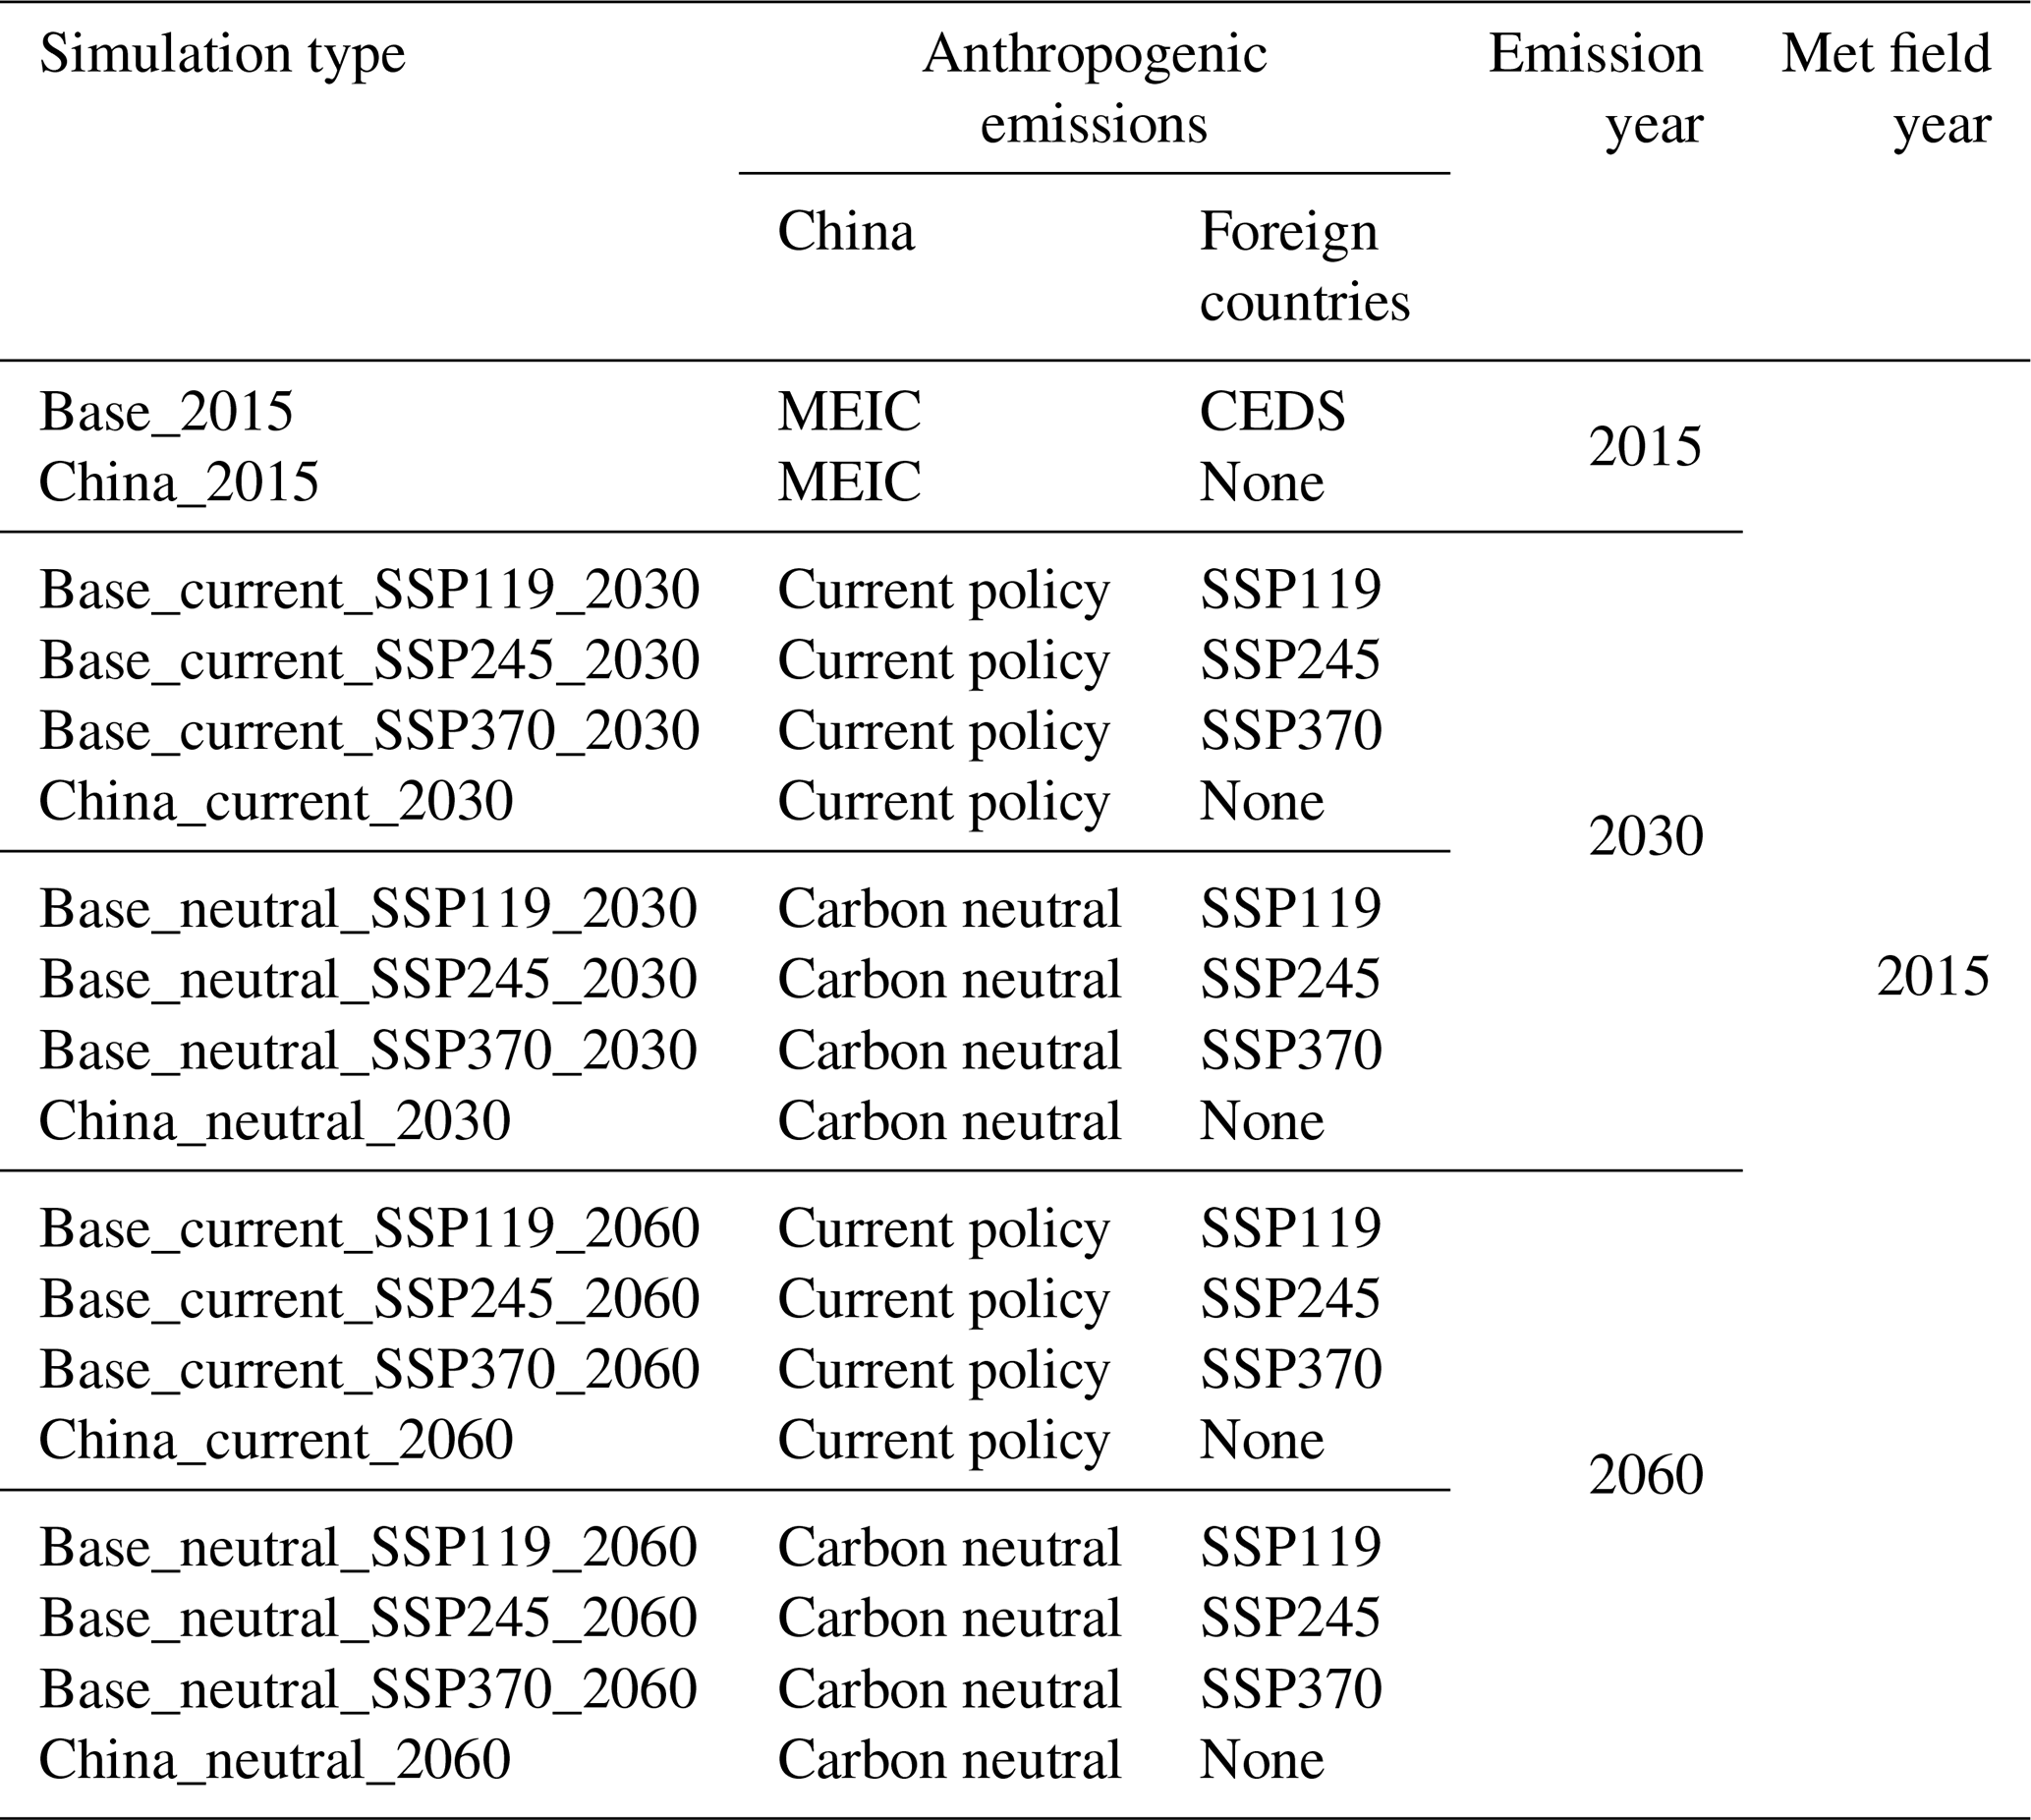
Anthropogenic emissions for the base year (2015) for China are taken from the Multi-resolution Emission Inventory (MEIC) for 2015 (Zheng et al., 2018b), and for the rest of the world they are taken from the Community Emissions Data System (CEDS) version 2 for 2015 (https://data.pnnl.gov/dataset/CEDS-4-21-21). For future simulations, anthropogenic emissions for China and foreign countries for each scenario are described above and are specified in Table 2. Other emissions are default in GEOS-Chem following Xu et al. (2023) and are fixed in all present and future scenarios.
We conduct simulations for January, April, July and October and treat the mean of the four months as an annual mean. Our meteorological fields are fixed to 2015 for all scenarios and years to exclude the influence of climate on the results. More details of our model configurations can be found in Table 2. We conduct two types of simulations: (1) baseline simulations (simulations with “Base_” prefix in Table 2) that include complete anthropogenic emissions for both China and foreign countries and (2) sensitivity simulations (simulations with “China_” prefix in Table 2) that exclude anthropogenic emissions for foreign countries from the baseline simulation. Baseline simulations calculate PM2.5 concentrations in China that are driven by both Chinese and foreign emissions, while sensitivity simulations calculate PM2.5 concentrations in China that are driven merely by China's domestic emissions. The impacts of transboundary pollution on China's PM2.5 are calculated as the difference in China's PM2.5 between a baseline simulation and a sensitivity simulation in a specified year and under a specified Chinese emission scenario.
We correct our simulated PM2.5 concentrations under each scenario, based on a large set of ground-based observations of PM2.5, because our simulated PM2.5 concentrations are biased high by roughly 15.7 % (Fig. S2). Descriptions and data screening method of our ground-based observations can be found in Xu et al. (2023). Further evaluations of PM2.5 composition concentrations in China and PM2.5 concentrations in other Asian countries with ground-based observations are presented in Xu et al. (2023). We correct simulated PM2.5 concentrations in anthropogenic concentration-dominated grid cells (where anthropogenic emissions exceed natural emissions) by observations located in anthropogenic concentration-dominated grid cells. Similarly, we correct simulated concentrations in natural concentration-dominated grid cells (where natural emissions exceed anthropogenic emissions) by observations located in natural concentration-dominated grid cells. Natural and anthropogenic concentration-dominated grid cells in the model are shown in Fig. S3. To isolate anthropogenic concentration-dominated grid cells, we conduct a sensitivity that excludes natural emissions in China and in foreign countries. PM2.5 concentrations from this sensitivity simulation are referred to as natural PM2.5 concentrations. The difference between concentrations from the Base_2015 simulation (with complete natural and anthropogenic emissions) in Table 2 and the natural concentrations is the anthropogenic emission-contributed concentrations (anthropogenic concentrations). We scale anthropogenic concentrations by the average ratio of observed concentrations and simulated concentrations at each observation site that falls into an anthropogenically dominated grid cell. Concentrations before and after the correction for anthropogenic and all grid cells (including natural grid cells) are shown in Fig. S2. The overestimation in both anthropogenic and total PM2.5 concentrations is removed after the correction.
We calculate sectoral contributions of foreign anthropogenic emissions to China's PM2.5 concentrations under China's current policy and foreign countries' SSP370 scenario at a resolution of 2∘ × 2.5∘ for January in 2030 and 2060. Sectoral contributions are calculated by taking the difference of a simulation that includes one sector of SSP370 foreign anthropogenic emissions (agriculture, industry, energy, traffic, residential combustion, solvent use, waste burning) at a time and a simulation without foreign anthropogenic emissions (“China_current_2030” and “China_current_2060” runs in Table 2).
We also conduct sensitivity simulations at a resolution of 2∘ × 2.5∘ to separate transboundary contributions to China's future PM2.5 concentrations from anthropogenic emissions within or outside the flex-grid domain of the model under the current-policy scenario and SSP370 scenario. Contributions of foreign anthropogenic emissions from within the flex-grid domain are calculated as the difference of a simulation without foreign anthropogenic emissions outside the flex-grid domain and a simulation without foreign anthropogenic emissions over the globe. Contributions of foreign anthropogenic emissions from outside the flex-grid domain are calculated as the difference between the total foreign contributions and foreign contributions from flex-grid countries.
2.3 Health impact assessment
We use the GEMM (Burnett et al., 2018) to estimate premature deaths attributable to ambient PM2.5 exposure for noncommunicable diseases (NCDs) and lower respiratory infections (LRIs) in China under each scenario. GEMM NCD + LRI calculates premature deaths associated with ambient PM2.5 exposure (M) for each population subgroup s (by age and sex) in grid cell g as
where Bs is the national baseline mortality rate of NCD + LRI for the exposed population subgroup s. AFs(Cg) is the attributable fraction of NCD + LRI to PM2.5 exposure at level Cg for population subgroup s. Pg represents the total exposed population in grid cell g. In particular AF was calculated as AF = (RR − 1) RR, where RR is the relative risk of NCD + LRI attributable to ambient PM2.5 exposure. The dependence of RR of NCD + LRI on PM2.5 concentrations is calculated as
where θ, α, μ and ν are fitted parameters of PM2.5–mortality relationships. According to the GEMM, the RR of NCD + LRI is calculated by age for adults aged from 25 to greater than 85 years in 5-year intervals.
In this study, we use the national baseline mortality data by age group and disease type from the Global Burden of Disease Results Tool, 2017 version (GBD 2017; Institute for Health Metrics and Evaluation, 2018). For future baseline mortality, we use the age-specific baseline mortality rates projected by the International Futures (IFs) model v7.89 (Hughes et al., 2011). Population and age structure data for China for 2015 and future years are obtained from the SSP dataset (Samir and Lutz, 2017; Riahi et al., 2017) because China's current-policy scenario is built upon the SSP2 scenario, and the carbon-neutral scenario is built upon the SSP1 scenario (Cheng et al., 2021b; Tong et al., 2020). The gridded population data for China on a 0.5∘ × 0.5∘ spatial resolution for 2015 and future years under each SSP scenario are developed by Huang et al. (2019). The future cause-and-effect relationship between PM2.5 exposure and mortality follows the PM2.5–mortality hazard ratio function in the GEMM, which has been widely used in the calculation of PM2.5-associated mortality in the future (Hong et al., 2019; Liu et al., 2021; Yang et al., 2022).
With the baseline mortality, the population data and the age-structure data, we calculate, grid cell by grid cell, the age-specific baseline mortality rate under present and future scenarios. The impacts of transboundary pollution on mortality in China are calculated as the difference between mortality associated with PM2.5 simulated by the full anthropogenic emissions for China and foreign countries and mortality associated with PM2.5 simulated by excluding foreign emissions from the full anthropogenic emissions.
3.1 Achievability of future air quality goals in China
In 2015, the national mean population-weighted PM2.5 over China is about 48 µg m−3 (Fig. 1) after the observation-based correction, consistent with previous studies (48–55 µg m−3) that used various models (Burnett et al., 2018; Cheng et al., 2021a, b; Tang et al., 2022; Zhang and Cao, 2015). The correction reduces the overestimation in the model by roughly 16 % (Fig. S2); details about the correction approach are described in the Method section. From 2015–2030 and 2030–2060, there is a remarkable decreasing trend in China's annual mean population-weighted PM2.5 concentrations under plausible futures (Fig. 1). In 2030, achieving the 35 µg m−3 goal on a national average level would be feasible even under the fossil-fuel-intensive pathways in China (current-policy scenario) and foreign countries (SSP370), yet the most polluted provinces might not be able to achieve the goal under such scenarios (upper whiskers in Fig. 1). In 2060, achieving the WHO AQG goal of 5 µg m−3 would be highly unlikely under any emission pathway analyzed in this study (Fig. 1).
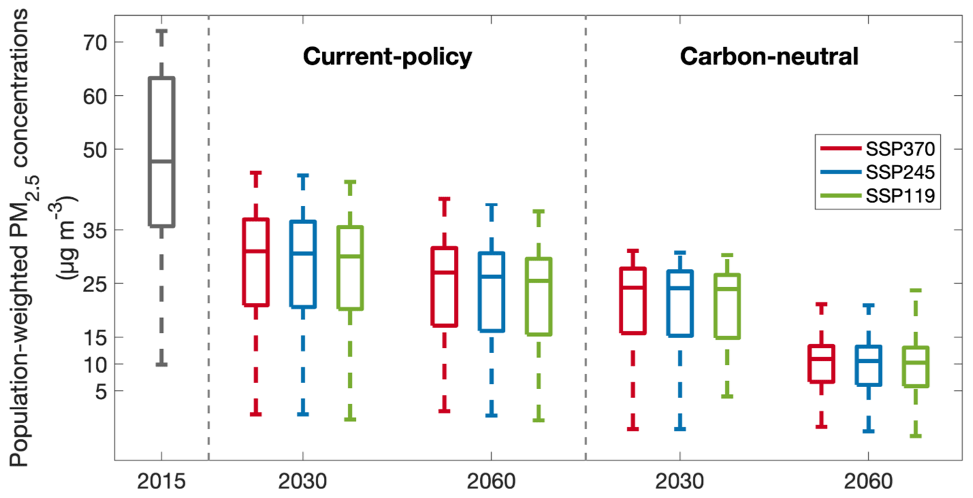
Figure 1Population-weighted PM2.5 concentrations over China. Box-and-whisker plots represent 5th, 25th, 75th and 95th percentiles of provincial population-weighted PM2.5 concentrations in 2015, 2030 and 2060. Lines in the middle of each box represent the national mean population-weighted PM2.5 concentrations. Future emission scenarios in China are labeled as text at the top, and in foreign countries they are represented by colors according to the legend.
Considering air quality goals at the city level in China (35 µg m−3 in 2015 and 2030; 5 µg m−3 in 2060), the fraction of cities achieving air quality goals increases considerably as China and foreign countries transition from the fossil-fuel-intensive to low-carbon pathways, yet the achievement is not fully attainable in all cities. In 2015, only 30 % of 365 cities in the national PM2.5 monitoring network has an annual mean population-weighted PM2.5 below the 35 µg m−3 threshold (Fig. 2a). In 2030, the percentage increases considerably (Fig. 2b). Under the current-policy emission pathway in China (the current clean-air policies and nationally determined contribution pledges), roughly 65 % of Chinese cities (average of the three foreign scenarios) are able to achieve the goal, doubling the percentage in 2015. Under the carbon-neutral emission pathway in China (stringent clean-air policies and carbon neutrality commitments), the percentage further increases to about 92 % (average of the three foreign scenarios). However, even the cleanest emission pathway in both China and foreign countries cannot allow all cities to attain the 35 µg m−3 goal. In 2060 (Fig. 2c), the WHO AQG goal of 5 µg m−3 is not achievable for the majority of cities (≥ 75 %) in China. Emission pathways adopted by foreign countries can affect up to 6 % of cities achieving the AQG goal, and the influence could be even larger over border regions (as shown in Fig. 3).
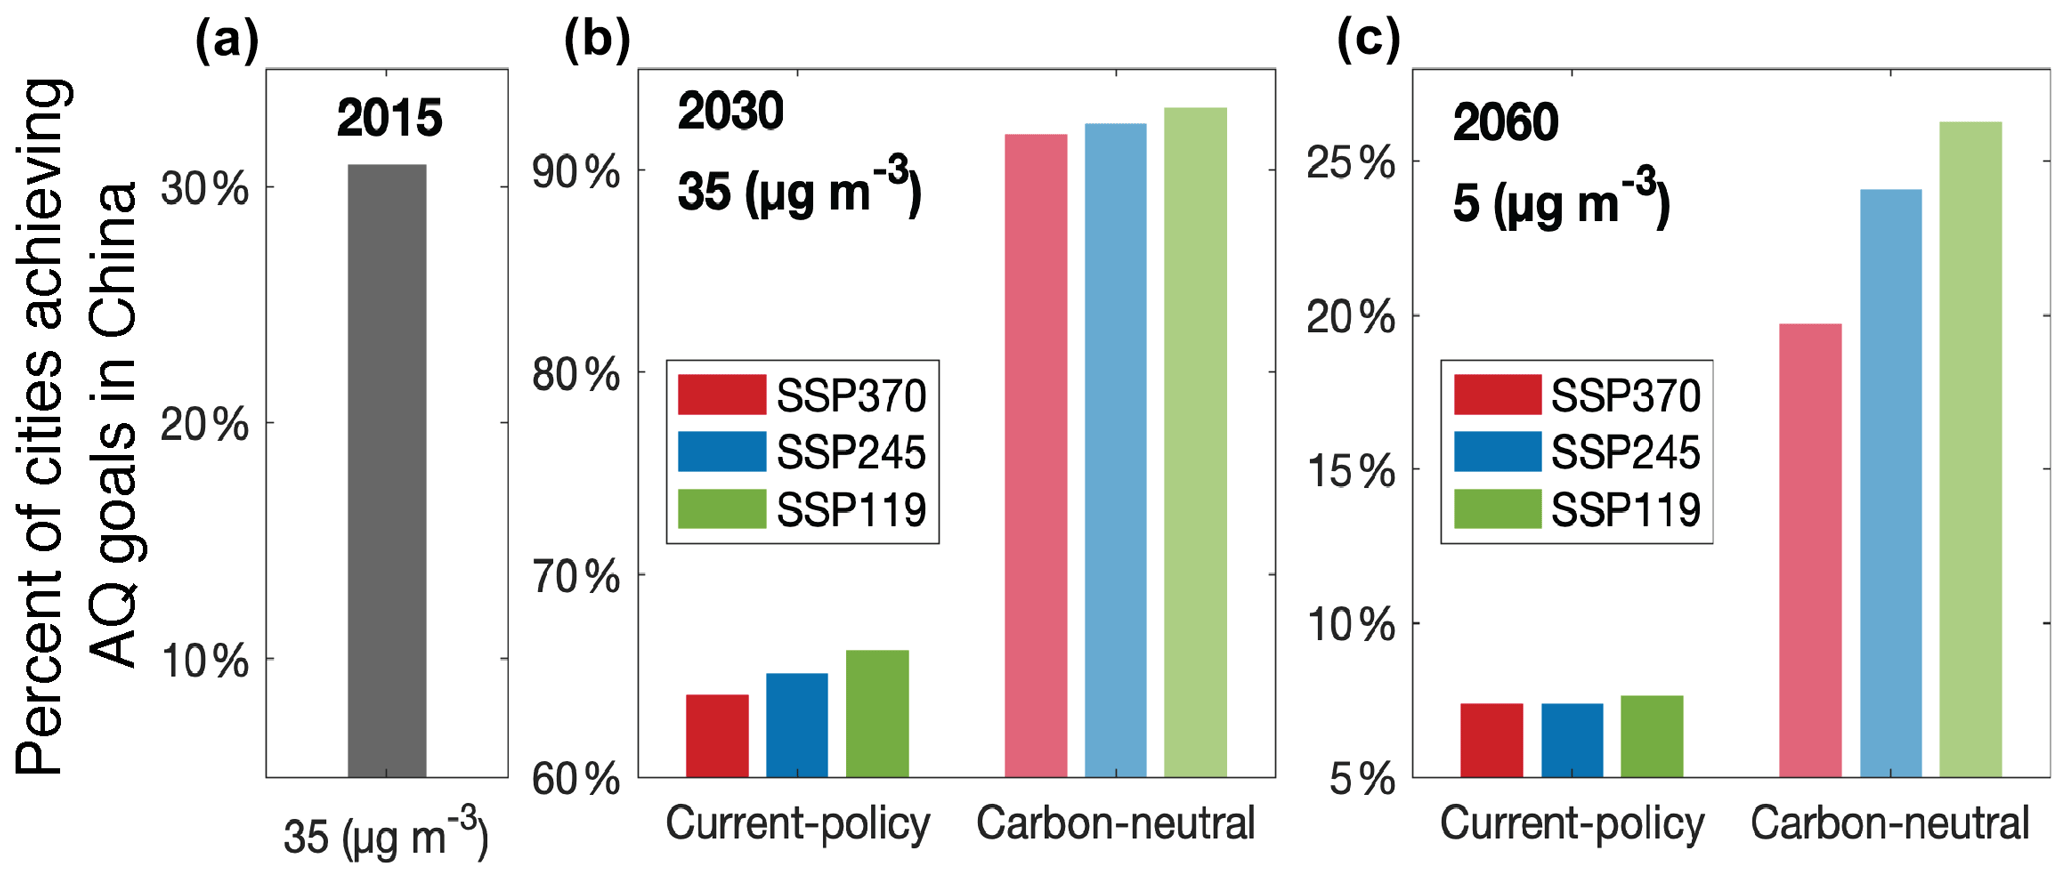
Figure 2Percent of cities achieving air quality goals in China. (a) Percent of cities in China with an annual mean population-weighted PM2.5 concentration below 35 µg m−3 in 2015. (b–c) Percent of cities with an annual mean population-weighted PM2.5 concentration achieving the 35 µg m−3 goal in 2030 (b) and the 5 µg m−3 goal in 2060 (c). PM2.5 concentrations are simulated under different future emission scenarios in China (current-policy and carbon-neutral scenarios) and foreign countries (represented by colors following the legend).
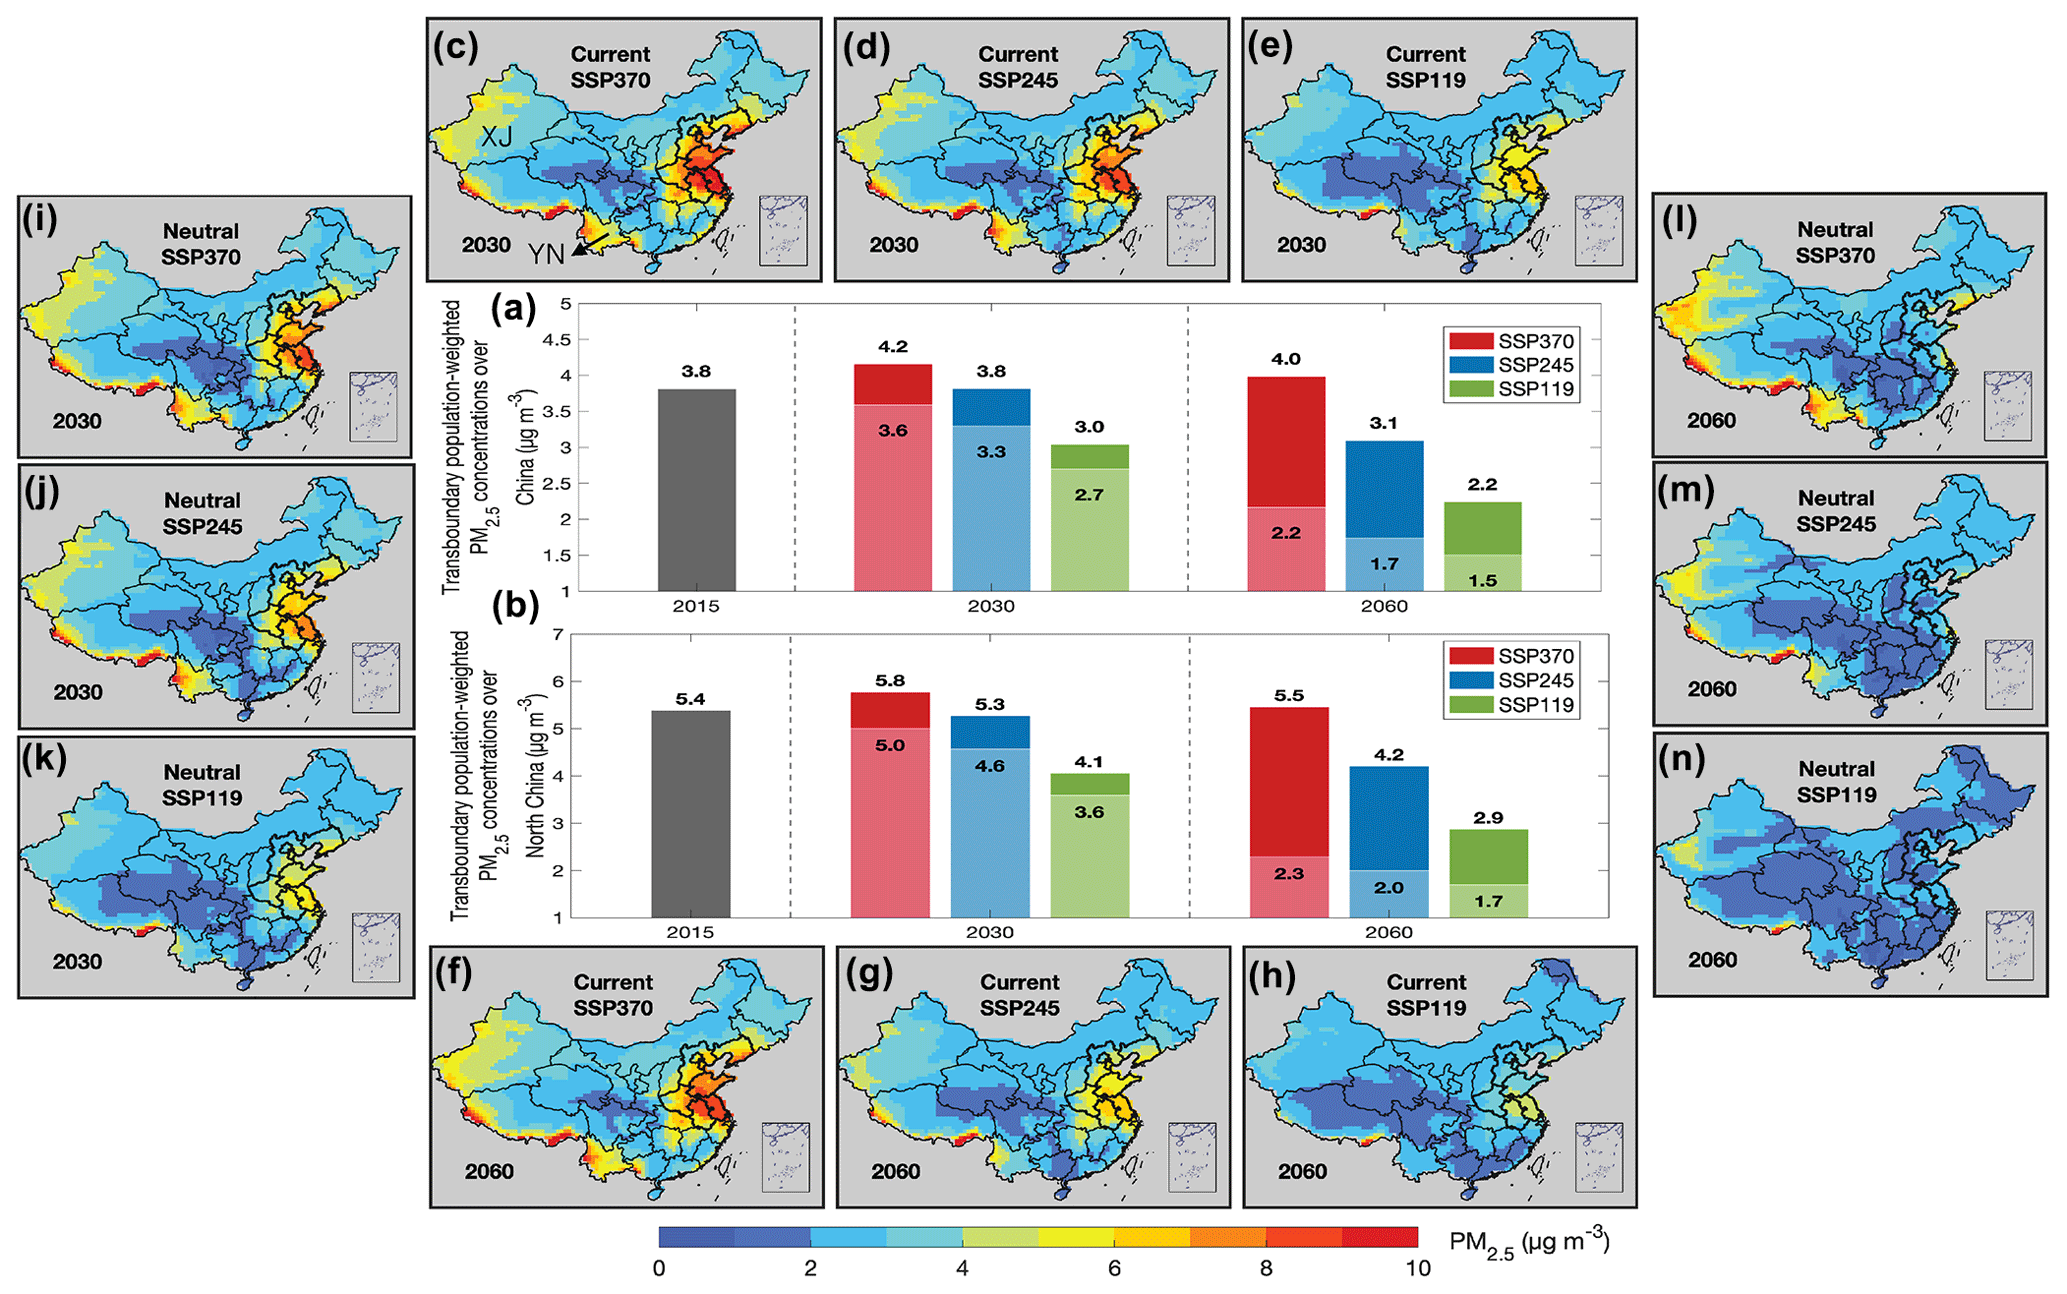
Figure 3Contributions of transboundary pollution to PM2.5 concentrations over China. (a) Transboundary contributions to national annual mean population-weighted PM2.5 in China in 2015, 2030 and 2060. Future scenarios are estimated by different emission scenarios in China represented by light (carbon-neutral scenario) and dark shadings (current-policy scenario), along with different emission scenarios in other countries (SSP370, SSP245, SSP119) represented by colors according to the legend. The text on top of each bar represents the transboundary-contributed population-weighted PM2.5 under China's current-policy emission scenarios. The text in the light shading of each bar represents the transboundary-contributed population-weighted PM2.5 under China's carbon-neutral emission scenarios. (b) Same as (a), but for northern China. (c–n) Spatial distributions of transboundary-contributed annual mean PM2.5 concentrations over China in 2030 and 2060 under different emission scenarios in China and in other countries. YN represents the province of Yunnan. XJ represents the province of Xinjiang. Northern China is outlined by thick black lines.
3.2 Transboundary impacts on PM2.5 concentrations in China
In 2015, transboundary pollution contributes about 3.8 µg m−3 population-weighted PM2.5 to China (Fig. 3a), accounting for roughly 8 % of the total population-weighted PM2.5 (Fig. 4). In the future, transboundary pollution becomes increasingly important in China, as the share of transboundary pollution in China's total population-weighted PM2.5 increases to 12 %–22 % in 2060 (Fig. 4).
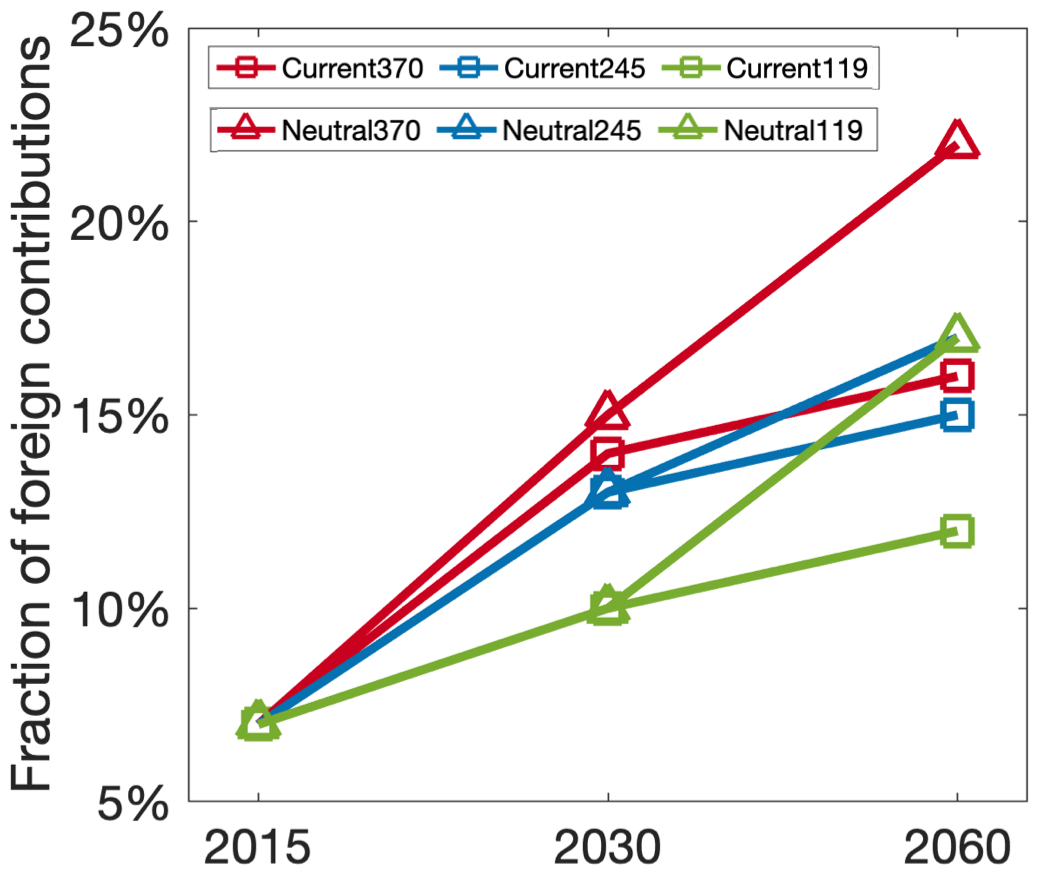
Figure 4Fractional transboundary contributions to PM2.5 concentrations over China. The percentage fraction of transboundary-contributed PM2.5 in China's total population-weighted PM2.5 in 2015, 2030 and 2060. Future anthropogenic emission scenarios are represented by different colors and markers following the legend.
For future PM2.5 concentrations, the contribution of transboundary pollution to PM2.5 in China decreases as foreign countries and China undergo the low-carbon pathways (Fig. 3a). In 2030, under the current-policy scenario in China, transboundary contributions to PM2.5 in China would be reduced by 1.2 µg m−3 (29 %) as foreign countries transition from the fossil-fuel-intensive (SSP370) to the low-carbon (SSP119) scenario. By 2060, the difference would be increased to 1.8 µg m−3 (45 %). The transboundary pollution will also depend on Chinese domestic emissions because of their chemical interactions with foreign-transported pollution (Xu et al., 2023). In 2030, under the SSP370 scenario in foreign countries, transboundary contributions to PM2.5 in China could be reduced by 0.6 µg m−3 (14 %) as China transitions from the current-policy to the carbon-neutral scenario. In 2060, the PM2.5 reduction could be increased to 1.8 µg m−3 (45 %).
Direct atmospheric transport and chemical interactions play different roles in transboundary pollution over different regions in China. Over northern China (outlined in Fig. 3c–o), the influence of chemical interactions on transboundary pollution is prominent. Xu et al. (2023) found that foreign-transported NMVOCs could enhance the atmospheric oxidizing capacity and facilitate the oxidation of Chinese nitrogen oxides (NOx) to form nitrate over northern China. This feature persists in the future. Due to chemical interactions, northern China is the region that is the most strongly affected by transboundary pollution in most scenarios. In 2030, transboundary pollution contributes 3 to 10 µg m−3 PM2.5 concentrations to northern China, even under China's carbon-neutral scenario (Fig. 3b and i–l), greatly increasing the difficulty for this region to achieve the 35 µg m−3 goal. Further reduction of transboundary pollution on northern China requires the reduction of not only foreign anthropogenic emissions but also China's domestic emission. For example, in 2060, if China adopts the current-policy pathway (Fig. 3f–h), achieving the WHO AQG goal of 5 µg m−3 would be highly unlikely for the majority of northern China, as transboundary pollution alone would contribute roughly 3–10 µg m−3 of PM2.5 concentration (Fig. 3b and f–h). Alternatively, adopting the carbon-neutral rather than the current-policy pathway in China reduces roughly 41 %–58 % of transboundary PM2.5 over northern China in 2060 (Fig. 3b), making it possible for the region to achieve the 5 µg m−3 goal. Thus, a low-emission pathway for China has a large co-benefit on reducing transboundary pollution exerted upon its populous northern area by reducing the aforementioned chemical interactions.
The western border provinces of Yunnan and Xinjiang (denoted in Fig. 3c–o) are also influenced substantially by transboundary pollution, with the magnitude of transboundary pollution determined predominantly by foreign emission pathways. For example, in 2060, under China's carbon-neutral emission pathway, transboundary PM2.5 over Yunnan decreases from 6 to 3 µg m−3 (a 50 % reduction) as the foreign pathway switches from a fossil-fuel-intensive (SSP370; Fig. 3m) to low-carbon (SSP119; Fig. 3o) pathway, reflecting the considerable impact of South Asian pollution to China (Jiang et al., 2013). Over Xinjiang, the transboundary pollution driven predominantly by direct atmospheric transport can reach 6 µg m−3 in many scenarios (i.e., current-policy plus SSP370 for 2030 and 2060, carbon-neutral plus SSP245 for 2030), indicating the important influence of anthropogenic emissions from Central Asia in the future that has hardly been investigated in previous studies.
As transboundary contributions are the largest under China's current-policy and foreign countries' SSP370 emission pathways (Fig. 3a), we further investigate major emission sectors in foreign countries that contribute to China's future PM2.5 concentrations. We take January as an example because Xu et al. (2023) found that transboundary contributions to China's PM2.5 were the largest in January. Figure S4 reveals that agriculture, energy, industry, transportation and residential combustion emissions in foreign countries are major sources of transboundary pollution to China's national average future PM2.5 concentrations in 2030 and 2060 January, and these sectors contribute roughly evenly (15 %–23 % for each source). There is pronounced spatial heterogeneity in the source attribution. Solvent use emissions in foreign countries make roughly 3 times larger contributions to northern China (18 % in 2030 and 2060) than to the national average (6 %–7 % in 2030 and 2060). This is in line with the result of Xu et al. (2023) that the NMVOCs are the primary drivers of transboundary PM2.5 over northern China. Residential combustion in foreign countries contributes about 16 % in 2030 and 10 % 2060 more PM2.5 to the province of Yunnan than to the entirety of China, as Yunnan is mostly affected by emissions from South Asia (Jiang et al., 2013), where residential combustion is intensive (McDuffie et al., 2020).
Transboundary pollution to China could arise from emissions of countries within and outside the flex-grid domain of the model. Thus, we conduct a sensitivity simulation driven by China's current-policy and foreign countries' SSP370 emissions in 2030 and 2060 as an example to explore the relative importance of anthropogenic emissions from countries within and outside the flex-grid domain for transboundary pollution to China. Figure S5 shows that anthropogenic emissions from countries within the flex-grid domain dominate the transboundary pollution to China in all seasons (> 80 %), and their contributions remain in 2030 and 2060. Contributions of anthropogenic emissions from countries outside the flex-grid domain are larger in April and October, when westerly winds prevail and wet deposition is not as strong as in July (Jiang et al., 2013; Leibensperger et al., 2011; Ni et al., 2018). Northern China is more influenced by emissions outside the flex-grid domain (13 % in April and 24 % in October) than China on average is (7 % in April and 13 % in October), indicating that northern China is more influenced by emissions outside Asia, such as Europe and North America. Leibensperger et al. (2011) have also found that NOx emission in the US could lead to an enhancement of PM2.5 over northern China.
3.3 Health threats by transboundary pollution in China
Figure 5 shows our estimated PM2.5-associated premature deaths in 2015 and the future. Our estimated PM2.5-associated premature deaths in China in 2015 (2.03 million) are comparable to other studies (2 to 2.4 million; Burnett et al., 2018; Geng et al., 2021; Tang et al., 2022). Our estimated increasing trend of premature deaths in China from SSP370 to SSP119 is also consistent with previous works (Tang et al., 2022; Yang et al., 2022), which is driven primarily by population aging (Fig. S6). Our estimated premature deaths in 2030 and 2060 under the current-policy emission scenario (2.68 to 2.82 million for 2030; 1.8 to 2.05 million for 2060) are substantially lower than those in Tang et al. (2022) (3.5 to 4 million for 2030; 6.5 to 7.5 million for 2060). The difference is primarily because Tang et al. (2022) fixed the baseline mortality rates in future years at the 2015 level, while our future baseline mortality rates from the IFs are projected on the basis of income, education and technology advancement, and other factors (Hughes et al., 2011).
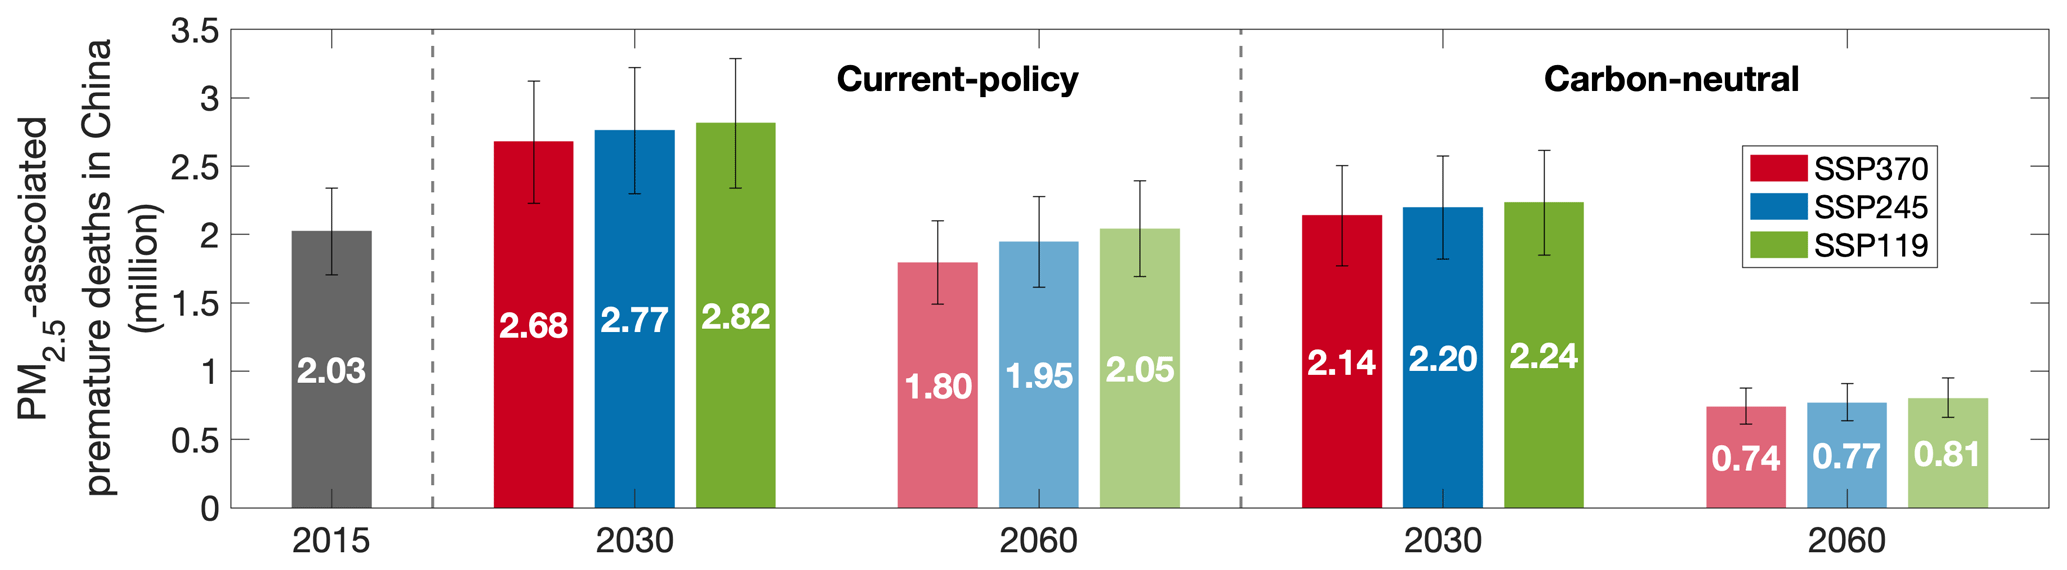
Figure 5PM2.5-associated premature deaths in China. Total PM2.5-associated premature deaths in China for 2015, 2030 and 2060 under each emission scenario in China (denoted as text at the top) and in other countries (represented by colors in the legend). Numbers denote the estimated deaths in each scenario. Error bars represent the 95 % confidence interval of the RR function.
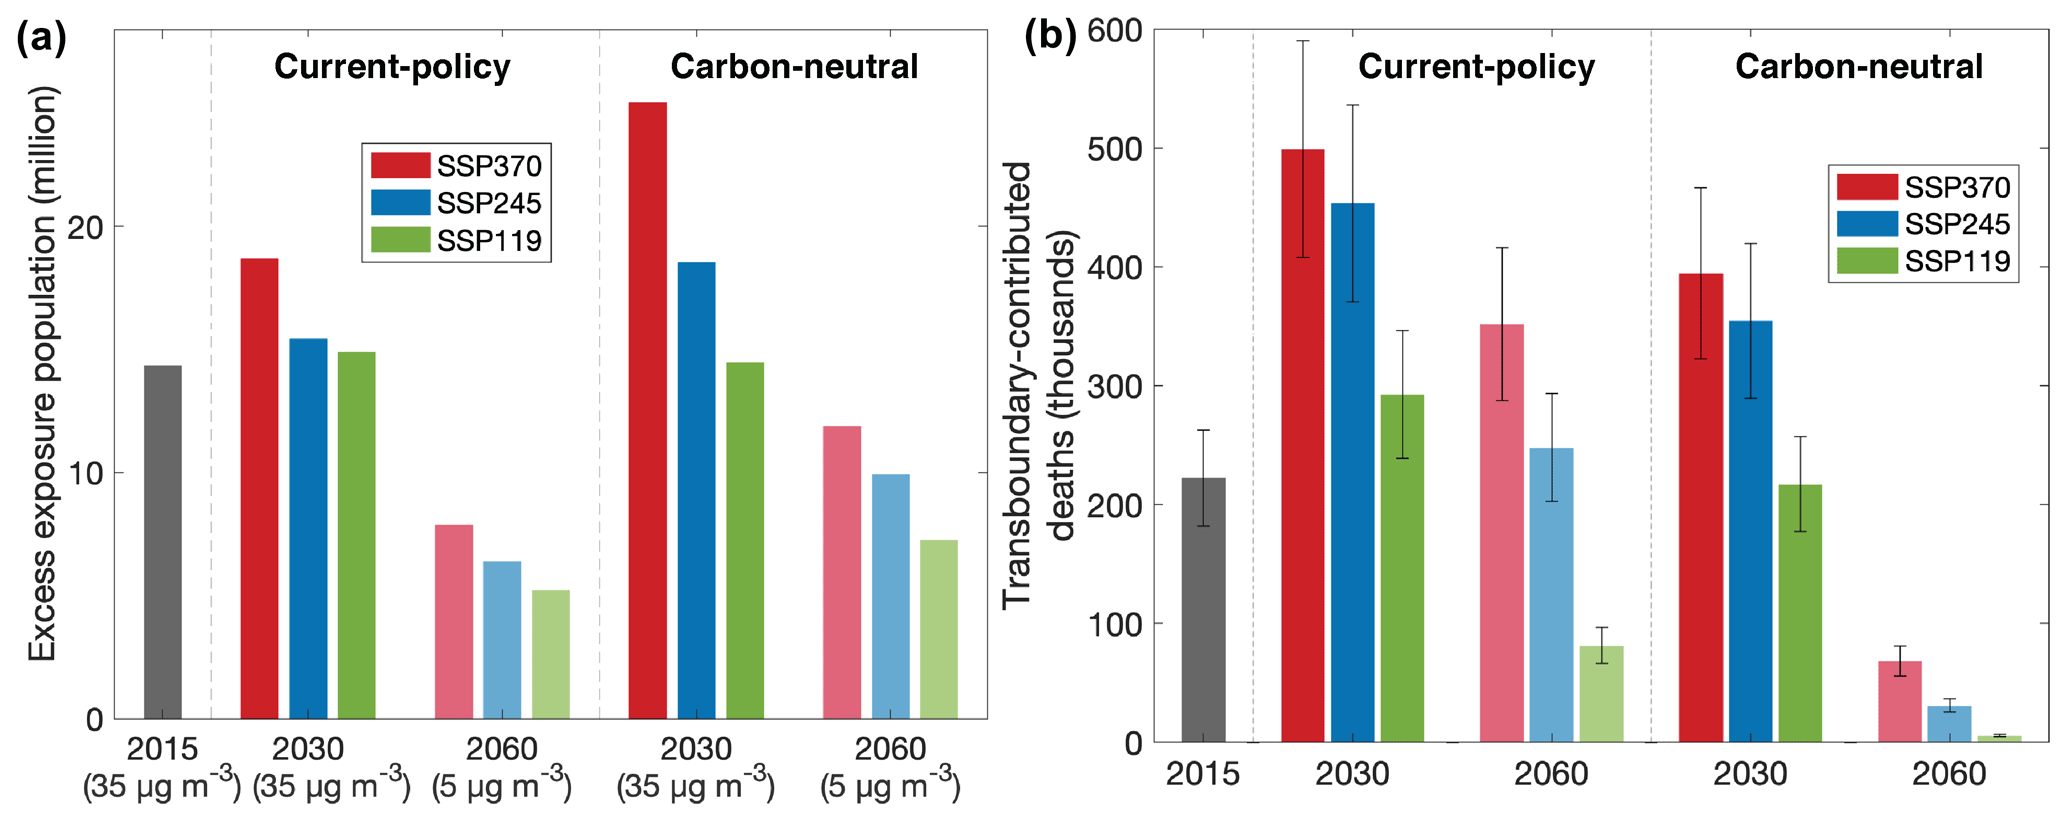
Figure 6Potential health threats associated with transboundary pollution in China. (a) Population exposed to an annual mean population-weighted PM2.5 concentration above the goals (35 µg m−3 for 2015 and 2030; 5 µg m−3 for 2060) due to transboundary contributions of PM2.5 in China under different emission scenarios in China (denoted as text at the top) and in other countries (represented by colors in the legend). (b) Transboundary-contributed PM2.5-related premature mortalities in China under different emission scenarios in China (denoted as text at the top) and in other countries (represented by colors in the legend). Error bars represent the 95 % confidence interval of the RR function.
The PM2.5 concentrations contributed by transboundary pollution can lead to an extra number of people (i.e., excess population) exposed to PM2.5 concentrations above the targeted air quality levels in China (35 µg m−3 in 2015 and 2030; 5 µg m−3 in 2060), which may lead to potential health threats. In the future, the amount of excess population due to transboundary pollution depends on both foreign and China's emission pathways (Fig. 6a). In 2030, with Chinese emissions following the carbon-neutral scenario, adopting the low-carbon (SSP119) rather than the fossil-fuel-intensive pathway (SSP370) in foreign countries could prevent 10 million Chinese people from being exposed to PM2.5 concentrations above 35 µg m−3. In 2060, 5 million people could be prevented from being exposed to PM2.5 concentrations above 5 µg m−3 if the foreign scenario switches from SSP370 to SSP119. These results indicate remarkable health benefits that the low-carbon emission pathway in foreign countries would bring to China.
For a given future year and foreign emission scenario, the excess population due to transboundary pollution tends to be larger when China adopts the carbon-neutral pathway than when China adopts the current-policy pathway (Fig. 6a). This reflects the increasing influence of transboundary pollution on air quality in China as China's overall PM2.5 concentrations drop sharply towards the air quality goals under the carbon-neutral pathway (Fig. 1).
Another measure of health threat that transboundary pollution could exert upon China is PM2.5-related premature deaths. As shown in Fig. 6b, there is an obvious decreasing trend of transboundary-contributed PM2.5-related premature deaths in China as foreign countries and China transition from the fossil-fuel-intensive to the low-carbon pathway. In 2030, adopting the low-carbon pathway (SSP119) in foreign countries would prevent 41 % (178 000 under China's carbon-neutral pathway) to 45 % (207 000 under China's current-policy pathway) of premature deaths that would occur under the fossil-fuel-intensive pathway (SSP370) in foreign countries. In 2060, the prevention would be as large as 76 % (270 000 under China's current-policy pathway) to 91 % (63 000 under China's carbon-neutral pathway). In addition, China's low-carbon emission pathway could also bring considerable health benefits through reducing the chemical interaction-related transboundary pollution and associated premature deaths in China. In 2030, adopting the carbon-neutral pathway in China would prevent 99 000 (SSP245) to 211 000 (SSP119) people from transboundary pollution-associated premature deaths relative to adopting the current-policy emission pathway. In 2060, the prevented deaths would be 76 000 (SSP119) to 283 000 (SSP370). These findings highlight the considerable health benefits to China if foreign countries and China could adopt the low-carbon emission pathways coincidently.
This study reveals the increasingly important role that transboundary pollution would play in the achievement of future air quality goals and the protection of public health in China. The magnitude of transboundary pollution depends on both Chinese and foreign emissions, given the direct pollution transport and the indirect impact through chemical interactions between transported and China's locally emitted pollutants. Adopting the low-carbon (SSP119) instead of the fossil-fuel-intensive (SSP370) pathway in foreign countries would prevent millions of Chinese people (Fig. 6a) from being exposed to PM2.5 concentrations above the targeted air quality levels in 2030 (35 µg m−3) and 2060 (5 µg m−3) and would prevent 63 000–270 000 of transboundary PM2.5-associated mortalities in China in 2060 (Fig. 6b). Adopting the carbon-neutral instead of current-policy pathway in China would prevent 76 000–283 000 premature mortalities associated with transboundary pollution in 2060 (Fig. 6b). If China and foreign countries undergo the low-carbon pathways coincidently, transboundary pollution in China would be reduced by 63 % relative to adopting a fossil-fuel-intensive emission pathway in both regions (Fig. 4a) and could prevent 386 000 premature deaths in China (Fig. 6b). Cutting foreign emissions is particularly effective at reducing transboundary pollution at the western border provinces of Yunnan and Xinjiang that are dominated by direct transport. Fully achieving the WHO AQG goal of 5 µg m−3 over populous northern China would be possible only when both China and foreign counties adopt the low-carbon pathways (carbon-neutral and SSP119, respectively).
The importance of transboundary pollution is not confined to China. In the future, significant emission changes are expected in many developing countries, affecting air quality locally and in the downwind regions. These developing countries are often financially and/or technologically less capable to control emissions by themselves. Thus, enhanced external aid would be essential for these developing countries to undergo a low-carbon development in the future, which in turn would benefit air quality and public health of the entire globe. External aid could be done through global cooperation programs such as the Paris Agreement or through inter-regional collaboration such as the Belt and Road Initiative.
Uncertainties arise from several factors in this study. The future development pathway of a country is highly uncertain, leading to a wide spread of projected emission trajectories in the future. We thereby use a set of emission projections to represent the plausible range of future emissions. The simulation of PM2.5 is subject to uncertainties in aerosol chemical and physical processes, such as the wet deposition of nitrate (Luo et al., 2020) and the simplified secondary organic aerosol formation scheme (Pai et al., 2020). Our correction to the simulated PM2.5 concentrations using ground-based observations could reduce the uncertainty by 15 % to 18 % (Fig. S2). Future population and age structure change are projected based on their historical relationships with gross domestic product (GDP) and urbanization (O'Neill et al., 2020; Riahi et al., 2017). Thus, they may introduce biases if the future development of global GDP and urbanization deviates from the historical path, e.g., due to the emergence of anti-globalization (Dür et al., 2020) and regional rivalry (O'Neill et al., 2014; van Vuuren et al., 2014). There are additional uncertainties from PM2.5-related death estimates due to the limited epidemiology evidence and statistical estimation of the GEMM, such as the influences of particulate species and size on health outcomes (Burnett et al., 2018). We estimate the overall uncertainties of PM2.5-related deaths in each scenario as a 95 % CI in the main text. Besides, we do not consider potential influences of climate change and the change of natural emissions on PM2.5 and transboundary pollution, yet their influences are found to be small compared to the influence of anthropogenic emissions (Hong et al., 2019; Jiang et al., 2013; Liu et al., 2021; Silva et al., 2017).
The GEOS-Chem model v13.2.1 source code used for PM2.5 concentration simulations is available at https://geos-chem.readthedocs.io/en/stable/gcc-guide/02-build/get-code.html (last access: 6 September 2023; https://doi.org/10.5281/zenodo.5500717, The International GEOS-Chem User Community, 2021). The SSP–RCP emission harmonization source code is available at http://software.ene.iiasa.ac.at/aneris/ (Gidden, 2023). All computer codes generated during this study are available from the corresponding author upon reasonable request.
The global SSP–RCP emission data for 2015 and future scenarios and the area-weighted PM2.5 concentrations in China for 2015 and future scenarios are available upon request to the corresponding author. All other data used in this study are publicly available and can be downloaded from the following links:
-
China's future emission scenarios 2015–2060 (http://meicmodel.org.cn/?page_id=2351&lang=en#firstPage, MEIC team, 2023)
-
Chinese future population data (https://doi.org/10.57760/sciencedb.01683, Jiang et al., 2022)
-
2015 baseline mortality rate (https://gbd2017.healthdata.org/gbd-results/, Institute for Health Metrics and Evaluation, 2023)
-
future baseline mortality rate projection (https://www.ifs.du.edu/ifs/frm_MainMenu.aspx, International Futures, 2023).
-
CEDS version-2 emissions (https://doi.org/10.25584/PNNLDataHub/1779095, Smith et al., 2023).
The supplement related to this article is available online at: https://doi.org/10.5194/acp-23-10075-2023-supplement.
JL led the study. JX and JL designed the study. JX performed the model simulations and conducted the data analysis. DT provided China's future emission data. LC provided the SSP–RCP emission harmonization and health impact assessment methods. JX wrote the manuscript with inputs from JL. All authors commented on the manuscript.
The contact author has declared that none of the authors has any competing interests.
Publisher's note: Copernicus Publications remains neutral with regard to jurisdictional claims in published maps and institutional affiliations.
We thank the GEOS-Chem community for developing and maintaining the model. We also appreciate the IIASA for providing the SSP-RCP emissions.
This research has been supported by the National Natural Science Foundation of China (grant no. 42075175), the second Tibetan Plateau Scientific Expedition and Research Program (grant no. 2019QZKK0604), and the China Postdoctoral Science Foundation (grant no. 2021M700191).
This paper was edited by Jason West and reviewed by two anonymous referees.
Ascensão, F., Fahrig, L., Clevenger, A. P., Corlett, R. T., Jaeger, J. A. G., Laurance, W. F., and Pereira, H. M.: Environmental challenges for the Belt and Road Initiative, Nat. Sustain., 1, 206–209, https://doi.org/10.1038/s41893-018-0059-3, 2018.
Burnett, R., Chen, H., Szyszkowicz, M., Fann, N., Hubbell, B., Pope, C. A., Apte, J. S., Brauer, M., Cohen, A., Weichenthal, S., Coggins, J., Di, Q., Brunekreef, B., Frostad, J., Lim, S. S., Kan, H., Walker, K. D., Thurston, G. D., Hayes, R. B., Lim, C. C., Turner, M. C., Jerrett, M., Krewski, D., Gapstur, S. M., Diver, W. R., Ostro, B., Goldberg, D., Crouse, D. L., Martin, R. V., Peters, P., Pinault, L., Tjepkema, M., Van Donkelaar, A., Villeneuve, P. J., Miller, A. B., Yin, P., Zhou, M., Wang, L., Janssen, N. A. H., Marra, M., Atkinson, R. W., Tsang, H., Thach, T. Q., Cannon, J. B., Allen, R. T., Hart, J. E., Laden, F., Cesaroni, G., Forastiere, F., Weinmayr, G., Jaensch, A., Nagel, G., Concin, H., and Spadaro, J. V.: Global estimates of mortality associated with longterm exposure to outdoor fine particulate matter, P. Natl. Acad. Sci. USA, 115, 9592–9597, https://doi.org/10.1073/pnas.1803222115, 2018.
Burtraw, D., Domeshek, M., Shih, J. S., Villanueva, S., and Lambert, K. F.: The Distribution of Air Quality Health Benefits from Meeting US 2030, Resources for the Future, https://media.rff.org/documents/Air_Quality_Two-pager_-_Burtraw_et_al..pdf (last access: 6 September 2023), 2022.
Cheng, J., Tong, D., Liu, Y., Yu, S., Yan, L., Zheng, B., Geng, G., He, K., and Zhang, Q.: Comparison of Current and Future PM2.5 Air Quality in China Under CMIP6 and DPEC Emission Scenarios, Geophys. Res. Lett., 48, 1–11, https://doi.org/10.1029/2021GL093197, 2021a.
Cheng, J., Tong, D., Zhang, Q., Liu, Y., Lei, Y., Yan, G., Yan, L., Yu, S., Cui, R. Y., Clarke, L., Geng, G., Zheng, B., Zhang, X., Davis, S. J., and He, K.: Pathways of China's PM2.5 air quality 2015–2060 in the context of carbon neutrality, Natl. Sci. Rev., 8, nwab078, https://doi.org/10.1093/nsr/nwab078, 2021b.
Dür, A., Eckhardt, J., and Poletti, A.: Global value chains, the anti-globalization backlash, and EU trade policy: a research agenda, J. Eur. Public Policy, 27, 944–956, https://doi.org/10.1080/13501763.2019.1619802, 2020.
European Commission: The Third Clean Air Outlook, European Commission, Report No. 52022DC0673, https://eur-lex.europa.eu/legal-content/EN/TXT/?uri=COM%3A2022%3A673%3AFIN&qid=1670510444610#document1 (last access: 6 September 2023), 2022.
GBD 2019 Risk Factors Collaborators: Global burden of 87 risk factors in 204 countries and territories, 1990–2019: a systematic analysis for the Global Burden of Disease Study 2019, Lancet, 396, 1223–1249, https://doi.org/10.1016/S0140-6736(20)30752-2, 2020.
Geng, G., Zheng, Y., Zhang, Q., Xue, T., Zhao, H., Tong, D., Zheng, B., Li, M., Liu, F., Hong, C., He, K., and Davis, S. J.: Drivers of PM2.5 air pollution deaths in China 2002–2017, Nat. Geosci., 14, 645–650, https://doi.org/10.1038/s41561-021-00792-3, 2021.
Gidden, M.: Aneris: Harmonization for Integrated Assessment Models, International Institute for Applied Systems Analysis (IIASA) [code], http://software.ene.iiasa.ac.at/aneris/, last access: 6 September 2023.
Gidden, M. J., Riahi, K., Smith, S. J., Fujimori, S., Luderer, G., Kriegler, E., van Vuuren, D. P., van den Berg, M., Feng, L., Klein, D., Calvin, K., Doelman, J. C., Frank, S., Fricko, O., Harmsen, M., Hasegawa, T., Havlik, P., Hilaire, J., Hoesly, R., Horing, J., Popp, A., Stehfest, E., and Takahashi, K.: Global emissions pathways under different socioeconomic scenarios for use in CMIP6: a dataset of harmonized emissions trajectories through the end of the century, Geosci. Model Dev., 12, 1443–1475, https://doi.org/10.5194/gmd-12-1443-2019, 2019.
Hoesly, R. M., Smith, S. J., Feng, L., Klimont, Z., Janssens-Maenhout, G., Pitkanen, T., Seibert, J. J., Vu, L., Andres, R. J., Bolt, R. M., Bond, T. C., Dawidowski, L., Kholod, N., Kurokawa, J.-I., Li, M., Liu, L., Lu, Z., Moura, M. C. P., O'Rourke, P. R., and Zhang, Q.: Historical (1750–2014) anthropogenic emissions of reactive gases and aerosols from the Community Emissions Data System (CEDS), Geosci. Model Dev., 11, 369–408, https://doi.org/10.5194/gmd-11-369-2018, 2018.
Hong, C., Zhang, Q., Zhang, Y., Davis, S. J., Tong, D., Zheng, Y., Liu, Z., Guan, D., He, K., and Schellnhuber, H. J.: Impacts of climate change on future air quality and human health in China, P. Natl. Acad. Sci. USA, 116, 17193–17200, https://doi.org/10.1073/pnas.1812881116, 2019.
Huang, J., Qin, D., Jiang, T., Wang, Y., Feng, Z., Zhai, J., Cao, L., Chao, Q., Xu, X., Wang, G., and Su, B.: Effect of Fertility Policy Changes on the Population Structure and Economy of China: From the Perspective of the Shared Socioeconomic Pathways, Earth's Futur., 7, 250–265, https://doi.org/10.1029/2018EF000964, 2019.
Hughes, B. B., Kuhn, R., Peterson, C. M., Rothman, D. S., Solórzano, J. R., Mathers, C. D., and Dickson, J. R.: Projections of global health outcomes from 2005 to 2060 using the International Futures integrated forecasting model, Bull. World Health Organ., 89, 478–486, https://doi.org/10.2471/BLT.10.083766, 2011.
Institute for Health Metrics and Evaluation: Findings from the Global Burden of Disease Study 2017, Institute for Health Metrics and Evaluation (IHME), Seattle, WA, https://www.healthdata.org/sites/default/files/files/policy_report/2019/GBD_2017_Booklet.pdf (last access: 6 September 2023), 2018.
Institute for Health Metrics and Evaluation: Global Burden of Disease 2017, University of Washington [data set], https://gbd2017.healthdata.org/gbd-results/, last access: 6 September 2023.
International Energy Agency (IEA): World Energy Outlook, IEA/OECD, https://www.iea.org/reports/world-energy-outlook-2021 (last access: 21 November 2022), 2021.
International Futures: Future baseline mortality rate projection, International Futures (IFs) [data set], https://www.ifs.du.edu/ifs/frm_MainMenu.aspx, last access: 6 September 2023.
Jiang, H., Liao, H., Pye, H. O. T., Wu, S., Mickley, L. J., Seinfeld, J. H., and Zhang, X. Y.: Projected effect of 2000–2050 changes in climate and emissions on aerosol levels in China and associated transboundary transport, Atmos. Chem. Phys., 13, 7937–7960, https://doi.org/10.5194/acp-13-7937-2013, 2013.
Jiang, T., Su, B., Wang, Y., Huang, J., Jing, C., Gao, M., Wang, G., Lin, Q., Jiang, S., Liu, S., and Luo, Y.: Gridded datasets for population and economy under Shared Socioeconomic Pathways, Science Data Bank [data set], https://doi.org/10.57760/sciencedb.01683, 2022.
Koplitz, S. N., Jacob, D. J., Sulprizio, M. P., Myllyvirta, L., and Reid, C.: Burden of Disease from Rising Coal-Fired Power Plant Emissions in Southeast Asia, Environ. Sci. Technol., 51, 1467–1476, https://doi.org/10.1021/acs.est.6b03731, 2017.
Leibensperger, E. M., Mickley, L. J., Jacob, D. J., and Barrett, S. R. H.: Intercontinental influence of NOx and CO emissions on particulate matter air quality, Atmos. Environ., 45, 3318–3324, https://doi.org/10.1016/j.atmosenv.2011.02.023, 2011.
Liu, S., Xing, J., Wang, S., Ding, D., Cui, Y., and Hao, J.: Health Benefits of Emission Reduction under 1.5 ∘C Pathways Far Outweigh Climate-Related Variations in China, Environ. Sci. Technol., 55, 10957–10966, https://doi.org/10.1021/acs.est.1c01583, 2021.
Luo, G., Yu, F., and Moch, J. M.: Further improvement of wet process treatments in GEOS-Chem v12.6.0: impact on global distributions of aerosols and aerosol precursors, Geosci. Model Dev., 13, 2879–2903, https://doi.org/10.5194/gmd-13-2879-2020, 2020.
McDuffie, E. E., Smith, S. J., O'Rourke, P., Tibrewal, K., Venkataraman, C., Marais, E. A., Zheng, B., Crippa, M., Brauer, M., and Martin, R. V.: A global anthropogenic emission inventory of atmospheric pollutants from sector- and fuel-specific sources (1970–2017): an application of the Community Emissions Data System (CEDS), Earth Syst. Sci. Data, 12, 3413–3442, https://doi.org/10.5194/essd-12-3413-2020, 2020.
MEIC team: Multi-resolution Emission Inventory model for Climate and air pollution research, Department of Earth System Science, Tsinghua University, http://meicmodel.org.cn/?page_id=2351&lang=en#firstPage, last access: 6 September 2023.
Ni, R., Lin, J., Yan, Y., and Lin, W.: Foreign and domestic contributions to springtime ozone over China, Atmos. Chem. Phys., 18, 11447–11469, https://doi.org/10.5194/acp-18-11447-2018, 2018.
O'Neill, B. C., Kriegler, E., Riahi, K., Ebi, K. L., Hallegatte, S., Carter, T. R., Mathur, R., and van Vuuren, D. P.: A new scenario framework for climate change research: The concept of shared socioeconomic pathways, Clim. Change, 122, 387–400, https://doi.org/10.1007/s10584-013-0905-2, 2014.
O'Neill, B. C., Carter, T. R., Ebi, K., Harrison, P. A., Kemp-Benedict, E., Kok, K., Kriegler, E., Preston, B. L., Riahi, K., Sillmann, J., van Ruijven, B. J., van Vuuren, D., Carlisle, D., Conde, C., Fuglestvedt, J., Green, C., Hasegawa, T., Leininger, J., Monteith, S., and Pichs-Madruga, R.: Achievements and needs for the climate change scenario framework, Nat. Clim. Chang., 10, 1074–1084, https://doi.org/10.1038/s41558-020-00952-0, 2020.
Pai, S. J., Heald, C. L., Pierce, J. R., Farina, S. C., Marais, E. A., Jimenez, J. L., Campuzano-Jost, P., Nault, B. A., Middlebrook, A. M., Coe, H., Shilling, J. E., Bahreini, R., Dingle, J. H., and Vu, K.: An evaluation of global organic aerosol schemes using airborne observations, Atmos. Chem. Phys., 20, 2637–2665, https://doi.org/10.5194/acp-20-2637-2020, 2020.
Rao, S., Klimont, Z., Smith, S. J., Van Dingenen, R., Dentener, F., Bouwman, L., Riahi, K., Amann, M., Bodirsky, B. L., van Vuuren, D. P., Aleluia Reis, L., Calvin, K., Drouet, L., Fricko, O., Fujimori, S., Gernaat, D., Havlik, P., Harmsen, M., Hasegawa, T., Heyes, C., Hilaire, J., Luderer, G., Masui, T., Stehfest, E., Strefler, J., van der Sluis, S., and Tavoni, M.: Future air pollution in the Shared Socio-economic Pathways, Glob. Environ. Chang., 42, 346–358, https://doi.org/10.1016/j.gloenvcha.2016.05.012, 2017.
Riahi, K., van Vuuren, D. P., Kriegler, E., Edmonds, J., O'Neill, B. C., Fujimori, S., Bauer, N., Calvin, K., Dellink, R., Fricko, O., Lutz, W., Popp, A., Cuaresma, J. C., KC, S., Leimbach, M., Jiang, L., Kram, T., Rao, S., Emmerling, J., Ebi, K., Hasegawa, T., Havlik, P., Humpenöder, F., Da Silva, L. A., Smith, S., Stehfest, E., Bosetti, V., Eom, J., Gernaat, D., Masui, T., Rogelj, J., Strefler, J., Drouet, L., Krey, V., Luderer, G., Harmsen, M., Takahashi, K., Baumstark, L., Doelman, J. C., Kainuma, M., Klimont, Z., Marangoni, G., Lotze-Campen, H., Obersteiner, M., Tabeau, A., and Tavoni, M.: The Shared Socioeconomic Pathways and their energy, land use, and greenhouse gas emissions implications: An overview, Glob. Environ. Chang., 42, 153–168, https://doi.org/10.1016/j.gloenvcha.2016.05.009, 2017.
Samir, K. C. and Lutz, W.: The human core of the shared socioeconomic pathways: Population scenarios by age, sex and level of education for all countries to 2100, Glob. Environ. Chang., 42, 181–192, https://doi.org/10.1016/j.gloenvcha.2014.06.004, 2017.
Silva, R. A., West, J. J., Lamarque, J. F., Shindell, D. T., Collins, W. J., Faluvegi, G., Folberth, G. A., Horowitz, L. W., Nagashima, T., Naik, V., Rumbold, S. T., Sudo, K., Takemura, T., Bergmann, D., Cameron-Smith, P., Doherty, R. M., Josse, B., MacKenzie, I. A., Stevenson, D. S., and Zeng, G.: Future global mortality from changes in air pollution attributable to climate change, Nat. Clim. Chang., 7, 647–651, https://doi.org/10.1038/nclimate3354, 2017.
Smith, S. J., Ahsan, H., and Mott, A.: CEDS v_2021_04_21 gridded emissions data, DataHub [data set], https://doi.org/10.25584/PNNLDataHub/1779095, last access: 6 September 2023.
Tang, R., Zhao, J., Liu, Y., Huang, X., Nielsen, C. P., Wang, H., Zhou, D., and Ding, A.: Air quality and health co-benefits of China's carbon dioxide emissions peaking before 2030, Nat. Commun., 13, 1008, https://doi.org/10.1038/s41467-022-28672-3, 2022.
The International GEOS-Chem User Community: geoschem/GCClassic: GEOS-Chem 13.2.1, Zenodo [code], https://doi.org/10.5281/zenodo.5500717, 2021.
The State Council of the People's Republic of China: The thirteenth Five-Year Plan, The State Council of the People's Republic of China, http://www.gov.cn/xinwen/2016-03/17/content_5054992.htm (last access: 6 September 2023), 2016 (in Chinese).
Tong, D., Cheng, J., Liu, Y., Yu, S., Yan, L., Hong, C., Qin, Y., Zhao, H., Zheng, Y., Geng, G., Li, M., Liu, F., Zhang, Y., Zheng, B., Clarke, L., and Zhang, Q.: Dynamic projection of anthropogenic emissions in China: methodology and 2015–2050 emission pathways under a range of socio-economic, climate policy, and pollution control scenarios, Atmos. Chem. Phys., 20, 5729–5757, https://doi.org/10.5194/acp-20-5729-2020, 2020.
Turnock, S. T., Allen, R. J., Andrews, M., Bauer, S. E., Deushi, M., Emmons, L., Good, P., Horowitz, L., John, J. G., Michou, M., Nabat, P., Naik, V., Neubauer, D., O'Connor, F. M., Olivié, D., Oshima, N., Schulz, M., Sellar, A., Shim, S., Takemura, T., Tilmes, S., Tsigaridis, K., Wu, T., and Zhang, J.: Historical and future changes in air pollutants from CMIP6 models, Atmos. Chem. Phys., 20, 14547–14579, https://doi.org/10.5194/acp-20-14547-2020, 2020.
van Vuuren, D. P., Kriegler, E., O'Neill, B. C., Ebi, K. L., Riahi, K., Carter, T. R., Edmonds, J., Hallegatte, S., Kram, T., Mathur, R., and Winkler, H.: A new scenario framework for Climate Change Research: Scenario matrix architecture, Clim. Change, 122, 373–386, https://doi.org/10.1007/s10584-013-0906-1, 2014.
van Vuuren, D. P., Stehfest, E., Gernaat, D. E. H. J., Doelman, J. C., van den Berg, M., Harmsen, M., de Boer, H. S., Bouwman, L. F., Daioglou, V., Edelenbosch, O. Y., Girod, B., Kram, T., Lassaletta, L., Lucas, P. L., van Meijl, H., Müller, C., van Ruijven, B. J., van der Sluis, S., and Tabeau, A.: Energy, land-use and greenhouse gas emissions trajectories under a green growth paradigm, Glob. Environ. Chang., 42, 237–250, https://doi.org/10.1016/j.gloenvcha.2016.05.008, 2017.
WHO: WHO Global Air Quality Guidelines: Particulate Matter (PM2.5 and PM10), Ozone, Nitrogen Dioxide, Sulfur Dioxide and Carbon Monoxide, World Health Organization, Geneva, ISBN 978924003422, 2021.
Xing, J., Lu, X., Wang, S., Wang, T., Ding, D., Yu, S., Shindell, D., Ou, Y., Morawska, L., Li, S., Ren, L., Zhang, Y., Loughlin, D., Zheng, H., Zhao, B., Liu, S., Smith, K. R., and Hao, J.: The quest for improved air quality may push China to continue its CO2 reduction beyond the Paris Commitment, P. Natl. Acad. Sci. USA, 117, 29535–29542, https://doi.org/10.1073/pnas.2013297117, 2020.
Xu, J.-W., Lin, J., Luo, G., Adeniran, J., and Kong, H.: Foreign emissions exacerbate PM2.5 pollution in China through nitrate chemistry, Atmos. Chem. Phys., 23, 4149–4163, https://doi.org/10.5194/acp-23-4149-2023, 2023.
Yang, H., Huang, X., Westervelt, D. M., Horowitz, L., and Peng, W.: Socio-demographic factors shaping the future global health burden from air pollution, Nat. Sustain., 11, 58–68 https://doi.org/10.1038/s41893-022-00976-8, 2022.
Zhang, Q., Zheng, Y., Tong, D., Shao, M., Wang, S., Zhang, Y., Xu, X., Wang, J., He, H., Liu, W., Ding, Y., Lei, Y., Li, J., Wang, Z., Zhang, X., Wang, Y., Cheng, J., Liu, Y., Shi, Q., Yan, L., Geng, G., Hong, C., Li, M., Liu, F., Zheng, B., Cao, J., Ding, A., Gao, J., Fu, Q., Huo, J., Liu, B., Liu, Z., Yang, F., He, K., and Hao, J.: Drivers of improved PM2.5 air quality in China from 2013 to 2017, P. Natl. Acad. Sci. USA, 116, 24463–24469, https://doi.org/10.1073/pnas.1907956116, 2019.
Zhang, Y.-L. and Cao, F.: Fine particulate matter (PM2.5) in China at a city level, Sci. Rep., 5, 14884, https://doi.org/10.1038/srep14884, 2015.
Zheng, B., Chevallier, F., Ciais, P., Yin, Y., Deeter, M. N., Worden, H. M., Wang, Y., Zhang, Q., and He, K.: Rapid decline in carbon monoxide emissions and export from East Asia between years 2005 and 2016, Environ. Res. Lett., 13, 044007, https://doi.org/10.1088/1748-9326/aab2b3, 2018a.
Zheng, B., Tong, D., Li, M., Liu, F., Hong, C., Geng, G., Li, H., Li, X., Peng, L., Qi, J., Yan, L., Zhang, Y., Zhao, H., Zheng, Y., He, K., and Zhang, Q.: Trends in China's anthropogenic emissions since 2010 as the consequence of clean air actions, Atmos. Chem. Phys., 18, 14095–14111, https://doi.org/10.5194/acp-18-14095-2018, 2018b.