the Creative Commons Attribution 4.0 License.
the Creative Commons Attribution 4.0 License.
 | 29 Jul 2022
Oxygenated volatile organic compounds (VOCs) as significant but varied contributors to VOC emissions from vehicles
Sihang Wang
Caihong Wu
Chaomin Wang
Tiange Li
Xianjun He
Yibo Huangfu
Jipeng Qi
Xiao-Bing Li
Qing'e Sha
Manni Zhu
Shengrong Lou
Hongli Wang
Thomas Karl
Martin Graus
Zibing Yuan
Min Shao
Vehicular emissions are an important source for volatile organic compounds (VOCs) in urban and downwind regions. In this study, we conducted a chassis dynamometer study to investigate VOC emissions from vehicles using gasoline, diesel, and liquefied petroleum gas (LPG) as fuel. Time-resolved VOC emissions from vehicles are chemically characterized by a proton-transfer-reaction time-of-flight mass spectrometer (PTR-ToF-MS) with high frequency. Our results show that emission factors of VOCs generally decrease with the improvement of emission standards for gasoline vehicles, whereas variations in emission factors for diesel vehicles with emission standards are more diverse. Mass spectrum analysis of the PTR-ToF-MS suggests that cold starts significantly influence VOC emissions of gasoline vehicles, while the influences are less important for diesel vehicles. Large differences in VOC emissions between gasoline and diesel vehicles are observed with emission factors of most VOC species from diesel vehicles being higher than gasoline vehicles, especially for most oxygenated volatile organic compounds (OVOCs) and heavier aromatics. These results indicate quantification of heavier species by the PTR-ToF-MS may be important in the characterization of vehicular exhausts. Our results suggest that VOC pairs (e.g., C14 aromatics / toluene ratio) could potentially provide good indicators for distinguishing emissions from gasoline and diesel vehicles. The fractions of OVOCs in total VOC emissions are determined by combining measurements of hydrocarbons from canisters and online observations of the PTR-ToF-MS. We show that OVOCs contribute 9.4 % ± 5.6 % of total VOC emissions for gasoline vehicles, while the fractions are significantly higher for diesel vehicles (52 %–71 %), highlighting the importance of detecting these OVOC species in diesel emissions. Our study demonstrated that the large number of OVOC species measured by the PTR-ToF-MS are important in the characterization of VOC emissions from vehicles.
- Article
(6291 KB) - Full-text XML
-
Supplement
(4632 KB) - BibTeX
- EndNote


Volatile organic compounds (VOCs) are important trace components in the troposphere, as important precursors of ground-level ozone (Shao et al., 2009) and secondary organic aerosol (SOA) (Seinfeld and Pandis, 2006; Kansal, 2009; Ziemann and Atkinson, 2012). As a result, it is particularly important to identify emission sources of VOCs in the atmosphere. Vehicular emissions are an important source of VOCs in cities around the world (Liu et al., 2008; Parrish et al., 2009), contributing approximately 25 % of total VOC emissions in China (Ou et al., 2015; Wu et al., 2016; Sun et al., 2018). In order to control atmospheric pollution in urban and surrounding regions, it is necessary to understand source profiles and emission characteristics of VOCs from vehicles.
Emissions of VOCs from vehicles have been investigated extensively from tunnel studies (Cui et al., 2018; Zhang et al., 2018; Song et al., 2020), on-road mobile measurements (Li et al., 2017), and chassis dynamometer tests (Guo et al., 2011; Wang et al., 2013; Yang et al., 2018). Previous studies demonstrated that fuel types of vehicles strongly impact VOC emissions. Aromatics along with other hydrocarbons are known as compounds with high emissions in exhausts of gasoline vehicles (Wang et al., 2013; Ly et al., 2020). Some carbonyl compounds contribute significantly to emissions of diesel vehicles, at fractions much higher than gasoline vehicles (Tsai et al., 2012; Qiao et al., 2012; Yao et al., 2015; Mo et al., 2016). Moreover, there are still a large number of unidentifiable compounds in diesel vehicles (May et al., 2014). Furthermore, VOC emissions from vehicles significantly decreased in China due to stricter emission standards (Liu et al., 2017; Sha et al., 2021). In order to reduce emissions of most primary pollutants, more stringent emission standards and after-treatment devices have been implemented. The emission standard of China VI was already implemented in July of 2019 in a few key cities in China and in July of 2021 nationwide. The emission limits for various air pollutants emitted by vehicles are significantly lower under the China VI emission standard (see details in the Supplement) (Wu et al., 2017). With the continuous development of engine and exhaust after-treatment technologies, emission characteristics of VOCs from vehicles may change and need to be frequently updated.
Oxygenated volatile organic compounds (OVOCs) were found to be an important class of compounds in vehicle exhausts, accounting for more than 50 % of the total VOC emissions for diesel vehicles from both chassis dynamometer tests (Schauer et al., 1999; Mo et al., 2016) and on-road mobile measurements (Yao et al., 2015). Traditionally, VOCs are collected in the canister or Tedlar bags, and then analyzed by a gas chromatograph mass spectrometer and flame ionization detector (GC-MS/FID), mainly reporting emissions of hydrocarbons (Wang et al., 2017; Qi et al., 2019). Previous work usually collected 2,4-dinitrophenylhydrazine (DNPH) cartridges and analyzed them using high-performance liquid chromatography (HPLC) for carbonyls (aldehydes and ketones), which are both time-consuming and prone to contaminations (Mo et al., 2016; Han et al., 2019).
The large variability in VOC emissions under different engine activities or driving conditions requires the characterization of vehicular emissions at a higher time resolution. A proton-transfer-reaction mass spectrometer (PTR-MS) has been used in a number of studies for measurements of vehicle emissions. VOCs from vehicle exhausts under various driving and operational modes were measured by PTR-MS on board a mobile laboratory (Zavala et al., 2006, 2009). Drozd et al. (2016) used a PTR-MS to emphasize the importance of cold starts for vehicles, concluding that VOC emissions during cold starts were equal to a 200 mi (320 km) distance of driving during the hot stabilized condition. A proton-transfer-reaction time-of-flight mass spectrometer (PTR-ToF-MS) can provide more powerful detection of various VOCs, thanks to the measurements of whole mass spectra and high mass resolution (Cappellin et al., 2012; Yuan et al., 2017). More OVOC species could be quantified from the measured mass spectra based on parameterization methods for the sensitivity of the instrument (Sekimoto et al., 2017; Wu et al., 2020).
In this study, we applied a PTR-ToF-MS along with a suite of other instruments to measure VOCs emitted from gasoline, diesel, and liquefied petroleum gas (LPG) vehicles. We investigated emission factors from different fuel types and emission standards for representative VOC species exhausted from these vehicles. We used the dataset to analyze contributions of various VOC groups to total VOC emissions in different types of vehicles.
2.1 Tested vehicles and the chassis dynamometer study methods
In this study, we conducted chassis dynamometer measurements to investigate VOC emissions from vehicles using gasoline, diesel, and LPG as fuel. All gasoline vehicles are light-duty gasoline vehicles (LDGVs) with the emission standards from China I to China VI, whereas diesel vehicles can be classified into light-duty diesel truck (LDDT), middle-duty diesel truck (MDDT), heavy-duty diesel truck (HDDT), and bus (BUS) associated with the emission standards of China III to China V. In addition, the test vehicles using LPG are all taxis, which are under mandatory scrappage after 8 years of driving in China; as a result only China IV and China V for LPG vehicles were tested. After-treatment devices commonly used in light-duty gasoline vehicles are three-way catalyst (TWC) and gasoline particulate filter (GPF) (Lyu et al., 2020). These devices have been improved with the stricter emission standards. For diesel vehicles, typical after-treatment devices include diesel oxidation catalyst (DOC), diesel particulate filter (DPF), and selective catalyst reduction (SCR) (Zhou et al., 2019; Lyu et al., 2020; Shen et al., 2021). The diesel vehicles for China III or prior do not have any after-treatment devices. The LDDT used DOC and DOC + DPF as after-treatment devices in China IV and V diesel vehicles, respectively. SCR devices are mainly used for heavy-duty diesel trucks (HDDTs) with China IV and V as after-treatment devices. The fractions of gasoline and diesel vehicles with different emission standards in China are shown in Table S1 in the Supplement (MEEPRC, 2019; Li et al., 2021). Among the 38 vehicles we tested, a fraction of vehicles was measured several times, with a total of 62 experiments measured. The detailed information for test vehicles is summarized in Sect. S1 in the Supplement and Tables S2 and S3.
The short transient driving cycle (GB 18285-2018, Fig. S1a in the Supplement), as one of the widely used test methods for vehicle emissions in China (Li et al., 2012; Wang et al., 2013), was used for measurements of gasoline vehicles and LDDTs, each running three to five times. The short transient driving cycle methods were initially adapted based on emission regulations of the Economic Commission for Europe (ECE) cycle (Yao et al., 2003), which is developed and used in European countries (Laurikko, 1995). The short transient driving cycle consists of four conditions, namely idling, acceleration, deceleration, and uniform speed, as shown in Fig. S1. For the MDDT and HDDT, we customized a step-by-step test method, in which the vehicle accelerates to 20, 40, and 60 km h−1 in sequence after the engine activates, remaining at 20 and 40 km h−1 for 2 min and 60 km h−1 for 1 min, respectively (Fig. S1) (Li et al., 2021; Liu et al., 2021; Liao et al., 2021). In addition, the cold start was tested for a number of vehicles after a cold soak for more than 12 h at ambient temperature (20–25∘) before the engine start-up. The measurements of cold starts are compared to measurements of hot starts after a ∼10 min break for the vehicles after previous measurement. More details about cold starts and hot starts in this campaign can be found in Li et al. (2021).
A custom-built sampling and dilution system for vehicles combining online and offline sampling techniques was used in this study. As shown in Fig. S2, a portable emission measurement system (PEMS; SEMTECH-DS, Sensors Inc., USA) was employed to measure emissions of CO, CO2, NOx, and total hydrocarbon (THC) directly from the tailpipe of vehicles. A custom-built dilution system (Li et al., 2021; Liao et al., 2021) was used for dilution of vehicular emissions, achieving dilution ratios of 10–100 for different vehicles. After dilution, CO2 and CO were measured using a LI-840A gas analyzer (LI-COR, Inc., USA) and a Thermo 48i-TLE analyzer (Thermo Fisher Scientific Inc., USA), respectively. Measurements of CO2 before and after the dilution system were used to determine the dilution ratio for each test (see details in Fig. S3).
2.2 VOC measurements using a PTR-ToF-MS
In this study, a proton-transfer-reaction quadrupole interface time-of-flight mass spectrometer (PTR-QiToF-MS) (IONICON Analytik, Innsbruck, Austria) with H3O+ chemistry was used to measure VOCs (Sulzer et al., 2014). The mass spectra of the PTR-ToF-MS were recorded every 1 s to capture characteristics of VOC species from vehicle exhausts in real time. Background measurements of the instrument were performed using sampled air through a custom-built platinum catalytical converter heated to 365 ∘C for 30 s before vehicle starts in each test. The more detailed setting parameters for the instrument can be found elsewhere (Wu et al., 2020; C. Wang et al., 2020; He et al., 2022). Data analysis of the PTR-ToF-MS was performed using the Tofware software package (version 3.0.3, Tofwerk AG, Switzerland) (Stark et al., 2015).
A 23-component gas standard (Linde Spectra) was used for daily calibration of the PTR-ToF-MS during the campaign. VOC sensitivities from automatical calibrations indicated quite stable instrumental performance for most of the VOC species (Fig. S4). Another gas standard with 35-component VOCs (Apel Riemer Environmental Inc.) was used for calibrations during the later period of this campaign to include more VOC species in the calibration. The liquid calibration unit (LCU; IONICON Analytik, Innsbruck, Austria) was used to calibrate a total of 11 organic acids and nitrogen-containing species (Table S4). The limits of detection for calibrated VOC species are below 100 ppt (parts per trillion) for the 1 s measurement, except for ethanol (423 ppt) and formic acid (166 ppt). Additionally, the humidity dependence for a few VOC species in the PTR-ToF-MS (Yuan et al., 2017; Koss et al., 2018) was corrected using humidity-dependence curves determined in the laboratory, as previously shown in Wu et al. (2020). To quantify the ion signals without calibration, we determine the sensitivities based on the kinetics of proton-transfer reactions of H3O+ with VOCs (Cappellin et al., 2012; Sekimoto et al., 2017). The relationship between VOCs sensitivity and kinetic rate constants for the same instrument has been reported in Wu et al. (2020) and He et al. (2022). The corrected sensitivities as a function of kinetic rate constants for proton-transfer reactions of H3O+ with VOCs during this campaign are shown in Fig. S5. The fitted line is used to determine sensitivities of uncalibrated species, and the uncertainty of the concentrations for uncalibrated species is determined to be around 50 %.
2.3 Other VOC measurements
Whole air samples were collected using canisters after the dilution system for determination of hydrocarbons emitted from various vehicles. All the canisters were sent to the laboratory for analysis by an offline GC-MS/FID system, with a total of 95 hydrocarbons calibrated by Photochemical Assessment Monitoring Stations (PAMS) and TO-15 standard mixtures (Table S5). We compared emission factors from the PTR-ToF-MS and the offline canister GC-MS/FID (Fig. S6c and d), obtaining generally consistent results, considering the large variation in VOC emissions for driving conditions and the difficulty to control the fill time for canisters.
An instrument based on the Hantzsch reaction–absorption method was used to measure formaldehyde (Zhu et al., 2020). Good agreement for formaldehyde between the PTR-ToF-MS and the Hantzsch instrument was obtained (Fig. S6a). An iodide-adduct time-of-flight chemical ionization mass spectrometer (I− ToF-CIMS; Aerodyne Research, Inc.) (Z. Wang et al., 2020; Ye et al., 2021) was used to measure organic acids, hydrogen cyanide (HCN), and isocyanic acid (HNCO) from vehicles (Li et al., 2021). As shown in Fig. S6b, formic acid measured by the PTR-ToF-MS and I− ToF-CIMS showed reasonable agreement.
2.4 Emission factors and emission ratios calculation
In this study, we determine emission factors of VOC species in two different approaches: the mileage-based emission factors (mg km−1) as the mass of these VOCs exhausted per kilometer of driving, and the fuel-based emission factors (mg kg) as the mass of VOCs per kilogram of fuel burned by the vehicles. In addition, emission ratios of VOCs to combustion tracers (usually CO) are widely applied in vehicle emissions in urban regions; as a result we determine emission ratios to CO in parts per billion per parts per million (ppb ppm−1) as well. More details about the determination of emission factors and emission ratios can be found in Sect. S2.
The average emission factors for various types of vehicles are determined from arithmetic means for different emission standards of vehicles. As for diesel vehicles, the average emission factors are obtained from the arithmetic means of LDDT, MDDT, HDDT, and BUS. Besides, we also calculate emission factors and emission ratios from weighted means based on the fractions of gasoline and diesel vehicles with different emission standards in China (MEEPRC, 2019; Li et al., 2021) (see Sect. S2 for details). In order to evaluate the uncertainties of obtained emission factors, the average limit of detection for VOC species are used to estimate the limit of detection for the determined emission factors (more details can be found in Sect. S3).
3.1 Characteristics of the VOC emissions in the vehicles
Time series of several aromatics and OVOC species measured by the PTR-ToF-MS for a selected gasoline vehicle associated with the emission standard of China I and a LDDT associated with the China IV emission standard are shown in Fig. 1. Both tests started with cold engines of the two vehicles. Benzene and toluene are typical aromatic species emitted by vehicles. As shown in Fig. 1a, high concentrations of benzene and toluene exhausted by the gasoline vehicle were observed as the engine start-up. The concentrations of the two species continued to increase until ∼2 min after the engine start-up, and then dropped rapidly before a minor increase during the acceleration condition. These observations are similar to the previous results from PTR-MS measurements in Drozd et al. (2016). Acetaldehyde and acetone are important OVOC species emitted from vehicles. They show similar temporal variations as benzene and toluene. However, concentrations of acetaldehyde and acetone were much lower than the two aromatics after engine start-up. Compared to the concentrations at engine start-up for the gasoline vehicle (the first cycle), concentrations of the VOCs are 3.0 to 40 times lower during the gasoline vehicle running at the hot stabilized condition (the third cycle). As shown in Fig. 1 for the diesel vehicle, enhanced emissions from cold starts are minor, which is different from the gasoline vehicle. The concentrations of these VOCs at engine start-up for the diesel vehicle are only 1.3 to 2.5 times higher than the periods with the diesel vehicle running at the hot stabilized condition. It indicates that the impact of the engine start-up on emissions in diesel vehicles is much lower than gasoline vehicles. This may be explained by a combined effect of cold engine and operation temperature of the after-treatment device (Gentner et al., 2017; George et al., 2015). In contrast to the gasoline vehicle, we observe higher concentrations of the two OVOC species than the two aromatic species, namely benzene and toluene, from the diesel vehicle. These higher OVOC concentrations in diesel vehicle exhausts are in line with the higher observations of organic acids using the I− ToF-CIMS from the same campaign (Li et al., 2021).
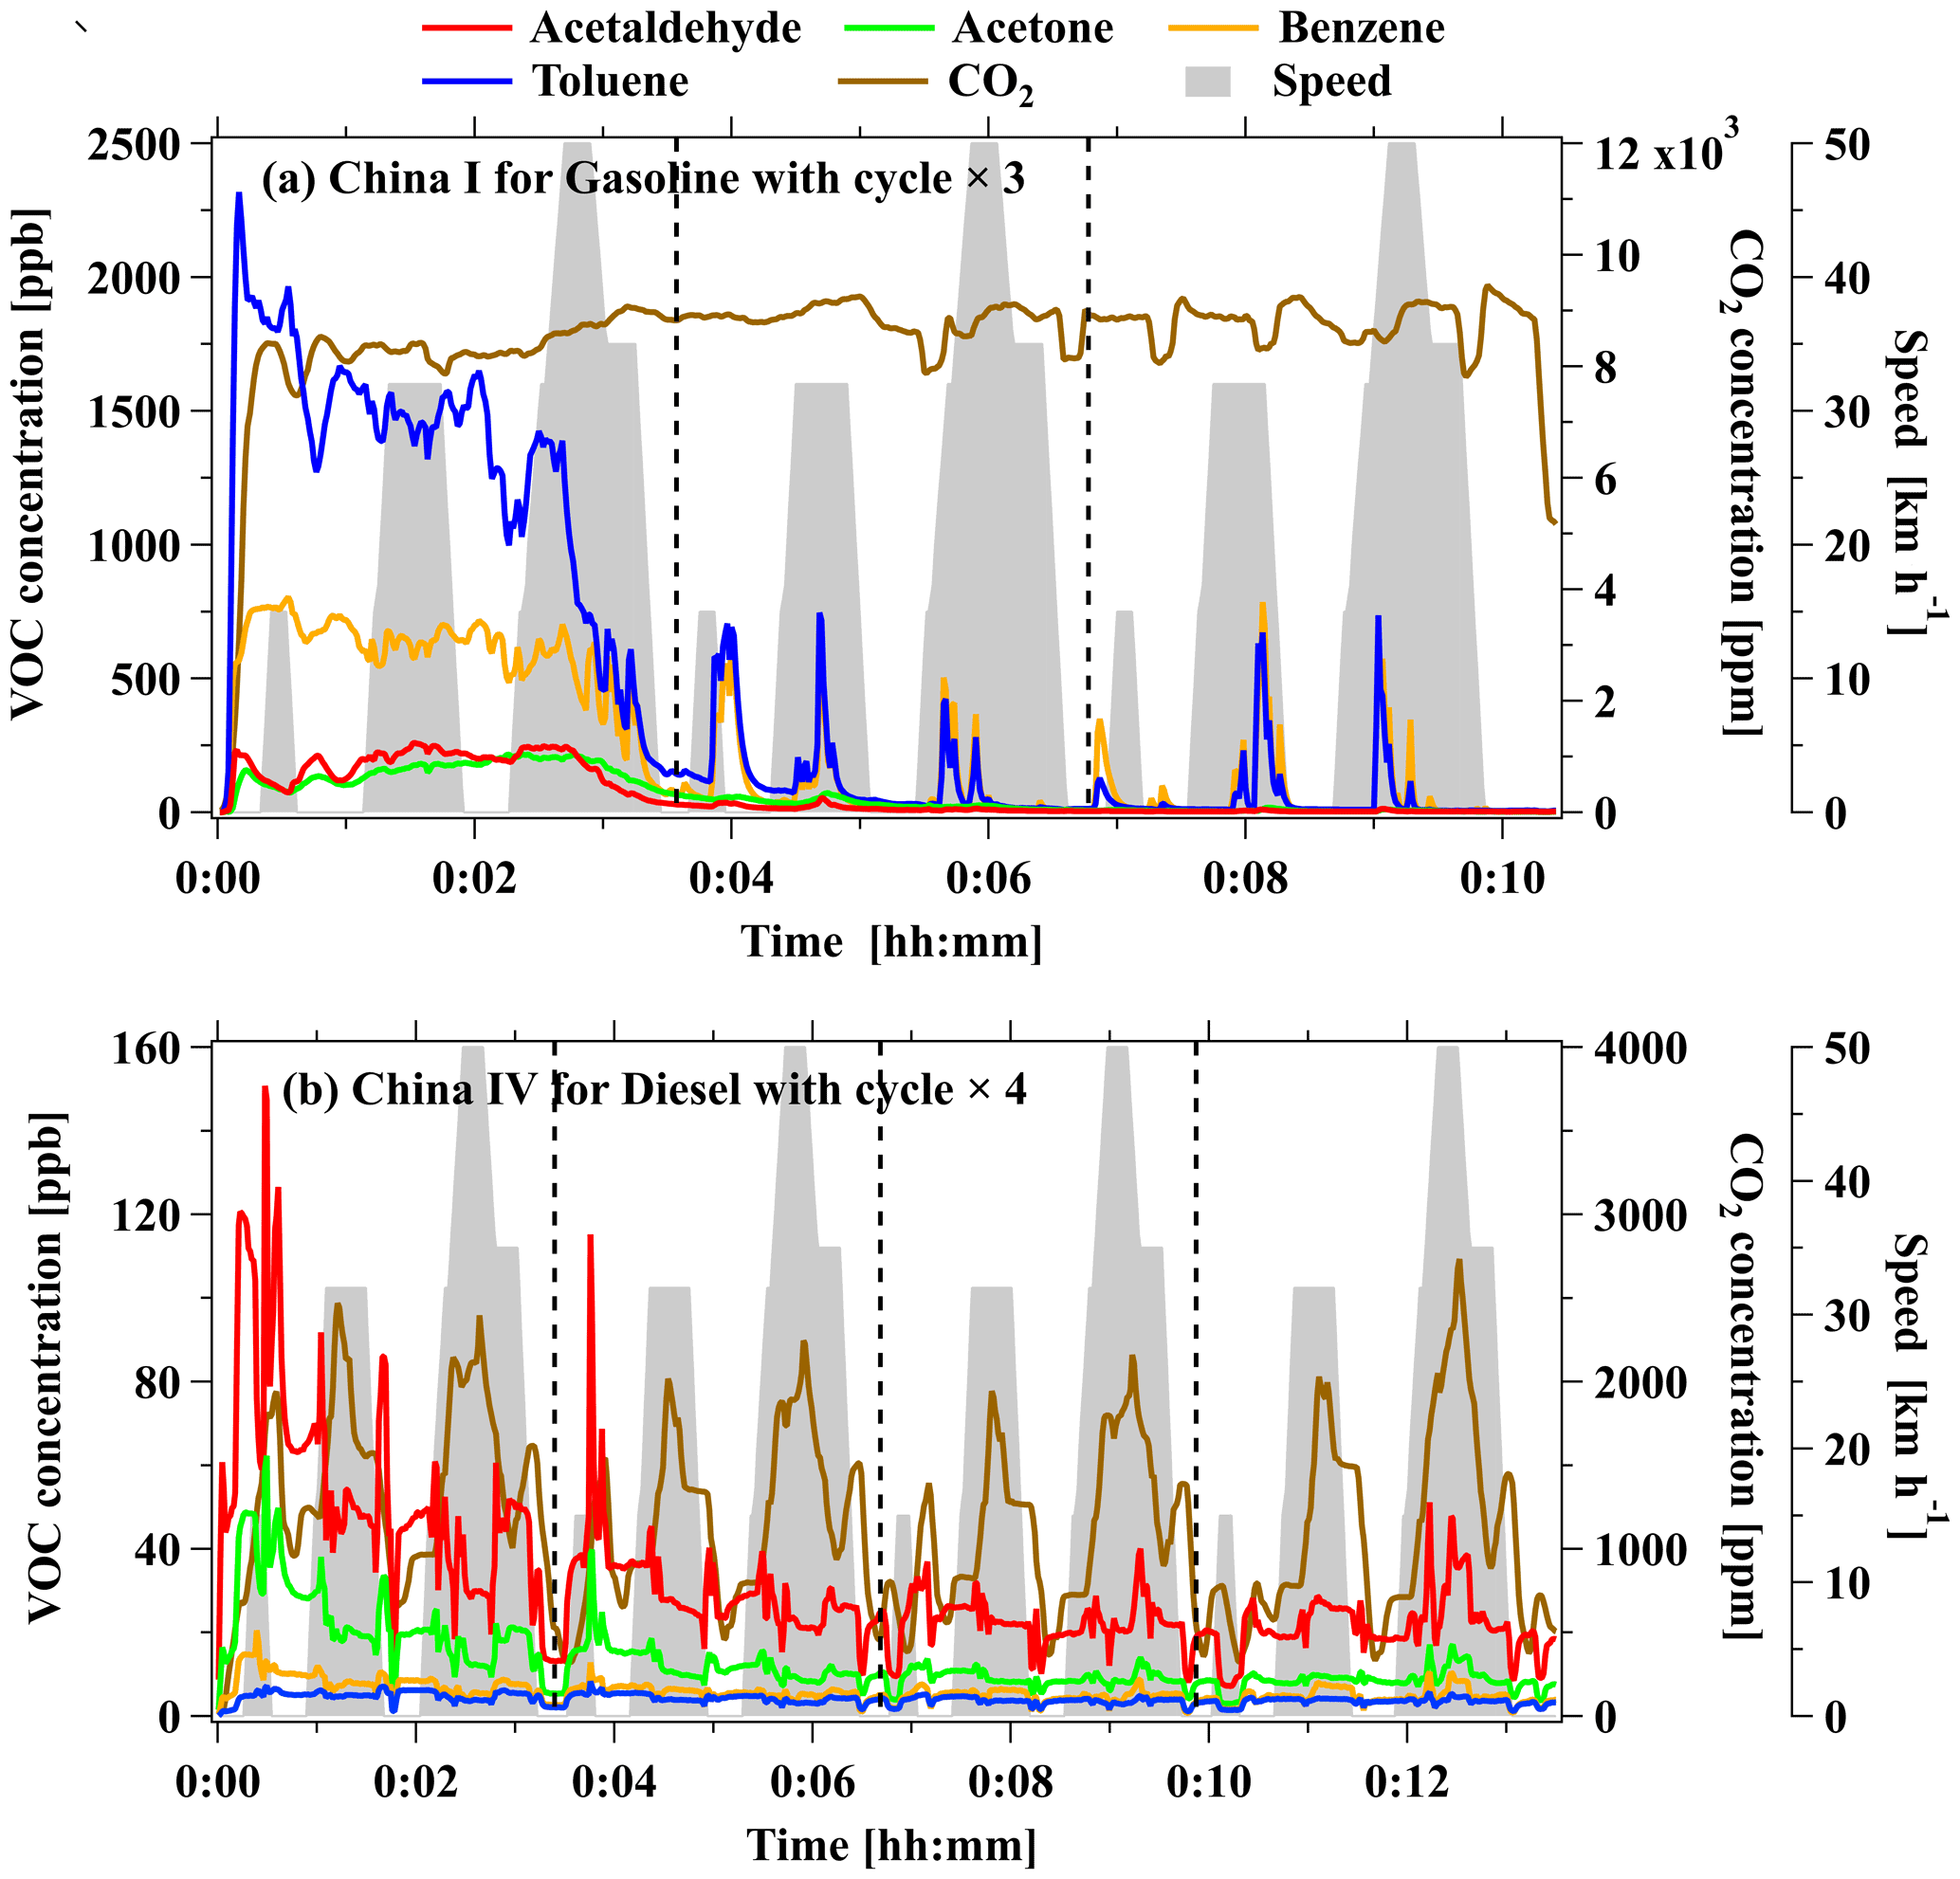
Figure 1Real-time concentrations of acetaldehyde, acetone, benzene, toluene, and CO2 for (a) a gasoline vehicle with emission standard of China I and (b) a light-duty diesel vehicle (LDDV) with emission standard of China IV. The two vehicles were both cold started. The gray shadows represent the speed of the vehicles on the chassis dynamometer.
Based on the high-time-resolution measurements of the PTR-ToF-MS, we determined emission factors of various VOC species from different vehicles. Figure 2 shows the determined average mileage-based emission factors of benzene, toluene, acetaldehyde, and acetone for various types of vehicles (also tabulated in the Supplement table). In general, we observe a downward trend for emission factors of gasoline vehicles from China I to China VI emission standards for the four representative VOC species. This is consistent with the results in previous studies with lower emissions for newer emission standards (Wang et al., 2017; Sha et al., 2021). In addition, the dependence of VOC emissions on emission standards may also be attributed to the history of vehicle usage, i.e., the mileage traveled by the vehicles, as lower mileage vehicles are usually associated with vehicles with newer emission standards. As shown in Fig. 3, we observe strong positive relationship between toluene emission factors and vehicle odometers for both gasoline and diesel vehicles, indicating the mileage of vehicles can significantly affect VOC emission factors for vehicles tested in this study. The emission factors of the representative VOC species are highest for China II gasoline vehicles than China I vehicles, which can be explained by the China II vehicles having the highest mileage of the test vehicles. Emission factors of the four species for China VI vehicles are 12 to 25 times lower than emission factors for China I vehicles, indicating that newer emission standards successfully reduced VOC emissions of gasoline vehicles. The decline of emission factors for the four species with newer emission standards for diesel vehicles is in the range of 1.1 to 7.4 times from China III to China V, compared to 4.5 to 5.4 times reduction from China III to China V for gasoline vehicles. Emission factors of benzene and toluene from diesel vehicles are in the range of 0.8 to 7.4 and 0.3 to 5.8 mg km−1, which are comparable to emission factors from gasoline vehicles with China IV to China VI emission standards. This is different from observations of the two OVOC species (acetaldehyde and acetone), with much higher emission factors from diesel vehicles (8.0 to 27.9 mg km−1 for acetaldehyde and 0.8 to 10.0 mg km−1 for acetone) than almost all gasoline vehicles (a maximum of 3.9 mg km−1 for acetaldehyde and a maximum of 3.2 mg km−1 for acetone). Higher emission factors from diesel vehicles are also observed for many other common OVOC species, as shown in Fig. 4. As the largest OVOC emitted from gasoline vehicles (4.6±5.1 mg km−1), methanol is found to be the only common OVOC species with lower emission factors from diesel vehicles than gasoline vehicles. The emission factors of other OVOCs (e.g., formaldehyde, acetone) from diesel vehicles are higher than gasoline vehicles, which is consistent with previous results (Gentner et al., 2013). The high emissions of OVOCs from diesel vehicles may be related to combustion processes in diesel vehicles, with more excess air present in the combustion cylinder (i.e., overall fuel-lean conditions) resulting in higher oxygen contents and more oxidation processes during fuel combustion (Pang et al., 2008; Qiao et al., 2012; Gentner et al., 2017). Finally, the determined emission factors of the four VOC species from LPG vehicles are much lower than both gasoline and diesel vehicles.
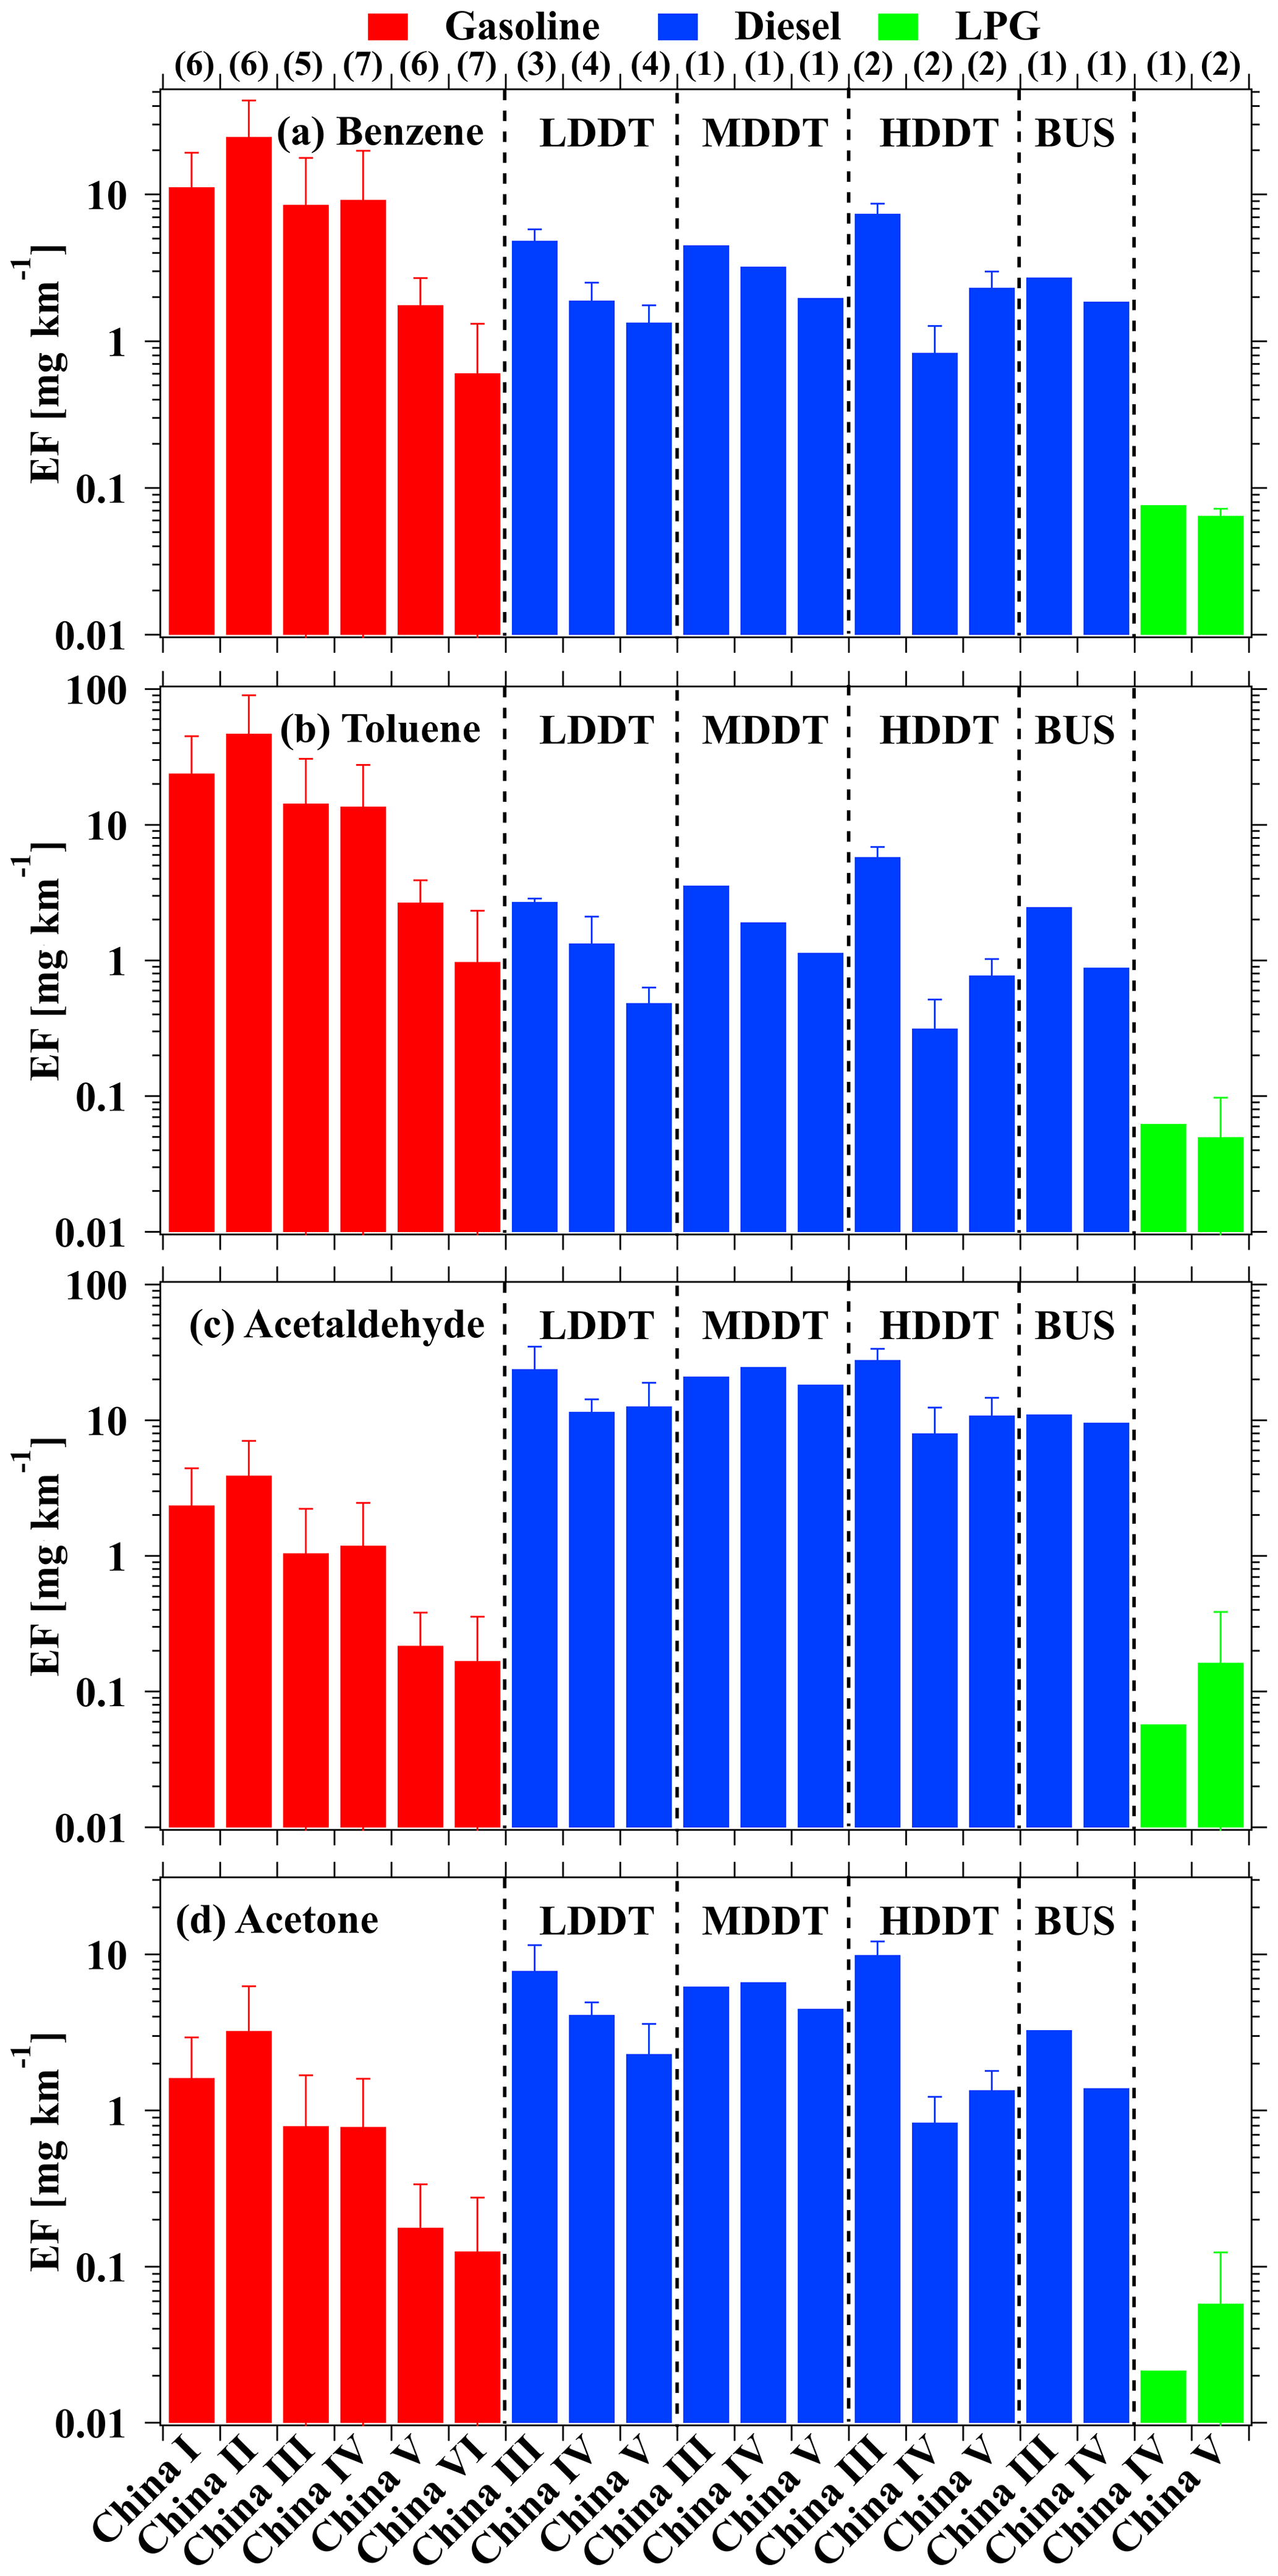
Figure 2The determined average mileage-based emission factors (mg km−1) for (a) benzene, (b) toluene, (c) acetaldehyde, and (d) acetone for vehicles with different emission standards. The numbers above the top axis represent the number of all experiments (including multiple measurements for an individual test vehicle) for each emission standard. LDDT, MDDT, HDDT, and BUS represent light-duty diesel truck, middle-duty diesel truck, heavy-duty diesel truck, and bus, respectively. Error bars represent standard deviations of emission factors for the specific emission standard.

Figure 3Scatterplot of the emission factors of toluene in (a) gasoline and (b) diesel vehicles, as well as acetone in (c) gasoline and (d) diesel vehicles during the hot start based on the odometer for each vehicle.
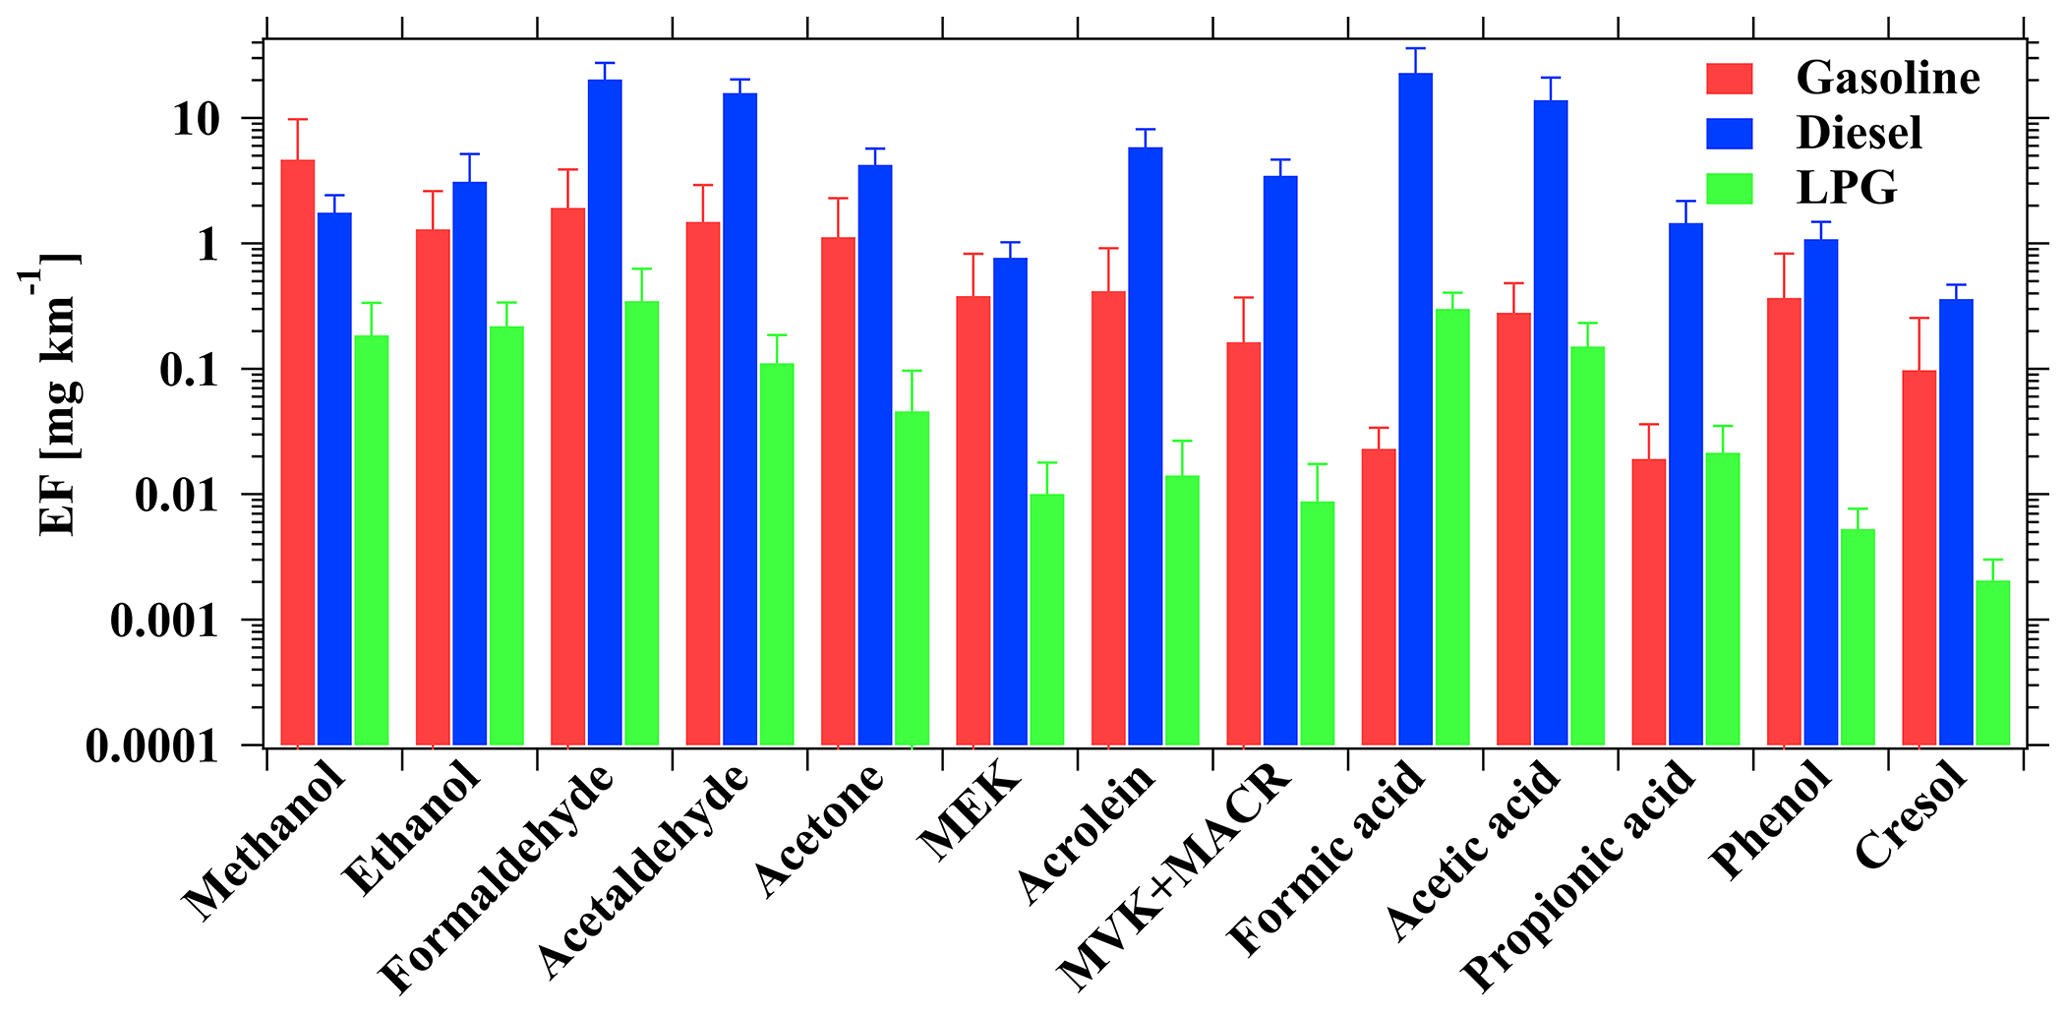
Figure 4The determined emission factors of representative OVOC species from different types of vehicles. Error bars represent standard deviations of the emission factors for the VOCs.
3.2 Analysis of PTR-ToF-MS mass spectra to evaluate VOC speciation
In addition to typical VOC species shown above, the PTR-ToF-MS detected abundant signals for a large number of ions. The determined average mileage-based emission factors for all detected VOC species are shown as mass spectra in Fig. 4. VOC species measured by the PTR-ToF-MS were divided into groups according to chemical formula, namely hydrocarbon species only containing C and H atoms (CxHy), OVOCs (CxHyOz), species containing nitrogen and/or sulfur atoms (N/S-containing), and some other ions (others). We observe similar mass spectra of emission factors for gasoline vehicles with different emission standards (Fig. S7). The highest emission factors from gasoline vehicles (Fig. 5a) are detected as hydrocarbons, including C6 to C10 aromatics. A few OVOC species, namely methanol, ethanol, formaldehyde, acetaldehyde, and acetone, are also observed as the largest emissions. In contrast to gasoline vehicles, the largest emissions from diesel vehicles were attributed to a few low-molecular-weight OVOC species, including formaldehyde, acetaldehyde, formic acid, and acetic acid, followed by a large number of hydrocarbon species. A comparison between the mass spectra of gasoline and diesel vehicle emissions suggests that emissions from diesel vehicles are more evenly distributed among different VOC species, as reflected by 50 and 140 species contributing more than 1 ‰ of the total emissions for gasoline and diesel vehicles, respectively. As shown in Fig. 5b, many hydrocarbon ions in the range of 150–200 still account for significant fractions of emissions from diesel vehicles, whereas only one species in this range contribute more than 1 ‰ of emissions from gasoline vehicles. These results demonstrate that diesel vehicles emit more heavier hydrocarbons than those from gasoline vehicles, which is consistent with observations in previous studies (Gentner et al., 2012; Erickson et al., 2014).

Figure 5The determined average mileage-based emission factors of VOC species measured by the PTR-ToF-MS from (a) gasoline, (b) diesel, and (c) LPG vehicles. The dashed gray lines represent 1 ‰ of total VOC emission factors.
The scatterplot of carbon oxidation states () as a function of carbon number (nC) provides a framework for describing bulk chemical properties of organics (Kroll et al., 2011). The details of calculation are included in Sect. S4. The results from gasoline and diesel vehicles are compared in Fig. 6 (LPG vehicles are shown in Fig. S8). It is apparent that ions with carbon oxidation states between −2.0 to 0 comprise the main emissions for each carbon number for both gasoline and diesel vehicles. It is interesting to observe that averaged for nC>6 increases as the carbon number decreases for both gasoline and diesel vehicles, whereas the opposite trends are observed for nC<5. The averaged in diesel vehicles for nC between 1 and 5 is significantly higher than those in gasoline vehicles, as a result of high emissions of C2 to C5 low-molecular-weight OVOCs. Figure 6c further shows that emission factors of most VOC species from diesel vehicles were higher than gasoline vehicles, except for a number of species occupying the bottom-right corner of the two-dimensional space.
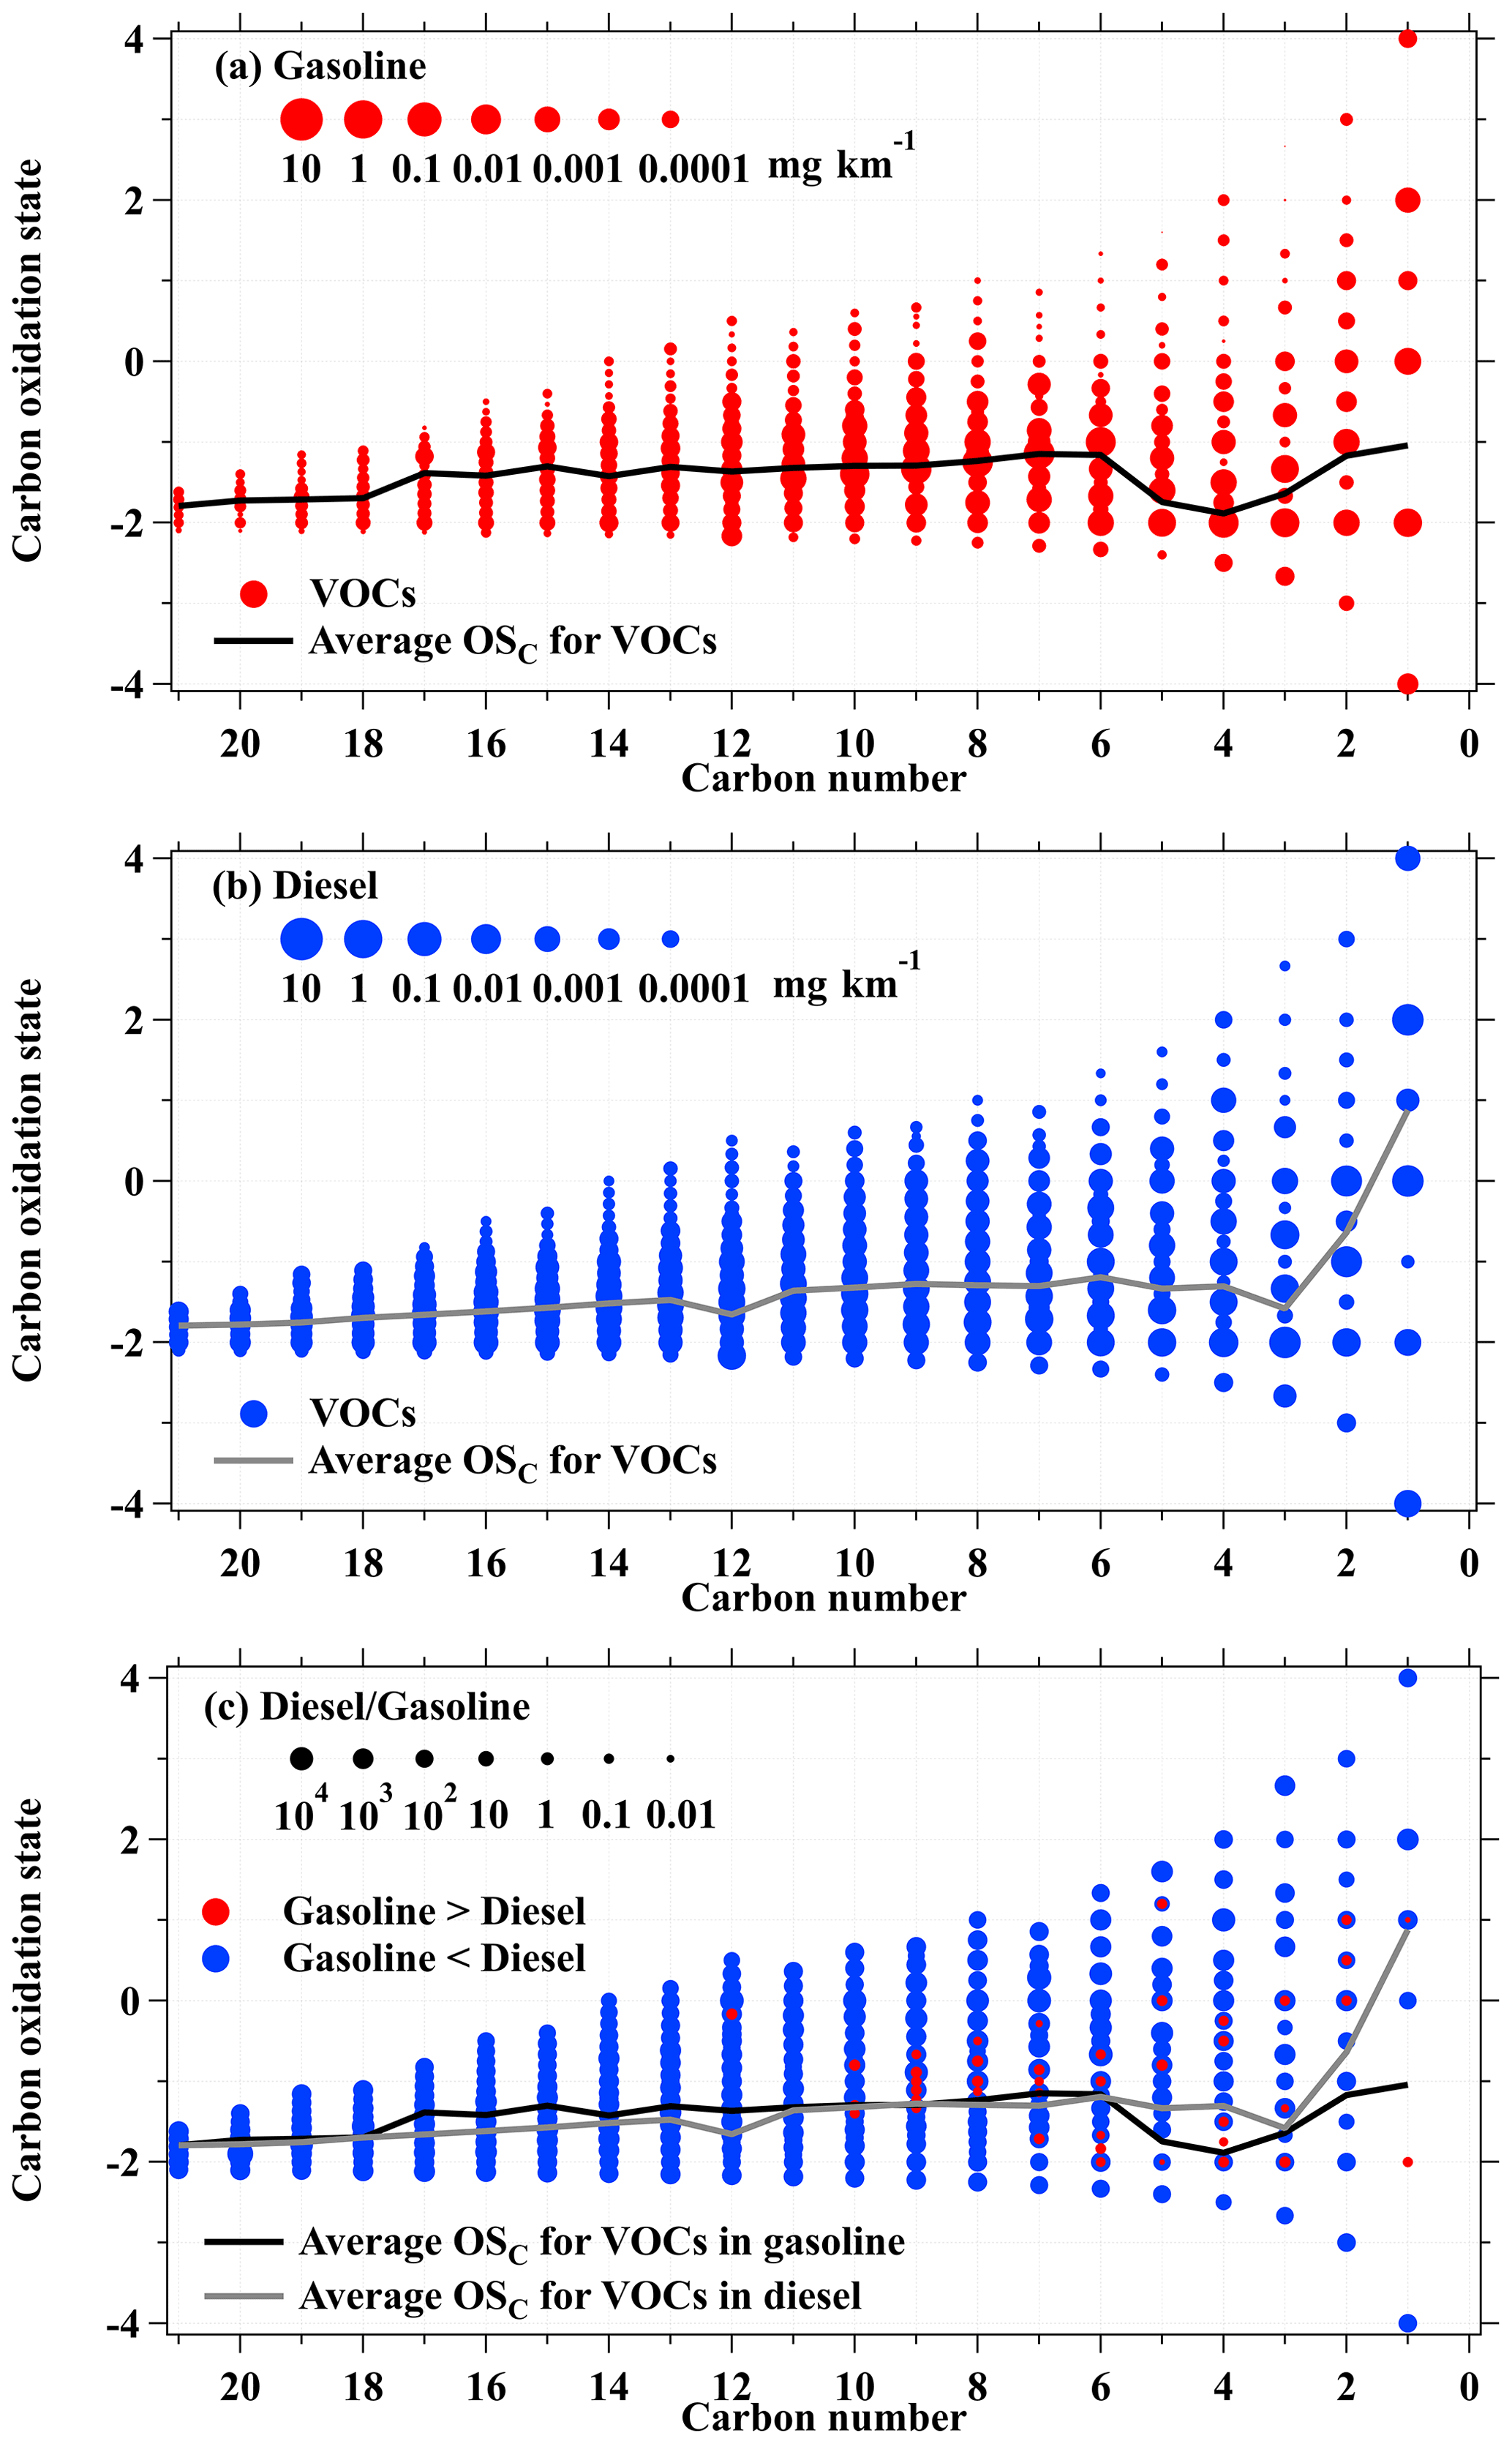
Figure 6The two-dimensional space of with data points sized coded using emission factors of VOC species from (a) gasoline and (b) diesel vehicles, as well as (c) the ratio of emission factors of diesel vehicles relative to gasoline vehicles. The black and gray lines are the average of each carbon number for VOC species in gasoline and diesel vehicles, respectively.
The determined mass spectra of the PTR-ToF-MS in terms of emission factors for different types of vehicles can be used to explore the dependence of various VOC emissions on different factors. Figure 7a and b show scatterplots of the average mileage-based emission factors of VOCs between cold starts and hot starts for gasoline and diesel vehicles, respectively. We observe a strong correlation between emission factors from cold start and hot start tests (R=0.99 and 0.92) and generally consistent ratios between cold starts and hot starts for different types of VOC species for both gasoline and diesel vehicles, indicating that variation behaviors are similar for different species and thus that chemical compositions of VOC emissions are comparable between different start conditions. As cold start emissions are richer in unburned fuel than other hot-running conditions (Gentner et al., 2017) and the after-treatment devices aim for VOC control for gasoline vehicles, the strong correlation and significantly lower than unity slope in Fig. 7a suggest that unburned fuel is the major contributor to exhaust emissions of gasoline vehicles, which has been previously shown in California, USA (Gentner et al., 2013). It is obvious that emission factors of VOCs during cold starts are significantly higher than those during hot starts for gasoline vehicles (slope = 0.40), whereas similar emission factors between cold starts and hot starts are derived for diesel vehicles (slope = 0.84). These results suggest that gasoline vehicles are more significantly influenced by cold starts as a result of compositions in gasoline fuel being more volatile than diesel fuel (National Research Council, 1996). We further explore the effects of emission standards on VOC emission factors by comparing determined emission factors between China I and China V for gasoline vehicles (Fig. 7c, also see China III versus China V and China V versus China VI in Fig. S9) and between China III and China V for LDDT (Fig. 7d, also see China III versus China V for MDDT and HDDT in Fig. S9). Figure 7c shows that the chemical compositions of VOC emissions are comparable between different emission standards for abundant VOC species from gasoline vehicles, indicating after-treatment devices may not affect the relative fractions of VOC components for gasoline vehicles (Drozd et al., 2019; Lu et al., 2018; Zhao et al., 2017). In comparison, the results between different emission standards for diesel vehicles (Fig. 7d) are somewhat more scattered than in gasoline vehicles. Furthermore, a comparison of both gasoline and diesel vehicles demonstrates that newer emission standards successfully decreased VOC emissions. Based on the derived slopes, we obtain VOC emission factors that are reduced by a factor of 10 for gasoline vehicles from China I to China V (a factor of 5 reduction from China III to China V and a factor of 2.5 reduction from China V to China VI), and a factor of 2 for LDDT from China III to China V (a factor of 1.5 and 8 reduction for MDDT and HDDT from China III to China V). The reduction ratios for gasoline vehicles from China I to China V are generally similar for most VOC species, except that some OVOC species showed smaller reduction ratios. The reduction ratios for LDDT vehicles from China III to China V show large variability for different species. The lowest reduction ratios (a factor of ∼2) are observed for the low-molecular-weight OVOC species associated with the largest emissions, while the reduction ratios for hydrocarbons and higher-molecular-weight OVOCs are in the range of a factor of 10–100. These results indicate the after-treatment device for diesel vehicles (see Sect. S1 for details) may effectively reduce emissions of some heavier VOC species, though the after-treatment devices do not aim for VOC control (Gentner et al., 2017).
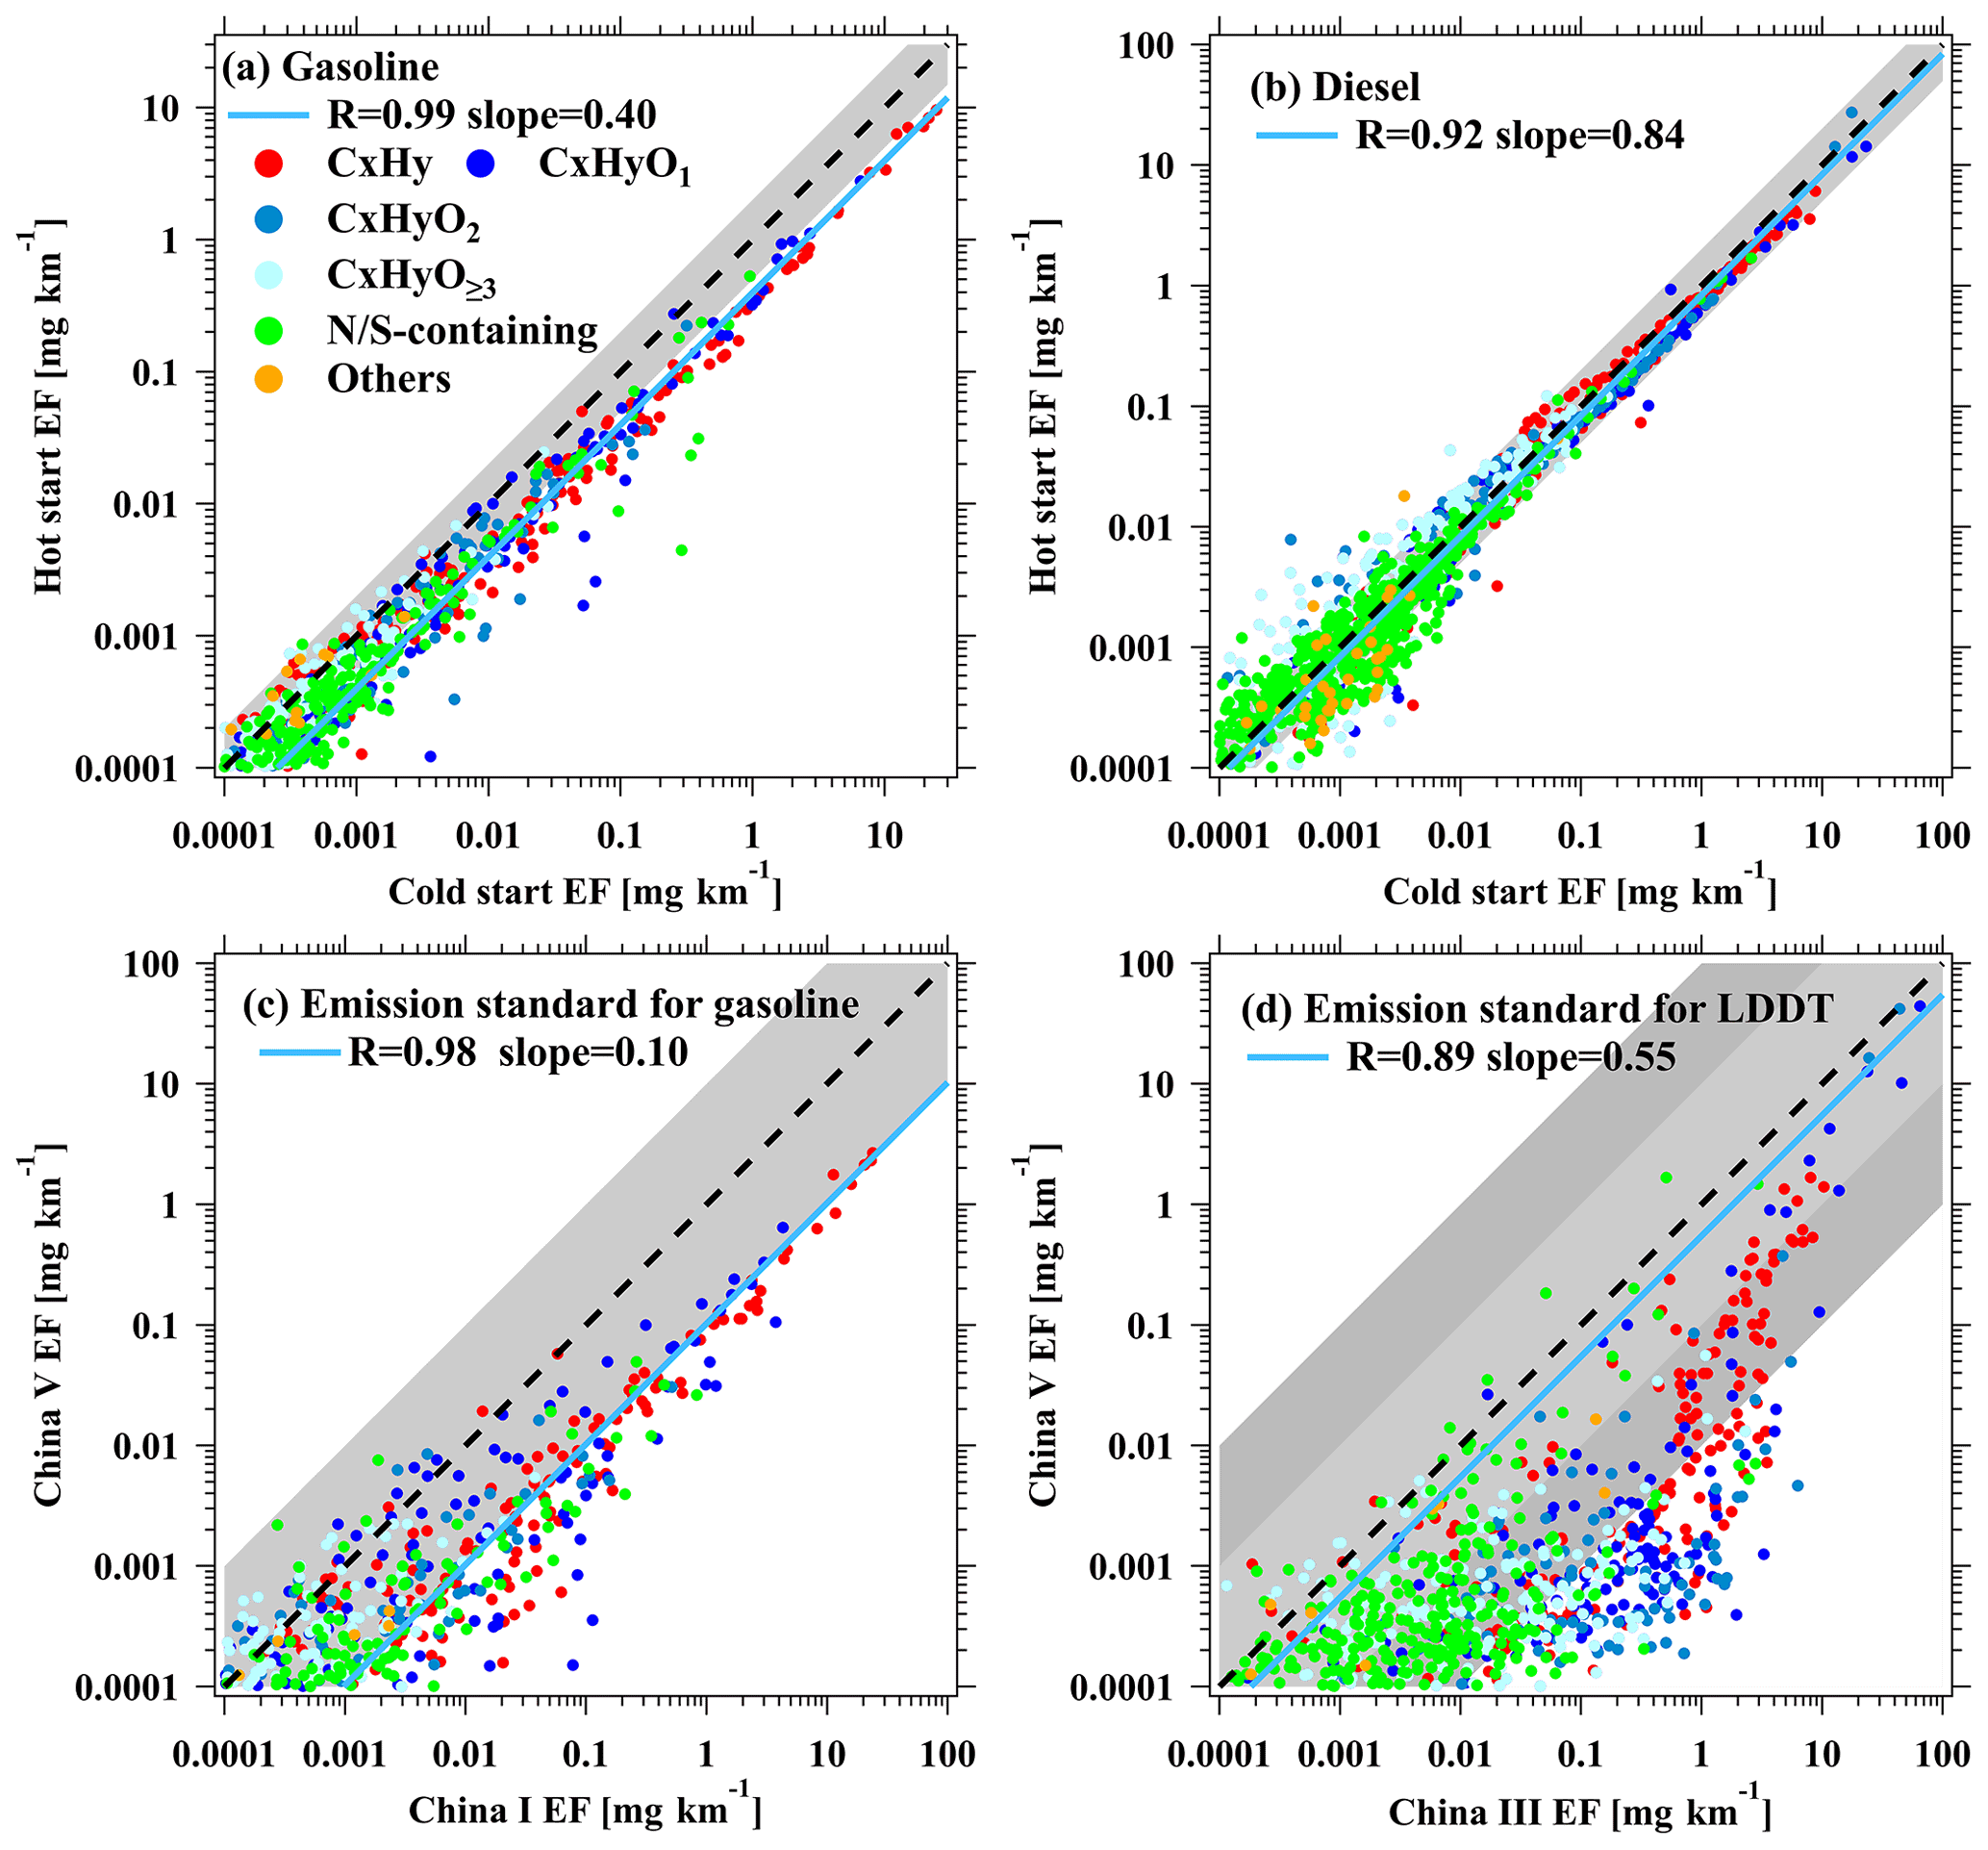
Figure 7Scatterplots of VOC emission factors between cold starts and hot starts for gasoline (a) and diesel vehicles (b). Scatterplots of VOC emission factors between China I and China V emission standards for gasoline vehicles (c) and between China III and China V emission standards for diesel vehicles (d). Each data point indicates a VOC species measured by the PTR-ToF-MS. The blue lines are the fitted results for all data points. The dashed black lines represent 1 / 1 ratio, and the shaded areas represent ratios of a factor of 2 in (a) and (b), as well as a factor of 10 and 100 in (c) and (d).
3.3 Non-target analysis for comparison between gasoline and diesel vehicles
As shown in the previous section, the analysis of PTR-ToF-MS mass spectra provides rich information on understanding the influences of VOC emissions from vehicles. This detailed information provided by the PTR-ToF-MS also offers an opportunity to systematically compare emissions between gasoline and diesel vehicles. The scatterplot of the determined average emission factors of various VOC species between gasoline and diesel vehicles is shown in Fig. 8. Large differences in VOC compositions emitted from gasoline and diesel vehicles are observed, as indicated by the low correlation of the data points (R=0.24). A limited number of VOC species, including C6–C10 aromatics and some N/S-containing species (e.g., C7H5N), are associated with higher emission factors from gasoline vehicles, whereas the obtained emission factors of most VOC species emitted from diesel vehicles are higher, especially for most OVOC species. For example, formic acid is found to be one of the most significant species emitted by diesel vehicles, with emission factors being 3 orders of magnitude higher than those from gasoline vehicles. In addition, emission factors of HCN from gasoline vehicles are similar to those from diesel vehicles. These results are consistent with the measurements using the I− ToF-CIMS from the same campaign, as shown in Li et al. (2021).
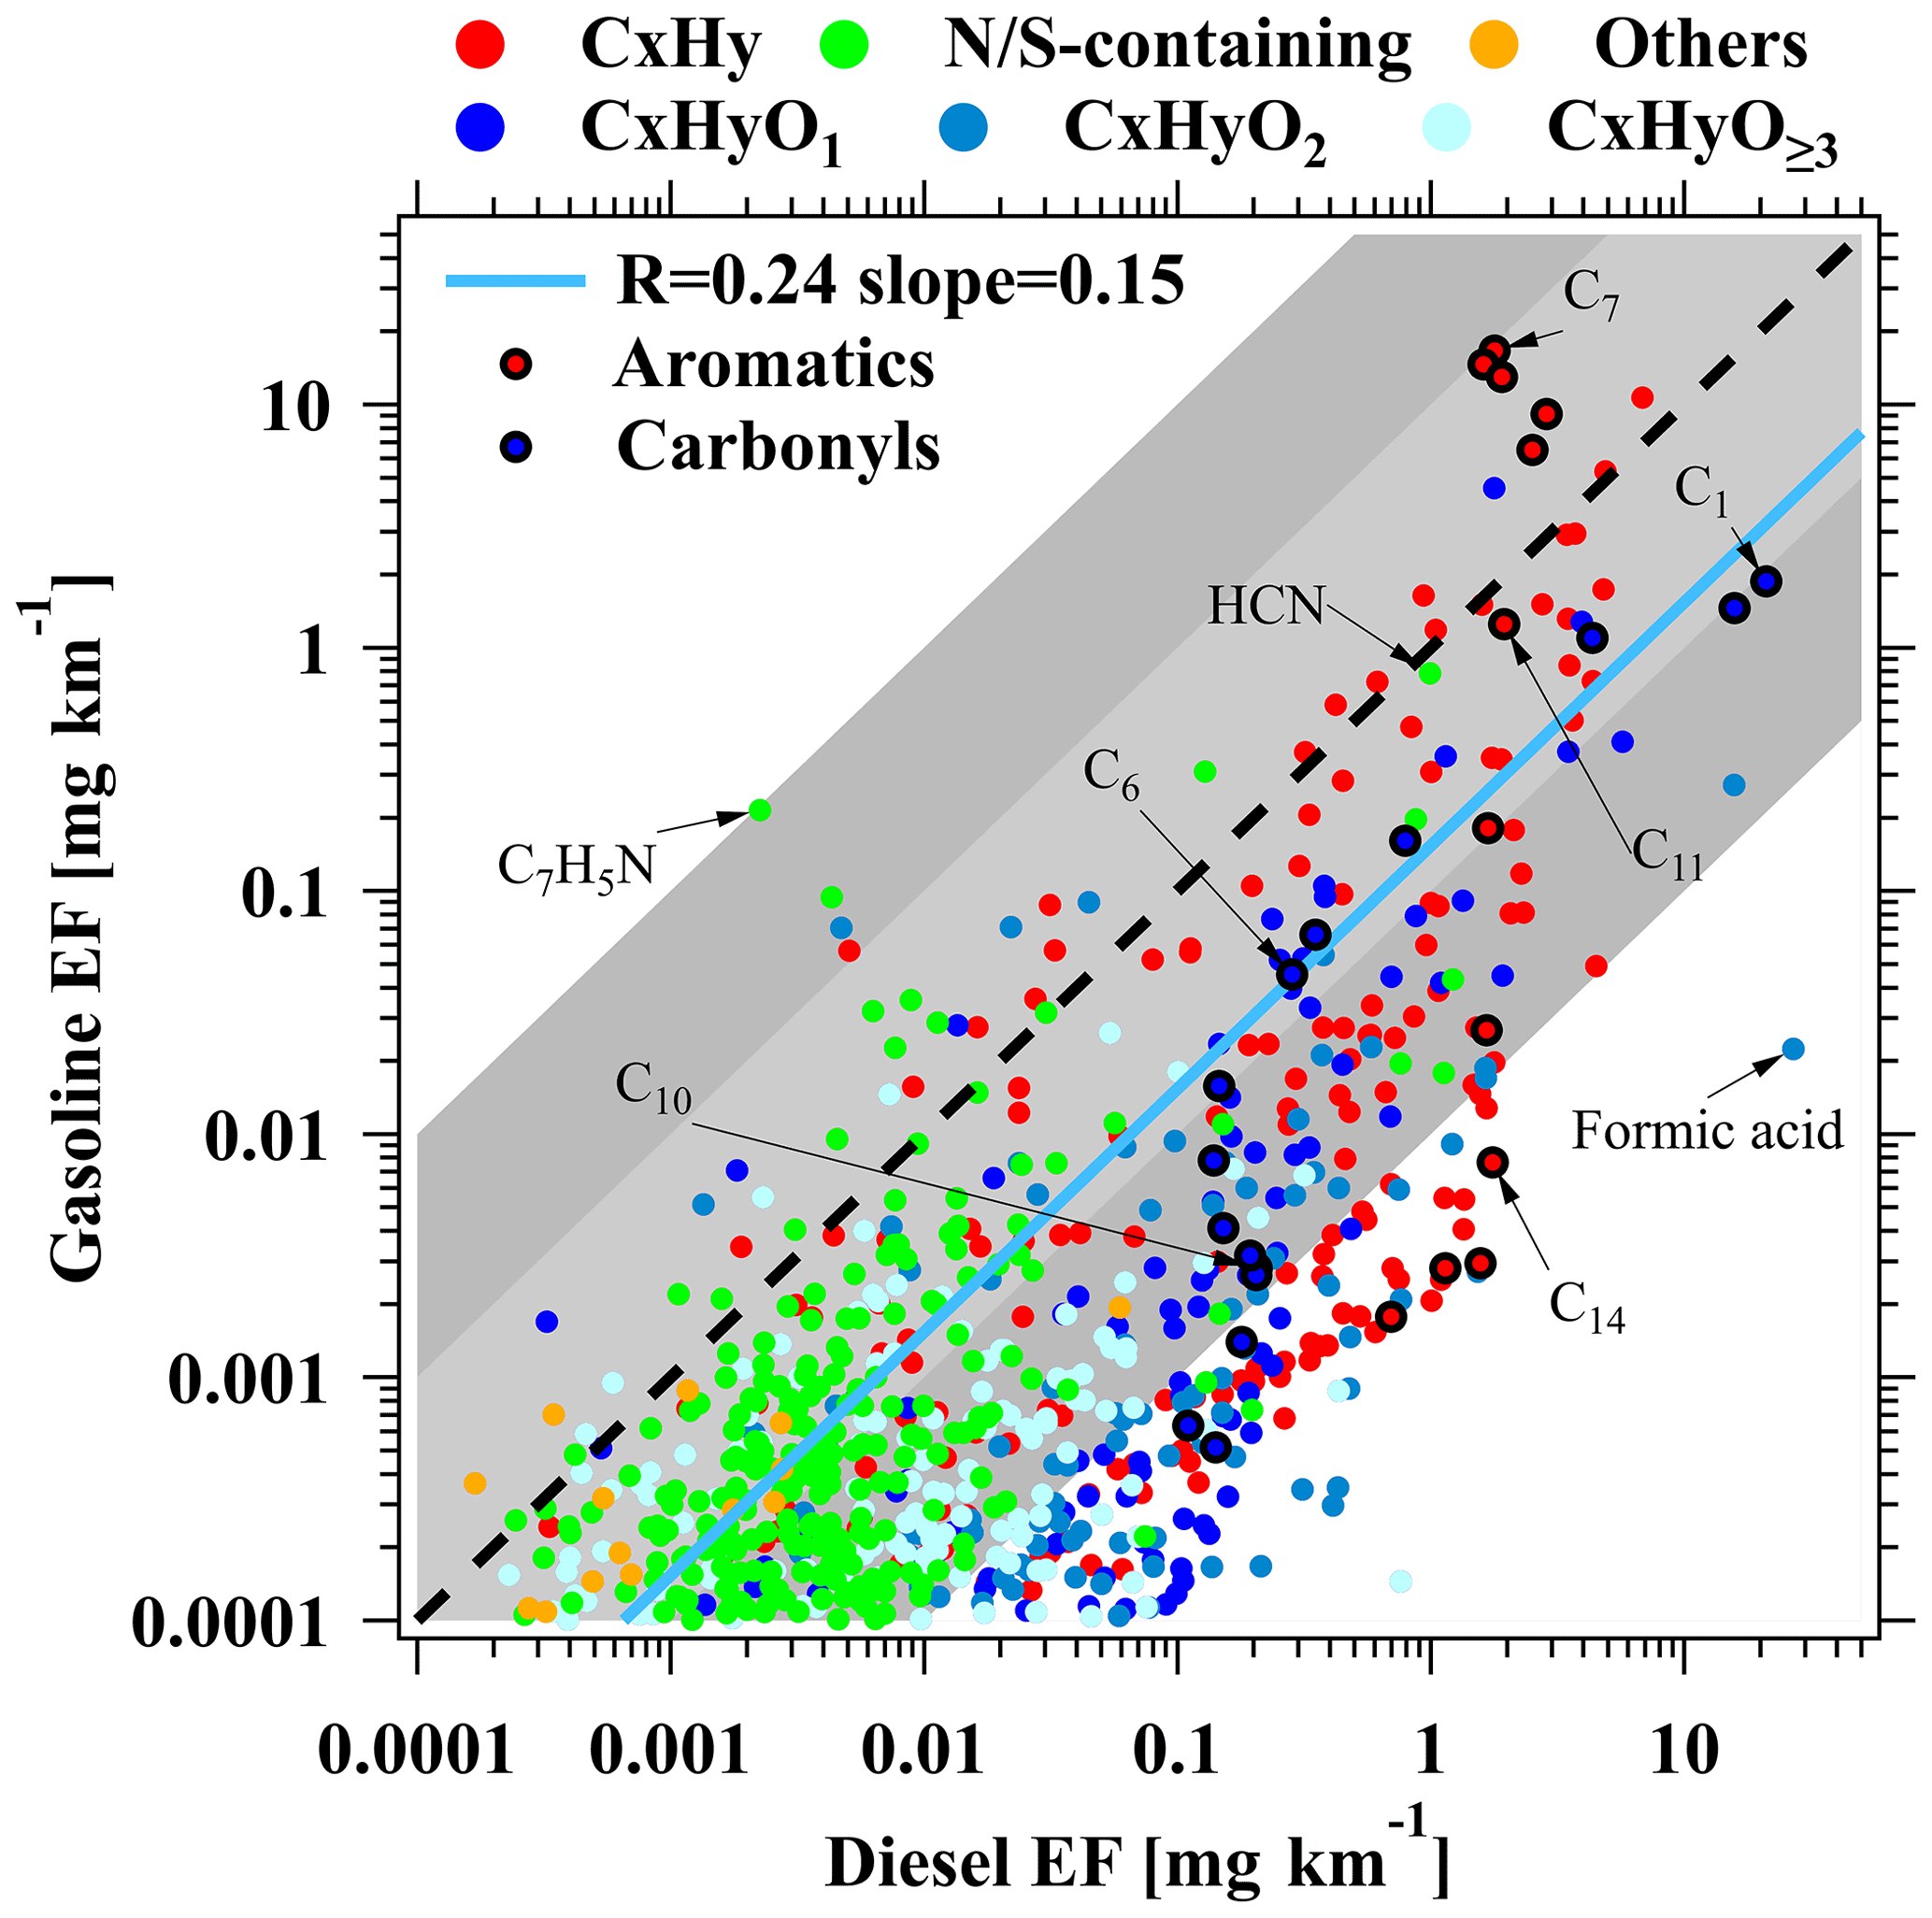
Figure 8Scatterplot of VOC emission factors between gasoline and diesel vehicles. Each data point indicates a VOC species measured by the PTR-ToF-MS. The blue line is the fitted result for all data points. The black line represents 1 / 1 ratio, and the shaded areas represent ratios of a factor of 10 and 100.
The scatterplot shown in Fig. 8 can also be expressed in terms of the determined fuel-based emission factors between gasoline and diesel vehicles (Fig. S10a). Generally, similar variability is obtained except the determined slope of the data points, with higher slopes determined from the scatterplot based on fuel-based emission factors (0.19 versus 0.15). The emission ratios to CO between gasoline and diesel vehicles (Fig. S10b) show similar results. Furthermore, the difference between the slopes reflects the different average mileage for the same weight of fuel between gasoline (9.7 km kg) and diesel vehicles (7.1 km kg), as demonstrated for emission factors of CO2 in Table S6.
Comparing gasoline and diesel vehicles, we can also observe profound differences in relative changes in emission factors for analogous compound series. The emission factors of C6–C10 aromatics are apparently higher for gasoline vehicles than diesel vehicles, whereas emission factors for larger aromatics (nC>11) from diesel vehicles start to exceed gasoline vehicles. This interesting behavior is the result of different variations in emission factors for gasoline and diesel vehicles as carbon number increases. This may be attributed to the differences in chemical compositions of gasoline and diesel fuel, such as higher fractions of polycyclic aromatic hydrocarbons (PAHs) in the diesel fuel (Yue et al., 2015; Gentner et al., 2017). As shown in Fig. 9, emission factors of aromatics from gasoline vehicles start to rapidly decrease at nC=10 (a factor of 5 for each additional carbon for C10–C15), while the emission factors of aromatics for diesel vehicles demonstrate a relatively flat pattern between C6 and C15, only with significant decrease for nC>15. Based on Fig. 9, we determine that emissions of aromatics with nC≥10 in gasoline and diesel vehicles account for 14 % and 63 % of total aromatic emissions, respectively, again suggesting the importance of heavier aromatics in emissions from diesel vehicles. It also highlights that quantification of these heavier species by the PTR-ToF-MS may be important in the characterization of vehicular exhausts, especially diesel vehicles.
In addition to aromatics, the relative changes in emission factors for carbonyls with carbon number are apparently different between gasoline and diesel vehicles (Figs. 8 and 9b). Emission factors of carbonyls tend to decrease as carbon number increases for both gasoline and diesel vehicles. The extent of this decrease is observed to be comparable for C1–C6 carbonyls in gasoline (97.6 %) and diesel vehicles (97.4 %). However, as nC>6, the decrease in carbonyl emission factors for diesel vehicles becomes smaller, resulting in larger emission factors than for gasoline vehicles for this range of carbon number.
The above discussions demonstrate that emission characteristics of aromatics and OVOCs are significantly different between gasoline and diesel vehicles. As a result, the ratios of VOC pairs can be used to distinguish emissions of gasoline and diesel vehicles. Figure 10 shows the scatterplots of four representative VOCs (benzene, C14 aromatics, formaldehyde, and acetaldehyde) versus toluene based on the determined emission factors. The data points for each VOC pair clearly show distinct separation between gasoline vehicles and diesel vehicles, with apparently higher slopes for diesel vehicles than gasoline vehicles, as a result of much larger emission factors of toluene from gasoline vehicles and lower emission factors of the four representative VOCs from diesel vehicles. The benzene toluene ratio in gasoline and diesel vehicles are determined as 0.48 and 1.24 mg mg−1 (corresponding to 0.57 and 1.46 ppb ppb−1 that are more widely used in ambient studies). The difference in benzene / toluene ratios between gasoline and diesel vehicles has been reported in previous studies, and our results are generally consistent with these previous results (Chan et al., 2002; Barletta et al., 2005; Qiao et al., 2012; Kumar et al., 2020). Compared to the benzene / toluene ratio, the difference in C14 aromatics / toluene ratio between gasoline and diesel vehicles are more substantial (a factor of 3800). The significantly higher emission factors of C14 aromatics from diesel vehicles suggest that diesel vehicles can be a significant or even dominant source of higher-molecular-weight aromatics. The enormous difference in C14 aromatics / toluene ratio (and also other higher aromatics / toluene) between gasoline and diesel vehicles indicates that these ratios could potentially provide good indicators for separation of gasoline and diesel vehicles in ambient or tunnel studies (see discussion in Sect. S5 for details about the feasibility of the ratio being used in ambient air). Similar discrepancies are observed for formaldehyde / toluene and acetaldehyde / toluene ratios between gasoline and diesel vehicles. These ratios may not be able to be used as indicators to distinguish gasoline and diesel vehicles in ambient studies since secondary sources may complicate the observed ratios in ambient air. However, these results strongly suggest that diesel vehicles can be important in emissions of these OVOC species, though the number of diesel vehicles are smaller than gasoline vehicles in many countries, e.g., China and USA (Wallington et al., 2013; Yao et al., 2015; Huang et al., 2021).
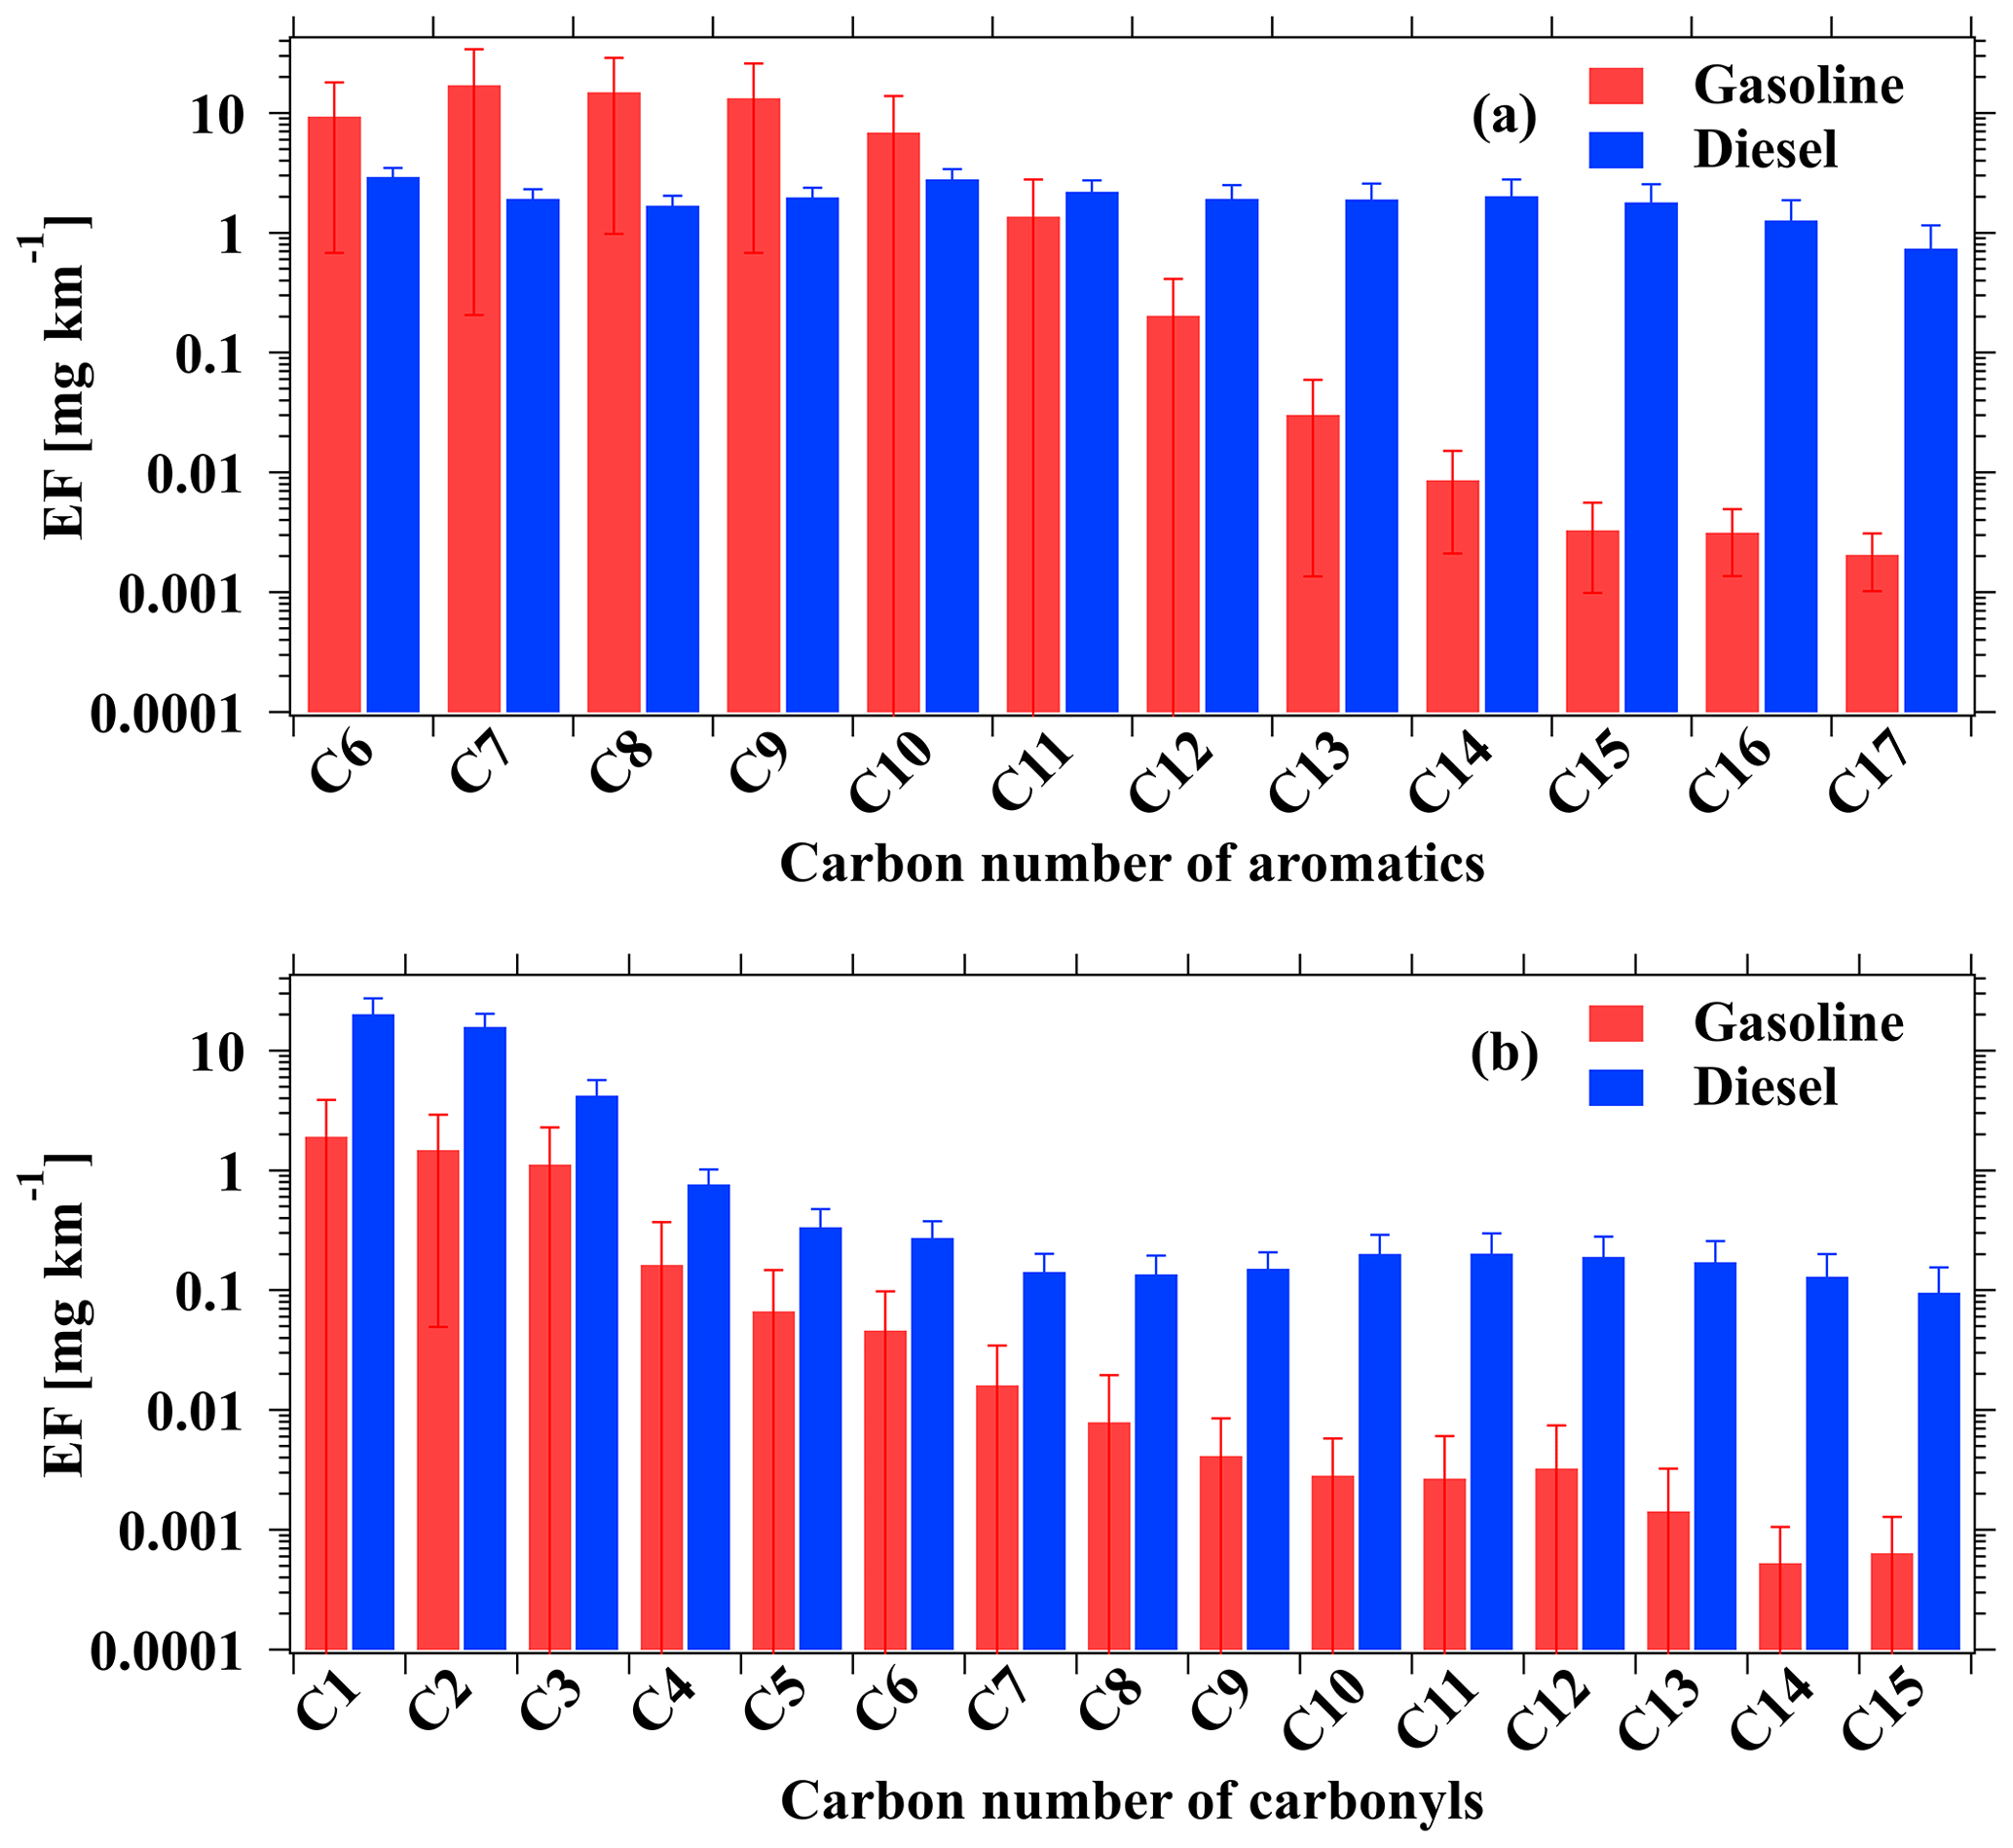
Figure 9The determined emission factors of (a) aromatics and (b) carbonyls for each carbon number from gasoline and diesel vehicles. Error bars represent standard deviations of the emission factors for the VOCs of different carbon number.
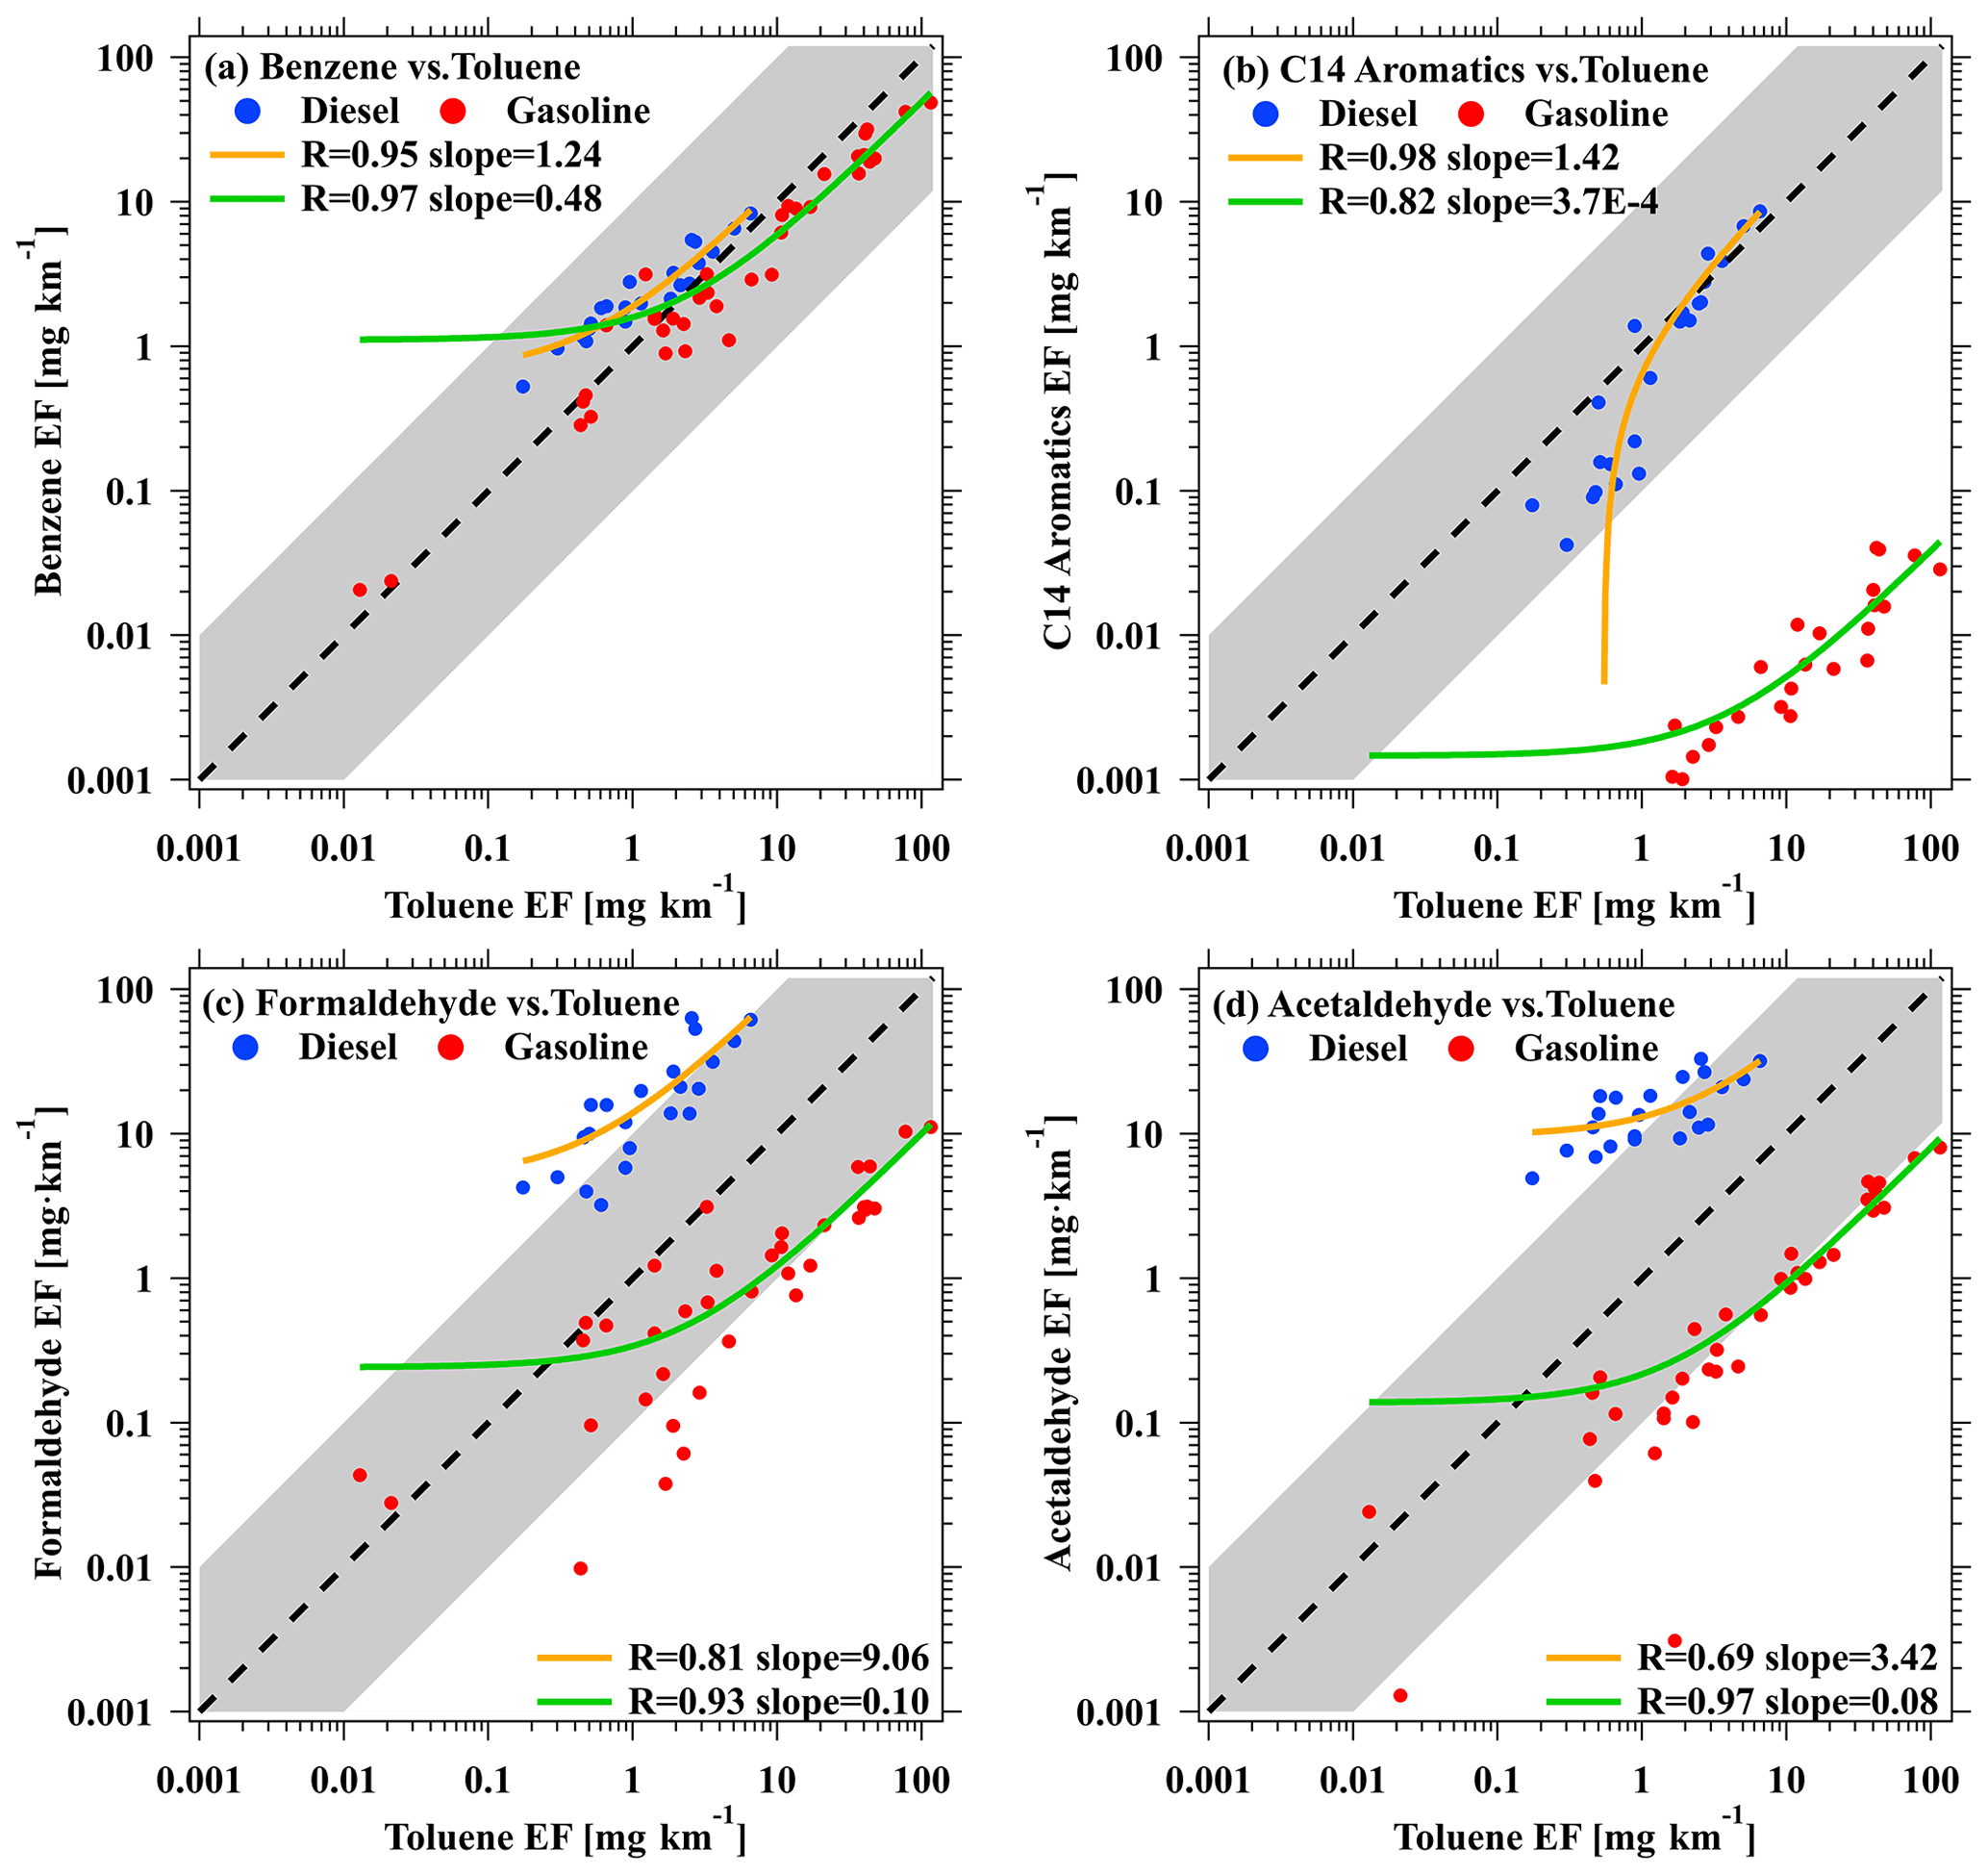
Figure 10Scatterplots of the determined mileage-based emission factors of (a) benzene versus toluene, (b) C14 aromatics versus toluene, (c) formaldehyde versus toluene, and (d) acetaldehyde versus toluene for gasoline and diesel vehicles. Each data point represents each test vehicle in this study. The green and orange lines are the fitted results for gasoline and diesel vehicles. The black line represents the 1 / 1 ratio, and the shaded areas represent the ratios of a factor of 10. The green and orange lines are the fits to gasoline and diesel points in each plot. Note that these linear fits are shown in curves in log–log space as a result of non-zero y intercept.
3.4 OVOC fractions in VOC emissions
Emission factors of various VOC species measured by the PTR-ToF-MS from different vehicles are summarized in Fig. 11. As shown in Fig. 11a, the determined average mileage-based emission factors of total VOC ions from diesel vehicles were much higher than gasoline and LPG vehicles. Figure 11b–d quantified the proportions of different categories of ions measured by the PTR-ToF-MS. The determined average mileage-based emission factors of CxHy accounted for the largest fraction in gasoline vehicles (84 % ± 5.9 %) and lower fractions in diesel (47 % ± 16 %) and LPG vehicles (32 % ± 0.7 %). OVOCs account for larger fractions in diesel (49 % ± 16 %) and LPG vehicles (58 % ± 3.7 %), while they only account for 13 % ± 6.1 % of emissions from gasoline vehicles. The fractions of different OVOC groups generally demonstrate a downward trend from CxHyO1 to CxHyO≥3, and OVOCs with more than two oxygen atoms only occupy small percentages (0 %–7 %) in vehicle exhausts, indicating low emissions of these species.
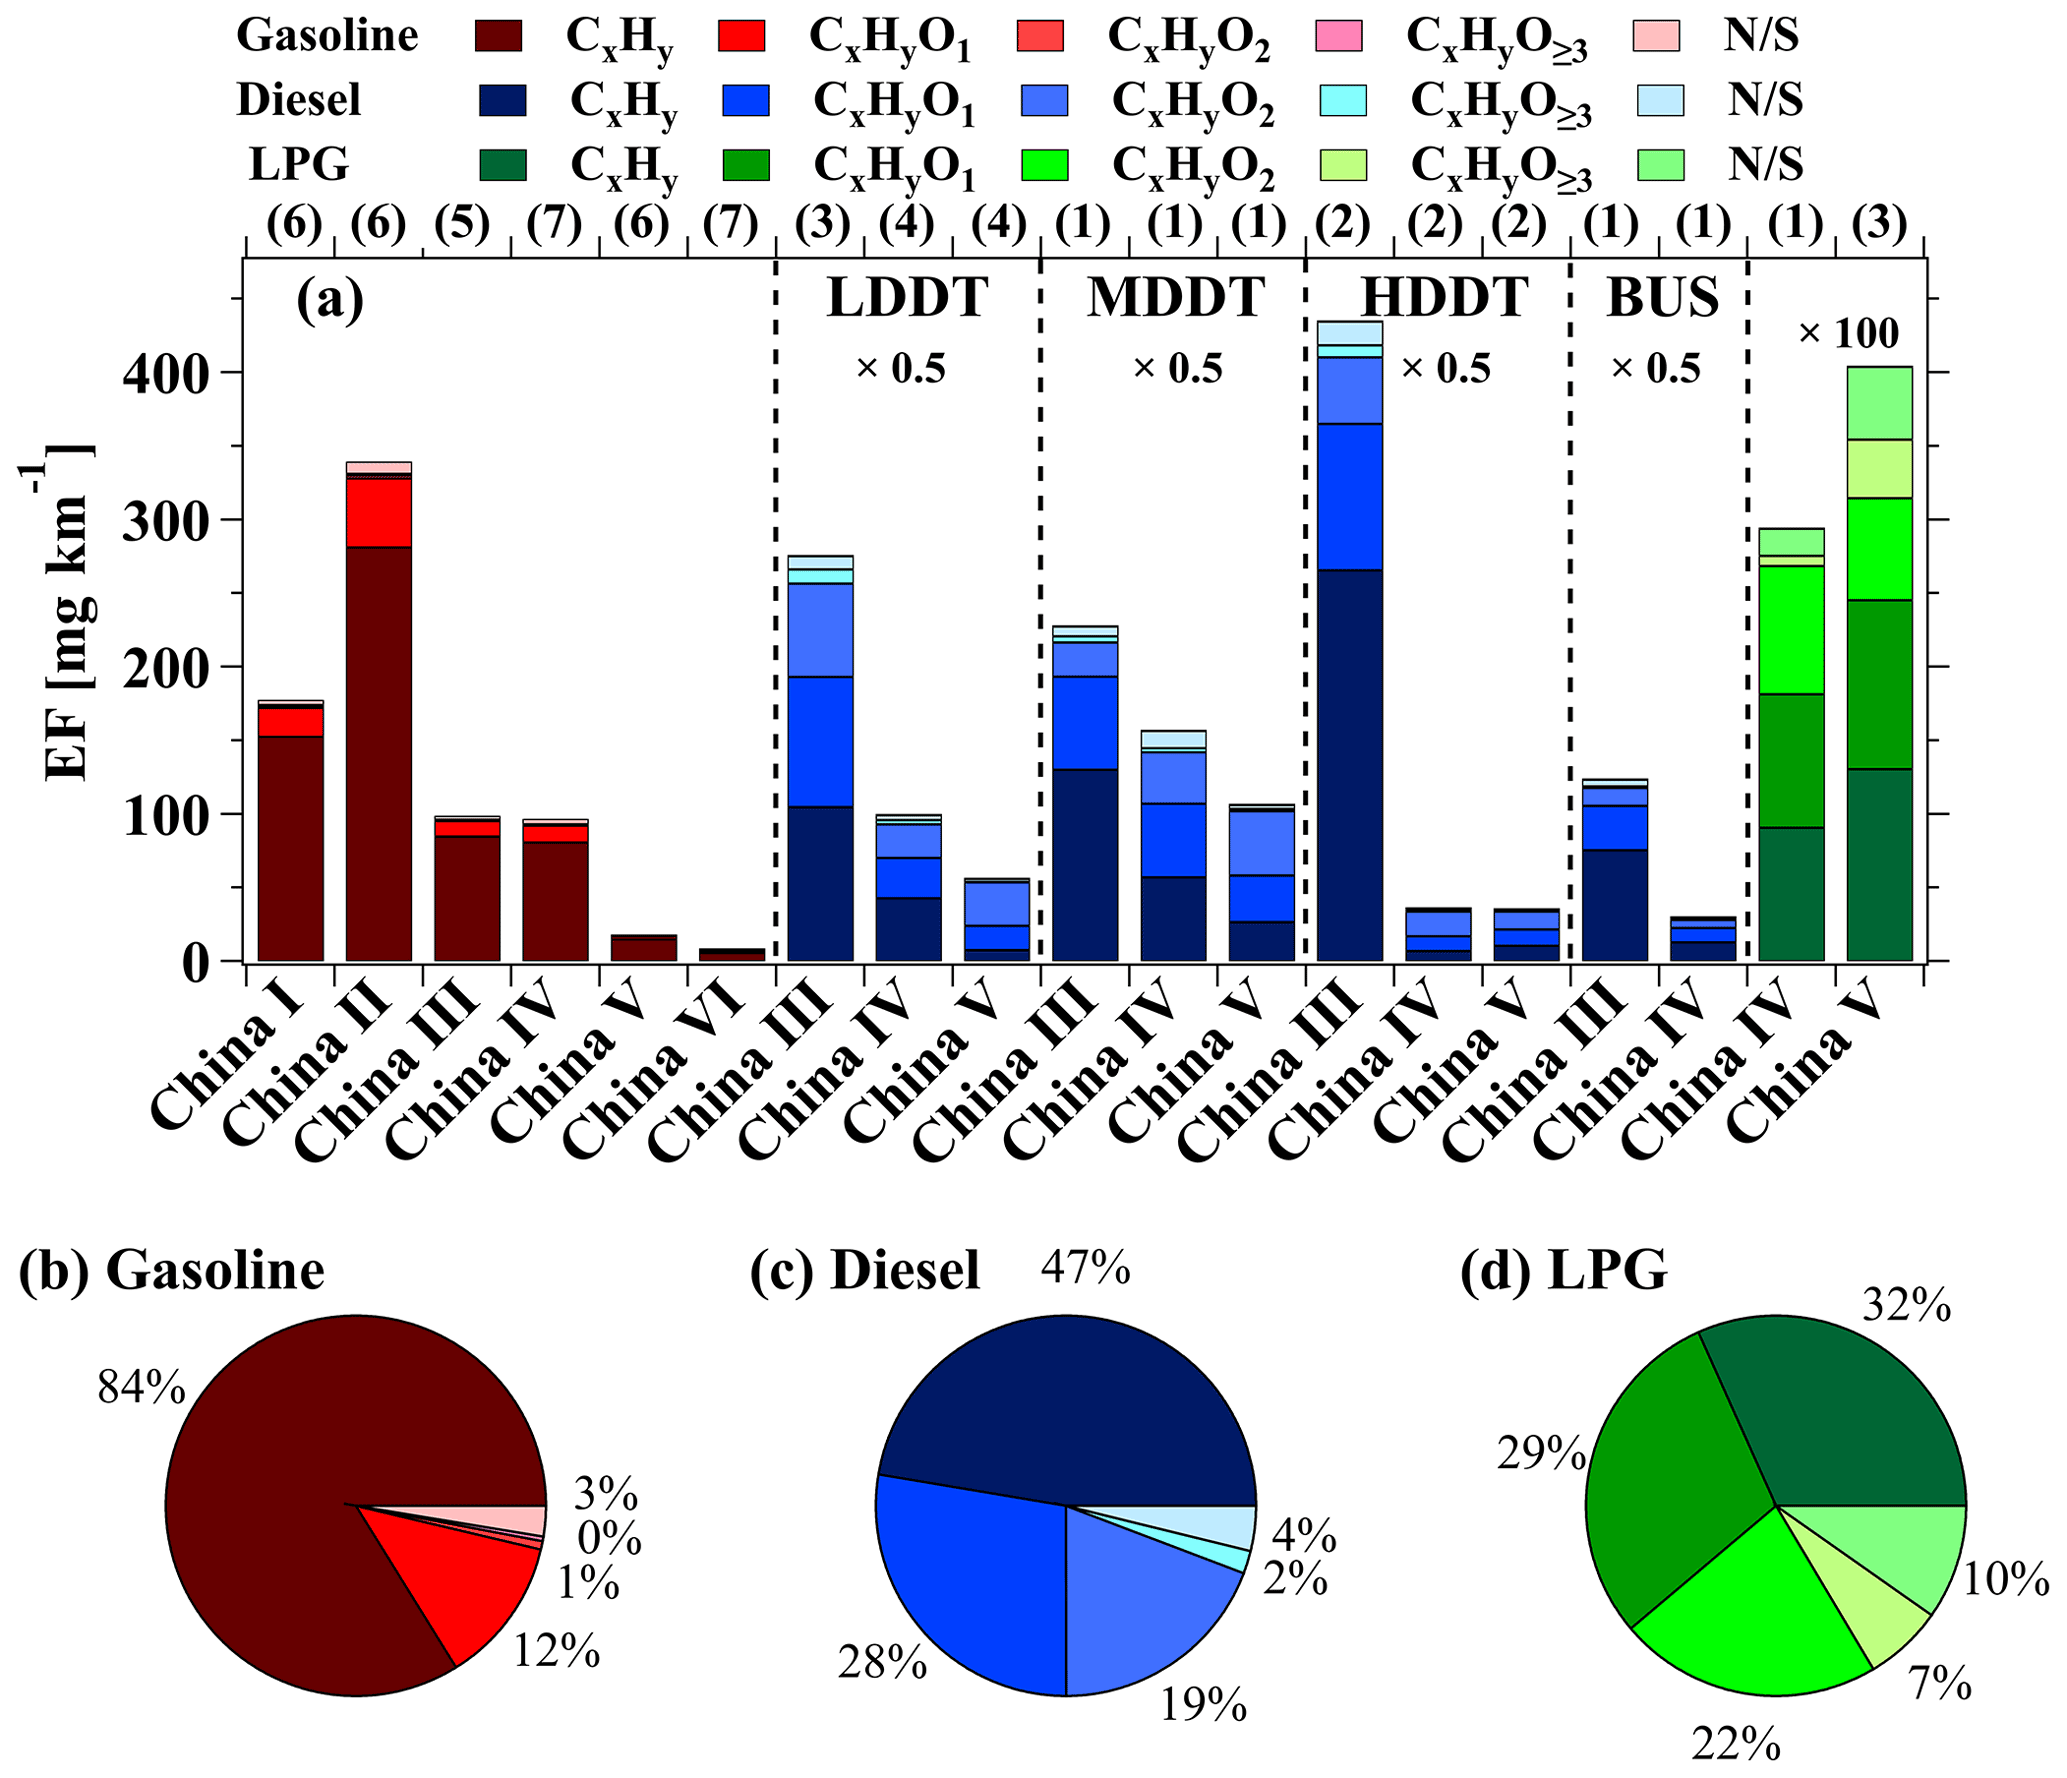
Figure 11(a) The determined average emission factors for different emission standards from gasoline, diesel (×0.5), and LPG (×100) vehicles measured by the PTR-ToF-MS. The different ion categories are discussed in the paper. Fractions of the determined average emission factors of VOC ions in different ion categories from (b) gasoline, (c) diesel, and (d) LPG vehicles. The numbers above the top axis represent the number of all experiments (including multiple measurements for an individual test vehicle) for each emission standard.
Combined with measurements of other VOCs from canisters measured by GC-MS/FID, the fractions of OVOCs in total VOC emissions can be determined for different vehicles (details in Sect. S6) (Fig. 12). OVOCs account for 9.4 % ± 5.6 % of total VOC emissions for gasoline vehicles. The OVOC fractions for gasoline vehicles are generally comparable for different emission standards and cold/hot starts, except somewhat higher fractions for China VI from hot starts (Fig. S11). The OVOC fractions obtained in this study for gasoline vehicles are generally consistent with previous results (Cao et al., 2016; M. Wang et al., 2020) (Fig. 12). Among these studies, the OVOC fractions determined for gasoline with 10 % ethanol (E10) (Roy et al., 2016) (22 % ± 11 %) are apparently higher. The fractions of OVOCs in total VOC emissions for diesel vehicles are 71 % ± 20 %, 65 % ± 22 %, 52 % ± 18 %, and 56 % ± 26 % for LDDT, MDDT, HDDT, and BUS, respectively. The variations in OVOC fractions with emission standards are observed to be mixed among different types of diesel vehicles (Fig. S11). The OVOC fractions from diesel vehicles are obviously higher than those in gasoline vehicles, indicating the importance of OVOCs in VOC emissions from diesel vehicles. Compared to previous studies (Tsai et al., 2012; Qiao et al., 2012; Cao et al., 2016; Mo et al., 2016), determined OVOC fractions for diesel vehicles in this study are higher. If only considering carbonyls among various types of OVOCs measured by the PTR-ToF-MS, the OVOC fractions determined in this study are more comparable with previous studies (Fig. 12) since most previous studies only detected carbonyls among various types of OVOCs. Finally, we determine that OVOCs account for 41 % ± 10 % of total VOC emissions for LPG vehicles, which is also higher than a previous study (M. Wang et al., 2020) in which only carbonyls and a few esters/alcohols were included. These results stress that the large number of OVOCs measured by the PTR-ToF-MS are important in the characterization of VOC emissions from vehicles. It should be noted that the OVOC fractions obtained here only reflect exhaust emissions. Evaporative emissions may also be associated with different fractions of various VOC groups, which may be more related to fuel compositions (Rubin et al., 2006; Huang et al., 2021).
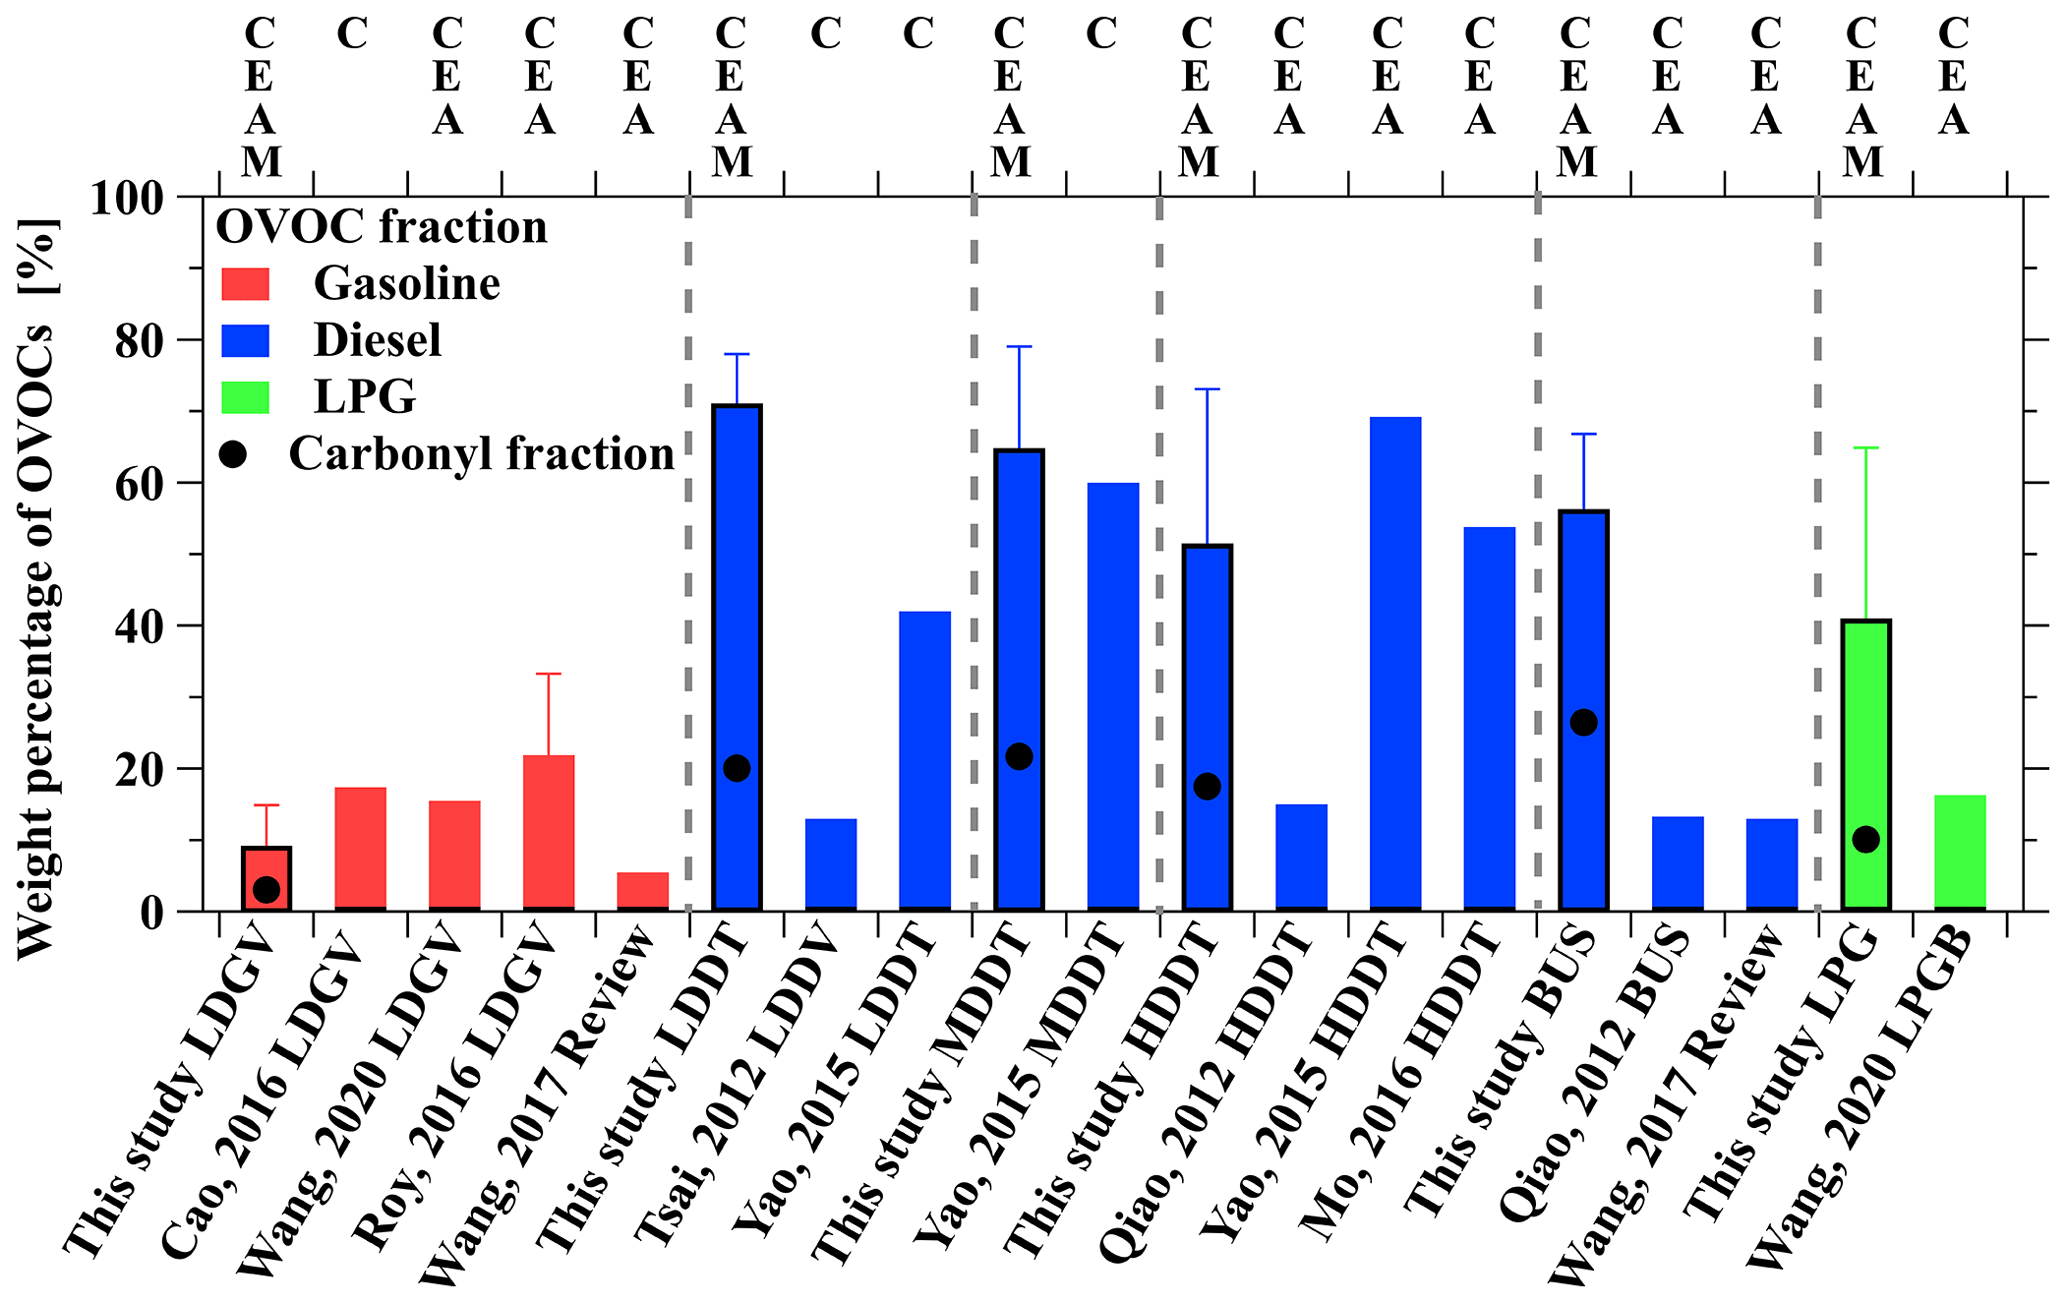
Figure 12Comparison of OVOC fractions determined in this study and those in previous studies. Error bars represent the standard deviations of the weight percentage of OVOCs. The C, E, A, and M above the top axis represent the four groups of OVOCs measured in this study or previous studies, including carbonyl (C), ester/ether (E), alcohol (A), and multiple-functional (M).
In this work, we conducted a chassis dynamometer study to measure VOC emissions from gasoline, diesel, and LPG vehicles using the PTR-ToF-MS along with other offline and online measurement techniques. Using this dataset, we provide emission factors of many VOCs from these three different types of vehicles associated with various emission standards in China. Our results show that emission factors of VOCs generally decrease with the increased stringency of emission standards for gasoline vehicles, whereas variations in emission factors for diesel vehicles with emission standards are more diverse. Mass spectrum analysis of the PTR-ToF-MS suggests that cold starts significantly influence VOC emissions of gasoline vehicles, while the influences are smaller for diesel vehicles.
We observe large differences in VOC emissions between gasoline and diesel vehicles based on PTR-ToF-MS measurements. Emission factors of most VOC species from diesel vehicles were higher than gasoline vehicles, especially for most OVOCs and heavier aromatics. The substantially larger emission factors of some OVOC emission factors for diesel vehicles indicate potentially dominant emissions of these species from diesel vehicles among vehicular emissions. Our results suggest that VOC pairs (e.g., C14 aromatics / toluene ratio) could potentially provide good indicators for distinguishing emissions between gasoline and diesel vehicles.
Based on measurements of the PTR-ToF-MS, CxHy ions account for the largest fraction in gasoline vehicles (84 % ± 5.9 %), whereas OVOC ions are the largest contributor in the mass spectra of emissions from diesel (49 % ± 16 %) and LPG vehicles (58 % ± 3.7 %). In the end, the fractions of OVOCs in total VOC emissions are determined by combining hydrocarbon measurements from canister results and online measurements of the PTR-ToF-MS. We show that OVOCs contribute 9.4 % ± 5.6 % of the total VOC emissions from gasoline vehicles, while the fractions are significantly higher for diesel vehicles (52 %–71 %), highlighting the importance of measuring these OVOC species in diesel emissions.
This study shows significant contributions of OVOCs in VOC emissions from various vehicles, especially diesel vehicles. As a consequence, vehicular emissions may account for considerable proportions of primary emissions of these OVOCs in urban regions. Emissions of many OVOC species are currently not fully represented in emission inventories of VOCs, which may in turn affect the prediction ability of air quality models in urban regions. In this study, OVOC species are mainly quantified from PTR-ToF-MS measurements by taking into account all signals in the mass spectra, which stress that the large number of OVOC species measured by the PTR-ToF-MS are important in the characterization of VOC emissions from vehicles.
Data are available from the authors upon request.
The supplement related to this article is available online at: https://doi.org/10.5194/acp-22-9703-2022-supplement.
BY designed the research. ZY, BY, and QS organized vehicle test measurements. SW, ChW, CaW, TL, JQ, QS, and MZ contributed to data collection. SW performed the data analysis, with contributions from TL, XH, YH, XBL, and QS. SW and BY prepared the manuscript with contributions from SL, HW, TK, MG, and MS. All the authors reviewed the manuscript.
At least one of the (co-)authors is a member of the editorial board of Atmospheric Chemistry and Physics. The peer-review process was guided by an independent editor, and the authors also have no other competing interests to declare.
Publisher's note: Copernicus Publications remains neutral with regard to jurisdictional claims in published maps and institutional affiliations.
The authors gratefully acknowledge the science team for their technical support and discussions during vehicular measurements. The authors would like to thank our colleague Junyu Zheng for providing many resources during the measurement and allowing us to use PEMS and formaldehyde data in this study. The authors appreciate valuable comments from two anonymous reviewers.
This work was supported by the National Key R & D Plan of China (grant nos. 2019YFE0106300, 2018YFC0213904), the National Natural Science Foundation of China (grant nos. 41877302, 42121004), Guangdong Natural Science Funds for Distinguished Young Scholar (grant no. 2018B030306037), the Guangdong Basic and Applied Basic Research Fund Project (grant no. 2020A1515110085), and the Guangdong Innovative and Entrepreneurial Research Team Program (grant no. 2016ZT06N263). This work was also supported by Special Fund Project for Science and Technology Innovation Strategy of Guangdong Province (grant no. 2019B121205004). Thomas Karl and Martin Graus were supported by OEAD grant CN 05/2020.
This paper was edited by Roya Bahreini and reviewed by two anonymous referees.
Barletta, B., Meinardi, S., Sherwood Rowland, F., Chan, C.-Y., Wang, X., Zou, S., Yin Chan, L., and Blake, D. R.: Volatile organic compounds in 43 Chinese cities, Atmos. Environ., 39, 5979-5990, https://doi.org/10.1016/j.atmosenv.2005.06.029, 2005.
Cao, X., Yao, Z., Shen, X., Ye, Y., and Jiang, X.: On-road emission characteristics of VOCs from light-duty gasoline vehicles in Beijing, China, Atmos. Environ., 124, 146–155, https://doi.org/10.1016/j.atmosenv.2015.06.019, 2016.
Cappellin, L., Karl, T., Probst, M., Ismailova, O., Winkler, P. M., Soukoulis, C., Aprea, E., Mark, T. D., Gasperi, F., and Biasioli, F.: On quantitative determination of volatile organic compound concentrations using proton transfer reaction time-of-flight mass spectrometry, Environ. Sci. Technol., 46, 2283–2290, https://doi.org/10.1021/es203985t, 2012.
Chan, C. Y., Chan, L. Y., Wang, X. M., Liu, Y. M., Lee, S. C., Zou, S. C., Sheng, G. Y., and Fu, J. M.: Volatile organic compounds in roadside microenvironments of metropolitan Hong Kong, Atmos. Environ., 36, 2039–2047, https://doi.org/10.1016/S1352-2310(02)00097-3, 2002.
Cui, L., Wang, X. L., Ho, K. F., Gao, Y., Liu, C., Hang Ho, S. S., Li, H. W., Lee, S. C., Wang, X. M., Jiang, B. Q., Huang, Y., Chow, J. C., Watson, J. G., and Chen, L.-W.: Decrease of VOC emissions from vehicular emissions in Hong Kong from 2003 to 2015: Results from a tunnel study, Atmos. Environ., 177, 64–74, https://doi.org/10.1016/j.atmosenv.2018.01.020, 2018.
Drozd, G. T., Zhao, Y., Saliba, G., Frodin, B., Maddox, C., Weber, R. J., Chang, M. O., Maldonado, H., Sardar, S., Robinson, A. L., and Goldstein, A. H.: Time Resolved Measurements of Speciated Tailpipe Emissions from Motor Vehicles: Trends with Emission Control Technology, Cold Start Effects, and Speciation, Environ. Sci. Technol., 50, 13592–13599, https://doi.org/10.1021/acs.est.6b04513, 2016.
Drozd, G. T., Zhao, Y., Saliba, G., Frodin, B., Maddox, C., Oliver Chang, M. C., Maldonado, H., Sardar, S., Weber, R. J., Robinson, A. L., and Goldstein, A. H.: Detailed Speciation of Intermediate Volatility and Semivolatile Organic Compound Emissions from Gasoline Vehicles: Effects of Cold-Starts and Implications for Secondary Organic Aerosol Formation, Environ. Sci. Technol., 53, 1706–1714, https://doi.org/10.1021/acs.est.8b05600, 2019.
Erickson, M. H., Gueneron, M., and Jobson, B. T.: Measuring long chain alkanes in diesel engine exhaust by thermal desorption PTR-MS, Atmos. Meas. Tech., 7, 225–239, https://doi.org/10.5194/amt-7-225-2014, 2014.
Gentner, D. R., Isaacman, G., Worton, D. R., Chan, A. W., Dallmann, T. R., Davis, L., Liu, S., Day, D. A., Russell, L. M., Wilson, K. R., Weber, R., Guha, A., Harley, R. A., and Goldstein, A. H.: Elucidating secondary organic aerosol from diesel and gasoline vehicles through detailed characterization of organic carbon emissions, P. Natl. Acad. Sci. USA, 109, 18318–18323, https://doi.org/10.1073/pnas.1212272109, 2012.
Gentner, D. R., Worton, D. R., Isaacman, G., Davis, L. C., Dallmann, T. R., Wood, E. C., Herndon, S. C., Goldstein, A. H., and Harley, R. A.: Chemical Composition of Gas-Phase Organic Carbon Emissions from Motor Vehicles and Implications for Ozone Production, Environ. Sci. Technol., 47, 11837–11848, https://doi.org/10.1021/es401470e, 2013.
Gentner, D. R., Jathar, S. H., Gordon, T. D., Bahreini, R., Day, D. A., El Haddad, I., Hayes, P. L., Pieber, S. M., Platt, S. M., de Gouw, J., Goldstein, A. H., Harley, R. A., Jimenez, J. L., Prevot, A. S., and Robinson, A. L.: Review of Urban Secondary Organic Aerosol Formation from Gasoline and Diesel Motor Vehicle Emissions, Environ. Sci. Technol., 51, 1074–1093, https://doi.org/10.1021/acs.est.6b04509, 2017.
George, I. J., Hays, M. D., Herrington, J. S., Preston, W., Snow, R., Faircloth, J., George, B. J., Long, T., and Baldauf, R. W.: Effects of Cold Temperature and Ethanol Content on VOC Emissions from Light-Duty Gasoline Vehicles, Environ. Sci. Technol., 49, 13067–13074, https://doi.org/10.1021/acs.est.5b04102, 2015.
Guo, H., Zou, S. C., Tsai, W. Y., Chan, L. Y., and Blake, D. R.: Emission characteristics of nonmethane hydrocarbons from private cars and taxis at different driving speeds in Hong Kong, Atmos. Environ., 45, 2711–2721, https://doi.org/10.1016/j.atmosenv.2011.02.053, 2011.
Han, C., Liu, R., Luo, H., Li, G., Ma, S., Chen, J., and An, T.: Pollution profiles of volatile organic compounds from different urban functional areas in Guangzhou China based on GC/MS and PTR-TOF-MS: Atmospheric environmental implications, Atmos. Environ., 214, 116843, https://doi.org/10.1016/j.atmosenv.2019.116843, 2019.
He, X., Yuan, B., Wu, C., Wang, S., Wang, C., Huangfu, Y., Qi, J., Ma, N., Xu, W., Wang, M., Chen, W., Su, H., Cheng, Y., and Shao, M.: Volatile organic compounds in wintertime North China Plain: Insights from measurements of proton transfer reaction time-of-flight mass spectrometer (PTR-ToF-MS), J. Environ. Sci., 114, 98–114, https://doi.org/10.1016/j.jes.2021.08.010, 2022.
Huang, J., Yuan, Z., Duan, Y., Liu, D., Fu, Q., Liang, G., Li, F., and Huang, X.: Quantification of temperature dependence of vehicle evaporative volatile organic compound emissions from different fuel types in China, Sci. Total Environ., 813, 152661, https://doi.org/10.1016/j.scitotenv.2021.152661, 2021.
Kansal, A.: Sources and reactivity of NMHCs and VOCs in the atmosphere: a review, J. Hazard Mater., 166, 17–26, https://doi.org/10.1016/j.jhazmat.2008.11.048, 2009.
Koss, A. R., Sekimoto, K., Gilman, J. B., Selimovic, V., Coggon, M. M., Zarzana, K. J., Yuan, B., Lerner, B. M., Brown, S. S., Jimenez, J. L., Krechmer, J., Roberts, J. M., Warneke, C., Yokelson, R. J., and de Gouw, J.: Non-methane organic gas emissions from biomass burning: identification, quantification, and emission factors from PTR-ToF during the FIREX 2016 laboratory experiment, Atmos. Chem. Phys., 18, 3299–3319, https://doi.org/10.5194/acp-18-3299-2018, 2018.
Kroll, J. H., Donahue, N. M., Jimenez, J. L., Kessler, S. H., Canagaratna, M. R., Wilson, K. R., Altieri, K. E., Mazzoleni, L. R., Wozniak, A. S., Bluhm, H., Mysak, E. R., Smith, J. D., Kolb, C. E., and Worsnop, D. R.: Carbon oxidation state as a metric for describing the chemistry of atmospheric organic aerosol, Nat. Chem., 3, 133–139, https://doi.org/10.1038/nchem.948, 2011.
Kumar, A., Sinha, V., Shabin, M., Hakkim, H., Bonsang, B., and Gros, V.: Non-methane hydrocarbon (NMHC) fingerprints of major urban and agricultural emission sources for use in source apportionment studies, Atmos. Chem. Phys., 20, 12133–12152, https://doi.org/10.5194/acp-20-12133-2020, 2020.
Laurikko, J.: Ambient temperature effect on automotive exhaust emissions: FTP and ECE test cycle responses, Sci. Environ., 169, 195–204, 1995.
Li, B., Ho, S. S. H., Xue, Y., Huang, Y., Wang, L., Cheng, Y., Dai, W., Zhong, H., Cao, J., and Lee, S.: Characterizations of volatile organic compounds (VOCs) from vehicular emissions at roadside environment: The first comprehensive study in Northwestern China, Atmos. Environ., 161, 1–12, https://doi.org/10.1016/j.atmosenv.2017.04.029, 2017.
Li, T., Wang, Z., Yuan, B., Ye, C., Lin, Y., Wang, S., Sha, Q. E., Yuan, Z., Zheng, J., and Shao, M.: Emissions of carboxylic acids, hydrogen cyanide (HCN) and isocyanic acid (HNCO) from vehicle exhaust, Atmos. Environ., 247, 118218, https://doi.org/10.1016/j.atmosenv.2021.118218, 2021.
Li, X., Wu, Y., Yao, X., Zhang, S., Zhou, Y., and Fu, L.: Evaluation of the environmental benefits of the enhanced vehicle inspection/maintenance program based on the short transient loaded mode in Guangzhou, Acta Scientiae Circumstantiae, 32, 101–108, https://doi.org/10.13671/j.hjkxxb.2012.01.009, 2012.
Liao, S., Zhang, J., Yu, F., Zhu, M., Liu, J., Ou, J., Dong, H., Sha, Q., Zhong, Z., Xie, Y., Luo, H., Zhang, L., and Zheng, J.: High Gaseous Nitrous Acid (HONO) Emissions from Light-Duty Diesel Vehicles, Environ. Sci. Technol., 55, 200–208, https://doi.org/10.1021/acs.est.0c05599, 2021.
Liu, H., Man, H., Cui, H., Wang, Y., Deng, F., Wang, Y., Yang, X., Xiao, Q., Zhang, Q., Ding, Y., and He, K.: An updated emission inventory of vehicular VOCs and IVOCs in China, Atmos. Chem. Phys., 17, 12709–12724, https://doi.org/10.5194/acp-17-12709-2017, 2017.
Liu, Y., Shao, M., Fu, L., Lu, S., Zeng, L., and Tang, D.: Source profiles of volatile organic compounds (VOCs) measured in China: Part I, Atmos. Environ., 42, 6247–6260, https://doi.org/10.1016/j.atmosenv.2008.01.070, 2008.
Liu, Y., Li, Y., Yuan, Z., Wang, H., Sha, Q., Lou, S., Liu, Y., Hao, Y., Duan, L., Ye, P., Zheng, J., Yuan, B., and Shao, M.: Identification of two main origins of intermediate-volatility organic compound emissions from vehicles in China through two-phase simultaneous characterization, Environ. Pollut., 281, 117020, https://doi.org/10.1016/j.envpol.2021.117020, 2021.
Lu, Q., Zhao, Y., and Robinson, A. L.: Comprehensive organic emission profiles for gasoline, diesel, and gas-turbine engines including intermediate and semi-volatile organic compound emissions, Atmos. Chem. Phys., 18, 17637–17654, https://doi.org/10.5194/acp-18-17637-2018, 2018.
Ly, B. T., Kajii, Y., Nguyen, T. Y., Shoji, K., Van, D. A., Do, T. N., Nghiem, T. D., and Sakamoto, Y.: Characteristics of roadside volatile organic compounds in an urban area dominated by gasoline vehicles, a case study in Hanoi, Chemosphere, 254, 126749, https://doi.org/10.1016/j.chemosphere.2020.126749, 2020.
Lyu, M., Bao, X., Zhu, R., and Matthews, R.: State-of-the-art outlook for light-duty vehicle emission control standards and technologies in China, Clean Technol. Environ. Policy, 22, 757–771, https://doi.org/10.1007/s10098-020-01834-x, 2020.
May, A. A., Nguyen, N. T., Presto, A. A., Gordon, T. D., Lipsky, E. M., Karve, M., Gutierrez, A., Robertson, W. H., Zhang, M., Brandow, C., Chang, O., Chen, S., Cicero-Fernandez, P., Dinkins, L., Fuentes, M., Huang, S.-M., Ling, R., Long, J., Maddox, C., Massetti, J., McCauley, E., Miguel, A., Na, K., Ong, R., Pang, Y., Rieger, P., Sax, T., Truong, T., Vo, T., Chattopadhyay, S., Maldonado, H., Maricq, M. M., and Robinson, A. L.: Gas- and particle-phase primary emissions from in-use, on-road gasoline and diesel vehicles, Atmos. Environ., 88, 247–260, https://doi.org/10.1016/j.atmosenv.2014.01.046, 2014.
MEEPRC – Ministry of Ecological and Environment of the People's Republic of China: China Mobile Source Environmental Management Annual Report, http://www.mee.gov.cn/hjzl/sthjzk/ydyhjgl/201909/P020190905586230826402.pdf (last access: 28 July 2022), 2019.
Mo, Z., Shao, M., and Lu, S.: Compilation of a source profile database for hydrocarbon and OVOC emissions in China, Atmos. Environ., 143, 209–217, https://doi.org/10.1016/j.atmosenv.2016.08.025, 2016.
National Research Council: Permissible Exposure Levels for Selected Military Fuel Vapors, The National Academies Press, Washington, DC, https://doi.org/10.17226/9133, 1996.
Ou, J., Zheng, J., Li, R., Huang, X., Zhong, Z., Zhong, L., and Lin, H.: Speciated OVOC and VOC emission inventories and their implications for reactivity-based ozone control strategy in the Pearl River Delta region, China, Sci. Total Environ., 530–531, 393–402, https://doi.org/10.1016/j.scitotenv.2015.05.062, 2015.
Pang, X., Mu, Y., Yuan, J., and He, H.: Carbonyls emission from ethanol-blended gasoline and biodiesel-ethanol-diesel used in engines, Atmos. Environ., 42, 1349–1358, https://doi.org/10.1016/j.atmosenv.2007.10.075, 2008.
Parrish, D. D., Kuster, W. C., Shao, M., Yokouchi, Y., Kondo, Y., Goldan, P. D., de Gouw, J. A., Koike, M., and Shirai, T.: Comparison of air pollutant emissions among mega-cities, Atmos. Environ., 43, 6435–6441, https://doi.org/10.1016/j.atmosenv.2009.06.024, 2009.
Qi, L., Liu, H., Shen, X., Fu, M., Huang, F., Man, H., Deng, F., Shaikh, A. A., Wang, X., Dong, R., Song, C., and He, K.: Intermediate-Volatility Organic Compound Emissions from Nonroad Construction Machinery under Different Operation Modes, Environ. Sci. Technol., 53, 13832–13840, https://doi.org/10.1021/acs.est.9b01316, 2019.
Qiao, Y. Z., Wang, H. L., Huang, C., Chen, C. H., and Huang, H. Y.: Source profile and chemical reactivity of volatile organic compounds from vehicle exhaust(in chinese), Environ. Sci., 33, 1071–1079, 2012.
Roy, A., Sonntag, D., Cook, R., Yanca, C., Schenk, C., and Choi, Y.: Effect of Ambient Temperature on Total Organic Gas Speciation Profiles from Light-Duty Gasoline Vehicle Exhaust, Environ. Sci. Technol., 50, 6565–6573, https://doi.org/10.1021/acs.est.6b01081, 2016.
Rubin, J. I., Kean, A. J., Harley, R. A., Millet, D. B., and Goldstein, A. H.: Temperature dependence of volatile organic compound evaporative emissions from motor vehicles, J. Geophys. Res.-Atmos., 111, D03305, https://doi.org/10.1029/2005JD006458, 2006.
Schauer, J. J., Kleeman, M. J., Cass, G. R., and Simoneit, B. R. T.: Measurement of Emissions from Air Pollution Sources. 2. C1 through C30 Organic Compounds from Medium Duty Diesel Trucks, Environ. Sci. Technol., 33, 1578–1587, 1999.
Seinfeld, J. H. and Pandis, S. N.: Atmospheric chemistry and physics: from air pollution to climate change, John Wiley & Sons, Inc., Hoboken, ISBN 0471720186, 2006.
Sekimoto, K., Li, S.-M., Yuan, B., Koss, A., Coggon, M., Warneke, C., and de Gouw, J.: Calculation of the sensitivity of proton-transfer-reaction mass spectrometry (PTR-MS) for organic trace gases using molecular properties, Int. J. Mass Spectrom., 421, 71–94, https://doi.org/10.1016/j.ijms.2017.04.006, 2017.
Sha, Q., Zhu, M., Huang, H., Wang, Y., Huang, Z., Zhang, X., Tang, M., Lu, M., Chen, C., Shi, B., Chen, Z., Wu, L., Zhong, Z., Li, C., Xu, Y., Yu, F., Jia, G., Liao, S., Cui, X., Liu, J., and Zheng, J.: A newly integrated dataset of volatile organic compounds (VOCs) source profiles and implications for the future development of VOCs profiles in China, Sci. Total Environ., 793, 148348, https://doi.org/10.1016/j.scitotenv.2021.148348, 2021.
Shao, M., Zhang, Y., Zeng, L., Tang, X., Zhang, J., Zhong, L., and Wang, B.: Ground-level ozone in the Pearl River Delta and the roles of VOC and NOx in its production, J. Environ. Manage., 90, 512–518, https://doi.org/10.1016/j.jenvman.2007.12.008, 2009.
Shen, X., Lv, T., Zhang, X., Cao, X., Li, X., Wu, B., Yao, X., Shi, Y., Zhou, Q., Chen, X., and Yao, Z.: Real-world emission characteristics of black carbon emitted by on-road China IV and China V diesel trucks, Sci. Total Environ., 799, 149435, https://doi.org/10.1016/j.scitotenv.2021.149435, 2021.
Song, C., Liu, Y., Sun, L., Zhang, Q., and Mao, H.: Emissions of volatile organic compounds (VOCs) from gasoline- and liquified natural gas (LNG)-fueled vehicles in tunnel studies, Atmos. Environ., 234, 117626, https://doi.org/10.1016/j.atmosenv.2020.117626, 2020.
Stark, H., Yatavelli, R. L. N., Thompson, S. L., Kimmel, J. R., Cubison, M. J., Chhabra, P. S., Canagaratna, M. R., Jayne, J. T., Worsnop, D. R., and Jimenez, J. L.: Methods to extract molecular and bulk chemical information from series of complex mass spectra with limited mass resolution, Int. J. Mass Spectrom., 389, 26–38, https://doi.org/10.1016/j.ijms.2015.08.011, 2015.
Sulzer, P., Hartungen, E., Hanel, G., Feil, S., Winkler, K., Mutschlechner, P., Haidacher, S., Schottkowsky, R., Gunsch, D., Seehauser, H., Striednig, M., Jürschik, S., Breiev, K., Lanza, M., Herbig, J., Märk, L., Märk, T. D., and Jordan, A.: A Proton Transfer Reaction-Quadrupole interface Time-Of-Flight Mass Spectrometer (PTR-QiTOF): High speed due to extreme sensitivity, Int. J. Mass Spectrom., 368, 1–5, https://doi.org/10.1016/j.ijms.2014.05.004, 2014.
Sun, W., Shao, M., Granier, C., Liu, Y., Ye, C. S., and Zheng, J. Y.: Long-Term Trends of Anthropogenic SO2, NOx, CO, and NMVOCs Emissions in China, Earth's Future, 6, 1112–1133, https://doi.org/10.1029/2018ef000822, 2018.
Tsai, J.-H., Chang, S.-Y., and Chiang, H.-L.: Volatile organic compounds from the exhaust of light-duty diesel vehicles, Atmos. Environ., 61, 499–506, https://doi.org/10.1016/j.atmosenv.2012.07.078, 2012.
Wallington, T. J., Lambert, C. K., and Ruona, W. C.: Diesel vehicles and sustainable mobility in the US, Energy Policy, 54, 47–53, https://doi.org/10.1016/j.enpol.2011.11.068, 2013.
Wang, C., Yuan, B., Wu, C., Wang, S., Qi, J., Wang, B., Wang, Z., Hu, W., Chen, W., Ye, C., Wang, W., Sun, Y., Wang, C., Huang, S., Song, W., Wang, X., Yang, S., Zhang, S., Xu, W., Ma, N., Zhang, Z., Jiang, B., Su, H., Cheng, Y., Wang, X., and Shao, M.: Measurements of higher alkanes using NO+ chemical ionization in PTR-ToF-MS: important contributions of higher alkanes to secondary organic aerosols in China, Atmos. Chem. Phys., 20, 14123–14138, https://doi.org/10.5194/acp-20-14123-2020, 2020.
Wang, H. L., Jing, S. A., Lou, S. R., Hu, Q. Y., Li, L., Tao, S. K., Huang, C., Qiao, L. P., and Chen, C. H.: Volatile organic compounds (VOCs) source profiles of on-road vehicle emissions in China, Sci. Total Environ., 607–608, 253–261, https://doi.org/10.1016/j.scitotenv.2017.07.001, 2017.
Wang, J., Jin, L., Gao, J., Shi, J., Zhao, Y., Liu, S., Jin, T., Bai, Z., and Wu, C. Y.: Investigation of speciated VOC in gasoline vehicular exhaust under ECE and EUDC test cycles, Sci. Total Environ., 445–446, 110–116, https://doi.org/10.1016/j.scitotenv.2012.12.044, 2013.
Wang, M., Li, S., Zhu, R., Zhang, R., Zu, L., Wang, Y., and Bao, X.: On-road tailpipe emission characteristics and ozone formation potentials of VOCs from gasoline, diesel and liquefied petroleum gas fueled vehicles, Atmos. Environ., 223, 117294, https://doi.org/10.1016/j.atmosenv.2020.117294, 2020.
Wang, Z., Yuan, B., Ye, C., Roberts, J., Wisthaler, A., Lin, Y., Li, T., Wu, C., Peng, Y., Wang, C., Wang, S., Yang, S., Wang, B., Qi, J., Wang, C., Song, W., Hu, W., Wang, X., Xu, W., Ma, N., Kuang, Y., Tao, J., Zhang, Z., Su, H., Cheng, Y., Wang, X., and Shao, M.: High Concentrations of Atmospheric Isocyanic Acid (HNCO) Produced from Secondary Sources in China, Environ. Sci. Technol., 54, 11818–11826, https://doi.org/10.1021/acs.est.0c02843, 2020.
Wu, C., Wang, C., Wang, S., Wang, W., Yuan, B., Qi, J., Wang, B., Wang, H., Wang, C., Song, W., Wang, X., Hu, W., Lou, S., Ye, C., Peng, Y., Wang, Z., Huangfu, Y., Xie, Y., Zhu, M., Zheng, J., Wang, X., Jiang, B., Zhang, Z., and Shao, M.: Measurement report: Important contributions of oxygenated compounds to emissions and chemistry of volatile organic compounds in urban air, Atmos. Chem. Phys., 20, 14769–14785, https://doi.org/10.5194/acp-20-14769-2020, 2020.
Wu, R., Bo, Y., Li, J., Li, L., Li, Y., and Xie, S.: Method to establish the emission inventory of anthropogenic volatile organic compounds in China and its application in the period 2008–2012, Atmos. Environ., 127, 244–254, https://doi.org/10.1016/j.atmosenv.2015.12.015, 2016.
Wu, Y., Zhang, S., Hao, J., Liu, H., Wu, X., Hu, J., Walsh, M. P., Wallington, T. J., Zhang, K. M., and Stevanovic, S.: On-road vehicle emissions and their control in China: A review and outlook, Sci. Total Environ., 574, 332–349, https://doi.org/10.1016/j.scitotenv.2016.09.040, 2017.
Yang, W., Zhang, Q., Wang, J., Zhou, C., Zhang, Y., and Pan, Z.: Emission characteristics and ozone formation potentials of VOCs from gasoline passenger cars at different driving modes, Atmos. Pollut. Res., 9, 804–813, https://doi.org/10.1016/j.apr.2018.01.002, 2018.
Yao, S., Liu, Z., and Qi, Z.: Test System for Exhaust Pollutants from Light-duty Gasoline Vehicle under Short Transient Driving Cycle, Shanghai Environm. Sci., 10, 722–728, 2003.
Yao, Z., Shen, X., Ye, Y., Cao, X., Jiang, X., Zhang, Y., and He, K.: On-road emission characteristics of VOCs from diesel trucks in Beijing, China, Atmos. Environ., 103, 87–93, https://doi.org/10.1016/j.atmosenv.2014.12.028, 2015.
Ye, C., Yuan, B., Lin, Y., Wang, Z., Hu, W., Li, T., Chen, W., Wu, C., Wang, C., Huang, S., Qi, J., Wang, B., Wang, C., Song, W., Wang, X., Zheng, E., Krechmer, J. E., Ye, P., Zhang, Z., Wang, X., Worsnop, D. R., and Shao, M.: Chemical characterization of oxygenated organic compounds in the gas phase and particle phase using iodide CIMS with FIGAERO in urban air, Atmos. Chem. Phys., 21, 8455–8478, https://doi.org/10.5194/acp-21-8455-2021, 2021.
Yuan, B., Koss, A. R., Warneke, C., Coggon, M., Sekimoto, K., and de Gouw, J. A.: Proton-Transfer-Reaction Mass Spectrometry: Applications in Atmospheric Sciences, Chem. Rev., 117, 13187–13229, https://doi.org/10.1021/acs.chemrev.7b00325, 2017.
Yue, X., Wu, Y., Hao, J., Pang, Y., Ma, Y., Li, Y., Li, B., and Bao, X.: Fuel quality management versus vehicle emission control in China, status quo and future perspectives, Energy Policy, 79, 87–98, https://doi.org/10.1016/j.enpol.2015.01.009, 2015.
Zavala, M., Herndon, S. C., Slott, R. S., Dunlea, E. J., Marr, L. C., Shorter, J. H., Zahniser, M., Knighton, W. B., Rogers, T. M., Kolb, C. E., Molina, L. T., and Molina, M. J.: Characterization of on-road vehicle emissions in the Mexico City Metropolitan Area using a mobile laboratory in chase and fleet average measurement modes during the MCMA-2003 field campaign, Atmos. Chem. Phys., 6, 5129–5142, https://doi.org/10.5194/acp-6-5129-2006, 2006.
Zavala, M., Herndon, S. C., Wood, E. C., Jayne, J. T., Nelson, D. D., Trimborn, A. M., Dunlea, E., Knighton, W. B., Mendoza, A., Allen, D. T., Kolb, C. E., Molina, M. J., and Molina, L. T.: Comparison of emissions from on-road sources using a mobile laboratory under various driving and operational sampling modes, Atmos. Chem. Phys., 9, 1–14, https://doi.org/10.5194/acp-9-1-2009, 2009.
Zhang, Q., Wu, L., Fang, X., Liu, M., Zhang, J., Shao, M., Lu, S., and Mao, H.: Emission factors of volatile organic compounds (VOCs) based on the detailed vehicle classification in a tunnel study, Sci. Total Environ., 624, 878–886, https://doi.org/10.1016/j.scitotenv.2017.12.171, 2018.
Zhao, Y., Saleh, R., Saliba, G., Presto, A. A., Gordon, T. D., Drozd, G. T., Goldstein, A. H., Donahue, N. M., and Robinson, A. L.: Reducing secondary organic aerosol formation from gasoline vehicle exhaust, P. Natl. Acad. Sci. USA, 114, 6984–6989, https://doi.org/10.1073/pnas.1620911114, 2017.
Zhou, H., Zhao, H., Hu, J., Li, M., Feng, Q., Qi, J., Shi, Z., Mao, H., and Jin, T.: Primary particulate matter emissions and estimates of secondary organic aerosol formation potential from the exhaust of a China V diesel engine, Atmos. Environ., 218, 116987, https://doi.org/10.1016/j.atmosenv.2019.116987, 2019.
Zhu, M., Dong, H., Yu, F., Liao, S., Xie, Y., Liu, J., Sha, Q., Zhong, Z., Zeng, L., and Zheng, J.: A New Portable Instrument for Online Measurements of Formaldehyde: From Ambient to Mobile Emission Sources, Environ. Sci. Technol. Lett., 7, 292–297, https://doi.org/10.1021/acs.estlett.0c00169, 2020.
Ziemann, P. J. and Atkinson, R.: Kinetics, products, and mechanisms of secondary organic aerosol formation, Chem. Soc. Rev., 41, 6582–6605, https://doi.org/10.1039/c2cs35122f, 2012.