the Creative Commons Attribution 4.0 License.
the Creative Commons Attribution 4.0 License.
 | 20 Jul 2022
Climate consequences of hydrogen emissions
Steven P. Hamburg
Given the urgency to decarbonize global energy systems, governments and industry are moving ahead with efforts to increase deployment of hydrogen technologies, infrastructure, and applications at an unprecedented pace, including USD billions in national incentives and direct investments. While zero- and low-carbon hydrogen hold great promise to help solve some of the world's most pressing energy challenges, hydrogen is also an indirect greenhouse gas whose warming impact is both widely overlooked and underestimated. This is largely because hydrogen's atmospheric warming effects are short-lived – lasting only a couple decades – but standard methods for characterizing climate impacts of gases consider only the long-term effect from a one-time pulse of emissions. For gases whose impacts are short-lived, like hydrogen, this long-term framing masks a much stronger warming potency in the near to medium term. This is of concern because hydrogen is a small molecule known to easily leak into the atmosphere, and the total amount of emissions (e.g., leakage, venting, and purging) from existing hydrogen systems is unknown. Therefore, the effectiveness of hydrogen as a decarbonization strategy, especially over timescales of several decades, remains unclear. This paper evaluates the climate consequences of hydrogen emissions over all timescales by employing already published data to assess its potency as a climate forcer, evaluate the net warming impacts from replacing fossil fuel technologies with their clean hydrogen alternatives, and estimate temperature responses to projected levels of hydrogen demand. We use the standard global warming potential metric, given its acceptance to stakeholders, and incorporate newly published equations that more fully capture hydrogen's several indirect effects, but we consider the effects of constant rather than pulse emissions over multiple time horizons. We account for a plausible range of hydrogen emission rates and include methane emissions when hydrogen is produced via natural gas with carbon capture, usage, and storage (CCUS) (“blue” hydrogen) as opposed to renewables and water (“green” hydrogen). For the first time, we show the strong timescale dependence when evaluating the climate change mitigation potential of clean hydrogen alternatives, with the emission rate determining the scale of climate benefits or disbenefits. For example, green hydrogen applications with higher-end emission rates (10 %) may only cut climate impacts from fossil fuel technologies in half over the first 2 decades, which is far from the common perception that green hydrogen energy systems are climate neutral. However, over a 100-year period, climate impacts could be reduced by around 80 %. On the other hand, lower-end emissions (1 %) could yield limited impacts on the climate over all timescales. For blue hydrogen, associated methane emissions can make hydrogen applications worse for the climate than fossil fuel technologies for several decades if emissions are high for both gases; however, blue hydrogen yields climate benefits over a 100-year period. While more work is needed to evaluate the warming impact of hydrogen emissions for specific end-use cases and value-chain pathways, it is clear that hydrogen emissions matter for the climate and warrant further attention from scientists, industry, and governments. This is critical to informing where and how to deploy hydrogen effectively in the emerging decarbonized global economy.
- Article
(2843 KB) - Full-text XML
- Comment
- BibTeX
- EndNote


Hydrogen is now considered an essential component in transitioning to a low-carbon global economy and achieving net-zero greenhouse gas emission targets. This is due to its potential to be a zero or near-zero carbon energy carrier to replace fossil fuel use, including in hard-to-abate sectors and for storage of renewable electricity (International Energy Agency, 2021). Dozens of countries have recently released plans to scale up clean hydrogen production and consumption, and USD 500 billion could be spent across the globe on hydrogen developments by 2030 (Hydrogen Council, 2021a). However, one climate concern has been largely absent in recent conversations and assessments of the role of hydrogen (International Energy Agency, 2019, 2021; BloombergNEF, 2020a; Bartlett and Krupnick, 2020; van Renssen, 2020; World Energy Council, 2021; Hydrogen Council, 2021a; Ueckerdt et al., 2021; International Renewable Energy Agency, 2022): the warming effects from hydrogen emitted into the atmosphere.
Scientists have long known and cautioned that hydrogen has indirect warming impacts (Ehhalt et al., 2001; Derwent et al., 2001, 2006, 2020; Prather, 2003; Schultz et al., 2003; Warwick et al., 2004, 2022; Colella et al., 2005; Wuebbles et al., 2010; Derwent, 2018; Paulot et al., 2021; Field and Derwent, 2021). When it escapes into the atmosphere, hydrogen has two main fates: around 70 %–80 % is estimated to be removed by soils via diffusion and bacterial uptake, and the remaining 20 %–30 % is oxidized by reacting with the naturally occurring hydroxyl radical (OH), yielding an atmospheric lifetime of around a few years (Rahn et al., 2003; Derwent, 2018; Paulot et al., 2021; Warwick et al., 2022). The oxidation of hydrogen in the atmosphere leads to increasing concentrations of greenhouse gases in both the troposphere and stratosphere, as described in Fig. 1 (Derwent, 2018; Derwent et al., 2020; Paulot et al., 2021; Field and Derwent, 2021; Warwick et al., 2022).
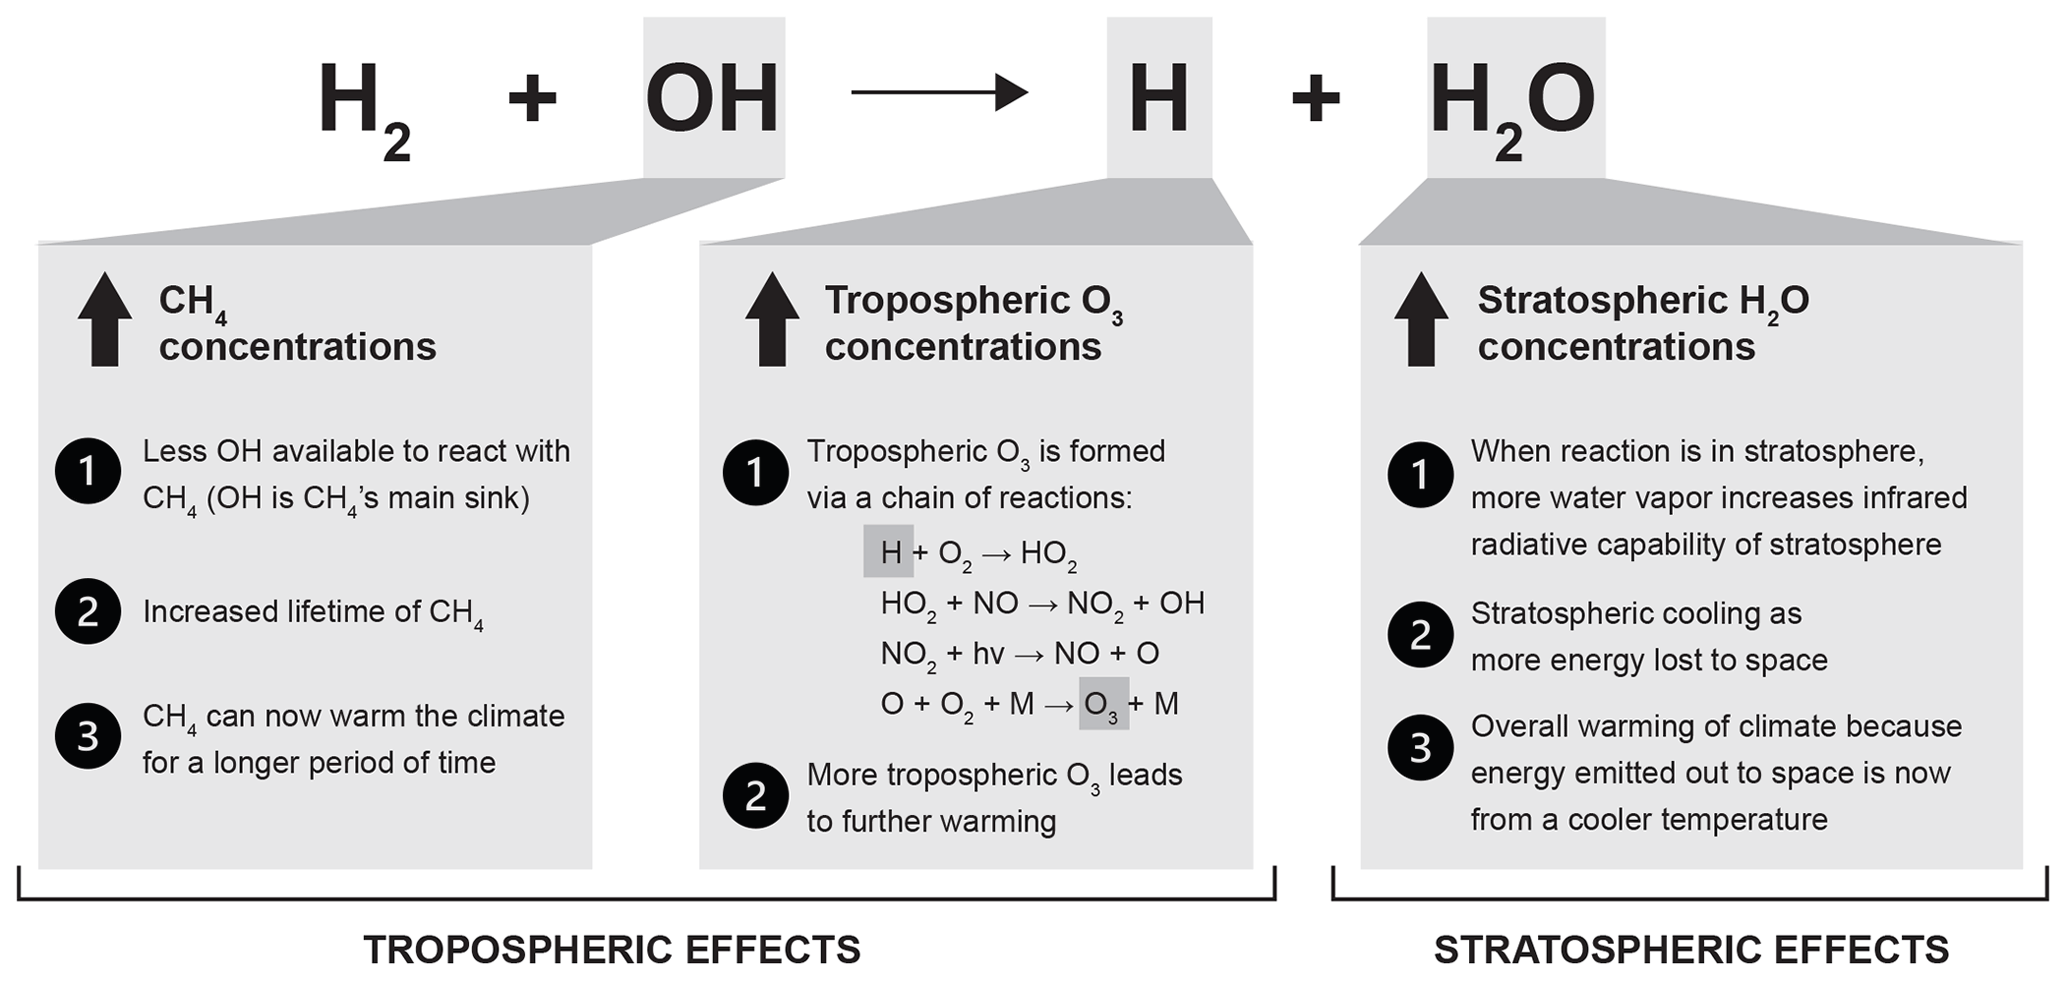
Figure 1Effects of hydrogen oxidation on atmospheric greenhouse gas concentrations and warming.
In the troposphere, less OH is available to react with methane; given that methane's reaction with OH is its primary sink, this leads to a longer atmospheric lifetime for methane which accounts for around half of hydrogen's total indirect warming effect (Paulot et al., 2021). Moreover, the production of atomic hydrogen from hydrogen oxidation in the troposphere leads to a series of reactions that ultimately form tropospheric ozone, a greenhouse gas that accounts for about 20 % of hydrogen's radiative impacts (Paulot et al., 2021). In the stratosphere, the oxidation of hydrogen increases water vapor, which, in turn, increases the infrared radiative capacity of the stratosphere, leading to stratospheric cooling and an overall warming effect on the climate because energy emitted out to space is now from a cooler temperature; this stratospheric effect accounts for about 30 % of hydrogen's climate impacts (Paulot et al., 2021). Stratospheric cooling can also lead to an increase in stratospheric polar clouds that enable more ozone-destroying reactions to occur; however, to date, these effects have been deemed as minor (Tromp et al., 2003; Warwick et al., 2004, 2022; Jacobson, 2008; van Ruijven et al., 2011; Vogel et al., 2011, 2012; Wang et al., 2013; Wuebbles et al., 2010; Derwent, 2018; Paulot et al., 2021).
A growing body of research has affirmed that the warming effects from hydrogen emissions are consequential, with new work showing that hydrogen's indirect warming effects are twice as high as previously recognized (Paulot et al., 2021; Warwick et al., 2022); this is due to the inclusion of stratospheric effects that were not considered until recently (Derwent, 2018; Derwent et al., 2020). Studies that take both tropospheric and stratospheric effects from hydrogen emissions into account report an indirect radiative efficiency of 0.13 and 0.18 mW m−2 ppbv−1, respectively (Paulot et al., 2021; Warwick et al., 2022), whereas studies that only consider tropospheric effects suggest an indirect radiative efficiency of around 0.08 mW m−2 ppbv−1 (Derwent, 2018; Derwent et al., 2020). Converting hydrogen's full atmospheric radiative efficiencies to per unit mass (3.64 and 5.04 W m−2 kg−1) and comparing them to the radiative efficiencies of carbon dioxide (CO2) and methane (1.7 W m−2 kg−1 and 2.0 W m−2 kg−1, respectively) shows that hydrogen's indirect warming potency per unit mass is around 200 times that of carbon dioxide and larger than that of methane (Forster et al., 2021). However, like methane, hydrogen's warming effects are potent but short-lived. Some of hydrogen's effects are shorter-lived than methane's – occurring within a decade after emission – but its impacts on methane can affect the climate for roughly an additional decade (Warwick et al., 2022).
Hydrogen's warming effects have major implications for an emerging hydrogen economy because hydrogen is a tiny molecule that is hard to contain. It can leak across the entire value chain, including from electrolyzers, compressors, liquefiers, storage tanks, geologic storage, pipelines, trucks, trains, ships, and fueling stations (Bond et al., 2011; van Ruijven et al., 2011; Melaina et al., 2013; Cooper et al., 2022; Frazer-Nash Consultancy, 2022). Furthermore, some hydrogen is deliberately vented and purged into the atmosphere from these systems (Frazer-Nash Consultancy, 2022).
While it is clear that hydrogen leakage poses a risk to decarbonization goals, given its potency as an indirect greenhouse gas, there are several challenges associated with determining the overall magnitude and, thus, importance of its warming impacts on the effectiveness of hydrogen as a decarbonization strategy. First, there is the uncertainty involved with how much hydrogen will ultimately be emitted from hydrogen systems. The total amount of emissions (e.g. leakage, venting, and purging) in current hydrogen systems remains unknown as empirical data on leakage rates from specific infrastructure (such as electrolyzers, pipelines, vehicles, and storage) are completely lacking. This is because measurement efforts to date have been concentrated on safety concerns, regulations, and risk assessment, which are focused on larger leaks. Commercially available sensing technologies able to detect smaller leaks – that would impact the climate but not safety – are unavailable (Mejia et al., 2020). Furthermore, most of the hydrogen infrastructure needed to achieve decarbonization goals has yet to be built, with plans underway to develop more pipelines and even to pump hydrogen into individual homes (United Kingdom. Secretary of State for Business, 2021).
Second, there is the uncertainty involved with how much hydrogen will be deployed in the future, how it will be produced, and what fossil fuel technologies it will replace. Currently, hydrogen is produced mostly from natural gas, and it accounts for only a small fraction of the global economy, with uses confined mainly to fertilizer production and refineries (International Energy Agency, 2021). However, projections suggest that demand could increase up to 10-fold by mid-century, with applications ranging from industrial processes, building heating, and a diversity of transportation systems to providing clean firm power to complement long-term renewable energy intermittency (Hydrogen Council, 2017; BloombergNEF, 2020, 2021; International Energy Agency, 2021; Energy Transitions Commission, 2021). While hydrogen leakage across the value chain is a concern regardless of production method and, therefore, applies to all hydrogen – including “green” hydrogen produced from water using renewable energy (considered “zero-carbon” or “climate neutral”) and “blue” hydrogen produced from natural gas using carbon capture, usage, and storage (CCUS) technologies (considered “low-carbon”) – blue hydrogen is subject to additional impacts on the energy balance due to residual emissions of CO2 as well as emissions of methane from the natural gas supply value chain (see Fig. 2). The specific fossil fuel technologies that are replaced with hydrogen alternatives will also determine the net climate benefit from deploying clean hydrogen via how much carbon dioxide and methane emissions can be reduced (Fig. 2).
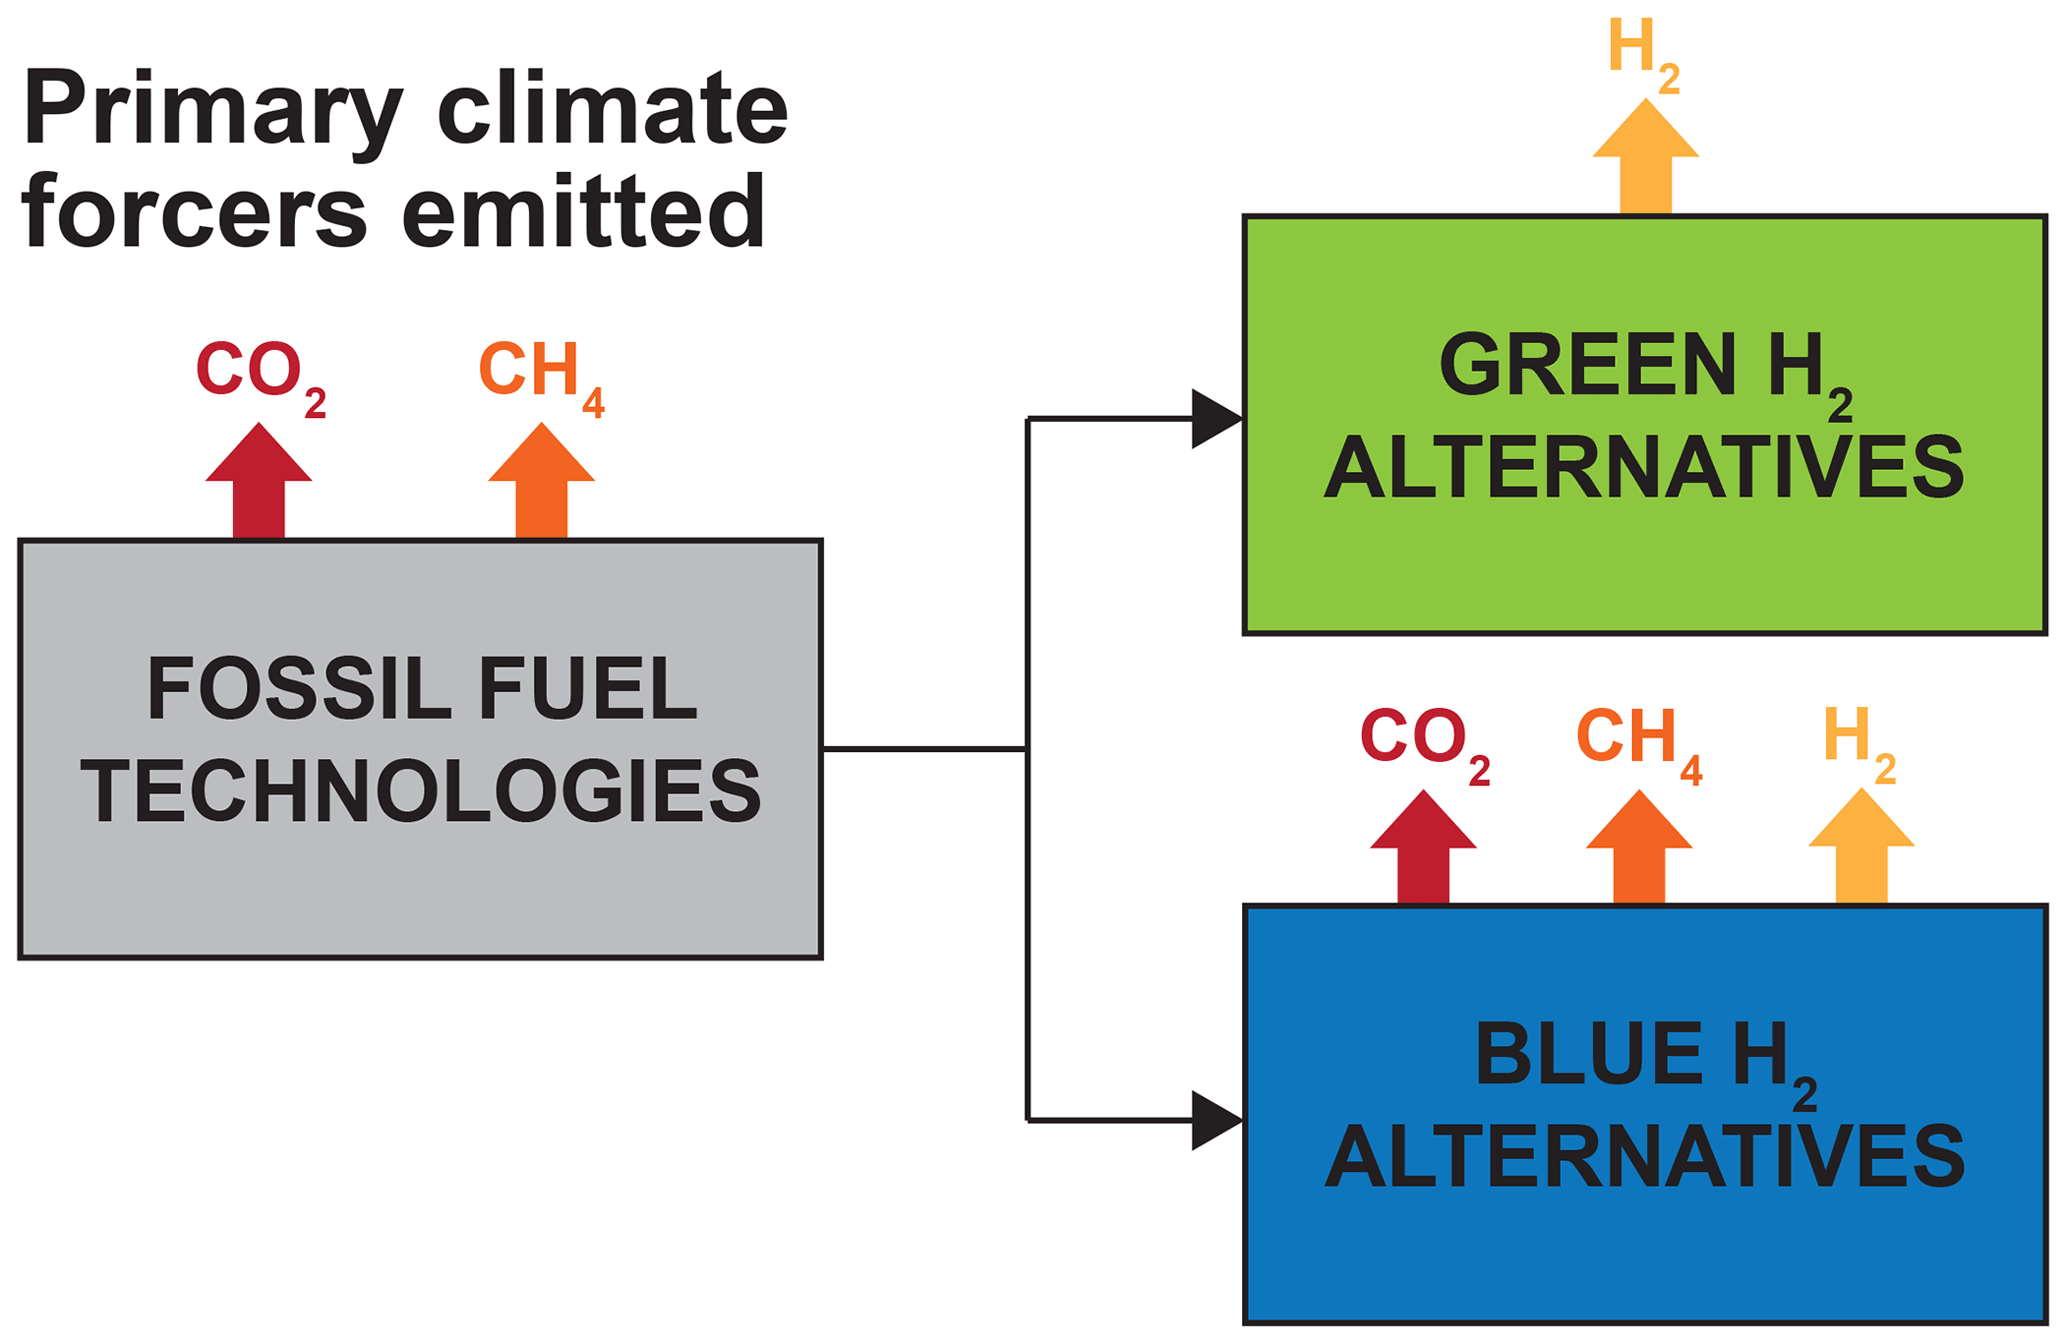
Figure 2Primary climate forcers emitted from fossil fuel technologies and their clean hydrogen alternatives.
The third challenge is how hydrogen's warming impacts are calculated and reported. Beyond the general uncertainties associated with estimating the direct and indirect radiative effects of any atmospheric constituent, the way in which scientists typically report the radiative potency of a climate forcer (such as via radiative efficiency or radiative forcing) can be inaccessible to and lack context for climate policy and business decision makers. Therefore, decades ago, scientists began developing simplified metrics for comparing the warming impacts among different greenhouse gases, with the potency of CO2 typically being used as the baseline for the comparison given its status as the most concerning human-emitted climate forcer. The most well-known and widely used metric has consistently been the global warming potential (GWP) with a 100-year time horizon, and this metric is even baked into policies, international agreements, and greenhouse gas reporting requirements. The GWP metric calculates the relative warming effect over a specified time interval from a pulse of emissions of a climate forcer compared to an equal pulse in mass of CO2.
However, mostly because of its pulse approach, using this method to compare the climate effects between a climate forcer whose impacts are short-lived (such as hydrogen and, most notably, methane) and a climate forcer whose impacts are long-lived (such as CO2) is complicated. For example, if a 100-year time horizon is used, it masks the true impact of hydrogen during the decades in which it is influencing the climate, providing the inaccurate perception that hydrogen's warming effects are much smaller than they are. On the other hand, it also provides the inaccurate perception that a pulse of hydrogen can influence the climate 100 years later. If a 20-year time horizon is used, it is more representative of hydrogen's impacts while it is affecting the atmosphere, but it disregards CO2's impacts after 20 years, when it is still affecting the atmosphere.
This temporal issue of comparing warming impacts of short- and long-lived climate forcers has been extensively discussed in the literature for decades and has been a major source of confusion in the climate policy community; it has also led to the development of numerous alternative metrics designed to improve the comparisons (Shine et al., 2007; Alvarez et al., 2012; Allen et al., 2016; Cherubini and Tanaka, 2016; Ocko et al., 2017; Fesenfeld et al., 2018; Balcombe et al., 2018; Ocko and Hamburg, 2019; Cain et al., 2019; Collins et al., 2020; Severinsky and Sessoms, 2021; Lynch et al., 2020). However, stakeholders continue to rely on GWP to understand the potency of any non-CO2 climate forcer – specifically, GWP with a 100-year time horizon (GWP-100).
The implications of this challenge for hydrogen are that the majority of studies to date have assessed its climate effects either using technical indicators (such as radiative forcing) or GWP-100, which did not convey hydrogen's near-term impacts (Derwent et al., 2001, 2006, 2020; Prather, 2003; Schultz et al., 2003; Wuebbles et al., 2010; Derwent, 2018; Field and Derwent, 2021; Paulot et al., 2021). Furthermore, until recently, the only published estimates of hydrogen's warming effects were focused on tropospheric responses. These two factors have had the result of undervaluing hydrogen's warming potency and overlooking its near-term effects. For example, new estimates of hydrogen's GWP that include stratospheric effects show that hydrogen's GWP-100 is twice as high as the previous central estimate of GWP-100 = 5 ± 1 (Derwent et al., 2020; Warwick et al., 2022). In terms of its near-term potency, the first estimates of hydrogen's GWP for a 20-year time horizon (GWP-20) yield a potency that is 3 times higher than its 100-year impact (GWP-20 = 33 [20–40]; Warwick et al., 2022). In other words, hydrogen's potency can be 6 times higher than commonly thought when looking at the critical next couple of decades.
Finally, accounting for methane emissions in climate assessments of clean hydrogen applications also suffers the same analytical challenges as hydrogen, given that it is also a short-lived gas commonly assessed through a long-term lens. The climate effects of methane emissions are often further underestimated, as natural gas leak rates are consistently underestimated in national emission inventories (Alvarez et al., 2018; Shen et al., 2021). Studies have shown that accounting for high methane emissions from upstream supply chains associated with blue hydrogen production when considered on shorter time horizons reveals near-term harm to the climate that is not conveyed with standard GWP-100 assessments (Howarth and Jacobson, 2021).
Overall, the question remains: how will hydrogen's full atmospheric warming impacts diminish its effectiveness as a decarbonization strategy across all timescales? While more sophisticated modeling will be needed to fully incorporate all complexities, interactions, and uncertainties described above, a first-order analysis is possible using already published data with minor improvements to the standard GWP metric to assess impacts over time and account for constant emissions. A constant emission rate, as opposed to a one-time pulse of emissions, is important because continuous emissions more realistically represent hydrogen emissions in a hydrogen economy. In this work, we examine the net climate impacts over time for a generic case of replacing fossil fuel technologies with clean hydrogen alternatives using a plausible range of future hydrogen emission rates. We also include emissions of methane associated with blue hydrogen production for a range of plausible leak rates. We use newly published GWP equations for hydrogen's indirect effects (Warwick et al., 2022) and report the outcomes of constant emissions for time horizons of 10 to 100 years.
The approach utilized is known as the technology warming potential (Alvarez et al., 2012), and it is similar to that of a life cycle assessment in that it compares climate impacts from two alternative technologies to help inform decision makers of the net benefits of switching from one to another. This method retains the familiar GWP formulation but conveys the climate implications over time from a sustained switch to hydrogen alternatives from fossil fuel technologies. Furthermore, we use a simple approach to estimate temperature responses to projected hydrogen demand levels, providing an indication of the absolute climate consequences of hydrogen emissions.
Our analysis is comprised of three components. First, to provide context on hydrogen's warming potency as an agent of climate change, we compare hydrogen's warming effects to that of carbon dioxide for equal mass using the traditional GWP methodology. Second, to provide context on the implications of this warming potency for a hydrogen economy relative to a fossil fuel one, we compare the warming impacts from deploying clean hydrogen across a range of hydrogen and methane emission rates to that from greenhouse gas emissions (CO2 and methane) from fossil fuel utilization. Third, to provide context on the magnitude of this warming impact, we estimate temperature responses to future hydrogen emissions based on different hydrogen demand levels and leak rates.
2.1 Climate impact calculations
To calculate the warming effects of hydrogen, methane, and carbon dioxide emissions, we use the traditional GWP metric but account for constant emissions rather than a pulse of emissions. We first use the absolute global warming potential (AGWP) components, which compute the cumulative radiative forcing of a climate forcer over a specified time horizon in watts per square meter per kilogram per year ((W m−2) (kg yr−1)). For carbon dioxide and methane, we use the Intergovernmental Panel on Climate Change (IPCC) formulations of AGWP, as shown in Eqs. (1) and (2), respectively (Myhre at al., 2013; Forster et al., 2021). Input parameters and their sources can be found in Table 1.
While these equations are appropriate for climate forcers with primarily direct radiative effects, hydrogen's radiative effects are entirely indirect. Therefore, we use the AGWP equations recently derived specifically for hydrogen based on sophisticated chemistry–climate modeling experiments, which explicitly account for its three main indirect effects and their varying temporal dynamics (methane, tropospheric ozone, and stratospheric water vapor) (Warwick et al., 2022). The equations are shown in the following (Eqs. 3–8) and provide the same output information of cumulative radiative forcing per time horizon ((W m−2) (kg yr−1)) as in Eqs. (1) and (2). More details on their derivation are available in Warwick et al. (2022). Input parameters and their sources can be found in Table 1.
To account for a constant emission rate of each forcer, as opposed to just a pulse of emissions, we consider a new pulse of emissions every year. Assuming linearity, the summation of the cumulative radiative forcing (AGWPi) from past and current pulses for each year is equal to the cumulative radiative forcing from a constant emission rate (AGWPci). To account for multiple forcers emitted from each technology, we add up the individual AGWPcis for each time horizon. Finally, to compare the climate impacts from hydrogen technologies to their fossil fuel technology counterparts, we simply divide their AGWPc values (comparable to how GWP is calculated). The results are then presented as a ratio of climate impacts (using cumulative radiative forcing as a proxy) as a function of time between two different technologies (i.e., hydrogen alternatives vs. fossil fuel technologies). A value greater than one indicates that the alternative technology (in this case hydrogen) has larger climate warming impacts at time horizon H than the original technology (and vice versa for less than one). In our analysis, we present the results as a percent change in climate impacts (cumulative radiative forcing) from the original technology, such that 1 = 0 % change (or equal), 0.5 = 50 % decrease, 2 = 100 % increase, etc.
Table 1Input parameters and sources used for the absolute global warming potential (AGWP) calculations shown in Eqs. (1)–(8). For hydrogen AGWPs, we replaced the IPCC Fifth Assessment Report (2013) (Myhre et al., 2013) values that were used in Warwick et al. (2022) with those from the IPCC Sixth Assessment Report (2021) (Forster et al., 2021).
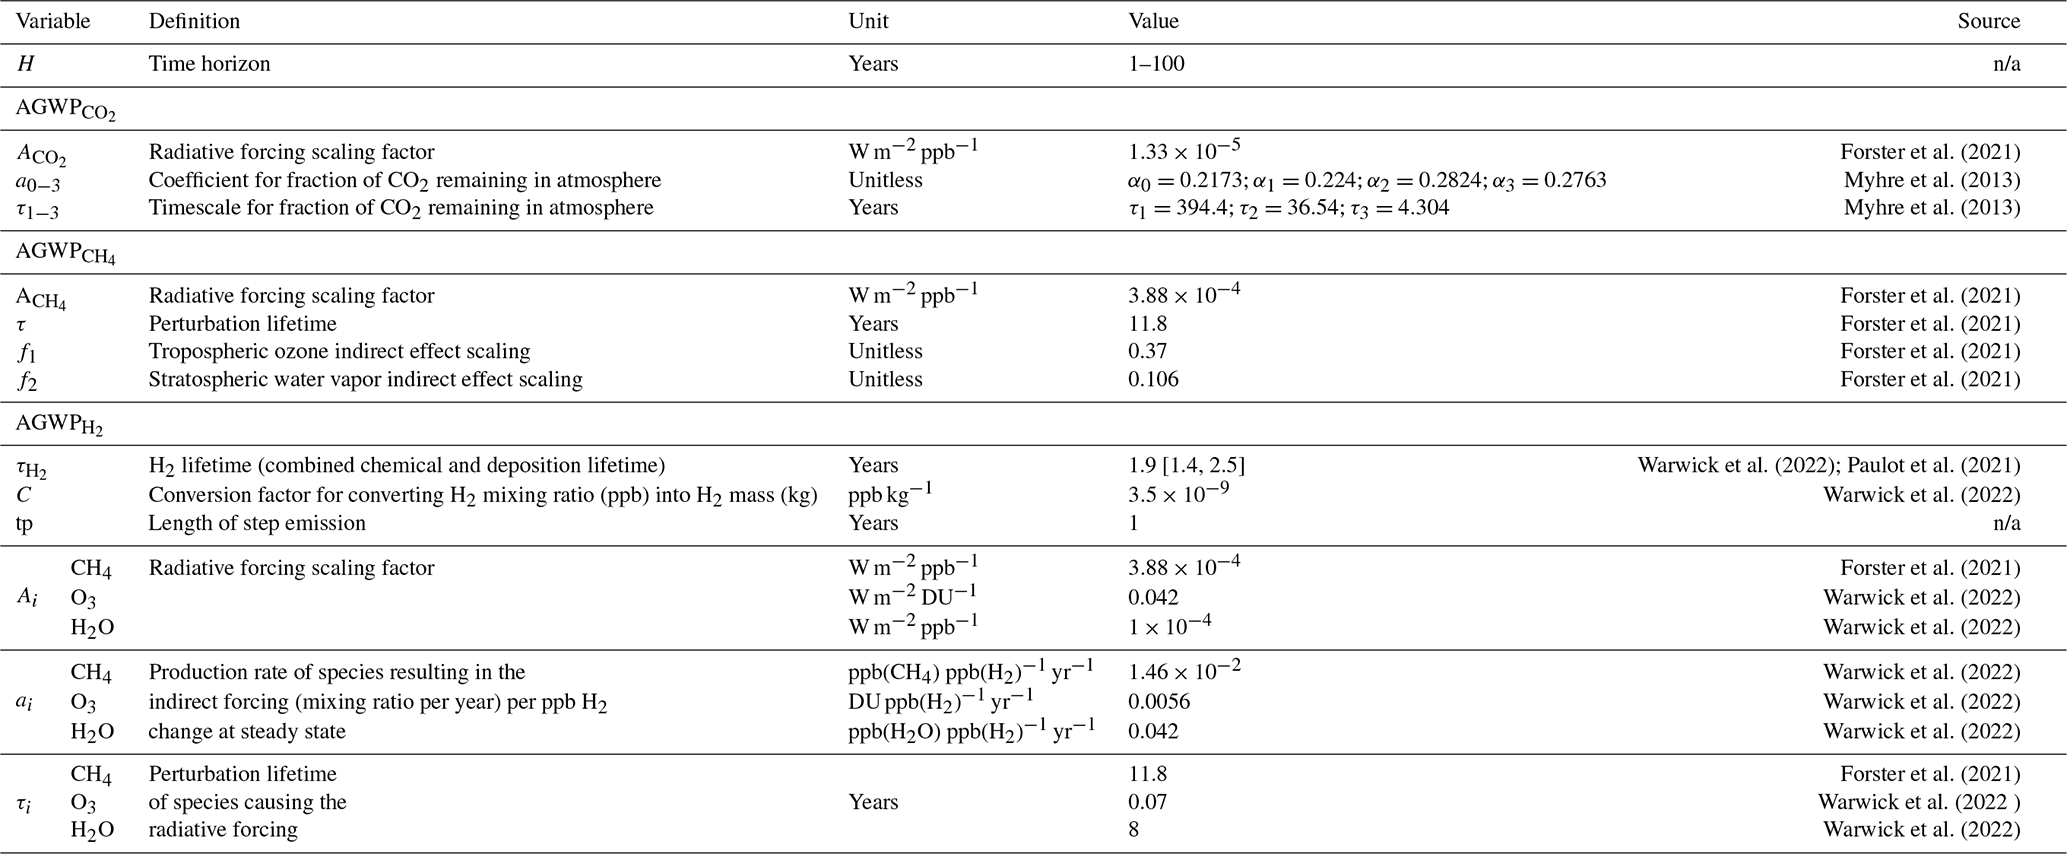
n/a: not applicable. DU: Dobson units.
This concept – an extension of AGWP and GWP that considers a constant emission rate (as opposed to a one-time pulse) and calculates the relative climate effects over time (as opposed to one specified time horizon, such as over 100 years) – is further documented and discussed in Alvarez et al. (2012), where it is called the technology warming potential. Several studies have used this metric to assess the climate impacts of different technologies that emit multiple greenhouse gases with varying atmospheric lifetimes, to show how the climate impacts of specific technologies change over time relative to one another (Alvarez et al., 2012; Camuzeaux et al., 2015; Ocko and Hamburg, 2019). However, given hydrogen's unique AGWP equations resulting from its varying indirect effects, we do not use the specific formulas derived in Alvarez et al. (2012) but rather follow the calculation chain described above.
To account for uncertainties in our analysis, we follow the approach of Warwick et al. (2022). First, we consider uncertainties in hydrogen's atmospheric lifetime, which (given the uncertainty in the strength of hydrogen's soil sink) are arguably the greatest source of uncertainty in hydrogen's atmospheric impacts overall (Paulot et al., 2021; Warwick et al., 2022). Compared with a central estimate of hydrogen's atmospheric lifetime of 1.9 years (Warwick et al., 2022), we use a lower-end estimate of 1.4 years (Warwick et al., 2022) and a higher-end estimate of 2.5 years (Paulot et al., 2021). Second, we apply a ± 20 % uncertainty to hydrogen's GWP (AGWP(H) AGWP (H)) due to uncertainties in radiative forcing scaling factors and CO2's radiative effects (Warwick et al., 2022).
In order to assess the absolute warming impact from future hydrogen demand levels based on varying hydrogen emission rates, we apply the simple approach used by Paulot et al. (2021) to approximate long-term temperature responses to hydrogen emissions. This method uses the best estimates of the long-term increase in global surface temperature (equilibrium climate sensitivity; ECS) and radiative forcing from a doubling of CO2 concentrations and assumes that hydrogen would have a similar efficacy. The Coupled Model Intercomparison Project Phase 6 (CMIP6) models suggest a best estimate of 3.78 ± 1.08 ∘C for the ECS and a 3.93 W m−2 effective radiative forcing for a doubling of CO2 (Forster et al., 2021). This suggests a climate efficacy of 0.96 ∘C (W m2)−1. To estimate temperature responses to hydrogen emissions, we multiply this efficacy by the hydrogen effective radiative efficiency estimated in Paulot et al. (2021) per unit of emission per year (0.84 mW m−2 (Tg yr−1)−1) and the hydrogen emissions per year (emission inputs discussed in Sect. 2.2). To account for uncertainties, we use a ± 40 % uncertainty in the hydrogen effective radiative efficiency, which is comparable to the uncertainty arising from both soil sink impacts on hydrogen's atmospheric lifetime and the uncertainty in radiative forcing scaling factors and carbon dioxide's radiative effects (discussed above). Note that for the temperature analysis, we do not consider additional temperature impacts from methane emissions associated with the natural gas supply chain utilized in the production of blue hydrogen, as we want to focus on the absolute impacts from hydrogen emissions in particular.
2.2 Emissions from hydrogen technologies
The emissions from hydrogen applications that we consider in our analysis are hydrogen emissions (e.g., leakage, venting, and purging) from green hydrogen production and consumption as well as both hydrogen and methane emissions (e.g., leakage, venting, purging, and flaring) from blue hydrogen production and consumption. We do not consider CO2 emissions from incomplete CCUS technologies to retain simplicity and be conservative, but this would increase the climate impacts of blue hydrogen consumption depending on the efficiency and the permanence of storage. We also do not consider greenhouse gas emissions from hydrogen infrastructure build-out.
For hydrogen emissions, there is a paucity of quantitative data addressing in situ hydrogen leakage along the value chain, with empirical measurements to date focused on safety concerns (i.e., large leaks), primarily in confined spaces (Kobayashi et al., 2018). While there are many methods of hydrogen gas sensing (e.g., optical, acoustic, thermal, and electrochemical) and several types of sensors exist (Najjar, 2019), there are currently no commercially available sensors that can detect hydrogen emissions at levels well below the threshold for hydrogen gas flammability which is required to characterize emissions in the open.
It is, however, very likely that hydrogen is emitted throughout the value chain, but it is unclear – given lack of data – which components contribute most and least to emissions. Research suggests that loss rates from electrolyzers could be high, and (based on the first principles of moving a small gas molecule) it is likely that transport of hydrogen is a major source (van Rujiven et al., 2011; Cooper et al., 2022; Frazer-Nash Consultancy, 2022). Fluid dynamics theory suggests that hydrogen can leak 1.3 to 3 times faster than methane (the main component of natural gas) (Swain and Swain, 1992), although a recent study focused on low-pressure distribution pipes suggested that small leaks of methane and hydrogen may occur at similar rates if the path to leakage is convoluted (Mejia et al., 2020). Previous work also suggests that liquified hydrogen could have high emission rates from boil-off (Sherif et al., 1997).
Total value-chain emissions will ultimately depend on the configuration of the pathway from production through to end use, and there can be very little confidence in any published estimates of hydrogen emissions from a future hydrogen economy in the absence of empirical data. Of the previous studies that have made assumptions regarding the total hydrogen emissions for the purpose of assessing environmental impacts from a potential hydrogen economy, estimates range from 0.3 % to 20 % for minimum to maximum emissions (Schultz et al., 2003; Tromp et al., 2003; Colella et al., 2005; Wuebbles et al., 2010; van Ruijven et al., 2011; Bond et al., 2011; Cooper et al., 2022; Frazer-Nash Consultancy, 2022). All studies acknowledge major uncertainty in the estimates due to a lack of data, and several do not include all components of the value chain (e.g., production, compression, storage, and end-use applications). Some studies have made assumptions on total value-chain emissions citing these previous studies, typically using a range of 1 % to 10 % (Prather, 2003; Derwent et al., 2001, 2020; Paulot et al., 2021; Warwick et al., 2022). Therefore, we follow the published literature and incorporate a hydrogen emission rate of 1 % (best case) to 10 % (worst case) per amount of hydrogen consumed.
For blue hydrogen production, methane is needed as both a feedstock and a heat source, and it can be emitted along the supply chain (upstream and midstream) before it is used for producing hydrogen. The amount of methane needed to produce a unit mass of hydrogen will depend on the composition of the natural gas, the efficiency of the reformer, and how much is needed as feedstock and fuel combined. The amount needed is not well documented in the published literature and, based on public documents and private communications, can range anywhere from 2.5 to 4.5 times the mass of hydrogen (Budsberg et al., 2015; Thibault et al., 2020). In this analysis, we use a central estimate that 3 times the mass of hydrogen is needed in the form of methane. This value is on the lower end of all estimates but in the middle with respect to published values; this makes methane emission assumptions from blue hydrogen applications potentially conservative.
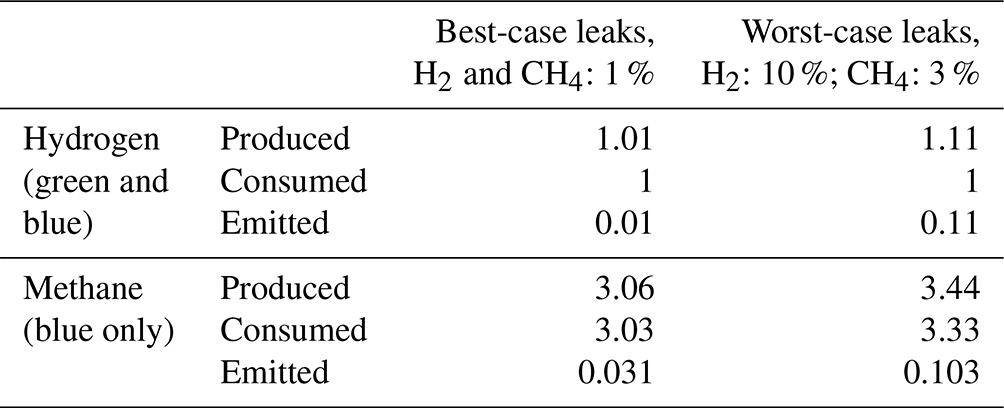
For methane emission estimates (including venting, purging, and flaring) upstream of hydrogen production, we use a range of 1 % (best case) to 3 % (worst case) per unit methane consumed. This is based on the latest understanding of upstream natural gas leakage from oil and gas production as well as the distribution of natural gas (Alvarez et al., 2018).
Table 2 shows the hydrogen and methane emissions used in this study for best- and worst-case leak rates based on 1 kg of either green or blue hydrogen deployed.
Table 2Hydrogen and methane emissions (in kg) for deploying 1 kg of either green or blue hydrogen based on best- and worst-case leak rates. We assume that 3 times the mass of hydrogen is needed in the form of methane for using methane as a feedstock for hydrogen production (Budsberg et al., 2015; Thibault et al., 2020).
For estimating absolute temperature responses to future hydrogen leakage, we consider three levels of leakage (1 %, 5 %, and 10 %) and several levels of hydrogen demand from the present-day level (around 100 Tg yr−1) to a theoretical maximum projected for mid-century (around 3000 Tg yr−1). Depending on the scenario and source, projections for future hydrogen demand range from 100 to 210 Tg by 2030 and from 130 to 1370 by 2050 (Table 3). Of 21 published estimates for hydrogen demand in 2050, the average is 590 Tg (median is 570 Tg). The theoretical maximum of using hydrogen to supply the entire final energy demand in 2050 is determined based on the estimates of hydrogen demand as a percent of the final energy demand provided by Hydrogen Council (2017) and BloombergNEF (2020a), 3055 and 2900 Mt, respectively, that are each for scenarios of a decarbonized world.
Table 3Published estimates of hydrogen demand for various scenarios.

2.3 Emissions from fossil fuel technologies
To estimate the potential climate concern with respect to hydrogen technologies, we compare the net climate impacts over time from green and blue hydrogen relative to their fossil fuel counterparts based on the anticipated avoided greenhouse gas emissions from the consumption of 1 kg of hydrogen continuously each year. We consider emissions of both carbon dioxide and methane. We do not include hydrogen emissions that would be avoided from the cessation of the combustion of fossil fuels nor other co-emitted climate pollutants such as particulates, sulfur dioxide, and nitrogen oxides that contain a mix of warming and cooling forcers.
While the carbon dioxide and methane emissions avoided from the deployment of 1 kg of hydrogen will ultimately depend on the specific technology, as a first-order approximation we explore the impacts from a generic case in which a variety of fossil fuel technologies are replaced. We use estimates from the Hydrogen Council (2017) that quantify avoided carbon dioxide emissions from a scenario of supplying 18 % of the final energy demand in 2050 with hydrogen applications. They estimate that a consumption of 550 Mt of hydrogen (roughly the same amount as the average of the 21 projections published in the literature for year 2050; Table 3) can avoid 6 Gt of carbon dioxide emissions annually. In their analysis, fossil-fuel-powered end-use applications that are decarbonized by hydrogen alternatives include segments of transport, industry energy use, building power and heating, and as an industry feedstock. For transport, their vision includes hydrogen-powering hundreds of millions of cars, trucks, buses, passenger ships, and locomotives, with hydrogen-based fuels powering a share of airplanes and freight ships. For heat and power for buildings and industry, hydrogen could provide around 10 % of the heat and power required for global households and industry sectors. Of the avoided 6 Gt of CO2 annually from this level of hydrogen deployment, around half is from hydrogen applications in the transport sector, and one-third is from industry energy and feedstocks. Using the scenario and calculations from Hydrogen Council (2017) provides a central estimate of 11 kg CO2 avoided per 1 kg H2 consumed. While this estimate is for the year 2050, in the absence of better estimates, we assume that it can generally apply to earlier decades as well. However, to test the sensitivity of our results to different levels of avoided CO2 (which arguably is of further importance for specific technologies as opposed to different years), we consider three different levels of avoided carbon dioxide emissions (5, 10, and 15 kg).
Furthermore, given that the Hydrogen Council (2017) analysis does not provide avoided methane emissions associated with their hydrogen economy vision, additional assumptions need to be made to include their impact on the net radiative effect of fossil fuel applications vs. their hydrogen alternatives. First, the methane avoided will depend on the specific fossil fuel (e.g., coal, oil, or gas) used in the displaced fossil fuel technologies. For example, a natural-gas-driven technology will likely emit more methane than a coal-driven technology due to emissions associated with natural gas production and distribution. However, a natural-gas-driven technology will also likely emit less CO2 than a coal-driven one because burning natural gas emits less CO2 than coal. Therefore, for each level of avoided carbon dioxide emissions in our sensitivity analysis, we also calculate the resulting radiative impact from these emissions if the CO2 is generated from burning natural gas (i.e., considerable methane emissions). Burning 1 kg of natural gas emits 2.75 kg of CO2 if the natural gas is almost entirely methane, and we consider methane leakage rates from 1 % to 3 %, as discussed earlier. The resulting emissions of methane are shown in Table 4.
Table 4Methane emissions (in kg) associated with different levels of carbon dioxide emissions (in kg) from fossil fuel technologies and for best- and worst-case leak rates. (Note: the values presented in the table have been rounded.)

3.1 Hydrogen's warming potency
Global warming potential has become the most familiar metric for grasping the importance of a climate forcer as an agent of climate change. Hydrogen's GWP has been reported for decades, although only with respect to its tropospheric effects and for a 100-year time horizon (thereby including numerous decades when hydrogen is not influencing the atmosphere) (Derwent et al., 2001, 2006, 2020; Derwent, 2018). This has led to an undervaluing of its impact. Recent research has reported hydrogen's GWP for both tropospheric and stratospheric effects and for both 20- and 100-year timeframes, revealing that hydrogen's 100-year GWP is twice as high as previously thought, and its 20-year GWP is 3 times higher than its 100-year GWP (Warwick et al., 2022). Fig. 3a extends this work to calculate hydrogen's GWP over time.
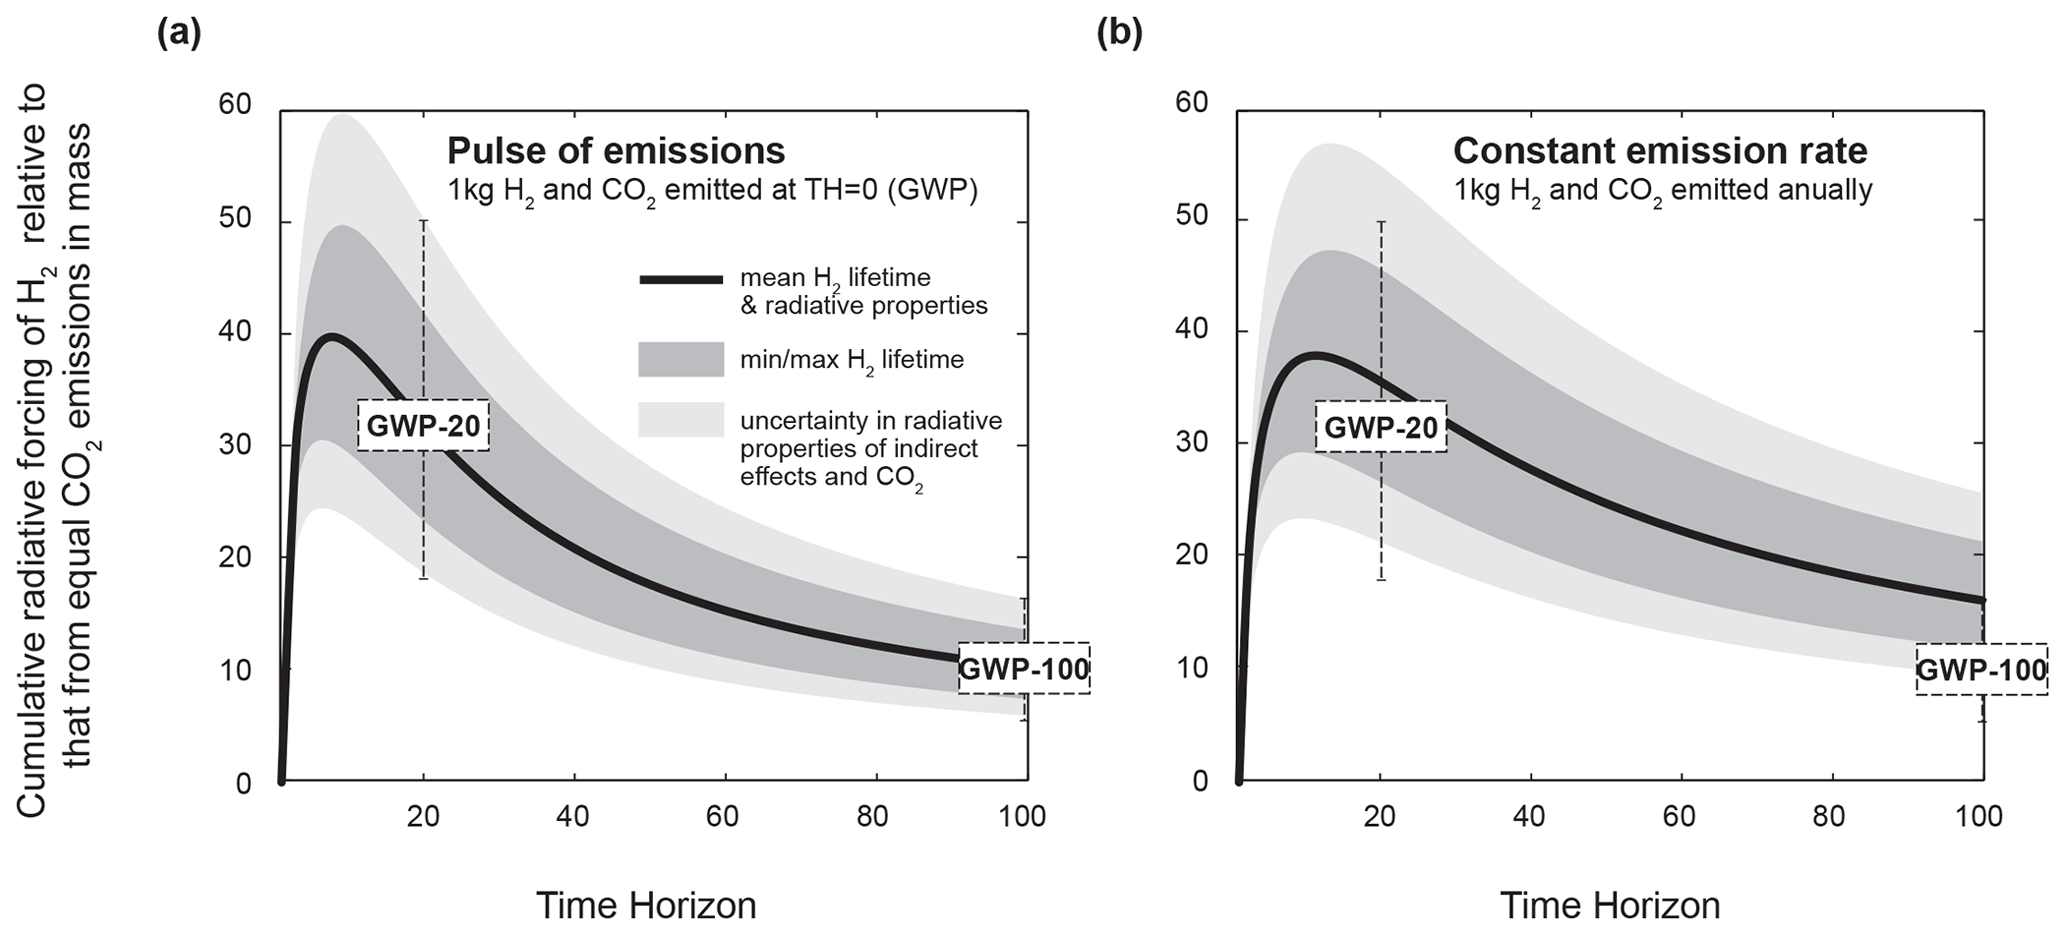
Figure 3Warming potency of hydrogen relative to carbon dioxide using cumulative radiative forcing as a proxy for (a) a one-time pulse of equal emissions in mass (equals hydrogen's global warming potential) and (b) a constant emission rate of both hydrogen and carbon dioxide for equal emissions in mass. The solid lines represent the mean hydrogen lifetime and radiative effects, the dark shaded areas correspond to a minimum and maximum hydrogen lifetime based on soil sink uncertainty, and the light shaded areas represent 20 % uncertainty in the radiative effects of hydrogen from its indirect effects and uncertainties in carbon dioxide's radiative properties. See Table 1 for all parameters used.
Hydrogen's maximum GWP occurs around 7 years after the initial pulse of emissions, with a range of 25 to 60 based on uncertainties, and a central estimate of 40. This is around 8 times higher than the most well-known GWP for hydrogen (Derwent et al., 2020). Hydrogen's GWP initially increases before it declines again, as it takes several years for methane's atmospheric lifetime to increase in response to less OH being available from the reaction with hydrogen. For time horizons of 10 to 100 years, GWP decreases, which is expected when the warming effects of a pulse of emissions from a short-term forcer are compared to those of a long-term forcer; the CO2 is still in the atmosphere 100 years later, whereas the short-term forcer's impacts are long gone – meaning that the relative potency of the short-term forcer declines. In fact, the factor of 3 difference between hydrogen's GWP-20 (central estimate of 33) and GWP-100 (central estimate of 11) is similar in ratio to that from methane (80 and 30, respectively; Forster et al., 2021).
In Fig. 3b, we use an identical GWP calculation except that a constant emission rate is considered, rather than pulse emissions. The constant-emission-rate approach is a more realistic representation of hydrogen leakage in a hydrogen economy, as opposed to a one-time pulse of emissions, and is also more sensible in that one is calculating hydrogen's warming effects compared with carbon dioxide for cases where they are both impacting the atmosphere in each time horizon.
When continuous equal emissions of both hydrogen and carbon dioxide are considered, as opposed to just one pulse at time = 0, the potency of hydrogen relative to carbon dioxide can be 50 % higher than that of the pulse approach. However, this is not uniform across all timescales. In fact, before 10 years, the pulse approach (GWP) yields higher potency values than the constant-emission-rate approach. This is because the carbon dioxide impact builds up more quickly in the near term for constant emissions compared with the hydrogen impact, as the hydrogen impact takes several years to reach its full impact. However, as time goes on, the replenishing effect of constant hydrogen emissions (as opposed to decaying impacts) dominates and leads to a greater relative potency compared with the pulse approach. For hydrogen's GWP-20, constant emissions lead to around a 15 % increase in hydrogen's potency; this increases to 50 % by a time horizon of around 70 years and to almost 60 % by a time horizon of 100 years.
3.2 Warming impacts from replacing fossil fuel technologies with hydrogen alternatives
The results of our analysis of the climate impacts of hydrogen and methane emissions are shown in Fig. 4. If there were zero climate forcer emissions from the hydrogen applications, the result would be a −100 % change in cumulative radiative forcing; moreover, if there was no replacement, the result would be 0 %. If the climate forcer emissions from hydrogen alternatives yield more (less) warming than their fossil fuel counterparts over a particular time period, it would amount to a positive (negative) percent change in cumulative radiative forcing.
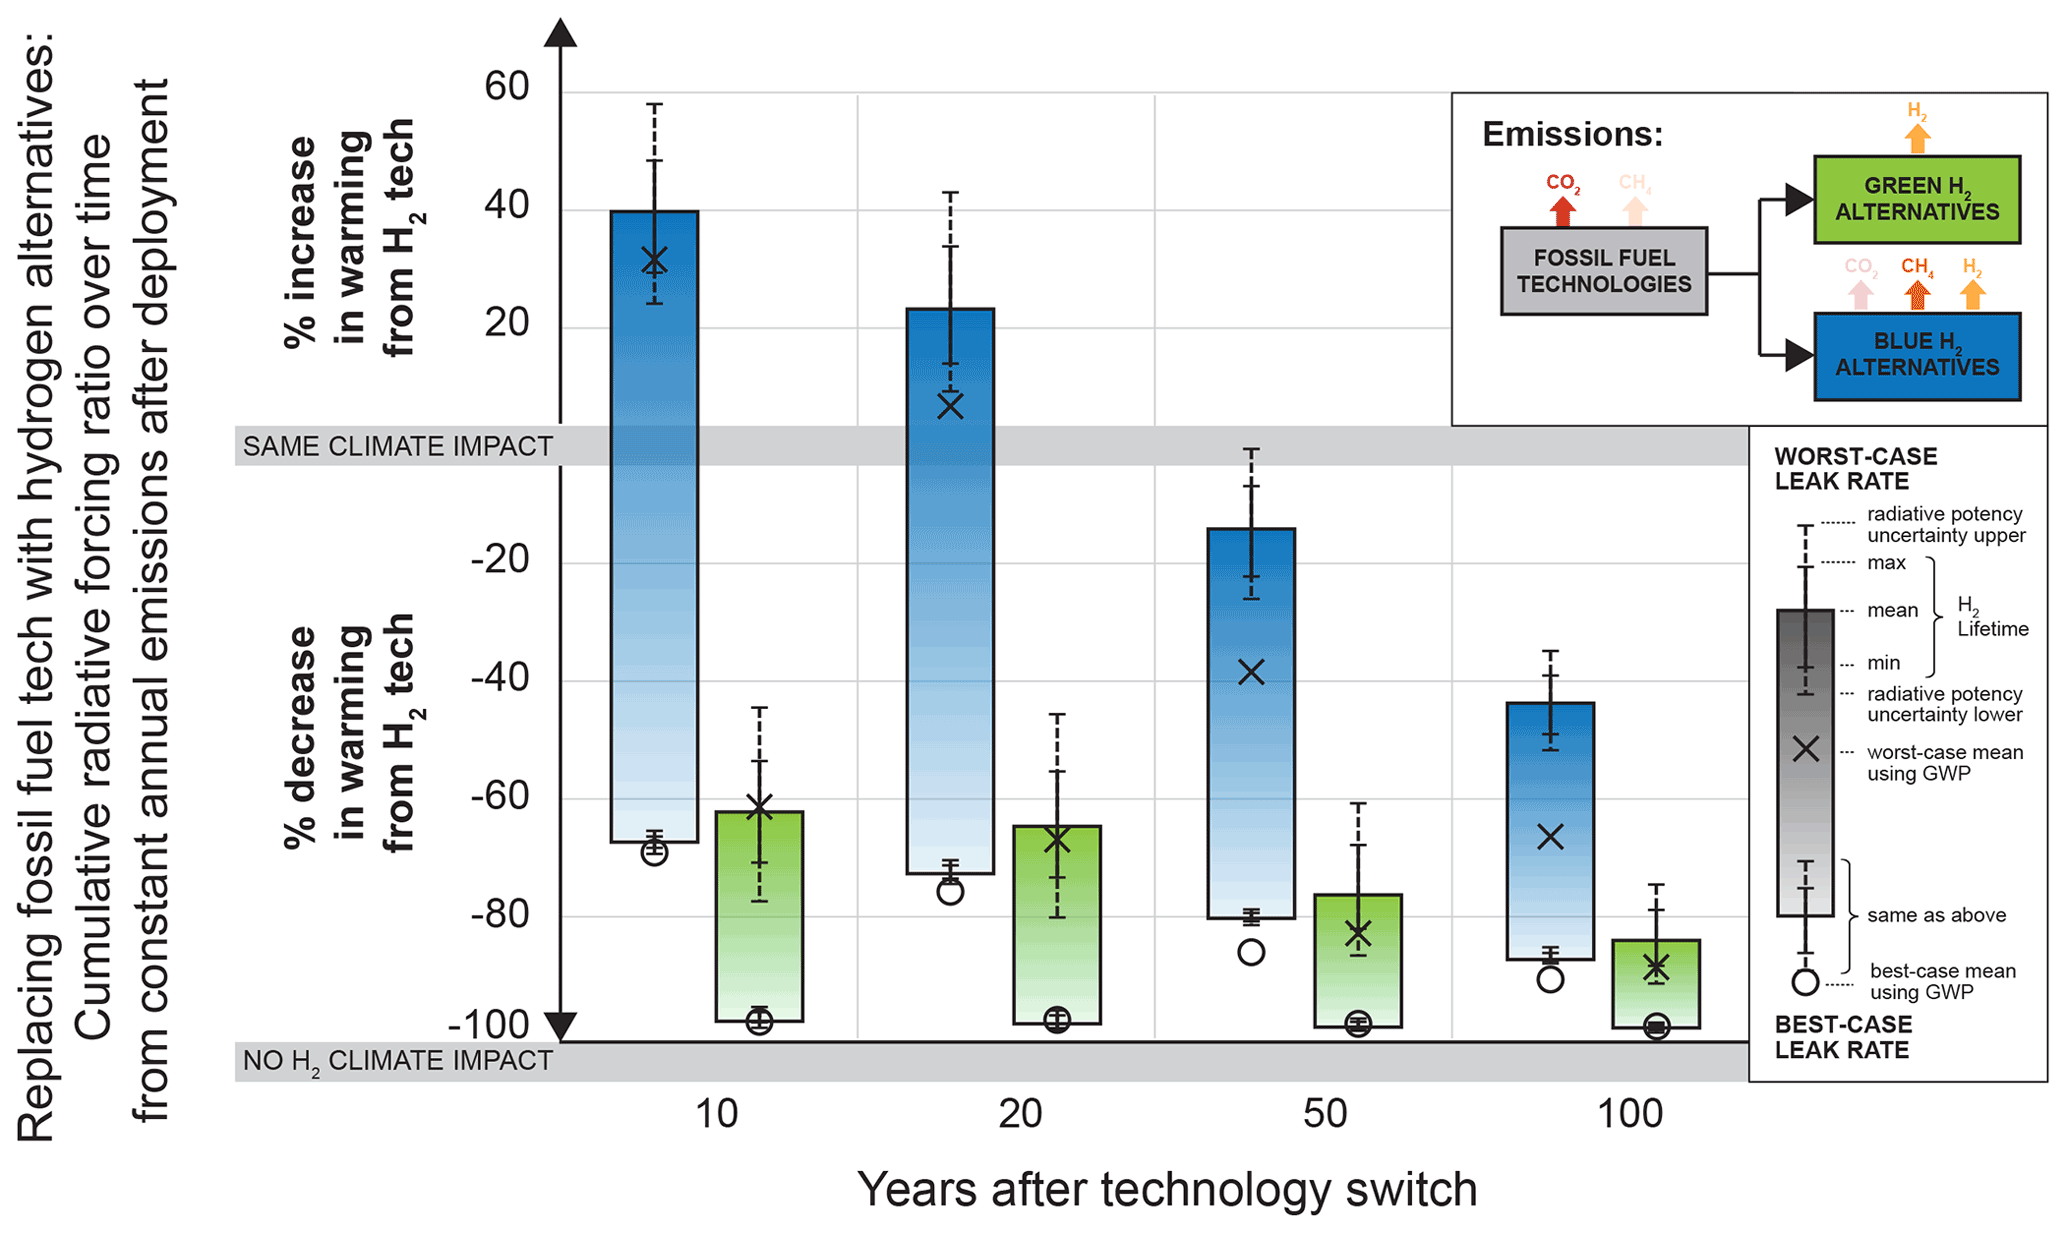
Figure 4Relative warming impact over time from replacing fossil fuel technologies with green or blue hydrogen alternatives for a generic case. A cumulative radiative forcing ratio for annually deploying 1 kg of H2 vs. annually avoided fossil fuel emissions is used as a proxy for relative warming impacts. Emissions from hydrogen alternatives are hydrogen for green hydrogen and hydrogen and methane for blue hydrogen. Emissions from fossil fuel technologies are carbon dioxide, estimated at 11 kg CO2 avoided per 1 kg H2 deployed, based on estimates from Hydrogen Council (2017). Emissions of hydrogen and methane include a range of plausible leak rates from 1 % (best case) to 10 % (worst case) per unit H2 deployed for hydrogen and from 1 % (best case) to 3 % (worst case) for methane. The height of each bar corresponds to the range of leakage. See Table 2 for the emission inputs for hydrogen and methane; Eqs. (1)–(8) and Table 1 for equations used in the calculation and input parameters, respectively; and Sects. 2.2 and 2.3 for more details on emission assumptions. Error bars represent uncertainties in both hydrogen's soil sink and lifetime (solid lines) as well as uncertainties in the radiative effects of hydrogen and carbon dioxide ( 20 %; dashed lines). The corresponding GWP results (only difference is pulse emissions rather than constant emission rate) are shown using the “x” and “o” markers.
Overall, any amount of hydrogen leakage will diminish the climate benefits of avoided carbon dioxide emissions to some degree, but there are vastly different outcomes – favorable and unfavorable – depending on the production method, total emissions, and time horizon. For example, the worst case for blue hydrogen (10 % hydrogen leakage and 3 % methane leakage) could initially be worse for the climate than the CO2 emissions from the corresponding fossil fuel technologies, yielding up to 60 % more warming over the first 10 years and taking around 50 years before the benefits of the technology switch are realized. On the other hand, the best case for green hydrogen (1 % hydrogen leaks) could yield a near elimination of the climate impact compared with fossil fuel's CO2 emissions. Recall, however, that we do not include greenhouse gas emissions associated with installing the infrastructure that will be needed to support the growing demand for hydrogen and its applications.
The importance of the clean hydrogen production method – i.e., green (renewable electricity with water) or blue (steam methane reforming with CCUS) – in determining the magnitude of climate benefits is clear (Fig. 4). While hydrogen emissions can yield climate impacts for green hydrogen that are far from climate neutral over all timescales, the cumulative radiative impact is still less than that from fossil fuels; this signifies a decrease in warming from using green hydrogen alternatives. On the other hand, blue hydrogen can be better or worse for the climate depending on the leakage rate and time horizon. For example, over a 10-year time period, worst-case blue hydrogen emissions could increase the warming impact from fossil fuels by 40 % [25, 60], whereas worst-case green hydrogen emissions could decrease warming by 60 % [43, 76]. For best-case leak rates for both, blue hydrogen could still only reduce the warming impact from fossil fuels by 65 % over the first 10 years, whereas green hydrogen could reduce the impact by more than 95 %. For a 100-year time horizon, the story is similar, with worst-case leak rates yielding a doubling of the climate impact of blue hydrogen compared with green hydrogen. In fact, the worst-case green hydrogen benefits are roughly the same as the best-case blue hydrogen benefits across all timescales (such as a ∼ 65 % decrease in the warming impact from fossil fuel CO2 emissions over a 10-year period and an 85 % decrease over a 100-year period). Given that the hydrogen emissions are the same in both the blue and green cases, the difference is due entirely to the warming effects of methane emissions from the natural gas supply chain.
While the production method matters greatly, so does the level of emissions. For example, how beneficial green hydrogen is to the climate in both the near and long term will depend strongly on the level of leakage, with benefits ranging from more than a 95 % reduction in climate impacts from fossil fuel technologies to only 65 % over the first 10 years for total leakage rates of 1 % and 10 %, respectively. Even in the long term (100-year time horizon), green hydrogen may only reduce climate impacts by 85 % if there is high leakage. The impact of leakage levels is also apparent for blue hydrogen, where high leak rates for both hydrogen and methane could lead to an increase in warming relative to their fossil fuel counterparts for decades, but the low leak rates for both could cut climate impacts by more than half within 10 years. In the longer term (over 100 years), both the worst- and best-case leak rates for blue hydrogen would likely yield reductions in the climate impacts; however, the magnitude of the benefits ranges from a 45 % to a 85 % reduction, respectively. These results show the importance of the emission rate in determining the climate benefits (and potential disbenefits) of replacing fossil fuel technologies with hydrogen alternatives.
Whereas most assessments of the climate benefits of alternative technologies inherently focus on the long-term impacts due to use of the GWP-100 metric, our analysis shows how different the picture looks when considering time horizons from 10 to 100 years. This is because, unlike carbon dioxide, the warming effects of hydrogen (and methane) are short-lived and do not accumulate over time. Therefore, the benefits of hydrogen applications grow larger over time due to the prevention of the build-up of carbon dioxide in the atmosphere. If only a long-term perspective is pursued when evaluating hydrogen applications, the results will not convey the much larger relative climate impacts over shorter time horizons. For example, for the first few decades, the worst-case green hydrogen scenario may only halve the warming impacts of the fossil fuel applications that it is replacing, but the warming impacts could be reduced by three-quarters over 100 years. For blue hydrogen, the temporal significance is even more stark due to the combination of emissions of two short-term forcers. For example, the worst-case blue hydrogen alternatives could increase warming relative to fossil fuel technologies for the first several decades, but they would cut the warming impact by nearly half over 100 years. Therefore, depending on the time horizon that is considered in the analysis, one could receive very different insights into the climate benefits of the decarbonization potential of hydrogen.
This is even more acute if the GWP metric with a pulse approach is used, as opposed to a constant emission rate. While we consider constant emissions in our analysis, Fig. 4 shows the corresponding result if a pulse approach is used (see the “x” and “o” markers). While the pulse approach reasonably captures the near-term impacts of hydrogen applications relative to those of fossil fuels, it diverges over time and ultimately undervalues the cumulative radiative forcing. For example, the worst-case blue hydrogen alternative could yield a decrease in warming of only 45 % even after 100 years of replacing fossil fuel technologies, but GWP-100 suggests a decrease in warming of 65 %. Moreover, if GWP-100 is used exclusively and taken to represent hydrogen's impacts over any timescale (as it often is), the near- and middle-term impacts of hydrogen (and methane) leakage will be overlooked entirely – which, in some cases, means assuming a benefit to the climate when it is actually a disbenefit for decades.
In the above, we considered a generic case for avoiding carbon dioxide emissions from fossil fuel technologies. However, the perceived climate benefits of hydrogen alternatives will depend on the amount of CO2 avoided, which will vary depending on the technology that is replaced. Therefore, to test the sensitivity of our results to the amount of CO2 avoided, we consider avoided emissions of 5, 10, and 15 kg per 1 kg of hydrogen deployed (compared with our central estimate of 11 kg) and compare the relative climate impacts of the hydrogen applications over a 20-year time horizon (solid bars in Fig. 5). We find that blue hydrogen could yield more than a 150 % increase in warming over the first 20 years if avoided emissions of CO2 are on the lower end and if leak rates from hydrogen and methane are at the upper end, whereas green hydrogen may only reduce warming by 20 %. However, if avoided emissions of CO2 are on the higher end, both the worst-case blue and green hydrogen alternatives would yield climate benefits, reducing warming by 10 % and 75 %, respectively.
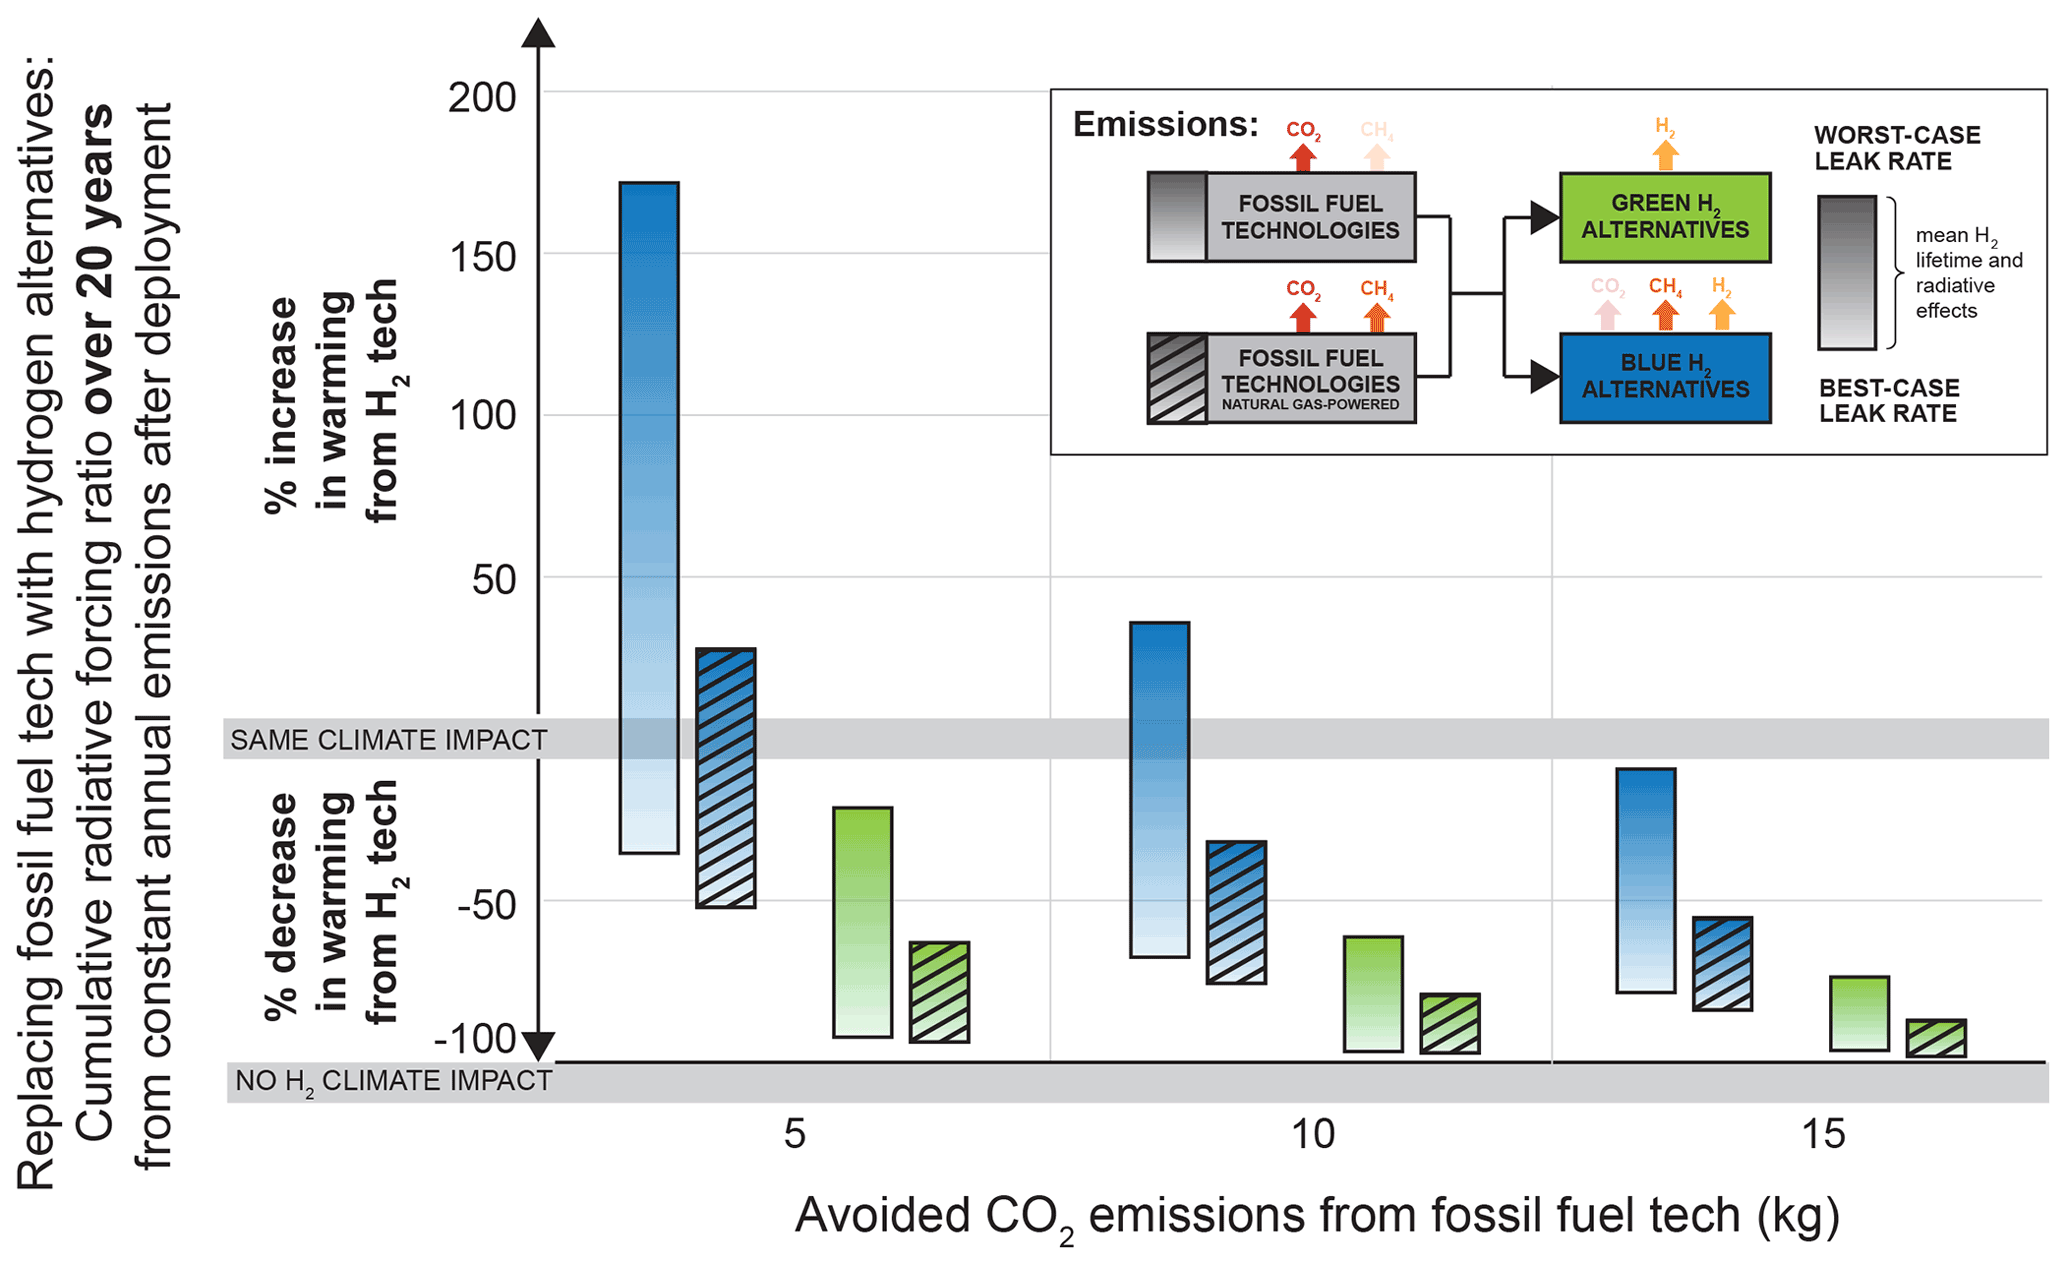
Figure 5Relative warming impact over time from replacing fossil fuel technologies with green or blue hydrogen alternatives for different levels of avoided carbon dioxide and methane emissions. A cumulative radiative forcing ratio for annually deploying 1 kg of H2 vs. annually avoided fossil fuel emissions is used as a proxy for relative warming impacts. Emissions from hydrogen alternatives are hydrogen for green hydrogen and hydrogen and methane for blue hydrogen. Emissions from fossil fuel technologies are carbon dioxide and methane. Emissions of hydrogen and methane include a range of plausible leak rates from 1 % (best case) to 10 % (worst case) per unit H2 deployed for hydrogen and from 1 % (best case) to 3 % (worst case) for methane. The height of each bar corresponds to the range of leakage. See Table 2 for emission inputs for hydrogen and methane from hydrogen applications, Table 4 for emissions of methane from fossil fuel technologies, and Eqs. (1)–(8) and Table 1 for the equations used in the calculation and the input parameters, respectively.
Given that methane emissions may also be avoided by replacing fossil fuel technologies, we extend the analysis to consider a case where the fossil fuel that was burned to produce the CO2 was natural gas (hatched bars in Fig. 5), using the same best- and worst-case methane leak rates as in the hydrogen applications. We find that the avoided methane emissions may play a significant role in increasing the near-term benefits of hydrogen applications, but there is a strong dependence on the corresponding CO2 emissions that are avoided. For example, while the worst-case blue hydrogen alternative with the lower-end avoided CO2 values would still be worse for the climate over the first 20 years, even when including avoided methane, the central estimate of avoided CO2 would switch from worse for the climate to better for the climate. For the worst-case green hydrogen alternative, climate benefits would double for all levels of avoided CO2 when including avoided methane emissions. However, given that natural gas emits less CO2 when burned than coal, it is likely that CO2 emissions would be lower if methane emissions were higher, as opposed to both being on the higher end. Therefore, a case-by-case study with reported data on both carbon dioxide and methane emissions from fossil fuel technologies is warranted to fully understand the impact of avoided methane emissions.
3.3 Absolute warming impacts due to hydrogen emissions
We find that the present-day hydrogen demand (around 100 Tg) may cause at most 0.01 ∘C warming for all levels of hydrogen emissions. For 2030 projections, five estimates based on different scenarios and sources suggest an average hydrogen demand of 150 Tg (see Table 3), which could double the 100 Tg impact for upper-end leak rates (10 %) and uncertainties (0.02 ∘C). For 2050 projections, 21 different estimates suggest a range in demand from 130 to 1370 Tg (Table 3), with an average of 590 Tg. For the worst-case hydrogen leak rates (10 %), these levels of demand could yield anywhere from 0.01 ∘C to 0.1 ± 0.05 ∘C warming. On the other hand, if total hydrogen emissions are kept minimal (1 %), temperature responses could be less than 0.02 ∘C including uncertainties. For context, a 590 Tg hydrogen demand could supply around 20 % of the final global energy demand in 2050 under a 2 ∘C scenario (Hydrogen Council, 2017; BloombergNEF, 2020a).
Figure 6 shows the long-term temperature responses to various hydrogen demand levels, up to a theoretical maximum of 3000 Tg estimated for 2050 (which would correspond to using hydrogen for the total final energy demand in a 2 ∘C decarbonization scenario). Using hydrogen for the total final energy demand in 2050 could lead to greater than 0.1 ∘C warming with a 5 % leak rate and up to 0.4 ∘C warming with 10 % leak rates and uncertainties in hydrogen's radiative effects.
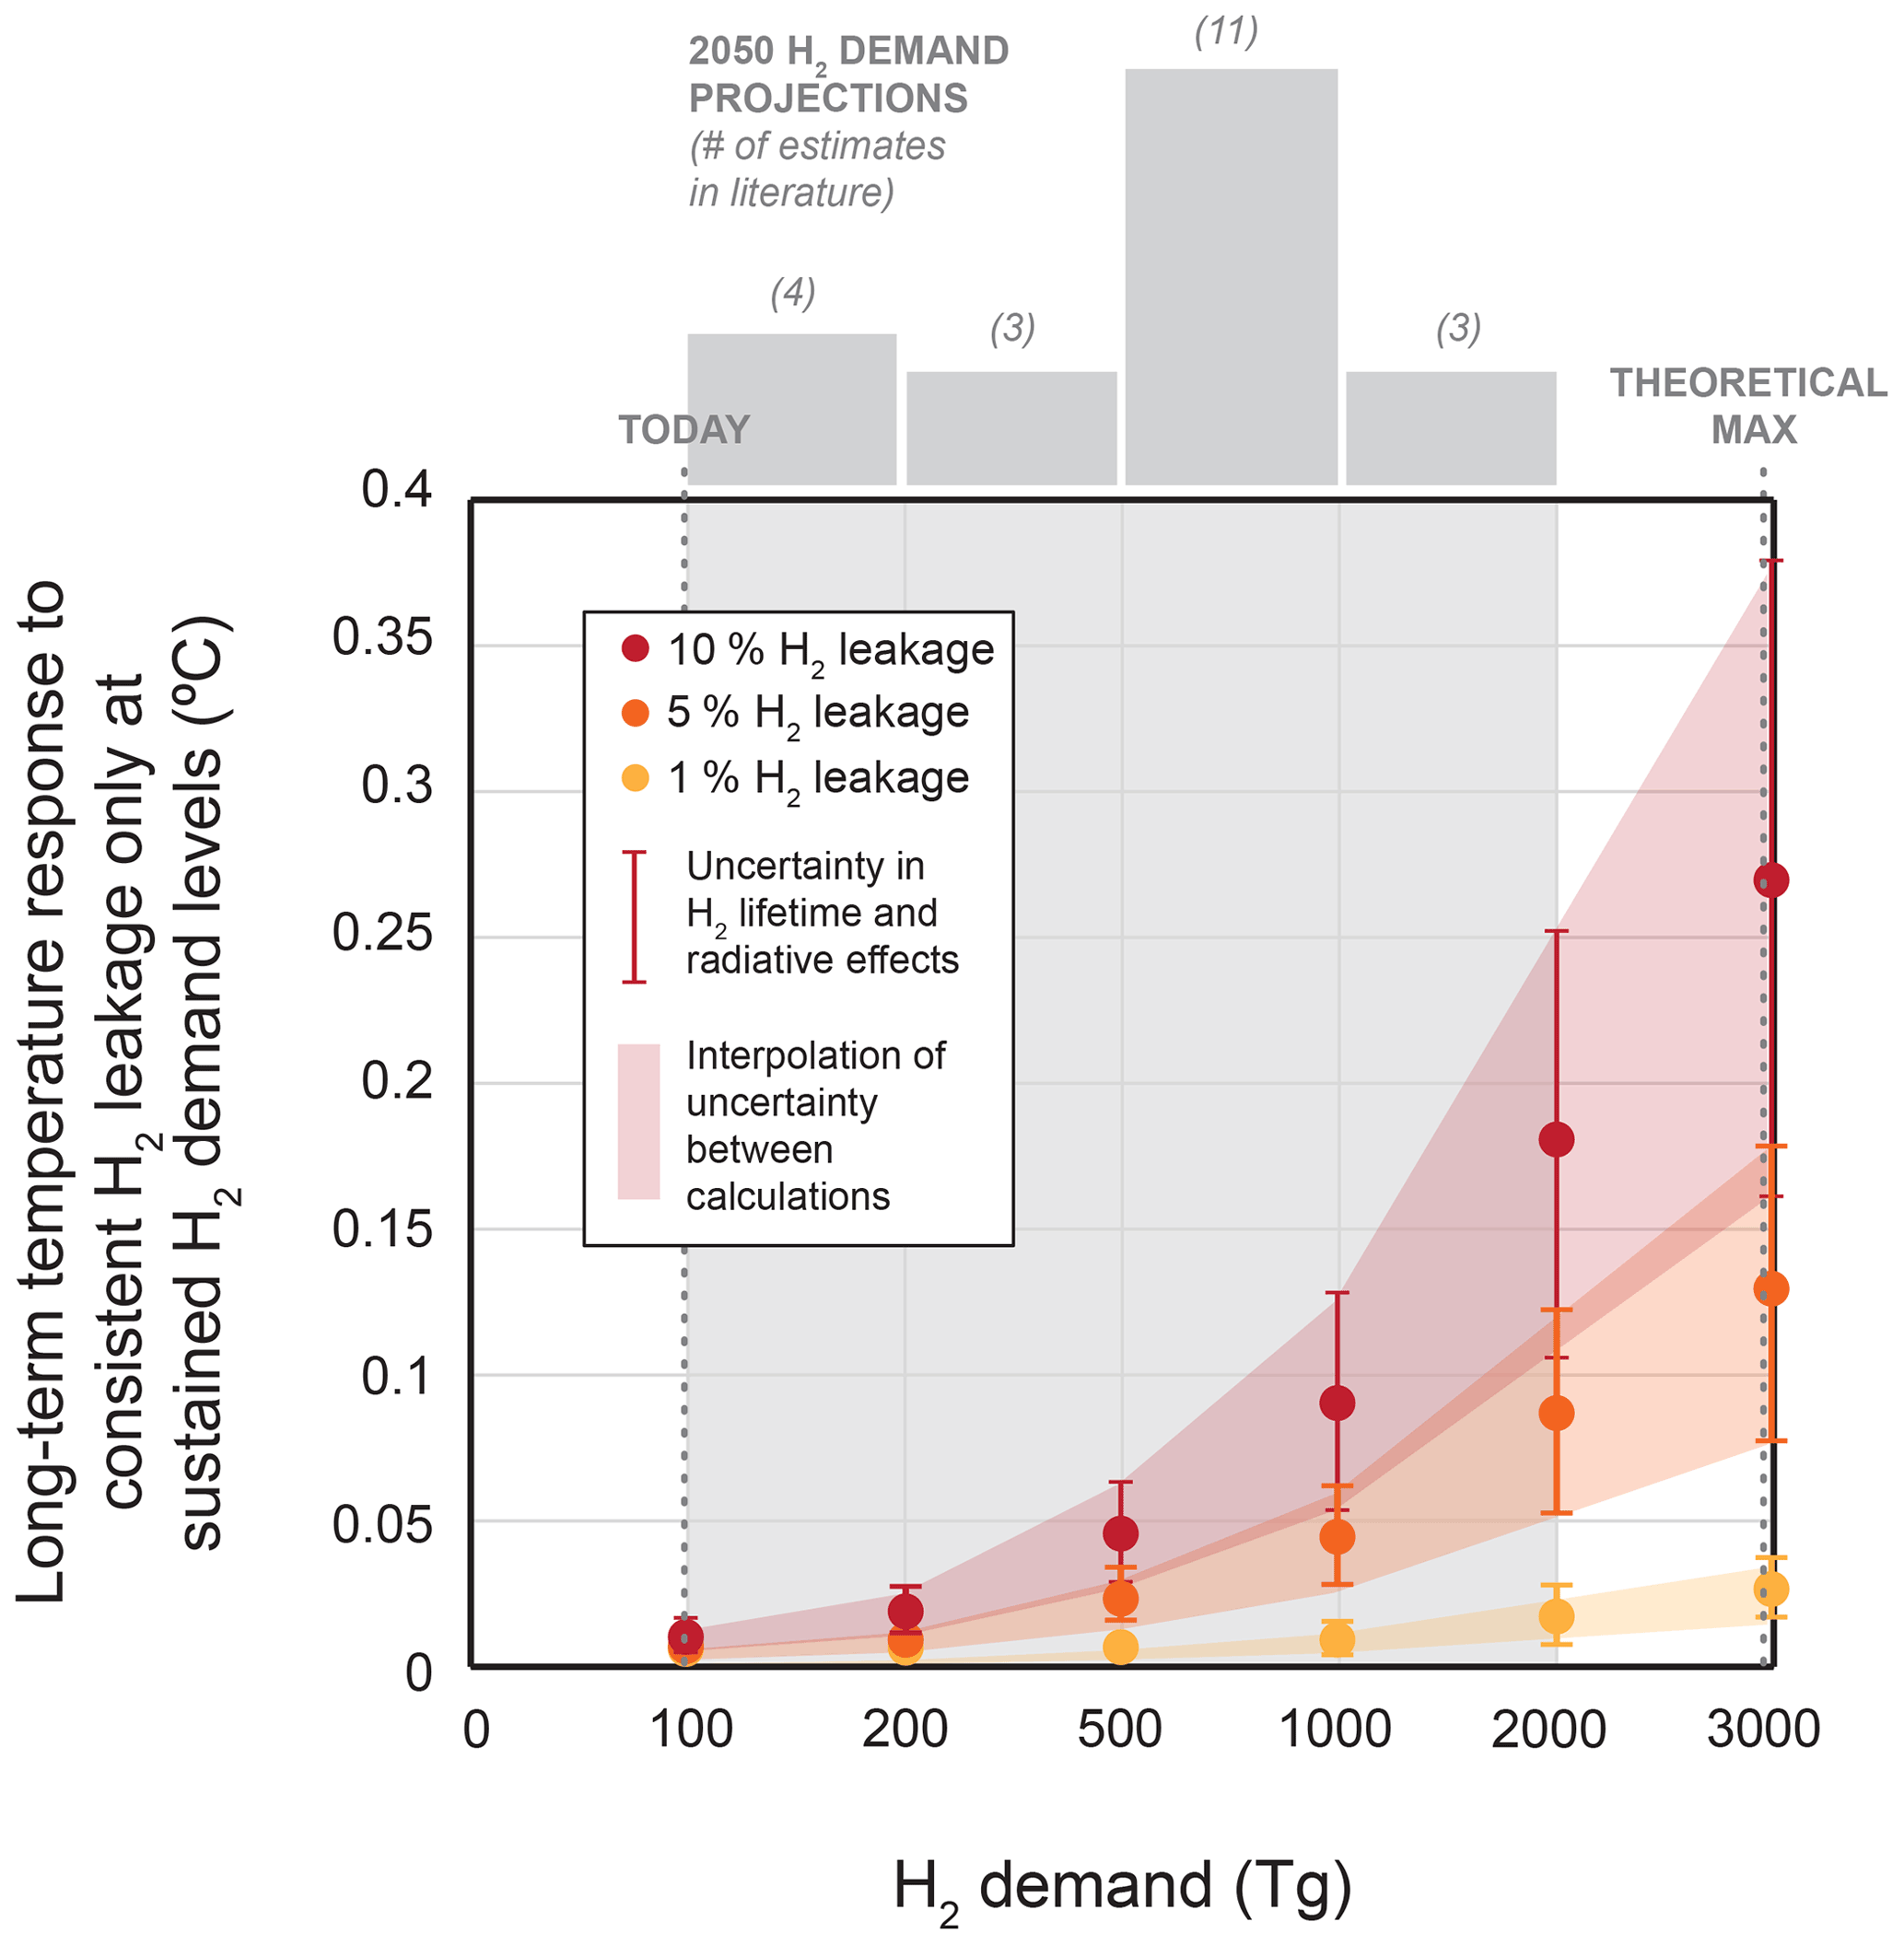
Figure 6Long-term temperature responses (in ∘C) to different levels of hydrogen leakage based on sustained hydrogen demand levels (in Tg). The red, orange, and yellow markers and shading represent leakage levels of 10 %, 5 %, and 1 %, respectively. Uncertainty is based on uncertainties in both hydrogen's soil sink and, therefore, lifetime ( 20 %) as well as uncertainties in hydrogen's radiative effects ( 20 %). Markers indicate calculations, and shaded regions represent interpolation. The histogram and shaded gray area characterize projections of hydrogen demand for the year 2050 in the published literature (see Table 3). The theoretical max is an estimate based on using hydrogen to supply the total final energy demand globally in 2050 based on decarbonization scenarios.
However, this level of hydrogen demand is not realistic. Of the available projections in the literature for hydrogen demand in 2050, 4 suggest values between 100 and 199 Tg, 3 suggest values between 200 and 499 Tg, 11 suggest values between 500 and 999 Tg, and 3 suggest values between 1000 and 1999 Tg (Table 3). None project hydrogen demands below 100 or above 2000. Sustained hydrogen demands around 800 Tg or greater (which could account for around a quarter of the final energy demand in 2050) could contribute at least 0.1 ∘C of warming if leak rates and uncertainties are at the upper end. For context, this amount of warming could offset the avoided warming in 2050 from deploying all cost-effective options to mitigate methane emissions globally over the next decade, which otherwise could have slowed down global-mean warming rates by up to 15 % (Ocko et al., 2021), or the avoided warming anticipated from the phasing out of hydrofluorocarbons (Xu et al., 2013). This amount of warming (∼0.1 ∘C) is also equal to the amount of warming projected in 2100 from carbon dioxide emissions from international shipping and aviation combined in the absence of climate action (Ivanovich et al., 2019). However, if leakage does not exceed 1 %, the temperature response could be an order of magnitude smaller.
The purpose of our study is to improve understanding of the role of hydrogen leakage in undermining the climate benefits of the deployment of clean hydrogen alternatives to replace fossil fuel technologies. We evaluated hydrogen's climate consequences in three ways: its warming potency relative to carbon dioxide, the warming impact of its leakage compared with that from the avoided emissions of fossil fuel technologies, and the absolute warming impacts from future levels of demand and leakage.
We found that hydrogen's warming potency strongly depends on the time horizon and (similar to methane) can be at least 3 times more potent in the near term than in the long term relative to carbon dioxide when using the traditional GWP framework with pulses of equal emissions. If a constant emission rate is used in the calculations instead, hydrogen's warming potency may be 50 % higher for time horizons of several decades or longer. When assessing the relative climate impacts of replacing fossil fuel technologies with their hydrogen alternatives (based on a unit of clean H2 deployed relative to the avoided CO2 emissions for a generic case), we found that there are vastly different climate outcomes depending on emission rates, time horizons, and production method. For example, blue hydrogen with high hydrogen and methane emissions (a 10 % and 3 % emission rate, respectively) can be worse for the climate for decades compared with fossil fuel technologies, but green hydrogen with low hydrogen emissions (1 %) can nearly eliminate climate impacts from its fossil fuel counterparts over all timescales. On the other hand, the best-case blue hydrogen alternative (1 % for both hydrogen and methane) can show roughly the same climate benefits as the worst-case green hydrogen alternative (10 % emissions) – far from climate neutral but still halving the impacts of its fossil fuel counterparts within a decade. However, the perceived benefits of clean hydrogen alternatives compared with fossil fuel technologies will depend on how much carbon dioxide and methane are avoided, which needs to be assessed on a case-by-case basis with reliable emission data. Finally, we found that a level of hydrogen demand around 800 Tg or above (which could account for around a quarter of the final energy demand in 2050) could contribute at least 0.1 ∘C of warming with high hydrogen leakage (10 %) and upper-bound uncertainties in hydrogen's radiative properties.
Our findings add to recent research that has revealed that the warming impacts of hydrogen emissions are higher than previously recognized (Paulot et al., 2021; Warwick et al., 2022) and has explored the implications that this has for the potential of hydrogen as a decarbonization strategy in the near and long term. For example, for the first time, when evaluating the climate change mitigation potential of clean hydrogen alternatives, we show a strong dependence of the climate change mitigation potential on timescale. This is because hydrogen's warming effects are most powerful in the 1–2 decades after hydrogen is released. While short-term climate warming impacts – followed by long-term climate change mitigation impacts – may lead to an eventual beneficial outcome, short-term warming may lead to climate impacts that cause more socioeconomic and environmental damage in the near term and that are not necessarily reversible (Fischer et al., 2021). This could strongly affect the choice of whether or not to deploy hydrogen in applications that have multiple “clean” options. Moreover, if GWP-100 is exclusively relied upon, the near- and medium-term warming power of hydrogen is masked; therefore, the anticipated climate benefits of deploying hydrogen are perceived to be much higher over the next few decades than in reality. However, we find that the dual approach of using both GWP-20 and GWP-100 adequately captures the climate impacts of hydrogen over all timescales and, therefore, is a straightforward way to effectively understand temporal trade-offs across hydrogen deployment opportunities.
Taken together, our findings and the findings of previous studies make it clear that hydrogen emissions (e.g., leakage, venting, and purging) matter for the climate. Moreover, given that hydrogen is a very small molecule that is hard to contain, it can easily escape from infrastructure. A new network of production facilities, pipes, storage tanks, and hydrogen-powered homes and vehicles could create a vast potential for hydrogen to leak. Furthermore, moving hydrogen through existing natural gas systems that are already shown to leak significant amounts of methane is even more problematic. However, the total amount of leakage in current hydrogen systems remains unknown, with the analytical capacity to accurately measure small levels of leakage in situ being largely unavailable. The lessons learned from extensive measurements of natural gas value-chain leaks over the last decade (similar infrastructure but larger molecule) have shown that leakage rates are far higher than expected (Alvarez et al., 2018). While hydrogen is arguably a more valuable product than natural gas, given the current cost of producing it, the lack of empirical measurements cannot confirm any assumptions regarding the influence of the cost of lost product on leakage rates, especially if there is no regulatory enforcement. Without measurements of hydrogen leakage and, in turn, knowledge of strategies to mitigate leakage and deploy best practices, we risk developing leaky systems that could significantly contribute to climate change in the near to medium term. Thus, more attention is needed to measure and minimize hydrogen leakage as hydrogen efforts are ramped up.
Beyond needing accurate measurements of hydrogen emissions, more work is needed to improve understanding of hydrogen's atmospheric impacts. This is because far less work has gone into refining hydrogen's radiative effects compared with gases such as methane and carbon dioxide. There is a need for more integrated chemistry–climate modeling to build confidence in and refine the tropospheric and stratospheric radiative effects of hydrogen emissions. This is especially true with respect to gaining a better understanding of the climate impacts in the first couple of decades after hydrogen is emitted to the atmosphere, given the complex temporal dynamics of hydrogen's indirect effects; to date, there is only one study that explores these near-term effects (Warwick et al., 2022). Chemistry–climate modeling is further required to (1) understand the net effects when including co-emissions from hydrogen and fossil fuel technologies (such as sulfur dioxide, black and organic carbon, nitrogen oxides, and carbon monoxide), (2) estimate climate responses to hydrogen emissions beyond forcings (such as global surface air temperature), and (3) assess how changing concentrations of other atmospheric constituents may affect hydrogen's potency (such as changing concentrations of methane resulting from reduced emissions in response to aggressive policies to address climate goals). For example, all else equal, hydrogen emissions will lead to an increase in other greenhouse gases. However, a new study has shown that reductions in the emissions of carbon monoxide, nitrogen oxides, and volatile organic carbon can lead to a smaller increase in methane's lifetime from hydrogen, as more OH is available, and a net decrease in tropospheric ozone (Warwick et al., 2022). These complexities and interactions will need to be explored in assessing the climate effects of decarbonization strategies.
Climate benefits of clean hydrogen alternatives to fossil fuel technologies also need to be assessed on a case-by-case basis, given (1) the dependency of the leak rate on the production method, value-chain pathway (i.e., compression, storage, and distribution), and end-use application, and (2) the dependency of the benefits on the avoided greenhouse gas emissions which, in turn, depends on the pathway, application, fuel, and location. While analysis of a generic hydrogen deployment case is valuable for first-order insights, decisions will ultimately need to be made based on implications for specific technological shifts. For example, if the hydrogen is burned in the stratosphere (e.g., from aircraft), the direct combustion of hydrogen could also increase stratospheric water vapor.
Furthermore, there are additional climate and other environmental concerns associated with the deployment of hydrogen that need to be better understood quantitatively. These include the diversion of renewably produced electricity to produce green hydrogen when a potentially more effective decarbonization pathway would be to use the renewable electricity directly to offset fossil fuel use (Ueckerdt et al., 2021); emissions of nitrogen oxides from combusting hydrogen, which is a health concern for local communities (Lewis, 2021); local water availability for green hydrogen production (Beswick et al., 2021; Simoes et al., 2021); and CCUS efficiency and permanence for blue hydrogen (Saadat and Gersen, 2021).
Around the world, industry and policymakers are enthusiastic about clean hydrogen's potential as an alternative to conventional fossil fuels, as it can conceivably greatly reduce greenhouse gas emissions. Billions (USD) in new investments and financial subsidies are being proposed to speed its adoption. Nevertheless, hydrogen itself has significant climate impacts that are both widely overlooked and underestimated, and it is a very small molecule that can easily leak into the atmosphere from infrastructure.
In this study, we evaluate the climate consequences, across all timescales, of deploying clean hydrogen given a range of plausible leak rates. Our results indicate that hydrogen emissions can considerably undermine the climate benefits of decarbonization strategies that involve clean hydrogen – especially in the decades immediately following deployment. Therefore, this issue deserves more attention, both with respect to advancing the science of hydrogen's indirect climate effects and regarding the improvement of estimates of hydrogen emissions throughout the value chain. Minimizing leakage will be essential to the effectiveness of hydrogen as a climate change mitigation strategy. Furthermore, given that it may be possible to prevent leakage in some applications and it is easier to address and minimize hydrogen leakage when designing a system vs. retrofitting one, we have the rare opportunity to get ahead of this issue before the infrastructure and systems are widely deployed.
Our results suggest that five key actions can help minimize hydrogen's warming effects and, therefore, maximize climate benefits in a future hydrogen economy:
-
advance research of hydrogen's indirect radiative effects and temperature responses to hydrogen emissions by incorporating interactive emissions, chemistry, and radiation parametrizations in further coupled chemistry–climate models as well as reduced-complexity climate models;
-
employ climate metrics and/or models that effectively reflect the role that hydrogen could play in meeting net-zero goals in the desired time frames – this means not exclusively relying on GWP-100 and potentially adopting a dual GWP-20/GWP-100 approach (Ocko et al., 2017);
-
improve quantification of hydrogen leakage rates by developing technologies that can be taken into the field to accurately measure hydrogen emissions at low detection thresholds (i.e., ppb level);
-
include the likelihood of hydrogen leakage and its impacts in decision-making about where and how to effectively deploy hydrogen – such as co-located production and end-use applications; and
-
identify leakage mitigation measures and best practices before building out infrastructure.
If we are to meet the climate challenge before us, it is imperative that we carefully examine each alternative decarbonization pathway using robust and appropriate metrics and data. The near- and medium-term warming impacts of hydrogen emissions are higher than widely perceived. These impacts should be explicitly and quantitatively accounted for in order to maximize the climate benefits of replacing fossil fuel systems with hydrogen. Taking a proactive and scientific approach to understand the implications of and address hydrogen leakage can help ensure that the global rush to hydrogen delivers on its promise to benefit the climate over all timescales.
All code and data are available from the corresponding author upon reasonable request.
IBO and SPH conceptualized the study. IBO conducted the analysis and data visualization. IBO and SPH wrote and edited the manuscript.
The contact author has declared that neither of the authors has any competing interests.
Publisher's note: Copernicus Publications remains neutral with regard to jurisdictional claims in published maps and institutional affiliations.
The authors would like to thank Tianyi Sun, Eriko Shrestha, and Naomi Cohen-Shields for project support; Fabian Paulot and Stephen Pacala for helpful discussions on the methodology; and Joan Ogden, Michael Oppenheimer, Roland Kupers, Beth Trask, Hanling Yang, Aoife O'Leary, Morgan Rote, Jane Long, Mark Brownstein, Laura Catalano, and Natasha Vidangos for thoughtful feedback on prior versions of the paper.
This research has been supported by Robertson Foundation, the Heising-Simons Foundation, and ClimateWorks Foundation.
This paper was edited by Farahnaz Khosrawi and reviewed by two anonymous referees.
Allen, M. R., Fuglestvedt, J. S., Shine, K. P., Reisinger, A., Pierrehumbert, R. T., and Forster, P. M.: New use of global warming potentials to compare cumulative and short-lived climate pollutants, Nat. Clim. Change, 6, 773–776, https://doi.org/10.1038/nclimate2998, 2016.
Alvarez, R. A., Pacala, S. W., Winebrake, J. J., Chameides, W. L., and Hamburg, S. P.: Greater focus needed on methane leakage from natural gas infrastructure, P. Natl. Acad. Sci. USA, 109, 6435–6440, https://doi.org/10.1073/pnas.1202407109, 2012.
Alvarez, R. A., Zavala-Araiza, D., Lyon, D. R., Allen, D. T., Barkley, Z. R., Brandt, A. R., Davis, K. J., Herndon, S. C., Jacob, D. J., Karion, A., Kort, E. A., Lamb, B. K., Lauvaux, T., Maasakkers, J. D., Marchese, A. J., Omara, M., Pacala, S. W., Peischl, J., Robinson, A. L., Shepson, P. B., Sweeney, C., Townsend-Small, A., Wofsy, S. C., and Hamburg, S. P.: Assessment of methane emissions from the U.S. oil and gas supply chain, Science, 361, 186–188, https://doi.org/10.1126/science.aar7204, 2018.
Balcombe, P., Speirs, J., Brandon, N. P., and Hawkes, A. D.: Methane emissions: choosing the right climate metric and time, Environ. Sci.-Proc. Imp., 20, 1323, https://doi.org/10.1039/c8em00414e, 2018.
Bartlett, J. and Krupnick, A.: Decarbonized Hydrogen in the US Power and Industrial Sectors: Identifying and Incentivizing Opportunities to Lower Emissions, Resources for the Future, 2020.
Beswick, R. R., Oliveira, A. M., and Yan, Y.: Does the Green Hydrogen Economy Have a Water Problem?, Am. Chem. S., 6, 3167–3169, https://doi.org/10.1021/acsenergylett.1c01375, 2021.
BloombergNEF: Hydrogen Economy Outlook Key messages, Bloomberg Finance L. P., 14 pp., https://assets.bbhub.io/professional/sites/24/BNEF-Hydrogen-Economy-Outlook-Key-Messages-30-Mar-2020.pdf (last access: 26 April 2022) 2020a.
BloombergNEF: New Energy Outlook 2020 Executive Summary, Bloomberg Finance L. P., 30 pp., https://assets.bbhub.io/professional/sites/24/928908_NEO2020-Executive-Summary.pdf (last access: 26 April 2022), 2020b.
BloombergNEF: New Energy Outlook 2021 Executive Summary, Bloomberg Finance L. P., 16 pp., https://assets.bbhub.io/professional/sites/24/NEO-Executive-Summary-2021.pdf (last access: 26 April 2022), 2021.
Bond, S. W., Gül, T., Reimann, S., Buchmann, B., and Wokaun, A.: Emissions of anthropogenic hydrogen to the atmosphere during the potential transition to an increasingly H2-intensive economy, Int. J. Hydrogen, Energ., 36, 1122–1135, https://doi.org/10.1016/j.ijhydene.2010.10.016, 2011.
Budsberg, E., Crawford, J., Gustafson, R., Bura, R., and Puettmann, M.: Ethanologens vs. acetogens: Environmental impacts of two ethanol fermentation pathways, Biomass Bioenerg., 83, 23–31, https://doi.org/10.1016/j.biombioe.2015.08.019, 2015.
Cain, M., Lynch, J., Allen, M. R., Fuglestvedt, J. S., Frame, D. J., and Macey, A. H.: Improved calculation of warming-equivalent emissions for short-lived pollutants, NPJ Clim. Atmos. Sci., 2, 29, https://doi.org/10.1038/s41612-019-0086-4, 2019.
Camuzeaux, J. R., Alvarez, R. A., Brooks, S. A., Browne, J. B., and Sterner, T.: Influence of methane emissions and vehicle efficiency on the climate implications of heavy-duty natural gas trucks, Am. Chem. S., 49, 6402–6410, https://doi.org/10.1021/acs.est.5b00412, 2015.
Cherubini, F. and Tanaka, K.: Amending the Inadequacy of a Single Indicator for Climate Impact Analyses, Environ. Sci. Technol., 50, 12530–12531, https://doi.org/10.1021/acs.est.6b05343, 2016.
Colella, W. G., Jacobson, M. Z., and Golden, D. M.: Switching to a U.S. hydrogen fuel cell vehicle fleet: The resultant change in emissions, energy use, and greenhouse gases, J. Power Sources, 150, 150–181, https://doi.org/10.1016/J.JPOWSOUR.2005.05.092, 2005.
Collins, W., Frame, D., Fuglesvedt, J. S., and Shine, K. P.: Stable climate metrics for emissions of short and long-lived species – combining steps and pulses, Environ. Res. Lett. 15, 024018, https://doi.org/10.1088/1748-9326/ab6039, 2020.
Cooper, J., Dubey, L., Bakkaloglu, S., and Hawkes, A.: Hydrogen emissions from the hydrogen value chain-emissions profile and impact to global warming, Sci. Total Environ., 830, 15624, https://doi.org/10.1016/j.scitotenv.2022.154624, 2022.
Derwent, R. G.: Hydrogen for Heating: Atmospheric Impacts, Department for Business, Energy & Industrial Strategy, https://assets.publishing.service.gov.uk/government/uploads/system/uploads/attachment_data/file/760538/Hydrogen_atmospheric_impact_report.pdf (last access: 12 May 2012), 2018.
Derwent, R. G., Collins, W. J., Johnson, C. E., and Stevenson, D. S.: Transient behaviour of tropospheric ozone precursors in a global 3-D CTM and their indirect greenhouse effects, Climatic Change, 49, 463–487, https://doi.org/10.1023/A:1010648913655, 2001.
Derwent, R. G., Stevenson, D. S., Utembe, S. R., Jenkin, M. E., Khan, A. H., and Shallcross, D. E.: Global modelling studies of hydrogen and its isotopomers using STOCHEM-CRI: Likely radiative forcing consequences of a future hydrogen economy, Int. J. Hydrogen Energ., 45, 9211–9221, https://doi.org/10.1016/j.ijhydene.2020.01.125, 2020.
Derwent, R., Simmonds, P., O'Doherty, S., Manning, A., Collins, W., and Stevenson, D.: Global environmental impacts of the hydrogen economy, Int. J. Nuclear Hydrogen Production and Application, 1, 57–67, https://doi.org/10.1504/IJNHPA.2006.009869, 2006.
Ehhalt, D., Prather, M., Dentener, F., Derwent, R., Dlugokencky, E., Holland, E., Isaksen, I., Katima, J., Kirchhoff, V., Matson, O., Midgley, P., and Wang, M.: Atmospheric Chemistry and Greenhouse Gases, in: Climate Change 2001: The Scientific Basis, Contribution of Working Group I to the Third Assessment Report of the Intergovernmental Panel on Climate Change, edited by: Houghton, J. T., Ding, Y., Griggs, D. J., Noguer, M., van der Linden, P. J., Dai, X., Maskell, K., and Johnson, C. A., Cambridge University Press, Cambridge, United Kingdom and New York, NY, USA, 239–287, ISBN: 0521014956, 2001.
Energy Transitions Commission: Making the Hydrogen Economy Possible: Accelerating Clean Hydrogen in an Electrified Economy, https://www.energy-transitions.org/publications/making-clean-hydrogen-possible/ (last access: 18 May 2022), 2021.
Fesenfeld, L. P., Schmidt, T. S., and Schrode, A.: Climate policy for short- and long-lived pollutants, Nat. Clim. Change, 8, 924–936, https://doi.org/10.1038/s41558-018-0321-8, 2018.
Field, R. A. and Derwent, R. G.: Global warming consequences of replacing natural gas with hydrogen in the domestic energy sectors of future low-carbon economies in the United Kingdom and the United States of America, Int. J. Hydrogen Energ., 46, 30190–30203, https://doi.org/10.1016/j.ijhydene.2021.06.120, 2021.
Fischer, E. M., Sippel, S., and Knutti, R.: Increasing probability of record-shattering climate extremes, Nat. Clim. Change, 11, 689–695, https://doi.org/10.1038/s41558-021-01092-9, 2021.
Forster, P., Storelvmo, T., Armour, K., Collins, W., Dufresne, J. L., Frame, D., Lunt, D. J., Mauritsen, T., Palmer, M. D., Watanabe, M.,Wild, M., and Zhang, H.: The Earth's energy budget, climate feedbacks, and climate sensitivity, in: Climate Change 2021: The Physical Science Basis, Contribution of Working Group I to the Sixth Assessment Report of the Intergovernmental Panel on Climate Change, edited by: Masson-Delmotte, V., Zhai, P., Pirant, A., Connors, S. L., Pean, C., Berger, S., Caud, C., Chen, Y., Goldfarb, L., Gomis, M. I., Huang, M., Leitzell, K., Lonnoy, E., Matthews, L. B. R., Maycock, T. K., Waterfield, T., Yelekci, O., Yu, R., and Zhou, B., Cambridge University Press, 923–1054, https://www.ipcc.ch/report/ar6/wg1/ (last access: 11 July 2022), 2021.
Frazer-Nash Consultancy: Fugitive Hydrogen Emissions in a Future Hydrogen Economy, Department for Business, Energy & Industrial Strategy, https://www.gov.uk/government/publications/fugitive-hydrogen-emissions-in-a-future-hydrogen-economy (last access: 14 April 2022), 2022.
Howarth, A. and Jacobson, M. Z.: How green is blue hydrogen?, Energy Sci. Eng., 9, 1676–1687, https://doi.org/10.1002/ese3.956, 2021.
Hydrogen Council: Hydrogen scaling up A sustainable pathway for the global energy transition, 78 pp., https://hydrogencouncil.com/en/study-hydrogen-scaling-up/ (last access: 7 April 2022), 2017.
Hydrogen Council: Hydrogen Insights Report 2021, A perspective on hydrogen investment, market development and cost competitiveness, 58 pp., https://hydrogencouncil.com/en/hydrogen-insights-2021/ (last access: 14 April 2022), 2021a.
Hydrogen Council: Hydrogen decarbonization pathways: A life-cycle assessmentfor Net-Zero: A critical cost-competitive energy vector, 55 pp., https://hydrogencouncil.com/en/hydrogen-for-net-zero/ (last access: 16 May 2022), 2021b.
International Energy Agency: The Future of Hydrogen Seizing today’s opportunities, 203 pp., https://www.iea.org/reports/the-future-of-hydrogen (last access: 14 April 2022), 2019.
International Energy Agency: Global Hydrogen Review 2021, 224 pp., https://www.iea.org/reports/global-hydrogen-review-2021 (last access: 14 April 2022), 2021.
International Energy Agency: Hydrogen, https://www.iea.org/fuels-and-technologies/hydrogen, last access: 17 May 2022.
International Renewable Energy Agency: Global Renewables Outlook: Energy transformation 2050, https://www.irena.org/publications/2020/Apr/Global-Renewables-Outlook-2020 (last access: 16 May 2022), 2020.
International Renewable Energy Agency: Global Hydrogen Trade to Meet the 1.5 ∘C Climate Goal Part II Technology Review of Hydrogen Carriers, https://www.irena.org/publications/2022/Apr/Global-hydrogen-trade-Part-II (last access: 13 May 2022), 2022.
Ivanovich, C. C., Ocko, I. B., Piris-Cabezas, P., and Petsonk, A.: Climate benefits of proposed carbon dioxide mitigation strategies for international shipping and aviation, Atmos. Chem. Phys., 19, 14949–14965, https://doi.org/10.5194/acp-19-14949-2019, 2019.
Jacobson, M. Z.: Effects of wind-powered hydrogen fuel cell vehicles on stratospheric ozone and global climate, Geophys. Res. Lett., 35, L19803, https://doi.org/10.1029/2008GL035102, 2008.
Kobayashi, H., Naruo, Y., Maru, Y., Takesaki, Y., and Miyanabe, K.: Experiment of cryo-compressed (90-MPa) hydrogen leakage diffusion, Int. J. Hydrogen Energ., 43, 17928–17937, https://doi.org/10.1016/J.IJHYDENE.2018.07.145, 2018.
Lewis, A. C.: Optimising air quality co-benefits in a hydrogen economy: a case for hydrogen-specific standards for NOx emissions, Environ. Sci: Atmos., 1, 201–207, https://doi.org/10.1039/d1ea00037c, 2021.
Lynch, J., Cain, M., Pierrehumbert, R., and Allen, M.: Demonstrating GWP*: a means of reporting warming-equivalent emissions that captures the contrasting impacts of short-and long-lived climate pollutants, Environ. Res. Lett., 15, 044023, https://doi.org/10.1088/1748-9326/ab6d7e, 2020.
Mejia, A. H., Brouwer, J., and Mac Kinnon, M.: Hydrogen leaks at the same rate as natural gas in typical low-pressure gas infrastructure, Int. J. Hydrogen Energ., 45, 8810–8826, https://doi.org/10.1016/j.ijhydene.2019.12.159, 2020.
Melaina, M. W., Antonia, O., and Penev, M.: Blending Hydrogen into Natural Gas Pipeline Networks: A Review of Key Issues, PhD, National Renewable Energy Laboratory, https://doi.org/10.2172/1068610, 2013.
Myhre, G., Shindell, D., Bréon, F.-M., Collins, W., Fuglestvedt, J., Huang, J., Koch, D., Lamarque, J.-F., Lee, D., Mendoza, B., Nakajima, T., Robock, A., Stephens, G., Takemura, T., and Zhang, H.: Anthropogenic and Natural Radiative Forcing Supplementary Material, in: Climate Change 2013: The Physical Basis, Contribution of Working Group I of the Fifth Assessment Report of the Intergovernmental Panel on Climate Change, edited by: Stocker, T. F., Qin, D., Plattner, G.-K., Tignor, M. Allen, S. K., Boschung, J., Nauels, A., Xia, Y., Bex, V., and Midgley, P. M., Cambridge University Press, 8SM-1–8SM-44, https://doi.org/10.1017/CBO9781107415324.018, 2013.
Najjar, Y. S.: Hydrogen Leakage Sensing and Control: (Review), Biomed. J. Sci. Tech. Res., 21, 16228–16240, https://doi.org/10.26717/bjstr.2019.21.003670, 2019.
Ocko, I. B. and Hamburg, S. P.: Climate Impacts of Hydropower: Enormous Differences among Facilities and over Time, Environ. Sci. Technol., 53, 14070–14082, https://doi.org/10.1021/acs.est.9b05083, 2019.
Ocko, I. B., Hamburg, S. P., Jacob, D. J., Keith, D. W., Keohane, N. O., Oppenheimer, M., Roy-Mayhew, J. D., Schrag, D. P., and Pacala, S. W.: Unmask temporal trade-offs in climate policy debates, Science, 356, 492–493, https://doi.org/10.1126/science.aaj2350, 2017.
Ocko, I. B., Sun, T., Shindell, D., Oppenheimer, M., Hristov, A. N., Pacala, S. W., Mauzerall, D. L., Xu, Y., and Hamburg, S. P.: Acting rapidly to deploy readily available methane mitigation measures by sector can immediately slow global warming, Environ. Res. Lett., 16, 054042, https://doi.org/10.1088/1748-9326/abf9c8, 2021.
Paulot, F., Paynter, D., Naik, V., Malyshev, S., Menzel, R., and Horowitz, L. W.: Global modeling of hydrogen using GFDL-AM4.1: Sensitivity of soil removal and radiative forcing, Int. J. Hydrogen Energ., 46, 13446–13460, https://doi.org/10.1016/j.ijhydene.2021.01.088, 2021.
Prather, M. J.: An Environmental Experiment with H2?, Science, 302, 581–582, https://doi.org/10.1126/science.1091060, 2003.
Rahn, T., Eiler, J. M., Boering, K. A., Wennberg, P. O., McCarthy, M. C., Tyler, S., Schauffler, S., Donnelly, S., and Atlas, E.: Extreme deuterium enrichment in stratospheric hydrogen and the global atmospheric budget of H2, Nature, 424, 915–918, https://doi.org/10.1038/nature01917, 2003.
Saadat, S. and Gersen, S.: Reclaiming Hydrogen for a Renewable Future, Earthjustice, 41 pp., https://earthjustice.org/features/green-hydrogen-renewable-zero-emission (last access: 11 July 2022), 2021.
Schultz, M. G., Diehl, T., Brasseur, G. P., and Zittel, W.: Air Pollution and Climate-Forcing Impacts of a Global Hydrogen Economy, 302, 622–624, https://doi.org/10.1126/science.1089527, 2003.
Secretary of State for Business: Department for Business, Energy and Industrial Strategy, UK hydrogen strategy, United Kingdom, https://www.gov.uk/government/publications/uk-hydrogen-strategy (last access: 20 April 2022), 2021.
Severinsky, A. J. and Sessoms, A. L.: Methane versus Carbon Dioxide: Mitigation Prospects, Int. J. Environ. Ecol. Eng., 15, 214–220, https://publications.waset.org/vol/176, 2021.
Shen, L., Zavala-Araiza, D., Gautam, R., Omara, M., Scarpelli, T., Sheng, J., Sulprizio, M. P., Zhuang, J., Zhang, Y., Qu, Z., Lu, X., Hamburg, S. P., and Jacob, D. J.: Unravelling a large methane emission discrepancy in Mexico using satellite observations, Remote Sens. Enviornment, 260, 112461, https://doi.org/10.1016/j.rse.2021.112461, 2021.
Sherif, S. A., Zeytinoglu, N., and Veziroglug, T. N.: Liquid Hydrogen: Potential, Problems, and a Proposed Research Program, Int. J. Hydrogen Energy, 22, 683–688, 1997.
Shine, K. P., Berntsen, T. K., Fuglestvedt, J. S., Skeie, R. B., and Stuber, N.: Comparing the Climate Effect of Emissions of Short-and Long0Lived Climate Agents, Phil. Trans. R. Soc. A., 365, 1903–1914, https://doi.org/10.1098/rsta.2007.2050, 2007.
Simoes, S. G., Catarino, J., Picado, A., Lopes, T. F., di Berardino, S., Amorim, F., Gírio, F., Rangel, C. M., and Ponce de Leão, T.: Water availability and water usage solutions for electrolysis in hydrogen production, J. Clean. Produc., 315, 128124, https://doi.org/10.1016/j.jclepro.2021.128124, 2021.
Swain, M. R. and Swain, M. N.: A comparison of H2, CH4 and C3H8 fuel leakage in residential settings, Int. J. Hydrogen Energ., 17, 807–815, https://doi.org/10.1016/0360-3199(92)90025-R, 1992.
Thibault, L., Gahlot, P. and Debarre, R.: Hydrogen applications and business models, Kearney Energy Transition Institute, https://www.energy-transition-institute.com/insights/hydrogen (last access: 14 April 2022), 2020.
Tromp, T. K., Shia, R.-L., Allen, M., Eiler, J. M., and Yung, Y. L.: Potential Environmental Impact of a Hydrogen Economy on the Stratosphere, Science, 300, 1740–1742, https://doi.org/10.1126/science.1085169, 2003.
Ueckerdt, F., Bauer, C., Dirnaichner, A., Everall, J., Sacchi, R., and Luderer, G.: Potential and risks of hydrogen-based e-fuels in climate change mitigation, Nat. Clim. Change, 11, 384–393, https://doi.org/10.1038/s41558-021-01032-7, 2021.
van Renssen, S.: The hydrogen solution?, Nat. Clim. Change, 10, 799–201, https://doi.org/10.1038/s41558-020-0891-0, 2020.
van Ruijven, B., Lamarque, J. F., van Vuuren, D. P., Kram, T., and Eerens, H.: Emission scenarios for a global hydrogen economy and the consequences for global air pollution, Glo. Env. Change, 21, 983–994, https://doi.org/10.1016/j.gloenvcha.2011.03.013, 2011.
Vogel, B., Feck, T., and Groobß, J. U.: Impact of stratospheric water vapor enhancements caused by CH4 and H2O increase on polar ozone loss, J. Geophys. Res-Atmos., 116, D05301, https://doi.org/10.1029/2010JD014234, 2011.
Vogel, B., Feck, T., Grooß, J. U., and Riese, M.: Impact of a possible future global hydrogen economy on Arctic stratospheric ozone loss, Energy Environ. Sci., 5, 6445–6452, https://doi.org/10.1039/c2ee03181g, 2012.
Wang, D., Jia, W., Olsen, S. C., Wuebbles, D. J., Dubey, M. K., and Rockett, A. A.: Impact of a future H2-based road transportation sector on the composition and chemistry of the atmosphere – Part 2: Stratospheric ozone, Atmos. Chem. Phys., 13, 6139–6150, https://doi.org/10.5194/acp-13-6139-2013, 2013.
Warwick, N., Bekki, S., Nisbet, E. G., and Pyle, J. A.: Impact of a hydrogen economy on the stratosphere and troposphere studied in a 2-D model, Geophys. Res. Letters, 31, L05107, https://doi.org/10.1029/2003gl019224, 2004.
Warwick, N., Griffiths, P., Keeble, J., Archibald, A., Pyle, J., and Shine, K.: Atmospheric implications of increased Hydrogen use, Department for Business, Energy and Industrial Strategy, 75 pp., https://www.gov.uk/government/publications/atmospheric-implications-of-increased-hydrogen-use (last access: 15 April 2022), 2022.
World Energy Council: Working Paper National Hydrogen Strategies, 20 pp., publications/entry/working-paper-hydrogen-on-the-horizon-national-hydrogen-strategies (last access: 25 January 2022), 2021.
Wuebbles, D. J., Dubey, M. K., Edmonds, J., Layzell, D., Olsen, S., Rahn, T., Rocket, A., Wang, D., and Jia, W.: Evaluation of the Potential Environmental Impacts from Large-Scale Use and Production of Hydrogen in Energy and Transportation Applications, University of Illinois at Urbana-Champaign, United States, https://doi.org/10.2172/1044180, 2010.
Xu, Y., Zaelke, D., Velders, G. J. M., and Ramanathan, V.: The role of HFCs in mitigating 21st century climate change, Atmos. Chem. Phys., 13, 6083–6089, https://doi.org/10.5194/acp-13-6083-2013, 2013.
Yusaf, T., Laimon, M., Alrefae, W., Kadirgama, K., Dhahad, H., Ramasamy, D., Kamarulzaman, M. K., and Yousif, B.: Hydrogen Energy Demand Growth Prediction and Assessment (2021–2050) Using a System Thinking and System Dynamics Approach, Appl. Sci., 12, 781, https://doi.org/10.3390/app12020781, 2022.