the Creative Commons Attribution 4.0 License.
the Creative Commons Attribution 4.0 License.
 | 15 Jul 2022
Particle size distribution and particulate matter concentrations during synoptic and convective dust events in West Texas
Karin Ardon-Dryer
Mary C. Kelley
Dust events are an important and complex constituent of the atmospheric system that can impact Earth's climate, the environment, and human health. The frequency of dust events in the Southern High Plains of West Texas has increased over the past 2 decades, yet their impact on air quality in this region is still unclear. This is due to the fact that there is only one air quality monitoring station that measures only PM2.5 concentrations (particulate matter with an aerodynamic diameter < 2.5 µm), and there is no information on other PM sizes or the particle size distribution. The Aerosol Research Observation Station (AEROS) unit provides insight into the local variation in particle concentration during different dust events and allows for a better understanding of the impact of dust events on air quality. As this area is prone to dust events, we were wondering if dust events generated by different meteorological causes (synoptic vs. convective) would present similar particle concentrations or particle size distributions. Thus, in this project, three different dust events were measured by AEROS and compared. Each dust event originated from a different direction and lasted a different duration. One of the dust events was synoptic (10 April 2019) and two were convective (5 and 21 June 2019). Measurements of particle mass and number concentration, size distribution, and meteorological conditions for each dust event were compared. The synoptic dust event (on 10 April) was longer (12 h) and had stronger wind speed conditions (up to 22.1 m s−1), whereas the two respective convective dust events on 5 and 21 June lasted only 20 and 30 min and had lower wind speeds (up to 16.5 and 13.4 m s−1). Observation of PM based on daily and hourly values showed an impact on air quality, yet measurements based on daily and hourly values underestimate the impact of the convective dust events. Observations based on a shorter timescale (10 min) reveal the true impact of the two convective dust events. A comparison of the particle size distribution showed that all three dust events presented an increase in particles in the 0.3–10 µm size range. Comparisons of the particle concentration for particles > 5 and > 10 µm show very high values during the dust events. Some particle sizes even increase in concentration by ∼ 2 orders of magnitude compared with the time before the dust event. This leads us to speculate that the impact of convective dust events on air quality in this region is underestimated with the current (hourly basis) method.
- Article
(1785 KB) - Full-text XML
-
Supplement
(13592 KB) - BibTeX
- EndNote


Atmospheric dust particles, generated during dust events, are the second-largest contributor to the global aerosol burden (Goudie and Middleton, 2006; Textor et al., 2006). Dust events are common in arid and semiarid environments (Goudie and Middleton, 2006; Goudie, 2014), and they occur when strong winds pick up loose dust particles, suspending them in the atmosphere (Goudie, 2014; Middleton, 2017). Dust events can be generated by two main meteorological disturbances, synoptic and convective events. Synoptic events are upper-level disturbances, including warm and cold fronts, low- and high-pressure systems, troughs, and ridges, whereas convective events are caused by thunderstorms, including thunderstorm outflow boundaries and thunderstorm downbursts (Knippertz, 2014).
Among the various regions common to dust events (including Africa, Asia, and Australia), dust events in the US contribute only 5 % of the global dust emissions (Miller et al., 2004), and most of the dust events are formed in the western portion of the US (Goudie, 2014; Rublee et al., 2020). Studies have shown that dust events in the central and southeastern US have increased in the last decade (Hand et al., 2016; Tong et al., 2017; Kelley and Ardon-Dryer, 2021), and climate models predict that the occurrence of these events will increase even further with climate change (Pu and Ginoux, 2017; Achakulwisut et al., 2018; Brey et al., 2020).
Dust events are an important and complex constituent of the atmospheric system, as they can impact the Earth's climate, the environment, and human well-being in different ways. Atmospheric dust particles affect climate directly, through the scattering and absorption of solar radiation (Wang et al., 2009; Lau et al., 2020), and indirectly, by acting as cloud condensation nuclei and ice nuclei particles (Chen et al., 2019; Ardon-Dryer and Levin, 2014). Dust particles can influence the atmospheric vertical electric field (Ardon-Dryer et al., 2021), impact the economy (Tozer and Leys, 2013; Al-Hemoud et al., 2019; Abdullaev and Sokolik, 2020), and negatively affect human well-being and health (Goudie, 2014; Bhattachan et al., 2019; Ardon-Dryer et al., 2020).
During dust events, the particle concentration may exceed the recommended daily PM10 and PM2.5 (particulate matter with an aerodynamic diameter < 10 and < 2.5 µm, respectively) threshold values with respect to human health from the World Health Organization (WHO) and the US Environmental Protection Agency (EPA): WHO puts forward respective PM10 and PM2.5 threshold values of 50 and 25 µg m−3 (WHO, 2006) or of 45 and 15 µg m−3 based on the updated air quality guidelines (WHO, 2021), whereas the EPA gives respective values of 150 and 35 µg m−3 (EPA, 2016). Information on atmospheric dust particle concentrations and their sizes during dust events is important, as dust events and the associated high particle concentrations have significant public health impacts (Aghababaeian et al., 2021). Epidemiological studies have demonstrated that there is a direct link between exposure to high amounts of dust particles and the number of daily hospitalizations and deaths (Karanasiou et al. 2012; Rublee et al., 2020; Herrera-Molina et al., 2021). Exposure to dust particles during dust events can cause respiratory and cardiovascular problems (Zhang et al., 2016; Toure et al., 2019; Rublee et al., 2020); increase the probability of low birth weight and premature birth (Dastoorpoor et al., 2018; Jones, 2020; Bogan et al., 2021); cause different diseases, such as meningitis (Diokhane et al., 2016) and valley fever (Middleton, 2020); and, in rare cases, end in death (Crooks et al., 2016; Zhang et al., 2016). Information on the increase in particle concentrations and the change in particle sizes with the degradation of air quality during dust events can help develop an understanding of the impact that these events have on people who are exposed to them.
The air quality in the Southern High Plains region of West Texas is good overall, with a daily PM2.5 value of around 7.1±7.5 µg m−3 (Kelley et al., 2020). This area experiences many dust events, with an annual average of ∼ 21 dust events per year, mainly in the spring and early summer (Kelley and Ardon-Dryer, 2021). Dust events in this region occur due to the high wind speed, low surface cover, and low moisture conditions (Stout, 2001). Analysis of 420 dust events in this region by Kelley and Ardon-Dryer (2021) showed that most of the dust events are only 1 h long, and very few exceeded the regulatory recommended PM2.5 daily threshold. Of these dust events, only synoptic dust events exceeded the daily threshold (none of the convective dust events did). It is unclear whether convective events are less intense and have lower particle concentrations or whether the methods used to evaluate their impact (daily and hourly measurements) were not sensitive enough to detect these events, as many of the convective dust events in this region are of short duration.
To better understand the impact of dust events on air quality and to examine if different types of dust events (synoptic vs. convective) have a similar particle mass and number concentration, additional measurements are needed. The Aerosol Research Observation Station (AEROS) was designed for this purpose. AEROS, which has been operational since March 2019, allows for continuous monitoring of particle mass and number concentration (including the mass concentration of different PM sizes) and of the particle size distribution (Ardon-Dryer et al., 2022). Three dust events were captured by AEROS during the study period: one synoptic and two convective. A comparison between these dust events, based on particle number concentrations, mass concentrations, and particle size distribution, and their impact on air quality will be presented.
2.1 Research area and measurement station
Measurements were conducted in Lubbock, which is located in the Southern High Plains of West Texas (33∘35′12.5′′ N, 101∘52′31.3′′ W; Fig. 1). The location is a flat urban area (approximately 1 km above sea level) in a rural region, surrounded by numerous agricultural fields, and situated in a semiarid environment. AEROS is located on the Texas Tech University campus on a building rooftop at 9.8 m above the ground. The aerosol unit includes a shed that is temperature controlled by an air-conditioning unit that maintains a continuous temperature of 22 ∘C. It has four rain-protected inlet units at 2.9 m from the rooftop floor (1±0.01 m from the station rooftop), and each inlet is connected to a 0.013 m diameter stainless steel tube ( inch tube) that is, in turn, connected to a custom-built in-line dryer unit, which is used to remove condensed-phase water from the collected particles. A Swagelok reducer connects each dryer to an aerosol instrument (one for each instrument) using a 0.0064 m diameter stainless steel tube ( inch tube). The fourth inlet is used for aerosol collection via a filter holder. The three aerosol instruments include the TSI 3330 optical particle sizer (OPS), a DustTrak DRX aerosol monitor (TSI 8533EP, Shoreview, MN, USA; TSI, 2021), and a Grimm 11-D system portable aerosol spectrometer (Grimm Aerosol Technik GmbH & Co. KG, Germany; Grimm 11-D, 2021).
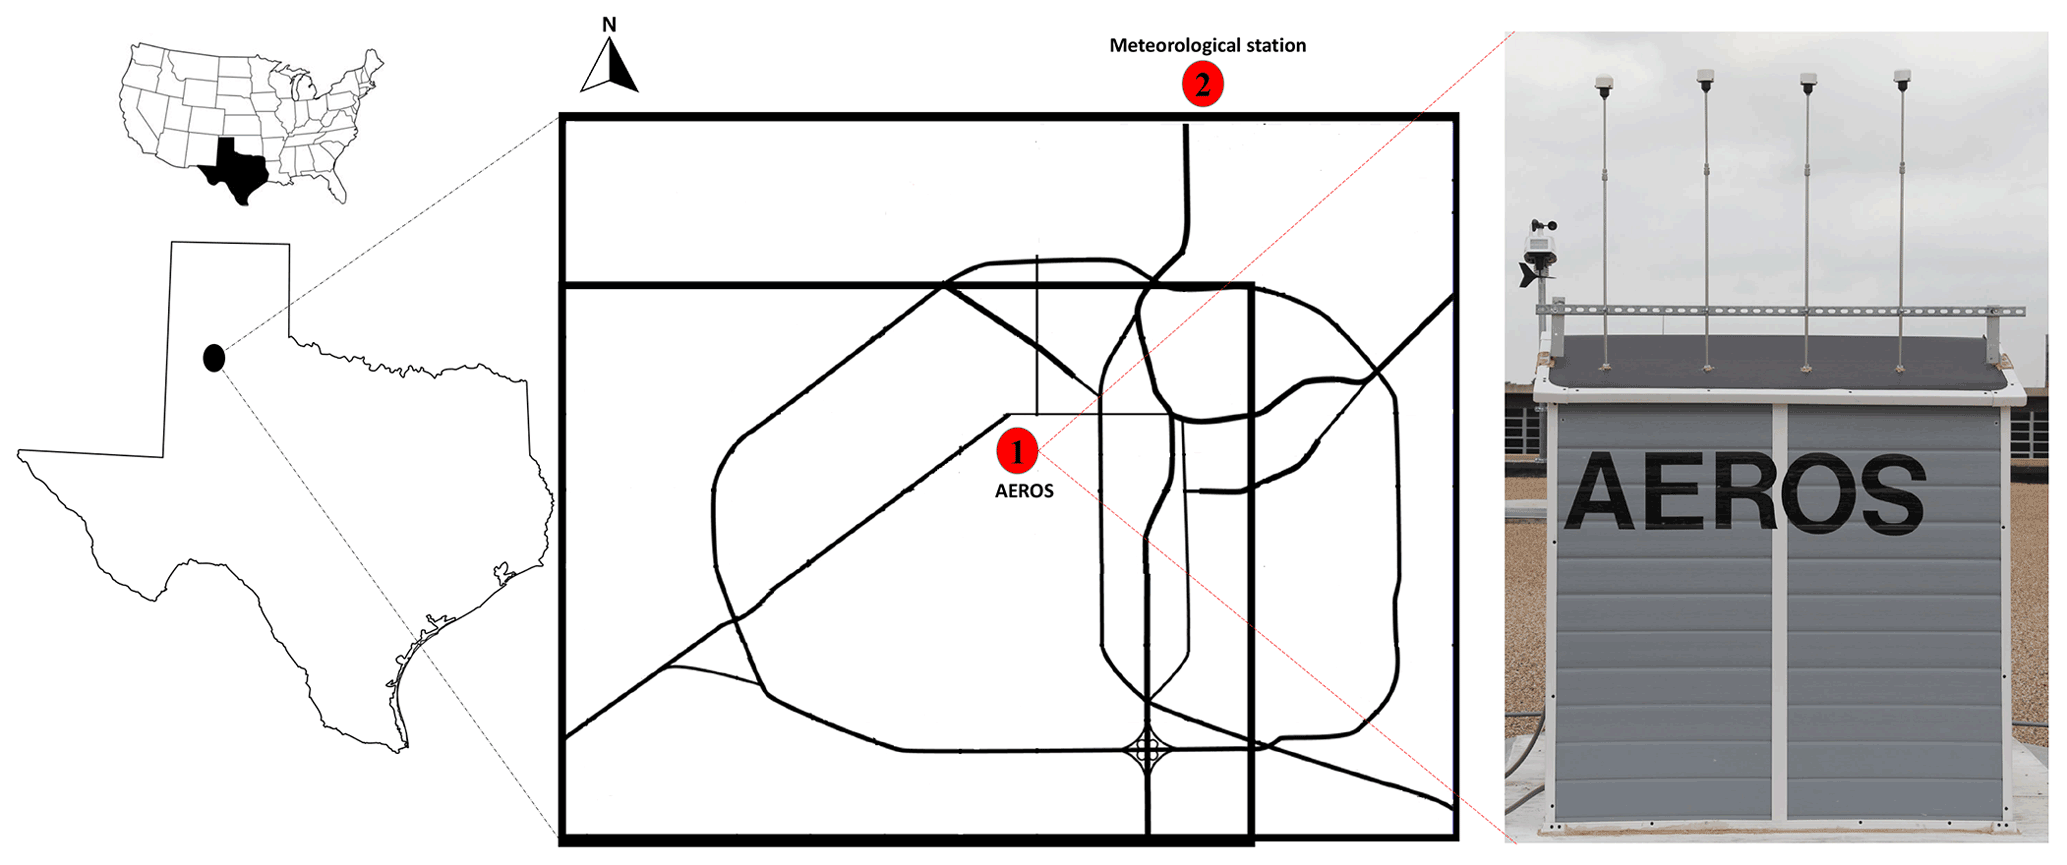
Figure 1Location of AEROS (1) and the meteorological station (2) in the Southern High Plains region of West Texas. The photo shows the AEROS aerosol measurements unit.
The OPS measures the total particle number concentration and particle size distributions in 16 channels from 0.3 to 10 µm at a time resolution of 60 s using a flow rate of 1.0 L min−1. The DustTrak DRX measures aerosol mass concentrations at various PM sizes (PM1, PM2.5, PM4, and PM10) at a time resolution of 60 s using a flow rate of 1.0 L min−1. The Grimm 11-D measures total particle number concentrations, mass concentration (e.g., PM1, PM2.5, PM4, and PM10), and size distribution over a size range of 0.25–35.15 µm in 31 channels (bins). Data are recorded every 60 s at a flow rate of 1.2 L min−1. Data from the three units were collected each minute, and the 10 min, hourly, and daily average values were calculated using MATLAB. As the Grimm 11-D instrument provides the concentration of particles for each bin size, calculations of size distributions for number concentrations (dN dlogDp) were performed from the instrument output using MATLAB. All instrument times were synchronized and converted to local Central Standard Time (CST). Additional information on AEROS and each of the aerosol instruments, including an intercomparison analysis, can be found in Ardon-Dryer et al. (2022).
2.2 Meteorological measurements
Meteorological information, such as 5 min to 1 h ambient temperature, relative humidity, wind speed, wind direction, wind gust, visibility, pressure, and precipitation, was retrieved from the local National Weather Service (NWS) Automated Surface Observation System (ASOS), available via the METeorological Aerodrome Reports (METARs), which is located ∼ 9.8 km northeast of AEROS (33∘39′48.96′′ N, 101∘49′22.8′′ W; Fig. 1). Observations of meteorological conditions (e.g., thunderstorms, rain, haze, and dust) were retrieved for that period using the “Present Weather Code”. All times were converted to CST.
3.1 Different meteorological conditions initiate each dust event
Three different dust events were captured by AEROS and compared in this work. The respective dust events occurred on 10 April and on 5 and 21 June 2019. All dust events were defined in the METARs as blowing dust events (BLDU). The 10 April dust event was caused by a synoptic disturbance, whereas the two June dust events were convective. A description of the meteorological conditions that initiated each dust event is given below. Each of these dust events originated from a different direction, as shown in Fig. S1.
The synoptic event on 10 April was caused by a low-pressure system that was located between Colorado, New Mexico, and Texas. As the system moved east, strong winds were generated from the west and moved toward AEROS. Strong winds started around 11:00 CST, but a reduction in visibility did not start until 13:30 CST. The highest wind speed and wind gust (22.1 and 26.7 m s−1, respectively) were measured at ∼ 17:50 CST, while the lowest visibility reached 0.8 km minutes afterward (at 17:53 CST). The cold front associated with the low-pressure system moved through the area in the late evening hours, resulting in the continuation of strong winds until the early morning hours the following day (11 April). Visibility during this day varied with wind speed, as can be seen in Fig. 2a. A video showing the dust event, taken from the 12th floor of the Atmospheric Science Group in the Media and Communications building at Texas Tech University campus, presents a continuous flow of dust particles (Video S1A in the Supplement).
The second dust event that occurred on 5 June was a convective event that resulted from an outflow boundary from thunderstorms that formed west of the measurement site. An outflow boundary from one of the thunderstorms moved through the area causing a dust wall (haboob type). This convective event lasted for a short duration (20 min), had a sharp increase in wind speed up to 16.5 m s−1 (from 2.6 m s−1 measured 3 min earlier), and wind gusts of up to 23.6 m s−1 with a decrease in visibility down to 0.4 km (Fig. 2b). The thunderstorms generated moderate precipitation that started at 18:41 CST and lasted until 20:50 CST. After the precipitation ended, the visibility increased again to 10 km (Fig. 2b). A video showing the dust event with the haboob and the precipitation that follows can be found in the Supplement (Video S1B).

Figure 2Changes in meteorological conditions: wind speed (blue) and visibility (black) as measured on each of the dust event days.
The third dust event was also a convective dust type and occurred on 21 June 2019. During the morning hours, a dry line moved east towards the area, and it stalled just to the west of the research location later in the afternoon. Thunderstorms developed east of the dry line, southeast of AEROS, ∼ 70 km from the measurements station (see Fig. S2), due to the lift that occurred in front of the boundary. An outflow boundary from the thunderstorm moved northwest through the observational domain and generated the dust event. This dust event was short (30 min), as can be seen by the sharp and short increase in wind speed from 4.1 to 10.8 m s−1 from 20:40 to 20:45 CST; by 21:00 CST, the wind speed reached 13.4 m s−1 (with gusts of 16.5 m s−1) and visibility decreased to 4.8 km (Fig. 2c). A video showing the dust particles' outflow can be found in the Supplement (Video S1C).
3.2 PM concentration during the three dust events
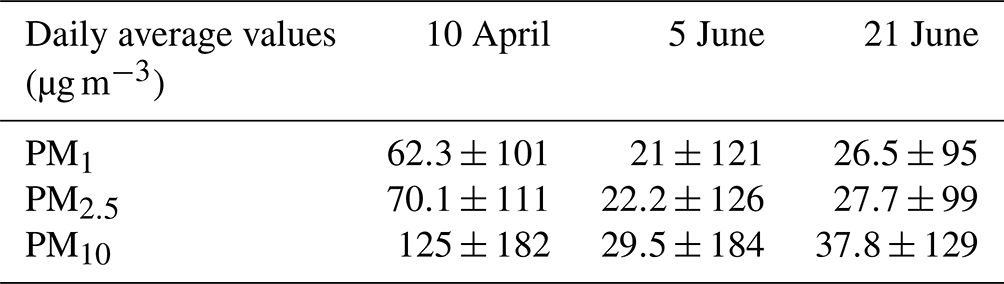
PM concentrations were measured during each of the dust events. Unfortunately, the Grimm 11-D instrument was not operational on 10 April; therefore, PM comparisons were only made based on the DustTrak unit. A comparison of the daily average values of each day shows relatively high standard deviation (SD) values for each of the 3 dust days (Table 1). The 10 April event had a higher daily concentration for all PM sizes compared with the events on 5 and 21 June. The daily average values on 10 April were 70.1±111 µg m−3 and 125±182 µg m−3 for PM2.5 and PM10, respectively. These values exceed the WHO daily threshold values for PM2.5 and PM10; they also exceed the EPA recommended daily threshold for PM2.5 but not for PM10. The PM1 daily average for the 10 April dust event was 62.37±101 µg m−3; however, as there is no standard set for PM1, we could not evaluate its impact (Griffiths et al., 2018). The PM2.5 and PM10 daily concentrations on 5 June were 22.2±126 and 29.5±184 µg m−3, respectively. These daily average values did not exceed the EPA daily threshold nor the WHO threshold, but the PM2.5 values were above the daily threshold based on the new WHO air quality guidelines (WHO, 2021). The PM1 daily average for the 5 June dust event was 21±121 µg m−3. On 21 June, the PM2.5 daily average was 27.7±99 µg m−3, which was above the WHO threshold values but not above the EPA threshold values. The PM10 daily average value was 37.8±129 µg m−3 and did not exceed the WHO or EPA threshold values. The PM1 daily average for the 21 June dust event was 26.5±95 µg m−3. If observations would have been made based only on the daily average values, without the ability to look at the high SD values, one would not have suspected that dust events occurred in June, and these days would have been classified as clean days. These findings are similar to those of Kelley and Ardon-Dryer (2021), who reported that dust events during synoptic days surpass the EPA recommended daily threshold for PM2.5, whereas convective dust events are under the PM2.5 threshold.
Table 1Daily average PM10, PM2.5, and PM1 values measured by the DustTrak during each day.
The daily average values found for the three events were lower than those measured at other locations, such as the Mediterranean (Alghamdi et al., 2015; Krasnov et al., 2016; Saraga et al., 2017), Asia (Tsai et al., 2012; Sarkar et al., 2019), and Africa (Kandler et al., 2009; Bouet et al., 2019). The proximity of these different locations to large dust sources, compared with our study region, could explain the higher PM values. Although several dust events in southern Tunisia had daily PM10 concentrations in a similar range to those measured during the synoptic day of 10 April (∼ 125 µg m−3), many other southern Tunisia dust events had much higher daily PM10 values (> 1500 µg m−3; Bouet et al., 2019). Even other locations in the US (e.g., Arizona) had higher PM10 concentrations, with daily values of up to 1972 µg m−3 (Hyde et al., 2018). The PM10 daily values for the synoptic day were in the same range as those measured during dust events in this region by Stout (2001). For PM2.5, the daily concentrations on these 3 days were in a similar range to those measured at the same location during previous dust events (Kelley and Ardon-Dryer, 2021) but higher than those measured in the Great Basin region (Hahnenberger and Nicoll, 2012).
The PM1, PM2.5, and PM10 values were then calculated for 1 h and 10 min time intervals in order to capture changes in the PM concentrations over a shorter duration (Fig. 3), mainly because the convective dust events were shorter (20–30 min long). Dust particles during the synoptic event (10 April) were present in the atmosphere for 12 h: from noon (when an increase in PM was observed) until midnight (when PM concentration decreased back to background levels) (Fig. 3a, d). The highest PM concentration (hourly average ± SD) was measured at 17:00 CST: 298±116 µg m−3 for PM1, 327±123 µg m−3 for PM2.5, and 539±186 µg m−3 for PM10. Calculation based on a 10 min interval shows that the highest PM concentrations were measured at 19:10 CST: 483±58 µg m−3 for PM1, 533±61 µg m−3 for PM2.5 and 850±90 µg m−3 for PM10 (Fig. 3d). The fluctuations in PM measurement based on the 10 min average were caused by the fluctuation in wind speed. Comparisons between the wind speed and the 10 min average PM concentrations had high R2 values (> 0.67). Unlike the synoptic dust event, the two convective events were shorter in duration and had different PM concentrations. The highest hourly PM concentrations on 5 June were measured at 18:00 CST: 187±408 µg m−3 for PM1, 196±425 µg m−3 for PM2.5, and 280±621 µg m−3 for PM10. Lower hourly PM concentrations were found than those measured during the synoptic dust event. However, when the observation was made based on a 10 min average, the highest PM concentrations, which were measured at 18:10 CST, had a PM1 concentration of 922±577 µg m−3, a PM2.5 concentration of 964±600 µg m−3, and a PM10 concentration of 1403±884 µg m−3, which are higher values than those measured during the synoptic event (based on a 10 min interval). The dust event on 21 June had the highest hourly PM concentrations at 21:00 CST: 170±251 µg m−3 for PM1, 178±261 µg m−3 for PM2.5, and 238±340 µg m−3 for PM10. These hourly values were also lower than those measured during the synoptic dust event. However, when observations were made based on a 10 min interval, the PM values were higher than those during the synoptic event. The highest 10 min PM concentrations, which were measured at 21:00 CST, were 684±153 µg m−3 for PM1, 710±159 µg m−3 for PM2.5, and 927±192 µg m−3 for PM10. The high SD values of the PM concentrations for the two convective events can reflect the short duration of these dust events. It should be noted that, although the calculation of PM based on 5 min intervals enhanced the difference between these three dust events, no statistical difference (based on an analysis of variance, ANOVA, test) was observed between 5 and 10 min (Fig. S3).
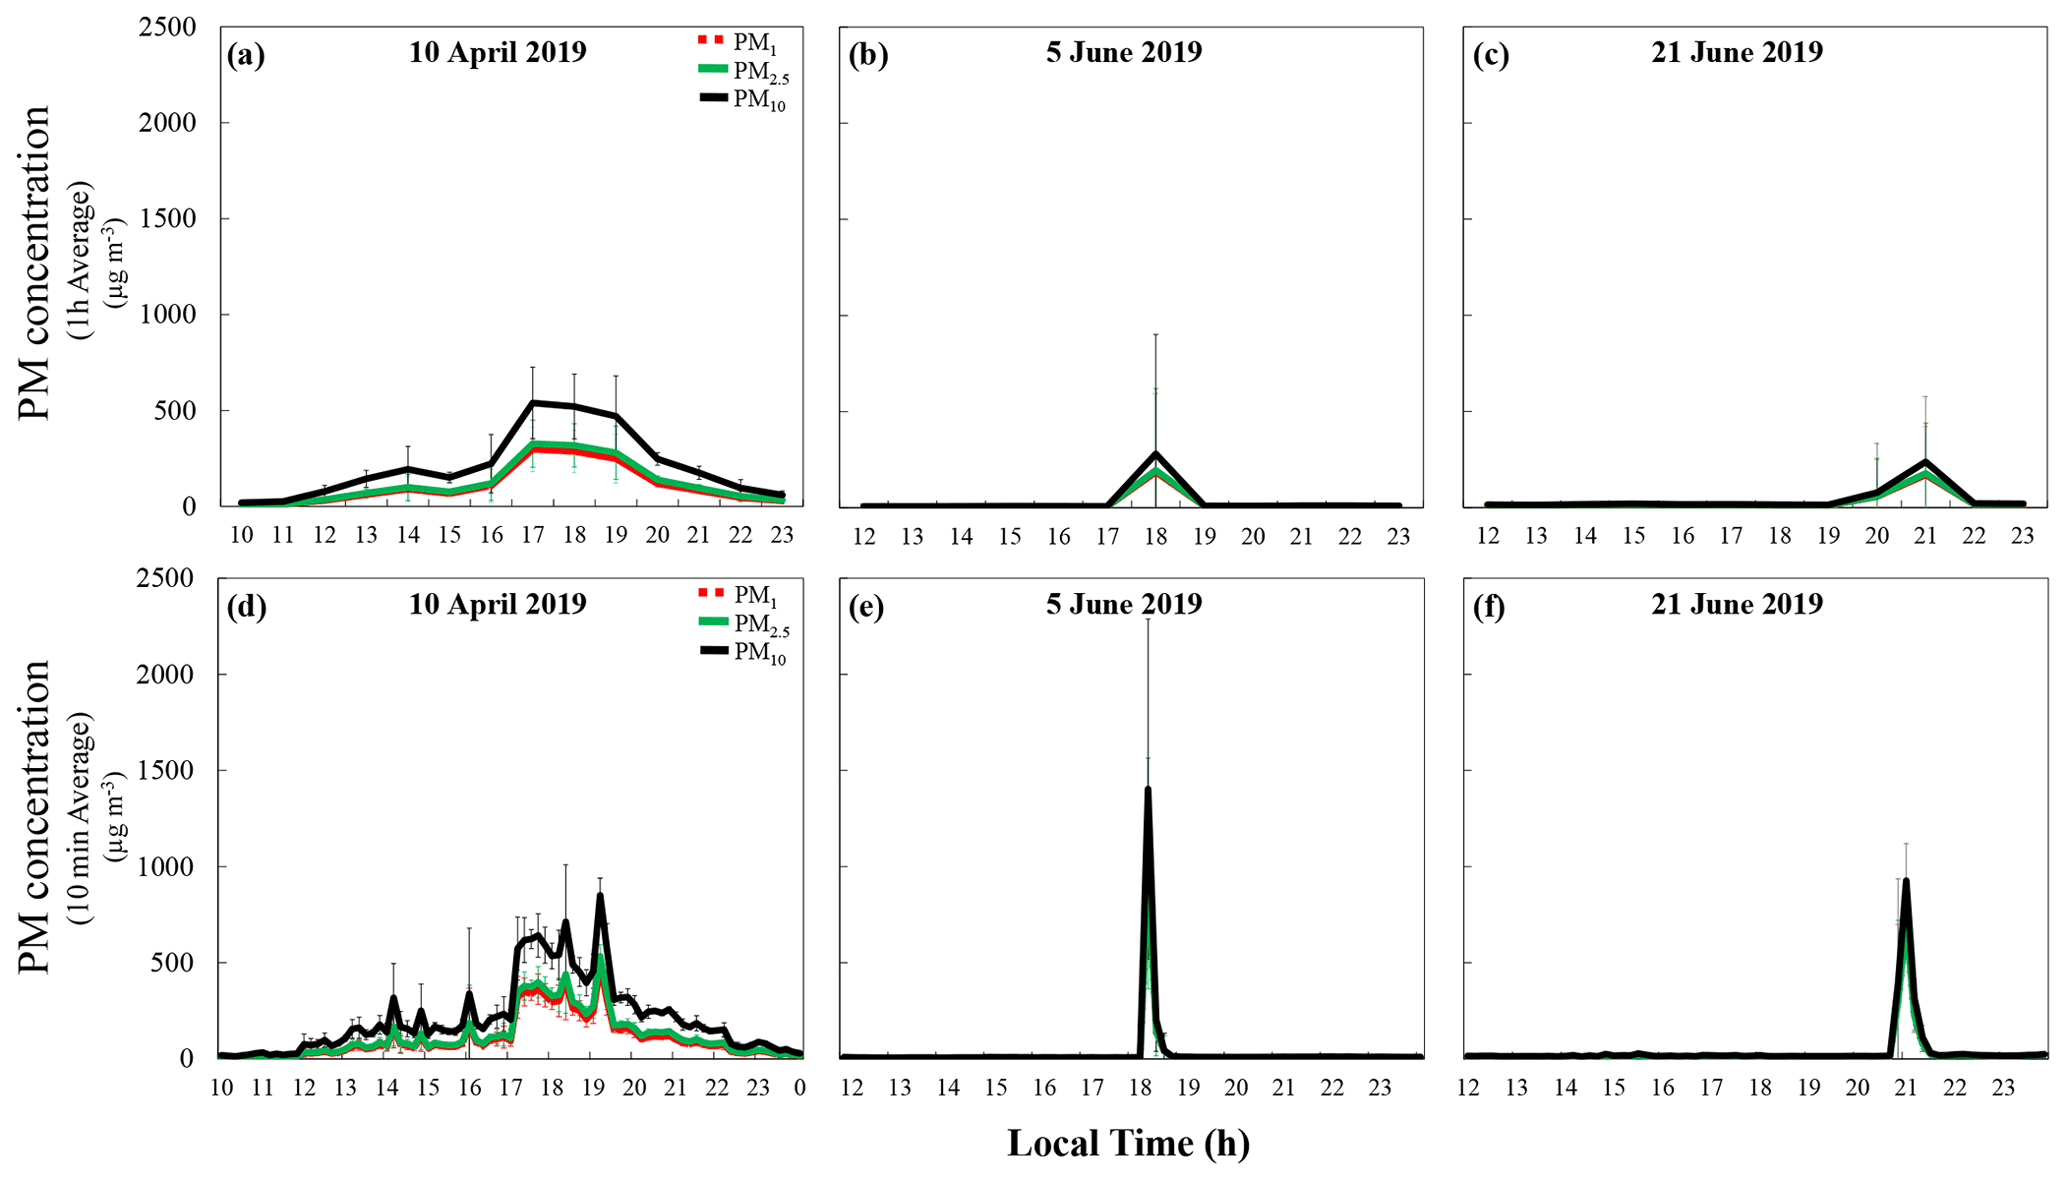
Figure 3Changes in PM concentration (PM1 in red, PM2.5 in green, and PM10 in black) measured by DustTrak during the three dust events, 10 April (a, d), 5 June (b, e), and 21 June (c, f), showing the 1 h (a–c) and 10 min (d–f) averages.
It is interesting to note that, as the synoptic dust event had much higher wind speeds, it was expected that the synoptic event would generate more particles and have higher PM concentrations than those during the convective events. It was also expected that the rate of increase of the PM concentrations from the background level (before the dust) could reflect that change. Calculations were made to evaluate how much PM values increased during each of these events. Comparison of the change in the PM2.5 and PM10 concentrations, from before the dust event to the highest value measured during the dust event (based on the 10 min average), was performed. We expected that the synoptic dust event would have the highest increase; however, to our surprise, the increase in PM2.5 and PM10 on 10 April was 533 and 848 µg m−3, respectively, which was lower compared with values calculated for the 2 convective days. The respective increases in PM2.5 and PM10 were 958 and 1397 µg m−3 on 5 June and 701 and 915 µg m−3 on 21 June.
All three dust events had an increase in the PM values in all three of the PM sizes examined (PM1, PM2.5, and PM10). The hourly and daily PM2.5 values were in the same range as those measured in this region during previous dust events (Kelley et al., 2020; Kelley and Ardon-Dryer, 2021). As for PM10, the hourly values measured during each of the three dust events were in the same range as those measured during dust events in El Paso, Texas (Novlan et al., 2007), and Phoenix, Arizona (Hyde et al., 2018). While an increase in PM2.5 and PM10 was expected, the increase in the PM1 values was interesting, as the increase was observed in each of the different dust events observed in this study. While a few studies have measured PM1 concentrations during dust events, some of them did not observe an increase in PM1 during dust events (Jaafari et al., 2018; Claiborn et al., 2000), whereas others measured an increase in PM1 concentrations (Alghamdi et al., 2015), although not as strong as those presented in this work.
Most of the studies that have examined human exposure thresholds are based on annual or daily values (e.g., WHO and EPA thresholds), but there are no guidelines or accepted thresholds for short-term (15 min to 1 h) exposure (Griffiths et al., 2018). The need for the development of short-term PM exposure guidance has become more crucial due to the increase in periods with short-term high PM concentrations (Deary and Griffiths, 2021). Many studies use short-term observation (mainly based on 1 h timescales) as a key to understanding the impact of episodic air pollution events with respect to the PM exposure, but the majority of studies have focused on wildfires and anthropogenic pollution (Griffiths et al., 2018; Brilli et al., 2021; Deary and Griffiths, 2021). The idea of a short-term threshold is that an hourly sampling interval can be used to characterize short-term exposure to critical PM concentrations and to provide information on the number of critical episodes as well as their persistence (Brilli et al., 2021), which could be critical for convective dust events.
Observation of PM during dust events is normally reported on an hourly basis (Hahnenberger and Nicoll, 2012; Krasnov et al., 2014; Hyde et al., 2018). Fewer studies have measured changes in particles during dust events using high temporal (5 or 10 min) intervals. One of these studies is Bouet et al. (2019), who presented similar findings to those shown in this work. In their study, they compared 2 dusty days that had similar daily PM10 values; however, when observations were made based on a shorter timescale (5 min), one of the dust events had very high PM10 values, which were about 2 orders of magnitude higher than the daily average values. Although no information about the type of dust event was provided, the fast and sharp increase and decrease in PM concentrations and wind speed suggest that the examined dust event was convective. The observation from Bouet et al. (2019) and those presented in this work validate the assumptions made by Kelley and Ardon-Dryer (2021) that hourly values mask the actual PM concentrations of short-duration convective dust events. It seems that observations based on a daily, or even hourly, basis underestimate the impact of short-duration dust events and will not reflect the true impact that these might have on atmospheric particles and air quality. It is important to examine the impact of short-term events, as it has been suggested that short-term exposure to high PM concentrations could cause various health issues (e.g., cardiovascular disease Martinelli et al., 2013). Several studies have also found a correlation between short-term exposure to coarse PM and various health issues (Brunekreef and Forsberg, 2005; Host et al., 2008; Pérez et al., 2008; Graff et al., 2009; Linares et al., 2010; Malig and Ostro, 2009; Tobias et al., 2019). In extreme cases, people and animals caught in severe dust events have even lost their lives due to suffocation (Idso et al., 1976; Middleton, 2017), The fact that some dust events are short-term raises questions regarding their impact on air quality and human health. As suggested in Bouet et al. (2019), the health consequences of such intense but relatively short exposure require the spatial definition of air quality standards that account for the intermittency of dust emission, and this should be encouraged in regions where such phenomena strongly control the air quality.
3.3 Comparison of particle size distribution and total concentration
Based on the differences in PM concentrations, there were questions regarding the particle size distributions of these dust events – for example, would they have more large or small (e.g., inhalable) particles? A comparison of the size distribution for the size range between 0.3 and 10 µm was performed using the OPS, which was operated during all three dust events. As the Grimm 11-D instrument did not operate during the 10 April dust event, it could not be used for this comparison; however, it should be noted that the OPS and Grimm 11-D instruments measured similar concentrations and size distributions during the 2 convective days when a similar particle size range (0.3–10 µm) was used (Fig. S4).
To evaluate how the particle size distribution changes on each of these 3 days, different calculations were made. The first calculation represents the entire day (daily average), and the second calculation is the 10 min average of the time before the dust and during the peak of the dust event (represented by the time of the highest PM concentrations: 19:10 CST for 10 April, 18:10 CST for 5 June, and 21:00 CST for 21 June). All particle size distributions during the peak of the three dust events had much higher particle concentrations compared with times before the dust event or the daily average (Fig. 4). For particles larger than 1 µm, the difference in concentration was ∼ 2 orders of magnitude. For the 10 April dust event, a high particle concentration was observed for all particle sizes (Fig. 4a), whereas the differences were high only for particles > 0.6 µm for the two convective dust events (Fig. 4b, c). As discussed earlier, the daily average for the convective days does not represent the true size distribution of these convective dust events; as the convective events lasted only 20 or 30 min, these durations only represent 2 % of the time of the day. The size distributions during the peak of the dust (black line in Fig. 4) were compared among the different dust events (Fig. 4d). This comparison showed that the two convective dust events had very similar size distributions. A difference between these convective dust events was observed for particles in the size range from 0.3 to 0.37 µm: 21 June had a much higher concentrations of small particles compared with those measured on 5 June. The synoptic dust event had much higher particle concentrations in the size range of 0.4–4 µm, but the three dust events had similar concentrations for particles > 4 µm, in the same range.

Figure 4Changes in the particle size distribution based on optical particle diameter, as measured by OPS, during the three dust events: 10 April (a), 5 June (b), and 21 June (c). The colored lines show the peak of the dust (10 min average for time with the highest concentration – black), a time before the dust reached the station (10 min average – light blue), and the daily average (gray). Panel (d) shows a comparison of the three size distributions at the peak of the dust (10 min average for the time with the highest concentration). Panel (e) shows a comparison of the 10 min average size distribution from 5 June (dark brown) and 21 June (red), as measured with the Grimm 11-D instrument, at the peak of the dust event (straight line) and right before the dust event (dashed line). Panel (f) presents the total particle number concentration (0.3–10 µm) from OPS for each of the dust events for 10 April (light brown), 5 June (dark brown), and 21 June (red).
Generally, dust events are characterized by high concentrations of coarse particles (> 2.5µm) (Clements et al., 2013). However, these three dust events show that dust events in this region can also contain small particles (< 2 µm). Particle concentrations of these sizes were an order of magnitude higher than those measured before the dust event. These findings are similar to those measured during dust storms in Israel (Ardon-Dryer and Levin, 2014). Coarse particles also increased in each of these dust events. The increase in the particle concentrations during the dust peak compared with the time before the dust (for particle size 5–10 µm, based on OPS) was found to be 30 to 300 times higher during the peak of the dust, and all three dust events had similar particle concentrations in that size range (Fig. 4d). An examination of the size distribution of coarse particles during the two convective events was then performed using the Grimm 11-D instrument, which tracks particles up to 35.15 µm (Fig. 4e). It should be noted that the unit was not operational during the synoptic dust event. Observation of the particle size distribution of particles larger than 10 µm (Fig. 4e) shows that some of the coarse particle size concentrations increased by more than 2 orders of magnitude compared with the time before the dust event. In addition, an increase in the particle concentration was observed for both convective dust events in the larger size bin (35.15 µm). The size of dust particles during dust events is vital for our understanding of how far these dust particles can travel from the source as well as our understanding of their health implications. This is especially relevant because the size distributions of dust particles during dust events are not well understood (Mahowald et al., 2014).
All three dust events seem to have a multimodal distribution, with the first mode at the lowest size measured (0.3 µm), the second at 1 µm, and the third at 1.94 µm. Gillette et al. (1974), who examine the size distribution of particles (in the 1–20 µm range) collected from Amarillo Texas (∼ 170 km north of AEROS) using a wind tunnel, found a mode at 1 µm. Dust in Morocco also had a multimodal distribution, although at different sizes (Kandler et al., 2009). Dust in Lebanon had a single mode at much smaller particle sizes (∼ 0.28 µm) compared with those found in this work (Jaafar et al., 2014). Analysis of dry deposition dust at different locations around the world found the mode to be at much larger particle sizes than those measured in this work (Reynolds et al., 2020; Katra and Krasnov, 2020), but the collection and analysis methods most likely contributed to these differences. The size distribution from these three dust events (Fig. 4d) was also in a similar range to those measured in the Sahara (D'Almeida and Schütz, 1983) but much lower than those measured during dust events in Asia (Chun et al., 2001) or Africa (Pio et al., 2014). The synoptic dust event (at its peak) had a size distribution in a similar range to those measured by Kandler et al. (2009) in Morocco, at least for a particle size < 2 µm. However, all three dust events had slightly higher concentrations for particles larger than 2 µm. The size distribution of the three dust events was similar to measurements during dust events in Israel, at least for particles up to 1 µm (Reicher et al., 2019). The higher concentration of larger particles in this study compared with those in Reicher et al. (2019) could be attributed to the fact that measurements from this work were taken close to the source, whereas dust collection in Israel was carried out after the dust particles had undergone long-distance transport to reach the measurement site. Daily values from the synoptic event were in a similar range to the size distribution measured in Israel during dust days (Ardon-Dryer and Levin, 2014). Both daily distributions of the convective days had similar concentrations to clean days measured in Ardon-Dryer and Levin (2014), at least for size ranges from 0.2 to 0.6 µm. For particles > 0.6 µm, the daily distribution of the convective days had higher particle concentrations.
Using the OPS total number concentration values, a comparison between the dust events was performed for particles in the size range from 0.3 to 10 µm. The total number concentration value measured at the highest PM concentrations was 156 cm−3 on 10 April (19:10 CST), 82 cm−3 on 5 June (18:10 CST), and 93 cm−3 on 21 June (21:00 CST) (Fig. 4f). The total number concentration values behaved in a similar fashion to the changes in PM, but the 10 April event had a much higher total number concentration than the convective events in this comparison. It should be noted that the calculation of the total number concentration based on a 5 or 10 min average did not show any significance between the two (data not shown). The total particle number concentrations during these dust events were much higher than those measured during dust events at Storm Peak Laboratory in Colorado (Hallar et al., 2011), but this could be attributed to the proximity to the source in this region. The total particle number concentrations during these dust events were much lower than those measured during biomass burning events (Reid et al., 2005; Ordou and Agranovski, 2019), and the emitted particles' sizes are the main cause of this difference.
Comparison of the total number concentration for the coarse particle size, as measured by Grimm 11-D, was also performed for the two convective dust events. During the June 5 dust event (based on a 10 min average at the peak of the dust), the total number concentration for particles from 5 to 35.15 µm was 4.6±2.9 cm−1, while the total number concentration was 1.3±0.9 cm−1 for particles in the size range from 10 to 35.15 µm. The increase in the total number concentration was more than 350 and 675 times higher than the total number concentration right before the dust reached the station for particles > 5 and > 10 µm, respectively. The total number concentration during the June 21 convective dust event (based on a 10 min average at the peak of the dust) was slightly lower than those measured on 5 June: 2.3±0.7 and 0.5±0.3 cm−1 for particles in the range from 5 to 35.15 and from 10 to 35.15 µm, respectively. The increase in the total number concentration was more than 141 and 318 times higher than the total number concentration right before the dust reached the station for particles > 5 and > 10 µm, respectively.
This study provides measurements of the particle size distribution and total number concentration of particles > 5 µm during three different dust events (of different types) and of particles > 10 µm for two convective events, showing that the concentration of these coarse particles may increase by more than 2 orders of magnitude during dust events. These findings are in line with recent studies that found coarse particles during dust events near the source (Ryder et al., 2019; O'Sullivan et al., 2020) and even thousands of kilometers from the source (Weinzierl et al., 2017; van der Does et al., 2018). Moreover, it has recently been stated that the atmosphere contains 4 times more coarse dust particles than what is currently simulated in climate models, which results in a substantial underestimation of the impact that coarse dust particles may have on the Earth system (Adebiyi and Kok, 2020). Therefore, Mahowald et al. (2014) suggested that models should improve their ability to capture the evolution of the dust size distribution and that this improvement should be based on additional cross-comparison of differing observational methods. Such effort has taken place in recent years, although many of these studies indicate that models still cannot capture some of the super coarse particles due to their deposition process, which is still unclear (Drakaki et al., 2022; Meng et al., 2022). In addition, some of the differences between measurements and models might be impacted by the proximity of the measurement location to the dust source (measurements closer to the source contain more coarse particles) as well as to the meteorological conditions that generated the dust event.
While the measurements from these three dust events provide an insight into the changes in PM concentration, size distribution, and total particle number concentrations of dust events in the Southern High Plains of West Texas, additional measurements during dust events in this region and across the world are needed to help improve our understanding of how dust events impact particle concentrations and sizes, which might cause a different impact on air quality and human health. In addition, more measurements during different types of dust events (synoptic vs. convective) will improve our understanding of their implications.
Three dust events were captured by AEROS during April and June 2019. One of the dust events was a synoptic disturbance (10 April 2019), whereas the other two were convective disturbances (5 and 21 June 2019). Measurements of the particle mass and number concentration, size distribution, and meteorological conditions for each dust event were performed and compared. The synoptic dust event (10 April) was longer (12 h) and had stronger wind speed conditions (up to 22.1 m s−1), whereas the two convective dust events lasted less than 30 min and had lower wind speeds (up to 16.5 and 13.4 m s−1 for 5 and 21 June, respectively). Observation of PM based on daily and hourly values seems to underestimate the impact of the convective dust events. Observations based on 10 min intervals reveal the true impact of the two convective dust events, with PM concentrations even higher than the synoptic dust event. A comparison of the particle size distribution showed that all three dust events had an increase in particle concentration in all sizes measured (0.3–10 µm). Some of the particle sizes had an increase in the particle concentration of more than ∼ 2 orders of magnitude during the dust event compared with before it. All three dust events had similar particle concentrations for particle sizes > 5 µm. Further research is needed to determine the effects of additional short and intense dust events on the particle concentration and sizes as well as the impact that these events may have on air quality and human health.
The MATLAB codes can be obtained from the authors upon request.
All measurements are available from the authors upon request.
The supplement related to this article is available online at: https://doi.org/10.5194/acp-22-9161-2022-supplement.
KAD designed the experiments, supervised the entire process, performed most of the analysis, and wrote the manuscript. MK maintained and managed AEROS during the sampling period. Both authors were actively involved in interpreting the results and in discussions on the manuscript.
The contact author has declared that none of the authors has any competing interests.
Publisher's note: Copernicus Publications remains neutral with regard to jurisdictional claims in published maps and institutional affiliations.
This article is part of the special issue “Dust aerosol measurements, modeling and multidisciplinary effects (AMT/ACP inter-journal SI)”. It is not associated with a conference.
This research did not receive any specific grant from funding agencies in the public, commercial, or not-for-profit sectors. The authors would like to thank Texas Tech University for the support of Mary Kelley's scholarship and Yuval Dryer for his help with the MATLAB codes.
This paper was edited by Stelios Kazadzis and reviewed by two anonymous referees.
Abdullaev, S. F. and Sokolik, I.: Assessment of the Influences of Dust Storms on Cotton Production in Tajikistan, in: Landscape Dynamics of Drylands across Greater Central Asia: People, Societies and Ecosystems, edited by: Gutman, G., Chen, J., Henebry, G., and Kappas, M., Landscape Series, Springer, Cham, 17, https://doi.org/10.1007/978-3-030-30742-4_6, 2020.
Achakulwisut, P., Mickley L., and Anenberg S.: Drought-sensitivity of fine dust in the US Southwest: implications for air quality and public health under future climate change, Environ. Res. Lett., 13, 054025, https://doi.org/10.1088/1748-9326/aabf20, 2018.
Adebiyi, A. A. and Kok, J. F.: Climate models miss most of the coarse dust in the atmosphere, Sci. Adv., 6, 15, https://doi.org/10.1126/sciadv.aaz9507, 2020.
Aghababaeian, H., Ostadtaghizadeh, A., Ardalan, A., Asgary, A., Akbary, M., Yekaninejad, M. S., and Stephens, C.: Global Health Impacts of Dust Storms: A Systematic Review, Environ. Health Insights, 15, 1–28, https://doi.org/10.1177/11786302211018390, 2021.
Alghamdi, M. A., Almazroui, M., Shamy, M., Redal, M. A., Alkhalaf, A. K., Hussein, M. A., and Khoder, M. I.: Characterization and elemental composition of atmospheric aerosol loads during springtime dust storm in western Saudi Arabia, Aerosol Air Qual. Res., 15, 440–453, https://doi.org/10.4209/aaqr.2014.06.0110, 2015.
Al-Hemoud, A., Al-Dousari, A., Misak, R., Al-Sudairawi, M., Naseeb, A., Al-Dashti, H., and Al-Dousari, N.: Economic impact and risk assessment of sand and dust storms (SDS) on the Oil and gas Industry in Kuwait, Sustainability, 11, 200, https://doi. org/10.3390/su11010200, 2019.
Ardon-Dryer, K. and Levin, Z.: Ground-based measurements of immersion freezing in the eastern Mediterranean, Atmos. Chem. Phys., 14, 5217–5231, https://doi.org/10.5194/acp-14-5217-2014, 2014.
Ardon-Dryer, K., Mock, C., Reyes, J., and Lahav, G.: The effect of dust storm particles on single human lung cancer cells, Environ. Res., 181, 108891, https://doi.org/10.1016/j.envres.2019.108891, 2020.
Ardon-Dryer, K., Chmielewski, V., Burning E., and Xueting X.: Changes of Electric Field, Aerosol, and Wind Covariance in Different Blowing Dust Days in West Texas, Aeolian Res., 54, 100762, https://doi.org/10.1016/j.aeolia.2021.100762, 2021.
Ardon-Dryer, K., Kelley, M. C., Xueting, X., and Dryer, Y.: The Aerosol Research Observation Station (AEROS), Atmos. Meas. Tech., 15, 2345–2360, https://doi.org/10.5194/amt-15-2345-2022, 2022.
Bhattachan, A., Okin, G. S., Zhang, J., Vimal, S., and Lettenmaier, D. P.: Characterizing the role of wind and dust in traffic accidents in California, GeoHealth 3, 328–336, https://doi.org/10.1029/2019GH000212, 2019.
Bogan, M., Al, B., Kul, S., Zengin, S., Oktay, M., Sabak, M., Gumusboga, H., and Bayram, H.: The effects of desert dust storms, air pollution, and temperature on morbidity due to spontaneous abortions and toxemia of pregnancy: 5-year analysis, Int. J. Biometeorol., 65, 1733–1739, https://doi.org/10.1007/s00484-021-02127-8, 2021.
Bouet, C., Labiadh, M. T., Rajot, J. L., Bergametti, G., Marticorena, B., Henry des Tureaux, T., Ltifi, M., Sekrafi, S., and Féron, A.: Impact of Desert Dust on Air Quality: What is the Meaningfulness of Daily PM Standards in Regions Close to the Sources? The Example of Southern Tunisia, Atmosphere, 10, 452, https://doi.org/10.3390/atmos10080452, 2019.
Brey, S. J., Pierce, J. R., Barnes, E. A., and Fischer, E. V.: Estimating the Spread in Future Fine Dust Concentrations in the Southwest United States, J. Geophys. Res., 125, e2019JD031735, https://doi.org/10.1029/2019JD031735, 2020.
Brilli, L., Carotenuto, F., Andreini, B. P., Cavaliere, A., Esposito, A., Gioli, B., Martelli, F., Stefanelli, M., Vagnoli, C., Venturi, S., Zaldei, A., and Gualtieri, G.: Low-Cost Air Quality Stations' Capability to Integrate Reference Stations in Particulate Matter Dynamics Assessment, Atmosphere, 12, 1065, https://doi.org/10.3390/atmos12081065,2021
Brunekreef, B. and Forsberg, B.: Epidemiological evidence of effects of coarse airborne particles on health, Eur. Respir. J., 26, 309–318, https://doi.org/10.1183/09031936.05.00001805, 2005.
Chen, Q., Yin, Y., Jiang, H., Chu, Z., Xue, L., Shi, R., Zhang, X., and Chen, J.: The roles of mineral dust as cloud condensation nuclei and ice nuclei during the evolution of a hailstorm, J. Geophys. Res.-Atmos., 124, 14262–14284, https://doi.org/10.1029/2019JD031403, 2019.
Chun, Y., Boo, K.-O., Kim, J., Park, S.-U., and Lee, M.: Synopsis, transport, and physical characteristics of Asian dust in Korea, J. Geophys. Res.-Atmos., 106, 18461–18469, https://doi.org/10.1029/2001JD900184, 2001.
Claiborn, C. S., Finn, D., Larson, T. V., and Koenig, J. Q.: Windblown dust contributes to high PM2.5 concentrations, J. Air Waste Manage., 50, 1440–1445, https://doi.org/10.1080/10473289.2000.10464179, 2000.
Clements, A. L., Fraser, M. P., Upadhyay, N., Herckes, P., Sundblom, M., Lantz, J., and Solomon, P.A.: Characterization of summertime coarse particulate matter in the Desert Southwest – Arizona, USA, J. Air Waste Manage., 63, 764–772, https://doi.org/10.1080/10962247.2013.787955, 2013.
Crooks, J. L., Cascio, W. E., Percy, M. S., Reyes, J., Neas, L. M., and Hilborn, E. D.: The association between dust storms and daily non-accidental mortality in the United States, 1993–2005, Environ. Health Persp., 124, 1735–1743, https://doi.org/10.1289/ehp216, 2016.
D'Almeida, G. A. and Schütz, L.: Number, Mass and Volume Distributions of Mineral Aerosol and Soils of the Sahara, J. Clim. Appl. Meteorol., 22, 233–243, https://doi.org/10.1175/1520-0450(1983)022<0233:NMAVDO>2.0.CO;2, 1983.
Dastoorpoor, M., Idani, E., Goudarzi, G., and Khanjani, N.: Acute effects of air pollution on spontaneous abortion, premature delivery, and stillbirth in Ahvaz, Iran: a time-series study, Environ. Sci. Pollut. R., 25, 5447–5458, https://doi.org/10.1007/ s11356-017-0692-9, 2018.
Deary, M. and Griffiths, S.: A novel approach to the development of 1-hour threshold concentrations for exposure to particulate matter during episodic air pollution events, J. Hazard. Mater., 418, 126334, https://doi.org/10.1016/j.jhazmat.2021.126334, 2021.
Diokhane, A. M., Jenkins, N., Manga, M. S., Drame, and Mbodji, B.: Linkages between observed, modeled Saharan dust loading and meningitis in Senegal during 2012 and 2013, Int. J. Biometeorol., 60, 557–575, https://doi.org/10.1007/s00484-015-1051-5, 2016.
Drakaki, E., Amiridis, V., Tsekeri, A., Gkikas, A., Proestakis, E., Mallios, S., Solomos, S., Spyrou, C., Marinou, E., Ryder, C., Bouris, D., and Katsafados, P.: Modelling coarse and giant desert dust particles, Atmos. Chem. Phys. Discuss. [preprint], https://doi.org/10.5194/acp-2022-94, in review, 2022.
EPA (United States Environmental Protection Agency): NAAQS table, https://www.epa.gov/criteria-air-pollutants/naaqs-table (last access: 11 September 2021), 2016.
Gillette, D. A., Blifford Jr., I. H., and Fryrear, D. W.: The influence of wind velocity on the size distributions of aerosols generated by the wind erosion of soils, J. Geophys. Res., 79, 4068–4075, https://doi.org/10.1029/JC079i027p04068, 1974.
Goudie, A. S. and Middleton, N. J.: Desert Dust in the Global System, Springer Verlag, Heidelberg, https://doi.org/10.1007/3-540-32355-4, 2006.
Goudie, A. S.: Desert Dust and Human Health Disorders, Environ. Int., 63, 101–13, https://doi.org/10.1016/j.envint.2013.10.011, 2014.
Graff, D. W., Cascio, W. E., Rappold, A., Zhou, H., Huang, Y. C., and Devlin, R. B.: Exposure to concentrated coarse air pollution particles causes mild cardiopulmonary effects in healthy young adults, Environ Health Persp., 117, 1089–1094, https://doi.org/10.1289/ehp0900558, 2009.
Griffiths, S. D., Chappell, P., Entwistle, J. A., Kelly, F. J., and Deary, M. E.: A study of particulate emissions during 23 major industrial fires: Implications for human health, Environ. Int., 112, 310–323, https://doi.org/10.1016/j.envint.2017.12.018, 2018.
Grimm 11-D: MODEL 11D the dust decoder, https://www.grimm-aerosol.com/products-en/dust-monitors/the-dust-decoder/11-d/, last access: 5 August 2021.
Hahnenberger, M. and Nicoll, K.: Meteorological Characteristics of Dust Storm Events in the Eastern Great Basin of Utah, U.S.A., Atmos. Environ., 60, 601–612, https://doi.org/10.1016/j.atmosenv.2012. 06.029, 2012.
Hallar, A. G., Chirokova, G., McCubbin, I., Painter, T. H., Wiedinmyer, C., and Dodson, C.: Atmospheric bioaerosols transported via dust storms in the western United States, Geophys. Res. Lett., 38, L17801, https://doi.org/10.1029/2011GL048166, 2011.
Hand, J. L., White, W. H., Gebhart, K. A., Hyslop, N. P., Gill, T. E., and Schichtel, B. A.: Earlier onset of the spring fine dust season in the southwestern United States, Geophys. Res. Lett., 43, 4001–4009, https://doi.org/10.1002/2016GL068519, 2016.
Herrera-Molina, E., Gill, T. E., Ibarra-Mejia, G., and Jeon, S.: Associations between Dust Exposure and Hospitalizations in El Paso, Texas, USA, Atmosphere, 12, 1413, https://doi.org/10.3390/atmos12111413, 2021.
Host, S., Larrieu, S., Pascal, Blanchard, L., Declercq, M., Fabre, C., Jusot, P., Chardon, J. F., Le Tertre, B., Wagner, A., Prouvost, V., and Lefranc, H.: Short-term associations between fine and coarse particles and hospital admissions for cardiorespiratory diseases in six French cities, Occup. Environ. Med., 65, 544–551, https://doi.org/10.1136/oem.2007.036194, 2008.
Hyde, P., Mahalov, A., and Li, J.: Simulating the meteorology and PM10 concentrations in Arizona dust storms using the Weather Research and Forecasting model with Chemistry (Wrf-Chem), J. Air Waste Manage., 68, 177–195, https://doi.org/10.1080/10962247.2017.1357662, 2018.
Idso, S. B.: Dust Storms, Sci. Am., 235, 108–115, 1976.
Jaafar, M., Baalbaki, R., Mrad, R., Daher, N., Shihadeh, A., Sioutas, C., and Saliba, N. A.: Dust episodes in Beirut and their effect on the chemical composition of coarse and fine particulate matter, Sci. Total Environ., 496, 75–83, 2014.
Jaafari, J., Naddafi, K., Yunesian, M., Nabizadeh, R., Hassanvand, M. S., Ghozikali, M. G., Nazmara, S., Shamsollahi, H. R., and Yaghmaeian, K.: Study of PM10, PM2.5, and PM1 levels in during dust storms and local air pollution events in urban and rural sites in Tehran, Hum. Ecol. Risk Assess., 24, 482–493, https://doi.org/10.1080/10807039.2017.1389608, 2018.
Jones, B. A.: After the Dust Settles: The Infant Health Impacts of Dust Storms, J. Assoc. Environ. Resour. Econ., 7, 6, https://doi.org/10.1086/710242, 2020.
Kandler, K., Schutz, L., Deutscher, C., Ebert, M., Hofmann, H., Jackel, S., Jaenicke, R., Knippertz, P., Lieke, K., Massling, A., Petzold, A., Schladitz, A., Weinzierl, B., Wiedensohler, A., Zorn, S., and Weinbruch, S.: Size distribution, mass concentration, chemical and mineralogical composition and derived optical parameters of the boundary layer aerosol at Tinfou, Morocco, during SAMUM 2006, Tellus B, 61, 32–50, https://doi.org/10.1111/j.1600-0889.2008.00385.x, 2009.
Karanasiou, A., Moreno, N., Moreno, T., Viana, M., de Leeuw, F., and Querol, X.: Health effects from Sahara dust episodes in Europe: literature review and research gaps, Environ. Int., 47, 107–114, https://doi.org/10.1016/j.envint.2012.06.012, 2012.
Katra, I. and Krasnov, H.: Exposure Assessment of Indoor PM Levels During Extreme Dust Episodes, Int. J. Environ. Res., 17, 1625, https://doi.org/10.3390/ijerph17051625, 2020.
Kelley, M. C. and Ardon-Dryer, K.: Analyzing two decades of dust events on the Southern Great Plains region of West Texas, Atmos. Pollut. Res., 12, 101091, https://doi.org/10.1016/j.apr.2021.101091, 2021.
Kelley, M. C., Brown, M. M., Fedler, C. B., and Ardon-Dryer, K.: Long-term Measurements of PM2.5 Concentrations in Lubbock, Texas, Aerosol Air Qual. Res., 20, 1306–1318, https://doi.org/10.4209/aaqr.2019.09.0469, 2020.
Knippertz, P.: Meteorological Aspects of Dust Storms, in: Mineral Dust: A Key Player in the Earth System, edited by: Knippertz, P. and Stuut, J. B., Springer, Dordrecht, 121–147, https://doi.org/10.1007/978-94-017-8978-3_6, 2014.
Krasnov, H., Katra, I., Koutrakis, P., and Michael, D. F.: Contribution of dust storms to PM10 levels in an Urban arid environment, J. Air Waste Manage., 64, 89–94, https://doi.org/10.1080/10962247.2013.841599, 2014.
Krasnov, H., Katra, I., and Friger, M.: Increase in dust storm related PM10 concentrations: A time series analysis of 2001–2015, Environ. Pollut., 213, 36–42, https://doi.org/10.1016/j.envpol.2015.10.021, 2016.
Lau, W. K. M., Kyu-Myong, K., Chun, Z., Ruby, L. L. and Sang-Hun, P.: Impact of Dust-Cloud-Radiation-Precipitation Dynamical Feedback on Subseasonal-to-Seasonal Variability of the Asian Summer Monsoon in Global Variable-Resolution Simulations With MPAS-CAM5, Front. Earth Sci., 8, 226, https://doi.org/10.3389/feart.2020.00226, 2020.
Linares, C., Tobías, A., and Díaz, J.: Is there new scientific evidence to justify reconsideration of the current WHO guidelines for particulate matter during dust intrusions?, Sci. Total Environ., 408, 2283–22834, https://doi.org/10.1016/j.scitotenv.2010.02.005, 2010.
Mahowald, N., Albani, S., Kok, J. F., Engelstaeder, S., Scanza, R., Ward, D. S., and Flanner, M. G.: The size distribution of desert dust aerosols and its impact on the Earth system, Aeolian Res., 15, 53–71, https://doi.org/10.1016/j.aeolia.2013.09.002, 2014.
Malig, B. J. and Ostro, B. D.: Coarse particles and mortality: evidence from a multi-city study in California, J. Occup. Environ. Med., 66, 832–839, https://doi.org/10.1136/oem.2008.045393, 2009.
Martinelli, F., Reagan, R. L., Uratsu, S. L., Phu, M. L., Albrecht, U., Zhao, W., Davis, C. E., Bowman, K. D., and Dandekar, A. M.: Gene Regulatory Networks Elucidating Huanglongbing Disease Mechanisms, PLoS ONE, 8, e74256, https://doi.org/10.1371/journal.pone.0074256, 2013.
Meng, J., Huang, Y., Leung, D. M., Li, L., Adebiyi, A. A., Ryder, C. L., Mahowald, N. M., and Kok, J. F.: Improved Parameterization for the Size Distribution of Emitted Dust Aerosols Reduces Model Underestimation of Super Coarse Dust, Geophys. Res. Lett., 49, e2021GL097287, https://doi.org/10.1029/2021GL097287, 2022.
Middleton, M. J.: Desert dust hazards: A global review, Aeolian Res., 24, 53–63, https://doi.org/10.1016/j.aeolia.2016.12.001, 2017.
Middleton, N.: Health in dust belt cities and beyond – an essay by Nick Middleton, BMJ, 371, m3089, https://doi.org/10.1136/bmj.m3089, 2020.
Miller, R. L. and Perlwitz, T. J.: Surface radiative forcing by soil dust aerosols and the hydrologic cycle, J. Geophys. Res.-Atmos., 109, D04203, https://doi.org/10.1029/2003JD004085, 2004.
Novlan, D. J., Hardiman, M., and Gill, T. E.: A synoptic climatology of blowing dust events in El Paso, Texas from 1932–2005, National Weather Service, https://www.weather.gov/media/epz/research/elp07-2.pdf (last access: 14 July 2022), 2007.
Ordou, N. and Agranovski, I. E.: Contribution of Fine Particles to Air Emission at Different Phases of Biomass Burning, Atmosphere, 10, 278, https://doi.org/10.3390/atmos10050278, 2019.
O'Sullivan, D., Marenco, F., Ryder, C. L., Pradhan, Y., Kipling, Z., Johnson, B., Benedetti, A., Brooks, M., McGill, M., Yorks, J., and Selmer, P.: Models transport Saharan dust too low in the atmosphere: a comparison of the MetUM and CAMS forecasts with observations, Atmos. Chem. Phys., 20, 12955–12982, https://doi.org/10.5194/acp-20-12955-2020, 2020.
Pérez, L., Tobias, A., Querol, X., Kunzli, N., Pey, J., Alastuey, A., Viana, M., Valero, N., Gonzalez-Cabre, M., and Sunyer, J.: Coarse particles from Saharan dust and daily mortality, Epidemiology, 19, 800–807, https://doi.org/10.1097/ede.0b013e31818131cf, 2008.
Pio, C. A., Cardoso, J. G., Cerqueira, M. A., Calvo, A., Nunes, T. V., Alves, C. A., Custódio, D., Almeida, S. M., and Almeida-Silva, M.: Seasonal variability of aerosol concentration and size distribution in Cape Verde using a continuous aerosol optical spectrometer, Front. Environ. Sci., 2, 1–15, https://doi.org/10.3389/fenvs.2014.00015, 2014.
Pu, B. and Ginoux, P.: Projection of American dustiness in the late 21st century due to climate change, Sci. Rep.-UK, 7, 5553, https://doi.org/10.1038/s41598-017-05431-9, 2017.
Reicher, N., Budke, C., Eickhoff, L., Raveh-Rubin, S., Kaplan-Ashiri, I., Koop, T., and Rudich, Y.: Size-dependent ice nucleation by airborne particles during dust events in the eastern Mediterranean, Atmos. Chem. Phys., 19, 11143–11158, https://doi.org/10.5194/acp-19-11143-2019, 2019.
Reid, J. S., Koppmann, R., Eck, T. F., and Eleuterio, D. P.: A review of biomass burning emissions part II: intensive physical properties of biomass burning particles, Atmos. Chem. Phys., 5, 799–825, https://doi.org/10.5194/acp-5-799-2005, 2005.
Reynolds, R. L., Goldstein, H. L., Moskowitz, B. M., Kokaly, R. F., Munson, S. M., Solheid, P., Breit, G. N., Lawrence, C. R., and Derry, J.: Dust deposited on snow cover in the San Juan Mountains, Colorado, 2011–2016: Compositional variability bearing on snow-melt effects, J. Geophys. Res.-Atmos., 125, e2019JD032210, https://doi-org.lib-e2.lib.ttu.edu/10.1029/2019JD032210, 2020.
Rublee, C., Sorensen, C., Lemery, J., Wade, T., Sams, E., Hilborn, E., and Crooks, J.: Associations between dust storms and intensive care unit admissions in the United States, 2000–2015, GeoHealth, 4, e2020GH000260, https://doi.org/10.1029/2020GH000260, 2020.
Ryder, C. L., Highwood, E. J., Walser, A., Seibert, P., Philipp, A., and Weinzierl, B.: Coarse and giant particles are ubiquitous in Saharan dust export regions and are radiatively significant over the Sahara, Atmos. Chem. Phys., 19, 15353–15376, https://doi.org/10.5194/acp-19-15353-2019, 2019.
Saraga, D., Maggos, T., Sadoun, E., Fthenou, E., Hassan, H., Tsiouri, V., Karavoltsos, S., Sakellari, A., Vasilakos, C., and Kakosimos, K.: Chemical Characterization of Indoor and Outdoor Particulate Matter (PM2.5, PM10) in Doha, Qatar, Aerosol Air Qual. Res., 17, 1156–1168, https://doi.org/10.4209/aaqr.2016.05.0198, 2017.
Sarkar, S., Chauhan, A., Kumar, R., and Singh, R.P.: Impact of deadly dust storms (May 2018) on air quality, meteorological, and atmospheric parameters over the northern parts of India, GeoHealth, 3, 67–80, https://doi.org/10.1029/2018GH000170, 2019.
Stout, J.: Dust and environment in the Southern High Plains of North America, J. Arid Environ., 47, 425–441, https://doi.org/10.1006/jare.2000.0732, 2001.
Textor, C., Schulz, M., Guibert, S., Kinne, S., Balkanski, Y., Bauer, S., Berntsen, T., Berglen, T., Boucher, O., Chin, M., Dentener, F., Diehl, T., Easter, R., Feichter, H., Fillmore, D., Ghan, S., Ginoux, P., Gong, S., Grini, A., Hendricks, J., Horowitz, L., Huang, P., Isaksen, I., Iversen, I., Kloster, S., Koch, D., Kirkevåg, A., Kristjansson, J. E., Krol, M., Lauer, A., Lamarque, J. F., Liu, X., Montanaro, V., Myhre, G., Penner, J., Pitari, G., Reddy, S., Seland, Ø., Stier, P., Takemura, T., and Tie, X.: Analysis and quantification of the diversities of aerosol life cycles within AeroCom, Atmos. Chem. Phys., 6, 1777–1813, https://doi.org/10.5194/acp-6-1777-2006, 2006.
Tobias, A., Karanasiou, A., Amato, F., Roqué, M., and Querol, X.: Health effects of desert dust and sand storms: a systematic review and metaanalysis protocol, BMJ Open, 9, e029876, https://doi.org/10.1136/bmjopen-2019-029876, 2019.
Tong, D. Q., Wang, J. X. L., Gill, T. E., Lei, H., and Wang, B.: Intensified dust storm activity and Valley fever infection in the southwestern United States, Geophys. Res. Lett., 44, 4304–4312, https://doi.org/10.1002/2017GL073524, 2017.
Toure, N. O., Gueye, A., Mbow-Diokhane, G. S., Jenkins, M., Li, M. S., Drame, K. A., Coker, R., and Thiam, K.: Observed and modeled seasonal air quality and respiratory health in Senegal during 2015 and 2016, Geo Health, 3, 423–442, https://doi.org/10.1029/2019GH000214, 2019.
Tozer, P. and Leys, J.: Dust storms – what do they really cost?, Rangel. J., 35, 131–142, https://doi.org/10.1071/RJ12085, 2013.
Tsai, J. H., Huang, K. L., Lin, N. H., Chen, S. J., Lin, T. C., Chen, S. C., Lin, C. C., Hsu, S. C., and Lin, W. Y.: Influence of an Asian Dust Storm and Southeast Asian Biomass Burning on the Characteristics of Seashore Atmospheric Aerosols in Southern Taiwan, Aerosol Air Qual. Res., 12, 1105–1115, https://doi.org/10.4209/aaqr.2012.07.0201, 2012.
TSI: DUSTTRAK™DRX Aerosol Monitor Model 8533/8534/8533EP, Operation and Service Manual, P/N 6001898 Revision S, https://www.tsi.com/getmedia/3699890e-4adf-452f-9029-f3725612d5d1/8533-8534-DustTrak_DRX-6001898-Manual-US?ext=.pdf, last access: 4 June 2021.
van der Does, M., Knippertz, P., Zschenderlein, P., Giles Harrison, R., and Stuut, J.B.W.: The mysterious long-range transport of giant mineral dust particles, Sci. Adv., 4, eaau2768, https://doi.org/10.1126/sciadv.aau2768, 2018.
Wang, C., Jeong, G. R., and Mahowald, N.: Particulate absorption of solar radiation: anthropogenic aerosols vs. dust, Atmos. Chem. Phys., 9, 3935–3945, https://doi.org/10.5194/acp-9-3935-2009, 2009.
Weinzierl, B., Ansmann, A., Prospero, J.M., Althausen, D., Benker, N., Chouza, F., Dollner, M., Farrell, D., Fomba, W.K., Freudenthaler, V., Gasteiger, J., Groß, S., Haarig, M., Heinold, B., Kandler, K., Kristensen, T.B., Mayol-Bracero, O.L., Müller, T., Reitebuch, O., Sauer, D., Schäfler, A., Schepanski, K., Spanu, A., Tegen, I., Toledano, C., and Walser, A.: The Saharan aerosol long-range transport and aerosol-cloud-interaction experiment: Overview and selected highlights, B. Am. Meteorol. Soc., 98, 1427–1451, https://doi.org/10.1175/BAMS-D-15-00142.1, 2017.
WHO (World Health Organization): WHO Air Quality Guidelines for Particulate Matter, Ozone, Nitrogen Dioxide and Sulfur Dioxide, Global Update 2005, Summary of Risk Assessment, WHO, Geneva, https://apps.who.int/iris/handle/10665/69477 (last access: 1 February 2022), 2006.
WHO (global air quality guidelines): particulate matter (PM2.5 and PM10), ozone, nitrogen dioxide, sulfur dioxide and carbon monoxide, World Health Organization, https://apps.who.int/iris/handle/10665/345329 (last access: 1 February 2022), 2021.
Zhang, X., Zhao, L., Tong, D.Q., Wu, G., Dan, M., and Teng, B.: A systematic review of global desert dust and associated human health effects, Atmosphere, 7, 158, https://doi.org/10.3390/atmos7120158, 2016.