the Creative Commons Attribution 4.0 License.
the Creative Commons Attribution 4.0 License.
 | 08 Jul 2022
Contrail formation within cirrus: ICON-LEM simulations of the impact of cirrus cloud properties on contrail formation
Contrail formation within natural cirrus introduces large perturbations in cirrus ice crystal number concentrations, leading to modifications in cirrus microphysical and optical properties. The number of contrail ice crystals formed in an aircraft plume depends on the atmospheric state as well as aircraft and fuel properties. Our aim is to study contrail formation within cirrus and, in particular, the impact of pre-existing cirrus on the contrail formation processes. We implement a parameterization for contrail ice nucleation and the survival of contrail ice crystals within the vortex phase within the high-resolution ICON-LEM at a horizontal resolution of 625 m over Germany and modify the parameterizations in order to consider the impact of the pre-existing cirrus. We then simulate contrail formation and analyze the change in ice nucleation and survival due to the presence of cirrus ice crystals.
We have selected two different synoptic situations to sample a large range of cirrus cloud properties from those representative of average thick in situ formed cirrus and liquid origin cirrus that are connected to a frontal system down to very thin cirrus within a high-pressure system. We find that contrail formation within cirrus mostly leads to increases in cirrus ice crystal numbers by a few orders of magnitude. Pre-existing cirrus has a discernible impact on the contrail formation threshold temperature and on contrail ice crystal number concentrations only if the cirrus ice water content is high and ice supersaturation is low. The cirrus ice crystals sucked into and subsequently sublimated within the aircraft's engine and the ice crystals mixed into the aircraft plume experiencing sublimation and later deposition lead to an increase in the contrail formation threshold temperature most of the time. Often this increase is negligible, but in the above atmospheric conditions the increase in the contrail formation threshold can be large, reaching maximum values of 2 K. Consequently, significant increases in ice nucleation are very seldom, but in areas of high cirrus ice water content and ice crystal number concentrations, contrail ice nucleation rates can be significantly increased, in particular at lower flight levels. Cirrus ice crystals can also lead to a reduction in ice nucleation, but negative changes are significantly smaller and less common. After nucleation cirrus and contrail ice crystals compete for water vapor, while the combined contrail and cirrus ice water mass grows. Once the aircraft plume gets trapped within the wake vortices and descends the plume relative humidity decreases so that eventually both cirrus and contrail ice crystals sublimate. We find that the impact of cirrus ice crystals on the contrail ice crystal loss within the descending vortices is negligible. Only for nucleation rates several orders of magnitude lower than the soot number emission index can the impact be noticeable, but the relevance of this impact is limited.
- Article
(5348 KB) - Full-text XML
- BibTeX
- EndNote


Cirrus clouds are very common in the upper troposphere and have a large impact on radiative transfer and therefore on climate and weather (Liou, 1986). Cirrus cools the atmosphere by reflecting incoming shortwave (solar) radiation and absorbing and re-emitting outgoing longwave (terrestrial) radiation, which warms the atmosphere. The size of both the shortwave and longwave cloud radiative forcing depends on the macrophysical and microphysical cirrus properties (Ramanathan et al., 1989; Zhang et al., 1999). Aviation has a significant impact on upper tropospheric cirrus cloudiness (Boucher, 2013) due to the formation of contrails and due to aviation aerosol–cloud interactions. Of the known aviation-related radiative forcing components, contrail cirrus is estimated to be the largest (Burkhardt and Kärcher, 2011), but the associated uncertainty is large (Lee et al., 2021). This is not unexpected since in IPCC-style double-CO2 climate change simulations uncertainties in cloud responses are the main source of uncertainty in the equilibrium climate sensitivity (Stevens and Bony, 2013). In assessments of aviation-related climate change (Lee et al., 2021) contrail cirrus and the indirect aerosol effects involving aviation aerosol emissions are the most notoriously difficult to estimate and the most uncertain (e.g., Righi et al., 2013; Kapadia et al., 2016; Lee et al., 2021), with uncertainties caused to a large degree by incomplete knowledge about the number and ice-nucleating properties of emitted and subsequently aging aviation aerosols.
Contrail cirrus clouds have been studied in great detail in observations (e.g., Gayet et al., 1996; Schröder et al., 1999; Voigt et al., 2017; Schumann et al., 2017) and in modeling. Modeling the life cycle of contrail cirrus, just as modeling natural clouds, involves processes on a large range of scales, comprising microphysical processes as well as large-scale dynamics. Different approaches have been used, ranging from simulating single contrails over parts or the whole life cycle in a large-eddy simulation (LES; e.g., Lewellen et al., 2014; Unterstrasser, 2014; Paoli and Shariff, 2016) or numerical weather prediction (NWP; Gruber et al., 2018) to simulating the evolution, properties, and climate impact of a large number of contrails in low-resolution models with a significantly simplified microphysical treatment (Burkhardt and Kärcher, 2011; Bock and Burkhardt, 2016a, 2016b, 2019; Bier et al., 2017; Chen and Gettelman, 2013; Schumann et al., 2015). While LES is ideally suited to resolving the flow field around the airplane and therefore the contrail evolution in the first few minutes, numerical weather prediction and climate models are suited to simulating the contrail evolution, which depends on the evolving atmospheric conditions influenced by synoptic-scale variability.
Despite those efforts to understand contrail cirrus processes, many uncertainties connected to contrail cirrus radiative forcing remain, stemming from uncertainties in the background upper tropospheric water budget and cirrus cloud properties, the contrail cirrus schemes, and the impact of contrail cirrus on radiative transfer (Lee et al., 2021). Furthermore, the interaction between contrail cirrus and natural cirrus add to the uncertainty. Upper tropospheric natural cloudiness has been shown to decrease as a consequence of contrail formation and therefore limits the impact of contrail formation on climate (Burkhardt and Kärcher, 2011; Schumann et al., 2015; Bickel et al., 2020). The strength of this cloud adjustment is very uncertain. Furthermore, until now only contrail formation within a previously cloud-free air volume has been studied extensively. The impact of contrail formation within pre-existing clouds is largely unknown because it was thought to be secondary or even negligible. Contrail-induced cloud perturbations within existing cirrus have recently been shown to lead to changes in cloud optical depth that can be detected using satellite remote sensing (Tesche et al., 2016), which calls into question the assumption that this effect is negligible.
Contrails form when relative humidity within the aircraft exhaust plume exceeds saturation relative to water as a consequence of the mixing of the plume air with ambient air (Schumann, 1996). Contrail formation is subject to the atmospheric state as well as aircraft and fuel parameters. The number of ice crystals nucleated during contrail formation depends on the thermodynamic state of the ambient atmosphere and on aircraft and fuel parameters, in particular the number of aerosol particles released by the engine (Kärcher et al., 2015), but also on aerosol properties (Kärcher et al., 1998). Variability in aerosol properties and inhomogeneities within the plume lead to successive nucleation of ice crystals, which has an impact on plume relative humidity and acts to decrease ice nucleation (Lewellen, 2020). At cruise altitude in the midlatitudes the atmospheric state is such that the number of emitted aerosol particles constrains the number of ice crystals forming within the contrail's jet phase (Bier and Burkhardt, 2019). At lower latitudes or altitudes this is not necessarily the case; here the thermodynamic state of the ambient atmosphere, which is responsible for the evolution of relative humidity in the plume, often limits ice nucleation within contrails. Within the subsequent vortex phase, which lasts until a few minutes after emission, the aircraft-induced wake vortices travel downwards and many of the contrail's ice crystals that are trapped within the vortices sublimate depending on the atmospheric state, aircraft parameters, and number of contrail ice crystals that nucleated within the jet phase (Unterstrasser, 2016).
Both ice nucleation in the jet phase and ice crystal survival during the vortex phase may be modified by the existence of ice crystals from pre-existing clouds. Ice crystals from pre-existing cirrus that are sucked into the engine, sublimate, and lead to a small increase in the water vapor content of the plume (Gierens, 2012). Furthermore, cirrus ice crystals that are entrained into the plume after emission may sublimate as long as the plume is ice-subsaturated (Kärcher et al., 1998). Once the plume is ice-supersaturated water vapor may deposit on the entrained cirrus ice crystals (Gierens, 2012). The resulting change in the plume water vapor mixing ratio can lead to changes in the contrail formation threshold (Kärcher et al., 1998) and in contrail ice nucleation. The cirrus ice crystals that are entrained into the aircraft plume compete with the newly nucleated contrail ice crystals for available water vapor, and, once trapped within the descending vortices, both cirrus and contrail ice water usually sublimate. The competition of cirrus and contrail ice crystals for water vapor leads to a lower increase, or even a decrease, in the ice water mass associated with contrail ice crystals than if no cirrus ice crystals were present, which tends to decrease survival fractions. Once the plume is subsaturated within the descending vortices, the sublimation of the cirrus ice crystals increases the relative humidity and therefore limits the contrail ice sublimation compared to the sublimation of the same-sized contrail ice crystals disregarding the impact of the cirrus ice crystals. Both processes together may lead to a negative or positive change in the fraction of contrail ice crystals surviving the vortex phase. Any modification of the ice nucleation or survival during the vortex phase leading to changed ice crystal numbers after the vortex phase has an impact on contrail microphysical processes, contrail cirrus properties, optical depth, and lifetime (Bier et al., 2017; Burkhardt et al., 2018).
Kärcher et al. (1998) discussed the impact of pre-existing ice crystals that are sublimated in the combustor and that are mixed into the aircraft plume after emission on the formation of an observed warm (237 K) contrail. They note that a large number of small cirrus ice crystals would be needed so that the sublimation of cirrus ice can increase relative humidity so much that a contrail could form. Gierens (2012) discusses the impact of cirrus ice sublimation during combustion and the impact of water vapor deposition on cirrus ice crystals mixed into the plume, but excludes the sublimation of cirrus ice crystals mixed into the plume. Assuming average cirrus cloud properties he concludes that the effects are negligible.
We study here contrail formation within cirrus clouds as a first step towards evaluating the impact of cloud perturbations created by contrail formation within cirrus as observed by Tesche et al. (2016). We choose an approach between LES and a global climate model, studying contrail formation in a numerical weather prediction setup at a resolution of a few hundred meters using parameterizations for contrail ice nucleation (Kärcher et al., 2015) and survival of contrail ice crystals in the vortex phase (Unterstrasser, 2016). We consider a wide range of cirrus cloud properties as simulated by the high-resolution ICON-LEM in weather forecasting mode (Heinze et al., 2017), calculating changes in the contrail formation criterion and in the number of ice crystals nucleating during contrail formation and in the contrail ice crystal loss during the vortex phase. In Sect. 2 we introduce the ICON model and describe the contrail-related processes that are part of our contrail scheme. The scheme consists of a parameterization for ice nucleation and for the ice crystal loss in the contrail's vortex phase as well as additions that consider the existence of pre-existing ice crystals from natural cirrus. We study contrail formation processes on two selected days that represent different synoptic situations over Germany and discuss the background natural cirrus cloud properties (Sect. 3.1). We analyze contrail ice nucleation within cirrus and the impact of pre-existing cirrus clouds on the contrail formation threshold and ice nucleation (Sect. 3.2). In Sect. 3.3 we estimate the fraction of contrail ice crystals surviving the vortex phase and analyze the impact of cirrus ice crystals on the vortex phase survival. We study the sensitivity of our results to different soot number emission indices and to a change in the upper tropospheric stability. In Sect. 4 we summarize and compare our results to the existing literature, and we conclude in Sect. 5.
We develop and implement a representation for contrail formation, based on parameterizations of ice nucleation in the jet phase and ice crystal loss during the contrail's vortex phase, in the ICON-LEM (ICOsahedral Non-hydrostatic large-eddy model) (Zängl et al., 2014; Dipankar et al., 2015) that allows for the study of cirrus cloud modifications induced by contrail formation. We use a model setup that simulates the synoptic development over a limited domain, Germany, at a horizontal resolution of 625 m using initial and boundary data coming from an operational NWP (numerical weather prediction) system, COSMO (COnsortium for Small-scale MOdelling, Baldauf et al., 2011), at 2.8 km resolution. Instead of prescribing an air traffic inventory, we prescribe air traffic everywhere in the upper troposphere to study the impact of pre-existing clouds on contrail formation, the contrail formation temperature threshold, ice nucleation, and ice crystal loss in the vortex phase for a large range of atmospheric states and cloud properties. We intentionally also prescribe air traffic at low altitudes down to about 7 km that are usually not thought of as main air traffic levels, as airspace over Germany has become very tight in the last years and more short-distance flights have been moved to lower flight levels. Furthermore, vertical shifts in air traffic are being discussed in connection with the mitigation of aviation climate impacts (Fichter et al., 2005; Matthes et al., 2021).
2.1 ICON-LEM
ICON-LEM is based on the ICON (ICOsahedral Non-hydrostatic) modeling framework developed by the German Weather Service (DWD) and the Max Planck Institute for Meteorology (Zängl et al., 2015; Dipankar et al., 2015). ICON solves a set of equations on an unstructured triangular grid based on successive refinement of a spherical icosahedron (Wan et al., 2013; Zängl et al., 2015). Time stepping is performed using a predictor–corrector scheme. A summary of the model configuration and a description of the physics package are given in Heinze et al. (2017) and references therein.
We use ICON in an LEM (large-eddy model) mode over Germany with realistic orography at a resolution of 625 m and a time step of 3 s (Dipankar et al., 2015). The model has an option for two one-way nested domains. The model's high horizontal resolution combined with a vertical resolution of around 150 m in the upper troposphere allows resolving relevant cloud processes, such as convection, while cloud microphysics, turbulence, and radiation remain parameterized. Resolved cloud-scale dynamics lead to improvements in structure and distribution of clouds and precipitation (Stevens et al., 2020). The heterogeneity in the cloud field and thus in the optical depth is largely resolved, which enables a more realistic estimation of the radiative forcing relative to coarser-resolution models. The model is initialized at 00:00 UTC from operational COSMO-DE analysis data (Baldauf et al., 2011) and relaxed at the lateral boundaries within a 20 km nudging zone towards COSMO-DE analysis, which is updated hourly. The initial and boundary condition data are interpolated to the ICON grids by using a radial basis function interpolation algorithm (Ruppert, 2007), and 3D variables are interpolated vertically during initialization. An evaluation of the model simulations has been presented by Heinze et al. (2017) and Stevens et al. (2020). The benefit of the high resolution of ICON-LEM or ICON-SRM (Storm Resolving Model) relative to lower-resolution simulations was shown to lead to improvements in precipitation patterns, their location, propagation, diurnal cycle, and cloud properties, in particular the vertical structure and diurnal cycle (Stevens et al., 2020). In order to minimize computing time and disk space, we choose to run the model at 625 m horizontal resolution. The benefit from increasing resolution from 625 to 156 m was shown by Stevens et al. (2020) to be small.
Two-moment cloud microphysics
The cloud microphysical scheme of ICON-LEM is based on Seifert and Beheng (2006) and includes microphysical processes in liquid, mixed-phase, and ice-phase clouds. The microphysical two-moment scheme predicts mass mixing ratios and number concentrations for six hydrometeors, cloud droplets, rain, ice, hail, snow, and graupel. The cloud cover scheme is an all-or-nothing scheme disregarding subgrid variability of total water. The microphysical scheme describes droplet formation and ice nucleation, growth and conversion processes between different hydrometeors, precipitation, and sedimentation. The parameterization for homogeneous and heterogeneous ice nucleation is based on Kärcher et al. (2006) and includes the competition between homogeneous and heterogeneous nucleation, and it considers the impact of pre-existing ice crystals. Heterogeneous nucleation is induced by INPs (ice-nucleating particles) with mineral dust concentrations prescribed according to Hande et al. (2015). Activation of INPs for heterogeneous nucleation is parameterized based on the simulation of the aerosol conditions with the COSMO MultiScale Chemistry Aerosol Transport (COSMO-MUSCAT) model (Wolke et al., 2004, 2012). A tracer is used to track the number of ice nuclei that have formed ice crystals and are therefore no longer available for ice nucleation (Köhler and Seifert 2015).
2.2 Contrail scheme
We developed and implemented a contrail scheme within ICON-LEM, based on the parameterization of contrail ice nucleation (Kärcher et al., 2015) and ice crystal survival within the vortex phase (Unterstrasser, 2016), to study changes in cloud variables due to contrail formation within cirrus. Contrail formation, dependent on atmospheric as well as aircraft and fuel parameters, is calculated, and contrail ice nucleation (Sect. 2.2.1) and ice crystal loss in the contrail's vortex phase (Sect. 2.2.3) are estimated. We analyze contrail ice number concentrations after the contrail's vortex phase at a contrail age of ∼ 5 min.
If contrails form within a pre-existing cirrus, the cirrus may have an impact on the contrail formation threshold, contrail ice nucleation, and contrail ice crystal survival during the vortex phase depending on the cirrus macrophysical and microphysical properties. We consider the impact of the sublimation of natural cirrus ice crystals that are sucked into the combustor or entrained into the aircraft plume and lead to changes in water vapor mixing ratio in the young plume as well as changes in the contrail formation threshold temperature and contrail ice nucleation (Sect. 2.2.2). After contrail ice nucleation, water vapor deposition on the contrail and cirrus ice crystals that were entrained into the plume leads to a relaxation of ice supersaturation. While shortly after nucleation ice supersaturation is usually so high that both contrail and cirrus ice crystals grow fast dependent on the size of their respective ice crystals, once ice supersaturation is very close to saturation large cirrus ice crystals may grow at the cost of smaller contrail ice crystals (Lewellen, 2012). The competition of cirrus and contrail ice crystals for available water vapor leads to smaller contrail ice crystals compared to the situation in which cirrus ice crystals are not present before vortex descent and therefore tends to decrease the contrail ice crystal survival fraction. The sublimation of ice crystals from the pre-existing cirrus clouds that are caught in the descending wake vortices increases relative humidity within the subsaturated vortices and tends to reduce the sublimation of contrail ice crystals. We analyze the combined impact of cirrus ice crystals during the diffusional growth phase and during vortex descent on the contrail ice crystal survival in Sect. 2.2.4.
In order to sample through a large number of atmospheric states with varying cloud properties without having to perform long simulations, we pick two different synoptic situations with very different background conditions and cloud properties. Both situations are part of 1 d long ICON-LEM simulations described in Heinze et al. (2017). For each of those situations we study contrail formation in the upper troposphere (above ∼ 7 km) for only one time step, prescribing air traffic in each grid box of the simulation domain.
2.2.1 Parameterization of contrail formation and ice nucleation
Contrail formation depends on atmospheric conditions as well as fuel- and aircraft-dependent parameters and is described by the Schmidt–Appleman (SA) criterion (Schumann, 1996). The temperature threshold for contrail formation depends on the slope of the mixing line, G, in a temperature–water vapor partial pressure diagram:
where Mw, cp, Pa, Q, and η are the mass emission index of water vapor, specific heat capacity, atmospheric pressure, specific combustion heat, and propulsion efficiency, respectively. We set the mass emission of water vapor to 1.25 kg (kg-fuel)−1, specific combustion heat to 43.2 MJ (kg-fuel)−1, and propulsion efficiency to 0.3 (Bock and Burkhardt, 2019). The temperature threshold of contrail formation, Tsa, is the temperature at which the mixing line with slope G touches the water saturation curve tangentially. Tsa is the highest temperature at which contrails can form in a water-saturated atmosphere. At ambient temperatures below that threshold, contrails will form if the ambient humidity is high enough. Contrails will only persist if ambient humidity is at least saturated relative to ice. At a given pressure level and for a given propulsion efficiency the slope of the mixing line depends on the ratio of emitted water vapor and combustion heat. An increase in water vapor emissions at constant combustion heat therefore leads to an increase in the slope of the mixing line and therefore to a higher temperature threshold of contrail formation.
Ice nucleation takes place within the first second after emission in the contrail's jet phase (Paoli and Shariff, 2016). The hot and moist air of the plume rapidly mixes with the cold and dry ambient air. If water saturation is exceeded within the plume, droplets form preferentially on emitted soot particles and background aerosols (Kärcher and Yu, 2009; Kärcher et al., 2015). The number of droplets that form within the contrail is dependent on the supersaturation and the size distribution and hygroscopicity of the aerosols. At current soot number emissions, volatile plume particles are generally too small to get activated. Once droplets have formed in the plume they rapidly freeze into ice particles by homogeneous freezing when plume temperatures fall below the freezing temperature. If the contrail formation threshold temperature is close to the ambient temperature then the maximum attainable plume supersaturation (when neglecting the decrease in supersaturation due to droplet formation) will be low, and therefore only few soot particles will activate into water droplets and subsequently freeze (Kärcher and Yu, 2009; Kärcher et al., 2015). Close to the temperature threshold the apparent emission index (AEIi) of contrail ice crystals increases rapidly with decreasing ambient temperature, Ta. Contrail formation close to the contrail formation threshold occurs often at low air traffic altitudes where air is relatively warm or in tropical or subtropical areas (Bier and Burkhardt, 2019). When contrails form far below the contrail formation threshold, AEIi is controlled by the soot number emission index. As ambient temperature decreases maximum attainable plume supersaturation increases and an increasing number of soot particles can activate and form ice crystals. The number of soot particles forming ice crystals for temperatures 5 K below the formation threshold is close to the number of emitted soot particles (within approximately 25 %). This means that in the extratropics at typical cruise levels ice crystal numbers in young contrails are mostly limited by the number of emitted soot particles (Bier and Burkhardt, 2019).
We have implemented the parameterization of contrail ice nucleation based on Kärcher et al. (2015). The parameterization calculates the number of droplets that form and subsequently freeze within the contrail's jet phase. The number of droplets that form within the contrail is determined by calculating the number of droplets that can form at a given plume supersaturation and that lead to a decrease in relative humidity that balances the large increase in relative humidity due to the mixing of plume and environmental air. All aerosols are assumed to activate and form droplets at the same time, tact, called the “activation–relaxation time”, neglecting the fact that aerosols that activate slightly earlier due to differences in aerosol properties or plume inhomogeneities would have an impact on the plume relative humidity and ice nucleation. This impact is large for large aerosol emissions, e.g., for EIs=1016 (kg-fuel)−1 and higher (when using parameters as in Fig. 5 of Lewellen, 2020). Furthermore, we do not expect the impact of differences in aerosol properties to be increased when forming contrails within cirrus since we can exclude entrainment of aerosols into the plume that preferentially form ice crystals. Few aerosols may be added to the plume due to the sublimation of ice crystals within the engine because the sulfuric acid droplets would evaporate, while IN, such as soot or dust, may be released with unknown properties, increasing the already high soot number emissions slightly. Smaller aerosols which may not have been activated within the natural cirrus could activate in the plume due to the larger plume relative humidity. But the impact of those smaller entrained aerosols would be similar when contrails form within cirrus instead of in cloud-free air because plume relative humidities are comparable in both cases.
We have calculated the apparent emission index of contrail ice crystals (AEIi) by prescribing on all model levels between 7 and 13 km of altitude a soot emission index (EIs) and assuming current-day soot-rich emissions of 2.5 × 10¹⁵ soot particles per kilogram of fuel (Bräuer et al., 2021). Figure 1 shows the dependency of AEIi on the difference between the ambient and threshold temperature in the altitude range between 9.6 and 10.8 km for varying atmospheric conditions. Close to the formation threshold (Tsa−Ta<3 K) AEIi rapidly increases with an increasing difference between ambient temperature and the temperature threshold for contrail formation. At ambient temperature far below the temperature threshold a large percentage of the soot particles activate and form contrail ice crystals so that AEIi approaches EIs. The apparent emission index of ice varies for a fixed difference between ambient and Schmidt–Appleman temperature since atmospheric conditions, i.e., pressure, water vapor mixing ratio, and the Schmidt–Appleman temperature, are not constant.

Figure 1Apparent emission index, AEIi, versus the difference between ambient temperature, Ta, and Schmidt–Appleman temperature, Tsa, for 26 April 2013 at altitudes between 9.6 and 10.8 km for various combinations of atmospheric pressure, ice saturation ratio, and temperature threshold for contrail formation.
2.2.2 Impact of natural cirrus on contrail formation and ice nucleation
The sublimation of cirrus ice crystals within the engine acts to increase water vapor emissions coming from fuel combustion and therefore changes the slope of the plume mixing line. Cirrus ice crystals that are entrained into the aircraft plume before nucleation (within the first second of the plume lifetime) sublimate partially as long as the plume is ice-subsaturated and increase the plume water vapor mixing ratio. Once the plume is ice-supersaturated deposition on the entrained cirrus ice crystals will take place, decreasing the water vapor mixing ratio. Assuming a mass-based air-to-fuel mixing factor at the engine outlet, N0, of 70 kg-air (kg-fuel)−1, we estimate the change in the plume's water vapor content per kilogram of fuel due to the presence of cirrus ice crystals (with a mean mass, m) at the time of aerosol activation (tact), Mcir [kg (kg-fuel)−1]:
with qci the ice water mass mixing ratio of cirrus [kg (kg-air)−1], nent the apparent emission index for cirrus ice crystal numbers entrained into the plume from the surrounding air [(kg-fuel)−1], which increases with plume dilution, and nent the dilution calculated using Eqs. (18) and (12) of Kärcher et al. (2015). The sublimated water mass per cirrus ice crystal, , deposited water mass on a cirrus ice crystal, , and their time-integrated values are estimated as explained in Appendix A. The first term of Eq. (2) describes the cirrus ice water that is sublimated within the engine per kilogram of fuel burned. The second term stands for the time-integrated change in water vapor mixing ratio due to sublimation and deposition on cirrus ice crystals that are mixed into the plume after emission (t0) and before aerosol activation (tact), assuming that we can neglect any changes in the time of aerosol activation that may be caused by the presence of cirrus ice crystals. The impact of cirrus ice crystals on the aviation-induced plume water vapor content is discussed in Sect. 3.2.
Sublimation and deposition on cirrus ice crystals lead to a deviation of the plume's water partial pressure away from the mixing line approximation, with variations largest shortly after emissions due to the plume's large subsaturation and high temperature. We approximate the evolution of the plume properties by a new mixing line, treating the change in the plume's water vapor content from the sublimation and deposition as a change in the water vapor emission. When calculating the slope of the new mixing line we add the Mcir to the mass emission index of water vapor, Mw. The new slope for the mixing line Gci is
When calculating the slope of the time series of water partial pressure at the time of contrail ice nucleation we find deviations from the simple mixing line approximation (Eq. 3) of a few tenths of a percent. Only when assuming a very large cirrus ice crystal number concentration of 5×10⁶ m−3 can the deviation from the mixing line slope at the time of aerosol activation reach values up to 1 %. This agrees with Gierens (2012), who finds that for a plume age of 1 s, at typical cirrus ice crystal concentrations and typical atmospheric conditions, the deposition timescale is 2 to 3 orders of magnitude smaller than the dynamic jet timescale, which indicates that cirrus ice crystals grow too slowly to effectively reduce plume supersaturation production due to cooling.
If the slope of the mixing line, Gci, is larger than the slope of the mixing line, which neglects the impact on the background cirrus ice crystals, then the temperature threshold for contrail formation is increased. Plume supersaturation can occur earlier and the maximum attainable relative humidity, which is reached within the plume when neglecting the decrease in supersaturation due to aerosol activation and droplet formation, can be larger. Therefore, ice nucleation is increased.
2.2.3 Parameterization of ice crystal loss during vortex descent
After contrail ice nucleation the plume ice water mass grows, and approximately 10 s after the emission, the exhaust plume including the newly formed ice crystals gets trapped in a pair of counter-rotating vortices (primary wake) that are created when the vorticity sheet originating from the pressure differences at the aircraft wings rolls up (Paoli and Shariff, 2016). The counter-rotating vortices propagate downward depending on atmospheric stability and aircraft properties, such as weight, wing span, and speed (Gerz et al., 1998). The density contrast between the air in the vortex, which descends through a stably stratified atmosphere, and the surrounding air creates vorticity that is shed upwards (secondary wake), and part of the exhaust, between 10 % and 30 % (Gerz et al., 1998), is detrained into the secondary wake. The secondary wake stays close to the flight level. The primary wake often descends a few hundred meters. Many ice crystals within the primary downward-propagating vortices sublimate due to adiabatic heating and the associated decrease in relative humidity, while the ice crystals in the secondary wake are more likely to survive. Survival of the ice crystals in the vortex regime depends on atmospheric temperature, humidity, the number of nucleated ice crystals, and the maximum vertical displacement of the vortices. After vortex descent most of the air that was forced downwards rises again, creating a vertically extended contrail.
The parameterization for the impact of the vortex descent on contrail properties in ICON-LEM is based on the work of Unterstrasser (2016). He used LES to study the vertical extent of the contrail and the survival fraction of ice crystals for contrails forming in cloud-free air for a number of different aircraft (with differences in weight and wing span) and varying conditions of the surrounding atmosphere. The Unterstrasser (2016) parameterization estimates (1) the maximum vertical displacement of the vortices in the atmosphere, (2) the vertical extent of the contrail, which is given by the maximum vertical displacement of the vortices if ice crystals survive at the location of maximum displacement and smaller otherwise, and (3) the survival fraction of the contrail ice crystals caused by the change in the relative humidity connected to adiabatic warming of air due to vortex descent while accounting for differences in ice crystal growth due to the Kelvin effect. The parameterization captures the dependence of the survival fraction on ice supersaturation, temperature, contrail ice crystal sizes, and atmospheric stability. We use the parameterization assuming aircraft properties of medium-sized aircraft (Aircraft type A350 or B767) (Table 1 of Unterstrasser, 2016) to estimate the survival fraction of ice crystals and the vertical extent of the contrail after vortex descent. The contrail cross-sectional area is given by the contrail vertical extent times the aircraft's wing span.
The survival fraction of nucleated contrail ice crystals is defined as follows.
A survival fraction of 1 means that all ice crystals survive the vortex descent, and zero means all nucleated contrail ice crystals sublimate.
2.2.4 Impact of cirrus ice crystals on growth of contrail ice crystals after nucleation and on sublimation of contrail ice crystals during vortex descent
When contrails form within cirrus the cirrus ice crystals entrained into the plume not only have an impact on ice nucleation but can also have an impact on the growth of contrail ice crystals after nucleation and on the subsequent loss of contrail ice crystals during the contrail's vortex descent. After nucleation cirrus and contrail ice crystals together act to relax the plume's supersaturation towards the ice saturation value. We use the diffusional growth equation (e.g., Pruppacher and Klett, 1997; Paoli and Shariff, 2016; Lewellen, 2012, Appendix A) in order to estimate the temporal evolution of water vapor deposition on the contrail and cirrus ice crystals over 9 s after nucleation and before vortices start to descend. Once the plume's relative humidity approaches ice saturation the smaller contrail ice crystals may sublimate, while larger cirrus ice crystals may still grow due to the dependence of the saturation vapor pressure on the curvature of the ice crystals (Kelvin effect), and the difference in ice crystal sizes between cirrus and contrail ice crystals increases. This behavior may often be found in contrails (Lewellen, 2012) and is important in areas of low background relative humidity and large cirrus ice crystals. This means that the presence of cirrus ice crystals limits the deposition on the contrail ice crystals due to the competition for water vapor. This competition during the growth phase before vortex descent acts to increase contrail ice crystal loss during vortex descent since the ice mass of contrail ice crystals is lower than it would have been in the absence of cirrus ice crystals.
Next, we estimate the water deposition and sublimation on cirrus ice crystals during vortex descent. When the plume gets trapped in the wake vortices and the vortices propagate downward, plume temperature increases and plume relative humidity decreases. As long as the plume air is slightly ice-supersaturated contrail ice crystals may sublimate, while cirrus ice crystals may still grow. Eventually cirrus ice crystals sublimate as well, and the sublimation of both the cirrus and contrail ice crystals moistens the air volume of the vortex. At this stage, the sublimation of cirrus ice crystals reduces the sublimation of the contrail ice crystals by weakening the decrease in relative humidity within the sinking vortex.
In the following we describe how we account for the above processes. We roughly estimate how much cirrus ice water can sublimate during vortex descent in the time it takes to completely sublimate the contrail ice water. For this calculation we use the diffusional growth equation including the Kelvin effect, while assuming spherical particles and setting the saturation ratio to the slightly subsaturated value of 0.98, a value that can typically be found in the descending vortices due to the decrease in relative humidity connected to the temperature increase and the moistening connected to sublimation (Simon Unterstrasser, personal communication, 2021, Naiman et al., 2011). Using those assumptions, we estimate the ratio of sublimated cirrus ice mass, Mcirrus, and sublimated contrail ice mass, Mcontrail, by dividing the diffusional growth equation for single cirrus ice crystals, d, by the one for contrail ice crystals, d, and multiplying by the ratio of the number of ice crystals within the air volume.
This equation allows us to roughly estimate the amount of cirrus ice water that can sublimate while the contrail ice crystals sublimate. dMcirrus is the cirrus ice water mass that sublimates in the time dtdesc, which is the vortex descent timescale. The vortex descent timescale we estimate from the vortex descent length scale, zdesc, and the vortex descent speed, w0, given by the parameterization and in Table 1 of Unterstrasser (2016), respectively. The sum of the cirrus ice water sublimation calculated in this way and the deposition on cirrus ice crystals, which was happening before vortex descent, is a measure of the impact of cirrus ice crystals on the water vapor content of the plume.
Finally, we use the parameterization of Unterstrasser (2016), which does not include the impact of cirrus ice crystals on the survival fraction of contrail ice crystals, adjusting the water vapor “emissions” of the air plane, which is an input in the parameterization. While the water vapor emission is usually given by the Mw coming from fuel combustion, in the context of contrail formation within cirrus, we use the “aviation-induced increase in water vapor (Mcir)” and add the sum of the sublimation of and deposition on cirrus ice crystals within the first 9 s after ice nucleation and during vortex descent (Mvort). This sum of sublimation and deposition on cirrus ice crystals (Mvort) describes the impact of the cirrus ice crystals on the plume water vapor content integrated over the vortex phase, which together with Mcir is a measure for the modification of the plume's water vapor content that is seen by the contrail ice crystals. Then we use the parameterization of Unterstrasser (2016) to estimate the contrail ice crystal loss.
In summary, we proceed in the following way: (a) estimate diffusional growth on contrail and entrained cirrus ice crystals before vortex descent. (b) Estimate the cirrus ice water mass that sublimates within the time that contrail ice crystals sublimate, which is either given by the time the vortex descends or by the time it takes to sublimate all contrail ice crystals. (c) Adjust the water vapor emission in the parameterization of Unterstrasser (2016); as explained above, we compute the net effect of water vapor uptake of and ice mass release from cirrus crystals during the respective phases and add this negative or positive contribution to the sum of water vapor emission originating from combustion and Mcir. (d) Recalculate the number of contrail ice crystals that sublimate and the fraction that survives the vortex descent based on Unterstrasser (2016) with the modified water vapor emission. This approach should give us a very rough estimate of the impact of cirrus ice crystals on the survival of contrail ice crystals within the vortex phase. In a sensitivity simulation we vary the growth time period before vortex descent (tgrow=19 s instead of 9 s) since, on the one hand, the time until vortex descent is not well-defined and, on the other hand, during the first few seconds of vortex descent relative humidity may be such that cirrus ice crystals could grow at the cost of contrail ice crystals. With this, we investigate how the choice of tgrow, which is not well-constrained, and the assumption of a constant slight subsaturation during vortex descent affect the prediction of the survival fraction.
In Sect. 3.3 we will discuss the impact of cirrus ice crystals on the loss of contrail ice crystals during the vortex phase, comparing it to the ice crystal loss that the contrail would have experienced in the same situation except for the absence of cirrus ice crystals and with a corresponding reduction in total water.
2.3 Simulations – analysis
We study contrail formation in a large variety of atmospheric states and cloud properties over Germany using ICON-LEM at a horizontal resolution of 625m and a vertical resolution of approximately 150 m. In order to sample many different atmospheric conditions, we prescribe air traffic within each grid box at altitudes between 7 and 13 km assuming an average fuel consumption of 6 kg-fuel km−1, which is typical for cruise conditions over Germany according to the Aviation Environmental Design Tool AEDT air traffic inventory (Wilkerson et al., 2010). Soot number emissions are set to 2.5×10¹⁵ (kg-fuel)−1, in line with Bräuer et al. (2021). We study two different synoptic situations on 24 April 2013 at 06:00 and 26 April 2013 at 17:00 (Sect. 3.1), starting our model with output from longer simulations with ICON-LEM that started on the respective days at midnight (Heinze et al., 2017). The success of the model simulating the large-scale synoptic situation and the associated cloud fields of those days is documented in Heinze et al. (2017). We calculate contrail ice nucleation within cirrus and the subsequent ice crystal loss in the vortex phase on 24 April at 06:00 in approximately 6 million cloudy grid boxes and on 26 April 2013 at 17:00 in approximately 5.5 million cloudy grid boxes between 7 and 13 km with cloudy grid boxes defined as ice water content (IWC) >10−11 kg m−3. For the calculation of ice crystal loss in the vortex phase we assume a fixed Brunt–Väisälä frequency of 0.012 s−1 and calculate the sensitivity to the assumed stability. Assuming a fixed Brunt–Väisälä frequency reduces the degrees of freedom in our calculations, making it easier to isolate the impact of contrail formation on cirrus properties. When exploring the sensitivity of our results to the stability we assume a Brunt–Väisälä frequency of 0.005 s−1. We furthermore study the sensitivity of the contrail ice crystal survival fraction to the soot number emissions, reducing the emission index of soot by up to 80 %.
We perform case studies for two different synoptic situations, a high-pressure system over central Europe on 24 April and a frontal passage on 26 April 2013. In Sect. 3.1 we introduce the synoptic situation and the cirrus properties found at that time over Germany. We study contrail formation, contrail ice nucleation and survival, and the impact of the pre-existing cirrus on contrail formation and ice nucleation (Sect. 3.2) as well as on the ice crystal loss in the vortex phase (Sect. 3.3).
3.1 Synoptic condition
We selected two days for our analysis, 24 and 26 April 2013. The days were part of the HOPE measurement campaign (Macke et al., 2017) that had the goal of evaluating the performance of the high-resolution ICON simulations. The synoptic situation on those two days was very different, which allows us to study contrail formation within pre-existing cirrus in strongly varying synoptic settings leading to distinct cloud microphysical properties. On 24 April a high-pressure system dominated over Germany with close to clear-sky conditions in many areas and some thin in situ formed cirrus. The day of 26 April saw the passage of a cold front over Germany moving towards the southeast connected to a conveyor belt that was supplying the upper troposphere with moist air. Cloudiness rapidly increased, and strong frontal convection, geometrically thick clouds, and precipitation could be found along the front. The cirrus field on this day includes clouds with properties typical for average thick in situ formed cirrus. A small fraction of the cirrus had properties that are typical for liquid origin cirrus (Krämer et al., 2020).
The simulations for those days were part of the model evaluation performed by Heinze et al. (2017) and Stevens et al. (2020). Heinze et al. (2017) showed that the synoptic systems on those days were simulated well by ICON. The high resolution of the ICON-LEM simulations led to improvements, e.g., in the vertical cloud structure and the diurnal cycle of clouds (Stevens et al., 2020). On 24 April cloudiness in general may be overestimated in comparison with MODerate Resolution Imaging Spectroradiometer (MODIS) images over central Germany, while cirrus clouds, for instance in the northwest of Germany, are largely missed or are too thin in the simulations. Over the middle of Germany, a large thin cirrus cloud field with low ice water content and ice crystal number concentration is simulated in an ice-saturated environment and persists for several hours. The cirrus field is spatially very homogeneous. On 26 April, ICON simulates the frontal passage realistically and shows a slight underestimation of cloud fraction, with good agreement regarding the cloud water path (Heinze et al., 2017). The cirrus is scattered and microphysical properties of the cirrus vary significantly. Lifting within the frontal zone ensures a continuous water vapor supply in some areas of the upper troposphere and provides ice-supersaturated conditions within the relatively thick cirrus layer. The conditions are therefore favorable for contrail formation and ice crystal growth.
We have performed a CFAD (Cloud Frequency Altitude Diagram) analysis to examine the properties, in particular the ice crystal number concentration, mean volume diameter of ice crystals, and ice water content (IWC), of the cirrus clouds (Fig. 2). The CFAD provides information about the frequency of occurrence (probability density) of the cloud properties at different atmospheric temperatures. Figure 2 shows the frequency of occurrence of ice crystal number concentration (Fig. 2b, e), mean diameter of ice crystals (Fig. 2c, f), and ice water content IWC (Fig. 2a, d) at different temperatures in the cirrus cloud field over Germany for 24 and 26 April 2013 at 06:00–07:00 and 17:00–18:00, respectively. On the morning of 24 April the cirrus cloud over Germany is relatively homogeneous and the probability of cloudy areas reaching ice crystal number concentrations of roughly 105 m−3 at about 220 K, a typical cruise level, is 0.01 %. At the same time, IWC is low, and only in 0.01 % of the cirrus at 220 K are values of gm−3 reached. On the evening of 26 April, the distributions of ice crystal number concentration and IWC are much wider with 0.01 % of cloudy areas reaching values up to 108 m−3 and 0.5 gm−3 at 220 K. Describing the width of the distribution by the values occurring with a probability of 0.01 %, the diameter of the ice crystals varies strongly with temperature and ranges between 20 and 200 µm at 210 K and between 20 and 400 µm at 230 K on 24 April 2013. On the evening of 26 April 2013 it ranges between less than 10 and 200 µm and between 15 and 600 µm at 210 and 230 K, respectively. The most striking difference between the cirrus properties on the two days is the large difference in ice number concentrations, with extrema in ice number concentrations at 220 K about 3 orders of magnitude higher on 26 April than on 24 April. At the same time, extrema in IWC are about 1 order of magnitude larger on 26 April and the probability of low ice crystal sizes is increased. Those high concentrations of small ice crystals on 26 April are likely connected to homogeneous freezing events happening in the areas of high ice supersaturation caused by lifting in the conveyor belts and with the freezing of droplets lifted within convective systems along the front. The vertical line in the diameter diagram (Fig. 2c and f) is an artifact from the lateral boundary conditions supplied by COSMO, which is run using a one-moment microphysical scheme. When using COSMO data for the forcing fields, a diameter of 100 µm and associated ice crystal numbers are assumed (personal communication Axel Seifert, DWD), leading to an increased probability of ice crystal sizes of 100 µm, particularly in areas close to the model edge.
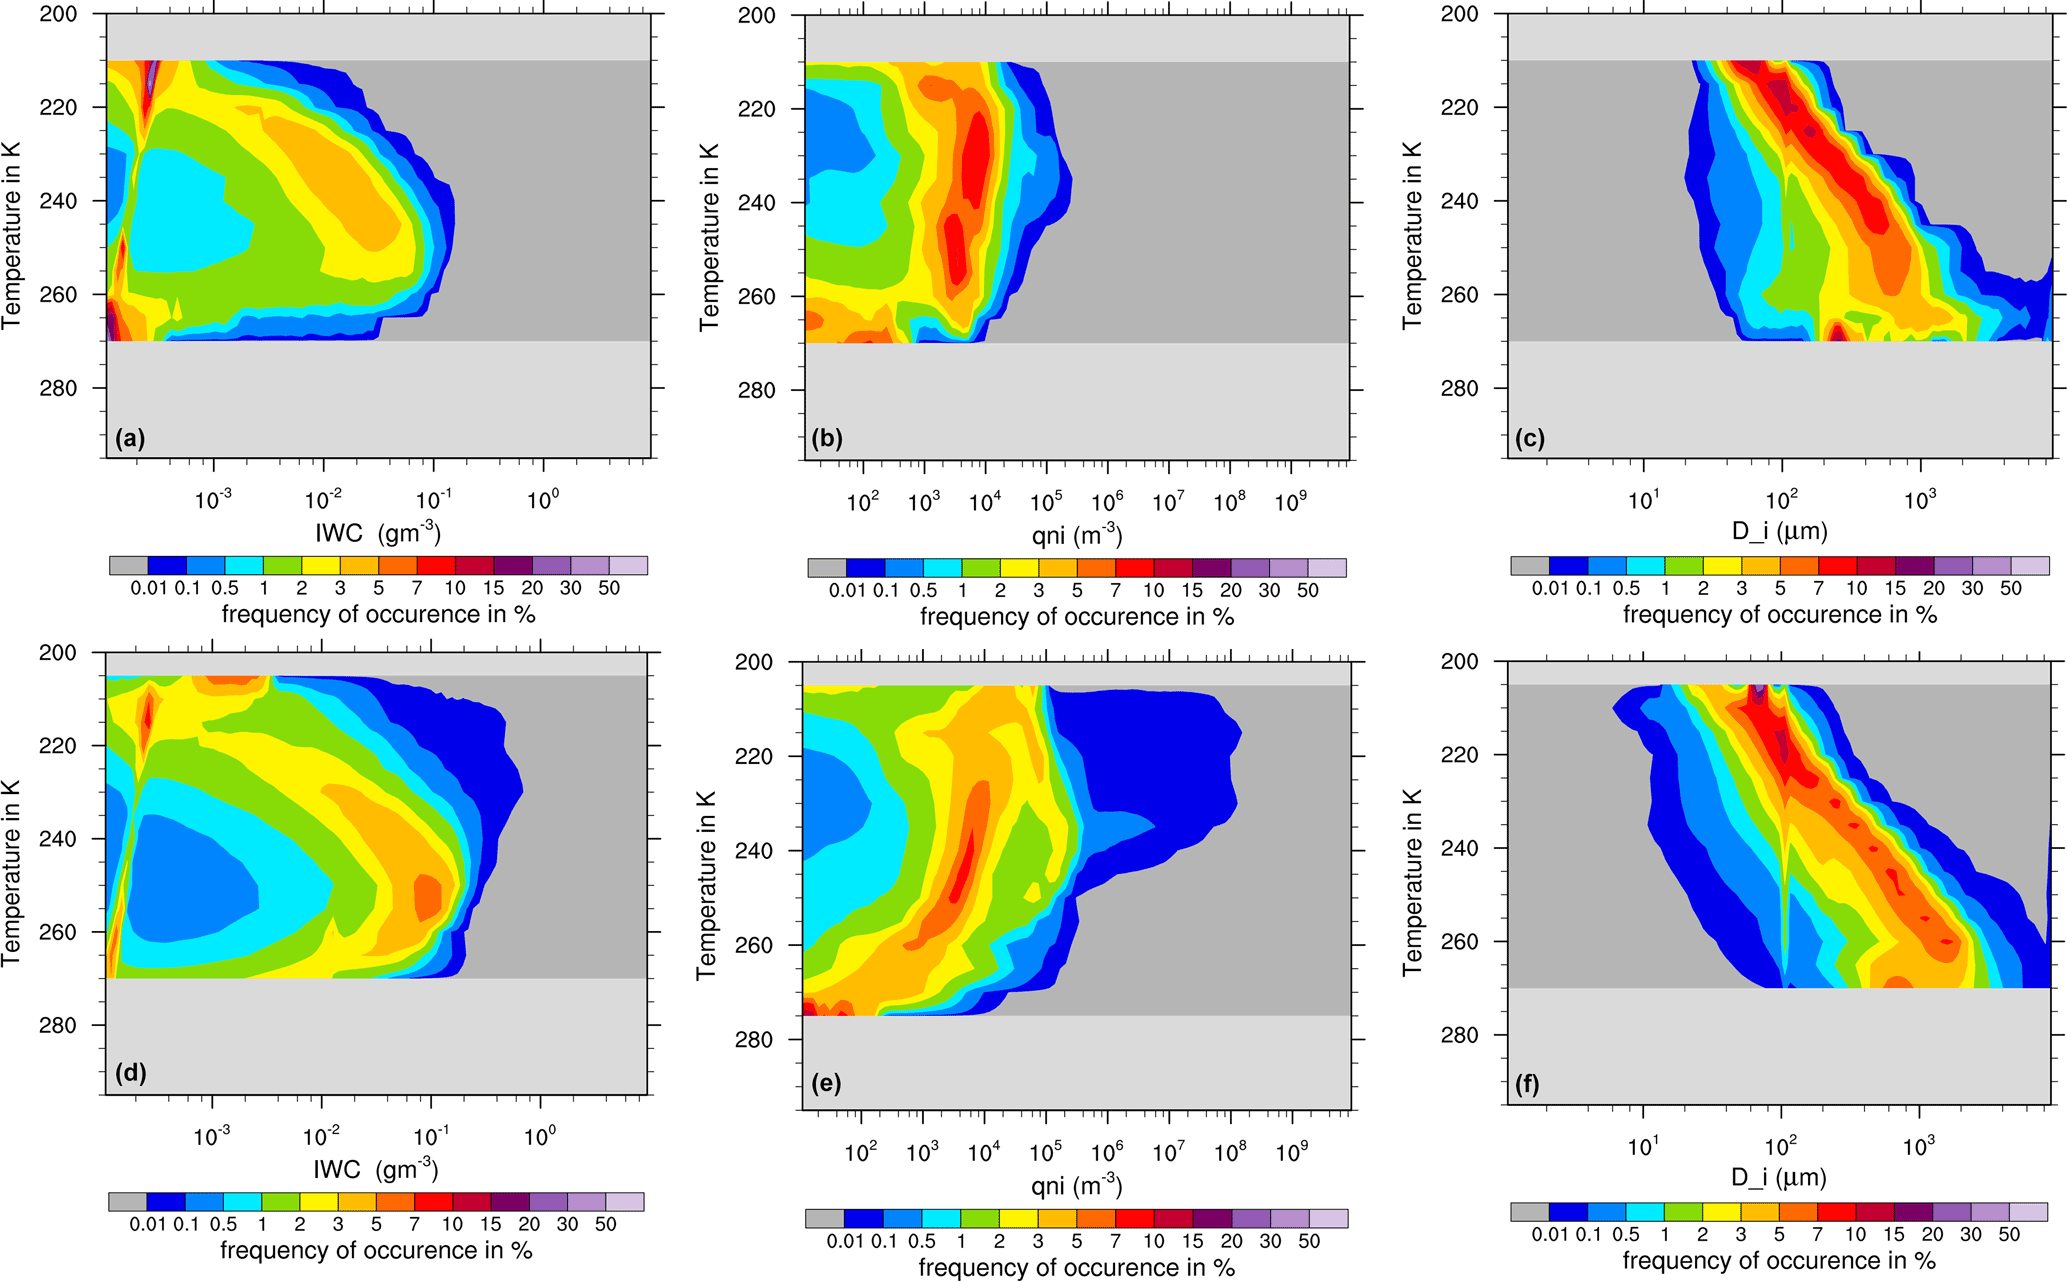
Figure 2Frequency of occurrence of IWC (a, d), ice crystal number concentration (b, e), and mean volume diameter of ice crystals (c, f) on (a, b, c) 24 April 2013 at 06:00–07:00 and (d, e, f) 26 April at 17:00–18:00. The frequencies of occurrence refer to individual temperature bins.
3.2 Impact of the pre-existing cirrus on contrail formation and ice nucleation
We study the impact of cirrus ice crystals that are either sublimated within the combustor or mixed into the plume before ice nucleation on the contrail formation threshold temperature and on ice nucleation. When aircraft fly through a cirrus cloud, air and ice crystals get sucked through the engine inlet and sublimate. Furthermore, cirrus ice crystals get mixed into the plume, causing sublimation or deposition depending on the plume's ice saturation ratio. The presence of cirrus ice crystals leads to a change in the total water vapor in the exhaust plume, usually increasing the water vapor content of the plume. In the following we will call the sum of the change in the water vapor content caused by the sublimation of cirrus ice crystals and by the deposition on the cirrus ice crystals while the plume is ice-supersaturated together with the water vapor emissions due to the combustion of fuel the “aviation-induced increase in water vapor”. We estimate the aviation-induced increase in water vapor for cirrus clouds that have properties as displayed in Fig. 2. The ratio of the change in plume water vapor concentration due to sublimation of or deposition on cirrus ice crystals and the aviation-induced increase in water vapor are mostly small. The change connected to the presence of cirrus ice crystals contributes often only a few thousands to a few hundreds of a percent to the aviation-induced increase in water vapor (Fig. 3), in line with the fact that we consider clouds with as little as 10−11 kg m−3. We additionally calculated the probability of changes when considering only contrail formation in pre-existing cirrus with a minimum IWC of 10−5 kg m−3(not shown). Maximum contributions of cirrus ice crystals to the aviation-induced increase in water vapor reach values of half a percent with a probability of 10−4 % (when analyzing all cirrus with a minimum IWC of 10−11 kg m−3) on 24 April at 6:00 or with a probability of a few tenths of a percent (when considering cirrus with an IWC of at least 10−5 kg m−3). On 26 April at 17:00 contributions exceed 10 % with a probability of 0.06 % (when considering cirrus with an IWC of at least 10−11 kg m−3) or with a probability of nearly 1 % (when considering only cirrus with an IWC of 10−5 kg m−3). Contributions exceed 5 % with a probability of approximately 0.2 % (when considering cirrus with an IWC of at least 10−11 kg m−3) or with a probability of 2.5 % (when considering only cirrus with an IWC of 10−5 kg m−3). The probability density function (PDF) of the changes due to sublimation of cirrus ice crystals in the combustor only is simply shifted towards lower values. This is despite the fact that the change in the plume water vapor concentration due to the sublimation of and deposition on cirrus ice crystals that were mixed into the plume can also be negative.
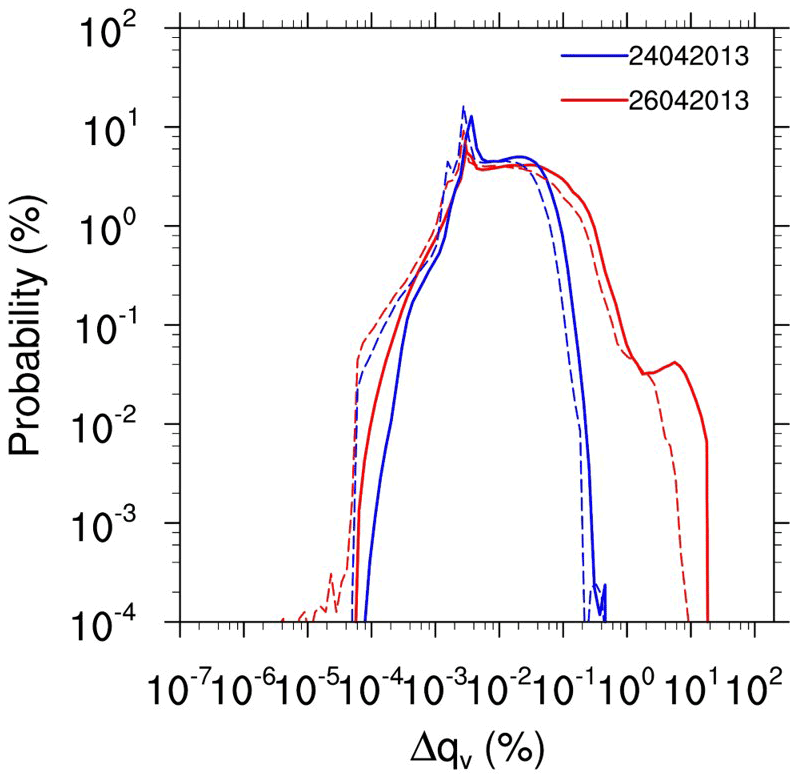
Figure 3Probability distribution of the ratio of the change in water vapor concentration due to the impact of cirrus ice crystals and the aviation-induced increase in the water vapor Δqv at aerosol activation roughly 1 s after emission for 24 April at 06:00 UTC (blue) and 26 April 2013 at 17:00 UTC (red) for areas with temperatures lower than 233.15 K, ice saturation ratio larger than 1, and IWC larger than 10−11 kg m−3. The water vapor emission index is set to 1.25 kg (kg-fuel)−1. Cloud properties for the two days are displayed in Fig. 2. Dashed lines indicate the change in the aviation-induced increase in water vapor due to the sublimation of cirrus ice crystals in the combustor only, and solid lines indicate the change when also accounting for the sublimation of cirrus ice mixed into the plume and the deposition on cirrus ice once the plume is ice-supersaturated.
The change due to the sublimation of cirrus ice within the combustor is roughly in agreement with the cirrus ice water content, reaching values of 0.5 gm−3 at 220 K (Fig. 2d). Assuming a pressure of 230 hPa the ice water mass mixing ratio can be estimated, and prescribing an air-to-fuel mixing factor of 70 kg-air (kg-fuel)−1 the cirrus ice water mass sublimated in the engine per mass of fuel burned can be shown to agree with the ratio of sublimated cirrus ice water mass and aviation-induced increase in water vapor (Fig. 3).
Temperature threshold for contrail formation
Even though the change in the water vapor concentration due to sublimation of or deposition on cirrus ice crystals often has only a small impact on the aviation-induced water vapor increase, it can result in a significant change in the Schmidt–Appleman threshold temperature, Tsa (Fig. 4c, e). On 26 April 2013 temperatures are usually between 4 and 10 K and between 1.5 and 5 K lower than the contrail formation threshold (Fig. 4a, b) on the main flight levels between 10.3 and 10.8 km and between 9.6 and 9.8 km, respectively. On 24 April, at height levels between 9.6 and 9.8 km, i.e., at a pressure of around 270 to 280 hPa, temperatures are mostly up to 5 K below the Schmidt–Appleman threshold temperature. The change in Tsa on 24 April is always very low, ranging between 0.04 and −0.01 K (Fig. 4e), consistent with the small impact of cirrus ice crystals on the aviation-induced water vapor increase (Fig. 3). On 26 April, the change in the threshold temperature is often low, but changes in Tsa can exceed values of 1.6 K in the lower and warmer atmospheric levels (between 9.6 and 9.8 km at ambient temperatures between 223 and 227 K) (Fig. 4d) and 2 K at higher atmospheric levels (between 10.3 and 10.8 km at ambient temperatures between 215 and 221 K) (Fig. 4c). Negative changes in the contrail formation threshold can occur but are very small and relatively seldom. On 26 April, large changes in the contrail formation threshold temperature are mainly associated with low ambient relative humidity (Fig. 4c, d). An ice saturation ratio of 1 within a cirrus cloud can often be indicative of a large ice crystal density that leads to an efficient relaxation of relative humidity to the saturation value. It is exactly in those areas that changes in Tsa are high. The high saturation ratios, i.e., ice saturation ratios of 1.4 and 1.3, indicate low ice crystal concentrations and ice water content and are likely to be the areas in which homogeneous and/or heterogeneous nucleation may occur within the next few time steps. In areas of high ice saturation ratio, the change in Tsa is negligible. In the following we will explore the reasons for large changes in Tsa in more detail.

Figure 4Probability distribution of the difference between the Schmidt–Appleman temperature threshold of contrail formation (Tsa) and the ambient temperature (Ta) at 11–11.5 (red), 10.3–10.8 (blue), 9.6–9.8 (green), and 8.6–9.2 km (purple) on 26 April (a) and 24 April (b). Difference between the Schmidt–Appleman temperature threshold (Tsa) and the ambient temperature as well as the change in Tsa due to the impact of cirrus ice crystals on 26 April 2013 at 17:00 at altitudes of 10.3 (∼ 250 hPa) to 10.8 km (∼ 225 hPa) (c) and at 9.6 (∼ 280 hPa) to 9.8 km (∼ 270 hPa) (d) as well as on 24 April 2013 at 06:00 at altitudes of 9.6 (∼ 280 hPa) to 9.8 km (∼ 270 hPa) (e). In all figures the difference of ambient air temperature and Tsa refers to the Tsa that is not modified due to the sublimation of pre-existing cirrus ice.
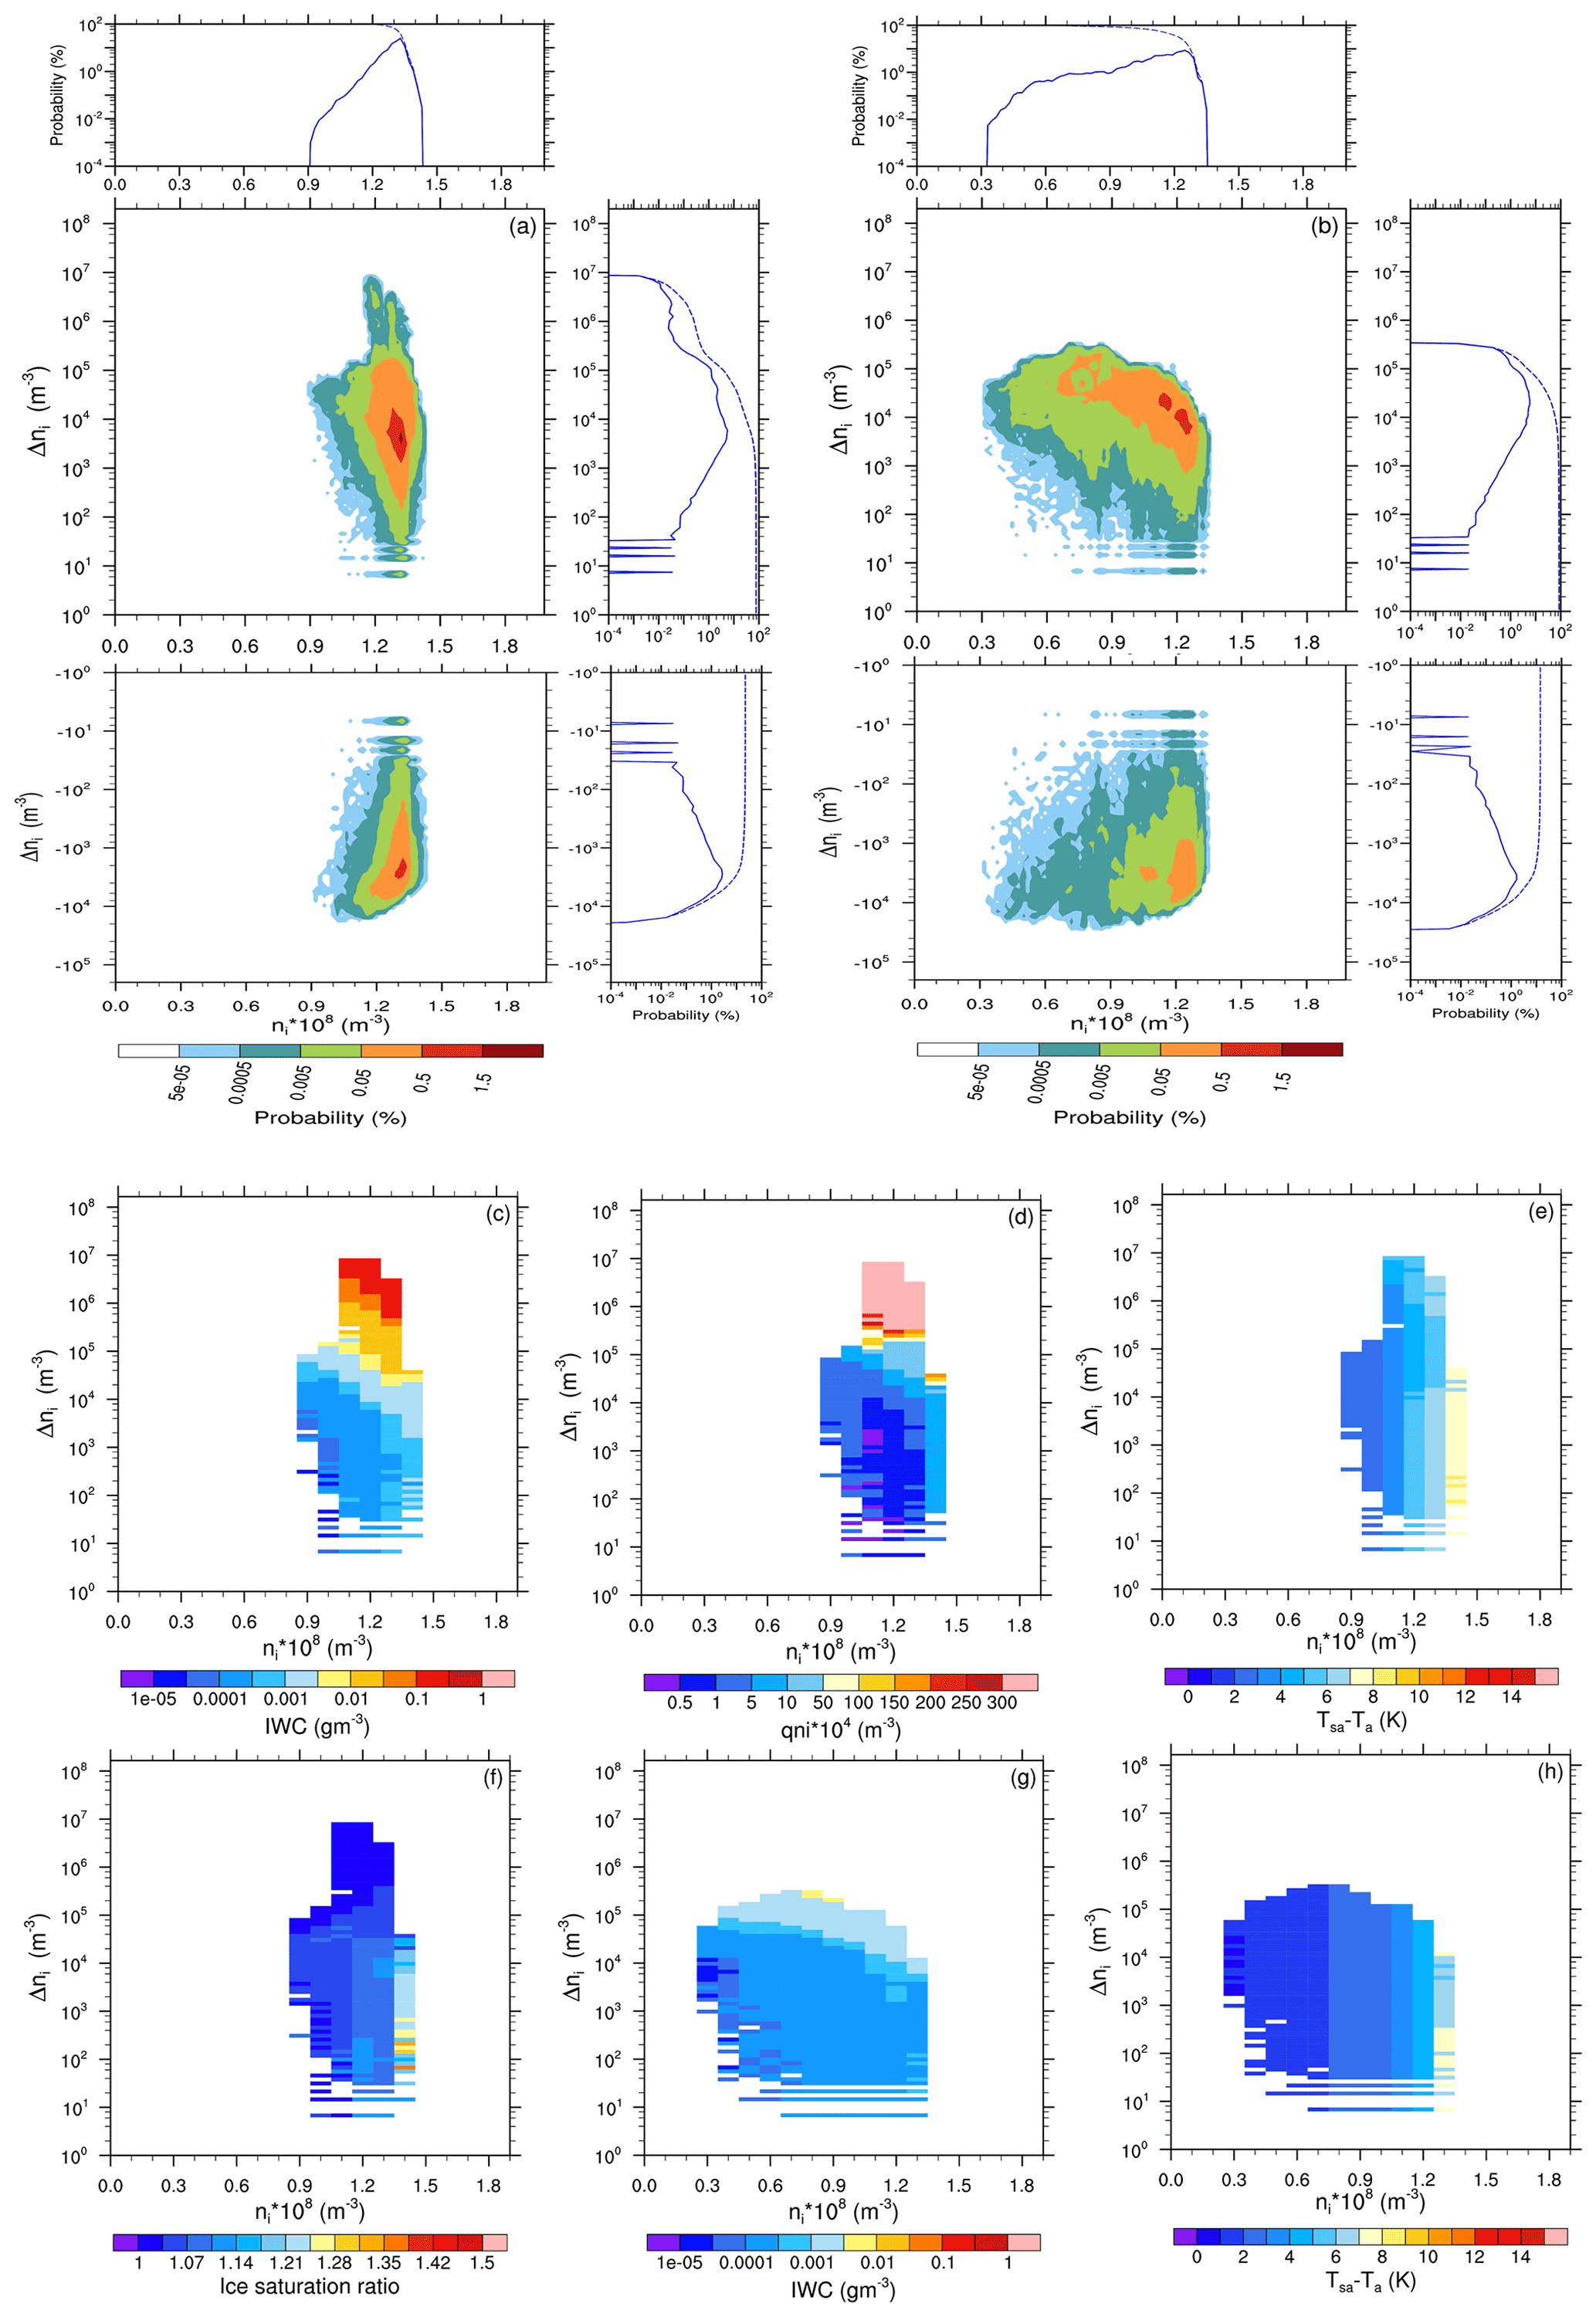
Figure 5Joint probability distribution of grid mean ice crystal number concentration due to contrail ice nucleation, ni, and its change due to the sublimation of and deposition on cirrus ice crystals, Δ ni, for current soot number emissions of 2.5×10¹⁵ (kg-fuel)−1 and for altitudes from 10.3 to 10.8 km (250 to 225 hPa) on (a) 26 April and (b) 24 April 2013. Additionally, the PDF of ice nucleation (solid) and the associated cumulative PDF (dashed) when neglecting the impact of natural cirrus ice crystals (top) and its change due to the sublimation of cirrus ice crystals (right) are shown. Mean cirrus cloud properties for the combination of ni and Δni (c, g) ice water content (IWC), (d) cirrus ice crystal number concentration qni, (e, g) the difference between the temperature formation threshold and ambient temperature, and (f) the ice saturation ratio. Panels (c), (d), (e), and (f) are for cirrus cloud properties on 26 April 2013 at 06:00, and panels (g) and (h) are for 24 April 2013 at 17:00. Mean ice cloud properties are shown only for the more common positive changes in ice nucleation. If all emitted soot particles formed an ice crystal, then the ice crystal number concentration within the grid box, ni, would reach approximately 1.5×10⁸ m−3. On the x axis, ni is the contrail ice nucleation when disregarding the impact of the cirrus ice crystals on nucleation.
Contrail ice nucleation
Large differences between the ambient temperature and the threshold temperature for contrail formation lead to high contrail ice nucleation rates (Fig. 1). Contrail ice nucleation within pre-existing cirrus leads to large perturbations in the ice crystal number concentration of the cirrus cloud field. On 24 April 2013 cirrus ice crystal number concentrations at 220 K reach values of about 105 m−3 with a probability of 0.01 % (Fig. 2b), while contrail ice nucleation leads to ice crystal number concentrations between 107 and 108 m−3 (Fig. 5b). On 26 April 2013 the frontal system and the associated large moisture transport into the upper troposphere lead to localized nucleation events so that cirrus ice crystal number concentrations up to 108 m−3, the same order of magnitude as the contrail perturbations (Fig. 5a), occur with a probability of 0.01 % (Fig. 2e). Ice crystal sizes grow fast and the smallest ice crystals have a diameter close to 10 µm. This means that approximately 5 min after contrail ice nucleation the perturbation to cirrus cloud properties is so high that it can only be matched by relatively fresh nucleation events. Even if contrail formation is happening close to the temperature threshold, contrail formation can significantly alter cirrus properties.
Close to the contrail formation threshold (within ∼ 5 K) the number of ice crystals increases steeply with increasing distance from the threshold conditions (Fig. 1). This means that even if temperatures are close to the temperature threshold for contrail formation they can have a significant impact on contrail ice nucleation, causing a systematic increase in ice crystal numbers. At temperatures further away from the formation threshold the increase in ice nucleation can be significant as well. Above 11 km, ambient temperatures are always more than 5 K below the contrail formation threshold (Fig. 4a, b) and nucleation rates are often high so that a change in the formation threshold would often have relatively little impact on nucleation rates.
At typical cruise levels between 10.3 and 10.8 km, the ambient temperature often lies well below and occasionally close to the contrail formation threshold. Wherever the difference between ambient temperatures and the contrail formation threshold temperature is small, few ice crystals nucleate (Figs. 1, 5e, h, 6e, h). If all emitted soot particles formed an ice crystal, then the grid box mean ice crystal number concentration would reach approximately 1.5×10⁸ m−3. At typical cruise levels contrail ice nucleation commonly leads to grid box mean ice crystal concentrations of 1.2×10⁸ and 1.3×10⁸ m−3on 24 (Fig. 5b) and 26 April 2013 (Fig. 5a), respectively, but on 24 April significantly lower nucleation rates are also fairly typical. The probability of changes in the contrail ice crystal concentration, Δ ni, is largest for values of Δ ni around 104 m−3 when analyzing all cirrus with IWC larger than 10−11 kg m−3, but changes on 26 April can reach values close to 107 m−3, which is close to 10 % of the contrail ice crystal concentration when disregarding the impact of cirrus ice crystals. When considering only cirrus with IWC >10−5 kg m−3, the probability of changes in the contrail ice crystal concentration, Δ ni, is largest for values of Δ ni around 105 m−3. Changes in the ice nucleation can also be negative due the effect of sublimation and deposition on cirrus ice crystals mixed into the aircraft plume. We estimate that in about 22 % and 14 % of cloudy grid boxes nucleation rates are reduced on 26 and 24 April, respectively. Contrail ice number concentrations are reduced by up to 104 m−3, which is several orders of magnitude smaller than the maximum possible increases in contrail ice number concentration but a large relative decrease given that on 24 April ice crystal number concentrations reach roughly 105 m−3 at about 220 K. In the following we will mainly discuss the increases in ice nucleation due to the presence of cirrus ice crystals.
At around 9.7 km of height the ambient temperature lies mostly within 5 K of the contrail formation threshold (Fig. 4a, b), and contrail ice nucleation leads to ice number concentrations that typically lie between 4.0×10⁷ and 1.1×10⁸ m−3 on 26 April (Fig. 6a) and between close to 0 and 1.3×10⁸ m−3 on 24 April (Fig. 6b). Absolute and relative changes in contrail ice nucleation due to the impact of cirrus ice crystals sublimated in the combustor or mixed into the plume are significantly larger than at higher flight levels (Fig. 6a, b) because the cirrus IWC is on average significantly higher and the atmosphere is generally closer to the contrail formation threshold (Figs. 5c, e, 6c, e and 2a, d). When analyzing all cirrus with IWC larger than 10−11 kg m−3, the probability for changes in the ice number concentrations is highest for values ranging between 104 and 106 m−3, but changes larger than 107 m−3 can also occur on 26 April that are significantly larger than on the main cruise level. When considering only cirrus with IWC larger than 10−5 kg m−3, changes in ice number concentrations are always larger than 105 m−3 except in situations very close to the formation threshold. Negative changes in contrail ice number concentrations due the impact of cirrus ice crystals are less common than on the main flight level and can be found in about 7 % of the grid boxes on both 26 and 24 April. This means that the change in contrail ice nucleation due to cirrus ice crystals can induce a change in the ice nucleation of the same order of magnitude as the contrail ice nucleation when neglecting the impact of cirrus ice crystals. On 24 April the change due to the impact of cirrus ice crystals remains significantly lower, in line with the lower ice water content on that day.
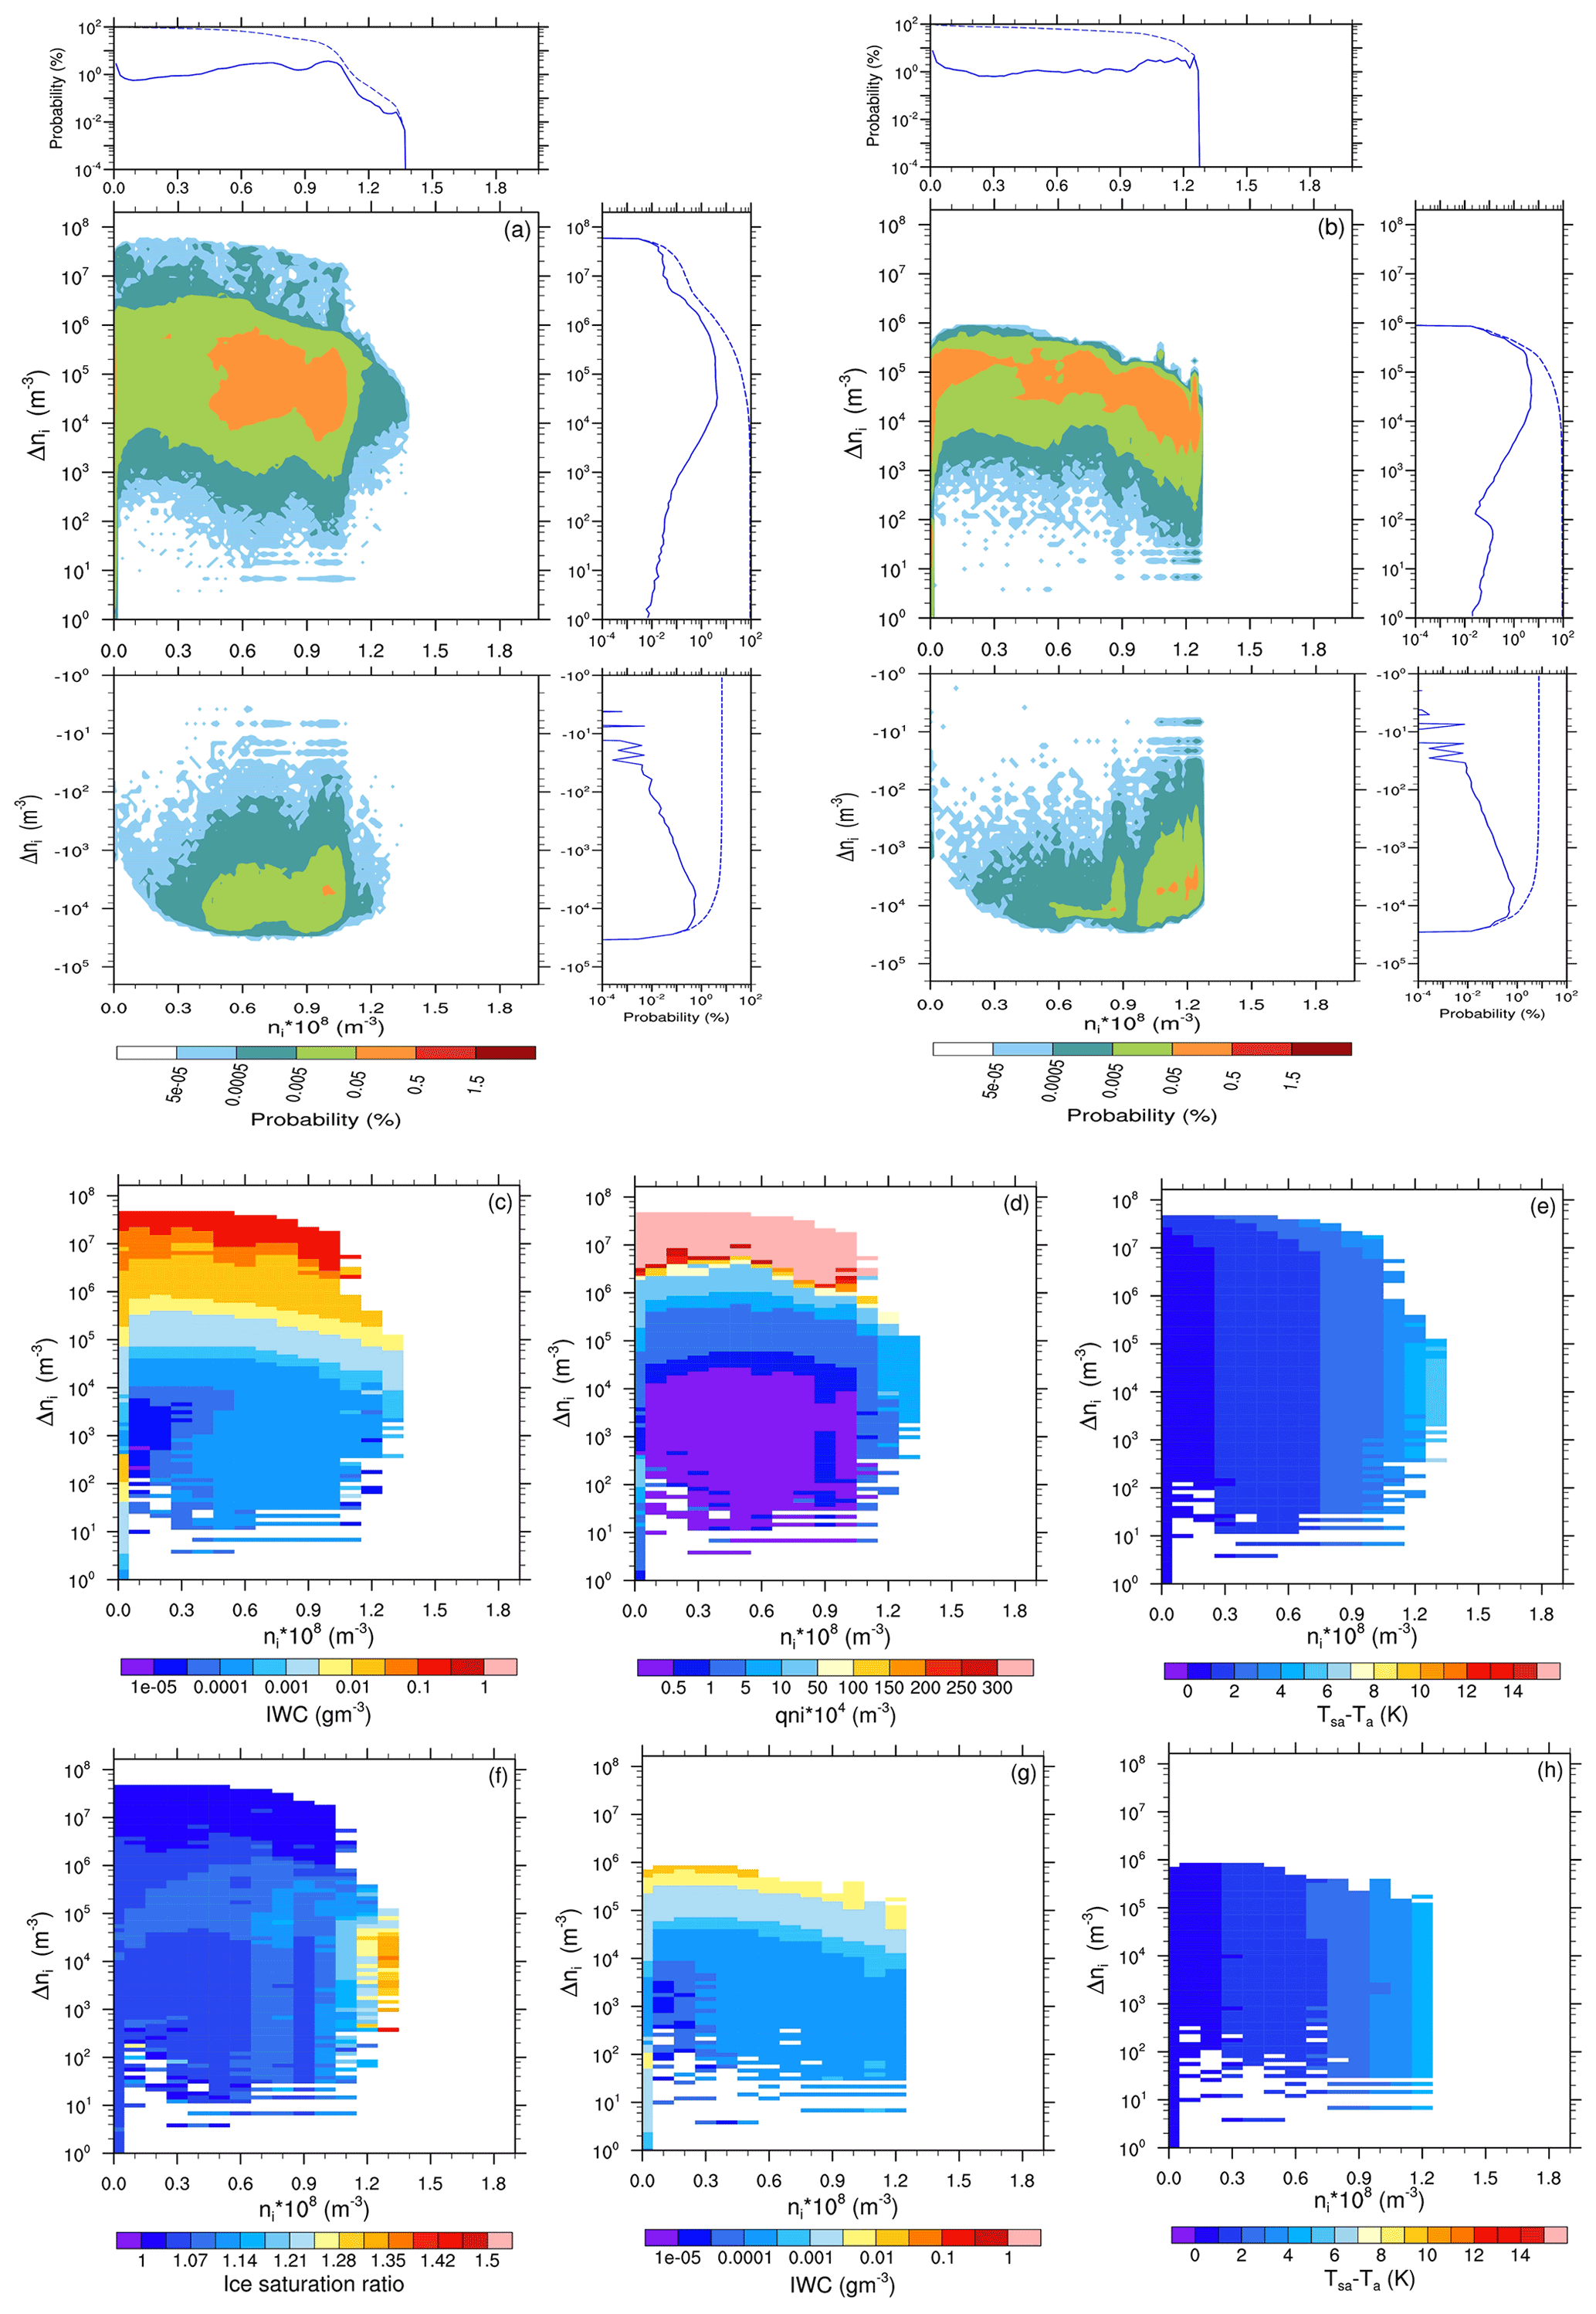
On both 26 and 24 April 2013 large changes in the contrail ice number concentration are connected to large cirrus ice water content (Figs. 5c and 6c), a high number concentration of cirrus ice crystals (Figs. 5d and 6d), and low ice saturation ratios (Figs. 5f and 6f). Large-scale lifting appears to lead to the freezing of water droplets and/or to homogeneous or heterogeneous nucleation events. The resulting large ice crystal number concentrations lead to an efficient relaxation of ice supersaturation to saturation values. In areas of lower ice crystal number concentrations, ice supersaturation can be larger (Figs. 5d, f and 6d, f). The larger ice saturation ratio in those areas leads to high contrail ice nucleation rates and low corrections of this nucleation rate. On 24 April 2013, contrail ice nucleation is lower than on 26 April due to the higher temperatures (Fig. 5h) and the change in ice nucleation is lower due to the cirrus clouds containing less ice water (Figs. 5g and 2) and fewer ice crystals.
Even relatively low contrail ice nucleation rates lead to ice crystal number concentrations that are high when compared to naturally formed cirrus clouds changing cirrus properties systematically.
Large changes in contrail ice nucleation caused by the presence of cirrus ice water are uncommon in our analysis. The probability of large change is dependent on the minimum ice water content that we use as a cloud mask (10−11 kg m−3), which means that we are including subvisible cirrus in our analysis. The probability of large changes in ice nucleation is increased when analyzing only cirrus clouds that have an IWC of at least 10−5 kg m−3. Nevertheless, large changes in ice nucleation remain uncommon.
3.3 Impact of the pre-existing cirrus on ice crystal loss during the vortex phase
Here we analyze the contrail ice crystal loss during the vortex phase and the impact of pre-existing cirrus ice crystals that get mixed into the plume before vortex descent on the ice crystal loss. Generally, we expect a low survival fraction since the saturation ratio within cirrus is often close to 1, in particular if cirrus ice crystal concentrations are high. As described in Sect. 2.2.4, cirrus ice crystals can have an impact on contrail ice crystal survival due to the competition of cirrus and contrail ice crystals for water vapor deposition. The lower the water vapor mass that is deposited on contrail ice crystals, the faster the contrail ice crystals may sublimate completely during vortex descent. But, the sublimation of cirrus ice crystals in the mostly ice-subsaturated descending vortices can increase the relative humidity and thereby the contrail ice crystal survival fraction. In the following we calculate the survival fraction for contrails that form more than 5 K below the temperature threshold depending on the number of nucleated ice crystals, which is itself dependent on the presence of cirrus ice crystals. We test the sensitivity of our results by varying the soot number emission index and the static stability, assuming an atmospheric stability of 0.012 s−1, which is a value that is slightly higher than the average in the upper troposphere, to the time at which the vortex starts descending.
On 24 April 2013, it is mainly the atmospheric levels above 11 km and a few hundred meters below where the temperature is more than 5 K below the contrail formation threshold (Fig. 4b). At those levels the fraction of ice crystals surviving the vortex phase, when neglecting the impact of natural cirrus ice crystals, is very low and its change caused by the presence of natural cirrus ice crystals is practically zero (not shown). On 26 April, the temperature at the atmospheric levels above about 10 km is more than 5 K below the contrail formation threshold (Fig. 4a). Ice supersaturation and cirrus ice water content (Fig. 2) are significantly larger than on 24 April, and therefore ice crystal survival fractions and their change due to the impact of cirrus ice crystals are also larger (Fig. 7b). Nevertheless, the probability of low survival fractions of up to 10 % is highest, but survival fractions of nearly 75 % can also be found. In about 1 % of grid boxes survival fractions exceed 30 %. The impact of cirrus ice crystals on the survival fractions is very low, very seldom surpassing values of only 0.05 % or 0.1 %.
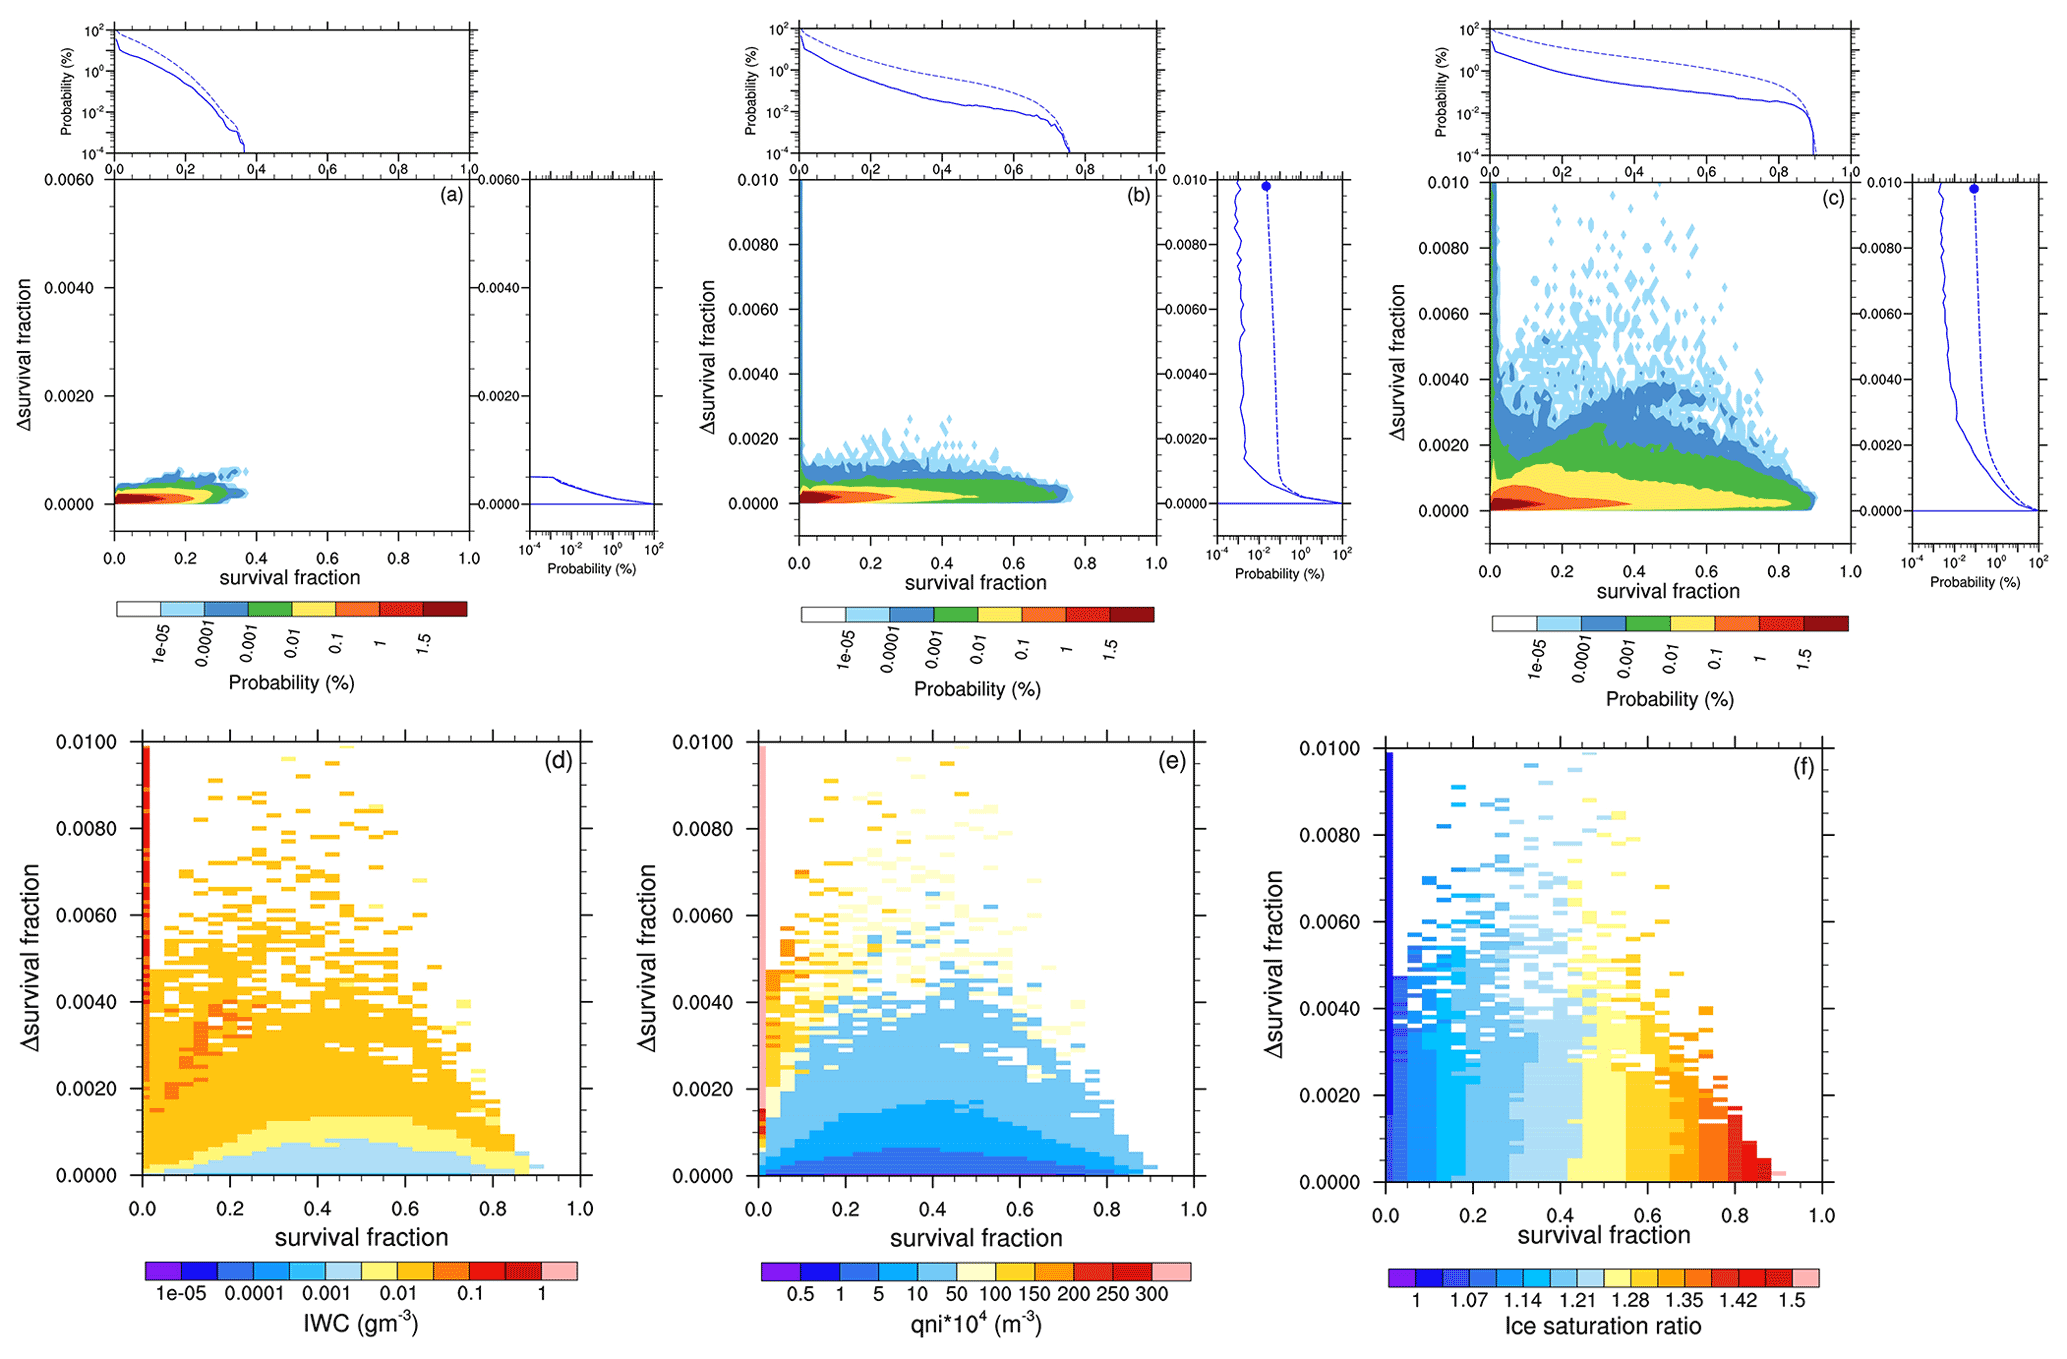
Figure 7Joint probability distribution of contrail ice crystal survival fraction during the vortex phase when neglecting the impact of cirrus ice crystals (SF) and its change due to the presence of cirrus ice crystals (ΔSF) for (a) 24 April for 80 % reduced soot number emissions and for 26 April 2013 for (b) current soot number emissions of 2.5×10¹⁵ (kg-fuel)−1 as well as (c) 80 % reduced soot number emissions. Furthermore, cirrus properties for combinations of SF and ΔSF for 26 April (d) ice water content (IWC), (e) cirrus ice crystal number concentration (qni), and (f) in-cloud ice saturation ratio are shown. In (a)–(c) the PDF of the fraction of surviving ice crystals (solid) and the associated cumulative PDF (dashed) when neglecting the impact of natural cirrus ice crystals (top) and its change due to the presence of cirrus ice crystals (right) are additionally shown. The dot in the probability distribution of the change in survival fraction (c, right) indicates the probability of changes in the survival fraction that are larger than 1 %. Analysis was restricted to areas where ambient temperature is at least 5 K below the formation threshold temperature. A Brunt–Väisälä frequency of 0.012 s−1 (strong stability) has been assumed for all cases.
A reduction in soot number emissions leads to fewer ice crystals nucleating within the aircraft plume (Kärcher et al., 2015) so that contrail (and cirrus) ice crystals grow larger, leading to a larger fraction of contrail ice crystals surviving the vortex descent (Unterstrasser, 2016). This explains the increase in the probability of high survival fractions and in the maximum survival fraction on 26 April for the decrease in soot number emissions by 80 % (Fig. 7c). In 1 % of grid boxes survival fractions exceed 65 %, and in 10 % of grid boxes survival fractions exceed 25 %–30 %. The decrease in the soot number emissions affects the change in the survival fraction due to the natural cirrus ice crystals. The change in the ice crystal survival fraction increases but nearly always stays below 0.5 %. On 24 April 2013, survival fractions maximally reach 40 %, and in only 1 % of grid boxes do more than 20 % of ice crystals survive for 80 % reduced soot emissions (Fig. 7a) due to the low ambient ice supersaturation. The change in the survival fraction caused by the presence of natural cirrus ice crystals is close to zero (Fig. 7a) due to the low IWC within the very thin cirrus (Fig. 2). Therefore, we do not show any further analysis for 24 April.
The atmospheric stability determines the maximum vertical displacement of the wake vortices, with high stability limiting the descent of the vortex. A low stability leads to a large descent of the vortex and therefore to a large decrease in relative humidity within the vortex and a decreased ice crystal survival fraction. We find a slightly lower probability of high survival fractions of contrail ice crystals and an associated very slight increase in the survival fraction due to the presence of natural cirrus ice crystals when lowering the upper tropospheric Brunt–Väisälä frequency to a value of 0.005 s−1 (not shown).
Since, on the one hand, the time until vortex descent is not well-defined and, on the other hand, relative humidity may be such that cirrus ice crystals could grow at the cost of contrail ice crystals during the first few seconds of vortex descent, we vary the growth time period before vortex descent (19s instead of 9 s) in a sensitivity simulation. We hardly find a difference in the resulting impact of cirrus ice crystals on contrail ice survival. Deposition and sublimation rates close to ice saturation are very small and cirrus ice crystal concentrations are usually not large enough to cause substantial sublimation of contrail ice crystals.
The strength of the impact of natural cirrus ice crystals on the fraction of contrail ice crystals surviving the vortex phase additionally depends on the cirrus ice crystal number concentration and ice crystal sizes (Eq. 5). Figure 7f shows the known dependence of contrail ice crystal survival on the ambient (in-cloud) saturation ratio (see Sect. 2.2.3). If ambient air is close to saturated with respect to ice (saturation ratio close to 1.0) then the contrail ice crystals have only a low ice water mass, and adiabatic warming in the descending vortices will lead to low survival fractions so that only the ice crystals within the secondary vortex may survive. The pre-existing cirrus has the largest impact on the survival of contrail ice crystals within the vortex phase if the cirrus ice water content and the ice crystal number concentrations are relatively high (Sect. 2.2.4; Fig. 7d, e) and resulting cirrus ice crystal sizes are small (not shown). Large cirrus ice crystal number concentrations lead, on the one hand, to smaller contrail ice crystals before vortex descent and, on the other hand, to an increase in the cirrus ice sublimation during vortex descend. At the time when the ice crystal growth rates are very high, which is right after nucleation, cirrus ice crystal numbers within the plume are much smaller than shortly before and during vortex descent. Therefore, a large number of cirrus ice crystals can often lead to an increase in the contrail ice crystal survival rate. Large cirrus ice crystal number concentrations are commonly connected to relative humidity that is relatively close to ice saturation. Therefore, areas with high cirrus ice crystal number concentrations are often areas where the contrail ice crystal survival fraction (when neglecting the impact of cirrus ice crystals) is relatively low (Fig. 7d). Once saturation ratios are very close to 1 and survival rates are close to zero the estimates have a high uncertainty. Survival fractions of more than 50 %, when neglecting the impact of cirrus ice, are usually connected to ice saturation ratios above around 1.25. In areas with a survival fraction around 50 %, high number concentrations of small cirrus ice crystals and a large IWC only occasionally lead to changes in the survival fraction of more than 0.2 %.
When contrails form close to the contrail formation threshold (within 5 K), large survival fractions of contrail ice crystals, when neglecting the impact of cirrus ice crystals, are much more common than when contrails form at temperatures far below the contrail formation threshold (not shown), with survival fractions larger than 70 % in about 10 % of the grid boxes. High survival fractions are found in areas where the in-cloud ice saturation ratio is high and/or where contrail formation occurs close to the formation threshold so that the number of nucleated contrail ice crystals is very low (not shown). Connected to the low number of contrail ice crystals, the ice crystals are larger and the survival fraction within the vortex phase is increased, similar to the increased survival fractions when reducing soot number emissions. The changes in the survival fraction due to the impact of cirrus ice crystals can be significantly larger than in the cases close to the formation threshold, but the uncertainty of these estimates is also significantly larger.
The impact of pre-existing cirrus on the contrail formation criterion and on ice crystal survival in the vortex phase has been discussed before by Gierens (2012). In agreement with Gierens (2012) we find that the sublimation of the ice crystals that get sucked into the aircraft's engine increases plume relative humidity only slightly. The impact of ice crystal sublimation within the engine on the aviation-induced change in humidity in the aircraft plume amounts to maximally a few percent in the case of medium to thick cirrus and to less than 1 % in the case of very thin cirrus. This agrees with the “order of percent” estimate of Gierens (2012). When additionally considering the impact of the cirrus ice crystals that are mixed into the plume after emission, the sublimation, as long as the plume is ice-subsaturated, and deposition, when the plume is supersaturated, increase the aviation-induced portion of the water vapor content on average. Most of the time sublimation exceeds deposition on entrained cirrus ice crystals. Changes in the aviation-induced water vapor content of the plume due to the impact of cirrus ice crystals 1 s after emission can be maximally 10 %–20 %. Our estimate of the impact of cirrus on the aviation-induced changes in water vapor is higher than the estimate of Gierens (2012) since he did not consider the additional impact of mixed-in cirrus ice crystals.
Consistent with us estimating a larger plume moistening effect due to the pre-existing cirrus ice crystals, our estimate of the impact on the contrail formation threshold is also larger than in Gierens (2012). We estimate that the increase in the plume relative humidity leads to changes in the contrail formation threshold that can reach values up to 1.5–2 K in specific atmospheric conditions as opposed to Gierens estimating that cirrus ice crystals have no significant impact on the contrail formation threshold. Nevertheless, we agree that the presence of cirrus ice crystals seldom impacts the contrail formation criterion and contrail ice nucleation significantly. Furthermore, we agree with Gierens (2012) that the use of alternative fuels and the associated increase in water vapor emissions, in particular the associated decrease in soot number emissions, have significant implications for ice nucleation, which is why they are regarded as an important mitigation method (Burkhardt et al., 2018).
Ice nucleation is estimated to be significantly changed due to the impact of cirrus ice crystals when the cirrus IWC and ice crystal number concentration are large. Changes can be positive (increasing contrail ice nucleation) or negative (decreasing contrail ice nucleation) with positive changes significantly larger and more common. While for far-from-threshold cases changes can amount to around 10 % of the maximum contrail ice crystal number concentration, at temperatures closer to the formation threshold, contrail ice nucleation can often be lower and changes in contrail ice nucleation due to the impact of cirrus ice crystals larger because the IWC is usually larger. We conclude that the sublimation of cirrus ice crystals in the engine and the impact of cirrus ice crystals mixed into the plume can have a significant impact on contrail formation in specific atmospheric conditions, while most of the time this impact is negligible. This sensitivity was not studied by Gierens (2012).
When analyzing the impact of cirrus ice crystals on the survival of contrail ice crystals, we find that, for current-day soot emissions, survival fractions are low and changes in the survival fraction due to the impact of cirrus ice crystals may be of the order of only a few tenths of a percent when contrails form more than 5 K below the formation threshold in a stably stratified atmosphere. Survival rates are largest when supersaturation is high or when only few contrail ice crystals form. Changes in the survival rate due to the impact of cirrus ice crystals are largest in cirrus clouds that comprise large number concentrations of small cirrus ice crystals and a large ice water content or in cases of low contrail ice nucleation. When reductions in soot number emissions are introduced, e.g., caused by the introduction of alternative fuels, the larger contrail ice crystal sizes lead to larger survival fractions and to a larger change in the survival fraction due to the presence of cirrus ice crystals because contrail ice crystals are larger and the difference between the contrail and cirrus ice crystal sizes gets smaller. Even for 80 % reduced soot number emissions changes in the survival fraction of ice crystals are very low (a few tenths of a percent). When contrail formation happens close to the formation threshold, the change in the ice crystal loss can be larger than in far-from-threshold cases, but the probability of those large changes is very low, and furthermore the uncertainty in those estimates is high. Despite us using a very different measure for estimating the impact of cirrus ice crystals on the contrail ice crystal survival fraction than Gierens (2012), we agree that the impact is negligible.
Contrail formation constitutes a significant perturbation to cirrus cloudiness. Until now it is mainly the impact of contrail formation in cloud-free air that has been studied. Recently, satellite observations of cirrus perturbations caused by contrail formation within cirrus, resulting in an increase in cirrus optical depth (Tesche et al., 2016), have led to increased interest in the topic. Here we present a contrail scheme consisting of the estimation of contrail formation conditions and parameterizations for contrail ice nucleation as well as contrail ice crystal loss in the vortex phase within ICON-LEM (Zängl et al., 2015). We adapt the scheme in order to study contrail formation within cirrus and study whether contrail formation is modified due to the impact of pre-existing cirrus ice crystals.
We find that contrail ice nucleation within cirrus often leads to increases in local ice crystal number concentrations by a few orders of magnitude even if survival rates of contrail ice crystals are often low. The presence of pre-existing cirrus ice crystals can lead to an increase in the contrail formation threshold temperature. Therefore, contrails may form and locally cause relatively high perturbations in cirrus ice crystal number concentrations when, judging only from the relative humidity, no contrails would form. In the case of cirrus with a large IWC and at least a medium to high ice crystal number concentration, such as cirrus with properties representative of medium thick in situ formed cirrus or fast-rising liquid-origin cirrus (Krämer et al., 2020), contrail formation, in particular the contrail formation threshold and contrail ice nucleation, can be noticeably modified. Positive and negative changes in ice crystal number concentrations are possible with positive changes significantly larger and more common. In large parts of the cloud field cirrus properties are such that the pre-existing cirrus ice crystals have a negligible impact on the contrail formation processes. We also find that the impact of pre-existing cirrus ice crystals on contrail ice crystal loss in the vortex phase is negligible.
The synoptic situation in which the impact of cirrus properties on contrail formation is large, e.g., the outflow of a warm conveyor belt connected to frontal activity and the associated steady supply of moisture in the lifting zones, is exactly the synoptic situation in which contrails that form in cloud-free air have a long lifetime and a large climate impact. The impact of cirrus ice crystals on contrail formation may therefore be expected to have a significant influence on cirrus optical depth, radiative fluxes, and cirrus lifetimes. Our simulations do not allow the estimation of the climate impact of cirrus perturbations caused by contrail formation, which depends on the optical depth perturbation and on the optical depth of the undisturbed cloud. Among others, Meerkötter et al. (1999) and Markowicz and Witek (2011) discuss the dependence of radiative forcing on optical depth and show a decrease in contrail warming once a certain optical depth is exceeded. Therefore, a large number of contrail ice crystals after the vortex phase may lead to enhanced warming in an optically thin cloud and to cooling relative to the undisturbed cloud in an optically thicker cloud, with the overall impact depending on the balance of the two effects. Since corrections in ice nucleation are large in clouds with large ice water content, which are likely connected to large optical depth, we speculate that disregarding the impact of cirrus on contrail formation may possibly underestimate the cooling of the contrail perturbations within optically thicker clouds. It should be noted that the cirrus optical depth at which a further increase in optical depth, caused by contrail formation, leads to a cooling is dependent on the cirrus ice crystal habit.
Many uncertainties remain in our estimates that are mainly caused by the simple two-moment microphysical scheme of ICON-LEM and by the assumptions made in the parameterizations that we are using. Since we do not resolve the size distribution of ice crystals we can only capture the differences in the diffusional growth of contrail or cirrus ice crystals depending on their mean ice crystal sizes. This means that within ICON-LEM we cannot calculate how many smaller cirrus ice crystals may be lost within the subsaturated plume or how many of the smallest contrail ice crystals get lost in the growth phase after nucleation due to the competition with much larger cirrus ice crystals. We also do not have any information on ice crystal shapes, which would be important for estimating diffusional growth, in particular when cirrus ice crystal sizes are large. For small cirrus and contrail ice crystals the assumption of sphericity may be reasonably good. Furthermore, the parameterization for ice nucleation of Kärcher et al. (2015) assumes that all contrail ice crystals are formed at the same time and therefore does not consider successive ice nucleation, which may have a significant impact on the temporal development of the plume relative humidity. Successive nucleation may result from inhomogeneities of the plume, which leads to reduction, in particular when soot number emission indices are very large, and from the variability in aerosol properties, which are themselves highly uncertain. Estimates of soot number emissions and ambient aerosol concentrations, their size distribution, chemical composition, and hygroscopicity are highly variable and uncertain. Within cirrus, ambient aerosols can be expected to have a similar impact on contrail formation as in cloud-free air, since on the one hand fewer aerosols are entrained and on the other hand plume relative humidity can very occasionally be higher than what would be observed in plumes in cloud-free air. Furthermore, contrail formation close to the formation threshold (within about 1 K) is connected to a large uncertainty since details in the plume development may have a large impact, leading to varying contrail ice crystal numbers resulting from slightly different plume evolutions (Lewellen, 2020) with cirrus ice crystals exerting a systematic influence on contrail ice nucleation. The parameterization of ice crystal survival is connected to a large uncertainty in cases of very low AEIi. Furthermore, we assume a constant plume subsaturation within the descending vortex in order to calculate the competition between cirrus and contrail ice crystals and calculate contrail ice crystal survival after adjusting the plume water vapor content, consistent with the impact of the cirrus ice crystals on plume water vapor content. Due to the large number of uncertainties we would welcome studies using LES with a complex microphysical scheme as well as more observational data, in particular on ambient and emitted aerosol properties that could shed more light on these uncertainties.
It is clear that the large perturbations induced by contrail formation within natural cirrus can lead to large modifications of cirrus microphysical properties. It would be important to study the life cycle of these disturbances and to estimate the associated changes in optical properties and, consequently, in radiative transfer that need to be included in aviation climate change assessments (Lee et al., 2021). Our study makes a first step in that direction by devising a contrail cirrus scheme with which contrail formation within clouds and their impact on cirrus properties and radiative forcing can be studied in models that do not resolve the plume processes. A complete picture of the climate impact of air traffic, including all the climate forcing components together with their uncertainties, is also crucially necessary for the evaluation of mitigation options that require calculating the trade-offs between different climate forcing components. Finally, our work allows improving the interpretation of cirrus observational data from flight campaigns and remote sensing and adds complexity to discussions about the importance of different ice nucleation pathways for cirrus properties. Contrail-induced perturbations in cirrus properties may be important when evaluating models with in situ measurements.
The cirrus ice crystals, which are entrained into the plume during the rapid mixing of plume and ambient air immediately after emission, sublimate in the young, ice-subsaturated plume. At the beginning right after emission, the sublimation rate of an entrained ice crystal is large since the plume's relative humidity is low and temperature very high but the number of mixed in ice crystals is low. Due to rapid mixing of the plume, the plume's temperature decreases and relative humidity and cirrus ice crystal concentrations increase. Close to ice saturation the sublimation rate is low, while the number of entrained cirrus ice crystals is large. Once the plume is ice-supersaturated, before aerosol activation, water vapor deposits on the cirrus ice crystals, reducing the fast increase in the plume ice supersaturation. The entrainment of ice crystals can be calculated using Eq. (18) of Kärcher et al. (2015) with the entrainment rate of Kärcher (1999). The entrainment rate was shown by Kärcher (1999) to be a good fit to LES from Gerz et al. (1998) after ∼ 0.01 s.
Table A1Sublimation of cirrus ice crystals and deposition on cirrus ice crystals mixed into a homogeneous aircraft plume after emission (starting at 0.01 s after emission) and before ice nucleation. An engine exit temperature of 580 K and an air-to-fuel ratio of N0=75 are prescribed, and a cirrus ice crystal number concentration of m−3 and ice water content of 10−5 kg m−3 are specified. The contrail formation threshold is 226.2 K. In order to estimate deposition on cirrus ice crystals from the deposition rate at time tad we assume a reduction in cirrus ice crystal numbers due to the prior sublimation of 20 %.
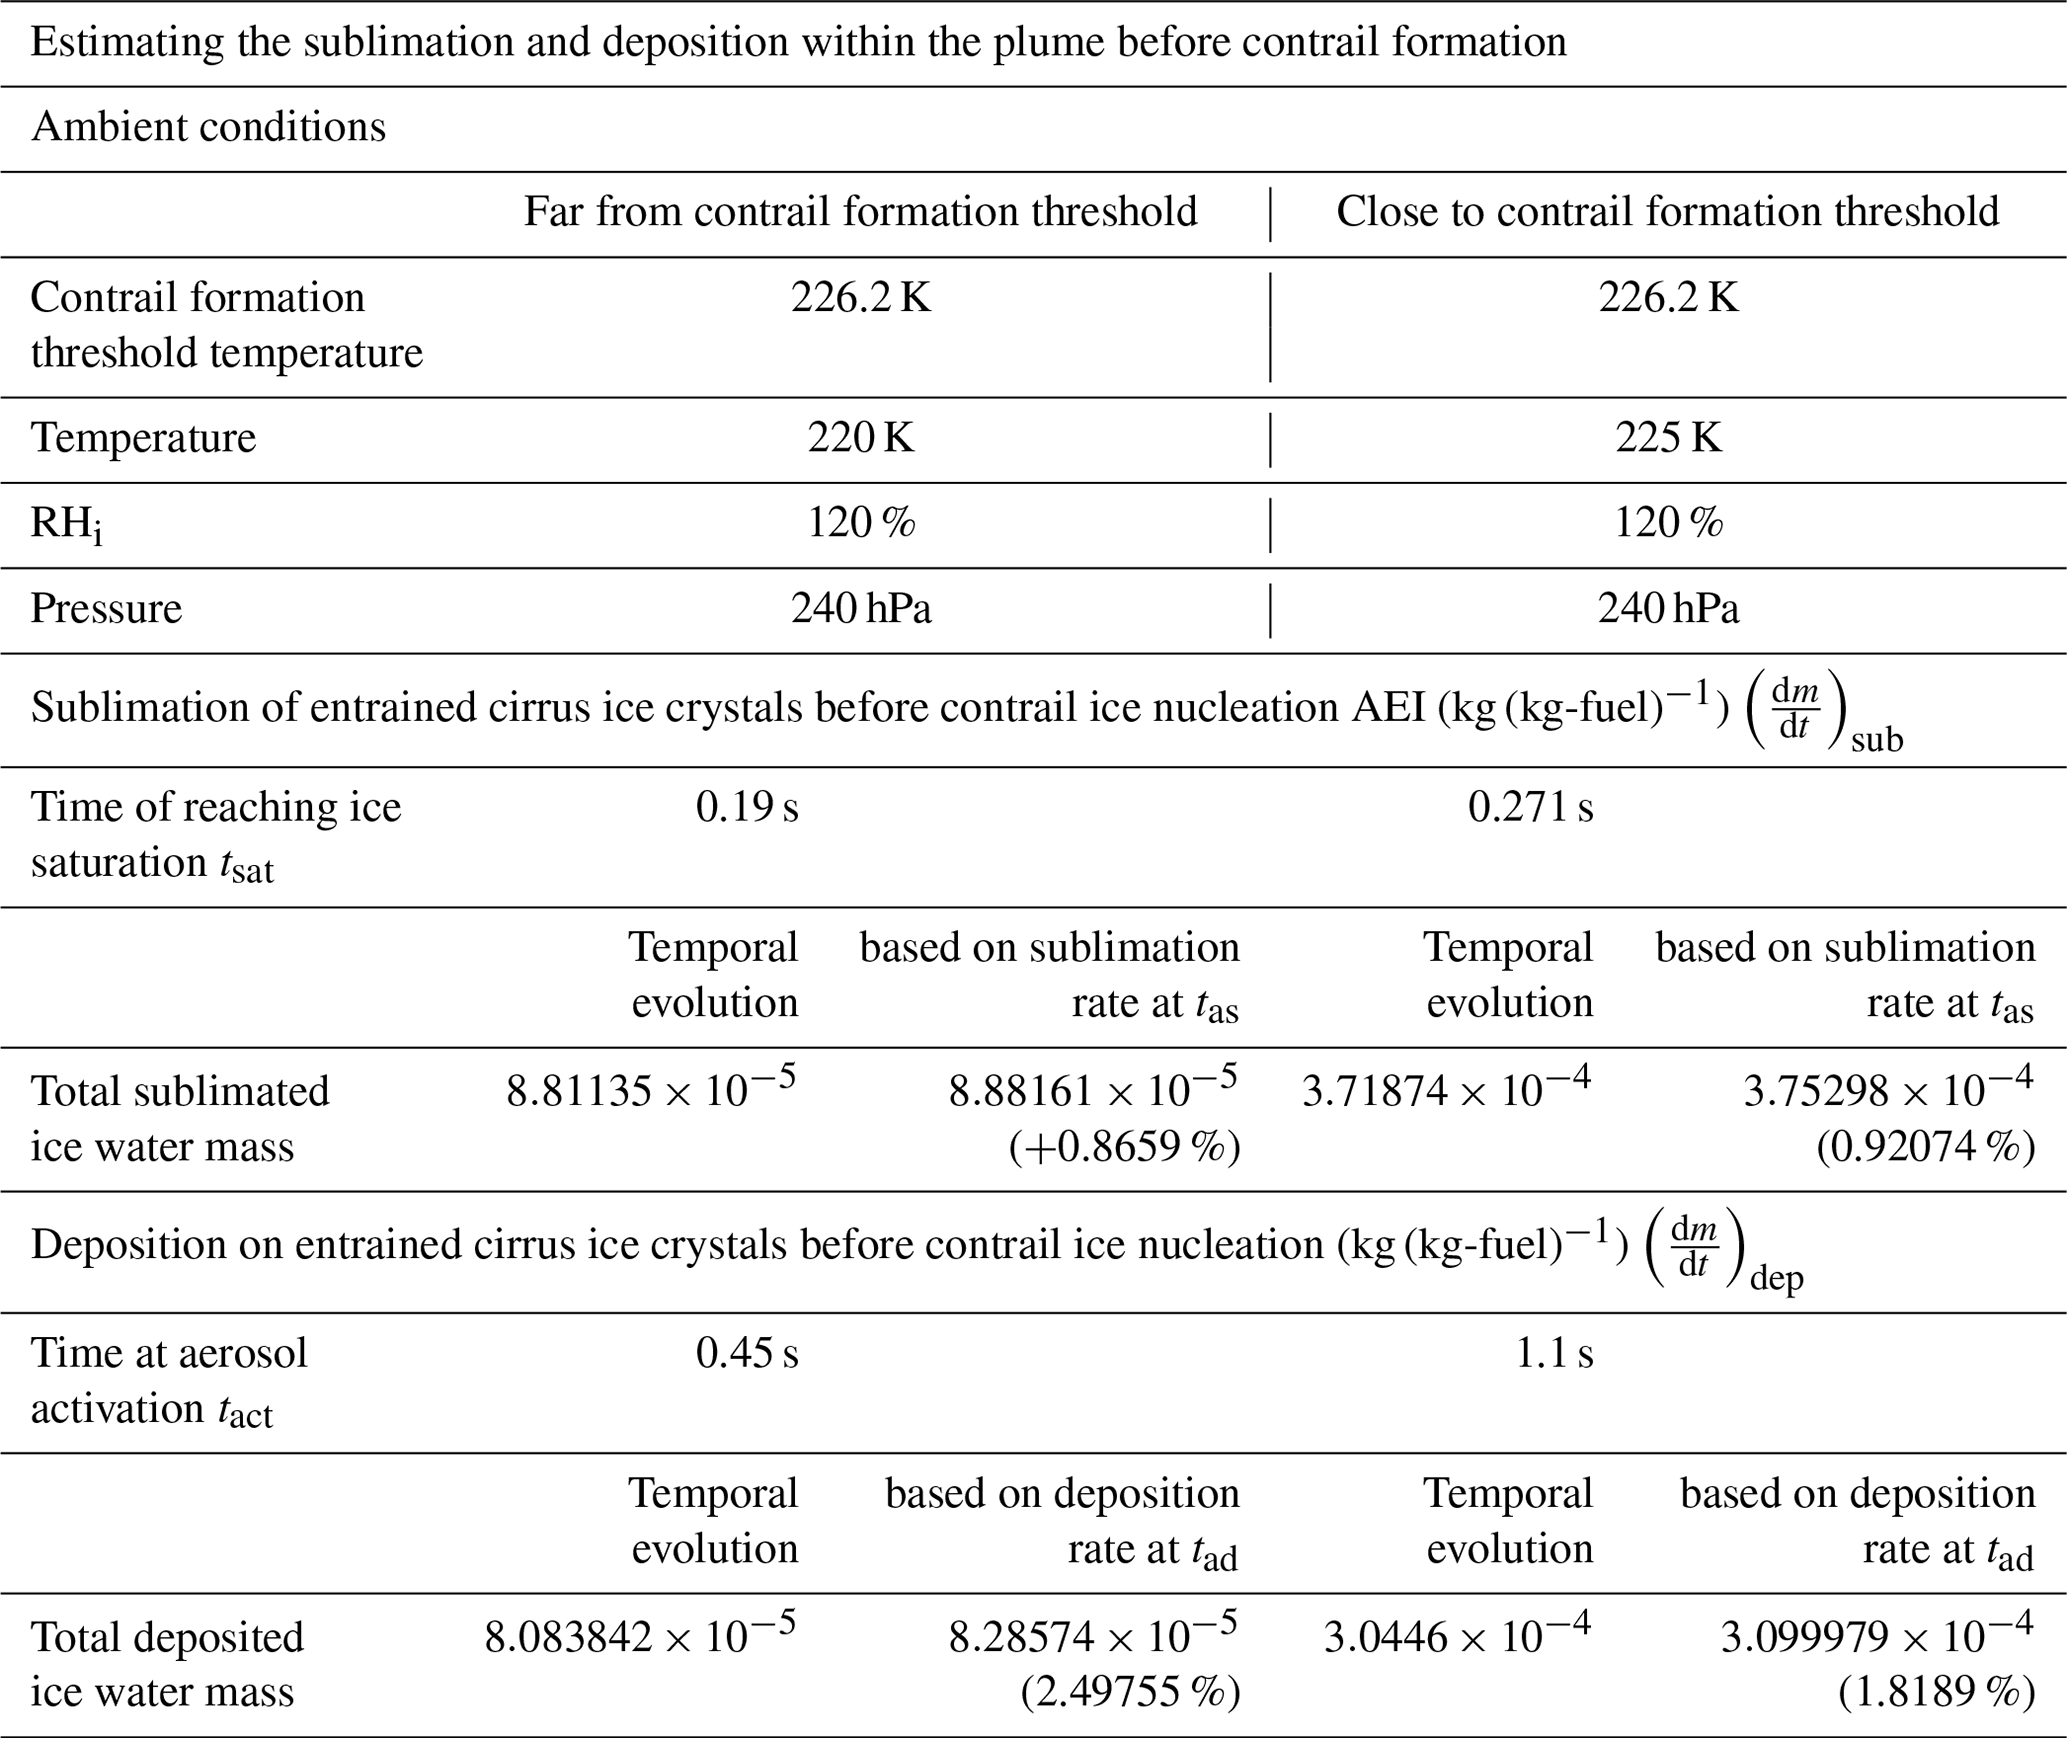
The rate of sublimation and deposition on an ice crystal can be calculated using the diffusional growth equation given in, e.g., Pruppacher and Klett (1997) and Lewellen (2012) assuming spherical ice crystals:
where r is the radius of the ice crystal, S is the ice supersaturation ratio, D the diffusivity of water vapor, K the thermal conductivity of air, Ls is the latent heat of sublimation, Rv is the gas constant, and ei(T) the saturation vapor pressure at temperature T. Sublimation and deposition depends mainly on the difference between the ambient vapor pressure and the saturation vapor pressure considering the dependence of the saturation vapor pressure on the ice crystal radius (Kelvin effect). In the curvature term we set the Kelvin radius ak to m, representative for cirrus-type conditions (Lewellen, 2012). The diffusivity of water vapor and thermal conductivity of air is calculated considering that the vapor density in moist air is not continuous right up to the surface of the ice crystal using equations given in Pruppacher and Klett (1996, Eqs. 13–14, 13–20) setting the thermal accommodation coefficient to 0.7 and the mass accommodation coefficient to 0.5 (Kärcher, 2003).
Here we calculate the temporal evolution of sublimation and deposition of cirrus ice crystals offline assuming a mean size which is given by the grid box ice water content and ice crystal number concentration. This means that we neglect the fact that when resolving the ice crystal size distribution, the smallest ice crystals (≲ 1.5 µm) may completely sublimate when mixed into the plume at a time with t0 the time of emission and tsat the time at which ice saturation is reached. Assuming the smallest mean cirrus ice crystal sizes within our model simulations (∼ 5 µm) and a generalized gamma ice crystal size distribution of Seifert and Beheng (2006) we estimate that ∼ 10 % of the cirrus ice crystals have a size below ∼ 1.5 µm and may sublimate when mixed at time tcs into the aircraft plume. The loss of cirrus ice crystals is likely to have a larger impact on our estimate of the deposition than of the sublimation and may accordingly lead to a conservative estimate for the plume water vapor increase due to entrained cirrus ice crystals. Furthermore, we assume spherical particles, since we do not have information on the habit of the ice crystals in our model, which can lead to an underestimation of the growth or decay of ice crystals. For young contrail ice crystals or newly nucleated cirrus ice crystals (including newly frozen water droplets) sphericity should be a good assumption, while for larger cirrus ice crystals this assumption is often not good. In order to reduce computing time we choose not to calculate the temporal evolution of the plume, including the sublimation and deposition on mixed-in cirrus ice crystals, within ICON-LEM. Instead, we estimate the change in the plume properties based on the plume properties at a time step between emission and ice saturation.
In Table A1 we show an example calculation. For two contrail formation cases, one far from the threshold and one close to the threshold case, we calculate the temporal evolution of cirrus ice crystal sublimation and deposition as well as the resulting total ice water mass sublimated from entrained cirrus ice crystals in the subsaturated plume and the water vapor deposited on the cirrus ice crystals once the plume is supersaturated using Eq. (6) and an equation for plume dilution (Kärcher et al., 2015, Eq. 12). We then compare the result to the approximated overall sublimation and deposition calculated at a time step between emission and ice saturation and between ice saturation and ice nucleation, respectively. We choose two sets of ambient conditions and aircraft parameters as in Bier et al. (2022, their Table 1) and cirrus properties (Table A1).
We approximately estimate the sublimation of the cirrus ice water mass from the plume conditions at . For both our example cases, the time-integrated sublimated ice water mass from entrained cirrus ice crystals is very close to the estimate when using plume conditions at time tas with deviations lower than 1 % (Table A1). The deposition of water vapor on cirrus ice crystals in the supersaturated plume has been estimated from the plume atmospheric variables midway between ice saturation (tsat) and aerosol activation (tact) at with an assumed reduction in cirrus ice crystal numbers of 20 %. tact is determined from the contrail ice nucleation parameterization of Kärcher et al. (2015) assuming it to be unchanged by the sublimation and deposition. Table A1 shows that the time-integrated deposition and the estimates midway between ice saturation and aerosol activation agree reasonably well (Table A1).
In order to estimate the errors connected to the estimates of deposition and sublimation we vary the background relative humidity, cirrus ice crystal numbers, and ice water content and calculate sublimation and deposition within the plume when resolving the temporal evolution and when approximating the integrated effect. We find that errors in estimating sublimation are mostly below 3 % and in estimating deposition around 2 %. We find larger errors in sublimation or deposition of up to 4 %–5 % only for combinations of atmospheric variables that are unlikely to occur, such as high relative humidity combined with many cirrus ice crystals and a large ice water content or for many very small ice crystals with small ice water content and low supersaturation.
The ICON model is distributed to institutions under an institutional license issued by the DWD. Two copies of the institutional license need to be signed and returned to the DWD. ICON can then be downloaded at https://data.dwd.de (last access: 5 July 2022). To individuals, the ICON model is distributed under a personal non-commercial research license distributed by the MPI-M (Max Planck Institute for Meteorology). Every person receiving a copy of the ICON framework code accepts the ICON personal non-commercial research license by doing so. Or, as the license states, any use of the ICON software is conditional upon and therefore leads to an implied acceptance of the terms of the Software License Agreement. To receive an individually licensed copy, please follow the instructions provided at https://code.mpimet.mpg.de/projects/iconpublic/ (last access: 5 July 2022).
Data used in the figures can be access from the given DOI (Verma, 2022, https://doi.org/10.5281/zenodo.6337981).
PV and UB jointly designed the study. PV performed simulations and analyzed the results. PV and UB jointly discussed scientific results and wrote and revised the paper.
The contact author has declared that neither of the authors has any competing interests.
Publisher's note: Copernicus Publications remains neutral with regard to jurisdictional claims in published maps and institutional affiliations.
We gratefully acknowledge the High Definition Cloud and Precipitation HD(CP)2 project that performed the ICON-LEM simulations on which our study is based. We thank Jan Frederik Engels from DKRZ for technical help implementing the contrail scheme and the air traffic inventory in ICON-LEM. We thank Klaus Gierens, Andreas Schäffler, and Simon Unterstrasser from DLR as well as Axel Seifert and Daniel Reinert from DWD and the whole HD(CP)2 community for valuable discussions. We thank Winfried Beer and Bastian Kern for their technical support at DLR. The paper was significantly improved by the reviews of David Lewellen and Xavier Vancassel as well as the comments of Bernd Kärcher.
This work is funded by the research program “High Definition of Clouds and
Precipitation for Advancing Climate Prediction” (HD(CP)2) of the BMBF
(German Federal Ministry of Education and Research) under grant 01LK1503C. The authors were also granted computing time by the German
Climate Computing Centre (Deutsches Klimarechenzentrum, DKRZ, Hamburg,
Germany).
The article processing charges for this open-access publication were covered by the German Aerospace Center (DLR).
This paper was edited by Martina Krämer and reviewed by David Lewellen and Xavier Vancassel.
Baldauf, M. and Brdar, S.: 3D diffusion in terrain-following coordinates: testing and stability of horizontally explicit, vertically implicit discretizations, Q. J. Roy. Meteorol. Soc., 142, 2087–2101, https://doi.org/10.1002/qj.2805, 2016.
Bickel, M., Ponater, M., Bock, L., Burkhardt, U., and Reineke, S.: Estimating the Effective Radiative Forcing of Contrail Cirrus, J. Clim., 33, 1991–2005, https://doi.org/10.1175/jcli-d-19-0467.1, 2020.
Bier, A. and Burkhardt, U.: Variability in Contrail Ice Nucleation and Its Dependence on Soot Number Emissions, J. Geophys. Res.-Atmos., 124, 3384–3400, https://doi.org/10.1029/2018jd029155, 2019.
Bier, A., Burkhardt, U., and Bock, L.: Synoptic Control of Contrail Cirrus Life Cycles and Their Modification Due to Reduced Soot Number Emissions, J. Geophys. Res.-Atmos., 122, 11584–11603, https://doi.org/10.1002/2017jd027011, 2017.
Bier, A., Unterstrasser, S., and Vancassel, X.: Box model trajectory studies of contrail formation using a particle-based cloud microphysics scheme, Atmos. Chem. Phys., 22, 823–845, https://doi.org/10.5194/acp-22-823-2022, 2022.
Bock, L. and Burkhardt, U.: Reassessing properties and radiative forcing of contrail cirrus using a climate model, J. Geophys. Res.-Atmos., 121, 9717–9736, https://doi.org/10.1002/2016jd025112, 2016a.
Bock, L. and Burkhardt, U.: The temporal evolution of a long-lived contrail cirrus cluster: Simulations with a global climate model, J. Geophys. Res.-Atmos., 121, 3548–3565, https://doi.org/10.1002/2015jd024475, 2016b.
Bock, L. and Burkhardt, U.: Contrail cirrus radiative forcing for future air traffic, Atmos. Chem. Phys., 19, 8163–8174, https://doi.org/10.5194/acp-19-8163-2019, 2019.
Boucher, O., Randall, D., Artaxo, P., Bretherton, C., Feingold, G., Forster, P., Kerminen, V.-M., Kondo, Y., Liao, H., Lohmann, U., Rasch, P., Satheesh, S. K. Sherwood, S., Stevens, B., Zhang, X. Y., Stocker, T. F., Qin, D., Plattner, G.-K., Tignor, M., Allen, S. K., Doschung, J., Nauels, A., Xia, Y., Bex, V., and Midgley, P. M.: Clouds and aerosols, in: Climate Change 2013: The Physical Science Basis, Contribution of Working Group I to the Fifth Assessment Report of the Intergovernmental Panel on Climate Change, Cambridge University Press, 571–657, https://https://doi.org/10.1017/CBO9781107415324.016, 2013.
Bräuer, T., Voigt, C., Sauer, D., Kaufmann, S., Hahn, V., Scheibe, M., Schlager, H., Diskin, G. S., Nowak, J. B., DiGangi, J. P., Huber, F., Moore, R. H., and Anderson, B. E.: Airborne Measurements of Contrail Ice Properties – Dependence on Temperature and Humidity, Geophys. Res. Lett., 48, 1–9, https://doi.org/10.1029/2020gl092166, 2021.
Burkhardt, U. and Kärcher, B.: Global radiative forcing from contrail cirrus, Nat. Clim. Change, 1, 54–58, https://doi.org/10.1038/nclimate1068, 2011.
Burkhardt, U., Bock, L., and Bier, A.: Mitigating the contrail cirrus climate impact by reducing aircraft soot number emissions, Npj Clim. Atmos. Sci., 1, 37, https://doi.org/10.1038/s41612-018-0046-4, 2018.
Chen, C.-C. and Gettelman, A.: Simulated radiative forcing from contrails and contrail cirrus, Atmo. Chem. Phys., 13, 12525–12536, https://doi.org/10.5194/acp-13-12525-2013, 2013.
Dipankar, A., Stevens, B., Heinze, R., Moseley, C., Zängl, G., Giorgetta, M., and Brdar, S.: Large eddy simulation using the general circulation model ICON, J. Adv. Model. Earth Sy., 7, 963–986, https://doi.org/10.1002/2015ms000431, 2015.
Fichter, C., Marquart, S., Sausen, R., and Lee, D. S.: The impact of cruise altitude on contrails and related radiative forcing, Meteorol. Z., 14, 563–572, https://doi.org/10.1127/0941-2948/2005/0048, 2005.
Gayet, J.-F., Febvre, G., Brogniez, G., Chepfer, H., Renger, W., and Wendling, P.: Microphysical and Optical Properties of Cirrus and Contrails: Cloud Field Study on 13 October 1989, J. Atmos. Sci., 53, 126–138, 1996.
Gerz, T., Dürbeck, T., and Konopka, P.: Transport and effective diffusion of aircraft emissions, J. Geophys. Res.-Atmos., 103, 25905–25913, https://doi.org/10.1029/98jd02282, 1998.
Gierens, K.: Selected topics on the interaction between cirrus clouds and embedded contrails, Atmos. Chem. Phys., 12, 11943–11949, https://doi.org/10.5194/acp-12-11943-2012, 2012.
Gruber, S., Unterstrasser, S., Bechtold, J., Vogel, H., Jung, M., Pak, H., and Vogel, B.: Contrails and their impact on shortwave radiation and photovoltaic power production – a regional model study, Atmos. Chem. Phys., 18, 6393–6411, https://doi.org/10.5194/acp-18-6393-2018, 2018.
Hande, L. B., Engler, C., Hoose, C., and Tegen, I.: Parameterizing cloud condensation nuclei concentrations during HOPE, Atmos. Chem. Phys., 16, 12059–12079, https://doi.org/10.5194/acp-16-12059-2016, 2016.
Heinze, R., Dipankar, A., Henken, C. C., Moseley, C., Sourdeval, O., Trömel, S., Xie, X., Adamidis, P., Ament, F., Baars, H., Barthlott, C., Behrendt, A., Blahak, U., Bley, S., Brdar, S., Brueck, M., Crewell, S., Deneke, H., Di Girolamo, P., Evaristo, R., Fischer, J., Frank, C., Friederichs, P., Göcke, T., Gorges, K., Hande, L., Hanke, M., Hansen, A., Hege, H.-C., Hoose, C., Jahns, T., Kalthoff, N., Klocke, D., Kneifel, S., Knippertz, P., Kuhn, A., van Laar, T., Macke, A., Maurer, V., Mayer, B., Meyer, C. I., Muppa, S. K., Neggers, R. A. J., Orlandi, E., Pantillon, F., Pospichal, B., Röber, N., Scheck, L., Seifert, A., Seifert, P., Senf, F., Siligam, P., Simmer, C., Steinke, S., Stevens, B., Wapler, K., Weniger, M., Wulfmeyer, V., Zängl, G., Zhang, D., and Quaas, J.: Large-eddy simulations over Germany using ICON: a comprehensive evaluation, Q. J. Roy. Meteor. Soc., 143, 69–100, https://doi.org/10.1002/qj.2947, 2017.
Kapadia, Z. Z., Spracklen, D. V., Arnold, S. R., Borman, D. J., Mann, G. W., Pringle, K. J., Monks, S. A., Reddington, C. L., Benduhn, F., Rap, A., Scott, C. E., Butt, E. W., and Yoshioka, M.: Impacts of aviation fuel sulfur content on climate and human health, Atmos. Chem. Phys., 16, 10521–10541, https://doi.org/10.5194/acp-16-10521-2016, 2016.
Kärcher, B.: Physicochemistry of aircraft-generated liquid aerosols, soot, and ice particles: 1. Model description, J. Geophys. Res.-Atmos., 103, 17111–17128, https://doi.org/10.1029/98jd01044, 1998.
Kärcher, B.: Aviation-Produced Aerosols and Contrails, Surv. Geophys., 20, 113–167, https://doi.org/10.1023/a:1006600107117, 1999.
Kärcher, B.: Simulating gas-aerosol-cirrus interactions: Process-oriented microphysical model and applications, Atmos. Chem. Phys., 3, 1645–1664, https://doi.org/10.5194/acp-3-1645-2003, 2003.
Kärcher, B. and Yu, F.: Role of aircraft soot emissions in contrail formation, Geophys. Res. Lett., 36, L01804, https://doi.org/10.1029/2008gl036649, 2009.
Kärcher, B., Busen, R., Petzold, A., Schröder, F. P., Schumann, U., and Jensen, E. J.: Physicochemistry of aircraft-generated liquid aerosols, soot, and ice particles: 2. Comparison with observations and sensitivity studies, J. Geophys. Res.-Atmos., 103, 17129–17147, https://doi.org/10.1029/98jd01045, 1998.
Kärcher, B., Hendricks, J., and Lohmann, U.: Physically based parameterization of cirrus cloud formation for use in global atmospheric models, J. Geophys. Res., 111, D01205, https://doi.org/10.1029/2005jd006219, 2006.
Kärcher, B., Burkhardt, U., Bier, A., Bock, L., and Ford, I. J.: The microphysical pathway to contrail formation, J. Geophys.l Res.-Atmos., 120, 7893–7927, https://doi.org/10.1002/2015jd023491, 2015.
Köhler, C. G. and Seifert, A.: Identifying sensitivities for cirrus modelling using a two-moment two-mode bulk microphysics scheme, Tellus B, 67, 24494, https://doi.org/10.3402/tellusb.v67.24494, 2015.
Krämer, M., Rolf, C., Spelten, N., Afchine, A., Fahey, D., Jensen, E., Khaykin, S., Kuhn, T., Lawson, P., Lykov, A., Pan, L. L., Riese, M., Rollins, A., Stroh, F., Thornberry, T., Wolf, V., Woods, S., Spichtinger, P., Quaas, J., and Sourdeval, O.: A microphysics guide to cirrus – Part 2: Climatologies of clouds and humidity from observations, Atmos. Chem. Phys., 20, 12569–12608, https://doi.org/10.5194/acp-20-12569-2020, 2020.
Lee, D. S., Fahey, D. W., Skowron, A., Allen, M. R., Burkhardt, U., Chen, Q., Doherty, S. J., Freeman, S., Forster, P. M., Fuglestvedt, J., Gettelman, A., De León, R. R., Lim, L. L., Lund, M. T., Millar, R. J., Owen, B., Penner, J. E., Pitari, G., Prather, M. J., Sausen, R., and Wilcox, L. J.: The contribution of global aviation to anthropogenic climate forcing for 2000 to 2018, Atmos. Environ., 244, 117834, https://doi.org/10.1016/j.atmosenv.2020.117834, 2021.
Lewellen, D. C.: Analytic Solutions for Evolving Size Distributions of Spherical Crystals or Droplets Undergoing Diffusional Growth in Different Regimes, J. Atmos. Sci., 69, 417–434, https://doi.org/10.1175/jas-d-11-029.1, 2012.
Lewellen, D. C.: A Large-Eddy Simulation Study of Contrail Ice Number Formation, J. Atmos. Sci., 77, 2585–2604, https://doi.org/10.1175/jas-d-19-0322.1, 2020.
Lewellen, D. C., Meza, O., and Huebsch, W. W.: Persistent Contrails and Contrail Cirrus, Part I: Large-Eddy Simulations from Inception to Demise, J. Atmos. Sci., 71, 4399–4419, https://doi.org/10.1175/jas-d-13-0316.1, 2014.
Liou, K. N.: Influence of Cirrus Clouds on Weather and Climate Processes: A Global Perspective, Mon. Weather Rev., 114, 1167–1199, https://doi.org/10.1175/1520-0493(1986)114<1167:IOCCOW>2.0.CO;2, 1986.
Macke, A., Seifert, P., Baars, H., Barthlott, C., Beekmans, C., Behrendt, A., Bohn, B., Brueck, M., Bühl, J., Crewell, S., Damian, T., Deneke, H., Düsing, S., Foth, A., Di Girolamo, P., Hammann, E., Heinze, R., Hirsikko, A., Kalisch, J., Kalthoff, N., Kinne, S., Kohler, M., Löhnert, U., Madhavan, B. L., Maurer, V., Muppa, S. K., Schween, J., Serikov, I., Siebert, H., Simmer, C., Späth, F., Steinke, S., Träumner, K., Trömel, S., Wehner, B., Wieser, A., Wulfmeyer, V., and Xie, X.: The HD(CP)2 Observational Prototype Experiment (HOPE) – an overview, Atmos. Chem. Phys., 17, 4887–4914, https://doi.org/10.5194/acp-17-4887-2017, 2017.
Markowicz, K. M. and Witek, M. L.: Simulations of Contrail Optical Properties and Radiative Forcing for Various Crystal Shapes, J. Appl. Meteorol. Climatol., 50, 1740–1755, https://doi.org/10.1175/2011jamc2618.1, 2011.
Matthes, S., Lim, L., Burkhardt, U., Dahlmann, K., Dietmüller, S., Grewe, V., Haslerud, A. S., Hendricks, J., Owen, B., Pitari, G., Righi, M., and Skowron, A.: Mitigation of Non-CO2 Aviation's Climate Impact by Changing Cruise Altitudes, Aerospace, 8, 36, https://doi.org/10.3390/aerospace8020036, 2021.
Meerkötter, R., Schumann, U., Doelling, D. R., Minnis, P., Nakajima, T., and Tsushima, Y.: Radiative forcing by contrails, Ann. Geophys., 17, 1080–1094, https://doi.org/10.1007/s00585-999-1080-7, 1999.
Naiman, A. D., Lele, S. K., and Jacobson, M. Z.: Large eddy simulations of contrail development: Sensitivity to initial and ambient conditions over first twenty minutes, J. Geophys. Res.-Atmos., 116, D21208, https://doi.org/10.1029/2011jd015806, 2011.
Paoli, R. and Shariff, K.: Contrail Modeling and Simulation, Ann. Rev. Fluid Mech., 48, 393–427, https://doi.org/10.1146/annurev-fluid-010814-013619, 2016.
Pruppacher, H. R. and Klett, J. D.: Microphysics of Clouds and Precipitation, Atmospheric and Oceanographic Sciences Library, 2nd Edn., Kluwer Academic Publishers, Dordrecht, the Netherlands, ISBN 978-0792344094, 1997.
Ramanathan, V., Cess, R. D., Harrison, E. F., Minnis, P., Barkstrom, B. R., Ahmad, E., and Hartmann, D.: Cloud-Radiative Forcing and Climate: Results from the Earth Radiation Budget Experiment, Science, 243, 57–63, https://doi.org/10.1126/science.243.4887.57, 1989.
Righi, M., Hendricks, J., and Sausen, R.: The global impact of the transport sectors on atmospheric aerosol: simulations for year 2000 emissions, Atmos. Chem. Phys., 13, 9939–9970, https://doi.org/10.5194/acp-13-9939-2013, 2013.
Ruppert T.: Vector field reconstruction by radial basis functions, Master's thesis, Department of Mathematics, Technical University Darmstadt, Darmstadt, 2007.
Schröder, F., Kärcher, B., Duroure, C., Ström, J., Petzold, A., Gayet, J.-F., Strauss, B., Wendling, P., and Borrmann, S.: On the Transition of Contrails into Cirrus Clouds, J. Atmos. Sci., 57, 464–480, 2000.
Schumann, U.: On conditions for contrail formation from aircraft exhausts, Meteorol. Z., 5, 4–23, https://doi.org/10.1127/metz/5/1996/4, 1996.
Schumann, U. and Heymsfield, A. J.: On the Life Cycle of Individual Contrails and Contrail Cirrus, Meteorol. Monogr., 58, 3.1–3.24, 2017.
Schumann, U., Penner, J. E., Chen, Y., Zhou, C., and Graf, K.: Dehydration effects from contrails in a coupled contrail–climate model, Atmos. Chem. Phys., 15, 11179–11199, https://doi.org/10.5194/acp-15-11179-2015, 2015.
Seifert, A. and Beheng, K. D.: A two-moment cloud microphysics parameterization for mixed-phase clouds, Part 1: Model description, Meteorol. Atmos. Phys., 92, 45–66, https://doi.org/10.1007/s00703-005-0112-4, 2006.
Stevens, B. and Bony, S.: What Are Climate Models Missing?, Science, 340, 1053–1054, https://doi.org/10.1126/science.1237554, 2013.
Stevens, B., Acquistapace, C., Hansen, A., Heinze, R., Klinger, C., Klocke, D., Rybka, H., Schubotz, W., Windmiller, J., Adamidis, P., Arka, I., Barlakas, V., Biercamp, J., Brueck, M., Brune, S., Buehler, S. A., Burkhardt, U., Cioni, G., Costa-Surós, M., Crewell, S., Crüger, T., Deneke, H., Friederichs, P., Henken, C. C., Hohenegger, C., Jacob, M., Jakub, F., Kalthoff, N., Köhler, M., van Laar, T. W., Li, P., Löhnert, U., Macke, A., Madenach, N., Mayer, B., Nam, C., Naumann, A. K., Peters, K., Poll, S., Quaas, J., Röber, N., Rochetin, N., Scheck, L., Schemann, V., Schnitt, S., Seifert, A., Senf, F., Shapkalijevski, M., Simmer, C., Singh, S., Sourdeval, O., Spickermann, D., Strandgren, J., Tessiot, O., Vercauteren, N., Vial, J., Voigt, A., and Zängl, G.: The Added Value of Large-Eddy and Storm-Resolving Models for Simulating Clouds and Precipitation, J. Meteorol. Soc. Jpn., 98, 395–435, https://doi.org/10.2151/jmsj.2020-021, 2020.
Tesche, M., Achtert, P., Glantz, P., and Noone, K. J.: Aviation effects on already-existing cirrus clouds, Nat. Commun., 7, 12016, https://doi.org/10.1038/ncomms12016, 2016.
Unterstrasser, S.: Large-eddy simulation study of contrail microphysics and geometry during the vortex phase and consequences on contrail-to-cirrus transition, J. Geophys. Res.-Atmos., 119, 7537–7555, https://doi.org/10.1002/2013jd021418, 2014.
Unterstrasser, S.: Properties of young contrails – a parametrisation based on large-eddy simulations, Atmos. Chem. Phys., 16, 2059–2082, https://doi.org/10.5194/acp-16-2059-2016, 2016.
Verma, P.: figures_and_data_for_manuscript_contrail_formation_ within_cirrus_Verma_and_Burkhardt_07032022, Zenodo [data set], https://doi.org/10.5281/zenodo.6337981, 2022.
Voigt, C., Schumann, U., Minikin, A., Abdelmonem, A., Afchine, A., Borrmann, S., Boettcher, M., Buchholz, B., Bugliaro, L., Costa, A., Curtius, J., Dollner, M., Dörnbrack, A., Dreiling, V., Ebert, V., Ehrlich, A., Fix, A., Forster, L., Frank, F., Fütterer, D., Giez, A., Graf, K., Grooß, J.-U., Groß, S., Heimerl, K., Heinold, B., Hüneke, T., Järvinen, E., Jurkat, T., Kaufmann, S., Kenntner, M., Klingebiel, M., Klimach, T., Kohl, R., Krämer, M., Krisna, T. C., Luebke, A., Mayer, B., Mertes, S., Molleker, S., Petzold, A., Pfeilsticker, K., Port, M., Rapp, M., Reutter, P., Rolf, C., Rose, D., Sauer, D., Schäfler, A., Schlage, R., Schnaiter, M., Schneider, J., Spelten, N., Spichtinger, P., Stock, P., Walser, A., Weigel, R., Weinzierl, B., Wendisch, M., Werner, F., Wernli, H., Wirth, M., Zahn, A., Ziereis, H., and Zöger, M.: ML-CIRRUS – The airborne experiment on natural cirrus and contrail cirrus with the high-altitude long-range research aircraft HALO, B. Am. Meteorol. Soc., 98, 271–288, https://doi.org/10.1175/BAMS-D-15-00213.1, 2017.
Wan, H., Giorgetta, M. A., Zängl, G., Restelli, M., Majewski, D., Bonaventura, L., Fröhlich, K., Reinert, D., Rípodas, P., Kornblueh, L., and Förstner, J.: The ICON-1.2 hydrostatic atmospheric dynamical core on triangular grids – Part 1: Formulation and performance of the baseline version, Geosci. Model Dev., 6, 735–763, https://doi.org/10.5194/gmd-6-735-2013, 2013.
Wilkerson, J. T., Jacobson, M. Z., Malwitz, A., Balasubramanian, S., Wayson, R., Fleming, G., Naiman, A. D., and Lele, S. K.: Analysis of emission data from global commercial aviation: 2004 and 2006, Atmos. Chem. Phys., 10, 6391–6408, https://doi.org/10.5194/acp-10-6391-2010, 2010.
Wolke, R., Knoth, O., Hellmuth, O., Schröder, W., and Renner, E.: The parallel model system LM-MUSCAT for chemistry-transport simulations: Coupling scheme, parallelization and applications, Adv. Parall. Comput., 13, 363–369, https://doi.org/10.1016/s0927-5452(04)80048-0, 2004.
Wolke, R., Schröder, W., Schrödner, R., and Renner, E.: Influence of grid resolution and meteorological forcing on simulated European air quality: A sensitivity study with the modeling system COSMO–MUSCAT, Atmos. Environ., 53, 110–130, https://doi.org/10.1016/j.atmosenv.2012.02.085, 2012.
Zängl, G., Reinert, D., Rípodas, P., and Baldauf, M.: The ICON (ICOsahedral Non-hydrostatic) modelling framework of DWD and MPI-M: Description of the non-hydrostatic dynamical core, Q. J. Roy. Meteorol. Soc., 141, 563–579, https://doi.org/10.1002/qj.2378, 2014.
Zhang, Y., Macke, A., and Albers, F.: Effect of crystal size spectrum and crystal shape on stratiform cirrus radiative forcing, Atmos. Res., 52, 59–75, https://doi.org/10.1016/s0169-8095(99)00026-5, 1999.
- Abstract
- Introduction
- Methods and simulations
- Impact of pre-existing cirrus on young contrail properties
- Summary and comparison with literature
- Conclusions
- Appendix A: Impact of cirrus ice crystals mixed into the plume on the plume water vapor partial pressure before aerosol activation
- Code availability
- Data availability
- Author contributions
- Competing interests
- Disclaimer
- Acknowledgements
- Financial support
- Review statement
- References