the Creative Commons Attribution 4.0 License.
the Creative Commons Attribution 4.0 License.
 | 06 Jul 2022
Black carbon aerosol reductions during COVID-19 confinement quantified by aircraft measurements over Europe
Ovid O. Krüger
Bruna A. Holanda
Sourangsu Chowdhury
Andrea Pozzer
David Walter
Christopher Pöhlker
Maria Dolores Andrés Hernández
John P. Burrows
Christiane Voigt
Jos Lelieveld
Johannes Quaas
Ulrich Pöschl
Mira L. Pöhlker
The abrupt reduction in human activities during the first lockdown of the COVID-19 pandemic created unprecedented atmospheric conditions. To quantify the changes in lower tropospheric air pollution, we conducted the BLUESKY aircraft campaign and measured vertical profiles of black carbon (BC) aerosol particles over western and southern Europe in May and June 2020. We compared the results to similar measurements of the EMeRGe EU campaign performed in July 2017 and found that the BC mass concentrations (MBC) were reduced by about 48 %. For BC particle number concentrations, we found comparable reductions. Based on ECHAM/MESSy Atmospheric Chemistry (EMAC) chemistry-transport model simulations, we found differences in meteorological conditions and flight patterns responsible for about 7 % of the MBC reductions. Accordingly 41 % of MBC reductions can be attributed to reduced anthropogenic emissions. Our results reflect the strong and immediate positive effect of changes in human activities on air quality and the atmospheric role of BC aerosols as a major air pollutant in the Anthropocene.
- Article
(5784 KB) - Full-text XML
-
Supplement
(14063 KB) - BibTeX
- EndNote


To subdue the exponential spread of the SARS-CoV-2 (severe acute respiratory syndrome coronavirus type 2), most European countries responded with substantial cuts in mobility and economic activities. This included forced and voluntary confinements such as travel bans, home office and relinquished travel activities (e.g. Hale et al., 2021; Quaas et al., 2021a). Many of these behaviour modifications decreased fossil fuel combustion, a major source of atmospheric black carbon (BC) (e.g. Pöschl, 2005; Bond et al., 2013). This decrease is reflected in a roughly 30 % decreased fossil fuel demand in early 2020 (Fig. S1 in the Supplement). That reduction is attributed to 90 % less air traffic in Europe (Schumann et al., 2021b) as well as strongly reduced road traffic (Figs. S2, S3, S4). These changes in anthropogenic emissions created unprecedented atmospheric conditions compared to the generally anthropogenic shaped continental aerosol burden (Andreae, 2007) and gave rise to the opportunity to measure airborne BC.
Several model studies use proxies like the strictness of the confinements or mobile phone data on transportation to show the impact of behaviour changes on emissions (e.g. Forster et al., 2020; Le Quéré et al., 2020). Also satellite-based observations are used to track changes in trace gas concentrations, aerosol optical properties as well as cloud coverage (e.g. Quaas et al., 2021b; Schumann et al., 2021a; Li and Groß, 2021). A more accurate estimate on costs of spatial resolution is achieved with surface air pollution monitoring stations (e.g. Evangeliou et al., 2021; Petetin et al., 2020; Shi et al., 2021). All these studies have contributed to understanding the COVID-19 confinement’s influence on the atmosphere and climate. Nevertheless, they fail to provide a precise quantification of air pollutants over a large spatial area with profiles of the lower tropospheric distribution. Here we present the first airborne in situ observations of BC during the first COVID-19 lockdown in early 2020, showing a consistent data set for a large region along with the vertical distribution of BC.
We measured refractory BC mass (MBC) and particle number concentrations (NBC) in the lower troposphere in western and southern Europe (Fig. 1). The measurements were carried out with a single particle soot photometer (SP2) mounted on the HALO (High Altitude and LOng range) research aircraft. This study compares data from in situ measurements during non-confinement conditions in July 2017 (during the EMeRGe EU campaign, Andrés Hernández et al., 2022) with those affected by reduced emissions in May and June 2020 (during the BLUESKY campaign, Voigt et al., 2022). The measurements were performed while most of the lockdown confinements were still active; however, the strictest lockdown was between the middle of March until the middle of May (Fig. 2 and Sect. 2.2). Here we estimate to what extent the BC reductions are due to lower emissions and to other factors such as meteorological conditions and differences in flight tracks. Therefore we modelled MBC along the flight tracks with the ECHAM/MESSy Atmospheric Chemistry (EMAC) model and used the differences in the model results to adjust our in situ data for changes not related to reduced anthropogenic emissions. We show for the measurement period in 2020 a substantial reduction in BC compared to the measurements from 2017.
The fast response on the BC burden can be explained by its relatively short atmospheric residence time, ranging from some days to a few weeks (Holanda et al., 2020; Lund et al., 2018; Bond et al., 2013). Despite its short residence time, BC absorbs solar radiation which leads to strong positive radiative forcing (RF) (Ramanathan and Carmichael, 2008; Bond et al., 2013; Gustafsson and Ramanathan, 2016; Naik et al., 2021). Owing to its relatively short atmospheric residence time the BC burden response is nearly immediate to emissions changes. This immediacy makes BC an appropriate tracer for the rapid changes in anthropogenic activities and thus an important quantity in estimating the radiative effect of the 2020 confinements.
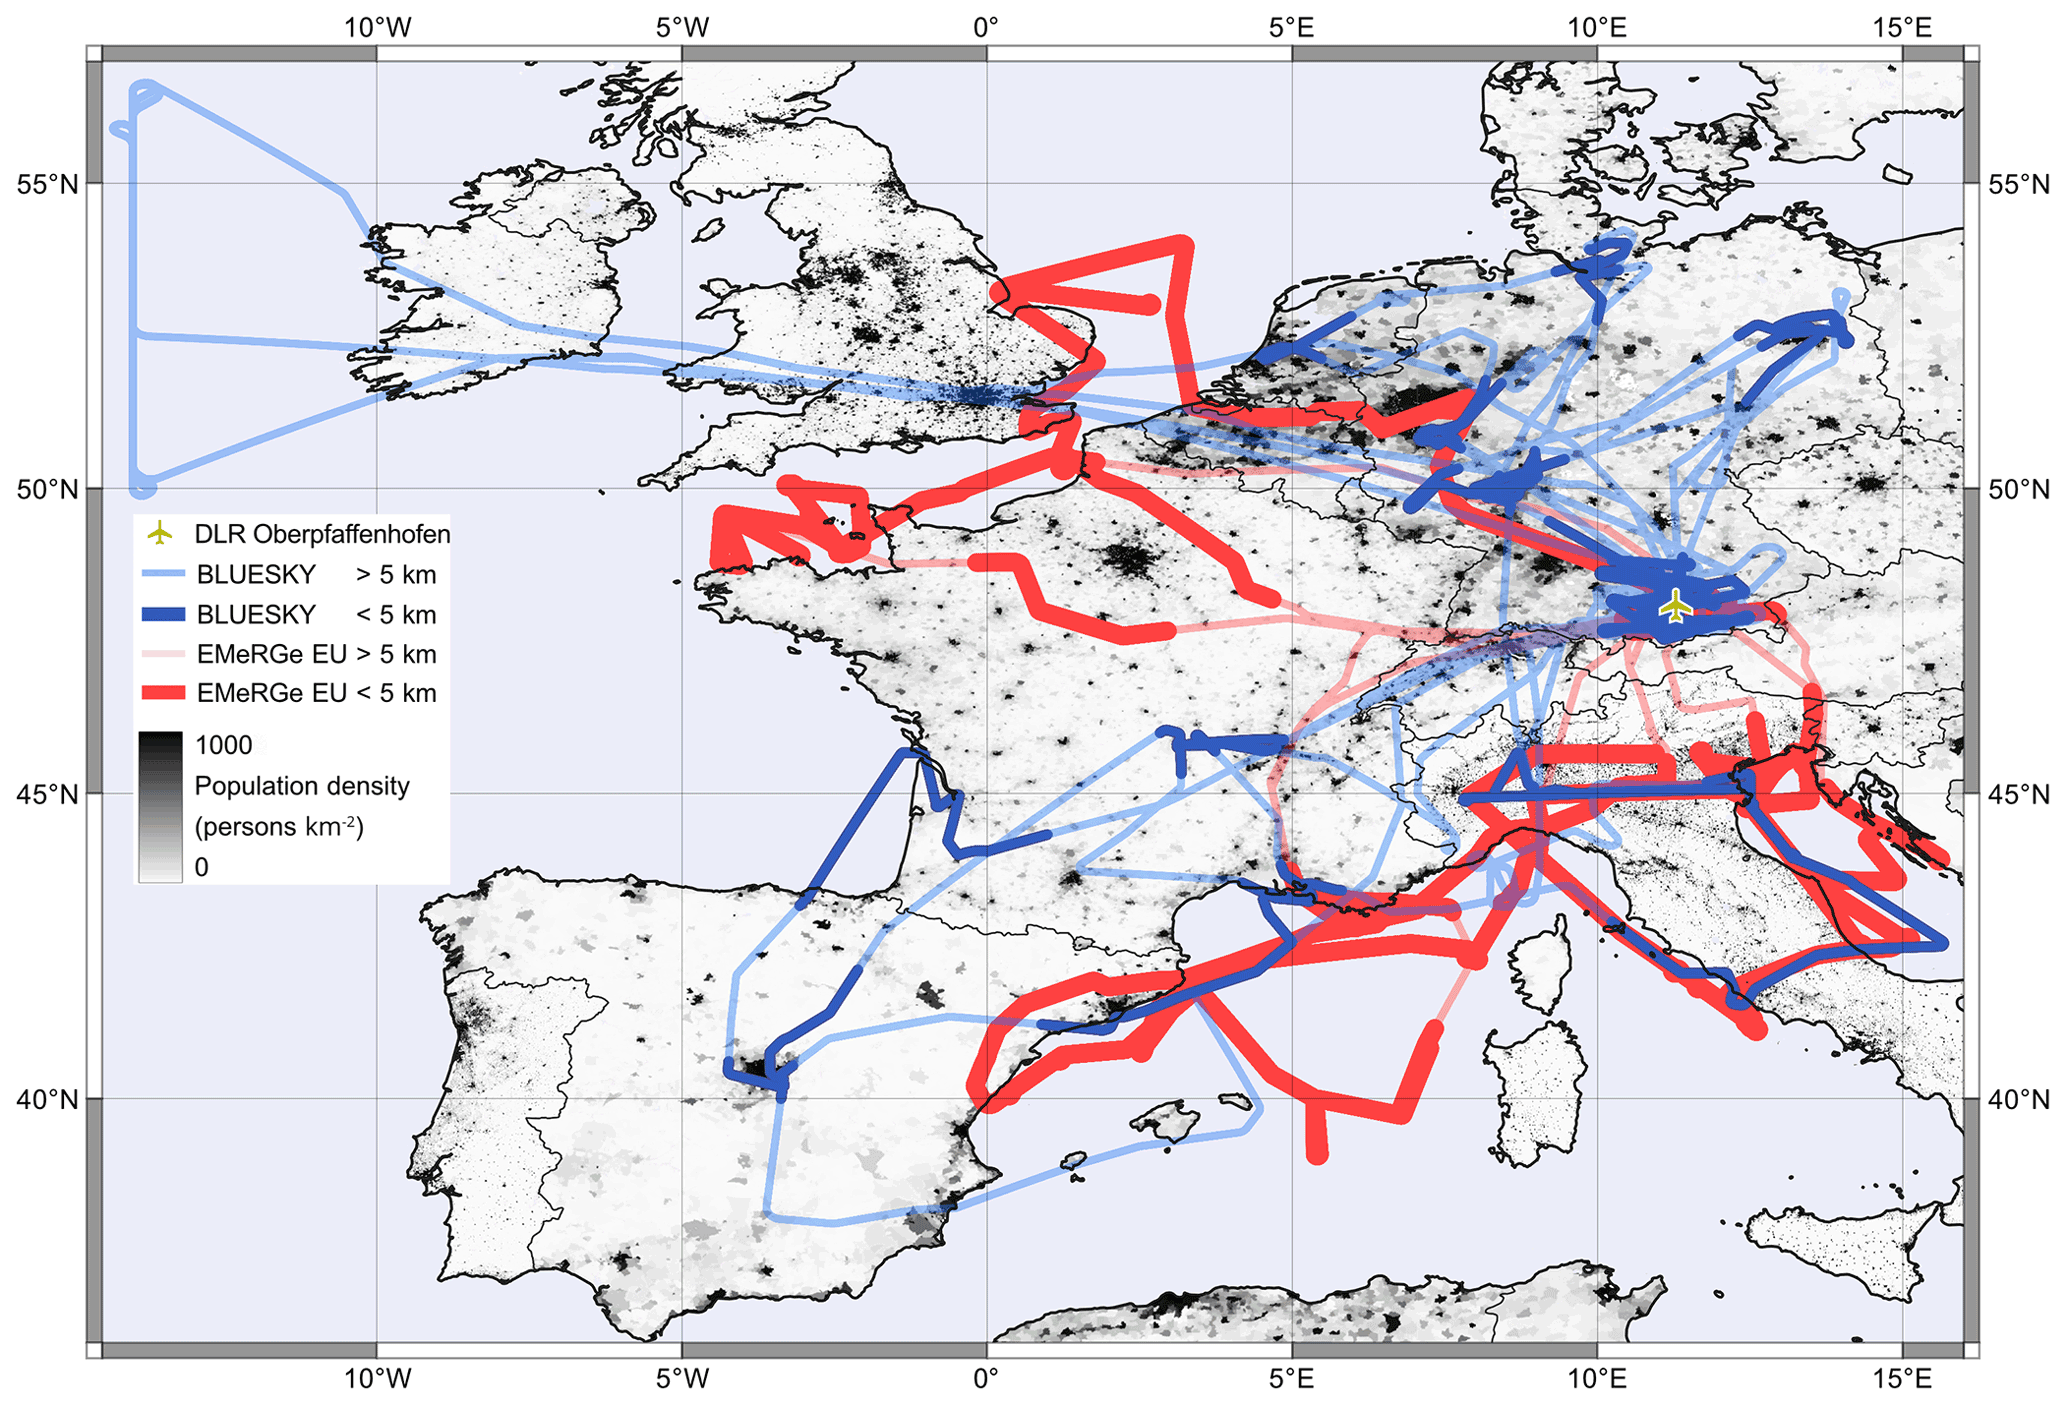
Figure 1Flight tracks of the HALO EMeRGe EU (in July 2017, Andrés Hernández et al., 2022) and BLUESKY (in May and June 2020, Voigt et al., 2022) aircraft campaigns. Both campaigns were conducted from the DLR airport in Oberpfaffenhofen in southern Germany. Flight segments with altitudes below 5 km, which yielded the measurement data for this study, are highlighted in the map. The population density is for the year 2020 (CIESIN, 2018).
2.1 Studied area
The measurement flights were carried out in southern and western European airspace (Fig. 1). The countries we focus on in this study are Germany, France, Spain, Italy, the Netherlands, Belgium and Luxembourg. These countries are also used for the comparison of our results to other data sets and publications.
From 10 until 28 July 2017 the Effect of Megacities on the transport and transformation of pollutants on the Regional and Global scales (EMeRGe EU) was investigated in Europe (Andrés Hernández et al., 2022). The focus of EMeRGe EU determined the flight tracks, to be in the lower troposphere, where anthropogenic pollution is most abundant. The flights were performed predominantly up- and down-wind of densely populated regions.
We compare the results of EMeRGe EU to BLUESKY including the CAFE EU project (Chemistry of the Atmosphere: Field Experiment in Europe), from 23 May until 9 June 2020 (Voigt et al., 2022). The central point during BLUESKY was to investigate the effects of the COVID-19 confinements on the atmosphere. This included measurements of urban pollution in the lower troposphere, but also effects of reduced air traffic. Therefore, some measurements were performed in passenger aircraft cruising altitudes in the upper troposphere and lowermost stratosphere (Zauner-Wieczorek et al., 2022).
The two compared HALO aircraft campaigns have besides the well comparable studied area also some important differences. A major difference, which is also apparent in the vertical distributions of MBC (e.g. Figs. 4, 6 and 5), is that during BLUESKY in 2020 low air traffic volume allowed us to perform more near-surface measurement flights. These measurements also include manoeuvres referred to as low approaches (Voigt et al., 2022), i.e. a landing manoeuvre without ground contact followed by a take-off. This manoeuvre enabled us to perform more measurements within the planetary boundary layer (PBL) during BLUESKY compared to EMeRGe EU in 2017, when high air traffic volume inhibited these low approaches. We later account for these differences in the flight pattern with the EMAC model simulations (Sects. 2.4 and A1).
The short lifetime of BC hinders it from getting well mixed in the free troposphere and leads to a strong vertical gradient in its concentration. An accumulation of BC can be found in the lower troposphere and especially in the PBL. On top of the PBL there is some turbulent and convective mixing taking place, introducing PBL pollutants, like BC, into the lower troposphere (Andreae et al., 2018; Schwarz et al., 2017). Moreover BC concentrations in the middle and upper troposphere are rather driven by wildfires and long-range transport (Holanda et al., 2020; Ditas et al., 2018) than by anthropogenic pollution. These properties of atmospheric BC led us to focus on the lower troposphere, up to 5000 m above mean sea level.
The vertical distribution we report in this study (e.g. Figs. 4 and 5) is rather representative of MBC in European background conditions (Querol et al., 2013), albeit both field campaigns have a focus on emissions from major pollution centres (MPCs) in Europe. This can be explained by the fact that large fractions of the measurement flights were performed out of the MPC outflows or in highly aged air masses which also reach remote regions in Europe. All measurement flights were performed during daytime; thus there is no diurnal influence expected in our data set.
2.2 Temporal course of country response measures to COVID-19 compared to measurement period
The regional severity of the COVID-19 outbreak and thus the response by the European states was not concerted. A dynamic and scattered change in restrictions was its outcome. Nevertheless, all countries covered by our measurements experienced substantial restrictions during the COVID-19 lockdown. The responses with the largest impact on air pollution include closings of schools and workplaces, the cancellation of public events, stay-at-home requirements, and relinquished national and internal travel activities (Hale et al., 2021). All these restrictions led to a drastic drop in both personal mobility as well as mobility on companies business. In Fig. 2 we show the governmental response index as an indicator of the confinement strengths for selected countries. The data are downloaded from the Oxford Covid-19 Government Response Tracker (https://github.com/OxCGRT/covid-policy-tracker, last access: 6 July 2021) and further described in Hale et al. (2021). Besides the patchy responses of particular states and provinces, the EU imposed a comprehensive travel ban for non-EU citizens, with a drop in air traffic as the outcome. This ban was in effect from 18 March until 30 June 2020 and thus covered the whole measurement period (https://data.consilium.europa.eu/doc/document/ST-9208-2020-INIT/de/pdf, last access: 26 June 2022). Generally, the measurement period falls into the later lockdown period, when still many confinements were in effect and travel activities remained low (Fig. 2).

Figure 2Temporal evolution of response on COVID-19 for selected European countries. Governmental response index data downloaded from https://github.com/OxCGRT/covid-policy-tracker/blob/3143b76020ef83072086853749c950ac0921ba47/data/timeseries/government_response_index.csv (last access: 6 July 2021). Further details on the governmental response index in Hale et al. (2021).
2.3 Airborne BC measurements
Both measurement campaigns were conducted with the High Altitude and LOng range (HALO) research aircraft (G550, Gulfstream, USA), a modified long-range business jet. HALO is based at the German Aerospace Center (DLR) in Oberpfaffenhofen, Germany. Near-isokinetic aerosol sampling was achieved with the HALO Aerosol Submicrometer Inlet mounted on the fuselage outside of the aircraft boundary layer (Andreae et al., 2018).
The refractory black carbon (rBC) was measured with an eight-channel Single Particle Soot Photometer (SP2, Droplet Measurement Technologies, Longmont, USA). The SP2 quantifies rBC and non-absorbing particles using laser-induced incandescence and scatter signals (Stephens et al., 2003; Schwarz et al., 2006). Particles with a rBC core absorb the laser light and evaporate. The emitted incandescence signal is linearly proportional to the mass of the rBC cores (Laborde et al., 2013). The SP2 used for this study is sensitive to rBC cores in the size range between 70 and 500 nm mass-equivalent diameter, assuming a density of 1.8 g cm−3.
The SP2 incandescence signal was calibrated at the beginning, during, and at the end of each campaign with size-selected fullerene soot particles (Alfa Aesar Lot W08A039). The scattering signal was calibrated with spherical polystyrene latex size standards (208, 244, and 288 nm) and size-selected ammonium sulfate particles using a differential mobility analyser (Grimm Aerosol Technik, Ainring, Germany). The results of all calibrations for both campaigns agreed within their uncertainty ranges, confirming good instrument stability throughout the comparison. The uncertainty for SP2 measurements is 5 % for NBC and 10 % for MBC (Laborde et al., 2012). The measurement data were analysed with the Paul Scherrer Institute (PSI) SP2 toolkit (Gysel-Beer and Corbin, 2019) and adjusted to standard temperature and pressure (STP, T=273.15 k, p=1013.25 hPa). Throughout the analysis we use the BC data without a correction for the lower cutoff of the SP2. Due to the large contribution of anthropogenic BC emissions on our measurements and the high uncertainty in the size distribution for diameters below the SP2 detection limit, we do not fit the size distribution to a log-normal distribution. Furthermore for MBC, diameters below 100 nm do not play a significant role, regardless of their potentially dominating role for NBC and importance for the BC surface area (Seinfeld and Pandis, 2006; Pileci et al., 2021; Schwarz et al., 2008; Reddington et al., 2013).
2.4 Accounting for different flight pattern and seasonal and meteorological variability
The major difficulty in comparing atmospheric aerosol measurements is the strong dependence on multivariate factors as, for example, meteorological, regional and seasonal influence on the distribution and concentration of aerosol. This is due to (i) removal processes driven by the hydrological circle, dominated by cloud processing (Ohata et al., 2016; Liu et al., 2020); (ii) the extent of the PBL, determining the concentration and vertical extent of bulk BC and other aerosol species (Raj et al., 2021); and (iii) seasonal variations in emission types and strengths. Besides these factors, influencing the actual BC burden, also the flight tracks and the emissions transportation pathways have an essential influence on the measurement results.
We therefore used EMAC model simulations of MBC along the flight tracks with different emission scenarios (details on the EMAC model set-up in Sect. A1). First, we run the model for 2017 and 2020 with unmodified 2014 emission inventories (Hoesly et al., 2018). For the comparison and evaluation we use 1 min average measurement data 30 s prior and 30 s after each model output (see Sect. 2.5, Figs. 3 and S6). In the next step we calculate the descriptive statistics for vertical bins of 500 m (see Sect. A3). The difference for each altitude bin between the results of the EMAC runs for 2017 and 2020 is added to the 2020 measurement results to account for differences unrelated to emission changes (e.g. flight pattern, meteorology, and differences in emissions pattern as well as emissions from wildfires). The adjusted vertical profile for the 2020 measurements is then compared to the 2017 measurements to quantify the emission reductions according to Eq. (1).
where BCred is the unit-less reduction factor in MBC attributed to the COVID-19 confinements, and MBC2017H and MBC2020H stand for HALO measurements, while the difference between the EMAC results (MBC2017M and MBC2020M) is the adjustment factor, introduced earlier.
2.5 EMAC model evaluation
Besides the comparison between the EMAC results for MBC (Fig. 3), we also compare the modelled and observed ambient temperature as an independent variable (Fig. S6). The R2 for the ambient temperature observation–model comparison is close to unity, indicating a successful nudging of synoptic variables and that the meteorological conditions during the relevant time period are simulated adequately. Locations of peaks in MBC due to biomass burning emissions during EMeRGe EU (Fig. A1a) are captured by the model, whereas concentrations are underestimated (Figs. 3, 5a and A1a). The median for the 500 m bins, however, turns out to be robust against these outliers (R2 of 0.76 with a median absolute deviation (MAD) of 0.12 µg m−3 for 2017 and R2=0.90, MAD=0.07 µg m−3 for 2020), whereas the averages for the vertical profiles are more sensitive to peak concentrations, leading to a significantly smaller R2=0.43 with a high standard deviation (SD) of 0.57 µg m−3 for EMeRGe EU. For BLUESKY the R2=0.94 with SD =0.16 µg m−3 is slightly higher, compared to median values.
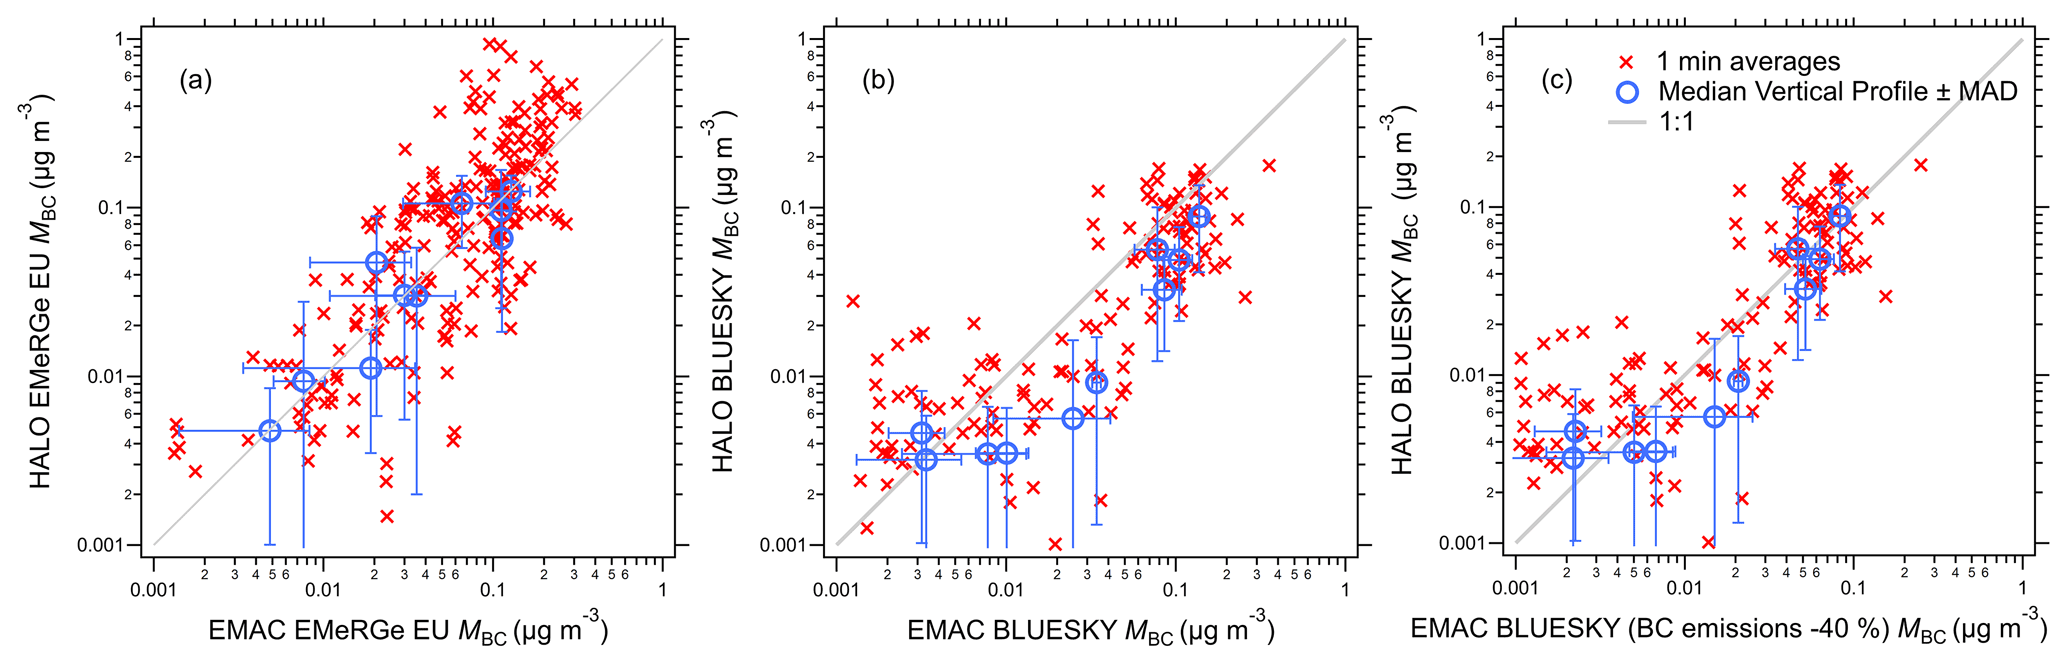
Figure 3Scatter plot for median MBC values of HALO measurements and EMAC model results. Red data show the comparison of 1 min averages. In blue median concentrations as used for the vertical profiles are shown. Error bars are one median absolute deviation (MAD) for the vertical merged data in 500 m altitude bins. Data shown are for the compared altitude up to 5000 m. Panel (a) corresponds to measurements from 2017 with R2 = 0.76. Panel (b) indicates 2020 measurements with initial emissions in the EMAC model and R2=0.90. Panel (c) is as (b) but with 40 % reduced anthropogenic emissions in EMAC simulation and R2=0.90.
The focal point of this study is the comparison between two HALO measurement campaigns, conducted over southern and western Europe in 2017 and 2020 (Fig. 1 and Sect. 2.1). By using EMAC model simulations we quantify to what extent the pandemic-related confinements in 2020, on the one hand, and other factors such as meteorology, on the other hand, influenced the observed MBC reduction. In addition, the atmospheric distribution of BC and its dependency on the magnitude of emissions is analysed. Furthermore, we examine the regional direct radiative effect of the BC reduction.
Determining the adjusted vertical distribution of the 2020 measurements (Fig. 4d and Sect. 2.4) enables us to quantify the anthropogenic emission reductions between both campaigns. Consequently, we calculated the difference between the two vertical distributions of MBC, retrieved from the two initial EMAC model simulations (Fig. 4a and b). In the following we added this difference to the 2020 measurements (Sect. 2.4), to generate an adjusted vertically integrated MBC burden (Sect. A4) of 129 µg m−2 for 2020, whereas the actual measured burdens are 113 µg m−2 for 2020 and 219 µg m−2 for 2017. Accordingly, the difference between the adjusted MBC burden for 2020 to the actual measurements from 2017 of 90 µg m−2 is attributable to reduced anthropogenic emissions. This value corresponds to a 41 % reduction in median MBC burden.

Figure 4Vertical distributions of measured and modelled MBC (a, b, c, d). Solid lines represent arithmetic mean values; dashed lines represent median values shading marks the interquartile range. Panel (a) shows EMeRGe EU 2017 measurements and EMAC simulations with initial 2014 emission inventories. Panel (b) shows BLUESKY 2020 measurements and EMAC simulations with initial 2014 emission inventories. Panel (c) shows BLUESKY measurements and EMAC simulations with anthropogenic BC emission reduced by 40 %. Panel (d) shows EMeRGe EU and BLUESKY measurements (as also shown in panels a and b) for comparison between the two campaigns. The grey solid line shows the adjusted median MBC concentration expected for BLUESKY measurements in 2020 (for details see Sect. 2.4). The adjusted value is based on non-confinement influences retrieved from the difference in the EMAC simulations for BLUESKY and EMeRGe EU with the 2014 emission inventories. It represents the expected measurement value, assuming the same meteorological and seasonal conditions for both campaigns. The difference between the medians of EMeRGe EU and adjusted BLUESKY represents the emission reduction. Panel (e) shows the measured NBC for EMeRGe EU in 2017 and BLUESKY in 2020. Panel (f) shows the geometric mean refractory BC core diameters (DrBC) for EMeRGe EU in 2017 and BLUESKY in 2020. Further details about the vertical distributions are in Sects. A3 and Supplement Sect. S1.
In accordance with the analysis described above (also, Sect. 2.4), we performed an evaluation of the regional sensitivity of the emission reductions. Therefore we separated our data set at a latitude of 47∘ N due to different vertical distributions and absolute concentrations north and south of that threshold (Fig. 6). Besides the differences in MBC the threshold also represents a rough estimate of the Alps corresponding to the HALO flight tracks. South of 47∘ N the median adjusted vertically integrated MBC burden is 37 % reduced, whereas concentrations north of 47∘ N are 38 % lower in 2020 compared to 2017 (Fig. 5). These results are in a good agreement with the reductions of 41 % we found for all data, showing that there is only little regional sensitivity for the reported MBC reductions.

Figure 5Vertical distribution of MBC north and south of 47∘ N. Solid lines represent arithmetic mean values; dashed lines represent median values shading marks the interquartile range. Panels (a) and (b) show data for EMeRGe EU from 2017, (c) and (d) for BLUESKY from 2020. Note that the x axis in (a) ranges between 0 and 0.4 µg m−3.
Besides an emission reduction, also other factors influence the differences in measured MBC. Figure 4 shows the median vertical distribution of measured and modelled MBC. For the two initial model runs (Fig. 4a and b) we used identical emission inventories for the year 2014 (Hoesly et al., 2018). This approach enables us to compare our measurements with an quantity independent from anthropogenic emissions (i.e. we apply the same emissions for both campaigns) and only account for drivers other than emission reductions for differences in MBC. While the 2017 measured mass burden is 4 % overestimated by the model (Fig. 4a and Table S4 in the Supplement), the measurements under confinement conditions are overestimated by 47 % in the model, when considering 2014 emissions (Fig. 4b). These results demonstrate that meteorological influences, different flight patterns and differences in seasonal emissions cannot explain the observed change in lower tropospheric MBC. As a metric for the direct comparison of the two measurement campaigns, we use the model results to adjust our measurements. Therefore, we calculate the difference of the model results for 2017 and 2020 for each altitude bin. Overall, the difference in modelled MBC between 2020 and 2017 accounts for a reduction of 7 % relative to 2017. This difference is a consequence of different flight pattern, meteorological conditions and seasonal variations in emissions.
We find a good agreement for the shape of the vertical BC distribution for measured and modelled MBC profiles. Even though the concentrations in 2020 are strongly overestimated the vertical extent is well described by the EMAC simulations (see also Fig. 4c with reduced anthropogenic emissions). The Pearson coefficient of determination (R2) for the vertical profiles of the observation–model comparison is 0.76 for 2017 and 0.90 for 2020 (Fig. 3). Based on the good agreement for the general vertical distribution during both campaigns, we conclude that the shape of the vertical distribution of anthropogenic BC in the lower troposphere remains unaffected by the emission changes in 2020.
We compare the median vertical profiles in this study to simplify the heterogeneously distributed MBC over Europe (Fig. 6). The vertical distribution of BC is strongly influenced by the planetary boundary layer (PBL) height, whereas its geographic pattern is more sensitive to emission hot spots like large cities or industrial areas. Elevated MBC during BLUESKY were mostly confined to the PBL in good agreements with observations for western Europe in the course of EMeRGe EU and literature (e.g. Ding et al., 2019). In southern Europe, however, MBC was more strongly decoupled from the PBL and we also observed high concentrations within the lower free troposphere in 2017 and occasionally in 2020. During both campaigns, MBC in southern Europe exceeds values in western Europe (at latitudes north of 47∘ N). During the measurements in 2017, we also encountered mixed biomass burning and anthropogenic pollution in and above the PBL, whereas the measurements in 2020 were not significantly influenced by biomass burning emissions (Fig. S10). The biomass burning influence was prominent in southern Europe from 40 and 42∘ N latitude (Figs. 6a and S9). The defined BC plume between 2000 and 3500 m altitude in southern Europe is dominated by biomass burning emissions. This biomass burning influence also caused the large discrepancies between the median and mean concentrations between 2000 and 3500 m in Figs. 4a and 5a. An analogy can be drawn to previous studies, which reported a similar pronounced stratification of biomass burning smoke above the PBL (Holanda et al., 2020). To be less sensitive to event-like measurements, we use median values for the comparison of the two aircraft campaigns (see also Sect. 2.5).
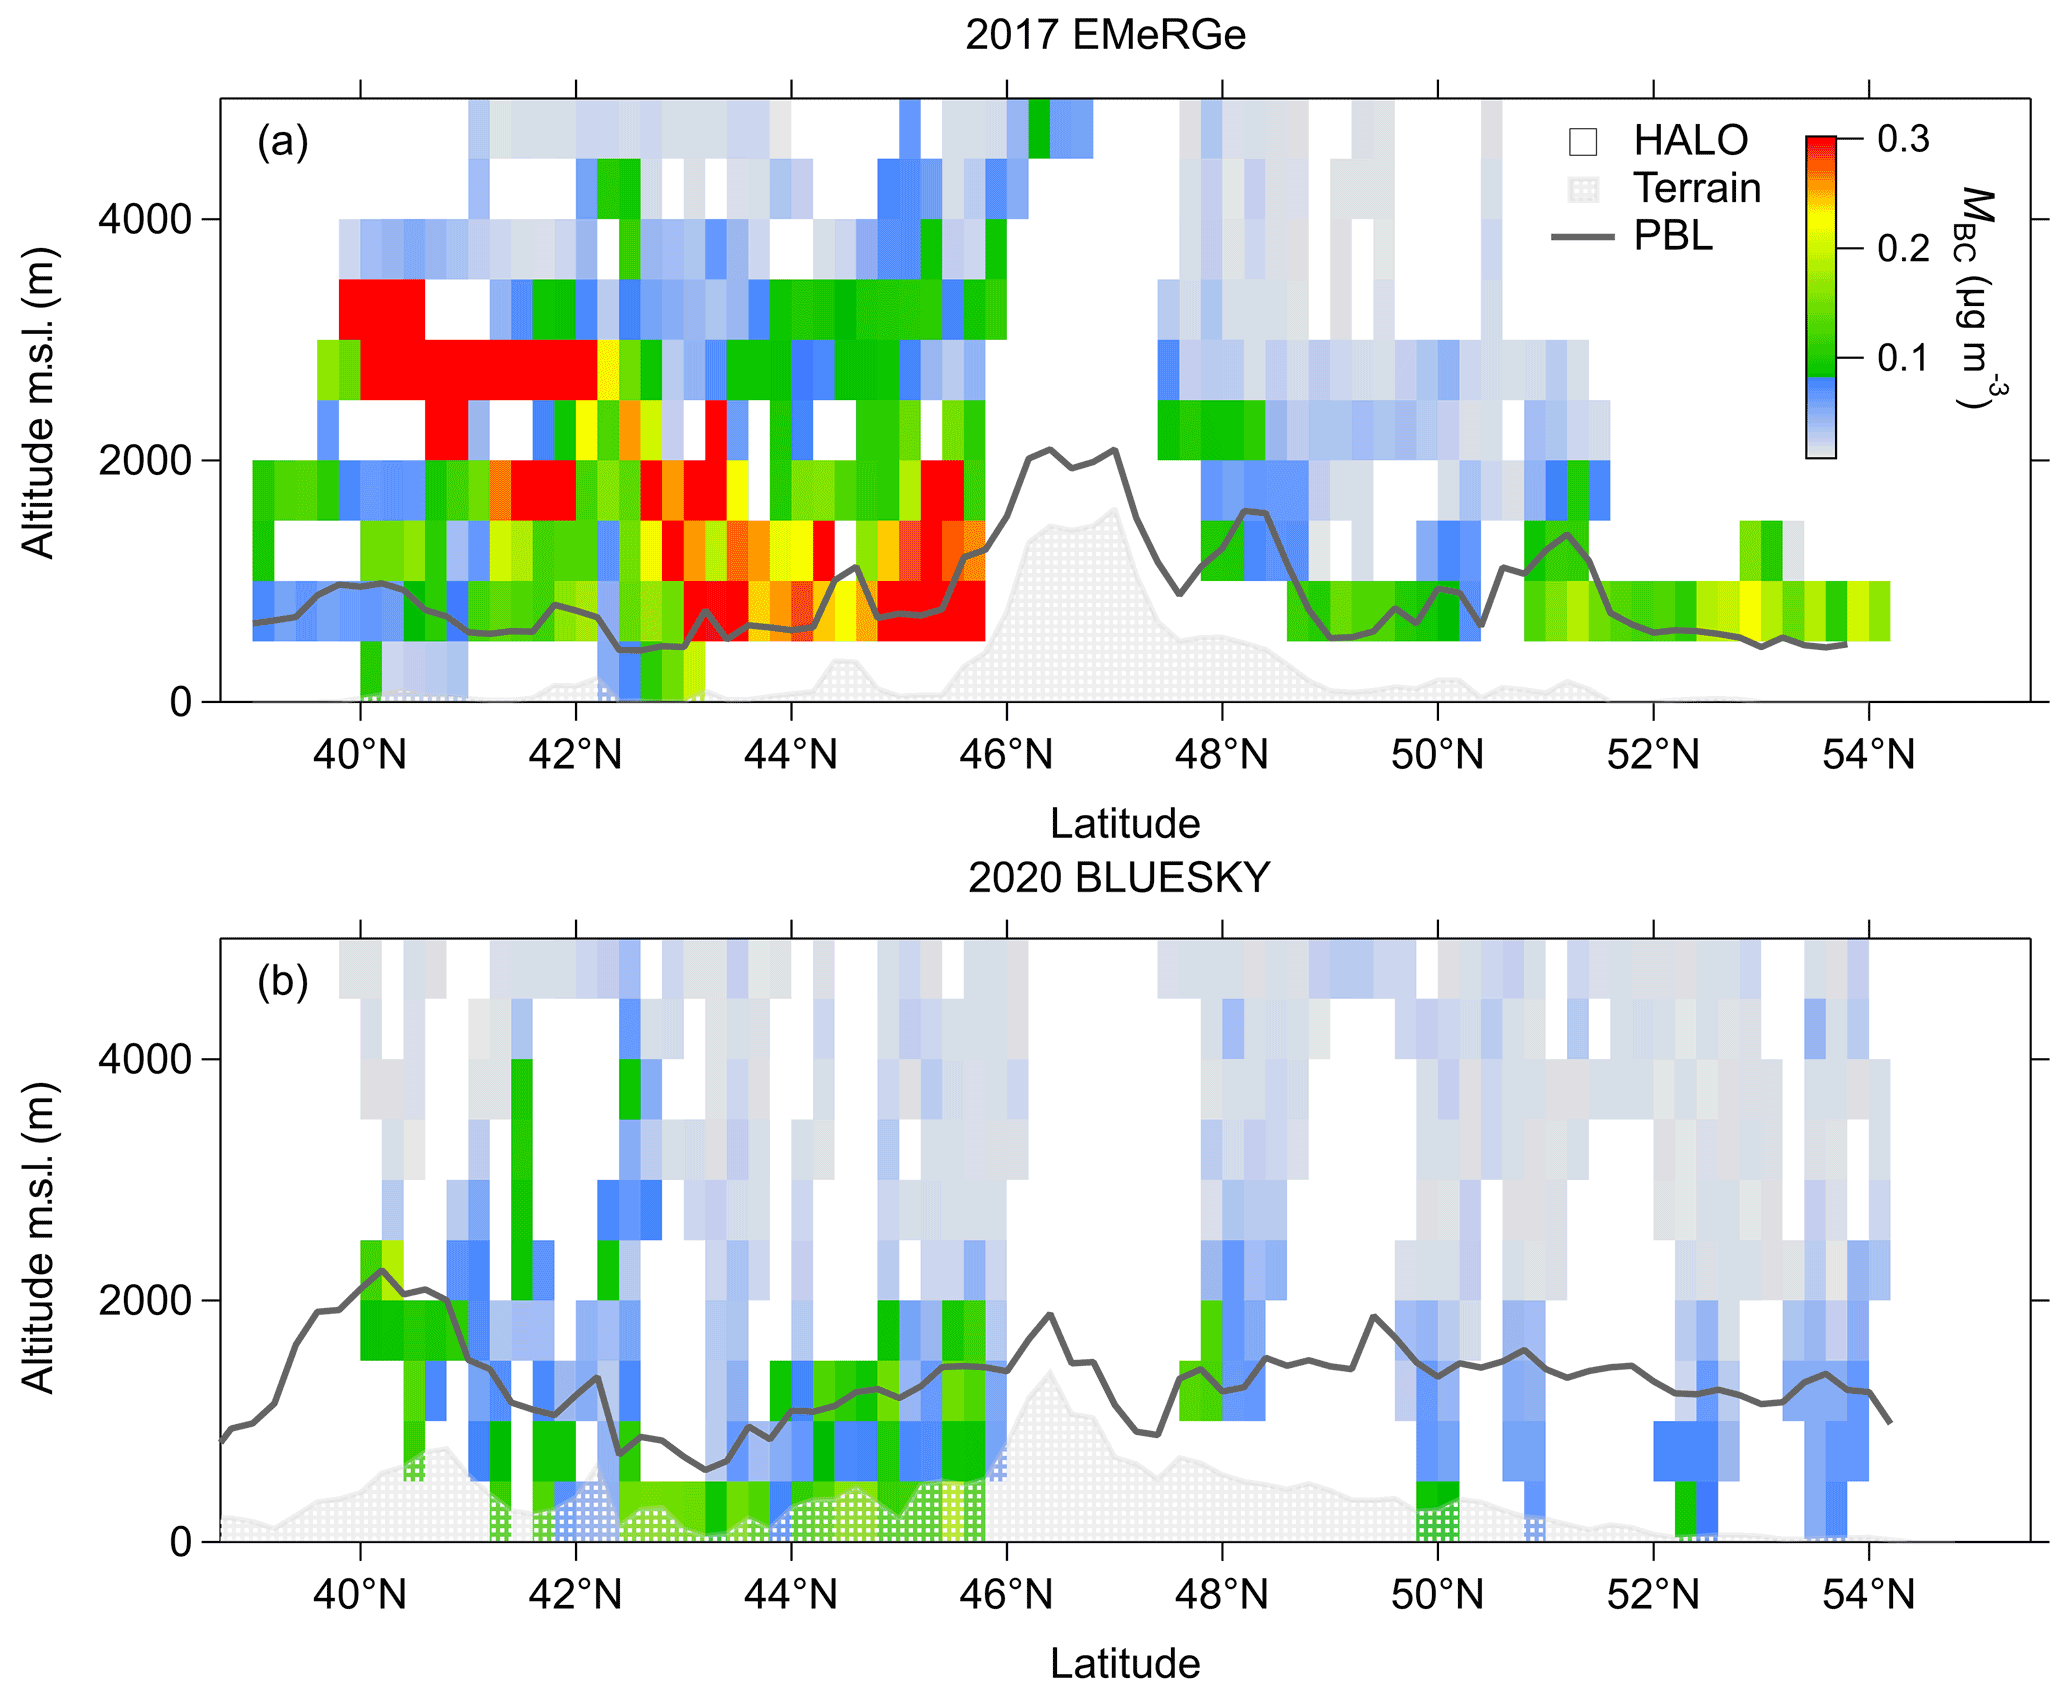
Figure 6(a) Cross section of MBC for 2017 EMeRGe EU measurements. Arithmetic mean for all data falling into a grid point of 0.2∘ latitude and 500 m altitude. The colour scale ranges from 0 to 0.3 µg m−3. Means exceeding this range are shown in red. Panel (b) is as (a) but for the 2020 BLUESKY measurements. The grey shading is the mean terrain height below flight track, and the grey solid line shows the planetary boundary layer height below flight track (details in Sect. S1 in the Supplement).
The measured values for MBC in 2020 are 48 % lower, when disregarding the model-based adjustment described above. For the refractory BC particle number concentration (NBC), we also find 48 % lower concentrations (Fig. 4 e). The good agreement between MBC and NBC is in accordance with the constant MBC to NBC ratios over its vertical distributions (Fig. 7). Also, the comparable median size distribution of the rBC particles between the two measurement campaigns, with rBC core diameters (DrBC) ranging between ∼ 120 and 180 nm (Fig. S7) shows the good agreement. The larger DrBC during the measurements in 2017 is likely due to influences of biomass burning smoke which tend to have larger DrBC compared to urban emissions (e.g. Schwarz et al., 2008; Liu et al., 2014; Holanda et al., 2020). The consistent ratio between MBC and NBC (Fig. 7) indicates that differences in coagulation growth are unlikely to play a significant role for the vertical profiles of DrBC reported here. Coagulation tends to predominately remove smaller particles and thus has a stronger impact on number concentrations than on the mass concentration (Ketzel and Berkowicz, 2004). This trend is not observable in our data (Fig. 7). Also anthropogenic BC emissions in Europe tend to get diluted before significant coagulation initiates (Vignati et al., 1999; Pohjola et al., 2003; Ketzel and Berkowicz, 2004). Besides coagulation and different sources, also size selective removal of BC cores with larger diameters by scavenging (e.g. Liu et al., 2020; Ohata et al., 2016) could play a role in the differences between 2017 and 2020. However there are no significant differences in precipitation in the summer months in Europe. Furthermore the range for DrBC agrees with literature values for urban emissions (e.g. Schwarz et al., 2008; Liu et al., 2014).
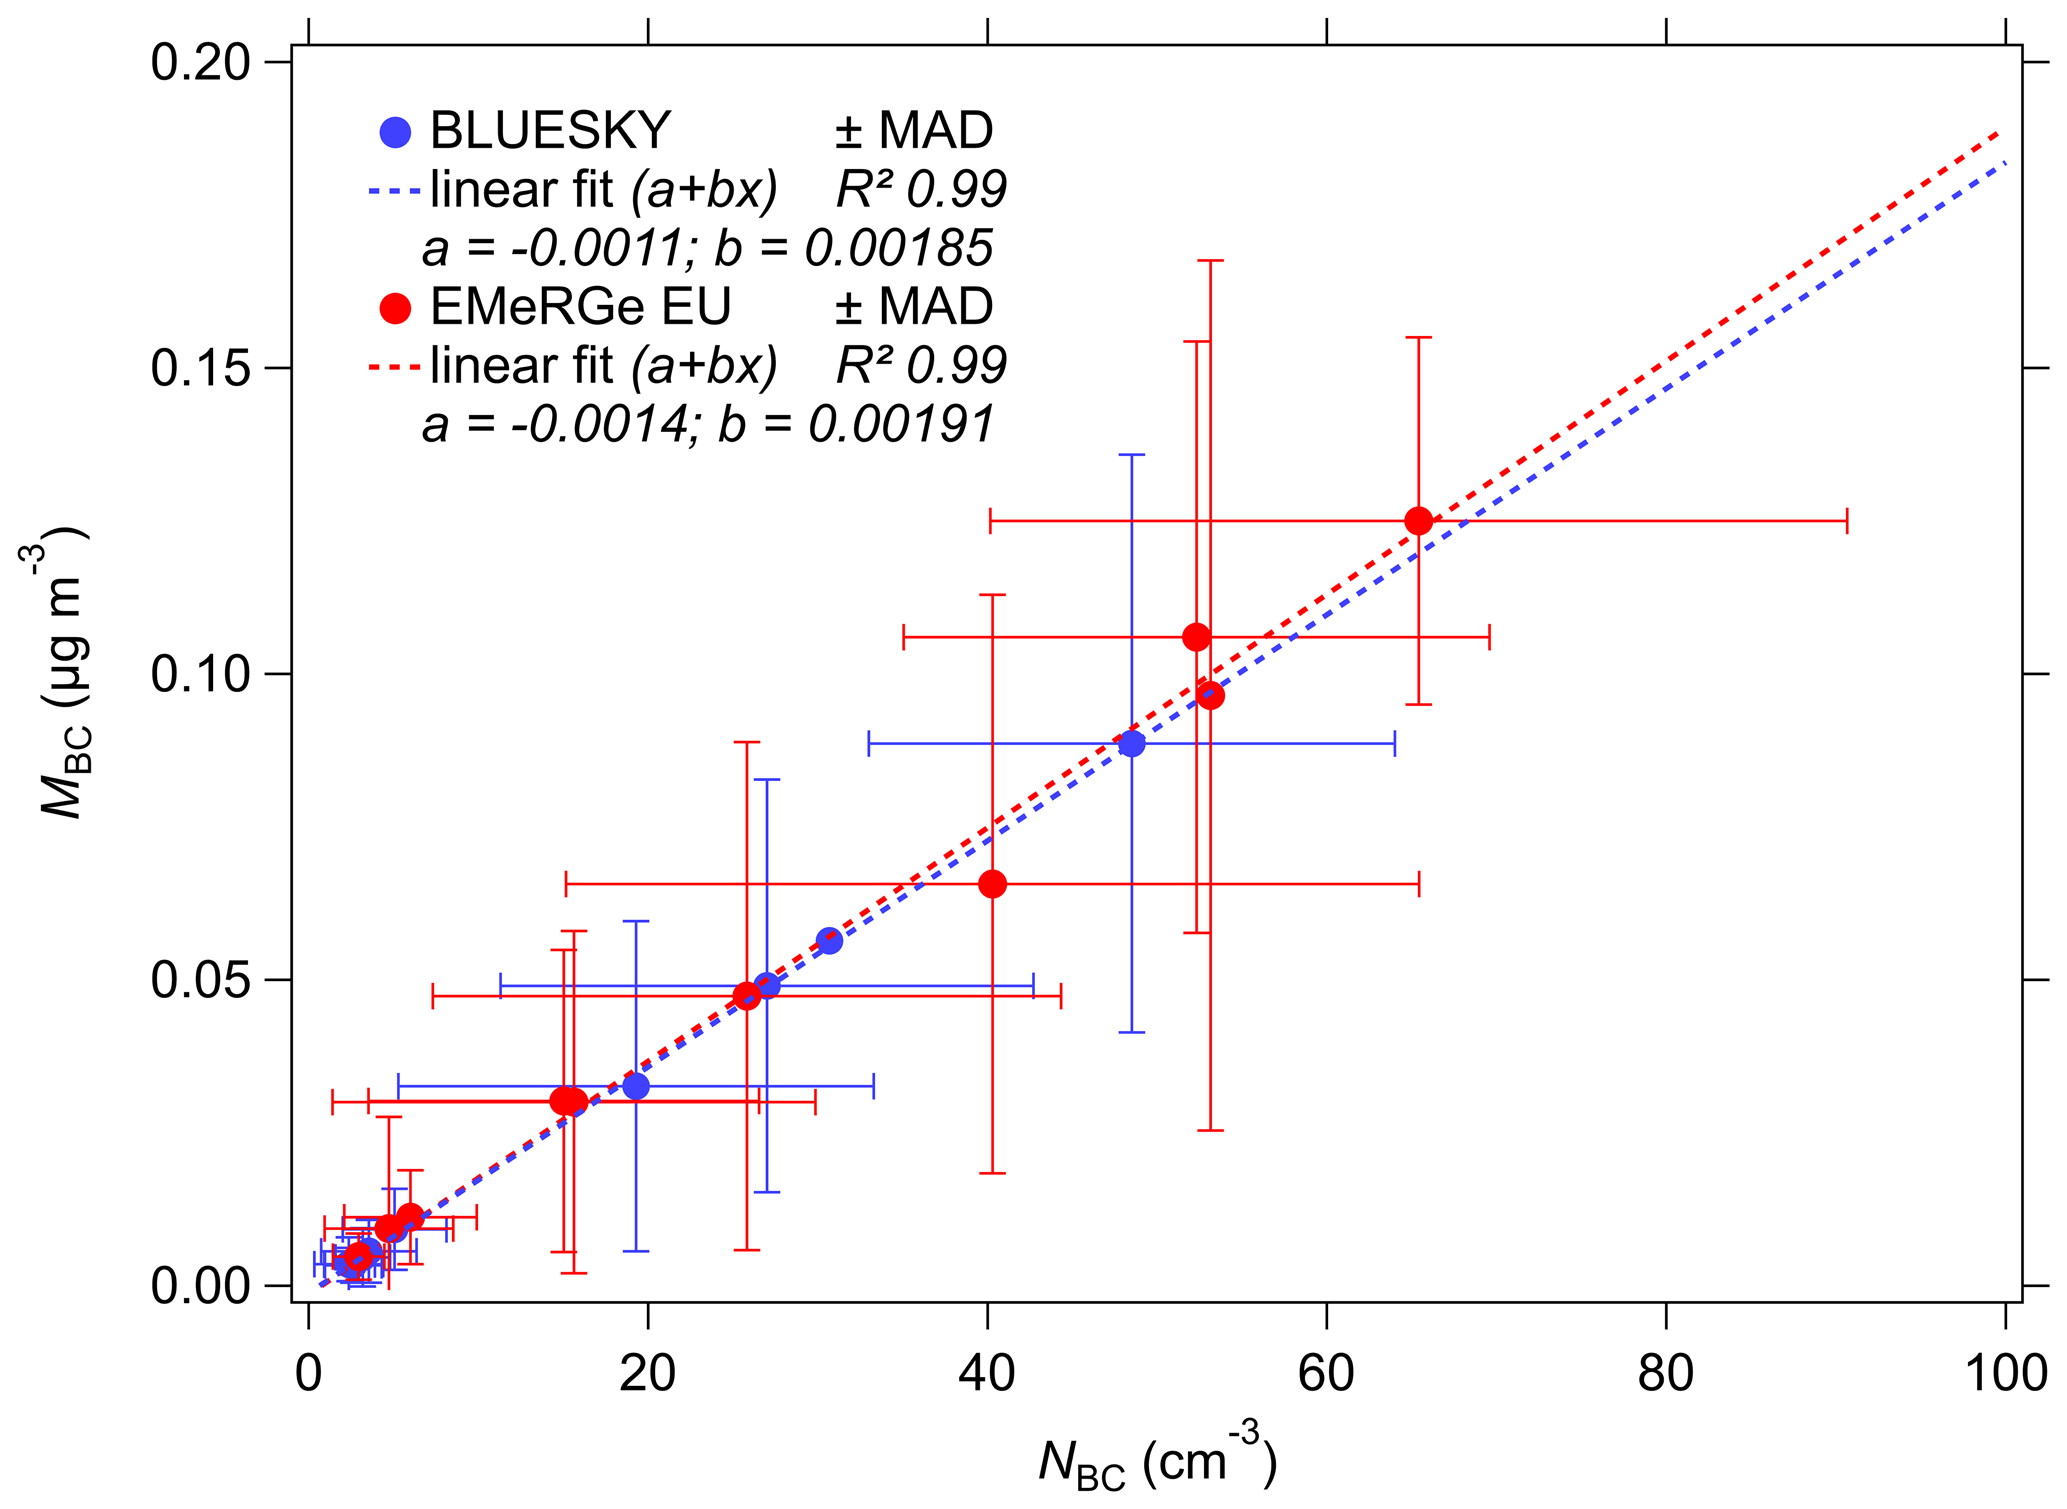
Figure 7Scatter plot for data from vertical distribution of MBC and NBC. In red, data from 2017 collected during EMeRGe EU, in blue data from BLUESKY in 2020. Median absolute deviation (MAD) is shown as whiskers. Dashed lines are linear fits for each campaign.
To estimate the effect the reductions have on Earth's radiative budget, we calculated the regional aerosol direct radiative effect in the measurement area (see Sect. A2). Therefore we reduced anthropogenic BC emissions in our EMAC simulation by 40 % and found a cooling effect of 0.06 W m−2 (Fig. S8) at the top of the atmosphere (TOA). This reduction due to a reduction of anthropogenic BC emissions by 40 % is as large as the global-mean BC radiative forcing, as assessed by the IPCC AR6 (Naik et al., 2021).
We present the first measurement study showing the influence of the unprecedented reduction in atmospheric pollution in 2020 on BC vertical distribution. Our measurements cover a large spatial area, measured on a rather short timescale. Thus, we deliver a representative data set, showing the changes in atmospheric BC concentration. We benefit in this comparison from the large spatial coverage, measured with the same instrumentation. In addition, the vertical extent of pollutants emitted in the PBL is observed with a high accuracy. In the discussion section we compare our aircraft data with recent studies, quantifying the impact of the COVID-19 confinements with other metrics. We find a general agreement, even though most studies use 2019 or a multiyear average as a reference for the comparison, while we compare two rather short periods in 2017 and 2020. We also investigate potential reasons for the reduction of atmospheric BC and other pollutants and consequently analyse data published by EUROSTAT (details in the Supplement) on fossil and solid fuel demand.
The 41 % reduced MBC we find exceeds the mean value for Europe (11 %) reported by Evangeliou et al. (2021). Nevertheless, our results fall within the reported range from 42 % to 8 % for southern and western Europe. Also studies with stronger regional focus agree well with our results. Moreda-Piñeiro et al. (2021) found, for the southwestern Atlantic region of Spain, BC reductions between 29 % and 51 %. Besides BC, also other atmospheric constituents were found to be reduced during the 2020 confinements. For the Po Valley, Lonati and Riva (2021) found benzene reduced by roughly 40 % in May 2020. Benzene is a volatile organic compound (VOC) primarily emitted by road traffic and in good correlation with anthropogenic BC emissions (Wren et al., 2018). Petetin et al. (2020) found NO2, as another traffic-related pollutant, decreased between 41 % and 55 % in Spain. By combining satellite and surface in situ measurements with numeric modelling, Venter et al. (2020) found fine particulate matter (PM2.5) reduced by 31 %. Apart from measurements, also proxy data are used to quantify the effect of the confinements on the atmosphere. Forster et al. (2020) show globally a decrease in BC of up to 22 % for the lockdown period and around 15 % in May 2020. When only considering the countries probed in our measurement flights, the reduction is 40 % in May and 20 % in June 2020. These literature values, based on mobility data from Google and Apple, agree well with our measurements. All of the above-mentioned studies, analysing the reductions in traffic-related pollutants and proxies, are in a similar range as our results.
Less traffic is identified as the driving force for improved air quality in 2020 (Le Quéré et al., 2020). This is reinforced by the drop in fossil fuel demand during the confinements in 2020 (Figs. S1, S2, S3, S4). For May 2020, fossil fuel demand was 30 % below the 2017 level (Fig. S1). We found the largest reduction in aircraft fuel demand with 75 % (Fig. S4). For road traffic fuels, the decrease is roughly 20 % (Diesel −18 %, Fig. S2 and gasoline −32 %, Fig. S3). Other than gasoline, diesel is widely used in the transportation sector and thus the impact of the confinements in 2020 is relatively smaller. On German highways, heavy goods traffic was reduced around 25 % compared to a more than 50 % reduction in passenger cars (Goecke et al., 2020). Studies found large differences in real-world emission factors between diesel and gasoline vehicles as well as passenger and heavy goods vehicles (Ban-Weiss et al., 2008, 2009; Wiesner et al., 2021; Peitzmeier et al., 2017); however, a source apportionment and thus a quantification of the single source impacts on the MBC reductions in 2020 is not possible based on our measurement data. The higher decrease in gasoline and aircraft fuel demand can be attributed to the drop in passenger traffic, due to travel bans, home office, and relinquished travelling activities.
Besides reduced emissions due to the COVID-19 confinements, other emission reductions took place between the two measurement campaigns. The total consumption of solid fuels (i.e. all common coal products, details in the Supplement) in 2020 was around 42 % below the corresponding value for 2017 (Fig. S5). However, solid fossil fuel only accounts for a small fraction (3 %) of the BC emissions from power generation (McDuffie et al., 2020). Accordingly, reductions in solid fossil fuel combustion for power generation have only little influence (<1 %) on the absolute MBC burden. Due to higher emission standards there are multi-year declines of the BC burden reported for the Northern Hemisphere (e.g. Singh et al., 2018; Querol et al., 2013; Kutzner et al., 2018). Based on surface measurement stations Kutzner et al. (2018) found an annual reduction between 1 % and 3 % for German urban background and rural sites in the period between 2005 until 2014. At traffic sites the annual reduction was as high as 5 %. For a kerbside station in London, Singh et al. (2018) found up to 8 % annual reduction in BC, whereas the reduction at rural and remote sites was as little as 0.6 %. Querol et al. (2013) obtain similar results for Spain with a high BC reduction in urban areas and little to statistically insignificant reductions in rural regions. The BC concentrations in our study fall within the range reported by Querol et al. (2013) for remote and rural sites in Spain. It has to be noted that BC concentrations show both a strong vertical gradient and a geographic pattern, highly sensitive to emission hot spots like traffic sites, domestic combustion sources or industrial areas. Thus the median vertical profiles shall be understood as lower tropospheric background concentrations with an anticipated annual reduction in the range of rural and urban background concentrations. Hence, around 3 % to 9 % of the reduction we found should be attributed to long-term trends in emission reductions.
The local TOA direct radiative effect of BC over continental Europe is considerably small, due to the low surface albedo and relatively low BC concentrations (Heald et al., 2014). Due to BC's ability to absorb solar radiation the reduced emissions show a net warming effect in the lower troposphere, by increasing the incoming radiation. However, there is a change of sign at pressure levels below 700 hPa (∽ 3000 m) resulting in an overall cooling effect at the TOA. Nevertheless, to get a full picture of the atmospheric response to the unprecedented atmospheric situation during the COVID-19 pandemic, more sophisticated studies are needed at this point. In particular the long-range transport of anthropogenic pollutants to remote regions like higher latitudes, where its climate impact is amplified by a high surface albedo and an increased ice melting due to deposition of atmospheric BC on snow and ice, will be of interest. Also, research on the long- and short-term radiative effects in combination with other relevant species will be very valuable for atmospheric science and policy makers. For these studies we present a good estimate for the near-immediate response of MBC in the area of southern and western Europe. Furthermore, we show that proxy data as used by Forster et al. (2020) or EUROSTAT data can serve well for the improvement and the definition of emission inventories during the exceptional atmospheric circumstances during the pandemic.
We showed that lower tropospheric median MBC was decreased by 41 % in southern and western Europe in 2020 compared to 2017. This reduction is attributed to two main reasons: the general decreasing trends of BC emissions in Europe accounting for 3 % to 9 % and the confinement of human movement as a result of the measures taken to minimize the spread of COVID-19 accounting for 32 % to 38 %. The effect of COVID-19 confinements on the atmospheric MBC found in this study generally agrees with earlier studies using ground-based and proxy data to estimate the confinement's effect. In addition to earlier studies, we present the first measurement results of airborne BC in 2020. We provide a consistent data set for a large spatial area and the vertical extent of MBC and NBC.
Our results confirm the near-immediate atmospheric response of MBC and NBC to anthropogenic activities. Reduced mobility drives the BC reductions in the lower troposphere. Some of these changes in mobility, such as reduced road and air traffic due to home office and video conferences, should be sustained in working culture. Model studies using our results can quantify the positive effects on public health and the atmosphere due to reductions in air pollution. Our study extends current knowledge about the distribution of pollutants in the atmosphere. It demonstrates that the impact of measures, which improve air quality, also influences climate. It thereby contributes to one of the most important challenges of this century, namely how to mitigate climate change.
A1 ECHAM/MESSy model
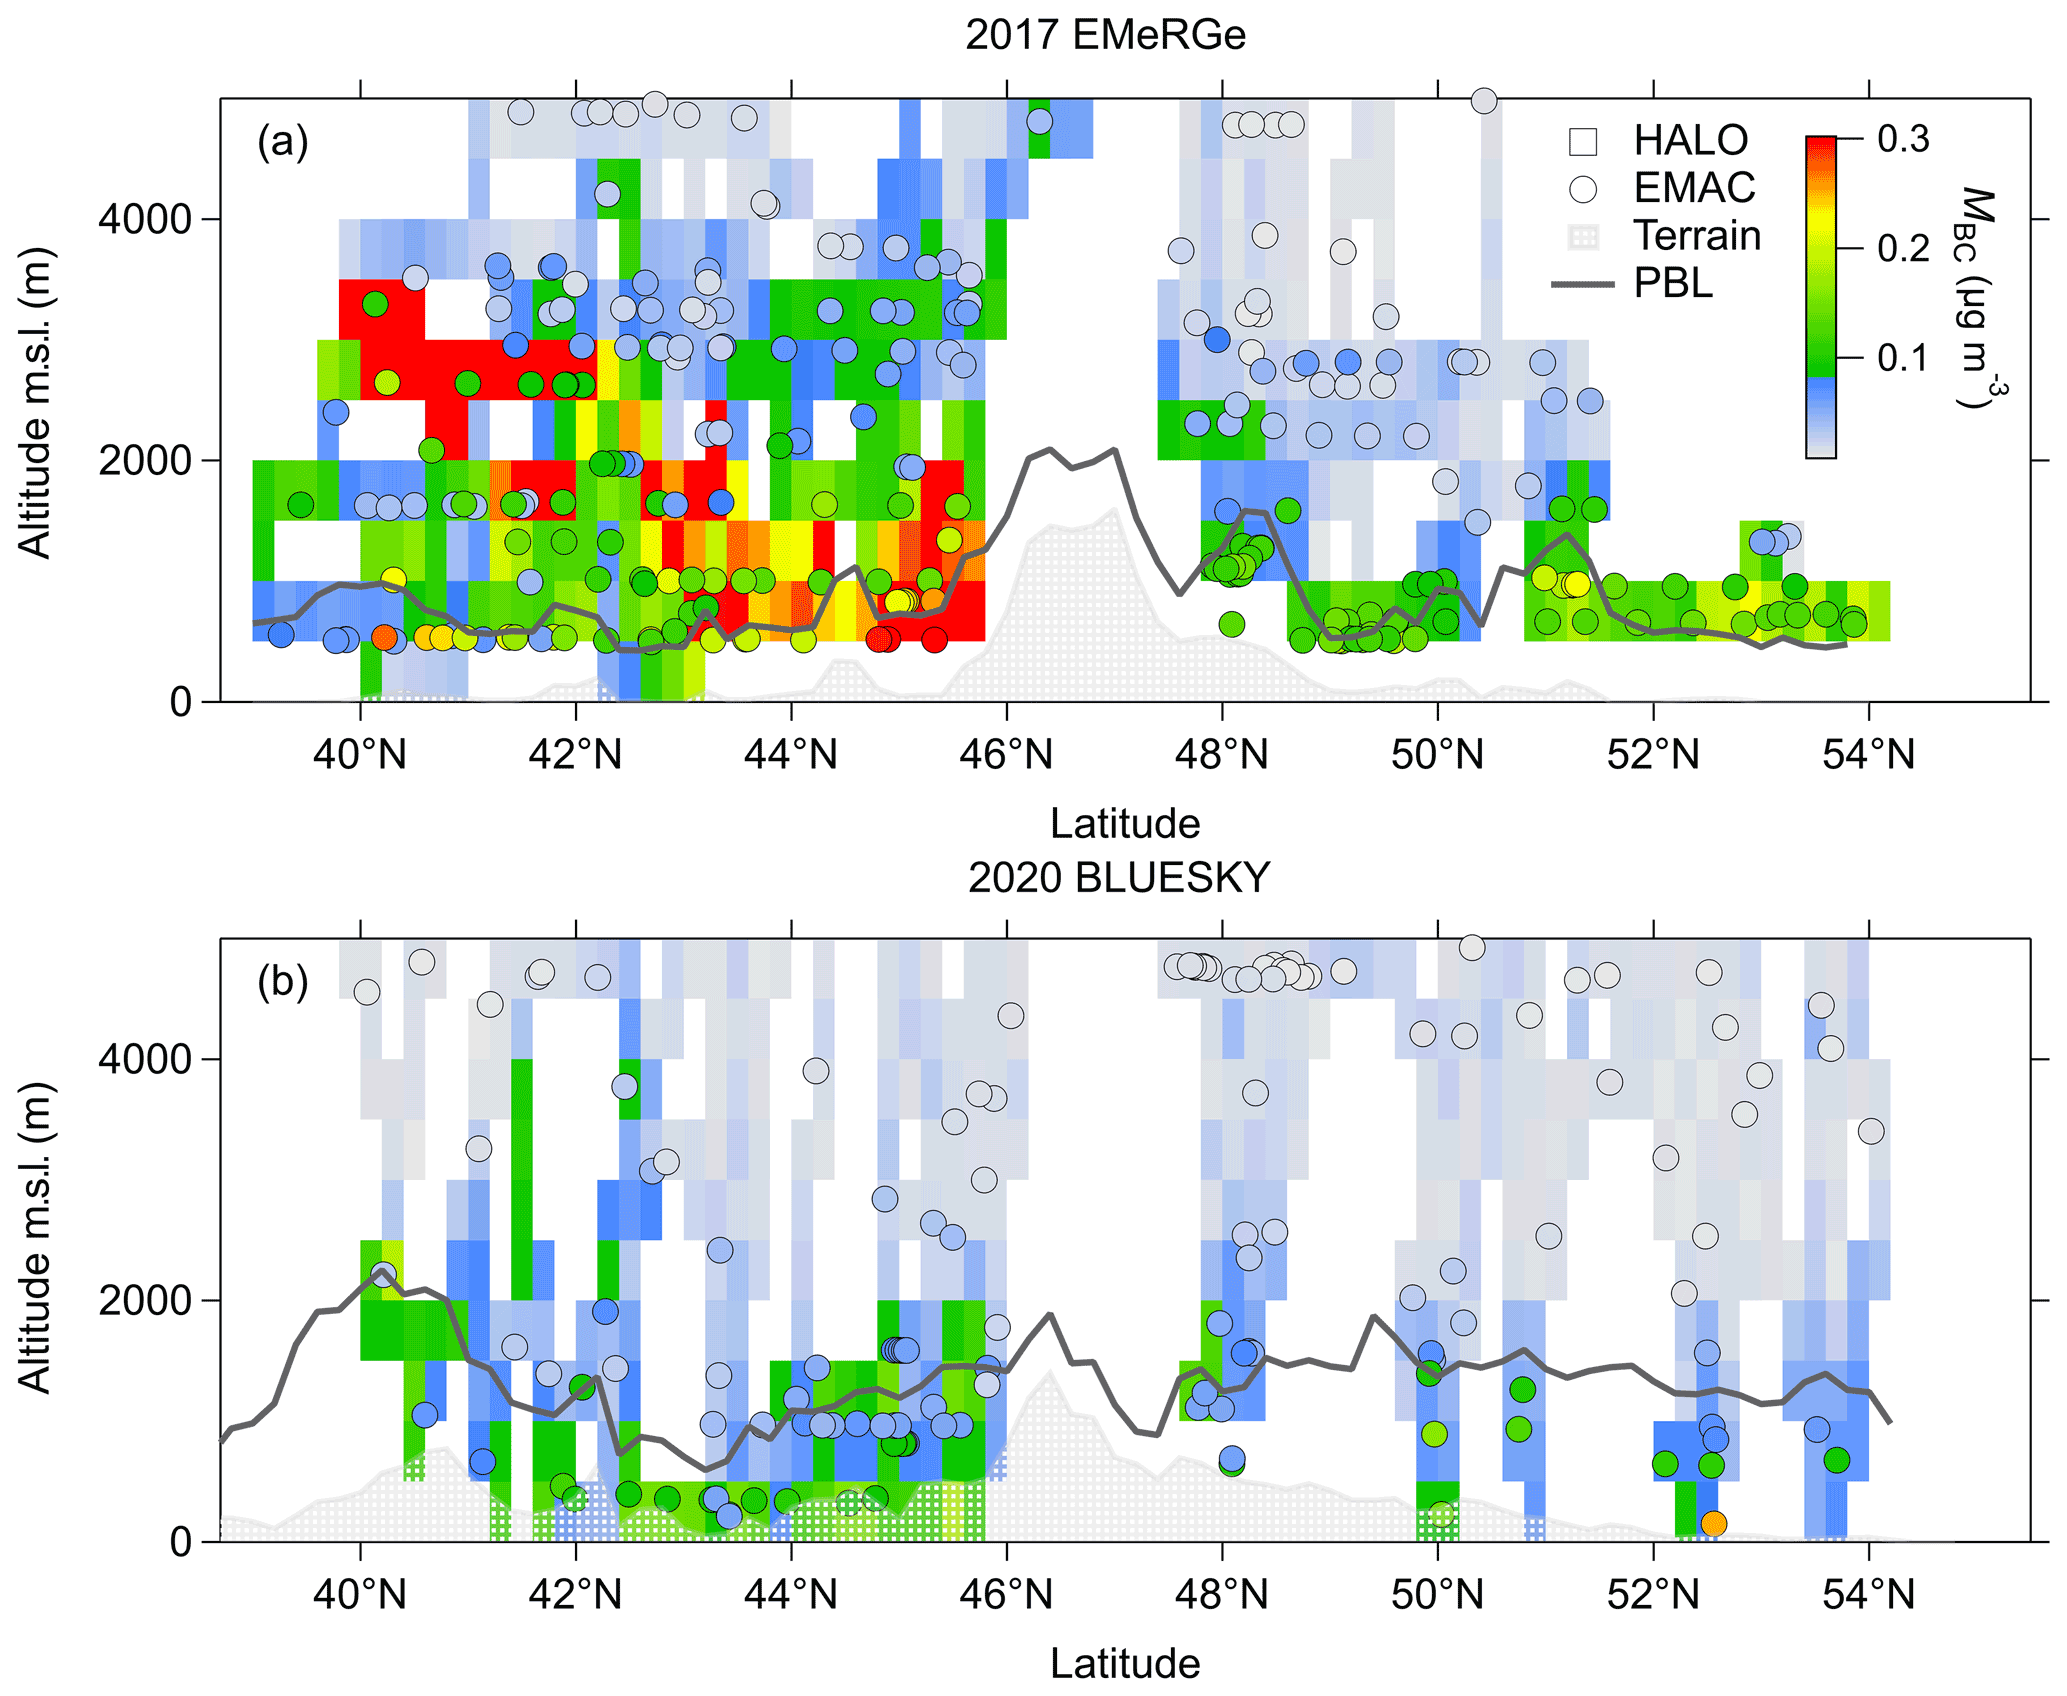
Figure A1(a) Cross section of MBC for 2017 EMeRGe EU measurements (rectangle marker). Arithmetic mean for all measurement data falling into a grid point of 0.2∘ latitude and 500 m altitude. The colour scale ranges from 0 to 0.3 µg m−3. Means exceeding this range are shown in red. As round marker EMAC model results are displayed without further modification. Panel (b) is as (a) but for the 2020 BLUESKY measurements. The grey shading is the mean terrain height below flight track, and the grey solid line shows the planetary boundary layer height below flight track (details in the Supplement).
We used the ECHAM/MESSy Atmospheric Chemistry (EMAC) model at T63 horizontal spectral resolution (approx. 1.8∘ × 1.8∘) and with 31 hybrid terrain following pressure levels up to 10 hPa in the lower stratosphere (Jöckel et al., 2005, 2010; Pozzer et al., 2012; Lelieveld et al., 2019). The core atmospheric model employed here is the 5th-generation European Centre Hamburg (ECHAM5) general circulation model. EMAC includes multiple sub-models that represent the tropospheric and stratospheric processes and their interaction with the biosphere. We used the Modular Earth Submodel System (MESSy, v.2.54, Jöckel et al., 2010; Beer et al., 2020) to link submodels that describe emission, aerosols, atmospheric chemistry, deposition and other processes. The GMXe (Global Modal Aerosol Extension) submodel (Pringle et al., 2010) was employed to simulate the microphysical processes in aerosols and the gas/aerosol portioning. The GMXe organizes the aerosols into hydrophilic and hydrophobic modes. The hydrophilic mode encompasses aerosols in the entire size spectrum (coarse, accumulation, Aitken and nucleation), whereas the hydrophobic mode does not consider the nucleation mode. We updated the assumption in the GMXe by emitting black and organic carbon in accumulation and Aitken modes following a recent study (Paasonen et al., 2016). The gas phase and heterogeneous chemistry was simulated with the MECCA submodel (Sander et al., 2005, 2019). The ORACLE (Organic Aerosol Composition and Evolution) submodel (Tsimpidi et al., 2014, 2018) was used to simulate the atmospheric evolution and composition of the organic aerosols. The aerosol optical properties are calculated by the AEROPT (AERosol OPTical properties) submodel (Lauer et al., 2007; Pozzer et al., 2012; Dietmüller et al., 2016; Klingmüller et al., 2019), which assumes the aerosol components in each mode to be spherical, well mixed and with volume-averaged refractive indices. The radiation calculations were done with the RAD submodel (Dietmüller et al., 2016), which is equipped with logical switches for diagnostically calling the radiation schemes multiple times within one model set-up for calculation radiative forcings. The S4D (Sampling in 4 Dimensions) submodel (Jöckel et al., 2010) was used to interpolate and write the model outputs, online at spatial and temporal steps of the EMeRGe EU and BLUESKY aircraft measurements. Apart from these submodels, the following MESSy submodels were enabled: AIRSEA, BIOBURN, CLOUD, CLOUDOPT, CONVEC, CVTRANS, DDEP, E5VDIFF, H2O, JVAL, LNOX, OFFEMIS, ONEMIS, ORBIT, SCAV, SEDI, SORBIT, SURFACE, TNUDGE and TROPOP. An explicit description of each of these submodels can be found in the MESSy submodel list (https://www.messy-interface.org/current/auto/messy_submodels.html, last access: 27 June 2022).
The EMAC global simulations, nudged towards the ERA-5 meteorological re-analyses, were performed for two time periods – January to July 2017 and January to June 2020 – to coincide with the EMeRGe EU and BLUESKY aircraft campaigns respectively. Over the past decade, EMAC model simulations of aerosols and trace gases have been extensively assessed against ground measurements and satellite retrievals (Lelieveld et al., 2007; Kerkweg et al., 2006; Lelieveld et al., 2019; Tsimpidi et al., 2018; Brühl et al., 2015; Pozzer et al., 2015; Zimmermann et al., 2020). Here, we use the monthly varying Community Emissions Data System (CEDS) anthropogenic emission inventory of 2014, Hoesly et al. (2018) at 0.5∘ × 0.5∘ resolution for the primary emitted species including CO (carbon monoxide), NO2 (oxides of nitrogen), SO2 (sulfur dioxide), NH3 (ammonia), BC, OC (organic carbon) and NMVOCs (non-methane volatile organic compounds). Biomass burning emissions were obtained from the Global Fire Assimilation System (GFAS) inventory Kaiser et al. (2012). The emissions data were then pre-processed and vertically distributed in six emission heights following Pozzer et al. (2012). Residential and commercial fuel use was the largest emitter of BC (46 934 t yr−1) over the region investigated in this study (Fig. 1, i.e. latitude between −5 and 16∘ and longitude between 37.5 and 54.5∘), followed by emissions from land transportation (36 023 t yr−1), power generation (22 161 t yr−1), industrial combustion and process (17 737 t yr−1), agricultural waste burning (1283 t yr−1), and air traffic (0.4067 t yr−1). For comparisons with the EMeRGe EU and BLUESKY aircraft measurements, BC concentration was diagnosed along the aircraft routes. A sensitivity model simulation was performed by reducing anthropogenic BC emissions from all sectors by 40 % to compare with the BLUESKY observations.
A2 EMAC regional radiative impact of the changed MBC
The radiative effect due to 40 % reduction in MBC is calculated with EMAC for the local radiative forcing (latitude between −5 and 16∘ and longitude between 37.5 and 54.5∘) for the months May and June. The radiative effect is the difference between one run with full aerosol emissions and one with 40 % reduced anthropogenic MBC emissions. The calculations are done for short-wave radiation with clear-sky conditions.
A3 Vertical and latitudinal distribution of MBC and NBC
The vertical profiles of MBC, NBC (Fig. 4) and the microphysical BC properties in Figs. 4d and S7 represent all the measurement data with the model output during the two campaigns. For the model evaluation we used only measurement data from 30 s prior and 30 s after a EMAC model output (Figs. 3 and S6). No EMAC simulations for NBC were conducted. To obtain the vertical profiles the measurement and model data are concatenated in 500 m altitude bins. The statistical values given in the particular figure and table are calculated for each bin with IGOR Pro (WaveMetrics Inc. version 7.08). We calculated the arithmetic mean, also referred to as mean within this study.
Also the log-normal size distributions, given in Figs. 4d and S7, are calculated for the concatenated data in each altitude bin. We used the following function according to (Heintzenberg, 1994):
with A as a free parameter, Dg as mean geometric diameters and the widths (i.e. the standard deviations, σg) of the core size distributions.
A4 Vertically integrated MBC burden
The vertically integrated MBC burden per surface area is calculated as the integral of the median vertical MBC concentration. We only considered vertical bins for the comparison where during both campaigns measurements were performed along with EMAC model outputs. Note that the MBC per cubic metre in the vertical profiles is STP corrected. Thus, we scaled the altitude bins with a scaling factor (SP, Table S4) based on the pressure altitude. Equation (A2) shows the calculation of (SP) with hbin as the altitude of the corresponding altitude bin in the vertical profile.
The Modular Earth Submodel System (MESSy) is continuously further developed and applied by a consortium of institutions (MESSy, 2022). The usage of MESSy and access to the source code is licensed to all affiliates of institutions which are members of the MESSy Consortium. Institutions can become a member of the MESSy Consortium by signing the MESSy Memorandum of Understanding. More information can be found on the MESSy Consortium Website (http://www.messy-interface.org, last access: 27 June 2022).
The data set for the vertical distribution of MBC (Table S1), NBC (Table S2), the rBC core size distribution (Table S3) and the vertically integrated MBC burden (Table S4) are provided in the Supplement. The original data set is available under https://doi.org/10.17617/3.GKRXCN (Krüger et al., 2022). Further data from the two HALO missions are available at the HALO database (https://halo-db.pa.op.dlr.de/, last access: 4 July 2022, https://doi.org/10.17616/R39Q0T, DLR, 2022). For data requests beyond the available data, please refer to the corresponding author.
The supplement related to this article is available online at: https://doi.org/10.5194/acp-22-8683-2022-supplement.
MLP, BAH and OOK designed the study. BAH and OOK collected the HALO measurement data. OOK, BAH, DW, CP, JL, CV, MDAH and JPB played key roles in the collection and analysis of the data in the course of the HALO EMeRGe EU and BLUESKY campaigns. SC and AP conducted the EMAC simulations. JQ supported with the data interpretation and validation. OOK wrote the manuscript with contributions of all authors. All authors contributed to the discussion of the results as well as the finalization of the manuscript. UP and MLP supervised the study.
At least one of the (co-)authors is a member of the editorial board of Atmospheric Chemistry and Physics. The peer-review process was guided by an independent editor, and the authors also have no other competing interests to declare.
Publisher's note: Copernicus Publications remains neutral with regard to jurisdictional claims in published maps and institutional affiliations.
This article is part of the special issues “BLUESKY atmospheric composition measurements by aircraft during the COVID-19 lockdown in spring 2020” and “Effect of Megacities on the Transport and Transformation of Pollutants at Regional and Global Scales (EMeRGe) (ACP/AMT inter-journal SI)”. It is not associated with a conference.
We thank all people involved in the technical, logistical, and scientific support of the EMeRGe EU and BLUESKY HALO missions, in particular Katharina Kaiser, Daniel Sauer, Thomas Klimach, Vladyslav Nenakhov, Thomas Leder, the DLR flight department for support during the campaign and the pilots for excellent flight operations. Further, we thank Gerhard Lammel for fruitful discussions. Support by the Max Planck Society and by the German Research Foundation (DFG) is greatly appreciated.
We are grateful for the constructive comments and questions by the two anonymous referees. This input helped and motivated us to improve the manuscript. We also thank James Allan for serving as the handling editor of this article.
We acknowledge the use of data and/or imagery from NASA's Land, Atmosphere Near real-time Capability for EOS (LANCE) system (https://earthdata.nasa.gov/lance, last access: 27 June 2022), part of NASA's Earth Observing System Data and Information System (EOSDIS). We acknowledge the use of data and/or imagery from NASA's Fire Information for Resource Management System (FIRMS) (https://earthdata.nasa.gov/firms, last access: 27 June 2022), part of NASA's Earth Observing System Data and Information System (EOSDIS).
This research has been supported by the Deutsche Forschungsgemeinschaft (grant no. HALO-SPP 1294).
The article processing charges for this open-access publication were covered by the Max Planck Society.
This paper was edited by James Allan and reviewed by two anonymous referees.
Andreae, M. O.: Aerosols Before Pollution, Science, 315, 50–51, https://doi.org/10.1126/science.1136529, 2007. a
Andreae, M. O., Afchine, A., Albrecht, R., Holanda, B. A., Artaxo, P., Barbosa, H. M. J., Borrmann, S., Cecchini, M. A., Costa, A., Dollner, M., Fütterer, D., Järvinen, E., Jurkat, T., Klimach, T., Konemann, T., Knote, C., Krämer, M., Krisna, T., Machado, L. A. T., Mertes, S., Minikin, A., Pöhlker, C., Pöhlker, M. L., Pöschl, U., Rosenfeld, D., Sauer, D., Schlager, H., Schnaiter, M., Schneider, J., Schulz, C., Spanu, A., Sperling, V. B., Voigt, C., Walser, A., Wang, J., Weinzierl, B., Wendisch, M., and Ziereis, H.: Aerosol characteristics and particle production in the upper troposphere over the Amazon Basin, Atmos. Chem. Phys., 18, 921–961, https://doi.org/10.5194/acp-18-921-2018, 2018. a, b
Andrés Hernández, M. D., Hilboll, A., Ziereis, H., Förster, E., Krüger, O. O., Kaiser, K., Schneider, J., Barnaba, F., Vrekoussis, M., Schmidt, J., Huntrieser, H., Blechschmidt, A.-M., George, M., Nenakhov, V., Harlass, T., Holanda, B. A., Wolf, J., Eirenschmalz, L., Krebsbach, M., Pöhlker, M. L., Kalisz Hedegaard, A. B., Mei, L., Pfeilsticker, K., Liu, Y., Koppmann, R., Schlager, H., Bohn, B., Schumann, U., Richter, A., Schreiner, B., Sauer, D., Baumann, R., Mertens, M., Jöckel, P., Kilian, M., Stratmann, G., Pöhlker, C., Campanelli, M., Pandolfi, M., Sicard, M., Gómez-Amo, J. L., Pujadas, M., Bigge, K., Kluge, F., Schwarz, A., Daskalakis, N., Walter, D., Zahn, A., Pöschl, U., Bönisch, H., Borrmann, S., Platt, U., and Burrows, J. P.: Overview: On the transport and transformation of pollutants in the outflow of major population centres – observational data from the EMeRGe European intensive operational period in summer 2017, Atmos. Chem. Phys., 22, 5877–5924, https://doi.org/10.5194/acp-22-5877-2022, 2022. a, b, c
Ban-Weiss, G. A., McLaughlin, J. P., Harley, R. A., Lunden, M. M., Kirchstetter, T. W., Kean, A. J., Strawa, A. W., Stevenson, E. D., and Kendall, G. R.: Long-term changes in emissions of nitrogen oxides and particulate matter from on-road gasoline and diesel vehicles, Atmos. Environ., 42, 220–232, https://doi.org/10.1016/j.atmosenv.2007.09.049, 2008. a
Ban-Weiss, G. A., Lunden, M. M., Kirchstetter, T. W., and Harley, R. A.: Measurement of black carbon and particle number emission factors from individual heavy-duty trucks, Environ. Sci. Technol., 43, 1419–1424, https://doi.org/10.1021/es8021039, 2009. a
Beer, C. G., Hendricks, J., Righi, M., Heinold, B., Tegen, I., Groß, S., Sauer, D., Walser, A., and Weinzierl, B.: Modelling mineral dust emissions and atmospheric dispersion with MADE3 in EMAC v2.54, Geosci. Model Dev., 13, 4287–4303, https://doi.org/10.5194/gmd-13-4287-2020, 2020. a
Bond, T. C., Doherty, S. J., Fahey, D. W., Forster, P. M., Berntsen, T., Deangelo, B. J., Flanner, M. G., Ghan, S., Kärcher, B., Koch, D., Kinne, S., Kondo, Y., Quinn, P. K., Sarofim, M. C., Schultz, M. G., Schulz, M., Venkataraman, C., Zhang, H., Zhang, S., Bellouin, N., Guttikunda, S. K., Hopke, P. K., Jacobson, M. Z., Kaiser, J. W., Klimont, Z., Lohmann, U., Schwarz, J. P., Shindell, D., Storelvmo, T., Warren, S. G., and Zender, C. S.: Bounding the role of black carbon in the climate system: A scientific assessment, J. Geophys. Res.-Atmos., 118, 5380–5552, https://doi.org/10.1002/jgrd.50171, 2013. a, b, c
Brühl, C., Lelieveld, J., Tost, H., Höpfner, M., and Glatthor, N.: Stratospheric sulfur and its implications for radiative forcing simulated by the chemistry climate model EMAC, J. Geophys. Res.-Atmos., 120, 2103–2118, https://doi.org/10.1002/2014JD022430, 2015. a
CIESIN: Center for International Earth Science Information Network – CIESIN – Columbia University, Gridded Population of the World, Version 4 (GPWv4): Population Density, Revision 11, Palisades, NY, NASA Socioeconomic Data and Applications Center (SEDAC) [code], https://doi.org/10.7927/H49C6VHW, 2018. a
Dietmüller, S., Jöckel, P., Tost, H., Kunze, M., Gellhorn, C., Brinkop, S., Frömming, C., Ponater, M., Steil, B., Lauer, A., and Hendricks, J.: A new radiation infrastructure for the Modular Earth Submodel System (MESSy, based on version 2.51), Geosci. Model Dev., 9, 2209–2222, https://doi.org/10.5194/gmd-9-2209-2016, 2016. a, b
Ding, S., Liu, D., Zhao, D., Hu, K., Tian, P., Zhou, W., Huang, M., Yang, Y., Wang, F., Sheng, J., Liu, Q., Kong, S., Cui, P., Huang, Y., He, H., Coe, H., and Ding, D.: Size-Related Physical Properties of Black Carbon in the Lower Atmosphere over Beijing and Europe, Environ. Sci. Technol., 53, 11112–11121, https://doi.org/10.1021/acs.est.9b03722, 2019. a
Ditas, J., Ma, N., Zhang, Y., Assmann, D., Neumaier, M., Riede, H., Karu, E., Williams, J., Scharffe, D., Wang, Q., Saturno, J., Schwarz, J. P., Katich, J. M., McMeeking, G. R., Zahn, A., Hermann, M., Brenninkmeijer, C. A. M., Andreae, M. O., Pöschl, U., Su, H., and Cheng, Y.: Strong impact of wildfires on the abundance and aging of black carbon in the lowermost stratosphere, P. Natl. Acad. Sci. USA, 115, E11595–E11603, https://doi.org/10.1073/pnas.1806868115, 2018. a
Deutsches Zentrum für Luft- und Raumfahrt (DLR): Mission: EMERGE-EU and Mission:BLUESKY, HALO database [data set], https://doi.org/10.17616/R39Q0T, 2022. a
Evangeliou, N., Platt, S. M., Eckhardt, S., Lund Myhre, C., Laj, P., Alados-Arboledas, L., Backman, J., Brem, B. T., Fiebig, M., Flentje, H., Marinoni, A., Pandolfi, M., Yus-Dìez, J., Prats, N., Putaud, J. P., Sellegri, K., Sorribas, M., Eleftheriadis, K., Vratolis, S., Wiedensohler, A., and Stohl, A.: Changes in black carbon emissions over Europe due to COVID-19 lockdowns, Atmos. Chem. Phys., 21, 2675–2692, https://doi.org/10.5194/acp-21-2675-2021, 2021. a, b
Forster, P. M., Forster, H. I., Evans, M. J., Gidden, M. J., Jones, C. D., Keller, C. A., Lamboll, R. D., Quéré, C. L., Rogelj, J., Rosen, D., Schleussner, C. F., Richardson, T. B., Smith, C. J., and Turnock, S. T.: Current and future global climate impacts resulting from COVID-19, Nat. Clim. Change, 10, 913–919, https://doi.org/10.1038/s41558-020-0883-0, 2020. a, b, c
Goecke, H., Puls, T., and Wendt, J.: Vollbremsung: Die Folgen vonCorona für den Straßenverkehr, IW-Kurzbericht, 60, https://www.iwkoeln.de/fileadmin/user_upload/Studien/Kurzberichte/PDF/2020/IW-Kurzbericht_2020_Corona_Stra %C3%9 Fenverkehr.pdf (last access: 27 June 2022), 2020. a
Gustafsson, Ö. and Ramanathan, V.: Convergence on climate warming by black carbon aerosols, P. Natl. Acad. Sci. USA, 113, 4243–4245, https://doi.org/10.1073/pnas.1603570113, 2016. a
Gysel-Beer, M. and Corbin, J.: SP2 toolkit 4.115 (Igor7) (Version 4.115), Zenodo [code], https://doi.org/10.5281/zenodo.3575186, 2019. a
Hale, T., Angrist, N., Goldszmidt, R., Kira, B., Petherick, A., Phillips, T., Webster, S., Cameron-Blake, E., Hallas, L., Majumdar, S., and Tatlow, H.: A global panel database of pandemic policies (Oxford COVID-19 Government Response Tracker), Nature Human Behaviour, 5, 529–538, https://doi.org/10.1038/s41562-021-01079-8, 2021. a, b, c, d
Heald, C. L., Ridley, D. A., Kroll, J. H., Barrett, S. R. H., Cady-Pereira, K. E., Alvarado, M. J., and Holmes, C. D.: Contrasting the direct radiative effect and direct radiative forcing of aerosols, Atmos. Chem. Phys., 14, 5513–5527, https://doi.org/10.5194/acp-14-5513-2014, 2014. a
Heintzenberg, J.: Properties of the log-normal particle size distribution, Aerosol Sci. Tech., 21, 46–48, https://doi.org/10.1080/02786829408959695, 1994. a
Hoesly, R. M., Smith, S. J., Feng, L., Klimont, Z., Janssens-Maenhout, G., Pitkanen, T., Seibert, J. J., Vu, L., Andres, R. J., Bolt, R. M., Bond, T. C., Dawidowski, L., Kholod, N., Kurokawa, J.-I., Li, M., Liu, L., Lu, Z., Moura, M. C. P., O'Rourke, P. R., and Zhang, Q.: Historical (1750–2014) anthropogenic emissions of reactive gases and aerosols from the Community Emissions Data System (CEDS), Geosci. Model Dev., 11, 369–408, https://doi.org/10.5194/gmd-11-369-2018, 2018. a, b, c
Holanda, B. A., Pöhlker, M. L., Walter, D., Saturno, J., Sörgel, M., Ditas, J., Ditas, F., Schulz, C., Franco, M. A., Wang, Q., Donth, T., Artaxo, P., Barbosa, H. M. J., Borrmann, S., Braga, R., Brito, J., Cheng, Y., Dollner, M., Kaiser, J. W., Klimach, T., Knote, C., Krüger, O. O., Fütterer, D., Lavrič, J. V., Ma, N., Machado, L. A. T., Ming, J., Morais, F. G., Paulsen, H., Sauer, D., Schlager, H., Schneider, J., Su, H., Weinzierl, B., Walser, A., Wendisch, M., Ziereis, H., Zöger, M., Pöschl, U., Andreae, M. O., and Pöhlker, C.: Influx of African biomass burning aerosol during the Amazonian dry season through layered transatlantic transport of black carbon-rich smoke, Atmos. Chem. Phys., 20, 4757–4785, https://doi.org/10.5194/acp-20-4757-2020, 2020. a, b, c, d
Jöckel, P., Sander, R., Kerkweg, A., Tost, H., and Lelieveld, J.: Technical Note: The Modular Earth Submodel System (MESSy) – a new approach towards Earth System Modeling, Atmos. Chem. Phys., 5, 433–444, https://doi.org/10.5194/acp-5-433-2005, 2005. a
Jöckel, P., Kerkweg, A., Pozzer, A., Sander, R., Tost, H., Riede, H., Baumgaertner, A., Gromov, S., and Kern, B.: Development cycle 2 of the Modular Earth Submodel System (MESSy2), Geosci. Model Dev., 3, 717–752, https://doi.org/10.5194/gmd-3-717-2010, 2010. a, b, c
Kaiser, J. W., Heil, A., Andreae, M. O., Benedetti, A., Chubarova, N., Jones, L., Morcrette, J.-J., Razinger, M., Schultz, M. G., Suttie, M., and van der Werf, G. R.: Biomass burning emissions estimated with a global fire assimilation system based on observed fire radiative power, Biogeosciences, 9, 527–554, https://doi.org/10.5194/bg-9-527-2012, 2012. a
Kerkweg, A., Sander, R., Tost, H., and Jöckel, P.: Technical note: Implementation of prescribed (OFFLEM), calculated (ONLEM), and pseudo-emissions (TNUDGE) of chemical species in the Modular Earth Submodel System (MESSy), Atmos. Chem. Phys., 6, 3603–3609, https://doi.org/10.5194/acp-6-3603-2006, 2006. a
Ketzel, M. and Berkowicz, R.: Modelling the fate of ultrafine particles from exhaust pipe to rural background: an analysis of time scales for dilution, coagulation and deposition, Atmos. Environ., 38, 2639–2652, https://doi.org/10.1016/j.atmosenv.2004.02.020, 2004. a, b
Klingmüller, K., Lelieveld, J., Karydis, V. A., and Stenchikov, G. L.: Direct radiative effect of dust–pollution interactions, Atmos. Chem. Phys., 19, 7397–7408, https://doi.org/10.5194/acp-19-7397-2019, 2019. a
Krüger, O. O., Holanda, A. B., Chowdhury, S., Pozzer, A., and Pöhlker, M. L.: Data Set – Black carbon aerosol reductions during COVID-19 confinement quantified by aircraft measurements over Europe, Edmond V1 [data set], https://doi.org/10.17617/3.GKRXCN, 2022. a
Kutzner, R. D., von Schneidemesser, E., Kuik, F., Quedenau, J., Weatherhead, E. C., and Schmale, J.: Long-term monitoring of black carbon across Germany, Atmos. Environ., 185, 41–52, https://doi.org/10.1016/j.atmosenv.2018.04.039, 2018. a, b
Laborde, M., Schnaiter, M., Linke, C., Saathoff, H., Naumann, K.-H., Möhler, O., Berlenz, S., Wagner, U., Taylor, J. W., Liu, D., Flynn, M., Allan, J. D., Coe, H., Heimerl, K., Dahlkötter, F., Weinzierl, B., Wollny, A. G., Zanatta, M., Cozic, J., Laj, P., Hitzenberger, R., Schwarz, J. P., and Gysel, M.: Single Particle Soot Photometer intercomparison at the AIDA chamber, Atmos. Meas. Tech., 5, 3077–3097, https://doi.org/10.5194/amt-5-3077-2012, 2012. a
Laborde, M., Crippa, M., Tritscher, T., Jurányi, Z., Decarlo, P. F., Temime-Roussel, B., Marchand, N., Eckhardt, S., Stohl, A., Baltensperger, U., Prévôt, A. S. H., Weingartner, E., and Gysel, M.: Black carbon physical properties and mixing state in the European megacity Paris, Atmos. Chem. Phys., 13, 5831–5856, https://doi.org/10.5194/acp-13-5831-2013, 2013. a
Lauer, A., Eyring, V., Hendricks, J., Jöckel, P., and Lohmann, U.: Global model simulations of the impact of ocean-going ships on aerosols, clouds, and the radiation budget, Atmos. Chem. Phys., 7, 5061–5079, https://doi.org/10.5194/acp-7-5061-2007, 2007. a
Le Quéré, C., Jackson, R. B., Jones, M. W., Smith, A. J., Abernethy, S., Andrew, R. M., De-Gol, A. J., Willis, D. R., Shan, Y., Canadell, J. G., Friedlingstein, P., Creutzig, F., and Peters, G. P.: Temporary reduction in daily global CO2 emissions during the COVID-19 forced confinement, Nat. Clim. Change, 10, 647–653, https://doi.org/10.1038/s41558-020-0797-x, 2020. a, b
Lelieveld, J., Brühl, C., Jöckel, P., Steil, B., Crutzen, P. J., Fischer, H., Giorgetta, M. A., Hoor, P., Lawrence, M. G., Sausen, R., and Tost, H.: Stratospheric dryness: model simulations and satellite observations, Atmos. Chem. Phys., 7, 1313–1332, https://doi.org/10.5194/acp-7-1313-2007, 2007. a
Lelieveld, J., Klingmueller, K., Pozzer, A., Burnett, R. T., Haines, A., and Ramanathan, V.: Effects of fossil fuel and total anthropogenic emission removal on public health and climate, P. Natl. Acad. Sci. USA, 116, 7192–7197, https://doi.org/10.1073/pnas.1819989116, 2019. a, b
Li, Q. and Groß, S.: Changes in cirrus cloud properties and occurrence over Europe during the COVID-19-caused air traffic reduction, Atmos. Chem. Phys., 21, 14573–14590, https://doi.org/10.5194/acp-21-14573-2021, 2021. a
Liu, D., Allan, J. D., Young, D. E., Coe, H., Beddows, D., Fleming, Z. L., Flynn, M. J., Gallagher, M. W., Harrison, R. M., Lee, J., Prevot, A. S. H., Taylor, J. W., Yin, J., Williams, P. I., and Zotter, P.: Size distribution, mixing state and source apportionment of black carbon aerosol in London during wintertime, Atmos. Chem. Phys., 14, 10061–10084, https://doi.org/10.5194/acp-14-10061-2014, 2014. a, b
Liu, D., Ding, S., Zhao, D., Hu, K., Yu, C., Hu, D., Wu, Y., Zhou, C., Tian, P., Liu, Q., Wu, Y., Zhang, J., Kong, S., Huang, M., and Ding, D.: Black Carbon Emission and Wet Scavenging From Surface to the Top of Boundary Layer Over Beijing Region, J. Geophys. Res.-Atmos., 125, 1–15, https://doi.org/10.1029/2020JD033096, 2020. a, b
Lonati, G. and Riva, F.: Regional scale impact of the covid-19 lockdown on air quality: Gaseous pollutants in the po valley, northern Italy, Atmosphere, 12, 264, https://doi.org/10.3390/atmos12020264, 2021. a
Lund, M. T., Samset, B. H., Skeie, R. B., Watson-Parris, D., Katich, J. M., Schwarz, J. P., and Weinzierl, B.: Short Black Carbon lifetime inferred from a global set of aircraft observations, npj Climate and Atmospheric Science, 1, 1–8, https://doi.org/10.1038/s41612-018-0040-x, 2018. a
McDuffie, E. E., Smith, S. J., O'Rourke, P., Tibrewal, K., Venkataraman, C., Marais, E. A., Zheng, B., Crippa, M., Brauer, M., and Martin, R. V.: A global anthropogenic emission inventory of atmospheric pollutants from sector- and fuel-specific sources (1970–2017): an application of the Community Emissions Data System (CEDS), Earth Syst. Sci. Data, 12, 3413–3442, https://doi.org/10.5194/essd-12-3413-2020, 2020. a
MESSy: Modular Earth Submodel System, MESSy [code], http://www.messy-interface.org, last access: 27 June 2022. a
Moreda-Piñeiro, J., Sánchez-Piñero, J., Fernández-Amado, M., Costa-Tomé, P., Gallego-Fernández, N., Piñeiro-Iglesias, M., López-Mahía, P., and Muniategui-Lorenzo, S.: Evolution of gaseous and particulate pollutants in the air: What changed after five lockdown weeks at a southwest atlantic european region (northwest of spain) due to the sars-cov-2 pandemic?, Atmosphere, 12, 562, https://doi.org/10.3390/atmos12050562, 2021. a
Naik, V., Szopa, S., Adhikary, B., Artaxo, P., Berntsen, T., Collins, W. D., Fuzzi, S., Gallardo, L., Kiendler Scharr, A., Klimont, Z., Liao, H., Unger, N., and Zanis, P.: Short-Lived Climate Forcers, in: Climate Change 2021: The Physical Science Basis. Contribution of Working Group I to the Sixth Assessment Report of the Intergovernmental Panel on Climate Change, edited by: Masson-Delmotte, V., Zhai, P., Pirani, A., Connors, S. L., Péan, C., Berger, S., Caud, N., Chen, Y., Goldfarb, L., Gomis, M. I., Huang, M., Leitzell, K., Lonnoy, E., Matthews, J. B. R., Maycock, T. K., Waterfield, T., Yelekçi, O., Yu, R., and Zhou, B., Cambridge University Press, Cambridge, United Kingdom and New York, NY, USA, 817–922, https://doi.org/10.1017/9781009157896.008, 2021. a, b
Ohata, S., Moteki, N., Mori, T., Koike, M., and Kondo, Y.: A key process controlling the wet removal of aerosols: New observational evidence, Sci. Rep., 6, 1–9, https://doi.org/10.1038/srep34113, 2016. a, b
Paasonen, P., Kupiainen, K., Klimont, Z., Visschedijk, A., Denier van der Gon, H. A. C., and Amann, M.: Continental anthropogenic primary particle number emissions, Atmos. Chem. Phys., 16, 6823–6840, https://doi.org/10.5194/acp-16-6823-2016, 2016. a
Peitzmeier, C., Loschke, C., Wiedenhaus, H., and Klemm, O.: Real-world vehicle emissions as measured by in situ analysis of exhaust plumes, Environ. Sci. Pollut. Res., 24, 23279–23289, https://doi.org/10.1007/s11356-017-9941-1, 2017. a
Petetin, H., Bowdalo, D., Soret, A., Guevara, M., Jorba, O., Serradell, K., and Pérez García-Pando, C.: Meteorology-normalized impact of the COVID-19 lockdown upon NO2 pollution in Spain, Atmos. Chem. Phys., 20, 11119–11141, https://doi.org/10.5194/acp-20-11119-2020, 2020. a, b
Pileci, R. E., Modini, R. L., Bertò, M., Yuan, J., Corbin, J. C., Marinoni, A., Henzing, B., Moerman, M. M., Putaud, J. P., Spindler, G., Wehner, B., Müller, T., Tuch, T., Trentini, A., Zanatta, M., Baltensperger, U., and Gysel-Beer, M.: Comparison of co-located refractory black carbon (rBC) and elemental carbon (EC) mass concentration measurements during field campaigns at several European sites, Atmos. Meas. Tech., 14, 1379–1403, https://doi.org/10.5194/amt-14-1379-2021, 2021. a
Pohjola, M., Pirjola, L., Kukkonen, J., and Kulmala, M.: Modelling of the influence of aerosol processes for the dispersion of vehicular exhaust plumes in street environment, Atmos. Environ., 37, 339–351, https://doi.org/10.1016/S1352-2310(02)00887-7, 2003. a
Pöschl, U.: Atmospheric aerosols: Composition, transformation, climate and health effects, Angew. Chem. Int. Edit., 44, 7520–7540, https://doi.org/10.1002/anie.200501122, 2005. a
Pozzer, A., de Meij, A., Pringle, K. J., Tost, H., Doering, U. M., van Aardenne, J., and Lelieveld, J.: Distributions and regional budgets of aerosols and their precursors simulated with the EMAC chemistry-climate model, Atmos. Chem. Phys., 12, 961–987, https://doi.org/10.5194/acp-12-961-2012, 2012. a, b, c
Pozzer, A., de Meij, A., Yoon, J., Tost, H., Georgoulias, A. K., and Astitha, M.: AOD trends during 2001–2010 from observations and model simulations, Atmos. Chem. Phys., 15, 5521–5535, https://doi.org/10.5194/acp-15-5521-2015, 2015. a
Pringle, K. J., Tost, H., Message, S., Steil, B., Giannadaki, D., Nenes, A., Fountoukis, C., Stier, P., Vignati, E., and Lelieveld, J.: Description and evaluation of GMXe: a new aerosol submodel for global simulations (v1), Geosci. Model Dev., 3, 391–412, https://doi.org/10.5194/gmd-3-391-2010, 2010. a
Quaas, M. F., Meya, J. N., Schenk, H., Bos, B., Drupp, M. A., and Requate, T.: The social cost of contacts: Theory and evidence for the first wave of the COVID-19 pandemic in Germany, PLOS ONE, 16, 1–29, https://doi.org/10.1371/journal.pone.0248288, 2021a. a
Quaas, M. F., Meya, J. N., Schenk, H., Bos, B., Drupp, M. A., and Requate, T.: The social cost of contacts: Theory and evidence for the first wave of the COVID-19 pandemic in Germany, PLOS ONE, 16, 1–29, https://doi.org/10.1371/journal.pone.0248288, 2021b. a
Querol, X., Alastuey, A., Viana, M., Moreno, T., Reche, C., Minguillón, M. C., Ripoll, A., Pandolfi, M., Amato, F., Karanasiou, A., Pérez, N., Pey, J., Cusack, M., Vázquez, R., Plana, F., Dall'Osto, M., de la Rosa, J., Sánchez de la Campa, A., Fernández-Camacho, R., Rodríguez, S., Pio, C., Alados-Arboledas, L., Titos, G., Artíñano, B., Salvador, P., García Dos Santos, S., and Fernández Patier, R.: Variability of carbonaceous aerosols in remote, rural, urban and industrial environments in Spain: implications for air quality policy, Atmos. Chem. Phys., 13, 6185–6206, https://doi.org/10.5194/acp-13-6185-2013, 2013. a, b, c, d
Raj, S., Krüger, O. O., Sharma, A., Panda, U., Pöhlker, C., Walter, D., Förster, J.-D., Singh, R. P., S., S., Klimach, T., Darbyshire, E., Martin, S. T., McFiggans, G., Coe, H., Allan, J., R., R., Soni, V. K., Su, H., Andreae, M. O., Pöschl, U., Pöhlker, M. L., and Gunthe, S. S.: Planetary Boundary Layer Height Modulates Aerosol–Water Vapor Interactions During Winter in the Megacity of Delhi, J. Geophys. Res.-Atmos., 126, e2021JD035681, https://doi.org/10.1029/2021JD035681, 2021. a
Ramanathan, V. and Carmichael, G.: Global and regional climate changes due to black carbon, Nat. Geosci., 1, 221–227, https://doi.org/10.1038/ngeo156, 2008. a
Reddington, C. L., McMeeking, G., Mann, G. W., Coe, H., Frontoso, M. G., Liu, D., Flynn, M., Spracklen, D. V., and Carslaw, K. S.: The mass and number size distributions of black carbon aerosol over Europe, Atmos. Chem. Phys., 13, 4917–4939, https://doi.org/10.5194/acp-13-4917-2013, 2013. a
Rolph, G., Stein, A., and Stunder, B.: Real-time Environmental Applications and Display sYstem: READY, Environ. Modell. Softw., 95, 210–228, https://doi.org/10.1016/j.envsoft.2017.06.025, 2017.
Sander, R., Kerkweg, A., Jöckel, P., and Lelieveld, J.: Technical note: The new comprehensive atmospheric chemistry module MECCA, Atmos. Chem. Phys., 5, 445–450, https://doi.org/10.5194/acp-5-445-2005, 2005. a
Sander, R., Baumgaertner, A., Cabrera-Perez, D., Frank, F., Gromov, S., Grooß, J.-U., Harder, H., Huijnen, V., Jöckel, P., Karydis, V. A., Niemeyer, K. E., Pozzer, A., Riede, H., Schultz, M. G., Taraborrelli, D., and Tauer, S.: The community atmospheric chemistry box model CAABA/MECCA-4.0, Geosci. Model Dev., 12, 1365–1385, https://doi.org/10.5194/gmd-12-1365-2019, 2019. a
Schumann, U., Bugliaro, L., Dörnbrack, A., Baumann, R., and Voigt, C.: Aviation Contrail Cirrus and Radiative Forcing Over Europe During 6 Months of COVID-19, Geophys. Res. Lett., 48, e2021GL092771, https://doi.org/10.1029/2021GL092771, 2021a. a
Schumann, U., Poll, I., Teoh, R., Koelle, R., Spinielli, E., Molloy, J., Koudis, G. S., Baumann, R., Bugliaro, L., Stettler, M., and Voigt, C.: Air traffic and contrail changes over Europe during COVID-19: a model study, Atmos. Chem. Phys., 21, 7429–7450, https://doi.org/10.5194/acp-21-7429-2021, 2021b. a
Schwarz, J. P., Gao, R. S., Fahey, D. W., Thomson, D. S., Watts, L. A., Wilson, J. C., Reeves, J. M., Darbeheshti, M., Baumgardner, D. G., Kok, G. L., Chung, S. H., Schulz, M., Hendricks, J., Lauer, A., Kärcher, B., Slowik, J. G., Rosenlof, K. H., Thompson, T. L., Langford, A. O., Loewenstein, M., and Aikin, K. C.: Single-particle measurements of midlatitude black carbon and light-scattering aerosols from the boundary layer to the lower stratosphere, J. Geophys. Res.-Atmos., 111, 1–15, https://doi.org/10.1029/2006JD007076, 2006. a
Schwarz, J. P., Gao, R. S., Spackman, J. R., Watts, L. A., Thomson, D. S., Fahey, D. W., Ryerson, T. B., Peischl, J., Holloway, J. S., Trainer, M., Frost, G. J., Baynard, T., Lack, D. A., de Gouw, J. A., Warneke, C., and Del Negro, L. A.: Measurement of the mixing state, mass, and optical size of individual black carbon particles in urban and biomass burning emissions, Geophys. Res. Lett., 35, 1–5, https://doi.org/10.1029/2008GL033968, 2008. a, b, c
Schwarz, J. P., Weinzierl, B., Samset, B. H., Dollner, M., Heimerl, K., Markovic, M. Z., Perring, A. E., and Ziemba, L.: Aircraft measurements of black carbon vertical profiles show upper tropospheric variability and stability, Geophys. Res. Lett., 44, 1132–1140, https://doi.org/10.1002/2016GL071241, 2017. a
Seinfeld, J. H. and Pandis, S. N.: Atmospheric Chemistry and Physics: From Air Pollution to Climate Change, John Wiley & Sons, Inc., https://doi.org/10.1063/1.882420, 2006. a
Shi, Z., Song, C., Liu, B., Lu, G., Xu, J., Van Vu, T., Elliott, R. J., Li, W., Bloss, W. J., and Harrison, R. M.: Abrupt but smaller than expected changes in surface air quality attributable to COVID-19 lockdowns, Sci. Adv., 7, eabd6696, https://doi.org/10.1126/sciadv.abd6696, 2021. a
Singh, V., Ravindra, K., Sahu, L., and Sokhi, R.: Trends of atmospheric black carbon concentration over the United Kingdom, Atmos. Environ., 178, 148–157, https://doi.org/10.1016/j.atmosenv.2018.01.030, 2018. a, b
Stein, A. F., Draxler, R. R., Rolph, G. D., Stunder, B. J., Cohen, M. D., and Ngan, F.: Noaa's hysplit atmospheric transport and dispersion modeling system, B. Am. Meteorol. Soc., 96, 2059–2077, https://doi.org/10.1175/BAMS-D-14-00110.1, 2015.
Stephens, M., Turner, N., and Sandberg, J.: Particle identification by laser-induced incandescence in a solid-state laser cavity, Appl. Optics, 42, 3726, https://doi.org/10.1364/ao.42.003726, 2003. a
Tsimpidi, A. P., Karydis, V. A., Pozzer, A., Pandis, S. N., and Lelieveld, J.: ORACLE (v1.0): module to simulate the organic aerosol composition and evolution in the atmosphere, Geosci. Model Dev., 7, 3153–3172, https://doi.org/10.5194/gmd-7-3153-2014, 2014. a
Tsimpidi, A. P., Karydis, V. A., Pozzer, A., Pandis, S. N., and Lelieveld, J.: ORACLE 2-D (v2.0): an efficient module to compute the volatility and oxygen content of organic aerosol with a global chemistry–climate model, Geosci. Model Dev., 11, 3369–3389, https://doi.org/10.5194/gmd-11-3369-2018, 2018. a, b
Venter, Z. S., Aunan, K., Chowdhury, S., and Lelieveld, J.: COVID-19 lockdowns cause global air pollution declines, P. Natl. Acad. Sci. USA, 117, 18984–18990, https://doi.org/10.1073/pnas.2006853117, 2020. a
Vignati, E., Berkowicz, R., Palmgren, F., Lyck, E., and Hummelshøj, P.: Transformation of size distributions of emitted particles in streets, Sci. Total Environ., 235, 37–49, https://doi.org/10.1016/S0048-9697(99)00188-6, 1999. a
Voigt, C., Lelieveld, J., Schlager, H., Schneider, J., Curtius, J., Meerkötter, R., Sauer, D., Bugliaro, L., Bohn, B., Crowley, J. N., Erbertseder, T., Groß, S., Hahn, V., Li, Q., Mertens, M., Pöhlker, M. L., Pozzer, A., Schumann, U., Tomsche, L., Williams, J., Zahn, A., Andreae, M., Borrmann, S., Bräuer, T., Dörich, R., Dörnbrack, A., Edtbauer, A., Ernle, L., Fischer, H., Giez, A., Granzin, M., Grewe, V., Harder, H., Heinritzi, M., Holanda, B. A., Jöckel, P., Kaiser, K., Krüger, O. O., Lucke, J., Marsing, A., Martin, A., Matthes, S., Pöhlker, C., Pöschl, U., Reifenberg, S., Ringsdorf, A., Scheibe, M., Tadic, I., Zauner-Wieczorek, M., Henke, R., and Rapp, M.: Cleaner skies during the COVID-19 lockdown, B. Am. Meteorol. Soc., https://doi.org/10.1175/bams-d-21-0012.1, online first, 2022. a, b, c, d
Wiesner, A., Pfeifer, S., Merkel, M., Tuch, T., Weinhold, K., and Wiedensohler, A.: Real world vehicle emission factors for black carbon derived from longterm in-situ measurements and inverse modelling, Atmosphere, 12, 1–19, https://doi.org/10.3390/atmos12010031, 2021. a
Wren, S. N., Liggio, J., Han, Y., Hayden, K., Lu, G., Mihele, C. M., Mittermeier, R. L., Stroud, C., Wentzell, J. J. B., and Brook, J. R.: Elucidating real-world vehicle emission factors from mobile measurements over a large metropolitan region: a focus on isocyanic acid, hydrogen cyanide, and black carbon, Atmos. Chem. Phys., 18, 16979–17001, https://doi.org/10.5194/acp-18-16979-2018, 2018. a
Zauner-Wieczorek, M., Heinritzi, M., Granzin, M., Keber, T., Kürten, A., Kaiser, K., Schneider, J., and Curtius, J.: Mass spectrometric measurements of ambient ions and estimation of gaseous sulfuric acid in the free troposphere and lowermost stratosphere during the CAFE-EU/BLUESKY campaign, Atmos. Chem. Phys. Discuss. [preprint], https://doi.org/10.5194/acp-2022-238, in review, 2022. a
Zimmermann, P. H., Brenninkmeijer, C. A. M., Pozzer, A., Jöckel, P., Winterstein, F., Zahn, A., Houweling, S., and Lelieveld, J.: Model simulations of atmospheric methane (1997–2016) and their evaluation using NOAA and AGAGE surface and IAGOS-CARIBIC aircraft observations, Atmos. Chem. Phys., 20, 5787–5809, https://doi.org/10.5194/acp-20-5787-2020, 2020. a