the Creative Commons Attribution 4.0 License.
the Creative Commons Attribution 4.0 License.
 | 06 Jul 2022
Effect of dust on rainfall over the Red Sea coast based on WRF-Chem model simulations
Sagar P. Parajuli
Georgiy L. Stenchikov
Alexander Ukhov
Suleiman Mostamandi
Paul A. Kucera
Duncan Axisa
William I. Gustafson Jr.
Yannian Zhu
Water is the single most important element of life. Rainfall plays an important role in the spatial and temporal distribution of this precious natural resource, and it has a direct impact on agricultural production, daily life activities, and human health. One of the important elements that govern rainfall formation and distribution is atmospheric aerosol, which also affects the Earth's radiation balance and climate. Therefore, understanding how dust compositions and distributions affect the regional rainfall pattern is crucial, particularly in regions with high atmospheric dust loads such as the Middle East. Although aerosol and rainfall research has garnered increasing attention as both an independent and interdisciplinary topic in the last few decades, the details of various direct and indirect pathways by which dust affects rainfall are not yet fully understood. Here, we explored the effects of dust on rainfall formation and distribution as well as the physical mechanisms that govern these phenomena, using high-resolution WRF-Chem simulations (∼ 1.5 km × 1.5 km) configured with an advanced double-moment cloud microphysics scheme coupled with a sectional eight-bin aerosol scheme. Our model-simulated results were realistic, as evaluated from multiple perspectives including vertical profiles of aerosol concentrations, aerosol size distributions, vertical profiles of air temperature, diurnal wind cycles, and spatio-temporal rainfall patterns. Rainfall over the Red Sea coast is mainly caused by warm rain processes, which are typically confined within a height of ∼ 6 km over the Sarawat mountains and exhibit a strong diurnal cycle that peaks in the evening at approximately 18:00 local time under the influence of sea breezes. Numerical experiments indicated that dust could both suppress or enhance rainfall. The effect of dust on rainfall was calculated as total, indirect, and direct effects, based on 10-year August-average daily-accumulated rainfall over the study domain covering the eastern Red Sea coast. For extreme rainfall events (domain-average daily-accumulated rainfall of ≥ 1.33 mm), the net effect of dust on rainfall was positive or enhancement (6.05 %), with the indirect effect (4.54 %) and direct effect (1.51 %) both causing rainfall increase. At a 5 % significance level, the total and indirect effects were statistically significant whereas the direct effect was not. For normal rainfall events (domain-average daily-accumulated rainfall < 1.33 mm), the indirect effect enhanced rainfall (4.76 %) whereas the direct effect suppressed rainfall (−5.78 %), resulting in a negative net suppressing effect (−1.02 %), all of which were statistically significant. We investigated the possible physical mechanisms of the effects and found that the rainfall suppression by dust direct effects was mainly caused by the scattering of solar radiation by dust. The surface cooling induced by dust weakens the sea breeze circulation, which decreases the associated landward moisture transport, ultimately suppressing rainfall. For extreme rainfall events, dust causes net rainfall enhancement through indirect effects as the high dust concentration facilitates raindrops to grow when the water vapor is sufficiently available. Our results have broader scientific and environmental implications. Specifically, although dust is considered a problem from an air quality perspective, our results highlight the important role of dust on sea breeze circulation and associated rainfall over the Red Sea coastal regions. Our results also have implications for cloud seeding and water resource management.
- Article
(17875 KB) - Full-text XML
-
Supplement
(713 KB) - BibTeX
- EndNote


Rainfall rejuvenates plant and animal life. In desert regions, rain events also bring hope and excitement. Rainfall affects the distribution of surface water and groundwater resources, which are constantly declining over the Middle East and North Africa (MENA) due to overexploitation (Joodaki et al., 2014). A large proportion of global agricultural production is indeed dependent on monsoon rainfall. Irregular patterns of rainfall have affected people in many countries across the globe, by causing floods and droughts, affecting the regional water resources (e.g., Jha et al., 2021), limiting people's access to safe drinking water, and increasing the prevalence of water-borne diseases such as malaria and diarrhea (Trinh et al., 2020).
Dust is the dominant aerosol type in desert regions (Kalenderski and Stenchikov, 2016; Parajuli et al., 2020; Ukhov et al., 2020), and it can affect regional water resources by modulating rainfall distributions (Jha et al., 2021). In regions with long-term water shortages such as the Middle East and North Africa (MENA), understanding the multifaceted aspects of dust–rainfall connections is even more important. In desert regions, regional dust storms such as haboobs (e.g., Anisimov et al., 2017) are often associated with rainfall. The older generation of people in the MENA region associate certain categories of dust storms with rainfall. Due to the frequent occurrence of dust storms, dust–cloud mixtures are common sights in this region.
Aerosol particles including dust are key to rainfall formation as they provide a surface for condensation. John Aitken, a pioneer scientist of the 18th century, said “There would probably be no rainfall if there were no dust particles in the atmosphere” (Spurny, 2000), which clearly highlights the importance of dust in the Earth's climate.
The process of rainfall is incredibly complex, and many aspects of the rain cycle remain unclear despite sustained research efforts. Although the principles that govern rainfall appear highly complex from a prediction perspective, the basic physics of rainfall are rather simple and mesmerizing. The least understood aspects of rainfall lie within the clouds, particularly the mechanisms by which aerosols affect clouds and the subsequent rainfall.
Given that the multiple effects of aerosols on the Earth's climate occur through various direct and indirect pathways, disentangling their effect on rainfall is not easy. Furthermore, previous studies on the effects of aerosols on rainfall have reported contradicting results, with some indicating that dust enhances rainfall while others report a suppressing effect. Generally, aerosols enhance heavy rainfall events and suppress light rainfall events (Choobari, 2018; Li et al., 2011). Although multiple new mechanisms have been recently proposed to explain the underlying causes of these discrepancies (e.g., Fan et al., 2018; Grabowski and Morrison, 2020; Abott and Cronin, 2021), these hypotheses are still debated and at times controversial (Choobari, 2018) despite extensive research on the topic. Furthermore, the effect of dust depends on the type of circulation (e.g., Bangalath and Stenchikov, 2015), and therefore the present study is highly significant in the coastal areas where sea and land breeze circulations are active. In this work, we specifically focus on the coastal regions of the Red Sea to explore the effects of dust on rainfall. We chose this region because dust–rainfall interaction should be prominent here, if there is any, given the high levels of atmospheric dust in the region.
The effects of aerosol on climate are generally classified into three categories – direct, semi-direct, and indirect effects (Lohmann and Feichter, 2001; Forkel et al., 2012; Zeinab et al., 2020), all of which affect rainfall in unique ways. Aerosol particles directly affect radiation through scattering and absorption, which is generally known as the “direct aerosol effect”. These effects on radiation lead to changes in temperature, wind speed, relative humidity, and atmospheric stability, all of which are collectively referred to as aerosol “semi-direct effects” (Hansen et al., 1997). Furthermore, the effects of aerosols through clouds are classified as indirect effects (Twomey, 1991), which in turn are sub-classified into two types. The formation of cloud condensation nuclei (CCN) or ice nuclei (IN) (Dennis, 1980; Stull, 2000) changes the cloud optical properties, particularly cloud albedo, and this is referred to as the “first indirect effect” (Kravitz et al., 2014). The subsequent changes in cloud cover, cloud lifetime, and rainfall are referred to as the “second indirect effect” (Lohmann and Feichter, 2001). In the literature, these effects are commonly calculated in terms of “radiative forcing”. However, here, we calculate how these effects translate into rainfall amounts, to gain insights into the effects of dust on rainfall from a water resources perspective.
Dust can both increase and decrease rainfall by affecting local atmospheric circulation (Jacobson and Kaufman, 2006; Rémy et al., 2015). For example, in West Africa, dust can reduce rainfall by inducing a cooling effect that decreases the meridional gradient of moist static energy (Konare et al., 2008). In contrast, dust can also enhance rainfall through dust-induced diabatic warming in the upper troposphere, which enhances regional circulation (Jin et al., 2015) through the “elevated heat pump” (EHP) effect (Lau et al., 2010). Dust can act as both IN (Creamean et al., 2013; Jha et al., 2018), which mainly affect cold-cloud processes (Ansmann et al., 2005), and CCN, which primarily affect warm-cloud processes (Li et al., 2010; Twohy, 2015; Jha et al., 2018). Nucleation is more effective when the CCN are hydrophilic. Although dust particles are weakly hydrophilic, they are larger and are activated at a higher supersaturation compared to other anthropogenic aerosol species (Karydis et al., 2011).
Increases in aerosol concentration increase the number of cloud droplets by shifting the aerosol spectrum towards smaller radii for a fixed liquid water content, which ultimately renders the autoconversion or collision–coalescence process in warm clouds less efficient and increases the cloud reflectivity, thus inducing a cooling effect on the Earth's surface (Albrecht, 1989; Choobari, 2018). Aerosol particles can reduce the cloud fraction by slowing down rain formation by collision–coalescence (Rosenfeld et al., 2001; Jacobson et al., 2006; Min et al., 2009), but they can also increase via the invigoration of convective clouds (Koren et al., 2005). Aerosol invigoration is a process in which aerosols delay the rainfall in the initial stage of convection but causes more rainfall in the mature stage due to the formation of deeper and larger clouds (Andreae et al., 2004; Koren et al., 2005, 2008; Chakraborty et al., 2018; Fan et al., 2018). The presence of fine aerosol particles in the atmosphere facilitates the formation of smaller cloud droplets and therefore suppresses rainfall initially. This suppression allows the cloud droplets to reach the freezing point as they rise to higher altitudes. Upon freezing, these hydrometeors release more latent heat, which ultimately intensifies convective updrafts and associated cold rainfall (Koren et al., 2008; Lee, 2012). One more reason for these contrasting effects is that the aerosols behave differently in different cloud types. For example, a dust layer below a warmer cloud base at approximately 3 km can suppress cloud formation by heating, but in a higher cloud base, cloud formation can be strengthened through the contribution of CCN and/or IN (Yin and Chen, 2007). Similarly, the effective radius of ice particles decreases with increased aerosol optical depth (AOD) in high clouds, whereas it increases for low clouds (Zhao et al., 2019). The rainfall response also depends on whether clouds are located over the continent or the ocean (Yin et al., 2002), or whether they are located over pristine remote areas or hazy urban regions (Solomos et al., 2011).
In summary, the effects of aerosol or dust on rainfall are governed by multiple microphysical, dynamic, and radiative interactions, which can suppress, enhance, or cause no net effect on rainfall depending on the regional geography (Andreae et al., 2004; Han et al., 2009). Therefore, regional modeling approaches (e.g., Konare et al., 2008; Zhang et al., 2017; Jordan et al., 2020) are necessary to understand the regional effects of dust on rainfall. Our study focused on the Red Sea Arabian coast, which is among the regions with the highest moisture transport, and where both natural (dust) and anthropogenic aerosols exist in high concentrations. Using the Weather Research Forecast model coupled with Chemistry (WRF-Chem) (Grell et al., 2005) model simulations supported by extensive validation of meteorology, aerosol properties, and microphysical parameters, our study aimed to understand the following research questions:
-
Does dust enhance or suppress rainfall? What physical mechanisms are responsible for any enhancement or suppression effect?
-
How does dust interact with local breeze circulations?
2.1 Study domain
Our study was conducted in a small domain over the Red Sea coast, as indicated by the red box (d03) in Fig. 1. The study area covers the King Abdullah University of Science and Technology (KAUST), Thuwal, in the north and the city of Abha in the south, the latter of which is famous for its high mountains and rainfall. The domain covers a full section of the Red Sea, the Sarawat mountain range that runs from north to south, and a good portion of the nearby inland deserts (d03). The study domain is encompassed by a middle domain d02, which covers a large part of the Arabian Peninsula and northeast Africa, where major dust exchange occurs between the two continents across the Red Sea (Kalenderski and Stenchikov, 2016). The outer domain d01, which is rather large, covers the entire MENA region and includes all regional aerosol sources, as described in Parajuli et al. (2020).
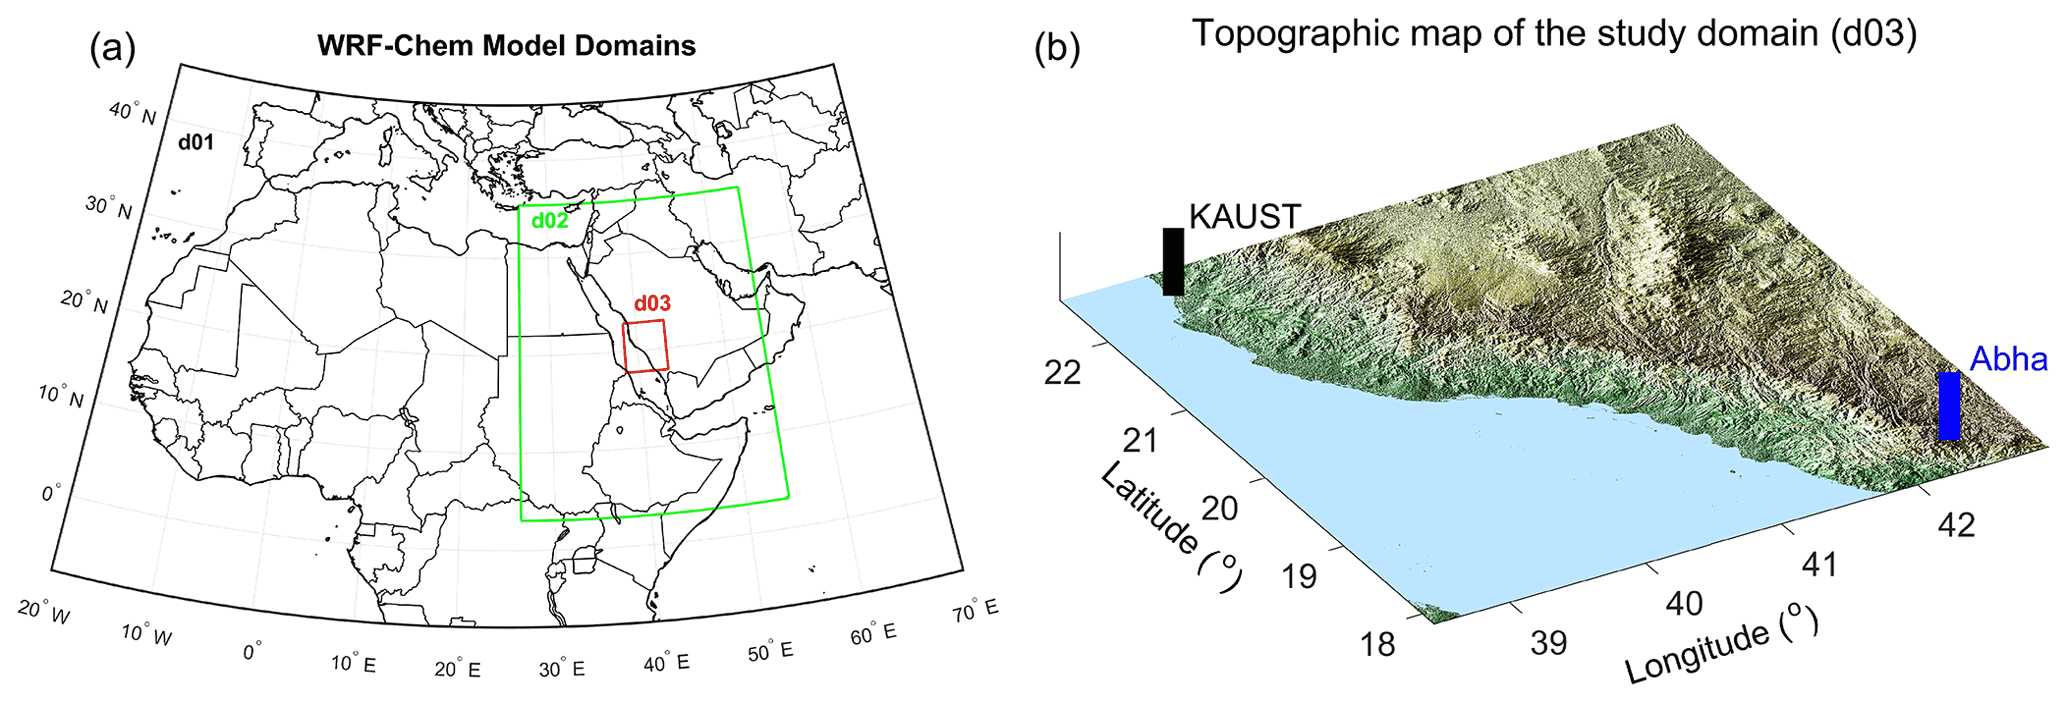
Figure 1Study area showing the nested domains d01, d02, and d03 used to conduct WRF-Chem model simulations (a) and a zoom-in topographic map of domain d03 over the Red Sea coast (b).
Precipitation over the Red Sea coast is governed by the complex interactions between sea breezes, local topography, and upper-level thermodynamics (Kucera et al., 2010). A moisture convergence boundary is created when the moist air from the sea (driven by sea breezes) that is orographically lifted along the mountain slope meets the dry Harmattan winds originating from the desert, which induces convective cloud development (Kucera et al., 2010; Parajuli et al., 2020).
Land and sea breezes (Simpson, 1994; Miller et al., 2003) are key components of the local atmospheric circulation that affect the rainfall pattern over the Red Sea coast. During the daytime, the coastal plains of the Red Sea become warmer, thus creating a pressure low. The moisture-laden air from the Red Sea then flows towards the low-pressure region, giving rise to sea breezes (Khan et al., 2015; Parajuli et al., 2020). At nighttime, the land cools down, often below the sea surface temperature and particularly during the winter, which drives land breezes that flow from the land to the sea (Parajuli et al., 2020).
2.2 Observations
Our study employed rainfall data from a recently developed algorithm called the Integrated Multi-satellite Retrievals (IMERG) for Global Precipitation Measurement (GPM), which combines data from the GPM constellation with the earlier precipitation estimates from TRMM (Tropical Rainfall Measurement Mission) (Liu et al., 2012) to increase coverage, accuracy, and resolution (Huffman et al., 2019). We specifically used the level-3 gauge-calibrated multi-satellite precipitation estimate (PrecipitationCal) V06 dataset available daily at a spatial resolution of 0.1∘ × 0.1∘.
Additionally, our study used Moderate Resolution Imaging Spectroradiometer (MODIS) level-2 Deep Blue AOD data (Hsu et al., 2004), which are available daily for the whole globe, at a resolution of ∼ 0.1∘ × 0.1∘. We used the MODIS AOD collection 6 dataset (Hsu et al., 2013), which features an improved Deep Blue aerosol retrieval algorithm. Data analyses were conducted using the daily average AOD from the Terra and Aqua satellites, which encompassed measurements at ∼ 10:30 and ∼ 13:30 local time, respectively.
Model comparisons were also conducted using the aerosol optical depth (AOD) from Aerosol Robotic Network (AERONET) (Holben et al., 1998) and aerosol vertical profiles from micropulse lidar (MPL) (Parajuli et al., 2020; Lopatin et al., 2021), both from the KAUST station (22.3∘ N, 39.1∘ E). We used cloud-screened and quality-assured level-2 AERONET AOD data, which were retrieved using the direct sun algorithm. We also use AERONET V3, level-2 aerosol number density and particle size distribution (PSD), which were obtained by inversion (Dubovik and King, 2000) and provide volume concentrations in 22 bins between a 0.05 and 15 µm radius (e.g., Parajuli et al., 2019). The lidar aerosol vertical profiles were retrieved using the GRASP algorithm following a multi-pixel approach that allows both daytime and nighttime retrievals with the use of collocated AERONET data (Dubovik et al., 2011; Parajuli et al., 2020; Lopatin et al., 2021).
Modern-Era Retrospective Analysis for Research and Applications version 2 (MERRA-2) data (Rienecker et al., 2011) were also used for model comparison.
Wind speed data from the KAUST station (Farrar et al., 2009) and radiosonde temperature data were obtained from King Abdul Aziz International Airport, Jeddah (41024-OEJN: 21.70∘ N, 39.18∘ E) available from http://weather.uwyo.edu/upperair/sounding.html (last access: 19 August 2021).
CCN number concentrations were retrieved from VIIRS data following the Automated Mapping of Convective Clouds (AMCC) algorithm (Yue et al., 2019) to validate our model results. The algorithm extends the novel idea proposed by Rosenfeld et al. (2016) to simultaneously retrieve the CCN concentrations and the cloud base updraft speeds using visible and infrared satellite data. The number of activated CCN in a convective cloud base can be calculated as a function of cloud drop effective radius (varies with altitude as in an adiabatic cloud), which can be retrieved from a satellite imager with high-resolution wave bands such as the VIIRS (Visible Infrared Imaging Radiometer Suite) on board the Suomi NPP (National Polar-Orbiting Satellite) (Freud et al., 2011; Rosenfeld et al., 2016, 2014). Similarly, the cloud base updraft speeds can be estimated as a linear function of cloud-base height (Zheng and Rosenfeld, 2015; Rosenfeld et al., 2016; Yue et al., 2019).
After identifying the convective cloud cells, the CCN number concentrations from the VIIRS satellite were retrieved corresponding to different cloud base heights (∼ 0.5–5.5 km) representing different locations and times, which resulted in 14 d of data availability in August 2015. For comparison, we first extracted the CCN concentrations for each of the 14 d of satellite observations closest to the measurement time from the hourly model output. Next, the 3-D model data were interpolated along the latitude, longitude, and altitude (cloud base) of the satellite data points. The satellite data represented a range of supersaturations, and therefore only the data that fell within the modeled supersaturation range (0.02 %–1.0 %) were extracted for further processing. The model CCN number concentrations were available at supersaturations of S = 0.02 %, 0.05 %, 0.1 %, 0.2 %, 0.5 %, and 1.0 %; therefore, for comparison, the model CCN concentrations at the points of satellite-retrieved supersaturations were obtained by fitting a third-order polynomial on the model concentration vs. supersaturation plot at the six model points.
We also used CCN number concentrations measured using a Droplet Measurement Technologies (DMT) CCN counter (Roberts and Nenes, 2005) during a field campaign in the Abha region of Saudi Arabia in August 2009 (Kucera et al., 2010). CCN number concentrations were measured at a PME (Presidency of Meteorology and Environment) ground station (18.24∘ N, 42.46∘ E) using a CCN counter (1–10 µm) at multiple supersaturations (S = 0.2 % and 0.7 % were used for comparison in this study). The model CCN number concentrations at the observation points of S = 0.2 % and 0.7 % were obtained by fitting a third-order polynomial equation on the model concentrations corresponding to the six model supersaturations, as mentioned previously.
Size-resolved aerosol concentrations were collected from a research aircraft (a Beechcraft King Air B200) during the field campaign (August 2009) with multiple probes including a Particle Measuring Systems (PMS) forward scatter spectrometer probe (FSSP-100, range 3, 0.5–8 µm diameter) (Dye and Baumgardner, 1984) and a passive cavity aerosol spectrometer probe (PCASP) (0.1–3 µm diameter) (Kucera et al., 2010). For particle size comparisons, model data were averaged within the range of flight times (06:00 to 10:00 UTC) during the flight days (11–30 August 2009). The model aerosol concentrations at the exact observation point along the flight track with a given latitude, longitude, and altitude were determined via 3-D linear interpolation of the model grid data.
2.3 Model simulations
2.3.1 WRF-Chem model set-up
High-resolution simulations are usually conducted for several days or weeks due to their high computational demand. Simulating full-scale aerosol–climate interactions including indirect effects adds further computational burdens. Therefore, considering our purpose, we conducted our model simulations using WRF-Chem at a cloud resolving spatial resolution of 1.5 km × 1.5 km for an entire month (August), of which the first 3 d were excluded from data analysis as the spin-up period. Most model evaluations and diagnostic calculations were performed for a reference year (August 2015) unless otherwise mentioned. Additional validations are carried out for August 2009 because aerosol size distributions and microphysical data from a field campaign were available during this period.
To obtain statistically meaningful calculations of the dust effect on rainfall, 10 years of simulations (2006–2015) were conducted specifically for August of each year. The simulations were conducted over the Red Sea coast outlined by the nested domain d03 (Fig. 1), in which the parent domains d02 (4.5 km ×4.5 km) and d01 (13.5 km ×13.5 km) cover the Arabian Peninsula–northeast Africa and the MENA region, respectively. August was chosen because during this month the Red Sea coast receives abundant rainfall and sea breezes are relatively strong, which plays an important role in moisture transport over the coastal plains (Mostamandi et al., 2022).
We use 6-hourly ECMWF operational data (F640) as initial and boundary conditions; these are some of the most accurate reanalysis data assimilating several observations. The sea surface temperature (SST) was also updated every 6 h using the skin temperature field from the same ECMWF dataset. We continue to use these data because they have worked well in our region (e.g., Parajuli et al., 2020; Mostamandi et al., 2022).
To better represent cloud processes, it is important to use well-developed aerosol chemistry and microphysical schemes (Zhang et al., 2016). Here, we adopted the Model for Simulating Aerosol Interactions and Chemistry (MOSAIC) scheme (Fast et al., 2006; Zaveri et al., 2008; Zhao et al., 2011) with eight sectional aerosol bins. The MOSAIC scheme is computationally intensive and generates large outputs, as all aerosol concentrations are reported for the eight MOSAIC bins for interstitial and in-cloud aerosols. Our simulations used chem_opt = 10, which couples the CBM-Z (Carbon Bond Mechanism version Z) gas phase chemical mechanism (Zaveri and Peters, 1999) with the MOSAIC aerosol scheme and is one of the most developed chemical mechanisms within WRF-Chem.
MOSAIC includes both interstitial and cloud-borne aerosols, cloud–aerosol interactions, activation/resuspension, nucleation, coagulation, aqueous chemistry, and wet removal (Fast et al., 2006; Gustafson et al., 2007). Here, we particularly focused on accurately representing dust aerosols because they are a specific characteristic of the region. MOSAIC includes all aerosols of interest including dust (included in other inorganic aerosols or “oin” because it is chemically inert), sea salt, sulfate, black carbon (BC), and organic carbon (OC) (Zhao et al., 2011; Zaveri et al., 2008). Within our model setup, aerosols affect clouds and clouds also affect aerosols, e.g., through in-cloud scavenging and by forming sulfate aerosols (Yang et al., 2012). Aerosol particles are assumed to be internally mixed, and Köhler's theory is used to relate the aerosol size distribution and composition to the activated CCN as a function of the maximum supersaturation (Abdul-Razzak and Ghan, 2002; Yang et al., 2012). Aerosol activation from the interstitial to in-cloud state is calculated based on a maximum supersaturation determined from a Gaussian spectrum of updraft velocities and internally mixed aerosol properties within each size bin (Chapman et al., 2009). When the hydrometeors evaporate, particles return to the original interstitial phase (Yang et al., 2012).
In MOSAIC, dust is treated as part of the internal mixture used across all aerosol species. All gas and aerosol processes (e.g., sulfate formation) operate within the mixture, but dust itself does not take part in the chemical reactions, although MOSAIC includes the chemical reaction of CaCO3 (a constituent of dust) with acids when the proportion of CaCO3 is provided (Zaveri et al., 2008). Dust itself is considered weakly hydrophilic in WRF-Chem with a hygroscopicity of 0.14 (Kawecki and Steiner, 2018). However, chemical processes within the aerosol mixture may affect the activation of CCN and/or IN, which ultimately affects precipitation (Abdelkader et al., 2017; Klingmüller et al., 2019). This is because interstitial aerosols are partially activated as CCN (in-cloud or cloud-borne aerosols) at each grid cell and time step by using a volume-weighted bulk hygroscopicity from all aerosol species (e.g., dust, sulfate, oin, sea salt) within each size bin (Kawecki and Steiner, 2018; Tuccella et al., 2015) as a function of the environmental supersaturation (Abdul-Razzak and Ghan, 2000). Reduction due to chemical and physical (e.g., coagulation) processes, as well as particle growth, will also cause particles to shift across different bins (Abdul-Razzak and Ghan, 2002; Chapman et al., 2009). The volume-average refractive index within a given size bin is used to calculate the optical properties using Mie theory (Tuccella et al., 2015). Therefore, dust can affect both direct and indirect aerosol feedback.
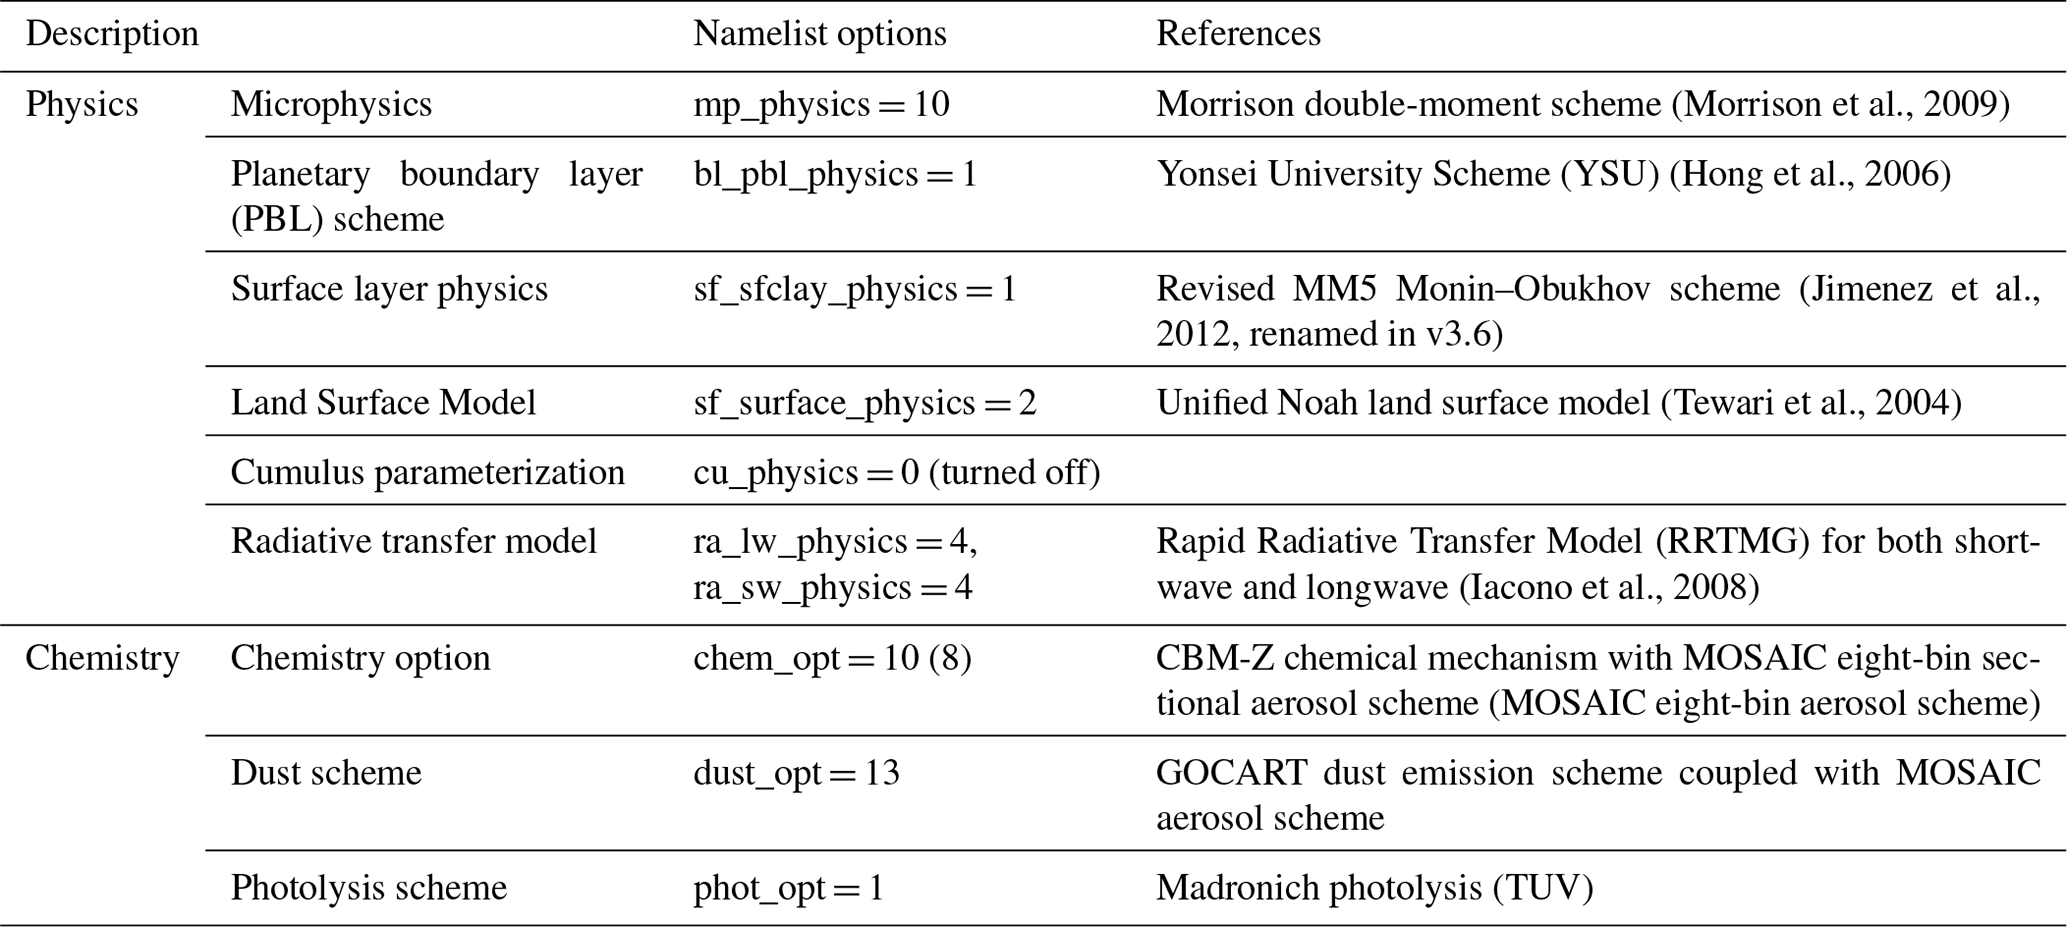
For cloud microphysics, we used the Morrison double-moment scheme (Morrison et al., 2009), which is one of the commonly used microphysics options in WRF. This scheme allows for the prognostic treatment of two moments of the hydrometeors (mixing ratios and number concentrations) for five species (cloud droplets, cloud ice, snow, rain, and graupel), while calculating key microphysical processes such as autoconversion, collection between hydrometeor species, melting–freezing, and mass transfer from snow to ice (Yang et al., 2011). Compared to the single-moment scheme, which only predicts mixing ratios, the double-moment approach can better represent precipitating convective clouds, particularly during heavy precipitation episodes (Lim and Hong, 2010). The size distribution of hydrometeors is prescribed from the predicted bulk number and mass mixing ratios of different hydrometeor types in an assumed gamma size distribution (Gao et al., 2016). The prognostic treatment of the CCN distribution improves the simulated cloud properties and radiative effects compared to a prescribed uniform CCN distribution, albeit at an increased computational cost (Gustafson et al., 2007). The physics and chemistry namelist options used in our WRF-Chem setup is summarized in Table 1.
Table 1Physics and chemistry namelist settings used in WRF-Chem.
We included sea salt emissions using a parameterization based on 10 m wind speed (Monahan et al., 1986; Gong, 2003). Anthropogenic aerosol emissions were also included in our simulations. The emission of sulfur dioxide (SO2), which chemically transforms to sulfate aerosols, is prescribed using OMI (Ozone Monitoring Instrument)-HTAP (Task Force Hemispheric Transport Air Pollution) data (Janssens-Maenhout et al., 2015) for 2015 developed by the National Aeronautics and Space Administration (NASA), as in Parajuli et al. (2020). Other emissions including BC and OC as well as SO2 ship emissions are prescribed using the EDGAR (Emission Database for Global Atmospheric Research) database v4.3.2 available at a 0.1∘ × 0.1∘ resolution (Crippa et al., 2018).
The cloud–aerosol interactions on shortwave (SW) radiation are represented by linking the cloud droplet number concentration predicted by the microphysics scheme with the RRTMG shortwave radiative scheme. Aerosol direct radiative effects through longwave (LW) radiation are also calculated using the RRTMG scheme (Iacono et al., 2000; Zhao et al., 2011). Aerosol indirect effects are calculated following Gustafson et al. (2007) to include both first and second indirect effects. Aerosol particles acting as CCN are coupled with the Morrison microphysics scheme, which allows aerosols to affect the cloud droplet number and cloud radiative properties, while also allowing clouds to alter aerosol size and composition through aqueous processes and wet scavenging (Gustafson et al., 2007). Note that we explicitly resolved the updrafts using a cloud-resolving spatial resolution in the inner domain (d03).
In MOSAIC, aerosol emissions are independently calculated within its own module in which the dust emission is calculated using the original GOCART dust scheme (Ginoux et al., 2001) as described by Zhao et al. (2010), which is called by setting dust_opt = 13. Note that this option was not implemented in the version of WRF-Chem used herein (3.8.1), but we ported this change into our setup (within the subroutine module_mosaic_addemiss.F). We also accounted for gravitational settling of aerosols in this work similar to Ukhov et al. (2021), which has not been implemented for the MOSAIC scheme in WRF-Chem.
To represent dust sources, we used the topographic source function developed by Ginoux et al. (2001), which is calibrated to match the simulated AOD with observed AOD as in Parajuli et al. (2020). To accurately simulate the effect of dust on cloud formation and rainfall, it is important to ensure that the simulated AOD is consistent with the observations. The AOD is highly sensitive to the size distribution of the dust particles (Ukhov et al., 2021). Therefore, we iteratively adjusted the emission size distribution to match the volume size distribution of aerosols obtained from AERONET as described by Ukhov et al. (2020). There are two places in which the dust size distributions can be adjusted within WRF-Chem. First is the size distribution of the “emitted dust” prescribed in five bins within the GOCART dust scheme, which is specified in phys/module_data_ gocart_dust.F. The second is the dust size fractions used by the MOSAIC aerosol scheme (eight bins) specified in chem/module_mosaic_addemiss.F. Both of these size fractions were modified to obtain a closer fit to the AERONET volume size distributions. The modified and the default size fractions are presented in Tables S1 and S2 in the Supplement.
2.3.2 Experiments
Designing an appropriate experiment to determine the effect of dust in a model is challenging. For example, one can consider a “baseline” simulation with “clear” conditions without any aerosols and then add dust to see how it affects the rainfall. However, clear conditions are hardly ever observed, and thus it is unrealistic to design an experiment with zero rainfall. Therefore, we first considered a real-world scenario as a baseline by including all aerosols (dust, sea salt, sulfate, organic, and black carbon) similar to Klingmüller et al. (2019) (Table 2, F1). This baseline experiment (all_aer) is calibrated against MODIS/AERONET AOD data by changing the dust emission fractions and dust size fractions as mentioned previously in Sect. 2.3.1. The results of this baseline simulation were compared against observations, which exhibited a realistic aerosol distribution in terms of optical depth, PSD, and vertical profiles, as well as the rainfall pattern (see Sect. 3.2.1). The second experiment is the “no_dust” experiment (Table 2, F2) in which we assigned “zero” values to the source function in the dust emission equation (Parajuli et al., 2019), thereby effectively eliminating dust emissions from all grid cells in all three domains. Both of the aforementioned experiments include aerosol–radiation, aerosol–cloud, and microphysical interactions, and therefore they represent the total effect (both direct and indirect) of aerosols. From a practical perspective, the all_aer experiment represents a real-world scenario in which all aerosols including dust are included to obtain a realistic rainfall pattern, whereas the no_dust experiment represents rainfall in an idealized, dust-free world. We also conducted two additional experiments (F3 and F4) to separate the aerosol direct effects from indirect effects. In these two simulations, we restricted aerosol–radiation interactions (aer_rad_feedback = 0), in both all_aer (F3) and no_dust (F4) cases, while keeping all the model physics and domain settings the same as in the previous two experiments. Therefore, these latter two experiments essentially represent the indirect effects only.
The total effect (Δtot), indirect effect (Δindir), and direct effect (Δdir) of dust were then calculated with the following equations.
Table 2WRF-Chem model experiments.
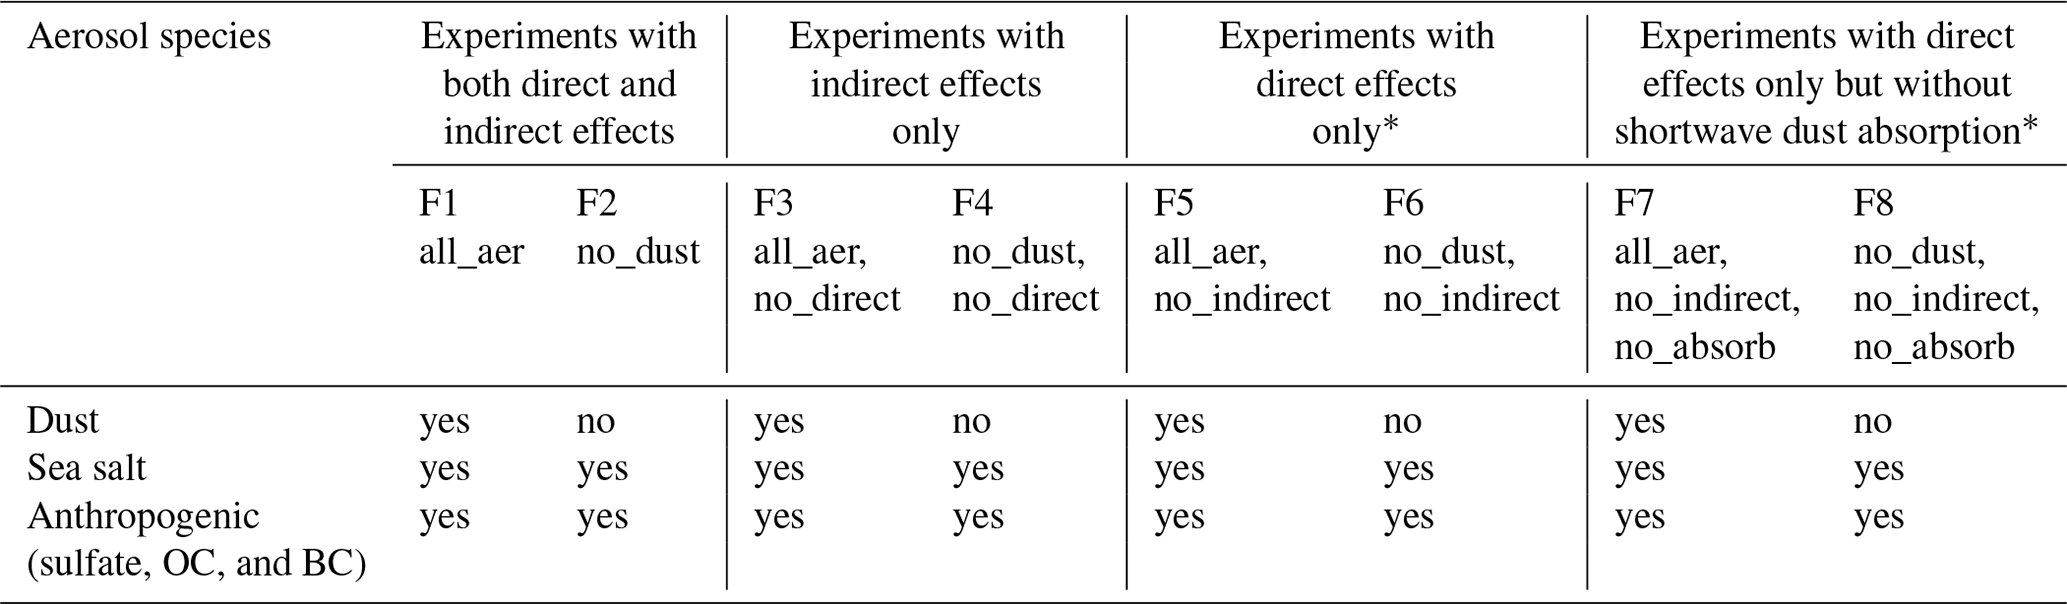
* Diagnostic experiments (see Sect. 3.3.2).
The physical processes through which dust affects breezes are difficult to understand when both direct and indirect effects are active. Additionally, the indirect effects are more complex, and their representation in the model is accompanied by a high degree of uncertainty. For these reasons, we additionally analyzed the direct effects of dust alone from an independent pair of simulations involving the dust direct effects only (F5, F6, Table 2) (i.e., without considering the indirect effects (chem_opt = 8)).
The dust direct effect is caused by both scattering and absorption of radiation in the SW bands. Therefore, to further understand the relative importance of shortwave cooling and warming resulting from direct effects, we conducted an additional pair of simulations (F7, F8, Table 2), in which we restricted the shortwave absorption of radiation by dust in the previous experiments F5 and F6. To achieve this, we changed the imaginary part of the refractive index for dust from the default value of 0.003 to 0.
The aforementioned effects were calculated for the domain-average daily-accumulated rainfall over the study period of 4–31 August for each year between 2006–2015 as the difference of rainfall amounts between the experiments all_aer (x) and no_dust (y). The statistical significance of the effect was determined from the entire 10 years of simulations by creating a uniform sample of domain-average daily-accumulated rainfall data consisting of 280 (10×28 d) data points. Statistical analyses were then conducted by separating the data into two categories: extreme and normal rainfall events. This separation is meaningful because extreme rainfall events are more influenced by synoptic features whereas normal rainfall events are more influenced by diurnal-scale sea breeze circulation. High- and low-rainfall regimes are also known to respond differently to a given aerosol loading (Li et al., 2011; Choobari, 2018). Extreme rainfall events were separated from normal rainfall events using the 90th percentile value of the rainfall data from F1 experiment, which was 1.33 mm. Specifically, days with domain-average daily-accumulated rainfall values greater than or equal to 1.33 mm were considered extreme rainfall events, whereas those with values below 1.33 mm were considered normal rainfall events. With this criterion, the effective numbers of samples (days) available for statistical analysis were 31 and 243 for extreme and normal rainfall events, respectively. Using MATLAB, the statistical significance of the effects was determined with the Wilcoxon signed-rank test (Hollander and Wolfe, 1999; Gibbons and Chakraborti, 2011), which is recommended for data with non-normal distributions such as rainfall. The null hypothesis of the test considered that the difference (all_aer (x) − no_dust (y)) comes from a distribution with zero median. The same method was applied to identify significant effects among other parameters including 2 m air temperature, 10 m winds, and 2 m water vapor mixing ratio.
3.1 Model validation
Here we present a comprehensive evaluation of WRF-Chem from multiple perspectives, including diurnal cycles, vertical profiles, spatial distribution, and column-averaged properties, before using the model for answering our research questions listed in Sect. 1. All results in this section correspond to the real-world case (all_aer) unless otherwise stated.
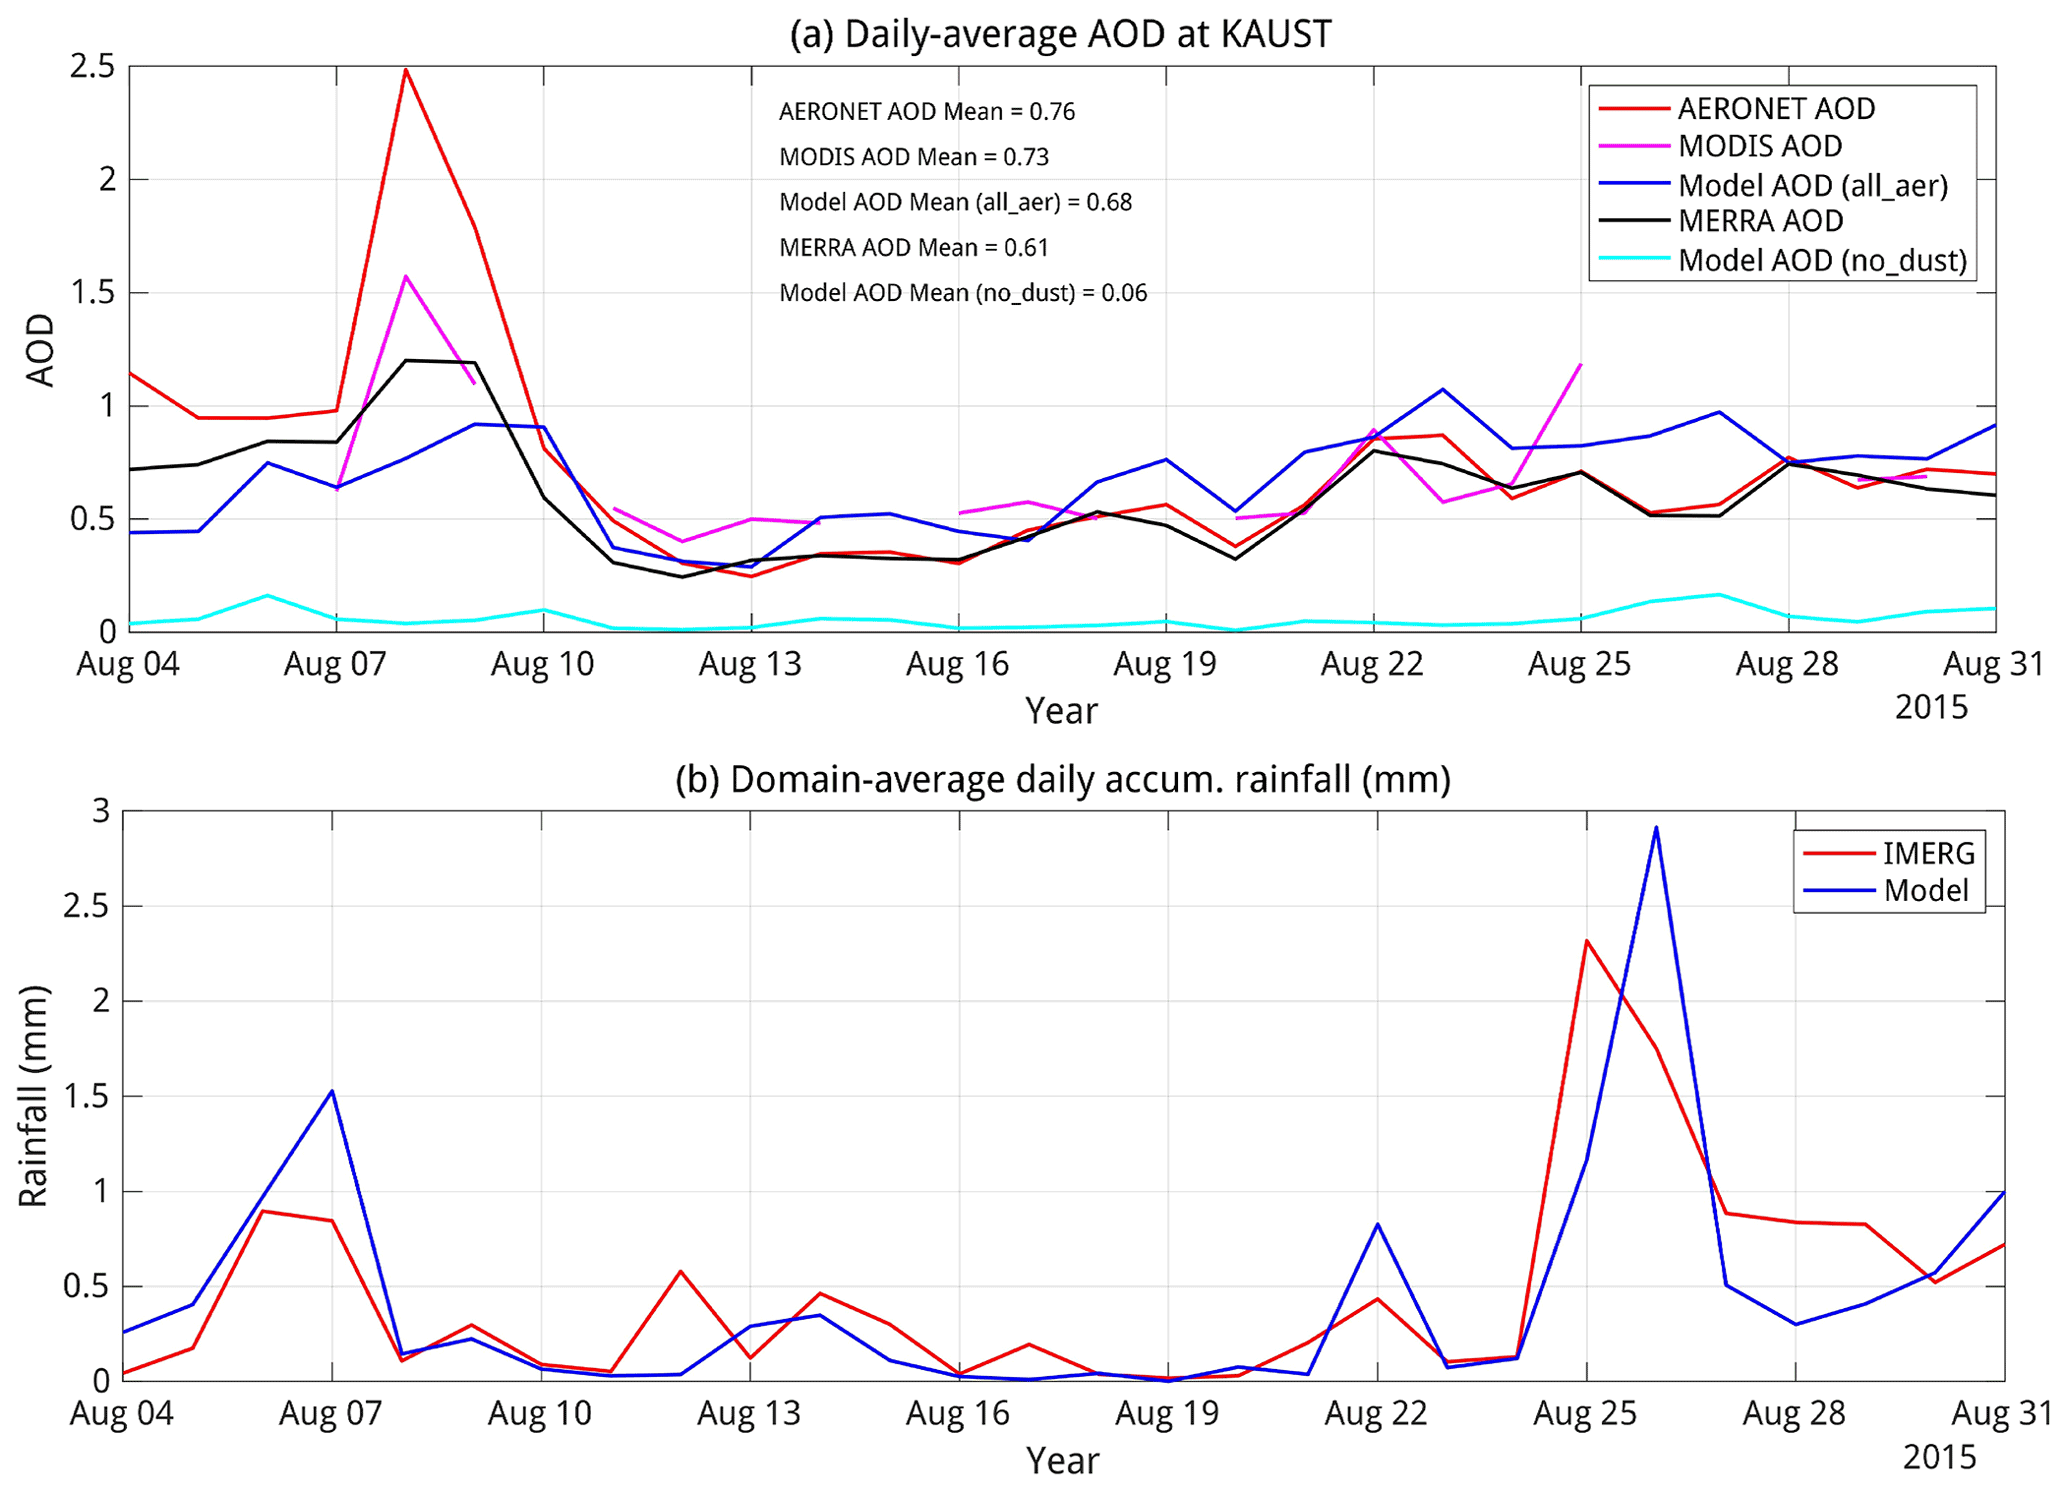
Figure 2(a) Simulated daily-mean total AOD compared to MODIS and MERRA-2 data at KAUST and (b) simulated daily-accumulated rainfall (mm) compared to IMERG data, averaged over the study domain (d03).
Figure 2a shows the domain-averaged (d03) time series of model-simulated AOD (all_aer case) during the study period compared to AERONET, MODIS, and MERRA data. The model AOD generally agrees well with both datasets, although the peaks during the dust storm (8–9 August) tend to be underestimated. The average AOD corresponding to the no_dust case is also presented in Fig. 2a to provide a sense of how much AOD is increased with the addition of dust.
The time-series profile of the model-simulated daily-accumulated rainfall follows the trend in the IMERG data (Fig. 2b). The rainfall peaks including the largest rain event during the study period (∼ 25 August 2015) were reproduced reasonably well. Some discrepancy is expected because there are usually fewer microwave imager observations included in the IMERG data in the tropical–subtropical region.
Figure S1 in the Supplement illustrates comparison between the simulated aerosol volume size distribution and the corresponding AERONET size distribution. The two distributions agreed well, especially in the finer mode that is centered at ∼ 0.1 µm, which is critical from the perspective of the contribution of aerosols in the formation of CCN and IN. It is also important to note that this finer mode was non-existent in the model when using the default aerosol size distribution. Therefore, we adjusted both dust emission fractions (Table S1) and MOSAIC dust size fractions (Table S2) so that the resulting size distribution matched the AERONET data more accurately, as mentioned earlier.
Figure 3 shows the model-simulated vertical profiles of air temperature (left) and aerosol concentrations (right) compared to key observations. The simulated temperature profile was generally consistent with the radiosonde observations as well as ECMWF operational analysis with some discrepancies at the cloud-level heights and near the surface. The temperature at the site does not show large daytime and nighttime variations. Figure 3 also shows the profiles of aerosol concentrations at KAUST averaged over the study period. The profiles of the model, MERRA-2, and lidar data show some similarity, but the model and MERRA-2 generally overestimate concentration by about 50 % compared to lidar data. The mismatch is greater near the surface.
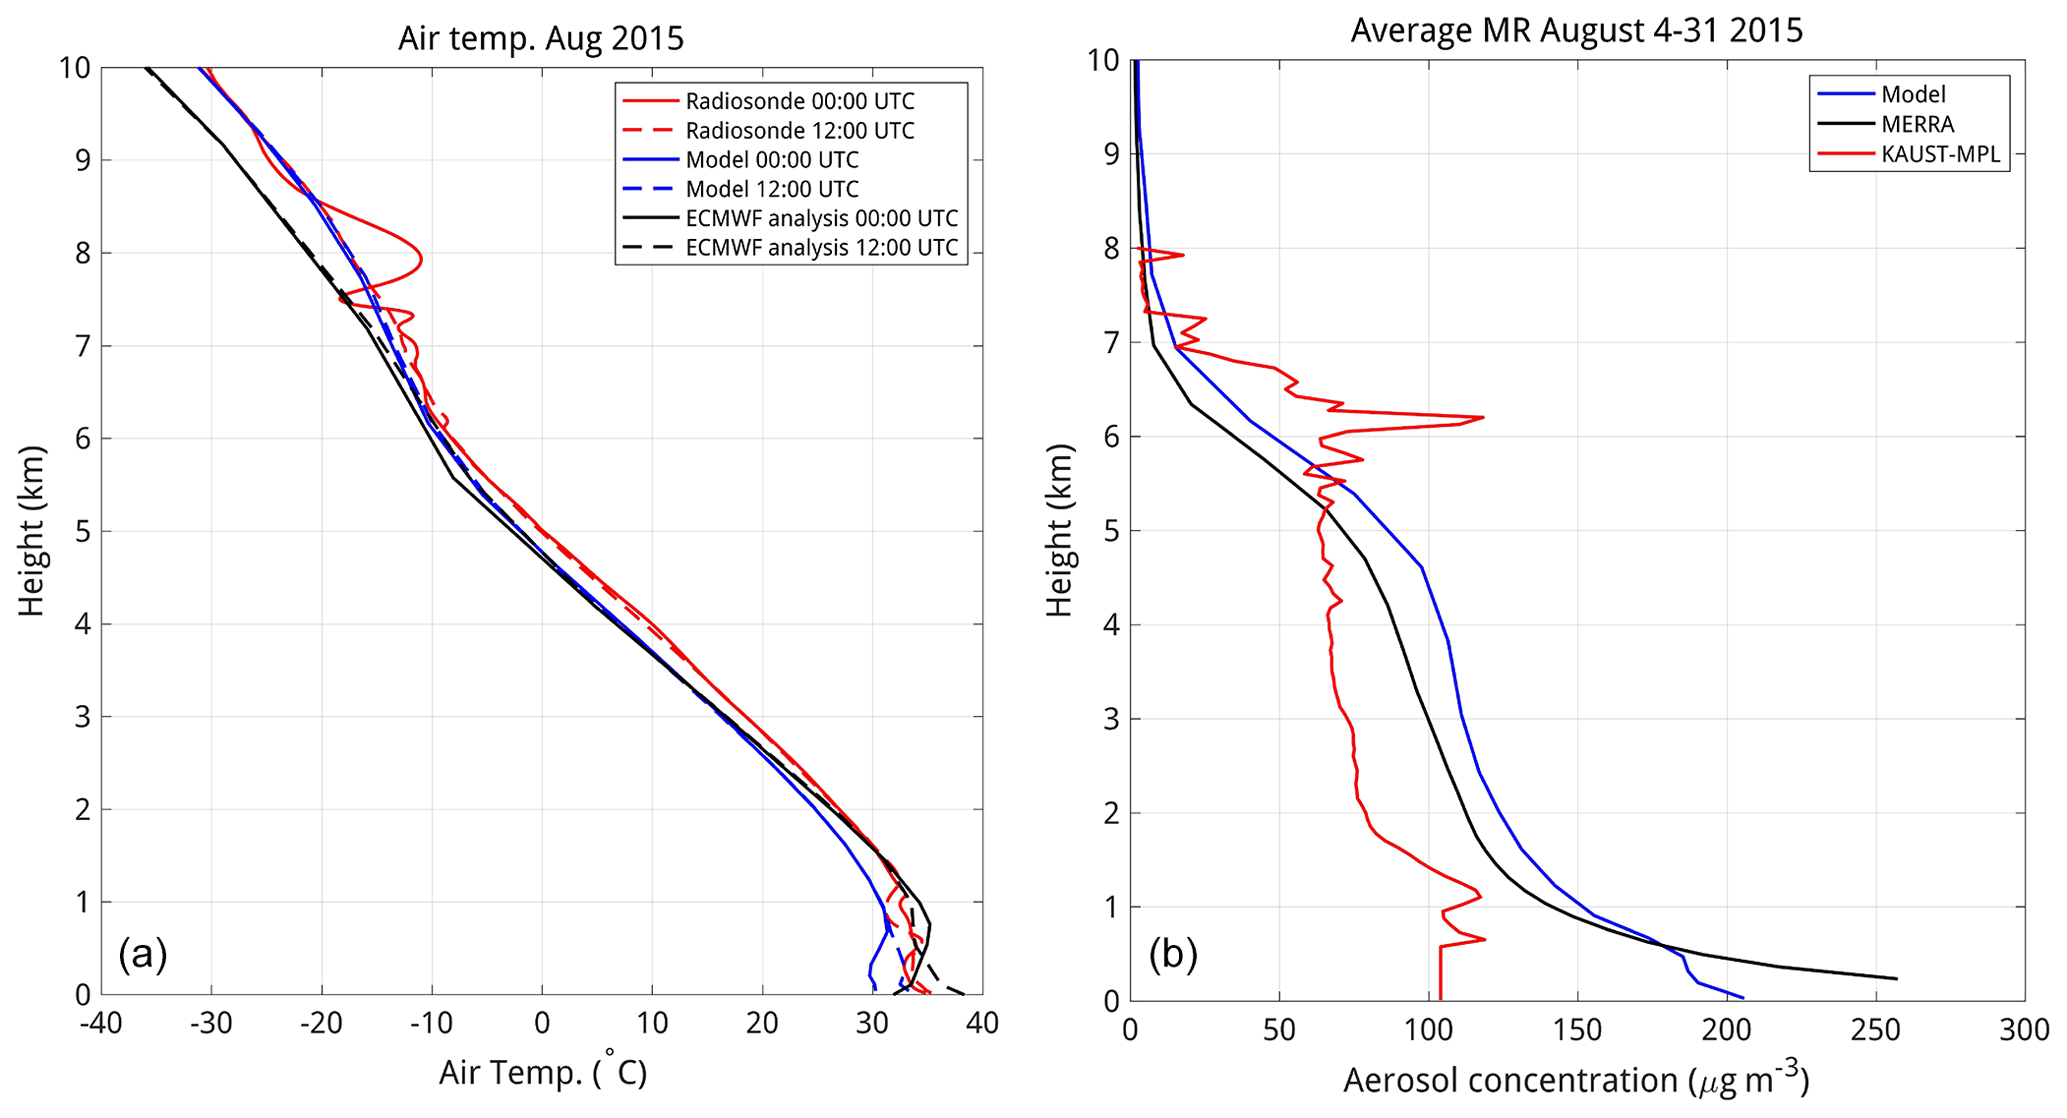
Figure 3Average vertical profiles of air temperature (a) and aerosol concentrations (b) compared to reference observations. The air temperature profile was compared against ECMWF operational analysis and radiosonde station data at King Abdul Aziz International Airport, Jeddah (21.7∘ N, 39.18∘ E) during the daytime (12:00 UTC) and nighttime (00:00 UTC) by averaging during the study period (4–31 August 2015). Simulated aerosol mixing ratios were compared against MERRA-2 reanalysis and MPL lidar station data at KAUST (22.30∘ N, 39.10∘ E) for 4–31 August 2015.
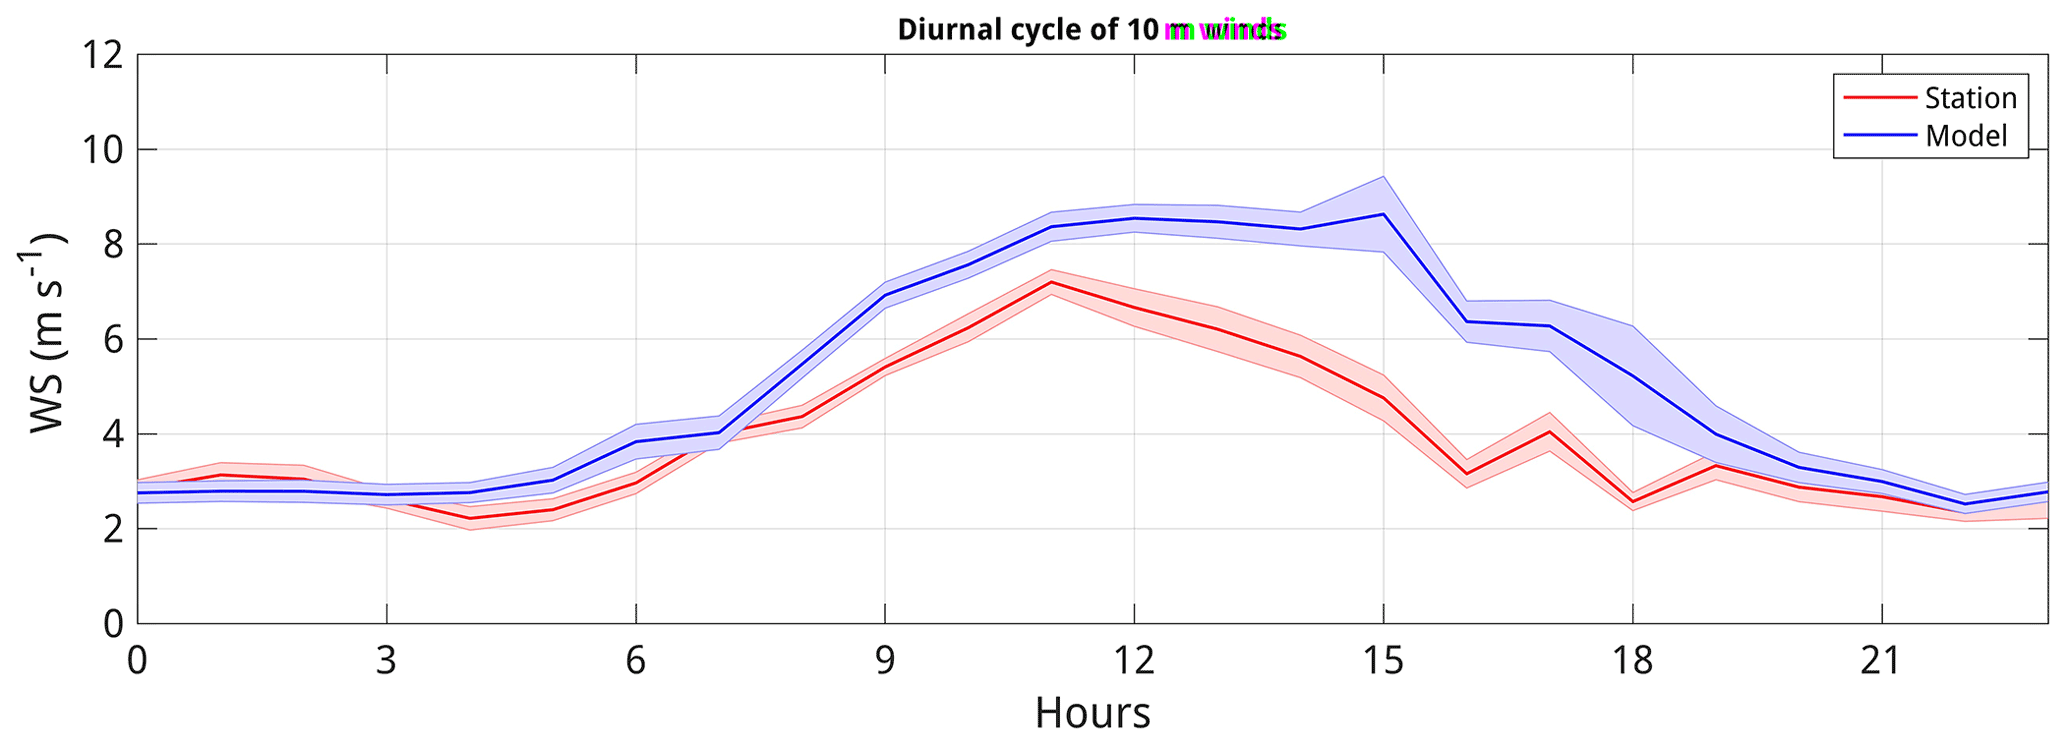
Figure 4Diurnal profile of the model-simulated wind speeds compared to station data over the study period (4–31 August 2015) at KAUST (22.30∘ N, 39.10∘ E). The shading represents the standard error of the mean calculated from the hourly wind speeds.
Figure 4 shows the wind speed diurnal profile in the model and the observations at KAUST during the study period (4–31 August 2015), which were reasonably consistent. The model overestimated wind speeds mainly during the afternoon, which is when the flow is more chaotic as the sea breezes meet the northeasterly harmattan winds. The peak winds occur at ∼ 12:00 UTC (15:00 local time), which correspond to the sea breeze maxima. The root-mean-squared error (RMSE) of the simulated wind speed is 1.18 m s−1, which is 29.6 % of the observed mean. This level of discrepancy is reasonable since anemometers also typically have uncertainty up to ±0.5 m s−1.
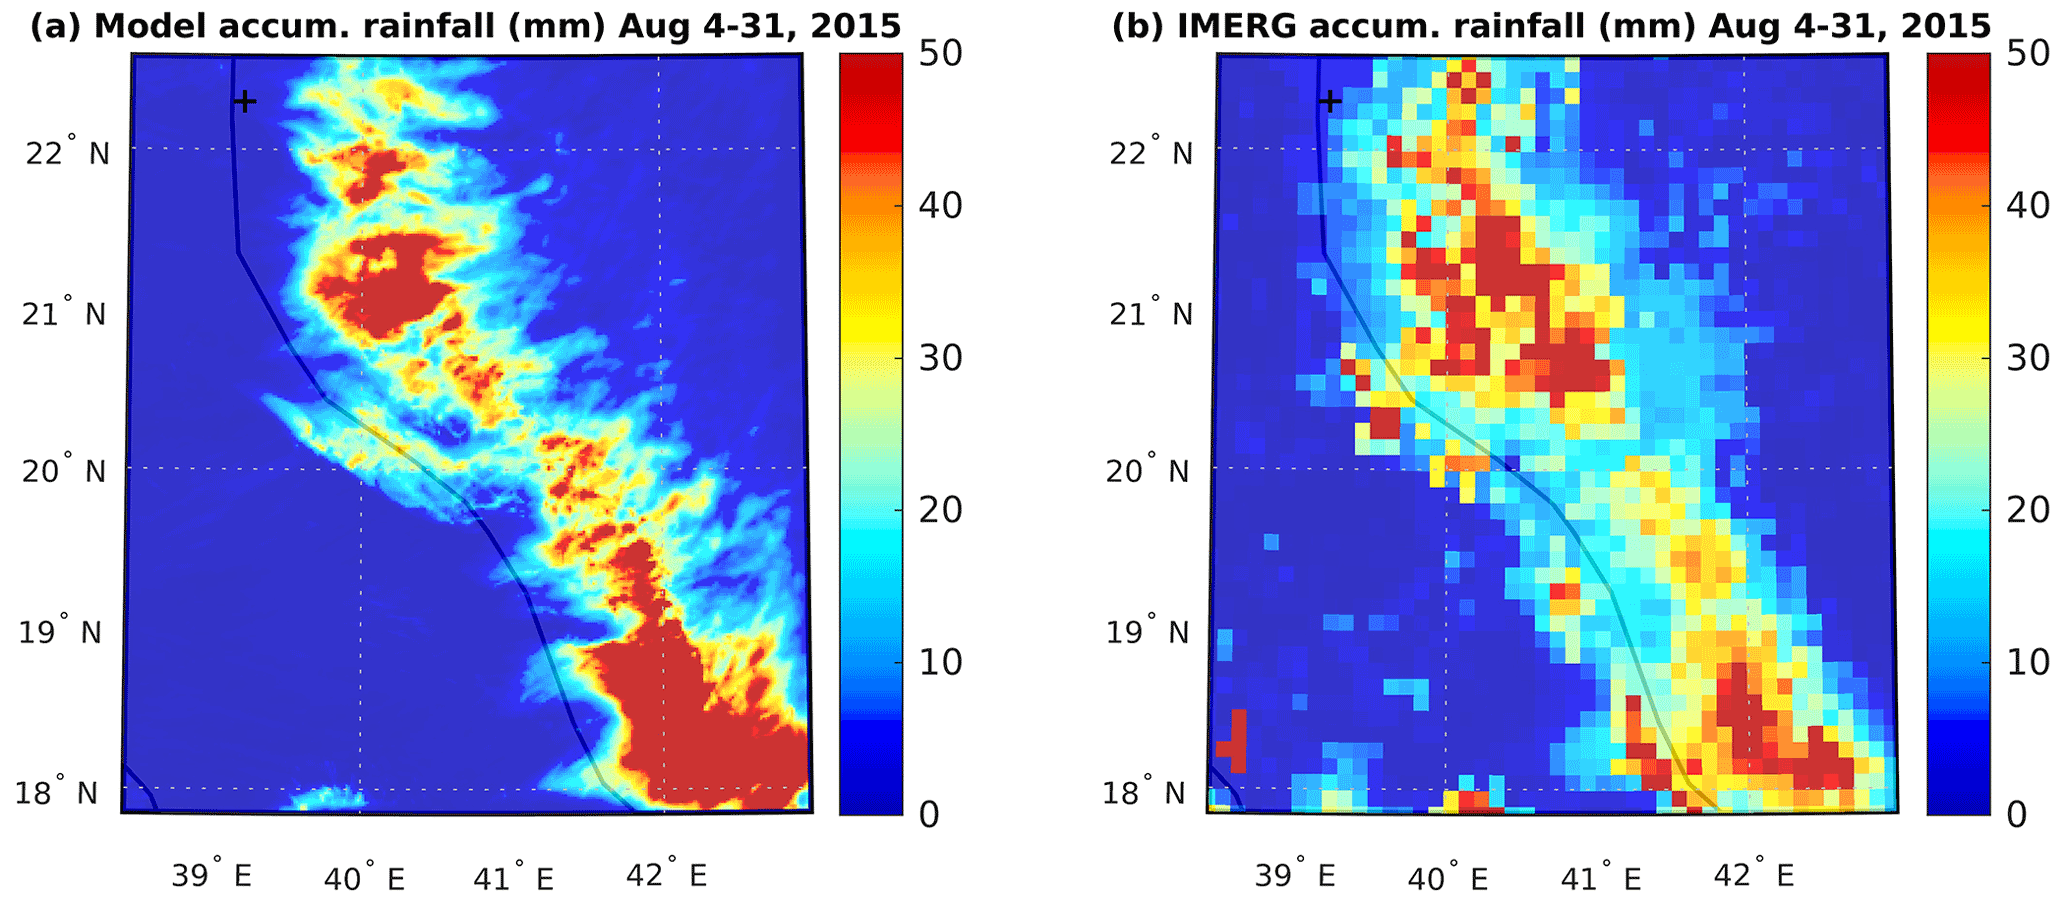
Figure 5Spatial distribution of accumulated rainfall (4–31 August 2015) (a) model and (b) IMERG data. The location of KAUST is marked by a plus sign.
Figure 5 shows the spatial distribution of accumulated rainfall during the study period over the study domain (d03) compared to the IMERG data, both of which were reasonably consistent with each other. The rainfall pattern follows the length of the Sarawat mountains stretching north to south. As the model shows, larger amounts of rainfall occur in the areas with higher mountains. In the inland areas away from the coast, rainfall distribution is also determined by synoptic rain events. For example, during the period of comparison, there were two events (7 and 26 August) categorized as extreme rainfall events. This could be the reason why the IMERG data show stronger rainfall in the north than in the south. The model has larger rainfall bias during such extreme rain events (Fig. 2b) so the spatial distribution appears somewhat inconsistent with the IMERG data. However, note that IMERG data also show high RMSE (up to 30 mm) in this region compared to rain gauge measurements (Mahmoud et al., 2018).
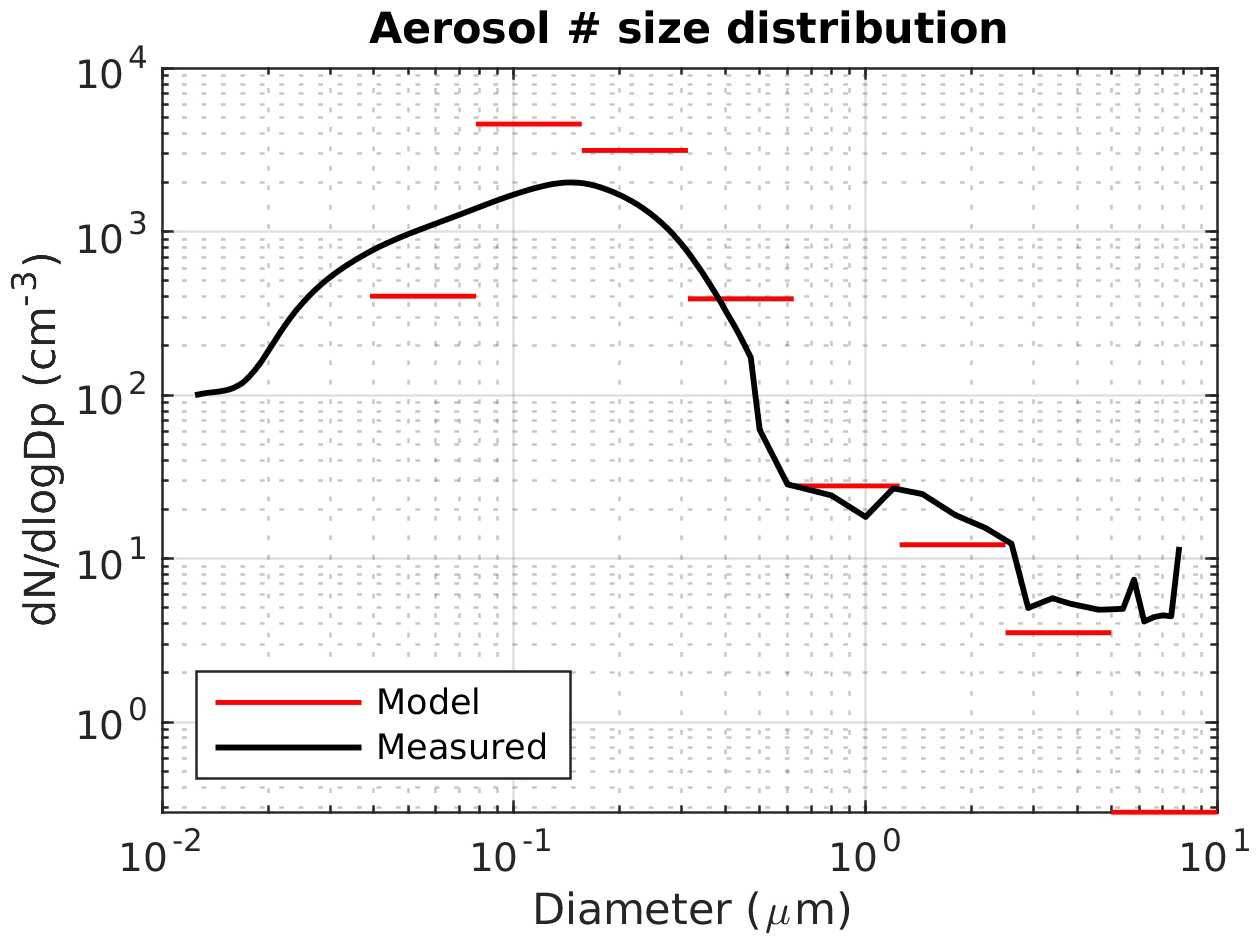
Figure 6Comparison of model-simulated aerosol number concentrations (cm−3) corresponding to MOSAIC size bins compared to flight-measured values during the field campaign of August 2009. The widths of the red lines represent the widths of the eight MOSAIC bins. The model data (eight bins) were extracted at the exact latitude, longitude, and altitude corresponding to the flight data by 3-D linear interpolation and averaged over the days available (11–30 August 2009) during the time of measurements (∼ 06:00 to 09:00 UTC).
Figure 6 shows the aerosol number size distributions compared to the flight data. Results indicate that the eight-bin MOSAIC sectional aerosol scheme can represent the atmospheric aerosol size distribution well. The peak number concentration occurs at ∼ 0.15 µm diameter in both model and flight data. Although the size distribution patterns appear similar in model and observation, the differences in number concentrations are high particularly at 0.06–0.2 µm (note the logarithmic scale).
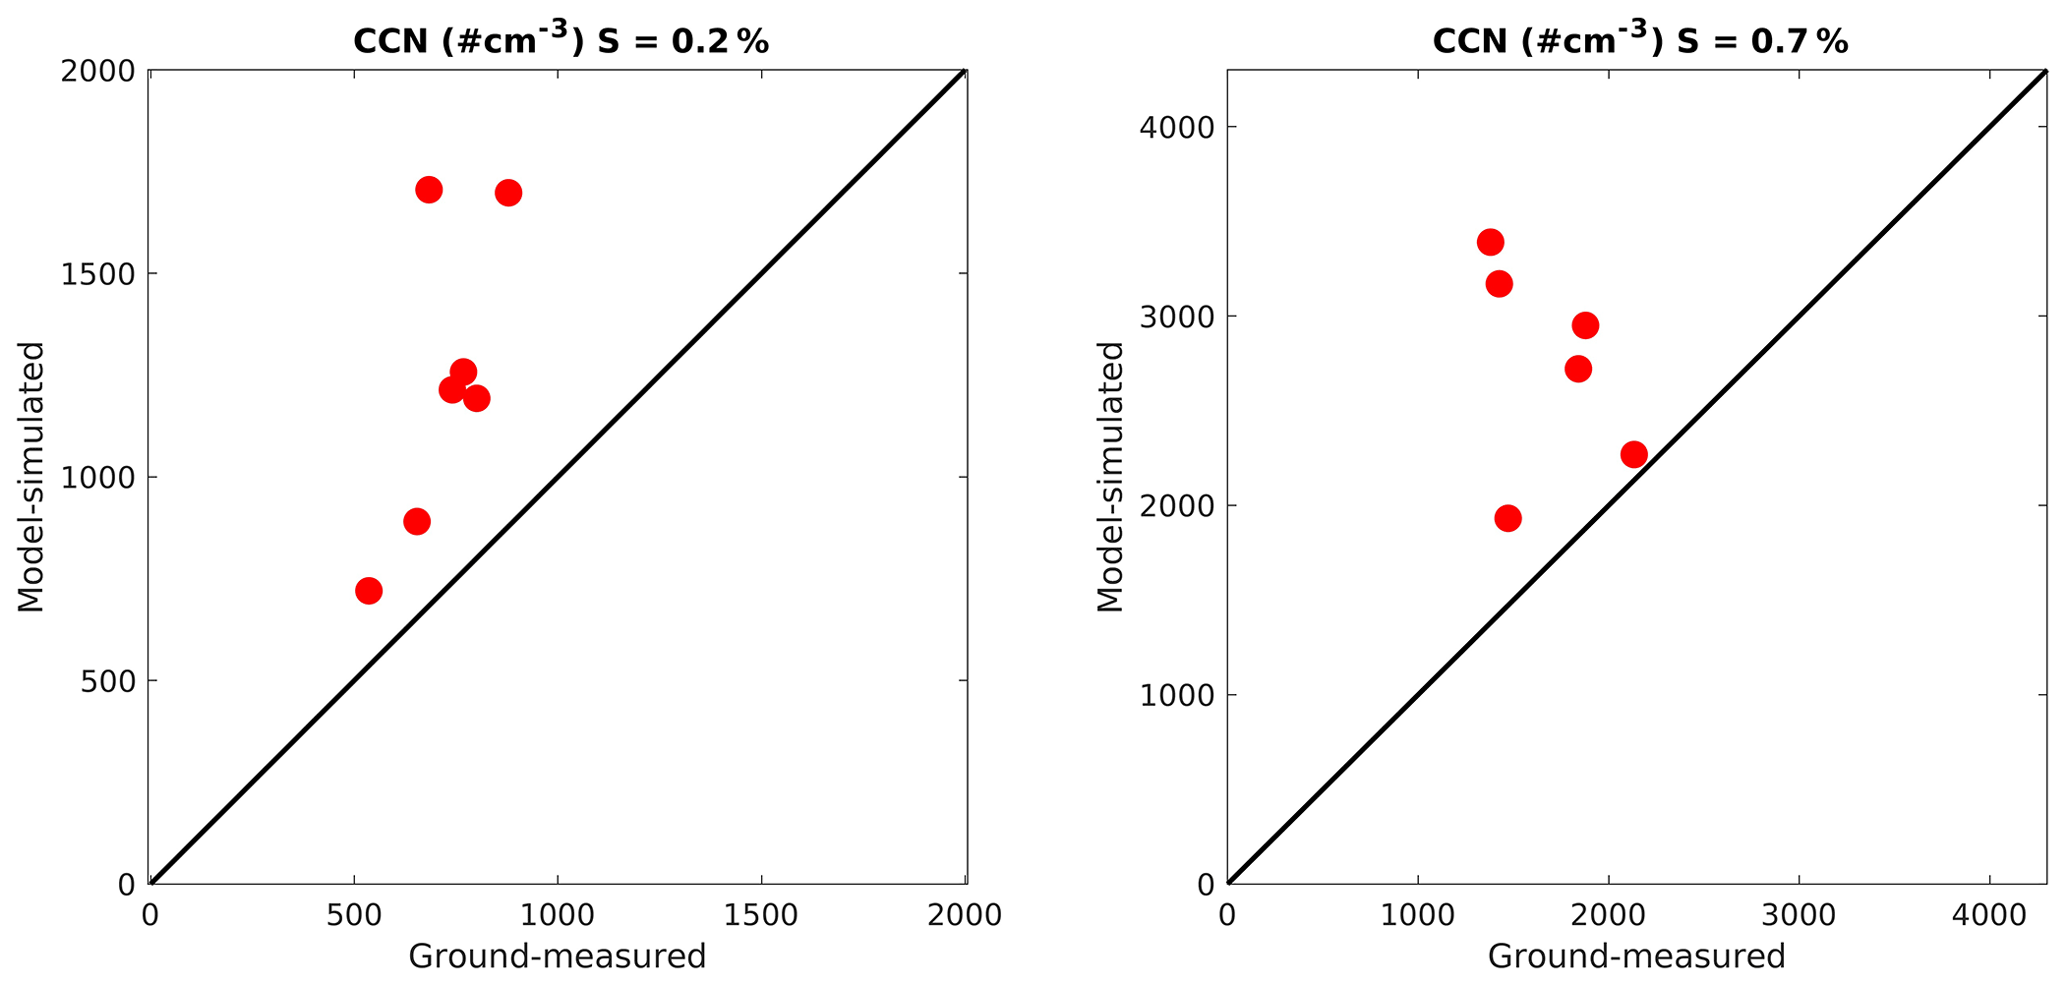
Figure 7Comparison between model-simulated CCN number concentrations and ground-measured values at the PME station (18.24∘ N, 42.46∘ E) at supersaturations of 0.2 % and 0.7 %. The CCN number concentrations correspond to the ground station at Abha. The plotted point represents the average value for different days of measurement from 11–30 August 2009 approximately from 02:00 to 08:00 UTC.
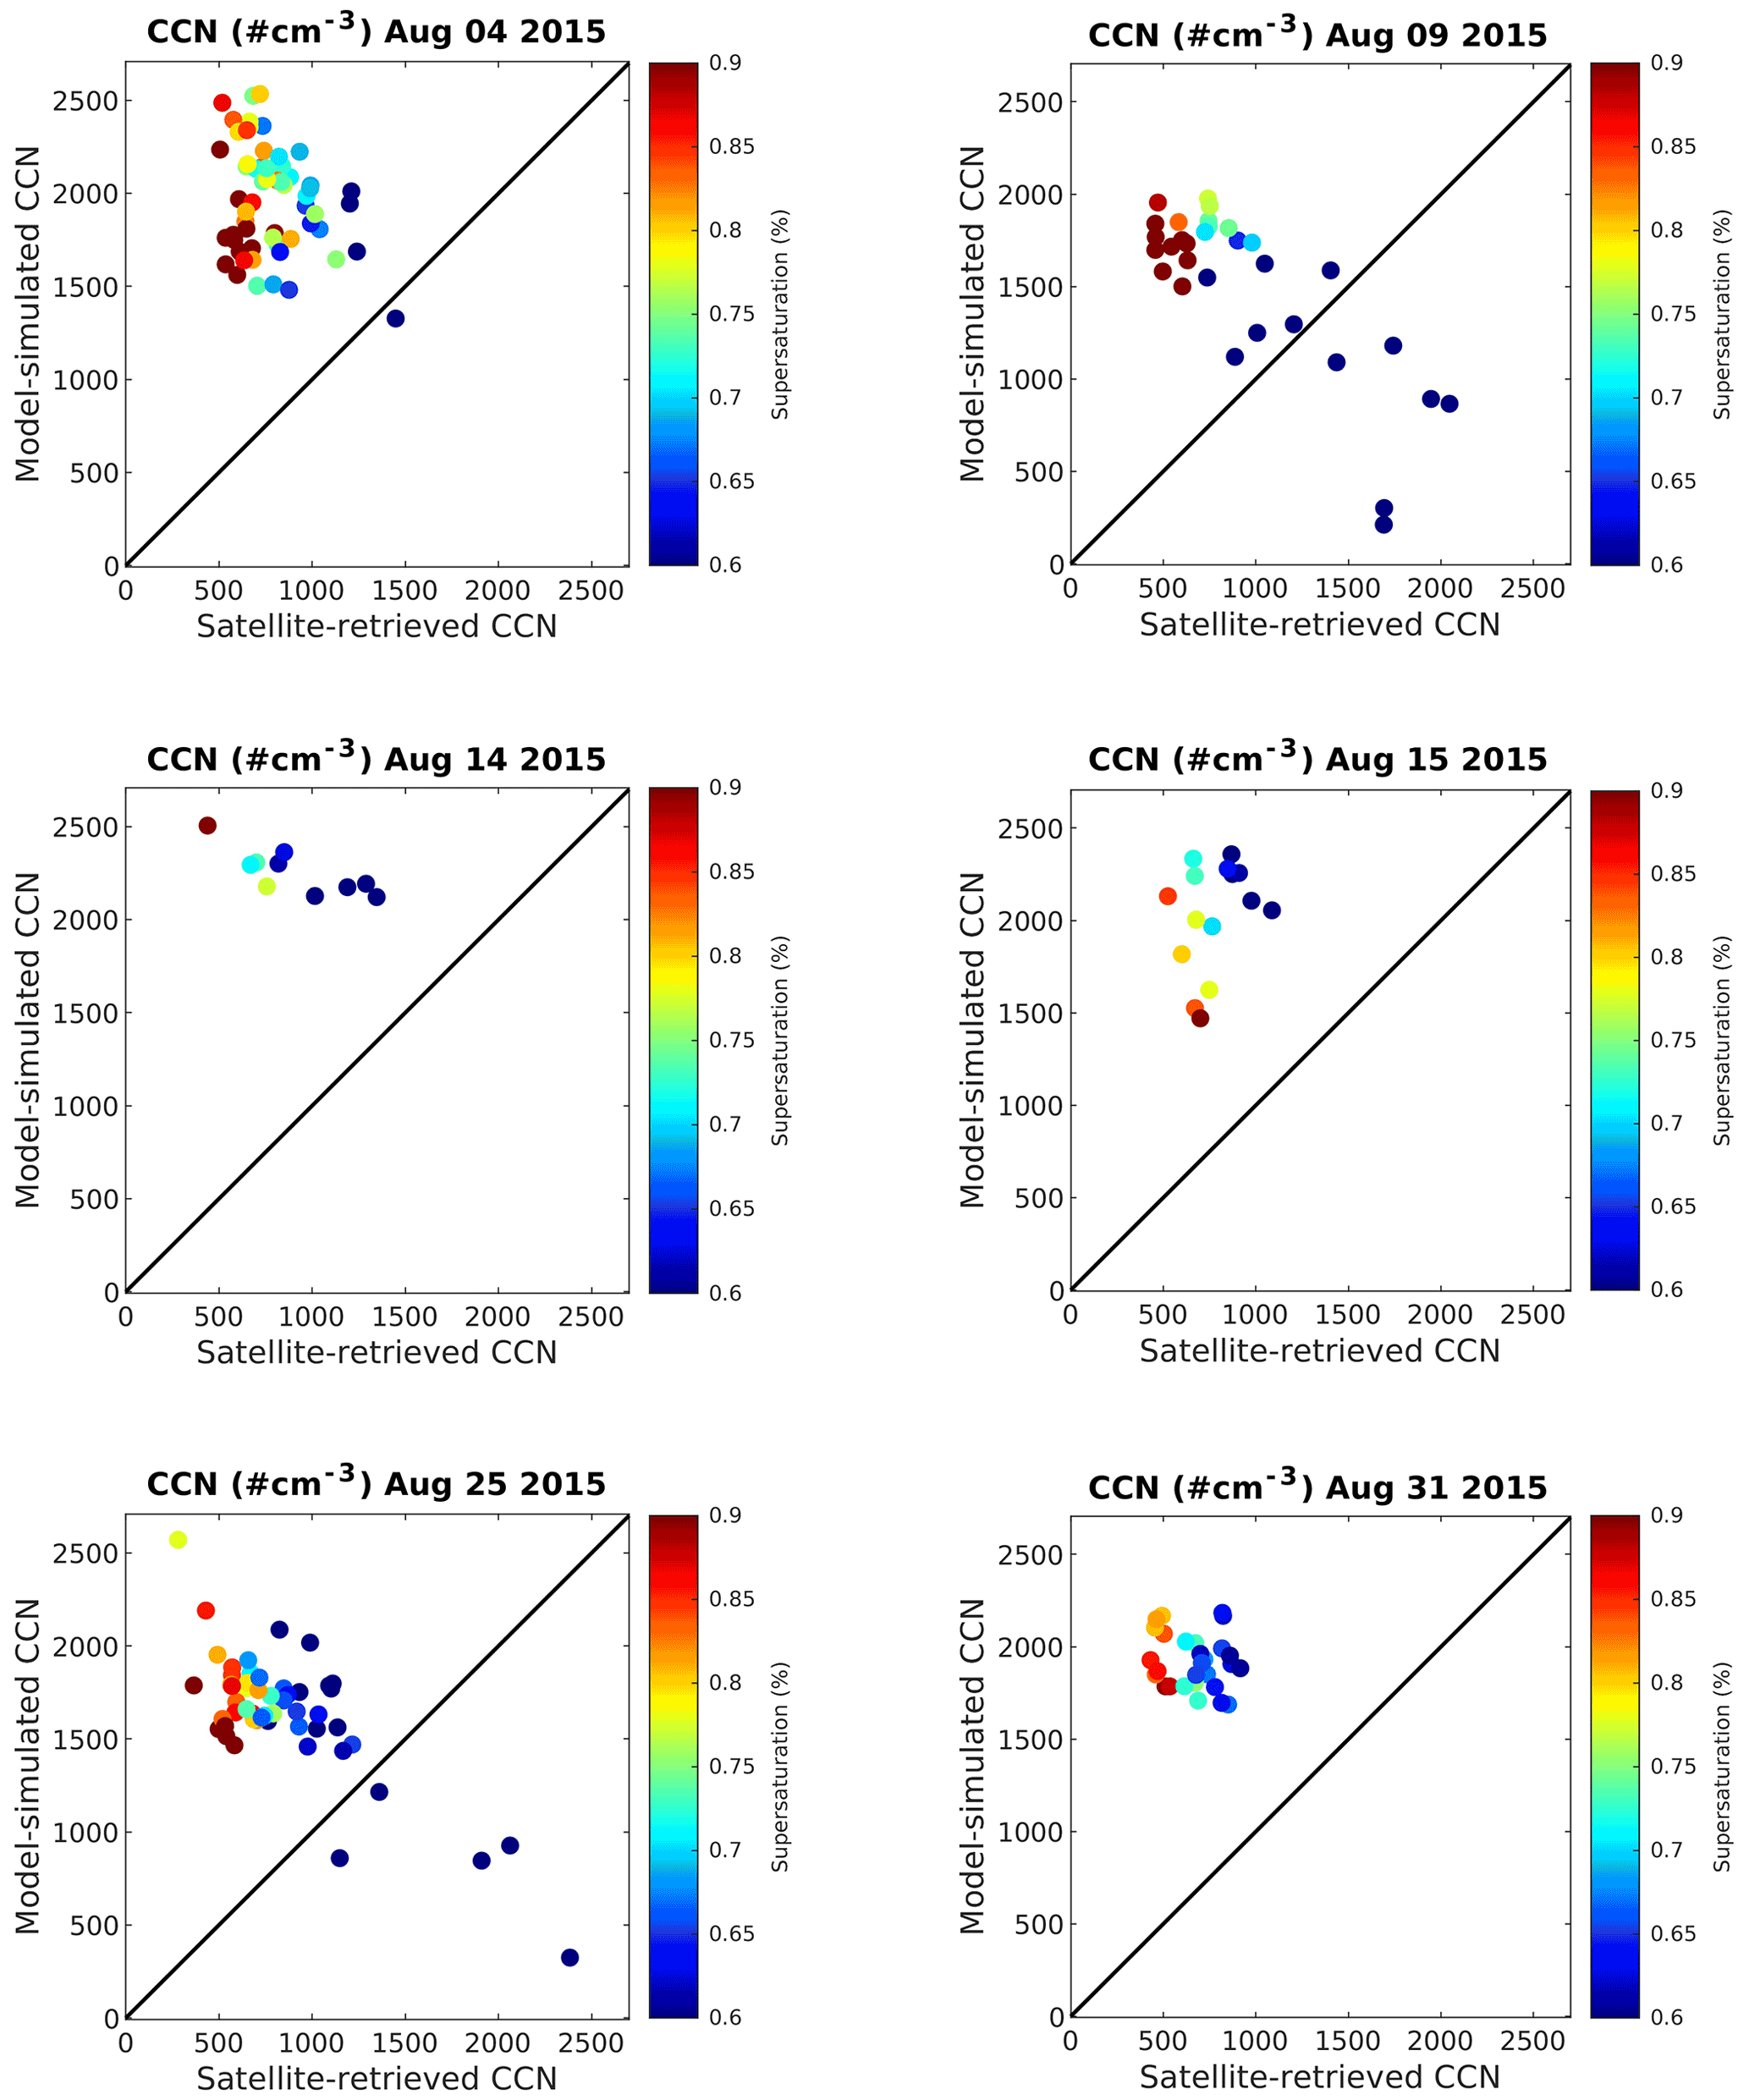
Figure 8Model-simulated vs. VIIRS satellite-retrieved CCN number concentrations for 6 d of available data within the study domain during the August 2015 study period. The data points represent CCN number concentrations at the cloud base of existing convective cells on different days over the study domain (d03).
Figure 7 shows the comparison between the CCN number concentrations obtained from the model and from the ground station at two supersaturations measured during the August 2009 field campaign. CCN number concentrations are generally overestimated by the model at both low and high supersaturations by up to a factor of 2.
Figure 8 shows the comparison between the model-simulated CCN number concentration and the satellite-retrieved data from VIIRS. Similar to the previous comparison, the model overestimates CCN number concentration compared to the VIIRS data also by approximately a factor of 2.
Since the rainfall amount is reasonably well simulated (Figs. 2b and 5), the overestimation of CCN concentration suggests that CCN is not a limiting factor for rain formation in the study region. These findings are reasonable because the study region is not aerosol-limited, and therefore cloud growth and rainfall do not strongly depend on the changes in CCN concentrations, unlike in other aerosol-limited areas (Koren et al., 2014).
3.2 Rainfall diagnostics
This section presents the diagnostic results of the key parameters related to the rainfall process to demonstrate the accuracy of our rainfall calculations.
Figure 9a and b show the rainwater mixing ratio in two longitudinal cross sections, one passing through KAUST (22.3∘ N, 39.10∘ E), a relatively dry area, and another through Abha (18.25∘ N, 42.51∘ E), a region known for rainfall abundance. Maximum rainfall occurs in the evening at 15:00 UTC (18:00 local time) at both locations in the convergence boundary (i.e., where the sea breezes meet with Harmattan winds). The rainfall is limited to a ∼ 6 km height around the hilly terrain. There is less rainfall near the coast, where the majority of the population resides, because the rain evaporates well before it reaches the ground due to high surface temperature. The moisture-laden sea breezes can be prominently seen during the day within ∼ 1.5 km height. Furthermore, these sea breezes strengthen as they travel upslope over the Sarawat Mountains (black shading). The dry northeasterly Harmattan winds, which usually bring dust from the desert towards the Red Sea during dust storms (Jish Prakash et al., 2015; Parajuli et al., 2020), can be seen at a ∼ 3–6 km height.
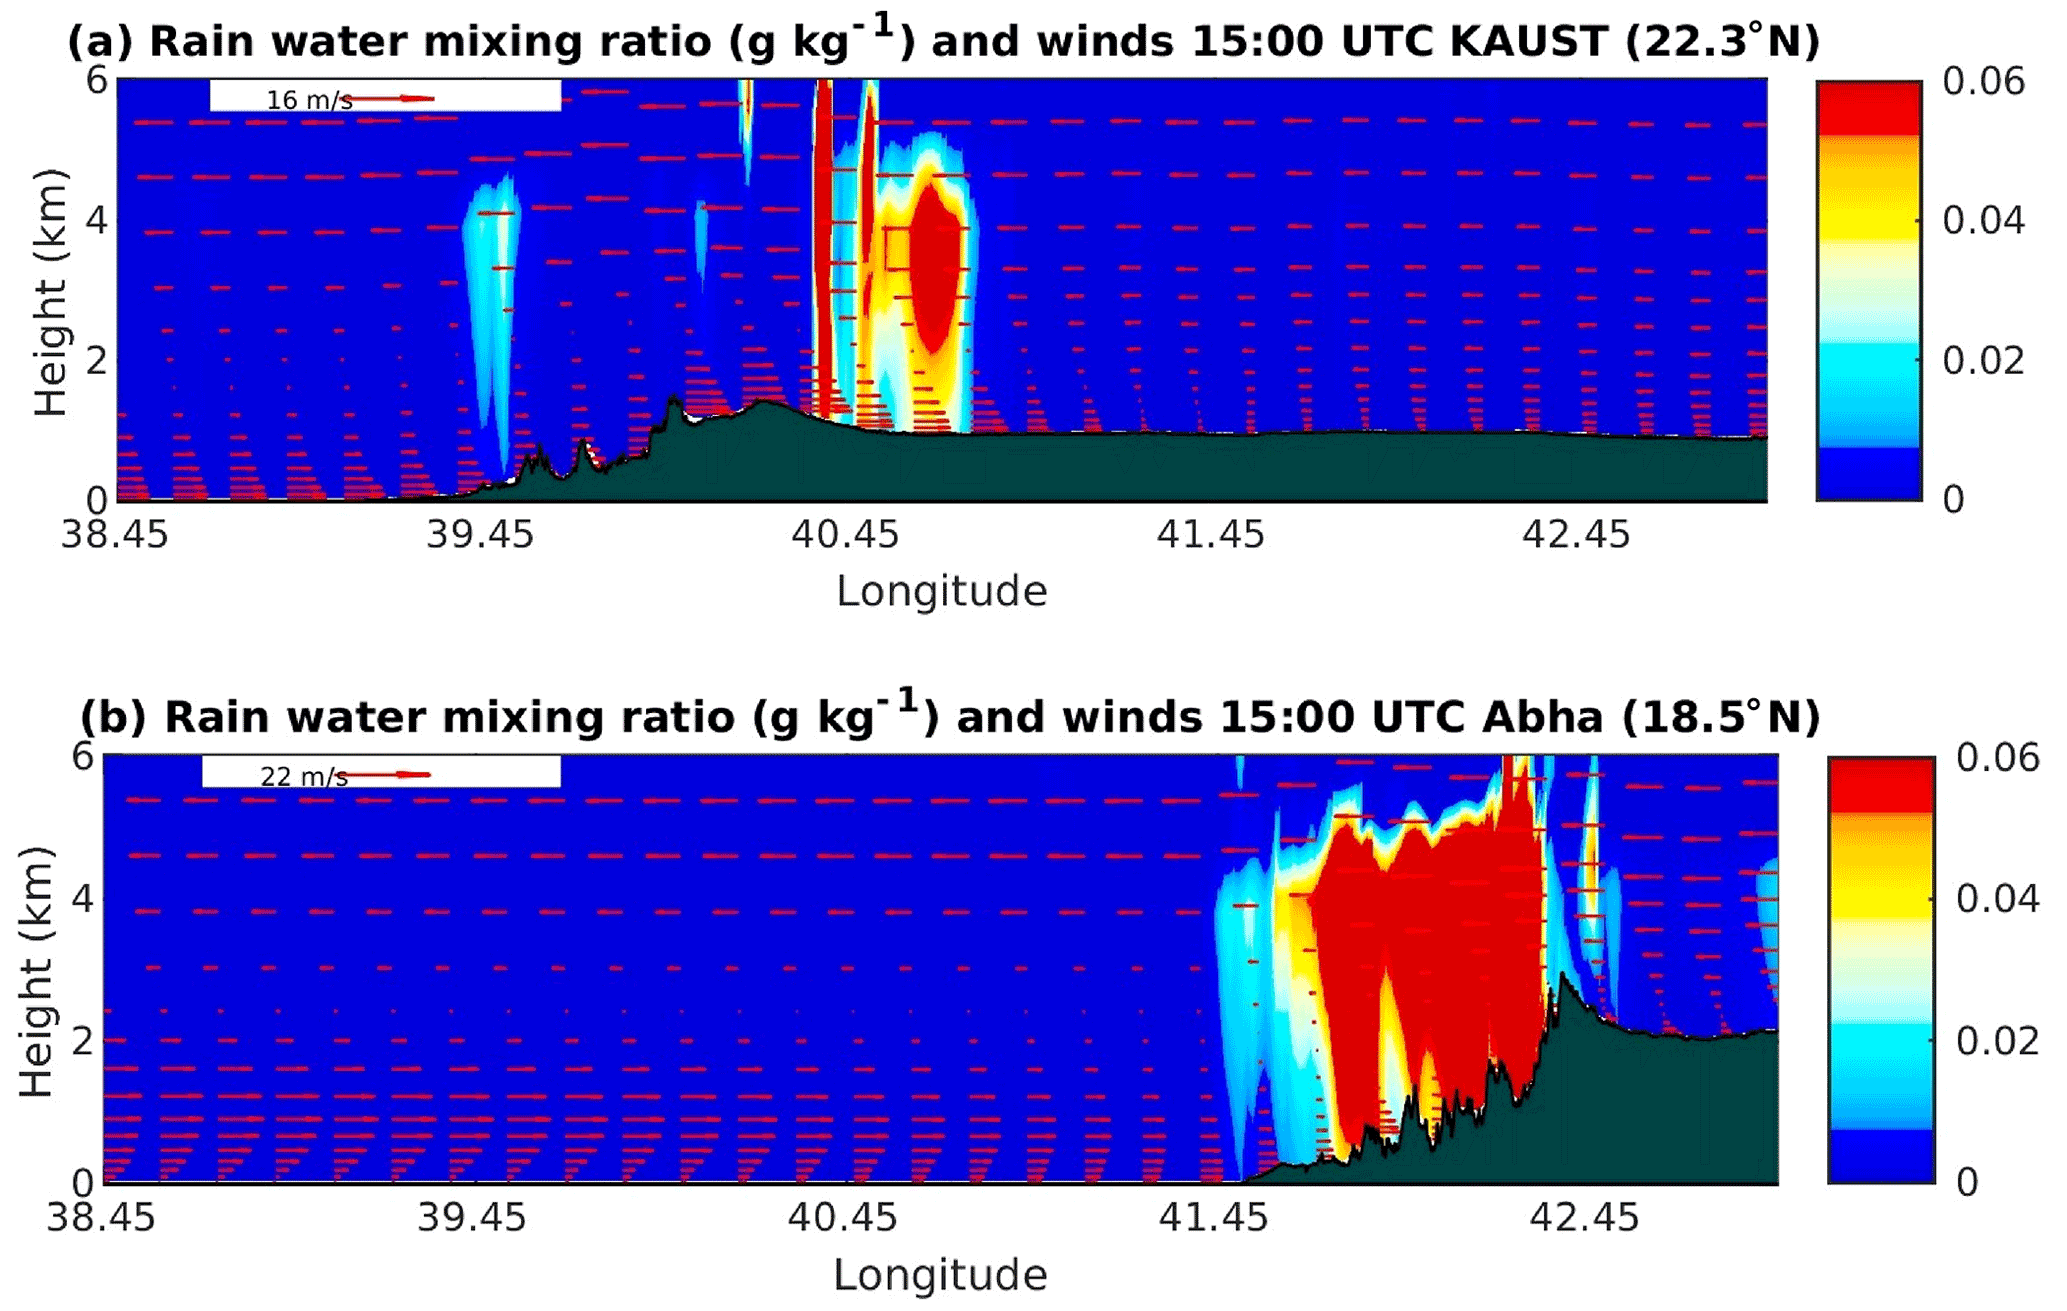
Figure 9Rainwater mixing ratio and wind vectors averaged at 15:00 UTC over the study period (4–31 August 2015) at two longitudinal cross sections passing through (a) KAUST and (b) Abha.
Figure 10 shows the cloud water mixing ratio profiles at the longitudinal profiles passing through KAUST and Abha at rainfall maxima (15:00 UTC), which provides insights into the vertical position and extents of the clouds. Most clouds are observed at a ∼ 5–6 km height at both locations, suggesting that the warm cloud processes are responsible for causing rainfall in the region. The height of deeper convective clouds ranges from ∼ 3 to 10 km. The clouds are generally deeper where rainfall is more intense, which suggests the existence of local convective activity. The horizontal location of clouds is consistent with the locations of rainfall maxima in Fig. 9.
Although more clouds are observed over KAUST (Fig. 10a) than over the Abha region (Fig. 10b), more rainfall occurs over Abha because the steeper topographic slope over the Abha region facilitates stronger orographic lifting of the moist air mass, which converts more easily into rain. The temperature over the Abha region is cooler than that over the KAUST region, and consequently the sea breezes over the Abha region are weaker than at KAUST (Fig. 9). Thus, the maximum rainfall occurs in the front (lee) side of the mountains in the Abha (KAUST) region. Additionally, there is more evaporation over the KAUST region due to its higher surface temperature compared to the Abha region, which reduces the amount of rainfall that reaches the ground but contributes to more cloud formation.
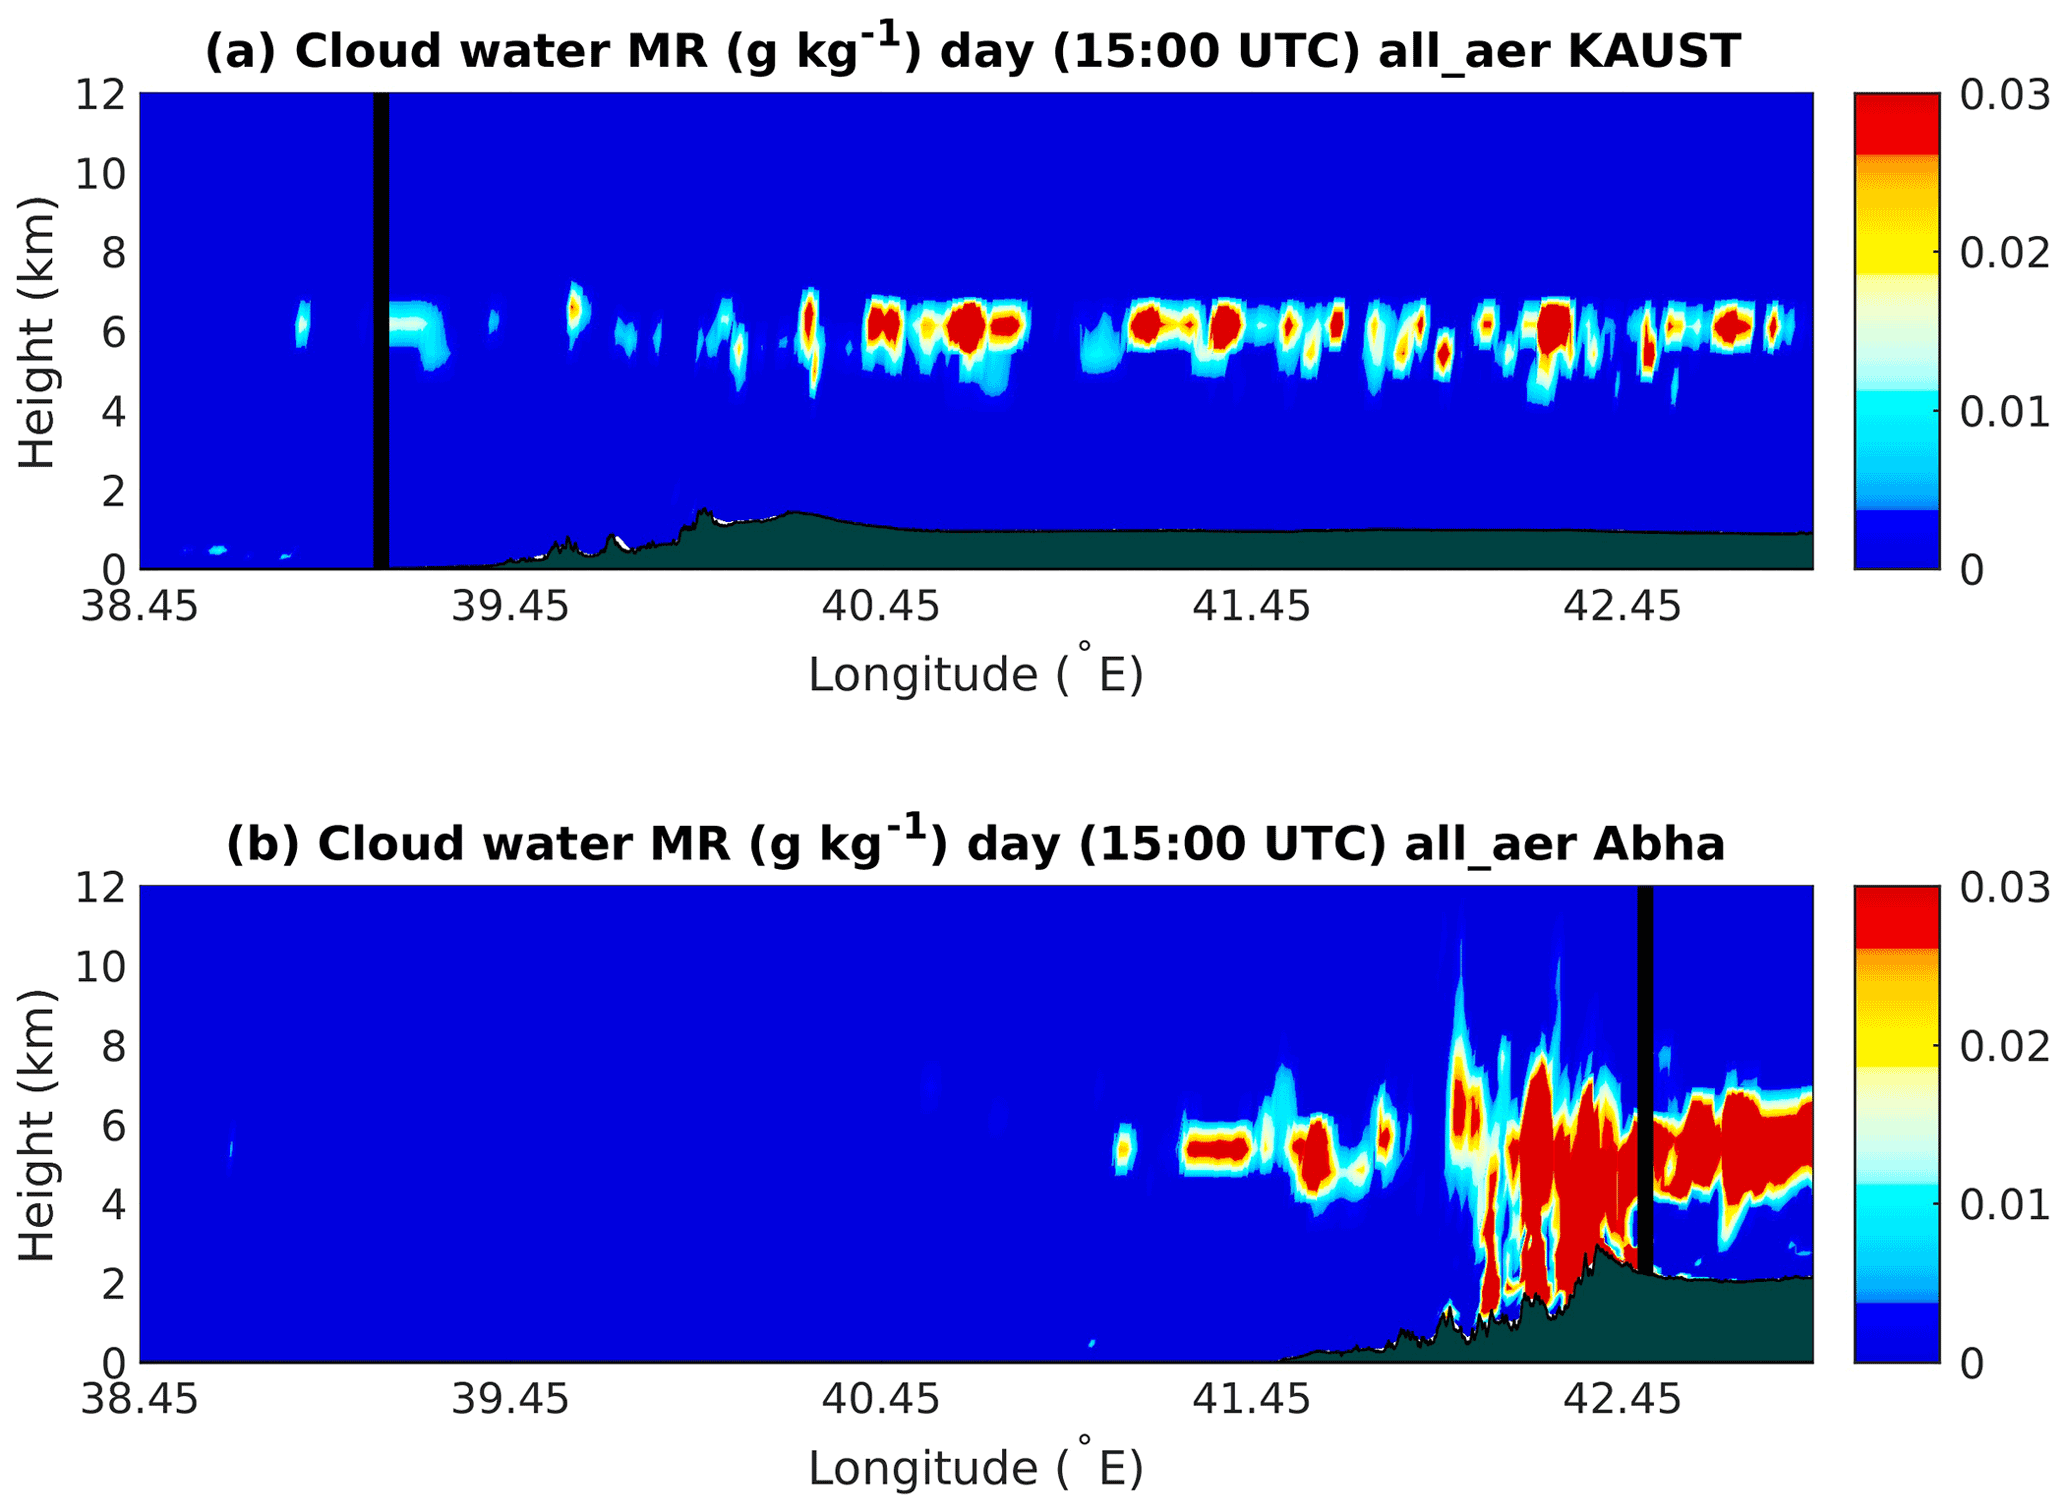
Figure 10Profile of cloud water mixing ratio for a longitudinal section passing through (a) KAUST and (b) Abha, averaged for 4–31 August 2015 at 15:00 UTC. The location of KAUST and Abha city are indicated with black vertical lines.
Figure 11 shows the spatial distribution of the CCN number concentrations at a 0.2 % supersaturation for all_aer (F1), nodust (F2), and their difference (F1 − F2). In the absence of dust, CCN number concentrations are generally uniform throughout the domain (Fig. 11b). There is up to 10-fold increase in CCN after addition of dust (Fig. 11a), making dust the major contributor of total CCN. The simulated CCN number concentrations in the no_dust case are in the range of ∼ 40–50 (Fig. 11b), which is too low compared to the observed CCN number concentrations, which are roughly in the range of 500–1000 in observations (Figs. 7 and 8). Although model CCN number concentrations are overestimated compared to observations as discussed previously, it is clear that the addition of dust brings the CCN number concentrations much closer to observations (Fig. 11a) compared to the case without dust (Fig. 11b).
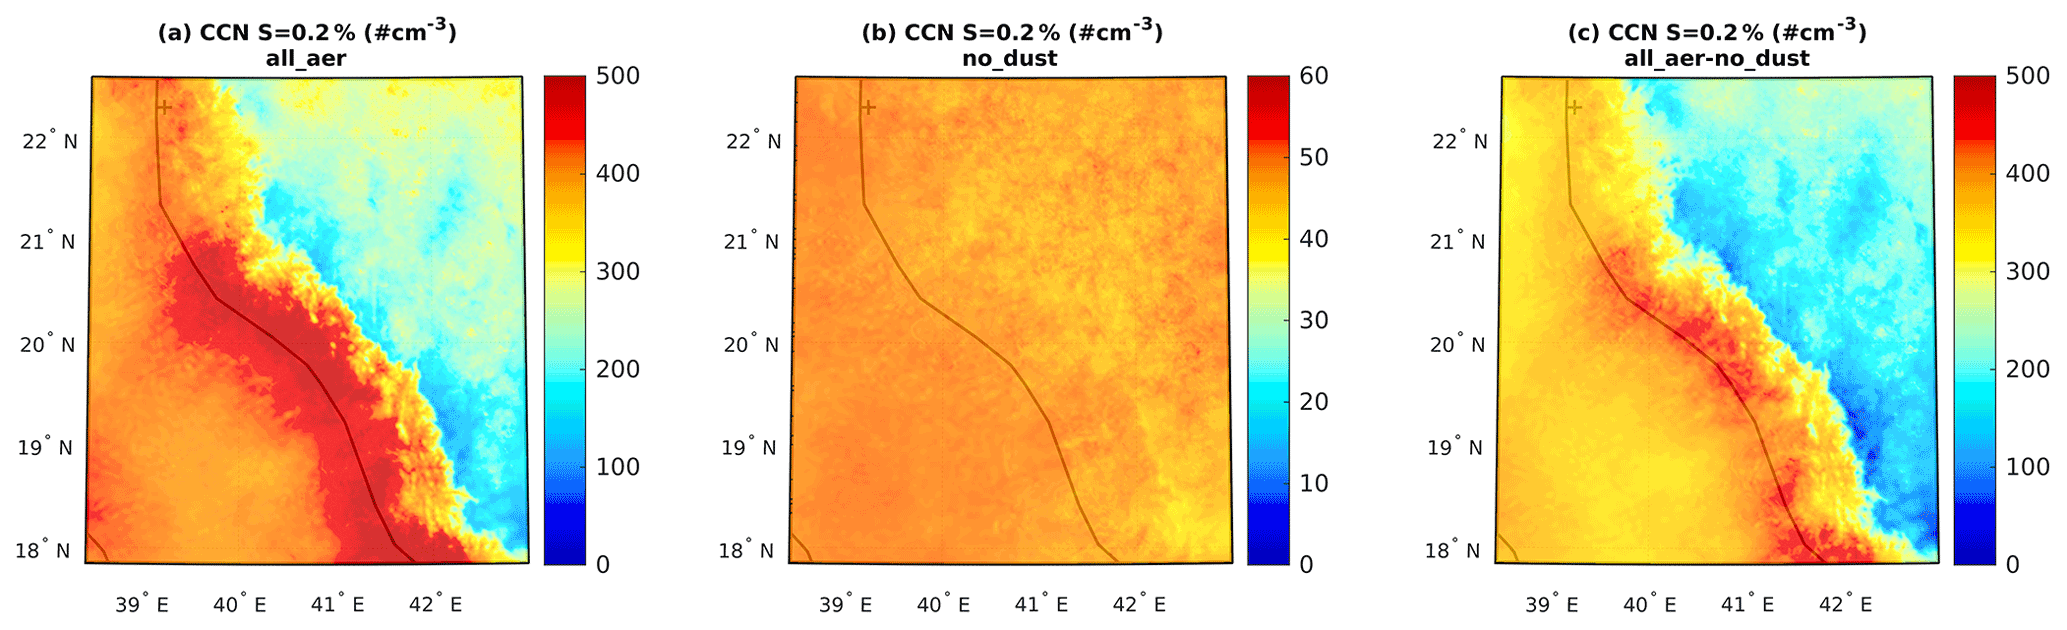
Figure 11CCN number concentrations at 0.2 % supersaturation at a cloud-level height (570 hPa) averaged at 15:00 UTC for 4–31 August (a) all_aer (F1), (b) no_dust (F2), and (c) the difference F1 − F2.

Figure 12Effects of dust on the clear-sky (left two columns) and all-sky (right two columns) radiative fluxes at the bottom of the atmosphere calculated from 10-year August average WRF-Chem simulations.
To accurately evaluate the effect of dust on rainfall, it is important to ensure that the dust effects on radiative fluxes are reasonably well simulated. To gain insights into the relative importance of dust and clouds on radiative budget, the effects of dust on radiative fluxes for clear-sky (without clouds) and all-sky (with clouds) conditions were calculated separately.
Figure 12 (left two columns) shows the effect of dust on clear-sky radiative flux in terms of total, indirect, and direct effects at the bottom of the atmosphere. Dust decreases the radiative flux that reaches the surface due to SW scattering and absorption, and therefore the direct effect is negative, which in turn governs the total effect. The effect of dust on LW radiative flux is positive because dust absorbs LW radiation. The clear-sky indirect effects are non-zero but very small compared to the direct effects. These small indirect effects arise due to feedback processes that cause small perturbations in cloud properties. Figure 12 (right two columns) shows the effects of dust on all-sky (i.e., with clouds) radiative flux. The all-sky radiative fluxes exhibited small changes in the indirect and direct effects due to the clouds in both the SW and LW bands. The magnitude and sign of change in SW and LW dust radiative fluxes are consistent with the results of Klingmüller et al. (2019).
3.3 Dust effect on rainfall
3.3.1 Dust direct and indirect effects
Figure 13a, b, c show the dust effects on 2 m air temperature. Dust induces a total cooling effect over the lands (Fig. 13a), which appear to be dominated by the direct effects (Fig. 13c) rather than the indirect effects (Fig. 13b). Dust also induces warming in some inland areas and over the ocean, which is affected by both the indirect and direct effects (Fig. 13b and c). The total and direct effects were largely statistically significant (black dots), but the indirect effects were significant only over the lands.
In turn, the cooling and warming of the land surface affects the winds. Figure 13d, e, f show the effects of dust on surface winds. As with surface temperature, the direct effects had a stronger influence compared to the indirect effects on winds as well. The direct effects on winds were statistically significant along the coast, which confirms the impact of dust's direct effects on sea breezes.
A high positive moisture anomaly was observed over the land (Fig. 13g, h, i), particularly with the direct effect (Fig. 13i). The moisture increase over the land caused by the direct effect is further amplified by the weaker indirect effect, making the total effect more widespread. The increased moisture due to the direct and total effect was statistically significant for both. The reason for the positive moisture anomaly over the land in relation to sea breeze is explained in the section below.
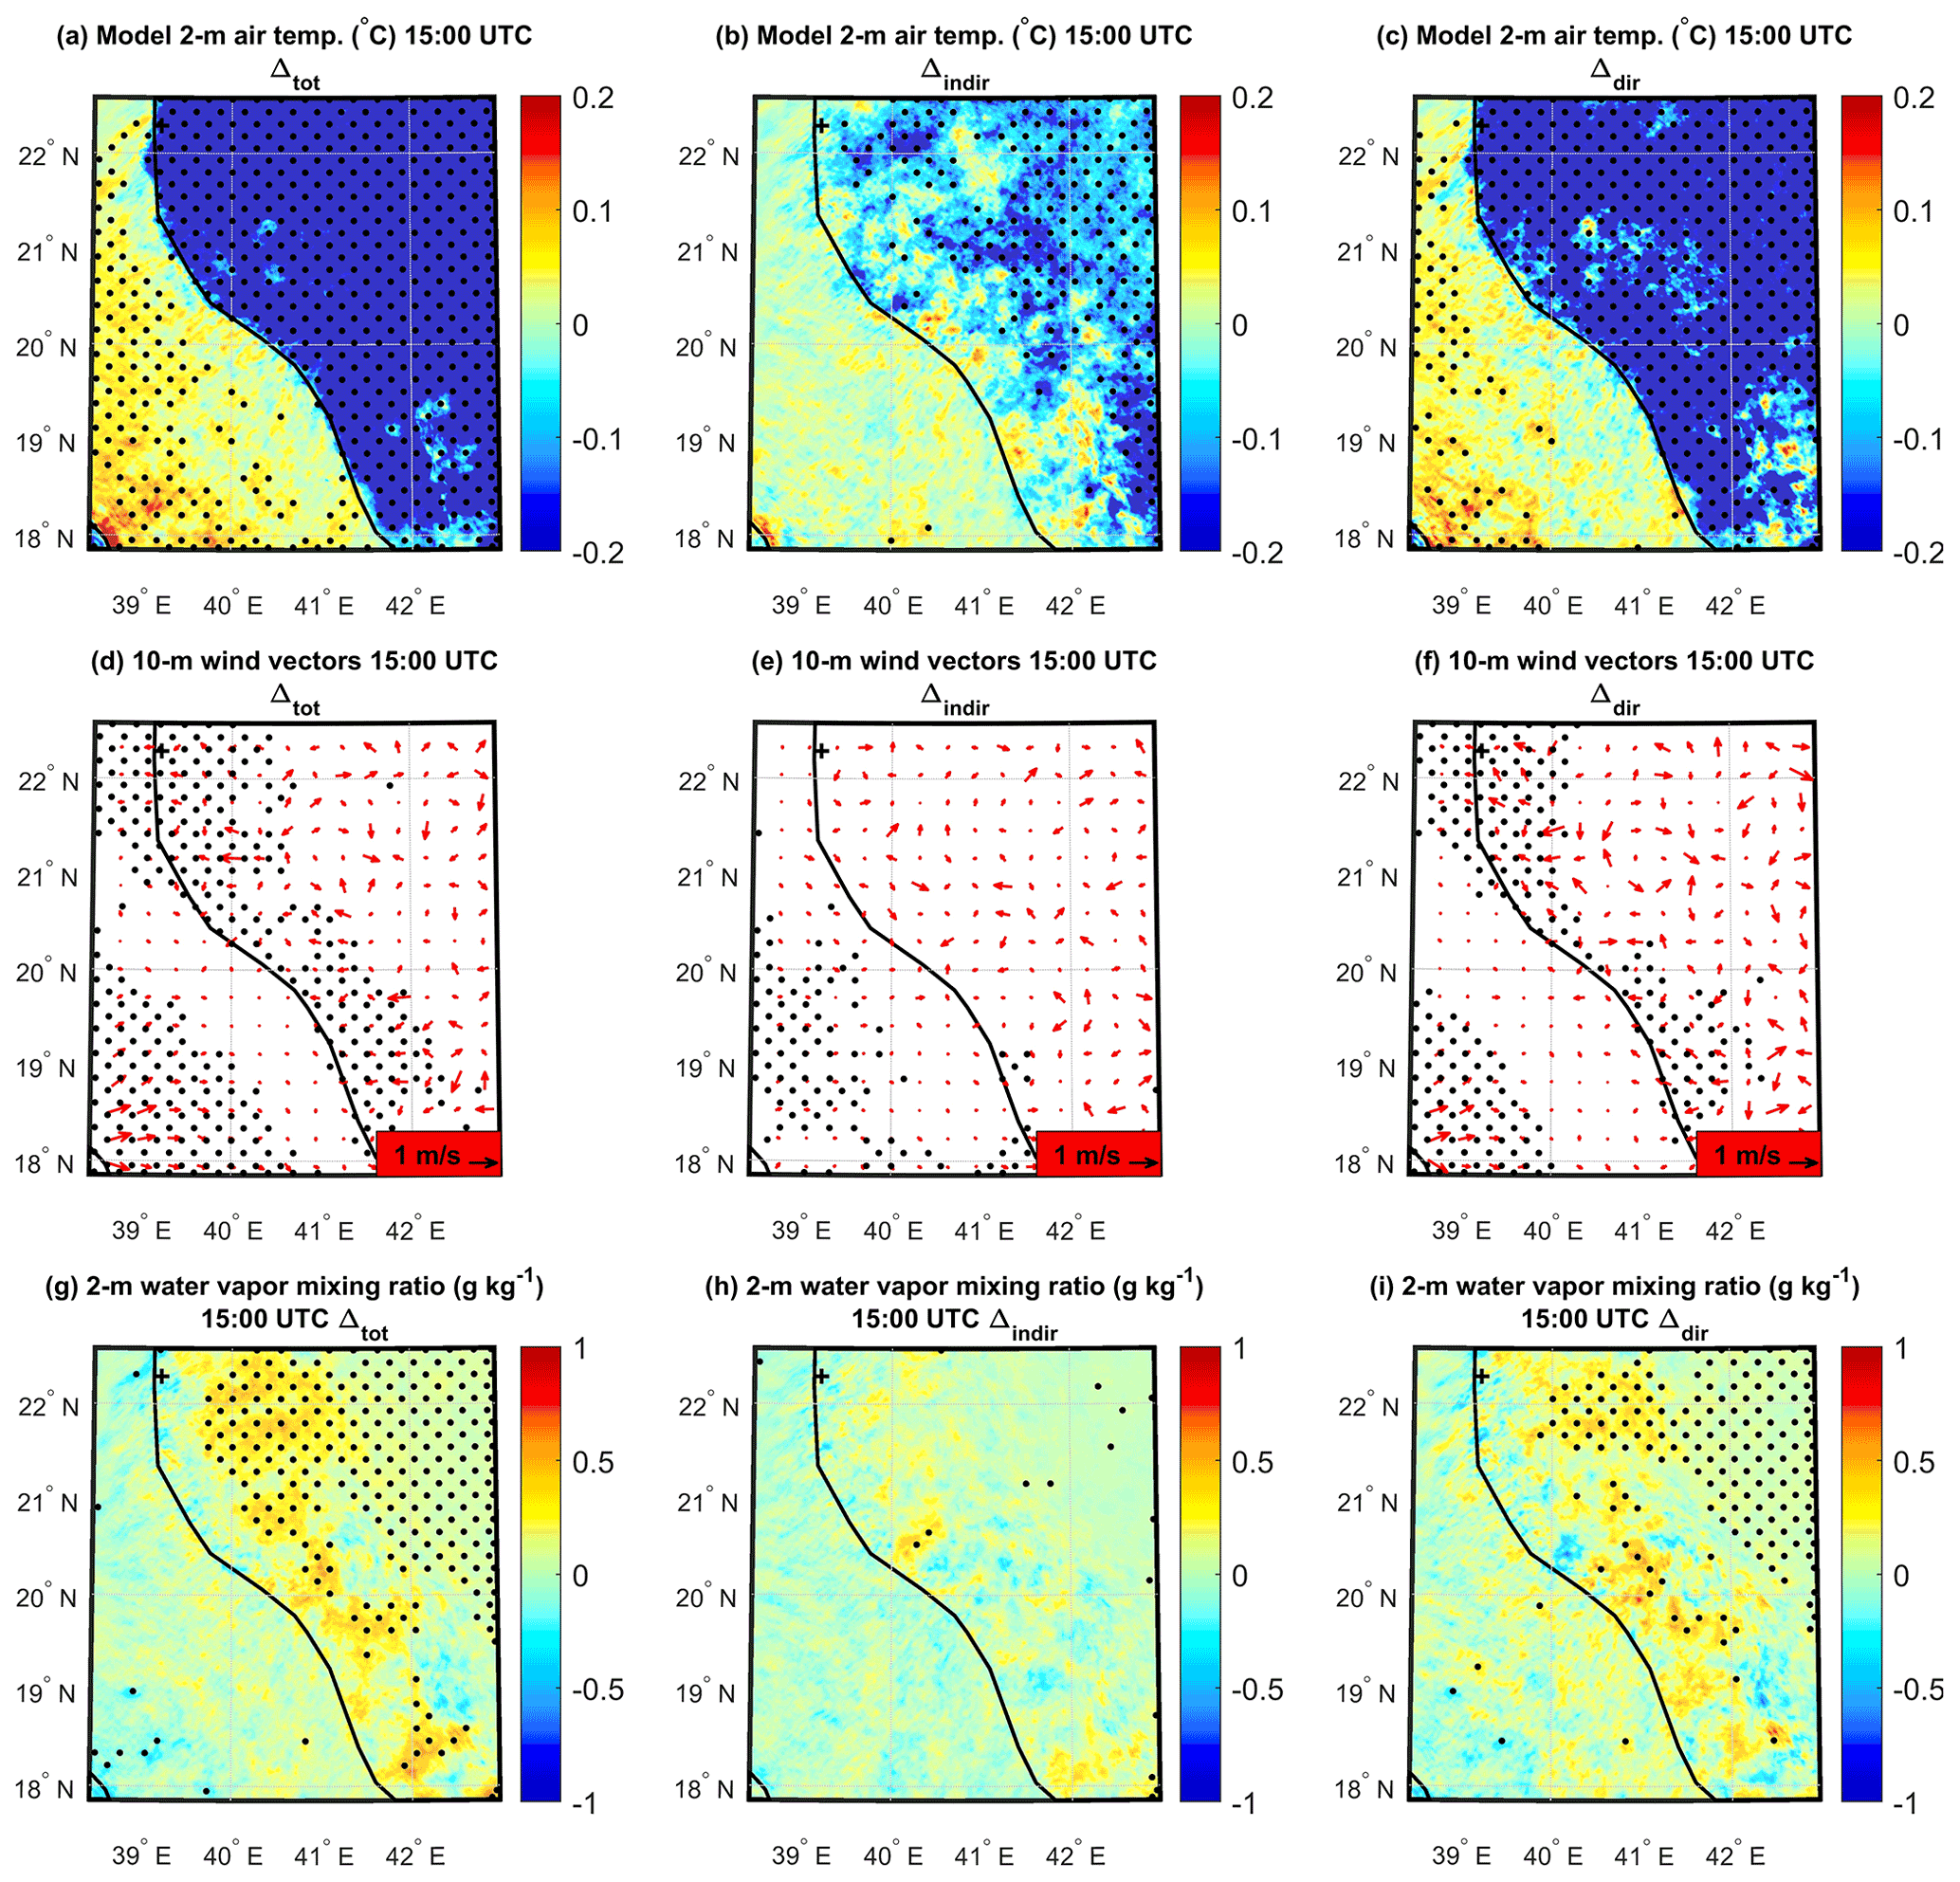
Figure 13Spatial patterns of the Δtot (F1 − F2), Δindir (F3 − F4), and for 2 m air temperature (a, b, c), 10 m winds (d, e, f), and 2 m water vapor mixing ratio (g, h, i) averaged at the time of rainfall maxima (15:00 UTC) over the entire study period (August 2006–2015). Black dots represent areas where the effect is statistically significant at the 95 % confidence interval.
Table 3Total, indirect, and direct effects of dust on rainfall for extreme and normal rainfall events.

* Percentage of average rainfall (F1, F2, F3, and F4).
Table 3 summarizes the effects of dust on rainfall for extreme and normal rainfall events calculated in terms of a 10-year average daily-accumulated rainfall over the study domain (d03) during the month of August. For the extreme rainfall events, the total effect (0.140 mm), indirect effect (0.105 mm), and direct effect (0.035 mm) were all positive (enhancement). The total, indirect, and direct effects in terms of percentage of average rainfall are 6.05 %, 4.54 %, and 1.51 %, respectively. The total and indirect effects are significant at the assumed 5 % significance level but not the direct effect. The direct effect, although small and statistically insignificant, contributed to the larger indirect effect, making the total effect statistically significant.
For the normal-rainfall events, the change in rainfall amount due to total, indirect, and direct effects is −0.003, 0.014, and −0.017 mm, respectively. The rainfall changes from both the indirect effect (positive) and the direct effect (negative) were statistically significant at the assumed 5 % significance level. The total, indirect, and direct effects in terms of percentage of average rainfall were −1.02 %, 4.76 %, and −5.78 %, respectively. The indirect and direct effects, which are opposite in sign and nearly equal in magnitude, cancel each other out, making the total effect small and statistically insignificant. However, note that the total effect could be considered significant if the significance level was increased to 10 % (p=0.083).
Although the domain-average rainfall change caused by dust averaged over multiple years (2006–2015) appeared small, the effect can be large at different locations and times. For example, for the year 2015, the accumulated rainfall changes (total effect) for August at the grid point maxima and minima within the domain were 92.0 mm (190.0 %) and −70.0 mm (−46.6 %), respectively.
The total, indirect, and direct effects were also calculated for the total number of wet days (average daily-accumulated rainfall ≥1 mm). The number of wet days increased by 3 due to the indirect effects but decreased by 4 by the direct effects, resulting in a total net increase of 1 d.
Table 3 summarizes the dust direct effect (Δdir) calculated using the standard method mentioned in Sect. 2.3.2 (i.e., by subtracting the indirect effect (Δindir) from the total effect (Δtot)). To verify the validity of this method, we compared the results obtained from this method with the direct effect calculated from direct-effects-only experiments (F5, F6, Table 2) for August 2015. The direct-effects-only experiments allow us to more directly calculate effects of dust on rainfall induced by land surface cooling or warming using the same model but with simpler settings without the indirect effects. The dust direct effect calculated from these direct-effects-only simulations (−0.046 mm) agreed very well with the results obtained from the standard method (−0.045 mm). The consistency of these two results confirms the robustness of our results.
3.3.2 Physical mechanism of the dust direct effects
The results of the direct-effects-only simulations (F5, F6, Table 2) are presented in Fig. 14 (left two columns). The cooling effect was dominant in the coastal areas, whereas warming was also observed in some inland areas, particularly in the southern region (Fig. 14b). Figure 14d demonstrates that the breezes are weakening and even reversing from land to sea in the areas of cooling (∼ 22∘ N) due to the dust direct effects. However, in the areas that exhibited warming (∼ 18.5∘ N), sea breezes strengthened as the land warming further increased the land–sea thermal contrast.
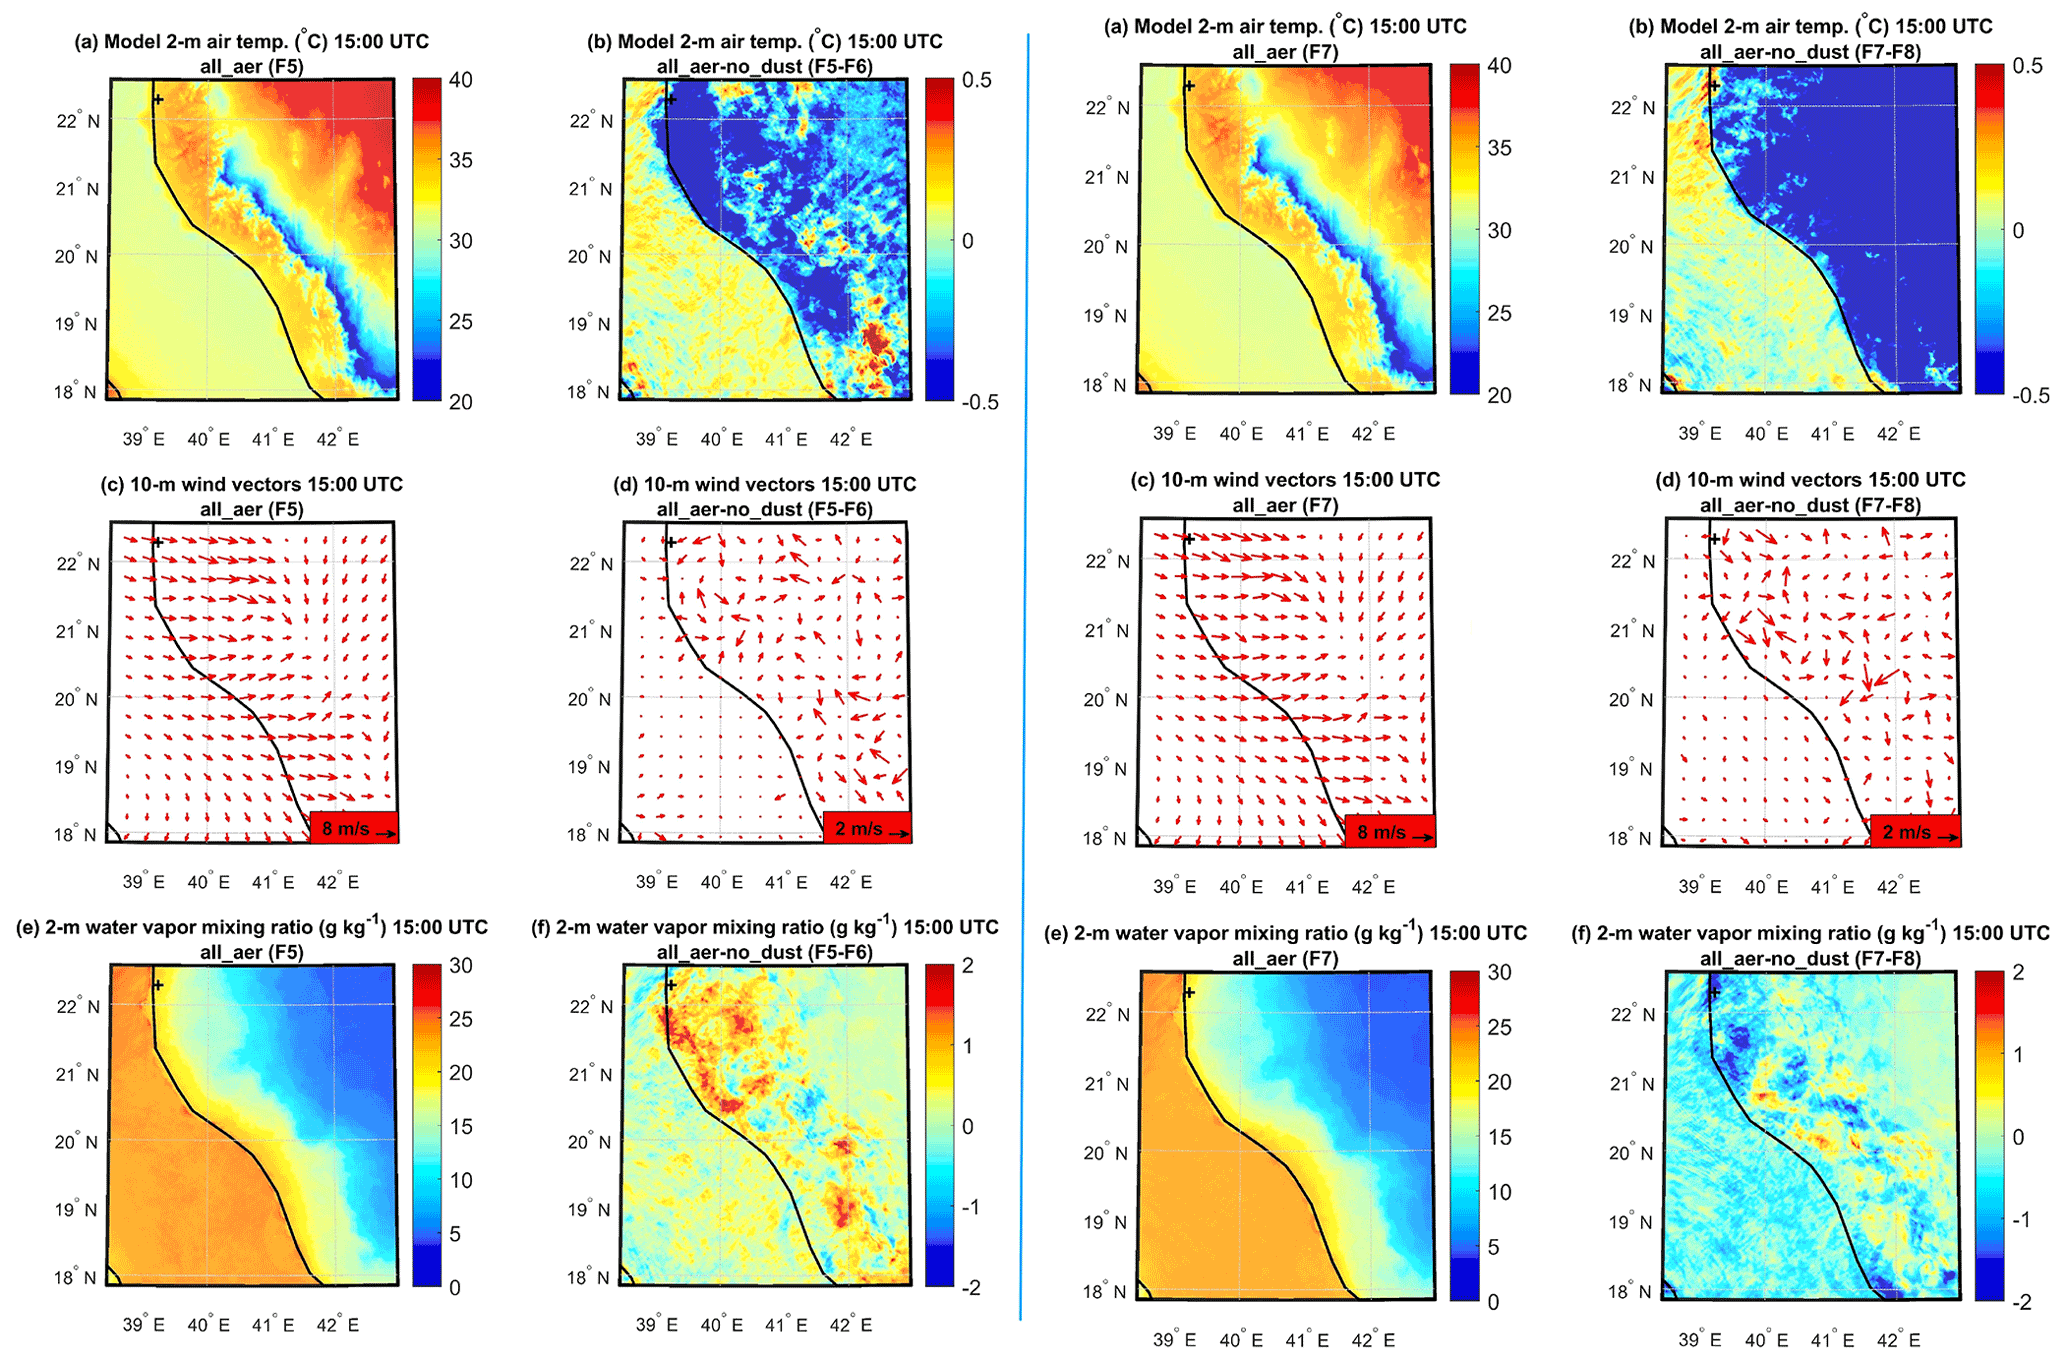
Figure 14The left two columns show spatial patterns of 2 m air temperature (a, b), 10 m wind vectors (c, d), and 2 m water vapor mixing ratio (e, f) averaged at the time of sea breeze maxima (15:00 UTC) throughout the period of 4–31 August 2015 from the direct-effects-only experiment for all_aer case F5 (a, c, e) and the difference all_aer-no_dust F5 − F6 (b, d, f). The right two columns show the same as the left two columns but without shortwave absorption, showing all_aer case (F7) and the difference all_aer-no_dust (F7 − F8).
A strong positive moisture anomaly was observed over the land in the direct-effects-only simulations (Fig. 14f, left two columns). This is intriguing because we expected a reduction in moisture transport over the land due to the dust direct effects as a result of land surface cooling and a subsequent weakening of the sea breezes (Mostamandi et al., 2022). Figure 14 also shows the results of the additional experiments in which the SW absorption was restricted (F7, F8), as mentioned in Sect. 2.3.2. Given that the SW absorption was eliminated, this experiment allows us to better understand the effect of dust on sea breezes via the cooling effect alone (i.e., without warming effects). However, note that the effect of dust is complex as it warms the atmosphere and cools the surface (Choobari et al., 2014). Nevertheless, this elimination of SW absorption removed the dust-induced warming observed earlier over the land (compare Fig. 14b left and right panels). Since the cooling effect becomes dominant, sea breezes are now weaker, and therefore the landward moisture transport is considerably reduced, which is evident by comparing the left and right panels of Fig. 15f. These results confirm that the high positive moisture anomaly over the land by dust direct effects is caused by the strengthening of sea breezes as a result of dust-induced warming. Although it is generally understood that SW absorption decreases the radiation reaching the surface and thus cools the surface (e.g., Choobari et al., 2014), we observed surface warming because most of the atmospheric dust here lies very close to the surface (Parajuli et al., 2020), which is evident in Fig. 3b. The observed effects on breezes are broadly consistent with those of Mostamandi et al. (2022), who also observed a weakening of albedo-induced land cooling on sea breezes associated with the strong land cooling, which reduces the thermal contrast between the land and the ocean.
The rainfall over the Red Sea coastal area has a strong diurnal cycle peaking at approximately 15:00 UTC coinciding with the moisture-laden westerly sea breezes uplifted by the coastal topography meeting the easterly Harmattan winds over the Sarawat Mountains. The dust modifies rainfall through both indirect and direct effects over the study region. In summary, dust enhances rainfall for extreme rainfall events but suppresses rainfall for normal rainfall events. These results are consistent with previous studies (e.g., Choobari, 2018; Li et al., 2011), which show that dust increases (decreases) rainfall in high-rainfall (low-rainfall) conditions. Since the calculated indirect effects are small, our results are also consistent with those of Koren et al. (2014), which also showed the indirect effects on warm clouds are less sensitive to aerosol loading over polluted atmosphere than over clean atmosphere.
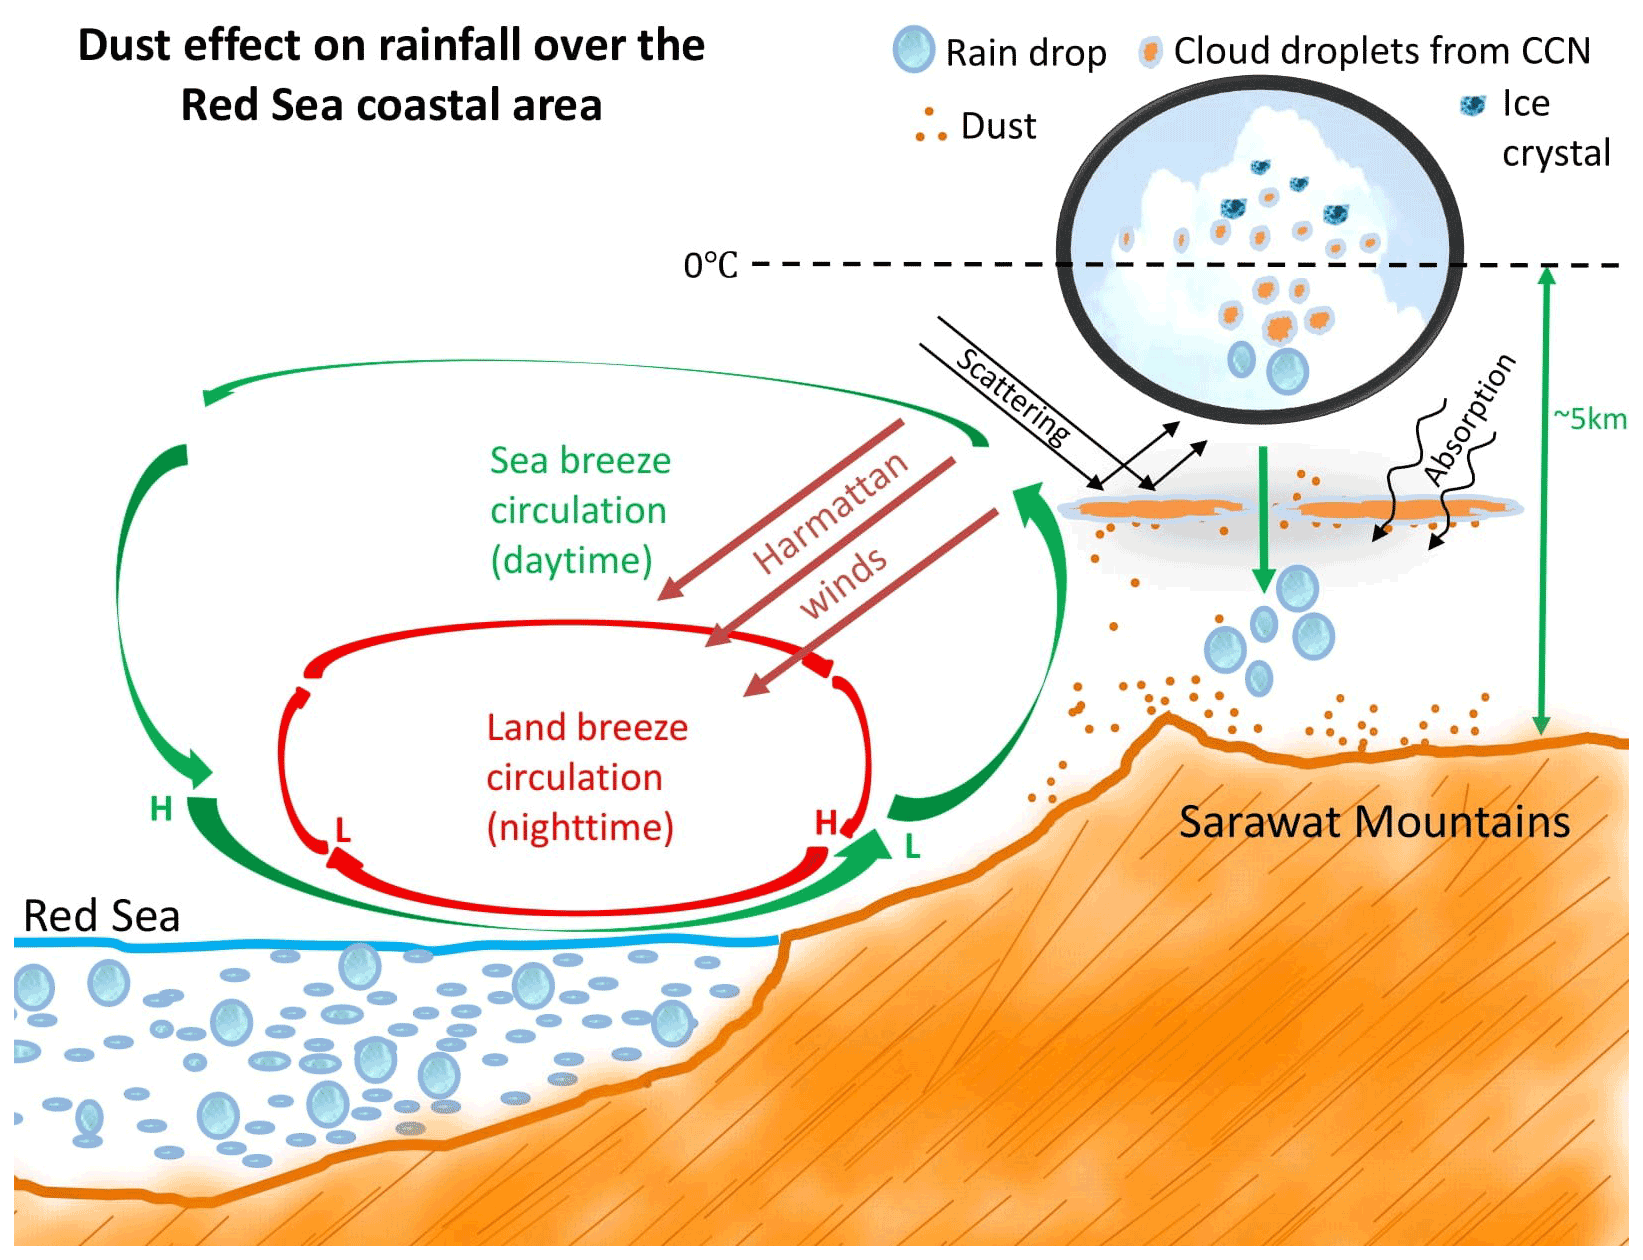
Figure 15Schematic diagram representing the rainfall processes and dust–rainfall interactions over the Red Sea coast.
For normal rainfall events, the dust effect on rainfall mainly occurs through both direct and indirect effects, which are strong and statistically significant. As Table 3 shows, the negative dust direct effect (−5.78 %) is slightly stronger than the positive indirect effect (+4.76 %) for the normal rainfall events. For these events, the dust direct effect is caused by the weakening of sea breeze circulation in response to SW cooling by dust as explained previously. The various pathways of dust–rainfall interactions occurring over the Red Sea coast are summarized in a schematic diagram presented in Fig. 15.
For extreme rainfall events, the direct effect was positive but was not statistically significant, which could perhaps become significant with a larger sample size. For these rainfall events, the dust effect occurs through a different physical mechanism governed by the indirect effects. As Table 3 shows, the indirect effect (+4.54 %) is stronger than the direct effect (+1.51 %). The reason why the indirect effect is stronger than the direct effect for extreme rainfall events is that extreme rain events are caused by larger synoptic processes, and during their occurrence, the local-scale breeze effect becomes comparatively weaker. Consequently, the indirect effect becomes dominant compared to the direct effect. Whether the indirect effect is positive or negative is mainly determined by prevailing dust concentration and water vapor availability. During the extreme rainfall events, the water vapor is abundantly available so water vapor is not a limiting factor for rain formation. Since CCN number concentrations are abundant (Figs. 7, 8), dust concentration is not a limiting factor in this desert study domain either. In such a scenario with high dust concentration and abundant water vapor, rain droplets keep growing (Choobari, 2018; Li et al., 2011), rendering the indirect effect positive. To demonstrate this mechanism further, we plotted the column-average water vapor mixing ratio for normal rainfall events and extreme rainfall events separately (Fig. 16). It is clear that the average water vapor concentration is remarkably higher in extreme rainfall events compared to normal rainfall events (note the positive difference in Fig. 16c), which supports the above explanation.
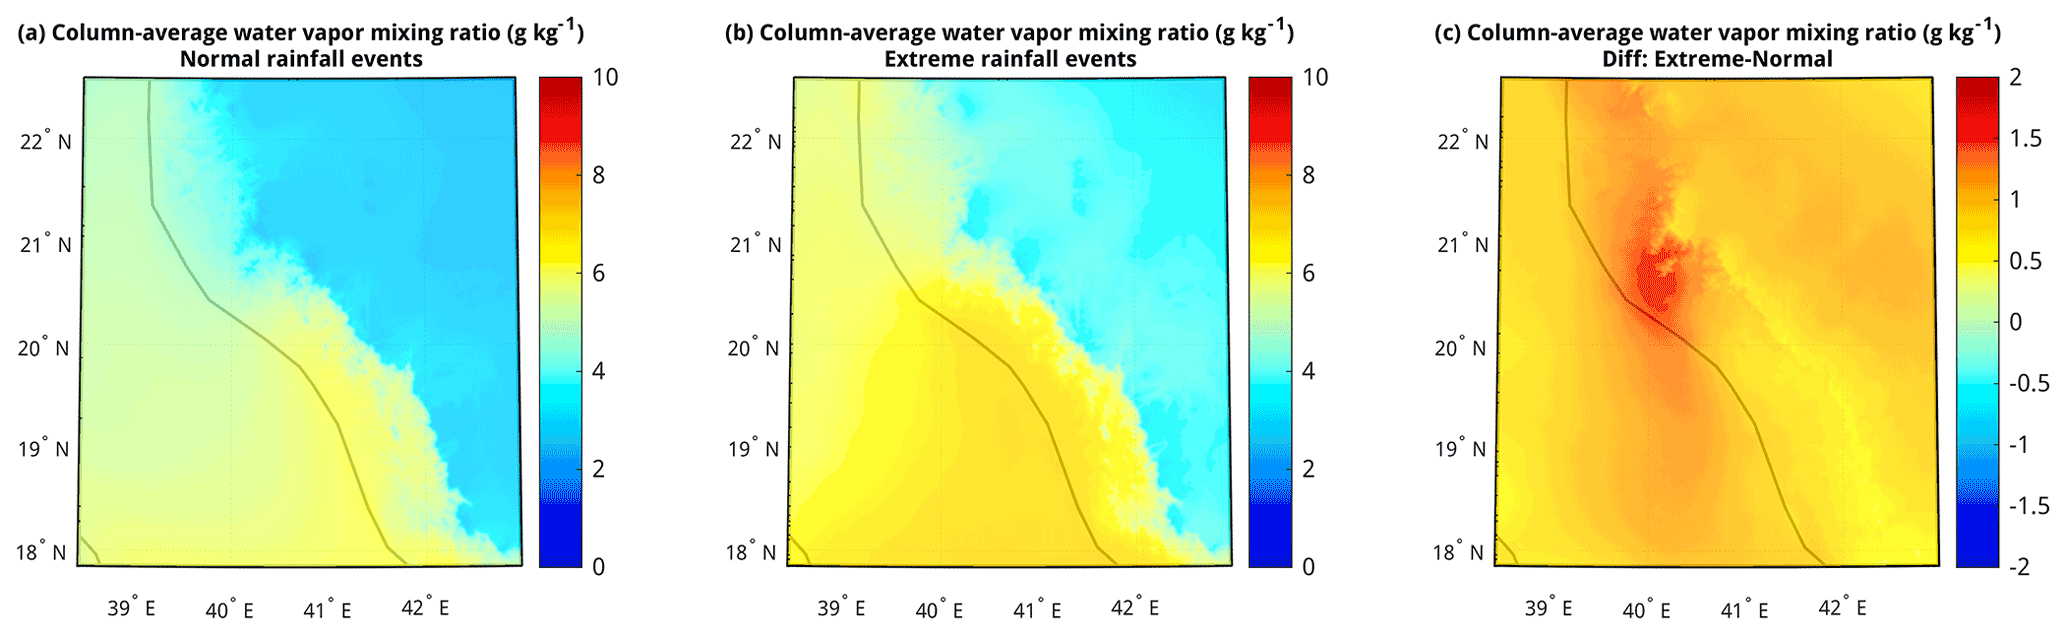
Figure 16Column-average water vapor mixing ratio for (a) normal rainfall events, (b) extreme rainfall events, and (c) the difference in extreme and normal rainfall events.
The indirect effect is positive even for normal rainfall events because although average water vapor concentration in normal rainfall events is lower in comparison to the extreme rainfall events, the water vapor concentration is still high enough for droplets to grow from the moisture supplied by the sea breezes on a diurnal basis. So given the abundant moisture supply, there is relatively minimal competition of raindrops, rendering the indirect effect positive even during the normal rainfall events.
The relative sign and magnitude of the observed effects are meaningful. The indirect effects are similar in both extreme and normal rainfall events (4.54 % vs. 4.76 %), which is reasonable because the indirect effect does not depend upon the breeze system. The direct effect is considerably stronger for normal rainfall events (−5.78 %) than that for extreme rainfall events (1.51 %), which is also reasonable because the rainfall in normal rainfall is governed by breeze circulation whereas for extreme rainfall events it is not.
Dust direct and indirect effects both contribute in modifying the cloud properties. Figure S2b presents the total, indirect, and direct effects of dust on cloud water mixing ratio at a cloud-level height (4.6 km). A statistically significant increase in cloud water mixing ratios is observed over the lands due to the indirect effects (Fig. S2b). As expected, the changes in clouds caused by the dust direct effects are not statistically significant in most areas (Fig. S2c). Dust indirect effects are more complex, but aerosols are known to suppress rainfall at the initial stage of convection and enhances rainfall during the mature stage through aerosol invigoration (Andreae et al., 2004; Koren et al., 2005, 2008; Chakraborty et al., 2018; Fan et al., 2018). Increased aerosol concentration can also increase cloud-top evaporation, thus reducing the cloud coverage (Choobari, 2018). Similar to dust direct effects, dust indirect effect also induces significant surface cooling and warming through clouds (Fig. 13b), as clouds also scatter and absorb shortwave radiation.
In this study, we evaluated the relative contribution of direct and indirect effects of dust on rainfall and explored associated physical mechanisms using well-developed microphysical and aerosol schemes in WRF-Chem. Modeling rainfall processes entails some uncertainty, which is mainly related to the effect of aerosols on clouds. We indeed observed a large order of difference in simulated microphysical parameters (CCN number concentrations and aerosol size distributions) compared to observations, although they did not have much impact on the rainfall in the study region. There are several microphysical processes governing dust–cloud–rainfall interactions that are not fully understood or implemented yet in WRF-Chem (e.g., the prognostic treatment of ice nucleation by dust) (Chapman et al., 2009). Therefore, our model simulations may not have captured some dust–cloud–rainfall interactions occurring in reality, particularly those related to cold-cloud processes.
Broader implications
Through high-resolution model simulations, complemented with multiple observational data, we investigated how dust affects rainfall over the Red Sea coastal region through direct and indirect effects. Our study has broader social and environmental implications. While dust and dust storms are generally considered detrimental from an air quality perspective, our study highlights their contribution in modulating rain, an essential element of plant and animal life. A better understanding of regional rainfall processes can be helpful for planning and managing regional water resources as the replenishment of surface water and groundwater largely depends on precipitation (Mostamandi et al., 2022). A better understanding of the dynamics of extreme rainfall events could also aid in the development of strategies to minimize their catastrophic outcomes such as heavy flooding and loss of public property (e.g., de Vries et al., 2013). Recent studies suggest that there is an increase in the dust and/or aerosol activity in the region (e.g., Klingmüller et al., 2016). In this context, our model experiments (no_dust and all_aer) can also provide insights into how increased dust activity affects regional rainfall patterns.
Our study also has implications from a cloud-seeding perspective, which is relevant in the context of recent rainfall enhancement efforts over the region (e.g., Tai et al., 2017; Mazroui and Farrah, 2017). Cloud-seeding experiments were conducted in the southwest of Saudi Arabia in the Asir mountainous region in 2006–2008 using AgI, which receives a relatively high amount of precipitation (Sinkevich and Krauss, 2010). Those results demonstrated the feasibility of cloud seeding over the region by showing that the reflectivity of seeded clouds was significantly different compared to that of natural clouds (Sinkevich and Krauss, 2010; Krauss et al., 2011). However, our results suggest that cloud-seeding efficiency may be affected by the presence of background dust aerosols and that cloud seeding using common materials such as AgI may not be as effective in dusty regions as in clean environments. It should also be noted that the effectiveness of cloud seeding depends upon the height of application. Therefore, before investing in expensive field experiments on cloud seeding, it would be beneficial to evaluate the effectiveness of cloud seeding through regional modeling in the areas of interest as done in this study.
Our study evaluated the effect of dust on rainfall over the Red Sea coastal plains using a double-moment microphysics scheme (Morrison) combined with an advanced aerosol scheme (MOSAIC) in WRF-Chem. The model captured the magnitude of AOD and aerosol vertical profiles, the vertical profile of air temperature, the diurnal cycle of winds, spatio-temporal variation in accumulated rainfall, and the CCN number concentrations over the study domain reasonably well.
The rainfall over the Red Sea coast is mainly governed by warm cloud processes, which mainly occur within a ∼ 5 km height. Rainfall has a strong diurnal cycle, which peaks in the evening at approximately 15:00 UTC (18:00 local time) under the influence of sea breezes.
We calculated the total, direct, and indirect effects of dust on rainfall for extreme and normal rainfall events in terms of the 10-year (2006–2015) August average daily-accumulated rainfall over the study domain (d03). For extreme rainfall events (average daily-accumulated rainfall ≥1.33 mm), dust causes a net enhancement on rainfall of 0.140 mm (6.05 %), whereas the indirect and the direct effects accounted for 0.105 mm (4.54 %) and 0.035 mm (1.51 %), respectively. Although the positive direct effect is statistically insignificant at the assumed 5 % significance level, it adds up with the positive indirect effect, making the total effect significant. For the normal rainfall events (average daily-accumulated rainfall <1.33 mm), dust causes a net suppression of rainfall of −0.003 mm (−1.02 %), with the indirect and direct effects accounting for 0.014 (4.76 %) and −0.017 mm (−5.78 %), respectively, both statistically significant. The indirect and direct effects, which are opposite in sign and nearly equal in magnitude, cancel each other out, making the total effect small but statistically significant.
Dust affects rainfall over the Red Sea coastal region through both direct and indirect effects. For normal rainfall events, dust suppresses rainfall by direct effects through the weakening of sea breeze circulation, caused by dust-induced land surface cooling. Such weakening of sea breezes reduces the landward moisture transport, which ultimately suppresses the coastal rainfall. For extreme rainfall events, the dust effect on breezes becomes smaller, and dust causes net rainfall enhancement through the indirect effects given the abundance of water vapor and dust concentrations over the study site, which facilitates raindrops to grow larger.
Given that the study area exhibits stable breeze circulation, our results could be extended to other coastal areas with a topography that has a similar breeze system. Importantly, our results have broader scientific and environmental implications. Although dust is considered a nuisance from an air quality perspective, our results highlight the more positive fundamental role of dust particles in modulating rainfall formation and distribution. In the context of regional rain enhancement efforts, our results also have implications for cloud seeding and regional water resource management.
MODIS AOD data were downloaded from https://ladsweb.modaps.eosdis.nasa.gov/ (NASA, 2022a). MERRA-2 and IMERG data were obtained from the NASA Goddard Earth Sciences Data and Information Services Center (GES DISC) available at https://disc.gsfc.nasa.gov/ (NASA, 2022b). ECMWF Operational Analysis data are restricted data, which were retrieved from http://apps.ecmwf.int/archive-catalogue/?type=4v&class=od&stream=oper&expver=1 (ECMWF, 2021) with a membership. EDGAR-4.2 is available at http://edgar.jrc.ec.europa.eu/overview.php?v=42 (European Commission, 2020). Field observation data and VIIRS satellite data may be obtained by request to the first author at psagar@utexas.edu. A copy of the namelist.input file with details of the WRF-Chem model configuration can be downloaded from the KAUST repository at https://doi.org/10.25781/KAUST-ZZ3WX (Parajuli et al., 2022).
The supplement related to this article is available online at: https://doi.org/10.5194/acp-22-8659-2022-supplement.
SPP and GLS developed the central scientific concept of the paper. SPP analyzed the data and wrote the paper with inputs from GLS. SPP conducted the WRF-Chem simulations, and AU contributed with code modifications. PAK and DA processed and provided data from the August 2009 field campaign in Saudi Arabia. YZ processed and provided the VIIRS data. All authors discussed the results and contributed to the final manuscript.
The contact author has declared that none of the authors has any competing interests.
Publisher’s note: Copernicus Publications remains neutral with regard to jurisdictional claims in published maps and institutional affiliations.
We thank Daniel Rosenfeld for his assistance in the acquisition of VIIRS data. Battelle Memorial Institute operates PNNL under contract DEAC05-76RL01830.
Our study was supported by funding from King Abdullah University of Science and Technology (KAUST).
This paper was edited by Jianping Huang and reviewed by three anonymous referees.
Abdelkader, M., Metzger, S., Steil, B., Klingmüller, K., Tost, H., Pozzer, A., Stenchikov, G., Barrie, L., and Lelieveld, J.: Sensitivity of transatlantic dust transport to chemical aging and related atmospheric processes, Atmos. Chem. Phys., 17, 3799–3821, https://doi.org/10.5194/acp-17-3799-2017, 2017.
Abdul-Razzak, H. and Ghan, S. J.: A parameterization of aerosol activation: 2. Multiple aerosol types, J. Geophys. Res., 105, 6837–6844, https://doi.org/10.1029/1999JD901161, 2000.
Abdul-Razzak, H. and Ghan, S. J.: A parameterization of aerosol activation, 3, Sectional representation, J. Geophys. Res., 107, AAC 1-1–AAC 1-6, https://doi.org/10.1029/2001JD000483, 2002.
Andreae, M. O., Rosenfeld, D., Artaxo, P., Costa, A. A., Frank, G. P., Longo, K. M., and Silva-Dias, M. D.: Smoking rain clouds over the Amazon, Science, 303, 1337–1342, https://doi.org/10.1126/science.1092779, 2004.
Abbott, T. H. and Cronin, T. W.: Aerosol invigoration of atmospheric convection through increases in humidity, Science, 371, 83–85, https://doi.org/10.1126/science.abc5181, 2021.
Albrecht, B. A.: Aerosols, cloud microphysics, and fractional cloudiness, Science, 245, 1227–1230, doi10.1126/science.245.4923.1227, 1989.
Ansmann, A., Mattis, I., Müller, D., Wandinger, U., Radlach, M., Althausen, D., and Damoah R.: Ice formation in Saharan dust over central Europe observed with temperature/humidity/aerosol Raman lidar, J. Geophys. Res., 110, D18S12, https://doi.org/10.1029/2004jd005000, 2005.
Anisimov, A., Tao, W., Stenchikov, G., Kalenderski, S., Prakash, P. J., Yang, Z.-L., and Shi, M.: Quantifying local-scale dust emission from the Arabian Red Sea coastal plain, Atmos. Chem. Phys., 17, 993–1015, https://doi.org/10.5194/acp-17-993-2017, 2017.
Bangalath, H. K. and Stenchikov, G.: Role of dust direct radiative effect on the tropical rain belt over Middle East and North Africa: A high-resolution AGCM study, J. Geophys. Res.-Atmos., 120, 4564–4584, https://doi.org/10.1002/2015JD023122, 2015.
Chakraborty, S., Fu, R., Rosenfeld, D., and Massie, S. T.: The influence of aerosols and meteorological conditions on the total rain volume of the mesoscale convective systems over tropical continents, Geophys. Res. Lett., 45, 13099–13106, https://doi.org/10.1029/2018GL080371, 2018.
Chapman, E. G., Gustafson Jr., W. I., Easter, R. C., Barnard, J. C., Ghan, S. J., Pekour, M. S., and Fast, J. D.: Coupling aerosol-cloud-radiative processes in the WRF-Chem model: Investigating the radiative impact of elevated point sources, Atmos. Chem. Phys., 9, 945–964, https://doi.org/10.5194/acp-9-945-2009, 2009.
Choobari, O. A.: Impact of aerosol number concentration on precipitation under different precipitation rates, Meteorol. Appl., 25, 596–605, https://doi.org/10.1002/met.1724, 2018.
Choobari, O. A., Zawar-Reza, P., and Sturman, A.: The global distribution of mineral dust and its impacts on the climate system: A review, Atmos. Res., 138, 152–165, https://doi.org/10.1016/j.atmosres.2013.11.007, 2014.
Creamean, J. M., Suski, K. J., Rosenfeld, D., Cazorla, A., DeMott, P. J., Sullivan, R. C., White, A. B., Ralph, F. M., Minnis, P., Comstock, J. M. and Tomlinson, J. M., and Prather, K. A.: Dust and biological aerosols from the Sahara and Asia influence precipitation in the Western U.S, Science, 339, 1572–1578, https://doi.org/10.1126/science.1227279, 2013.
Crippa, M., Guizzardi, D., Muntean, M., Schaaf, E., Dentener, F., van Aardenne, J. A., Monni, S., Doering, U., Olivier, J. G. J., Pagliari, V., and Janssens-Maenhout, G.: Gridded emissions of air pollutants for the period 1970–2012 within EDGAR v4.3.2, Earth Syst. Sci. Data, 10, 1987–2013, https://doi.org/10.5194/essd-10-1987-2018, 2018.
Dennis, A. S.: Weather modification by cloud seeding, International Geophysics Series, 24, 670, https://digitalcommons.usu.edu/water_rep/670 (last access: 3 May 2020), 1980.
de Vries, A. J., Tyrlis, E., Edry, D., Krichak, S. O., Steil, B., and Lelieveld, J.: Extreme precipitation events in the Middle East: Dynamics of the Active Red Sea Trough, J. Geophys. Res., 118, 7087–7108, https://doi.org/10.1002/jgrd.50569, 2013.
Dubovik, O. and King, M. D.: A flexible inversion algorithm for retrieval of aerosol optical properties from Sun and sky radiance measurements, J. Geophys. Res., 105, 20673–20696, https://doi.org/10.1029/2000JD900282, 2000.
Dubovik, O., Herman, M., Holdak, A., Lapyonok, T., Tanré, D., Deuzé, J. L., Ducos, F., Sinyuk, A., and Lopatin, A.: Statistically optimized inversion algorithm for enhanced retrieval of aerosol properties from spectral multi-angle polarimetric satellite observations, Atmos. Meas. Tech., 4, 975–1018, https://doi.org/10.5194/amt-4-975-2011, 2011.
Dye, J. E. and Baumgardner, D.: Evaluation of the Forward Scattering Spectrometer Probe. Part I: Electronic and Optical Studies, J. Atmos. Ocean. Tech., 1, 329–344, 1984.
ECMWF: Archive Catalogue, ECMWF [data set], http://apps.ecmwf.int/archive-catalogue/?type=4v&class=od&stream=oper&expver=1, last access: 3 January 2021.
European Commission: EDGAR – Emissions Database for Global Atmospheric Research, European Commission [data set], http://edgar.jrc.ec.europa.eu/overview.php?v=42, last access: 3 August 2020.
Fan, J., Rosenfeld, D., Zhang, Y., Giangrande, S. E., Li, Z., Machado, L. A., Martin, S. T., Yang, Y., Wang, J., Artaxo, P., and Barbosa, H. M.: Substantial convection and precipitation enhancements by ultrafine aerosol particles, Science, 359, 411–418, https://doi.org/10.1126/science.aan8461, 2018.
Farrar, J. T., Lentz, S. J., Churchill, J. H., Bouchard, P. R., Smith, J. C., Kemp, J. N., Lord, J., Allsup, G. P., and Hosom, D. S.: King Abdullah University of Science and Technology (KAUST) mooring deployment cruise and fieldwork report, fall 2008 R/V Oceanus voyage 449-5, October 9, 2008–October 14, 2008, WHOAS, https://doi.org/10.1575/1912/3012, 2009.
Fast, J. D., Gustafson, W. I., Easter, R. C., Zaveri, R. A., Barnard, J. C., Chapman, E. G., Grell, G. A., and Peckham, S. E.: Evolution of ozone, particulates, and aerosol direct radiative forcing in the vicinity of Houston using a fully coupled meteorology-chemistry-aerosol model, J. Geophys. Res., 111, D21305, https://doi.org/10.1029/2005JD006721, 2006.
Forkel, R., Werhahn, J., Hansen, A. B., McKeen, S., Peckham, S., Grell, G., and Suppan, P.: Effect of aerosol-radiation feedback on regional air quality – A case study with WRF/Chem, Atmos. Environ., 53, 202–211, https://doi.org/10.1016/j.atmosenv.2011.10.009, 2012.
Freud, E., Rosenfeld, D., and Kulkarni, J. R.: Resolving both entrainment-mixing and number of activated CCN in deep convective clouds, Atmos. Chem. Phys., 11, 12887–12900, https://doi.org/10.5194/acp-11-12887-2011, 2011.
Gao, W., Fan, J., Easter, R. C., Yang, Q., Zhao, C., and Ghan, S. J.: Coupling spectral-bin cloud microphysics with the MOSAIC aerosol model in WRF-Chem: Methodology and results for marine stratocumulus clouds, J. Adv. Model. Earth Sy., 8, 1289–1309, https://doi.org/10.1002/2016MS000676, 2016.
Gibbons, J. D. and Chakraborti, S.: Nonparametric Statistical Inference, 5th Edn., Boca Raton, FLn Chapman & Hall/CRC Press, Taylor & Francis Group, http://www.ru.ac.bd/stat/wp-content/uploads/sites/25/2019/03/501_13_Gibbons_Nonparametric_statistical_inference.pdf (last access: 4 July 2022), 2011.
Ginoux, P., Chin, M., Tegen, I., Prospero, J. M., Holben, B., Dubovik, O., and Lin, S.-J.: Sources and distributions of dust aerosols simulated with the GOCART model, J. Geophys. Res., 106, 20255–20273, https://doi.org/10.1029/2000JD000053, 2001.
Gong, S. L.: A parameterization of sea-salt aerosol source function for sub- and super-micron particles, Global Biogeochem. Cy., 17, 1097, https://doi.org/10.1029/2003GB002079, 2003.
Grabowski, W. W. and Morrison, H.: Do Ultrafine Cloud Condensation Nuclei Invigorate Deep Convection?, J. Atmos. Sci., 77, 2567–2583, https://doi.org/10.1175/JAS-D-20-0012.1, 2020.
Grell, G. A., Peckham, S. E., Schmitz, R., McKeen, S. A., Frost, G., Skamarock, W. C., and Eder, B.: Fully coupled “online” chemistry within the WRF model, Atmos. Environ., 39, 6957–6975, https://doi.org/10.1016/j.atmosenv.2005.04.027, 2005.
Gustafson, W. I., Chapman, E. G., Ghan, S. J., Easter, R. C., and Fast, J. D.: Impact on modeled cloud characteristics due to simplified treatment of uniform cloud condensation nuclei during NEAQS 2004, Geophys. Res. Lett., 34, L19809, https://doi.org/10.1029/2007GL030021, 2007.
Han, Y., Fang, X., Zhao, T., Bai, H., Kang, S., and Song, L.: Suppression of precipitation by dust particles originated in the Tibetan Plateau, Atmos. Environ., 43, 568–574, https://doi.org/10.1016/j.atmosenv.2008.10.018, 2009.
Hansen, J., Sato, M., and Ruedy, R.: Radiative forcing and climate response, J. Geophys. Res.-Atmos., 102, 6831–6864, https://doi.org/10.1029/96JD03436, 1997.
Holben, B. N., Eck, T. F., Slutsker, I. A., Tanre, D., Buis, J. P., Setzer, A., Vermote, E., Reagan, J. A., Kaufman, Y. J., Nakajima, T., Lavenu, F., Jankowiak, I., and Smirnov, A.: AERONET – A federated instrument network and data archive for aerosol characterization, Remote Sens. Environ., 66, 1–16, https://doi.org/10.1016/S0034-4257(98)00031-5, 1998.
Hollander, M. and Wolfe, D. A.: Nonparametric Statistical Methods, Hoboken, NJ, John Wiley & Sons, Inc., 1999.
Hong, S.-Y., Yign, N., and Dudhia, J.: A new vertical diffusion package with an explicit treatment of entrainment processes, Mon. Weather Rev., 134, 2318–2341, https://doi.org/10.1175/MWR3199.1, 2006.
Hsu, N. C., Tsay, S.-C., King, M. D., and Herman, J. R.: Aerosol properties over bright-reflecting source regions, IEEE T. Geosci. Remote Sens., 42, 557–569, https://doi.org/10.1109/TGRS.2004.824067, 2004.
Hsu, N. C., Jeong, M.-J., Bettenhausen, C., Sayer, A. M., Hansell, R., Seftor, C. S., Huang, J., and Tsay, S.-C.: Enhanced Deep Blue aerosol retrieval algorithm: The second generation, J. Geophys. Res.-Atmos., 118, 9296–9315, https://doi.org/10.1002/jgrd.50712, 2013.
Huffman, G. J., Stocker, E. F., Bolvin, D. T., Nelkin, E. J., and Tan, J.: GPM IMERG Late Precipitation L3 1 day 0.1 degree × 0.1 degree V06, edited by: Savtchenko, A., Greenbelt, MD, Goddard Earth Sciences Data and Information Services Center (GES DISC) [data set], https://doi.org/10.5067/GPM/IMERGDL/DAY/06, 2019.
Iacono, M. J., Mlawer, E. J., Clough, S. A., and Morcrette, J.-J.: Impact of an improved longwave radiation model, RRTM, on the energy budget and thermodynamic properties of the NCAR community climate model, CCM3, J. Geophys. Res., 105, 14873–14890, https://doi.org/10.1029/2000JD900091, 2000.
Iacono, M. J., Delamere, J. S., Mlawer, E. J., Shephard, M. W., Clough, S. A., and Collins, W. D.: Radiative forcing by long-lived greenhouse gases: Calculations with the AER radiative transfer models, J. Geophys. Res., 113, D13103, https://doi.org/10.1029/2008JD009944, 2008.
Jacobson, M. Z. and Kaufman, Y. J.: Wind reduction by aerosol particles, Geophys. Res. Lett., 33, L24814, https://doi.org/10.1029/2006GL027838, 2006.
Janssens-Maenhout, G., Crippa, M., Guizzardi, D., Dentener, F., Muntean, M., Pouliot, G., Keating, T., Zhang, Q., Kurokawa, J., Wankmüller, R., Denier van der Gon, H., Kuenen, J. J. P., Klimont, Z., Frost, G., Darras, S., Koffi, B., and Li, M.: HTAP_v2.2: a mosaic of regional and global emission grid maps for 2008 and 2010 to study hemispheric transport of air pollution, Atmos. Chem. Phys., 15, 11411–11432, https://doi.org/10.5194/acp-15-11411-2015, 2015.
Jha, V., Cotton, W., R., Carrió, G. G., and Walko, R.: Sensitivity Studies on the Impact of Dust and Aerosol Pollution Acting as Cloud Nucleating Aerosol on Orographic Precipitation in the Colorado River Basin, Adv. Meteorol., 2018, 3041893, https://doi.org/10.1155/2018/3041893, 2018.
Jha, V., Cotton, W. R., Carrió, G. G., and Walko, R.: Seasonal estimates of the impacts of aerosol and dust pollution on orographic precipitation in the Colorado River Basin, Phys. Geogr., 42, 73–97, https://doi.org/10.1080/02723646.2020.1792602, 2021.
Jimenez, P. A., Dudhia, J., Gonzalez–Rouco, J. F., Navarro, J., Montavez, J. P., and Garcia–Bustamante, E.: A revised scheme for the WRF surface layer formulation, Mon. Weather. Rev., 140, 898–918, https://doi.org/10.1175/MWR-D-11-00056.1, 2012.
Jin, Q., Wei, J., Yang, Z.-L., Pu, B., and Huang, J.: Consistent response of Indian summer monsoon to Middle East dust in observations and simulations, Atmos. Chem. Phys., 15, 9897–9915, https://doi.org/10.5194/acp-15-9897-2015, 2015.
Jish Prakash, P., Stenchikov, G., Kalenderski, S., Osipov, S., and Bangalath, H.: The impact of dust storms on the Arabian Peninsula and the Red Sea, Atmos. Chem. Phys., 15, 199–222, https://doi.org/10.5194/acp-15-199-2015, 2015.
Joodaki, G., Wahr, J., and Swenson, S.: Estimating the human contribution to groundwater depletion in the Middle East, from GRACE data, land surface models, and well observations, Water Resour. Res., 50, 2679–2692, https://doi.org/10.1002/2013WR014633, 2014.
Jordan, A. K., Zaitchik, B. F., Gnanadesikan, A., Kim, D., and Badr, H. S.: Strength of Linkages Between Dust and Circulation Over North Africa: results from a coupled modeling system with active dust, J. Geophys. Res.-Atmos., 125, e2019JD030961, https://doi.org/10.1029/2019JD030961, 2020.
Kalenderski, S. and Stenchikov, G.: High-resolution regional modeling of summertime transport and impact of African dust over the Red Sea and Arabian Peninsula, J. Geophys. Res.-Atmos., 121, 6435–6458, https://doi.org/10.1002/2015JD024480, 2016.
Kawecki, S. and Steiner, A. L.: The influence of aerosol hygroscopicity on precipitation intensity during a mesoscale convective event, J. Geophys. Res.-Atmos., 123, 424–442, https://doi.org/10.1002/2017JD026535, 2018.
Karydis, V. A., Kumar, P., Barahona, D., Sokolik, I. N., and Nenes, A.: On the effect of dust particles on global cloud condensation nuclei and cloud droplet number, J. Geophys. Res., 116, D23204, https://doi.org/10.1029/2011JD016283, 2011.
Khan, B., Stenchikov, G., Weinzierl, B., Kalenderski, S., and Osipov, S.: Dust plume formation in the free troposphere and aerosol size distribution during the Saharan Mineral Dust Experiment in North Africa, Tellus B, 67, https://doi.org/10.3402/tellusb.v67.27170, 2015.
Konare, A., Zakey, A. S., Solmon, F., Giorgi, F., Rauscher, S., Ibrah, S., and Bi, X.: A regional climate modeling study of the effect of desert dust on the West African monsoon, J. Geophys. Res., 113, D12206, https://doi.org/10.1029/2007JD009322, 2008.
Klingmüller, K., Pozzer, A., Metzger, S., Stenchikov, G. L., and Lelieveld, J.: Aerosol optical depth trend over the Middle East, Atmos. Chem. Phys., 16, 5063–5073, https://doi.org/10.5194/acp-16-5063-2016, 2016.
Klingmüller, K., Lelieveld, J., Karydis, V. A., and Stenchikov, G. L.: Direct radiative effect of dust–pollution interactions, Atmos. Chem. Phys., 19, 7397–7408, https://doi.org/10.5194/acp-19-7397-2019, 2019.
Koren, I., Kaufman, Y. J., Rosenfeld, D., Remer, L. A., and Rudich, Y.: Aerosol invigoration and restructuring of Atlantic convective clouds, Geophys. Res. Lett., 32, L14828, https://doi.org/10.1029/2005GL023187, 2005.
Koren, I., Martins, J. V., Remer, L. A., and Afargan, H.: Smoke invigoration versus inhibition of clouds over the Amazon, Science, 321, 946–949, https://doi.org/10.1126/science.1159185, 2008.
Koren, I., Dagan, G., and Altaratz, O.: From aerosol-limited to invigoration of warm convective clouds, Science, 344, 1143–1146, https://doi.org/10.1126/science.1252595, 2014.
Krauss, T. W., Sinkevich, A. A., and Ghulam, A. S.: Effects of feeder cloud merging on storm development in Saudi Arabia, Journal of King Abdulaziz University: Metrology, Environment and Arid Land Agricultural Sciences, 142, 1–33, https://doi.org/10.4197/Met.22-2.2, 2011.
Kravitz, B., Wang, H., Rasch, P. J., Morrison, H., and Solomon, A. B.: Process-model simulations of cloud albedo enhancement by aerosols in the Arctic, Philos. T. R. Soc. A, 372, 20140052, https://doi.org/10.1098/rsta.2014.0052, 2014.
Kucera, P., Axisa, D., Burger, R. P., Collins, D. R., Li, R., Chapman, M., Posada, R., Krauss, T. W., and Ghulam, A. S.: Features of the Weather Modification Assessment Project in Southwest Region of Saudi Arabia, Journal Weather Modification, 42, 78–103, 2010.
Lau, W. K. M., Kim, M.-K., Kim, K.-M., and Lee, W.-S.: Enhanced surface warming and accelerated snow melt in the Himalayas and Tibetan Plateau induced by absorbing aerosols, Environ. Res. Lett., 5, 025204, https://doi.org/10.1088/1748-9326/5/2/025204, 2010.
Lee, S. S.: Effect of Aerosol on Circulations and Precipitation in Deep Convective Clouds, J. Atmos. Sci., 69, 1957–1974, https://doi.org/10.1175/JAS-D-11-0111.1, 2012.
Li, R., Min, Q., and Harrison, L. C.: A Case Study: The Indirect Aerosol Effects of Mineral Dust on Warm Clouds, J. Atmos. Sci., 67, 805–816, https://doi.org/10.1175/2009JAS3235.1, 2010.
Li, Z., Niu, F., Fan, J., Liu, Y., Rosenfeld, D., and Ding, Y.: Long-term impacts of aerosols on the vertical development of clouds and precipitation, Nat. Geosci., 4, 888–894, https://doi.org/10.1038/ngeo1313, 2011.
Lim, K. S. and Hong, S.: Development of an Effective Double-Moment Cloud Microphysics Scheme with Prognostic Cloud Condensation Nuclei (CCN) for Weather and Climate Models, Mon. Weather Rev., 138, 1587–1612, https://doi.org/10.1175/2009MWR2968.1, 2010.
Liu, Z., Ostrenga, D., Teng, W., and Kempler, S.: Tropical Rainfall Measuring Mission (IMERG) Precipitation Data and Services for Research and Applications, B. Am. Meteorol. Soc., 93, 1317–1325, https://doi.org/10.1175/BAMS-D-11-00152.1, 2012.
Lohmann, U. and Feichter, J.: Can the direct and semi-direct aerosol effect compete with the indirect effect on a global scale?, Geophys. Res. Lett., 28, 159–161, https://doi.org/10.1029/2000GL012051, 2001.
Lopatin, A., Dubovik, O., Fuertes, D., Stenchikov, G., Lapyonok, T., Veselovskii, I., Wienhold, F. G., Shevchenko, I., Hu, Q., and Parajuli, S.: Synergy processing of diverse ground-based remote sensing and in situ data using the GRASP algorithm: applications to radiometer, lidar and radiosonde observations, Atmos. Meas. Tech., 14, 2575–2614, https://doi.org/10.5194/amt-14-2575-2021, 2021.
Mahmoud, M. T., Al-Zahrani, M. A., and Sharif, H. O.: Assessment of global precipitation measurement satellite products over Saudi Arabia, J. Hydrol., 559, 1–12, https://doi.org/10.1016/j.jhydrol.2018.02.015, 2018.
Mazroui, A. A. and Farrah, S.: The UAE seeks leading position in global rain enhancement research, Journal of Weather Modification, 49, 54–55, 2017.
Miller, S. T. K., Keim, B. D., Talbot, R. W., and Mao, H.: Sea breeze: Structure, forecasting, and impacts, Rev. Geophys., 41, 1011, https://doi.org/10.1029/2003RG000124, 2003.
Monahan, E. C., Spiel, D. E., and Davidson, K. L.: A Model of Marine Aerosol Generation Via Whitecaps and Wave Disruption, in: Oceanic Whitecaps, edited by: Monahan, E. C. and Niocaill, G. M., Oceanographic Sciences Library, Springer, Dordrecht, 2, 167–174, https://doi.org/10.1007/978-94-009-4668-2_16, 1986.
Morrison, H., Thompson, G., and Tatarskii, V.: Impact of Cloud Microphysics on the Development of Trailing Stratiform Precipitation in a Simulated Squall Line: Comparison of One- and Two-Moment Schemes, Mon. Weather Rev., 137, 991–1007, https://doi.org/10.1175/2008MWR2556.1, 2009.
Mostamandi, S., Predybaylo, E., Osipov, S., Zolina, O., Gulev, S., Parajuli, S., and Stenchikov, G.: Sea Breeze Geoengineering to Increase Rainfall over the Arabian Red Sea Coastal Plains, J. Hydrometeorol., 23, 3–24, https://doi.org/10.1175/JHM-D-20-0266.1, 2022.
Min, Q.-L., Li, R., Lin, B., Joseph, E., Wang, S., Hu, Y., Morris, V., and Chang, F.: Evidence of mineral dust altering cloud microphysics and precipitation, Atmos. Chem. Phys., 9, 3223–3231, https://doi.org/10.5194/acp-9-3223-2009, 2009.
NASA: MODIS AOD data, LAADS DAAC [data set], https://ladsweb.modaps.eosdis.nasa.gov/, last access: 4 July 2022a.
NASA: MERRA-2 and IMERG data, GES DISC [data set], https://disc.gsfc.nasa.gov/, last access: 4 July 2022b.
Parajuli, S. P., Stenchikov, G. L., Ukhov, A., and Kim, H.: Dust emission modeling using a new high-resolution dust source function in WRF-Chem with implications for air quality, J. Geophys. Res.-Atmos., 124, 10109–10133, https://doi.org/10.1029/2019JD030248, 2019.
Parajuli, S. P., Stenchikov, G. L., Ukhov, A., Shevchenko, I., Dubovik, O., and Lopatin, A.: Aerosol vertical distribution and interactions with land/sea breezes over the eastern coast of the Red Sea from lidar data and high-resolution WRF-Chem simulations, Atmos. Chem. Phys., 20, 16089–16116, https://doi.org/10.5194/acp-20-16089-2020, 2020.
Parajuli, S. P., Stenchikov, G. L., Ukhov, A., Mostamandi, S., Kucera, P., Axisa, D., Gustafson, W., and Zhu, Y.: Effect of dust on rainfall over the Red Sea coast based on WRF-Chem model simulations, KAUST Research Repository [data set], https://doi.org/10.25781/KAUST-ZZ3WX, 2022.
Rémy, S., Benedetti, A., Bozzo, A., Haiden, T., Jones, L., Razinger, M., Flemming, J., Engelen, R. J., Peuch, V. H., and Thepaut, J. N.: Feedbacks of dust and boundary layer meteorology during a dust storm in the eastern Mediterranean, Atmos. Chem. Phys., 15, 12909–12933, https://doi.org/10.5194/acp-15-12909-2015, 2015.
Rienecker, M. M., Suarez, M. J., Gelaro, R., Todling, R., Bacmeister, J., Liu, E., Bosilovich, M. G., Schubert, S. D., Takacs, L., Kim, G., Bloom, S., Chen, J., Collins, D., Conaty, A., da Silva, A., Gu, W., Joiner, J., Koster, R. D., Lucchesi, R., Molod, A., Owens, T., Pawson, S., Pegion, P., Redder, C. R., Reichle, R., Robertson, F. R., Ruddick, A. G., Sienkiewicz, M., and Woollen, J.: MERRA: NASA's modern-era retrospective analysis for research and applications, J. Climate, 24, 3624–3648, https://doi.org/10.1175/JCLI-D-11-00015.1, 2011.
Roberts, G. C. and Nenes, A.: A Continuous-Flow Streamwise Thermal-Gradient CCN Chamber for Atmospheric Measurements, Aerosol Sci. Tech., 39, 206–221, https://doi.org/10.1080/027868290913988, 2005.
Rosenfeld, D., Rudich, Y., and Lahav, R.: Desert dust suppression precipitation: A possible desertification feedback loop, P. Natl. Acad. Sci. USA, 98, 5975–5980, https://doi.org/10.1073/pnas.101122798, 2001.
Rosenfeld, D., Liu, G., Yu, X., Zhu, Y., Dai, J., Xu, X., and Yue, Z.: High-resolution (375 m) cloud microstructure as seen from the NPP/VIIRS satellite imager, Atmos. Chem. Phys., 14, 2479–2496, https://doi.org/10.5194/acp-14-2479-2014, 2014.
Rosenfeld, D., Zheng, Y., Hashimshoni, E., Pöhlker, M. L., Jefferson, A., Pöhlker, C., Yu, X., Zhu, Y., Liu, G., Yue, Z., Fischman, B., Li, Z., Giguzin, D., Goren, T., Artaxo, P., Barbosa, H. M. J., Pöschl, U., and Andreae, M. O.: Satellite retrieval of cloud condensation nuclei concentrations by using clouds as CCN chambers, P. Natl. Acad. Sci. USA, 113, 5828–5834, https://doi.org/10.1073/pnas.1514044113, 2016.
Sinkevich, A. A. and Krauss, T. W.: Cloud modification in Saudi Arabia: Statistical estimation of the results, Russ. Meteorol. Hydrol., 35, 378–385, https://doi.org/10.3103/S1068373910060038, 2010.
Simpson, J. E.: Sea breeze and local winds, Cambridge University Press, 1994.
Solomos, S., Kallos, G., Kushta, J., Astitha, M., Tremback, C., Nenes, A., and Levin, Z.: An integrated modeling study on the effects of mineral dust and sea salt particles on clouds and precipitation, Atmos. Chem. Phys., 11, 873–892, https://doi.org/10.5194/acp-11-873-2011, 2011.
Spurny, K. R.: Atmospheric Condensation Nuclei P. J. Coulier 1875 and J. Aitken 1880 (Historical Review), Aerosol Sci. Tech., 32, 243–248, https://doi.org/10.1080/027868200303777, 2000.
Stull, R.: Meteorology for scientists and engineers, Brooks/Cole, https://www.eoas.ubc.ca/books/Practical_Meteorology/mse3.html (last access: 4 July 2022), 2000.
Tai, Y., Liang, H., Zaki, A., El Hadri, N., Abshaev, A. M., Huchunaev, B. M., Griffiths, S., Jouiad, M., and Zou, L.: Core/Shell Microstructure Induced Synergistic Effect for Efficient Water-Droplet Formation and Cloud-Seeding Application, ACS Nano, 11, 12318–12325, https://doi.org/10.1021/acsnano.7b06114, 2017.
Tewari, M., Chen, F., Wang, W., Dudhia, J., LeMone, M., Mitchell, K., Ek, M., Gayno, G., Wegiel, J., and Cuenca, R. H.: Implementation and verification of the unified NOAH land surface model in the WRF model, 20th conference on weather analysis and forecasting/16th conference on numerical weather prediction, 11–15, https://ams.confex.com/ams/84Annual/techprogram/paper_69061.htm (last access: 4 July 2022), 2004.
Trinh, T.-A., Feeny, S., and Posso, A.: Rainfall shocks and child health: the role of parental mental health, Clim. Dev., 13, 34–48, https://doi.org/10.1080/17565529.2020.1716672, 2020.
Tuccella, P., Curci, G., Grell, G. A., Visconti, G., Crumeyrolle, S., Schwarzenboeck, A., and Mensah, A. A.: A new chemistry option in WRF-Chem v. 3.4 for the simulation of direct and indirect aerosol effects using VBS: evaluation against IMPACT-EUCAARI data, Geosci. Model Dev., 8, 2749–2776, https://doi.org/10.5194/gmd-8-2749-2015, 2015.
Twohy, C. H.: Measurements of Saharan Dust in Convective Clouds over the Tropical Eastern Atlantic Ocean, J. Atmos. Sci., 72, 75–81, https://doi.org/10.1175/JAS-D-14-0133.1, 2015.
Twomey, S. A.: Aerosols, clouds and radiation, Atmos. Environ. A-Gen., 25, 2435–2442, https://doi.org/10.1016/0960-1686(91)90159-5, 1991.
Ukhov, A., Mostamandi, S., da Silva, A., Flemming, J., Alshehri, Y., Shevchenko, I., and Stenchikov, G.: Assessment of natural and anthropogenic aerosol air pollution in the Middle East using MERRA-2, CAMS data assimilation products, and high-resolution WRF-Chem model simulations, Atmos. Chem. Phys., 20, 9281–9310, https://doi.org/10.5194/acp-20-9281-2020, 2020.
Ukhov, A., Ahmadov, R., Grell, G., and Stenchikov, G.: Improving dust simulations in WRF-Chem v4.1.3 coupled with the GOCART aerosol module, Geosci. Model Dev., 14, 473–493, https://doi.org/10.5194/gmd-14-473-2021, 2021.
Yang, Q., Gustafson Jr., W. I., Fast, J. D., Wang, H., Easter, R. C., Morrison, H., Lee, Y.-N., Chapman, E. G., Spak, S. N., and Mena-Carrasco, M. A.: Assessing regional scale predictions of aerosols, marine stratocumulus, and their interactions during VOCALS-REx using WRF-Chem, Atmos. Chem. Phys., 11, 11951–11975, https://doi.org/10.5194/acp-11-11951-2011, 2011.
Yang, Q., Gustafson Jr., W. I., Fast, J. D., Wang, H., Easter, R. C., Wang, M., Ghan, S. J., Berg, L. K., Leung, L. R., and Morrison, H.: Impact of natural and anthropogenic aerosols on stratocumulus and precipitation in the Southeast Pacific: a regional modelling study using WRF-Chem, Atmos. Chem. Phys., 12, 8777–8796, https://doi.org/10.5194/acp-12-8777-2012, 2012.
Yin, Y. and Chen, L.: The effects of heating by transported dust layers on cloud and precipitation: a numerical study, Atmos. Chem. Phys., 7, 3497–3505, https://doi.org/10.5194/acp-7-3497-2007, 2007.
Yin, Y., Wurzler, S., Levin, Z., and Reisin, T. G.: Interactions of mineral dust particles and clouds: Effects on precipitation and cloud optical properties, J. Geophys. Res., 107, 4724, https://doi.org/10.1029/2001JD001544, 2002.
Yue, Z., Rosenfeld, D., Liu, G., Dai, J., Yu, X., Zhu, Y., Hashimshoni, E., Xu, X., Hui, Y., and Lauer, O.: Automated Mapping of Convective Clouds (AMCC) Thermodynamical, Microphysical, and CCN Properties from SNPP/VIIRS Satellite Data, J. Appl. Meteorol. Clim., 58, 887–902, https://doi.org/10.1175/JAMC-D-18-0144.1, 2019.
Zaveri, R. A. and Peters, L. K.: A new lumped structure photochemical mechanism for large-scale applications, J. Geophys. Res., 104, 30387–30415, https://doi.org/10.1029/1999JD900876, 1999.
Zaveri, R. A., Easter, R. C., Fast, J. D., and Peters, L. K.: Model for Simulating Aerosol Interactions and Chemistry (MOSAIC), J. Geophys. Res., 113, D13204, https://doi.org/10.1029/2007JD008782, 2008.
Zeinab S. Z., Steiner, A., Zakey, A. S., Shalaby, A., and Wahab, M. M. A.: An exploration of the aerosol indirect effects in East Asia using a regional climate model, Atmosfera, 33, 87–103, https://doi.org/10.20937/ATM.52604, 2020.
Zhang, Y., He, J., Zhu, S., and Gantt, B.: Sensitivity of simulated chemical concentrations and aerosol-meteorology interactions to aerosol treatments and biogenic organic emissions in WRF/Chem, J. Geophys. Res.-Atmos., 121, 6014–6048, https://doi.org/10.1002/2016JD024882, 2016.
Zhang, Y., Wang, K., and He, J.: Multi-year application of WRF-CAM5 over East Asia – Part II: Interannual variability, trend analysis, and aerosol indirect effects, Atmos. Environ., 165, 222–239, https://doi.org/10.1016/j.atmosenv.2017.06.029, 2017.
Zhao, B., Wang, Y., Gu, Y., Liou, K.-N., Jiang, J. H., Fan, J., Liu, X., Huang, L., and Yung, Y. L.: Ice nucleation by aerosols from anthropogenic pollution, Nat. Geosci., 12, 602–607, https://doi.org/10.1038/s41561-019-0389-4, 2019.
Zhao, C., Liu, X., Leung, L. R., Johnson, B., McFarlane, S. A., Gustafson Jr., W. I., Fast, J. D., and Easter, R.: The spatial distribution of mineral dust and its shortwave radiative forcing over North Africa: modeling sensitivities to dust emissions and aerosol size treatments, Atmos. Chem. Phys., 10, 8821–8838, https://doi.org/10.5194/acp-10-8821-2010, 2010.
Zhao, C., Liu, X., Ruby Leung, L., and Hagos, S.: Radiative impact of mineral dust on monsoon precipitation variability over West Africa, Atmos. Chem. Phys., 11, 1879–1893, https://doi.org/10.5194/acp-11-1879-2011, 2011.
Zheng, Y. and Rosenfeld, D.: Linear relation between convective cloud base height and updrafts and application to satellite retrievals, Geophys. Res. Lett., 42, 6485–6491, https://doi.org/10.1002/2015GL064809, 2015.