the Creative Commons Attribution 4.0 License.
the Creative Commons Attribution 4.0 License.
 | 04 Jul 2022
Absorption enhancement of black carbon particles in a Mediterranean city and countryside: effect of particulate matter chemistry, ageing and trend analysis
Marta Via
Andrés Alastuey
Angeliki Karanasiou
María Cruz Minguillón
Noemí Perez
Xavier Querol
Cristina Reche
Matic Ivančič
Martin Rigler
Marco Pandolfi
Black carbon (BC) is recognized as the most important warming agent among atmospheric aerosol particles. The absorption efficiency of pure BC is rather well-known, nevertheless the mixing of BC with other aerosol particles can enhance the BC light absorption efficiency, thus directly affecting Earth's radiative balance. The effects on climate of the BC absorption enhancement due to the mixing with these aerosols are not yet well constrained because these effects depend on the availability of material for mixing with BC, thus creating regional variations.
Here we present the mass absorption cross-section (MAC) and absorption enhancement of BC particles (Eabs), at different wavelengths (from 370 to 880 nm for online measurements and at 637 nm for offline measurements) measured at two sites in the western Mediterranean, namely Barcelona (BCN; urban background) and Montseny (MSY; regional background). The Eabs values ranged between 1.24 and 1.51 at the urban station, depending on the season and wavelength used as well as on the pure BC MAC used as a reference. The largest contribution to Eabs was due to the internal mixing of BC particles with other aerosol compounds, on average between a 91 % and a 100 % at 370 and 880 nm, respectively. Additionally, 14.5 % and 4.6 % of the total enhancement at the short ultraviolet (UV) wavelength (370 nm) was due to externally mixed brown carbon (BrC) particles during the cold and the warm period, respectively. On average, at the MSY station, a higher Eabs value was observed (1.83 at 637 nm) compared to BCN (1.37 at 637 nm), which was associated with the higher fraction of organic aerosols (OA) available for BC coating at the regional station, as denoted by the higher organic carbon to elemental carbon (OC:EC) ratio observed at MSY compared to BCN. At both BCN and MSY, Eabs showed an exponential increase with the amount of non-refractory (NR) material available for coating (RNR-PM). The Eabs at 637 nm at the MSY regional station reached values up to 3 during episodes with high RNR-PM, whereas in BCN, Eabs kept values lower than 2 due to the lower relative amount of coating materials measured at BCN compared to MSY. The main sources of OA influencing Eabs throughout the year were hydrocarbon OA (HOA) and cooking-related OA (COA), i.e. primary OA (POA) from traffic and cooking emissions, respectively, at both 370 and 880 nm. At the short UV wavelength (370 nm), a strong contribution to Eabs from biomass burning OA (BBOA) and less oxidized oxygenated OA (LO-OOA) sources was observed in the colder period. Moreover, we found an increase of Eabs with the ageing state of the particles, especially during the colder period. This increase of Eabs with particle ageing was associated with a larger relative amount of secondary OA (SOA) compared to POA. The availability of a long dataset at both stations from offline measurements enabled a decade-long trend analysis of Eabs at 637 nm, that showed statistically significant (s.s.) positive trends of Eabs during the warmer months at the MSY station. This s.s. positive trend in MSY mirrored the observed increase of the OC:EC ratio over time. Moreover, in BCN during the COVID-19 lockdown period in spring 2020 we observed a sharp increase of Eabs due to the observed sharp increase of the OC:EC ratio. Our results show similar values of Eabs to those found in the literature for similar background stations.
- Article
(2656 KB) - Full-text XML
-
Supplement
(1354 KB) - BibTeX
- EndNote


The light-absorbing properties of atmospheric carbonaceous aerosols, i.e. black carbon (BC) and organic aerosols (OA), have been linked with a strong positive radiative forcing effect on Earth's energy budget (Liu et al., 2015; Zhang et al., 2018; Cappa et al., 2019). Recent scientific assessments (e.g. Myhre et al., 2013) on the global warming effect of anthropogenic agents have estimated that BC is the major aerosol contributing to the absorption of solar radiation from the ultraviolet (UV) to the infrared (IR) part of the spectrum, with a direct radiative forcing (DRF) of 0.71±0.17 W m−2 (Bond et al., 2013). However, the DRF of carbonaceous aerosols still presents large uncertainties given the limitations to constrain the spatial distribution, mixing state, and absorbing properties of these atmospheric aerosols in climate models (e.g. Myhre et al., 2013).
The BC particles can be mixed with less-absorbing and non-absorbing material through either external mixing, a heterogeneous mixture of internally homogeneous particles, or internal mixing, either a homogeneous mixture of internally homogeneous particles or a heterogeneous mixture of particle composition and population (Bond and Bergstrom, 2006). The mixing state of BC with these aerosol particles determines its mass absorption cross-section (MAC), which is a spectral quantity relating to the volumetric absorptive efficiency of a particle per unit mass, and is usually reported in square metres per gram [m2 g−1]. The MAC of pure BC (or elemental carbon (EC), depending on the measuring technique employed, Lack et al., 2014) is rather well constrained. However, BC aggregates are rarely emitted as pure BC as they are usually co-emitted and internally mixed with other source-dependent aerosols that can enhance the MAC of BC (e.g. Bond and Bergstrom, 2006; Knox et al., 2009; Lack and Cappa, 2010). Moreover, the absorption of radiation by less-absorbing particles externally mixed with BC, as absorbing OA, also referred to as brown carbon (BrC) (Andreae and Gelencsér, 2006), also contributes to increase the measured absorption (Lack and Cappa, 2010). Different mixing states of BC particles were the cause for the regional differences found for the MAC in different background sites in Europe (Zanatta et al., 2016). The enhancement that this mixing produces in the resulting observed MAC with respect to the theoretical pure BC MAC is defined as the absorption enhancement (Eabs). Understanding the relationship of Eabs with the BC mixing state and the different aerosol species/sources is key to better parameterize the BC impact on radiative forcing (Jacobson, 2001; Bond et al., 2013). Whilst several studies assume Eabs as only influenced by the internal mixing (e.g. Lack and Cappa, 2010), we used an approach similar to Liu et al. (2015) where the spectral enhancement of light absorption by BC is considered as due to both the external and internal mixing of BC particles.
Externally mixed BrC particles also contribute to the enhancement of total absorption, although the absorption efficiency of BrC significantly decreases from UV moving into the visible range (e.g. Moise et al., 2015; Laskin et al., 2015; Samset et al., 2018; Saleh et al., 2018; Saleh, 2020). BrC absorption coefficient values found in the literature display a large spatial variability (e.g. Liu et al., 2015; Saleh et al., 2018; Saleh, 2020; Zhang et al., 2020) due to the specific OA sources and composition found for each site. These differences in OA composition result in different BrC MACs, since different OAs from different sources present variations in absorption efficiencies (e.g. Saleh et al., 2018; Saleh, 2020; Zhang et al., 2020). Moreover, the MAC of different OA compounds shows different behaviour along the UV–visible (UV–VIS) range, hence the variation is found in the influence of BrC on the absorption for this spectral range (Saleh et al., 2018; Saleh, 2020). The internal mixing contribution to Eabs has been thoroughly studied both through core–shell models (Lack and Cappa, 2010) and by laboratory and field experiments (e.g. Cappa et al., 2019). The main differences in Eabs values reported in literature were associated with different diameters of both BC cores and shells in the case of model simulations, and to BC ageing in the case of laboratory and field experiments. In fact, BC particle ageing can be seen as a surrogate of the particle shell diameter since more ageing implies more coating layers (Lack and Cappa, 2010). Therefore, analysing the influence of both internal and external BC mixing states on Eabs is fundamental for a correct characterization of the aerosol particle light absorption, and to better constrain modelling results (Liu et al., 2015).
Several laboratory studies, field measurements, and modelling results can be found in the literature about Eabs values (e.g. Lack and Cappa, 2010; Cappa et al., 2012; Liu et al., 2015; Zhang et al., 2018). However, the results fail to present a ubiquitous Eabs value, with values ranging between almost no absorption enhancement (Eabs∼1, Cappa et al., 2012), to around 50 % absorption increase as assumed by some climate models (Eabs∼1.5, Liu et al., 2015, and references therein) up to values of more than 100 %, especially at the shorter wavelengths, where the BrC, externally mixed, can largely contribute to the Eabs ( e.g. Chen et al., 2017). As a consequence of the broad spectrum of values, several authors have suggested to treat Eabs as a region-specific parameter in climate models to account for the different sources or processes that may contribute to increase both the amount of BrC and the degree of BC internal mixing (Lack et al., 2012; Liu et al., 2015; Zhang et al., 2018).
To characterize the specific chemical species or sources that affect, and to which extent, the Eabs, simultaneous measurements of aerosol particle light absorption at multi-wavelengths, EC concentrations, and particulate matter (PM) chemical composition analysis are needed. Although specific instrumentation (e.g. the single particle photometer, SP2; and the soot particle aerosol mass spectrometer, SP-AMS) can be used for direct measurements of the chemical composition and internal mixing state of carbonaceous particles. Their global implementation is sparse, thus impinging a global characterization of Eabs values. Using more simple yet robust monitors to obtain the source-dependent chemical composition influencing the absorption enhancement is possible (e.g. Zhang et al., 2018). The applied methodology consists of obtaining each measurement, e.g. chemical speciation, EC concentrations, light absorption, and aerosol ageing through independent instruments, and merging the results to the lowest timestamp possible.
Here we present an analysis of the BC light absorption enhancement measured at an urban station (Barcelona; BCN) and a regional station (Montseny; MSY) in the western Mediterranean basin. The chemical analyses were performed using offline 24 h filter measurements at both stations (between 2010 and 2020). In BCN, online chemical composition measurements with a higher time resolution were also available (2018). In BCN, EC measurements were performed with a semi-continuous Sunset analyser (Karanasiou et al., 2020), and submicron aerosol particle chemical composition measurements were performed with an aerosol chemical speciation monitor (ACSM; Via et al., 2021). Absorption measurements were performed with a multi-wavelength Aethalometer (AE33) and multi-angle absorption photometer (MAAP) instruments. In Sect. 3.1, we present an overall analysis of both MAC and Eabs, showing the Eabs seasonal variability and the contribution of both external and internal BC mixing states to Eabs. In Sect. 3.2, we performed an analysis of the relationship between the absorption enhancement and the amount of non-refractory (NR) material available for coating with BC particles. Section 3.3 reports the results of a multilinear regression analysis performed to identify the main sources/species responsible for the increase of Eabs at both sites. Section 3.4 presents the influence of particle ageing in the Eabs values. Finally, we performed a trend analysis of Eabs using the decade-long offline filter measurements available at both stations (Sect. 3.5). To the best of our knowledge, although some studies have shown the variability of MAC in the Mediterranean basin (e.g. Pandolfi et al., 2014b; Zanatta et al., 2016), this is the first study of Eabs in this region and one of the few studies of its kind performed in Europe (Liu et al., 2015; Zhang et al., 2018).
2.1 Aerosol sampling sites and main characteristics
Measurements were performed at the BCN (urban background, Palau Reial, Barcelona, N, E, 80 m a.s.l.), and MSY (regional background, El Brull, N, E, 720 m a.s.l.) monitoring supersites (NE Spain). These measurement stations are characterized by aerosols with different physical and chemical properties. The BCN urban station is located within the BCN metropolitan area of nearly 4.5 million inhabitants at a distance of about 5 km from the coast, and at a 200 m distance from one of the most concurred roads of the city (>60 k vehicles per day; City council of Barcelona, 2021). The MSY regional station is located in a hilly and densely forested area within the Natural Park and Biosphere Reserve of Montseny, 50 km to the N–NE of the BCN site and 25 km from the Mediterranean coast. A detailed characterization of these measurement stations can be found in previous works for BCN (e.g. Querol et al., 2001; Rodrıguez et al., 2001; Reche et al., 2011; Brines et al., 2014, 2015; Ealo et al., 2018); and for MSY (Pérez et al., 2008; Pey et al., 2009; Pandolfi et al., 2011, 2014a, 2016). These supersites are part of the Catalonian Air Quality Monitoring Network and are part of the ACTRIS and GAW networks. Aerosol optical properties at BCN and MSY are measured following standard protocols (WMO, 2016).
Overall, the area of study is characterized by high concentrations of both primary and secondary aerosols from diverse emission sources (Rodríguez et al., 2002; Pandolfi et al., 2014a; Dayan et al., 2017; Rivas et al., 2020; Brean et al., 2020). Recently, Veld et al. (2021) presented the main aerosol sources in BCN and MSY by applying receptor modelling techniques to offline 24 h speciated PM2.5 samples collected during the period 2009–2018. The main sources identified from OA were the secondary OA (SOA), and from the secondary inorganic aerosols (SIAs) were sulfates, nitrates and ammonia. Moreover, online ACSM measurements at the BCN station (Via et al., 2021) have also shown that the OAs are mainly dominated by secondary aerosols, also referred to as oxygenated OA (OOA), as well as by hydrocarbon and cooking-related OAs (HOA and COA). Both Via et al. (2021) and Veld et al. (2021) have shown an increasing trend in the SOA as well as a reduction in a relative contribution of the primary OA (POA) to PM at the BCN and MSY stations, mainly related to more restrictive pollutant emission policies and a larger amount of higher oxidative potential scenarios. The higher oxidative potential of the OA is characterized by an increase in the relative proportion of the more-oxidized OOA (MO-OOA), in comparison with the less-oxidized OOA (LO-OOA) (Via et al., 2021). Finally, a common characteristic of the BCN and MSY measurement sites is that both are located in the proximity of North African deserts, thus both sites are heavily impacted by Saharan dust outbreaks (Querol et al., 2009; Yus-Díez et al., 2021a). For this reason, in order to avoid the interference due to dust absorption, we filtered out scenarios in which the sites were under the influence of dust outbreaks (following the European Commission guidelines; European Commission, 2011).
2.2 Absorption coefficients and EC measurements
At both measurement sites, aerosol particle absorption coefficients (babs) at 637 nm were obtained with MAAP instruments(Model 5012, Thermo Inc., USA, Petzold and Schönlinner, 2004). Moreover, in BCN, absorption measurements were also performed with a multi-wavelength Aethalometer (model AE33, Magee Scientific, Aerosol d.o.o., Drinovec et al., 2015) at seven different wavelengths (370, 470, 520, 590, 660, 880, and 950 nm). The MAAP absorption coefficients at 637 nm were derived by the internal MAAP software using a radiative transfer model from the measurements of transmission of light through the filter tape and backscattering of light at two different angles, and corrections were made following Müller et al. (2011). The MAAP measurements were obtained with a 1 min time resolution at a flow rate of 5 L min−1 and with a PM10 inlet cut-off. The AE33 babs coefficients in BCN were derived with the same time resolution and flow rate as that of the MAAP, and with a PM2.5 inlet cut-off. The Aethalometer filter-loading effect was corrected online by the dual-spot manufacturer correction (Drinovec et al., 2015), and the multiple scattering correction parameter, C, was set to 2.44, as obtained for the BCN station by Yus-Díez et al. (2021b). Absorption measurement errors of 12 % and 23 % were set for MAAP and AE33, respectively (Petzold and Schönlinner, 2004; Rigler et al., 2020). For AE33, the larger uncertainty is introduced by the multiple scattering parameter, C ( at BCN, Yus-Díez et al., 2021b), which depends on the physical properties of the particles collected on the filter tape. In Yus-Díez et al. (2021b), the C obtained with the same instruments (i.e. MAAP and AE33) and inlet cut-offs as in the present work was found to have an average value of 2.44, and it did not present a marked dependence with the single scattering albedo (SSA) of the particles collected on the filter tape. In fact, Yus-Díez et al. (2021b) showed that the C values can increase considerably when SSA is high (>0.95). However, these high SSAs are rarely measured in the city of BCN. Moreover, it was reported that the C is wavelength independent in BCN (cf. Fig. 1 in Yus-Díez et al., 2021b). Therefore, we used the average C value of 2.44 for deriving the absorption measurements.
The PM10 24 h offline filter samples were collected at both BCN and MSY on 150 mm quartz micro-fibre filters (Pallflex 2500 QAT-UP) using high-volume samplers (MCV CAV-A and DIGITEL DH80 at 30 m3 h−1). The 24 h average concentrations of major and trace elements, and soluble ions (determined following the procedure by Querol et al., 2001), as well as those of OC and EC (by a thermal–optical carbon analyser, Sunset, following the EUSAAR2 protocol, Cavalli et al., 2010), were obtained from these offline filter samples and were estimated to have a measurement error of 10 %.
Semi-continuous EC measurements were obtained in BCN by means of a semi-continuous OC:EC aerosol analyser (Sunset Laboratory Inc.) with a PM2.5 inlet cut-off at a flow rate of 8.0 L min−1, a measuring interval of 3 h using the EUSAAR2 protocol, with a measurement error of 10 % (Karanasiou et al., 2020). The device was equipped with a C parallel-plate diffusion denuder to remove volatile organic compounds (VOCs) that can be adsorbed on quartz fibre filters and cause positive artefacts in the OC measurements (Viana et al., 2006). By comparing the EC measurements from the online and offline OC:EC measurements (Fig. S1 in the Supplement), we show that there is a good agreement between both techniques, and that on average, offline EC concentrations in the PM10 fraction were 26 % higher compared to online EC concentrations in the PM2.5 fraction during the 2018 measurement period.
2.3 Submicron NR-PM chemical composition measurements and OA source apportionment
A quadrupole aerosol chemical speciation monitor (Q-ACSM, Aerodyne Research Inc.) was deployed in BCN for chemical speciation of submicrometric particles at a flow rate of 3 L min−1. The incoming particles go through an aerodynamical lens, transmitting particles of aerodynamic diameters from 75 to 650 nm. Then, these particles are vaporized, ionized by hard-electron impact and fragmentated, and the resulting fragments are analysed by a quadrupole mass spectrometer. The instrument can provide the concentrations of NR PM1 species (OA, sulfate, nitrate, ammonia and chloride) with 30 min resolution and a 12–120 Th OA spectra matrix, using a fragmentation table (Allan et al., 2004). The software used for data acquisition and treatment was provided by Aerodyne Research Inc. (versions 1.6.0.0 and 1.6.1.1, respectively) and implemented in the Igor Pro (Wavemetrics, Inc.) environment).
The retrieved OA matrices retrieved were used as input for analysis of the positive matrix factorization analysis (PMF; Paatero and Tapper, 1994), applied using a multilinear engine (ME-2; Paatero, 1999) to differentiate the different OA sources. A detailed description of the OA sources detected in BCN and used in this work can be found in Via et al. (2021). Briefly, the OA sources in BCN were: COA, HOA, biomass burning OA (BBOA), LO-OOA, and MO-OOA.
2.4 Determination of the absorption enhancement (Eabs)
Here, similar to Zhang et al. (2018), we derived the absorption enhancement (Eabs) as the ratio between the measured ambient MAC calculated at the different wavelengths available from AE33 and MAAP, and the reference MAC value of pure BC.
The observed ambient MAC defines the contribution to the measured absorption coefficients from BC particles internally and externally, mixed with organic and inorganic species that can contribute positively to the measured absorption (Bond et al., 2013). The ambient MAC measurements were obtained as the ratio of the light absorption coefficients (babs) at a given wavelength, λ, and the EC concentrations obtained with the Sunset analyser, either online or offline,
The Eabs due to both internal and external mixing of the BC particles can be quantified by normalizing the measured ambient MACλ with a reference value for pure BC, MAC. As already stated, we have applied the same methodology as in Zhang et al. (2018) and Liu et al. (2015) to determine Eabs, by calculating the ambient MAC through Eq. (1) applied to the 7 AE33 wavelengths. Thus, since BrC absorbs more efficiently at the shortest wavelengths (370–470 nm mostly), but not at 880 nm, the observed Eabs at the shortest wavelengths includes the lensing-driven enhancement and the enhancement induced by semi-volatile BrC (e.g. Liu et al., 2015), while the observed Eabs at 880 nm represents the lensing-driven enhancement only.
The reference MAC value (MAC) can be obtained either from the literature (Bond and Bergstrom, 2006), or from experimental data. There are two experimental approaches for obtaining MAC: (1) by using denuded measurements that evaporate the semi-volatile organic and inorganic species, thus allowing for a measurement of the pure BC absorption (e.g. Liu et al., 2015), and (2) by using the intercept of the relationship between the ambient MACλ and the OC:EC ratio as MAC. In this latter case, MAC is the MAC value obtained when the OC:EC ratio is equal to 0 (Zhang et al., 2018). Here we have preferentially used the second method (intercept) to determine MAC (Figs. S2–S4). For this purpose, we used a Deming regression fit, taking into account the propagation of errors from the absorption and OC:EC measurement errors. Additionally, we used MAC from the literature to calculate Eabs, i.e. 7.5±1.2 (m2 g−1) at 550 nm (Bond and Bergstrom, 2006), which was extrapolated to each AE33 wavelength assuming an absorption Ångström exponent (AAE) of 1.
Online MACλ and values at BCN were obtained during 2018 using AE33 coefficients averaged to the semi-continuous timestamp of the Sunset OC:EC measurements (3 h) when the Q-ACSM measurements were also available. Offline MAC values at both BCN and MSY were obtained by using the 24 h average babs coefficients from MAAP at 637 nm, and 24 h OC:EC concentrations from PM10 filters (2010–2020). Figure S6 shows the obtained MAC for both BCN and MSY stations for all the wavelengths available from both online (BCN) and offline (BCN and MSY) measurements. Data in Fig. S6 were grouped into two periods: a cold period from December to May, and a warm period from June to October. As shown later, measurements were grouped into these two distinct periods due to the source apportionment results from Q-ACSM measurements in BCN, since the BBOA-like compounds were only detected during winter and spring (Via et al., 2021). Offline MAC at both stations showed a good agreement with the theoretical reference value obtained in Bond and Bergstrom (2006), whereas the online measurements obtained with AE33 were higher throughout the whole spectrum. Similar values, higher than the theoretical MAC, have also been reported in other studies, such as in Zhang et al. (2018).
Furthermore, we have assumed that BrC particles do not absorb at 880 nm (Kirchstetter et al., 2004) and that the measured absorption at this wavelength was only driven by the internally mixed BC particles (i.e. the lensing effect). Moreover, although some studies assumed a lensing-driven absorption enhancement for BC particles that is wavelength independent (Liu et al., 2015; Zhang et al., 2018), other studies showed that the presence of brown coatings can produce variations in the spectral behaviour of Eabs with the wavelength (Lack and Cappa, 2010). Consequently, in order to take the possible influences of the brown coatings on Eabs into account, following Lack and Langridge (2013) we performed a sensitivity study by studying the variation of the absorption enhancement attributed to BC, the BC coating, and BrC by varying the AAE of internally mixed BC (cf. Fig. S5). For this, Eabs attributed to the different values of AAE for the internally mixed BC can be described as follows (Eq. 3):
where different AAE (0.8, 1 and 1.4) were considered for the sensitivity study presented here, following Lack and Langridge (2013).
Finally, Eabs due to externally mixed particles at a given wavelength (E) was obtained as the difference between the measured total ambient Eabs and the absorption enhancement due to the internal mixing,
2.5 Chemical fractions contribution to Eabs
Submicron chemical composition from ACSM in BCN, and offline 24 h chemical speciated data from filter analyses at both BCN and MSY were used to determine the influence of the material available for BC coating on Eabs. Chemical speciated data were used to calculate the total amount of NR-PM (NR-PM10 for offline measurements and NR-PM1 for online measurements) mass concentration. The NR-PM to EC concentration ratios were then calculated as follows:
Thus, the calculated RNR-PM represents a proxy for the amount of NR material available for mixing with the BC particles (Cappa et al., 2019). The chemical species and groups of compounds taken into account using the online ACSM continuous measurements were: [HOA], [COA], [LO-OOA], [MO-OOA], [SO, [NO, [NH, [Cl−], and [BBOA] during the cold period; whereas they were [OA], [SO, [NO, [NH, [Cl−] from the 24 h filters.
Moreover, online submicron chemical composition data and OA source apportionment from ACSM in BCN were used to determine the species that mostly contributed to Eabs. For this, a multivariate linear regression (mlr) analysis was employed to solve the following equation:
where E0 is the intercept, mi (where ) are the regression coefficients, i.e. the relative contribution of each chemical fraction to Eabs, and [qi] are the dependent variables of the mlr, i.e. the ratios of each chemical fraction/source normalized to the EC concentration. Note that E0 should be equal to 1 (i.e. no absorption enhancement) when all the ratios are equal to 0 in Eq. (6). In order to perform a more robust mlr analysis and to reduce the effect of outliers, data points lower than the 5th and higher than the 95th percentiles were excluded from the analysis.
3.1 Site-specific MAC and Eabs analysis
The median values of the ambient BC MAC and Eabs at different wavelengths from both online and offline measurements at BCN and MSY are reported in Tables 1 and 2, respectively. For the long-term offline measurements, the MAC at 637 nm was 9.67±2.55 m2 g−1 at the BCN urban background station, and 13.10±4.47 m2 g−1 at the MSY regional background station. The BC MAC at MSY showed a higher median value compared to BCN (cf. Table 1) due to the fact that BC particles reaching the regional station had more time to gather material for coating. Moreover, the frequency distribution of the MAC values at MSY was less left-skewed and more right-skewed compared to BCN (see Fig. S7). For the intensive online measurements in BCN, the MAC values range between 7.55±2.06 at 950 nm and 22.74±6.98 at 370 nm (Table 1). The values at 660 nm for the online measurements and 637 nm for the offline measurements were around 10.85±2.98, and 9.67±2.55 in BCN, and 13.10±4.47 in MSY, which were within the range of MAC values reported by Zanatta et al. (2016) for similar station backgrounds. The difference between the offline and online measurements at BCN, although the mean values fall within the standard deviation of the measurements, was mainly associated with the difference in the length of the measurement periods, and the different inlet cut-off sizes, which prevent direct comparison (Fig. S1 in the Supplement). The observed increase of MAC with decreasing wavelength was expected due to both the increase of the energy radiation and the larger influence of the externally mixed BrC particles at shorter wavelengths. In fact, the effect of externally mixed BrC particles on MAC in BCN is visible in Fig. S7 where the frequency distribution of MAC at 370 nm showed a much more pronounced tile toward higher values compared to the MAC at 880 nm.
Table 1Observed MAC (m2 g−1) values obtained using online techniques via AE33 and Sunset online EC measurements at BCN for a PM2.5 inlet cut-off, and offline at BCN and MSY via MAAP and offline EC measurements on 24 h filters for a PM10 inlet cut-off.

The averaged multi-wavelength Eabs values from both online and offline measurements at BCN and MSY are shown in Table 2. The online measurements at 880 nm in BCN led to a median Eabs value of 1.28±0.36, whereas it increased to 1.45±0.51 at 370 nm. For the offline measurements, the median Eabs values at 637 nm were 1.42±0.40 and 2.00±0.75 at BCN and MSY, respectively. As reported in Table 2, the Eabs values from online and offline measurements in BCN were rather similar (1.31±0.38 at 660 nm online and 1.42±0.40 at 637 nm offline), and the observed difference was likely due to both the different periods, the inlet cut-off (Fig. S1 in the Supplement), and the different instrumentation used for the calculation of Eabs. As already observed for MAC, the higher Eabs at the regional MSY station was due to ageing of BC particles during the transport toward the regional station. The Eabs values reported in Table 2 were calculated from Eq. (2) as MAC using the intercept values from the Deming regression fits reported in Figs. S2–S4 and S6 for online AE33 and offline BCN and MSY, respectively. If the theoretical reference MAC (Bond and Bergstrom, 2006) of uncoated BC was used, the overall median Eabs values were higher for the online measurements at BCN (1.59±0.51 at 880 nm and 1.91±0.62 for 370 nm), although within the uncertainty, and rather similar for the offline measurements at BCN and MSY, with Eabs values at 637 nm of 1.43±0.44 and 1.92±0.76, respectively (Table 2). The values found at the urban BCN area using the experimental (theoretical) reference MAC at 880 nm were similar (higher) to those observed in the literature for the same wavelength at rural/suburban areas (Liu et al., 2015; Zhang et al., 2018). The mean Eabs value observed at the regional background MSY station was also similar to the values reported in literature for rural areas (e.g. Cui et al., 2016).
Table 2Overall, and cold and warm period average Eabs values for both multi-wavelength online measurements at BCN, and offline measurements at the near-infrared (NIR) BCN and MSY stations.
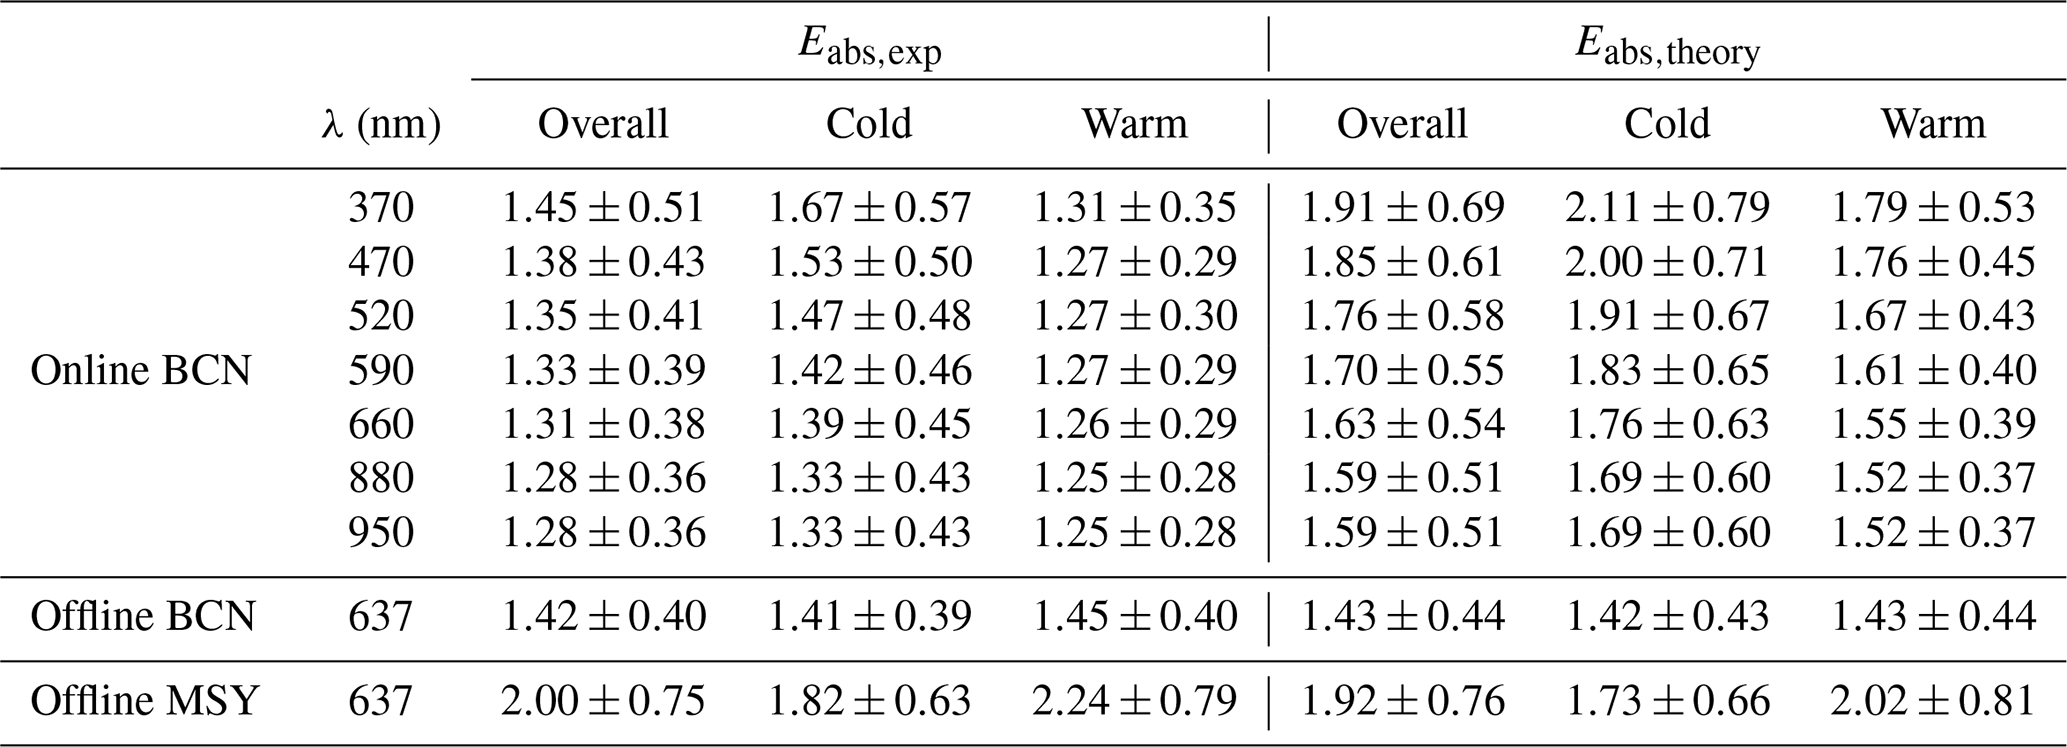
Figure 1 shows the density distribution of Eabs for the cold (December–May) and warm (June–October) seasons from both online measurements at BCN and offline measurements at BCN and MSY (Fig. 1). The median values of the season-dependent frequency distributions of Eabs were reported in Table 2. The long-term offline measurements led, on average, to similar Eabs values at 637 nm in BCN during the warm (1.45±0.40) and cold (1.41±0.39) seasons. However, for MSY Eabs values they were larger during the warm season (2.24±0.79) compared to the cold season (1.82±0.63), mainly due to the increase in the SOA formation (Figs. S8 and S9) which was mostly driven by the increase in biogenic volatile organic compounds (BVOCs) during the warm season (Seco et al., 2013; Veld et al., 2021). Thus, as shown later in more detail, OA, and especially SOA, contributed strongly to the BC lensing-driven Eabs, especially at the regional station.
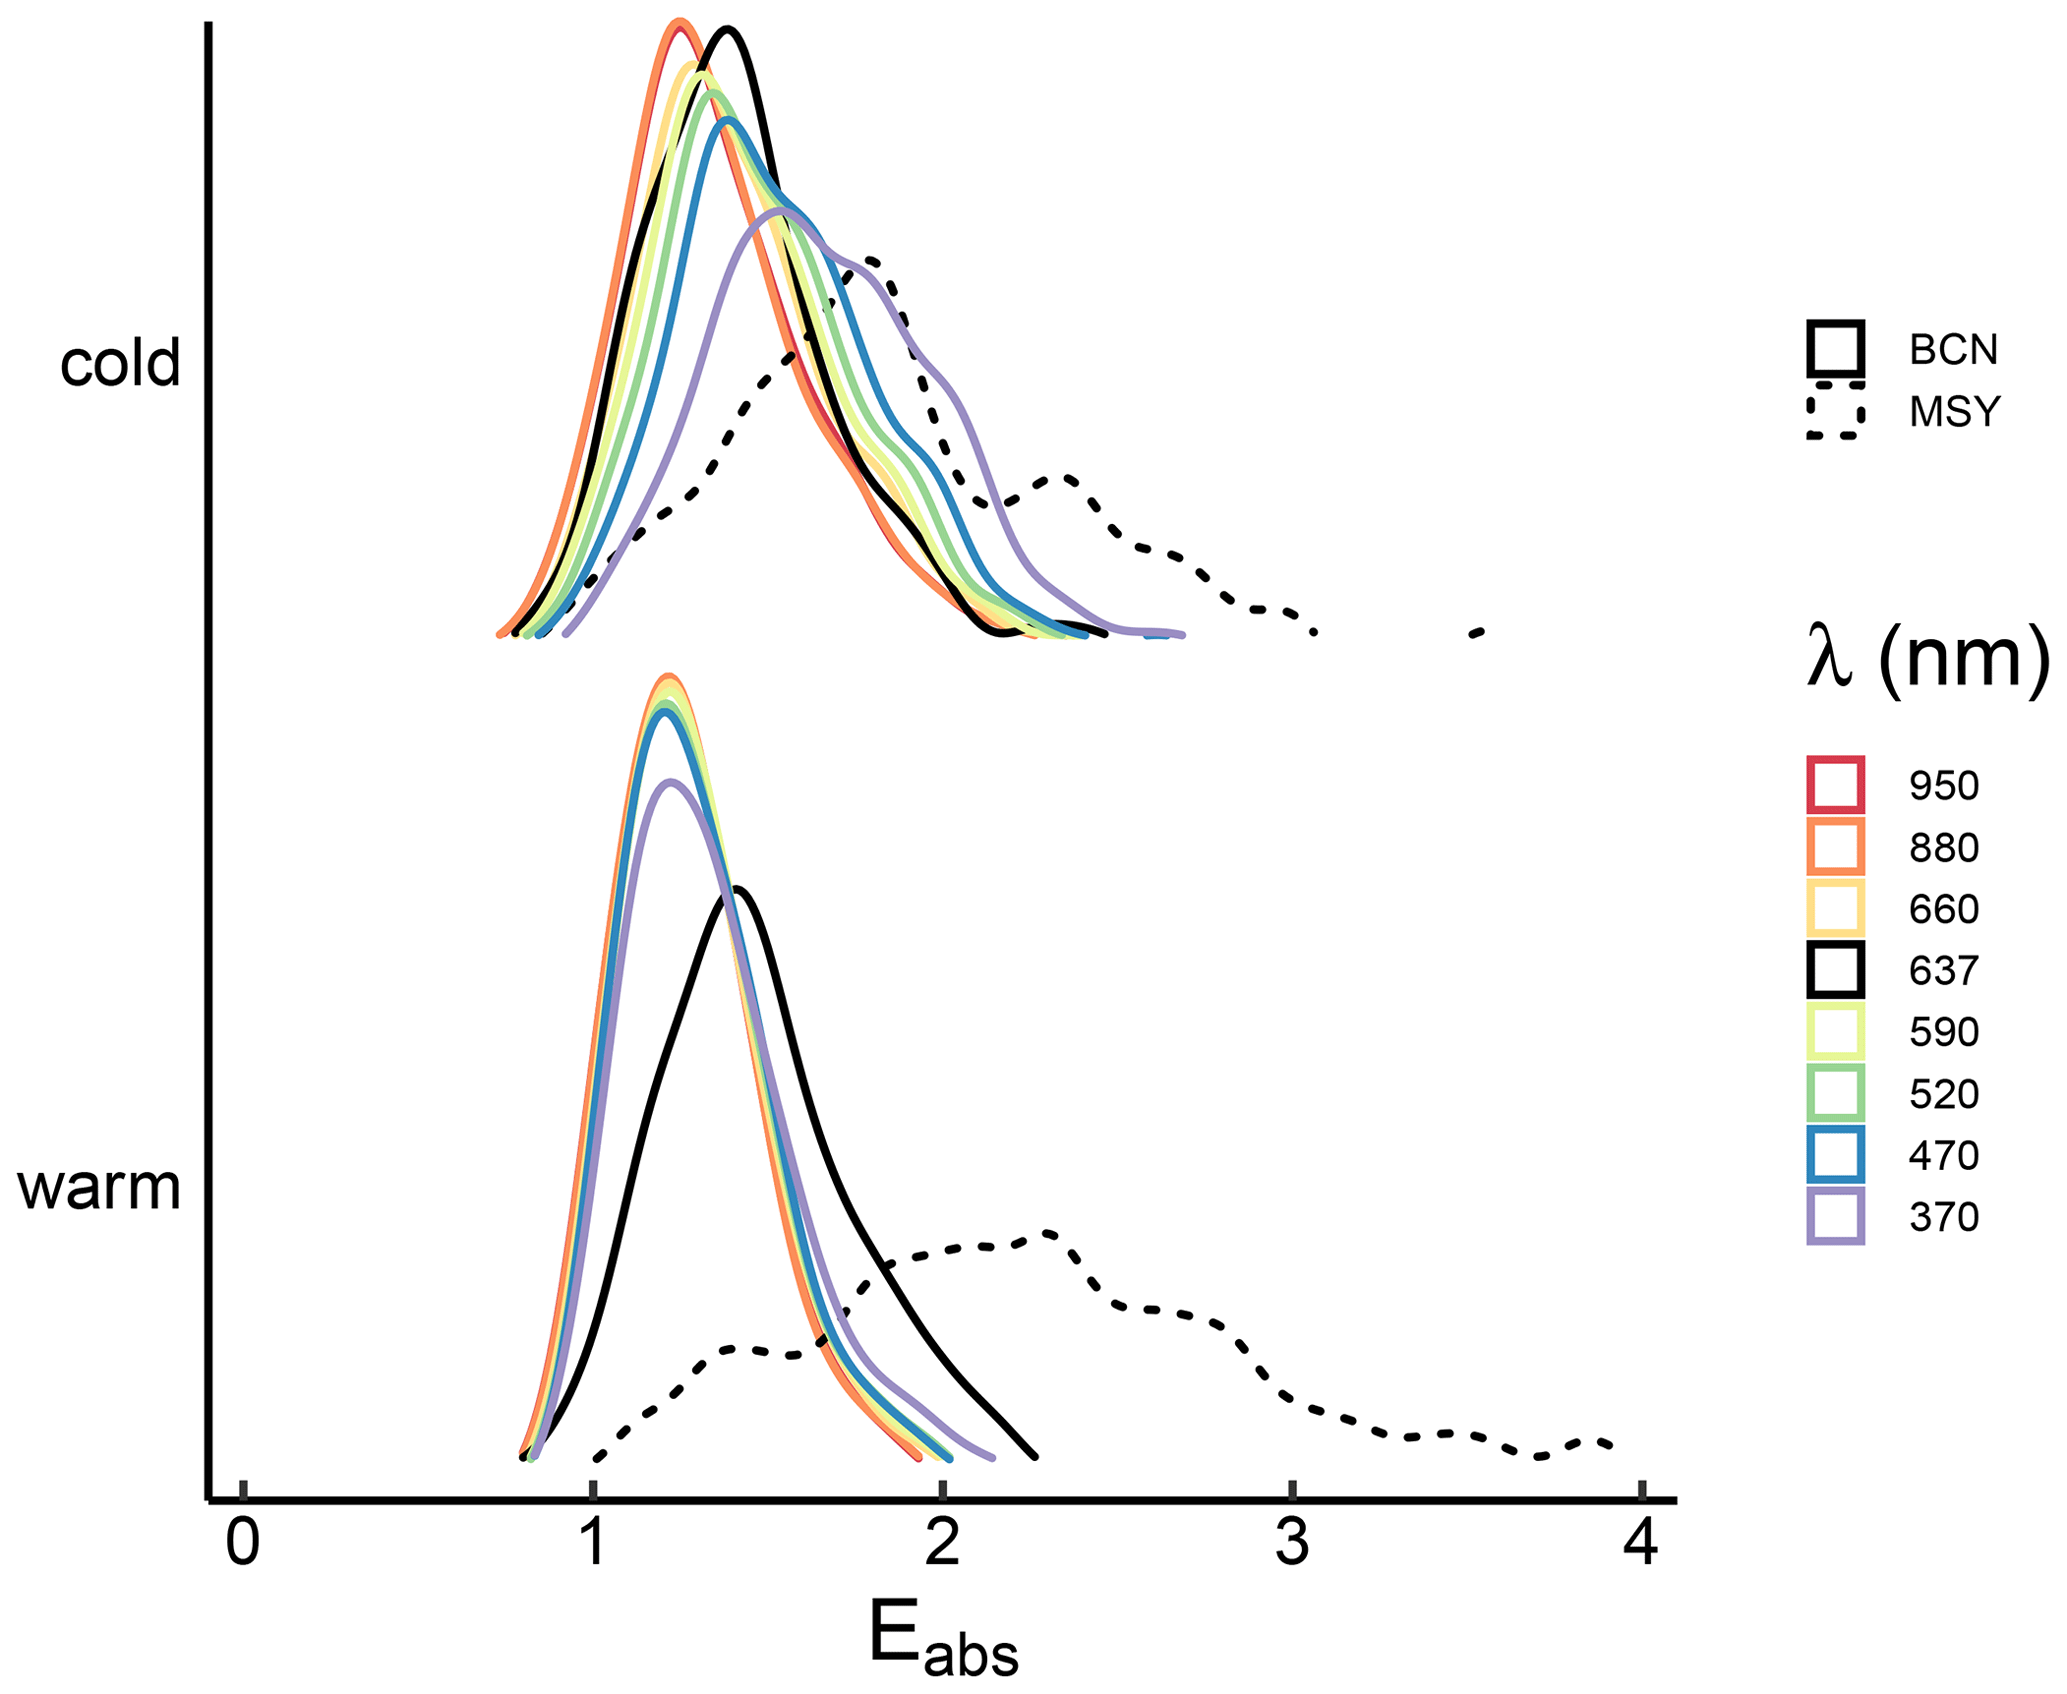
Figure 1Seasonal frequency distributions of Eabs at BCN for the multi-wavelengths measured with AE33 (coloured solid lines for 370, 470, 520, 590, 660, 880 and 950 nm), and at BCN (black solid line) and MSY (black dash line) measured with MAAP for 637 nm and offline filters.
The online measurements performed with AE33 allowed for a multi-wavelength analysis of . Figure 1a shows a seasonal decoupling of Eabs between the short UV and the IR wavelengths: whilst in the warm period Eabs remained similar for all the wavelengths, during the cold period there was an increase of Eabs towards the shorter wavelengths. This different amplification of Eabs at short UV can be associated with a larger presence of BrC-like compounds (e.g. BBOA from winter biomass burning) (Figs. S8 and S9) during the cold period (Via et al., 2021), which present larger MACs and contribution to absorption at these wavelength ranges (e.g. Lack et al., 2012; Qin et al., 2018; Saleh et al., 2018; Saleh, 2020; Kasthuriarachchi et al., 2020; Zhang et al., 2020). Figure S10 shows that by using the theoretical reference MAC, the density distribution of Eabs was similar, although the differences between the cold and warm periods were not that great. This was attributed to the fact that using a theoretical MAC does not take the different seasonal-dependent contributions of OA sources into account.
3.1.1 Eabs dependence on the mixing state
As already stated, ambient BC particles can be either externally or internally mixed with other aerosols (Bond and Bergstrom, 2006). In order to separate the relative contributions to Eabs of these two mixing states, i.e. external (Eabs,ext) and internal (Eabs,int), we used the multi-wavelength AE33 and the semi-continuous OC:EC measurements obtained in BCN (see Sect. 2.4). We assumed that Eabs at the near-infrared (NIR) (880 nm) was only produced by the internal mixing of BC particles, whereas at the short UV (370 nm) the Eabs is due to both the internal and external mixing of BC particles. Given the spectral characteristic of the BrC absorption, the contribution to Eabs due to external mixing was the highest at 370 nm compared to the other AE33 wavelengths. In addition, here we analysed the possible contribution of different internal mixing states of BC using different AAE for internally mixed BC, since the presence of brown coatings over the BC cores can actually produce a reduction of the enhancement of the absorption towards the shorter wavelengths (cf. Lack and Cappa, 2010).
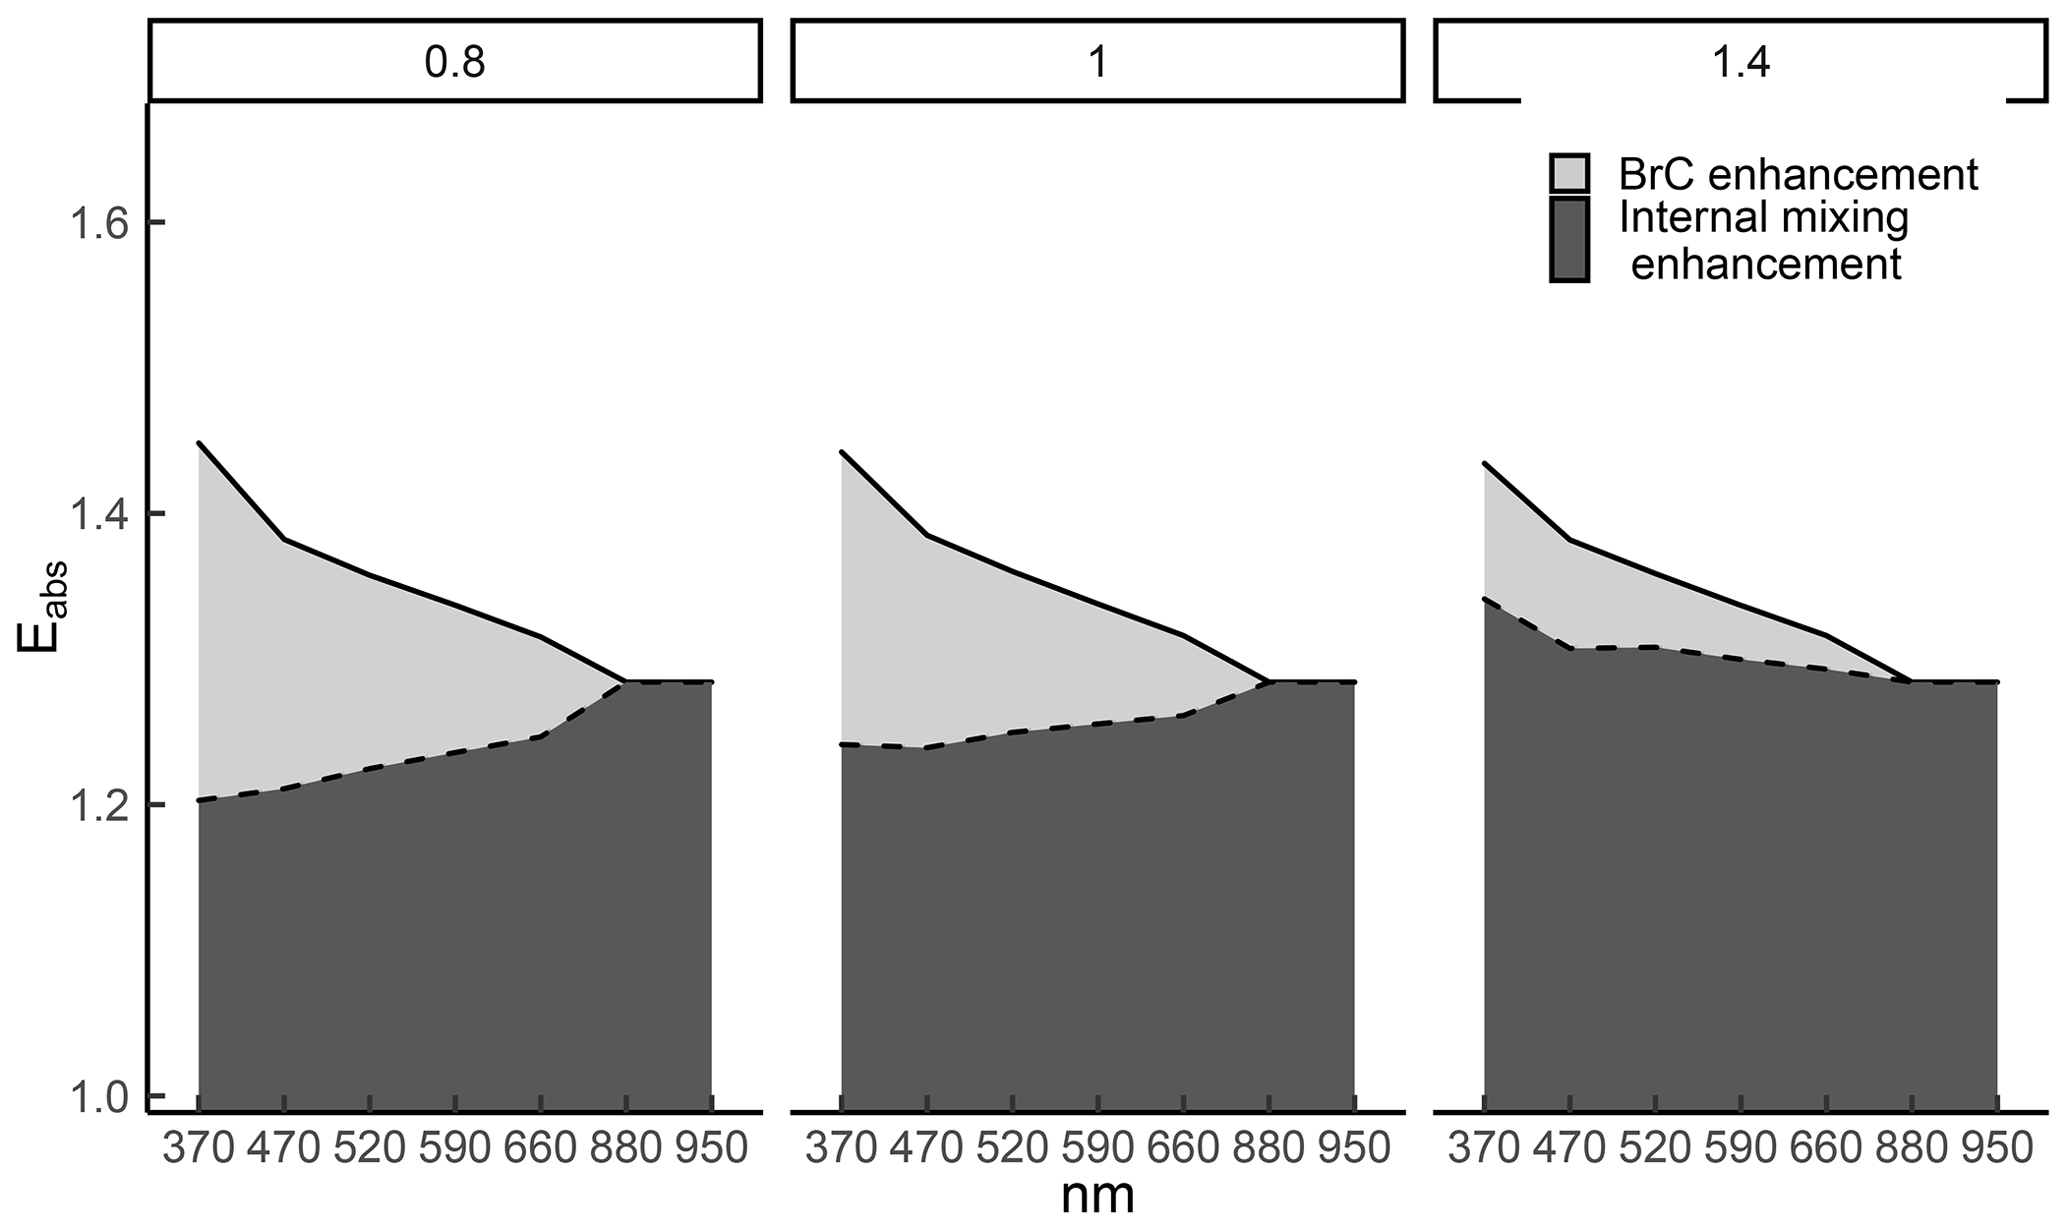
Figure 2Absorption enhancement (Eabs) attribution to both internal and external mixing under different AAE conditions for the internally mixed BC (0.8, 1, 1.4) for the online measurements at the 7-AE33 wavelengths at Barcelona (BCN).
Figure 2 shows the evolution of the contribution of the internal and external mixing states to the total Eabs for the three AAE values considered for the internally mixed BC. Indeed, Fig. 2 shows that an AAE of 0.8 could be related with a larger proportion of brown coatings, reducing Eabs due to the internally mixed BC (cf. Fig. 5 Lack and Cappa, 2010). In the case of AAE =1, the contribution of the coating material remains fairly constant (Fig. 2). However, it presents a slight decrease with decreasing wavelengths, which is due to the fact that the MAC Ångström exponent presented here for the experimental reference MAC for pure BC particles was slightly above 1 (Fig. S6). Moreover, Fig. 2 shows that for an AAE of 1.4, the internal mixing increases towards the shorter wavelengths, as observed in the simulations performed in Fig. 3 of Lack and Cappa (2010) for the case of BC core with a brown shell that does not absorb.
The overall contribution due to the internal mixing (Eabs,int) ranged between a 100 % at 880 nm, and 83 %, 86 %, and 93.5 % of the total Eabs at 370 for an AAE of 0.8, 1 and 1.4, respectively. Thus, the externally mixed BrC particles represented a non-negligible fraction of the total Eabs at short UV wavelengths (Table S1 in the Supplement), especially for the AAE =0.8 case, for which it increased from 0.069±0.066 (5.2 %) at 660 nm up to 0.17±0.18 at 370 nm (16.9 %). Conversely, if an AAE =1.4 is used, then the increase and relative contribution of Eabs due to the externally mixed BrC particles remains lower, from 0.023±0.049 (1.7 %) at 660 nm up to 0.093±0.200 at 370 nm (6.5 %).
Although BCN is an urban background station with a non-predominant contribution from biomass burning, the contribution to absorption from other potential BrC sources cannot be excluded. Since biomass burning emissions are higher during the cold season, we have found that during this season compared to the warm season, there was a small increase of the total Eabs due to the internal mixing (6.4 %), and a more significant increase of contribution of the external mixing Eabs, which increased for an AAE =1 from 0.09 during the warm period to 0.36 during the cold season (Table S1 and Fig. S11 in the Supplement), i.e. from representing a 7 % to 22 % of the total Eabs, respectively. In fact, biomass burning is not the only source contributing to the presence of BrC in the atmosphere during the colder months (e.g. Zhang et al., 2020). As shown later, other OA sources also contribute to Eabs.
3.2 Eabs dependence on RNR-PM content
Here we analysed the relationship between Eabs and the amount of material available for mixing with BC particles (RNR-PM, cf. Sect. 2.5). As commented in Sect. 3.1, the variability of Eabs with the seasons can be attributed to the differences in the OA composition and concentration levels. Cappa et al. (2019) have shown the discrepancies between model, laboratory, and field studies in the behaviour of Eabs with RNR-PM. Indeed, Fig. 1 in Cappa et al. (2019) shows that some studies reported only a slight increase of Eabs with the amount of the coating material (Cappa et al., 2012), whereas others measured a larger increase of Eabs for high concentrations of RNR-PM (Liu et al., 2015; Peng et al., 2016). The authors argued that the differences could be associated with the ageing state, volatility, and amount of coating of the particles, as well as with the apportionment of external mixing to Eabs.
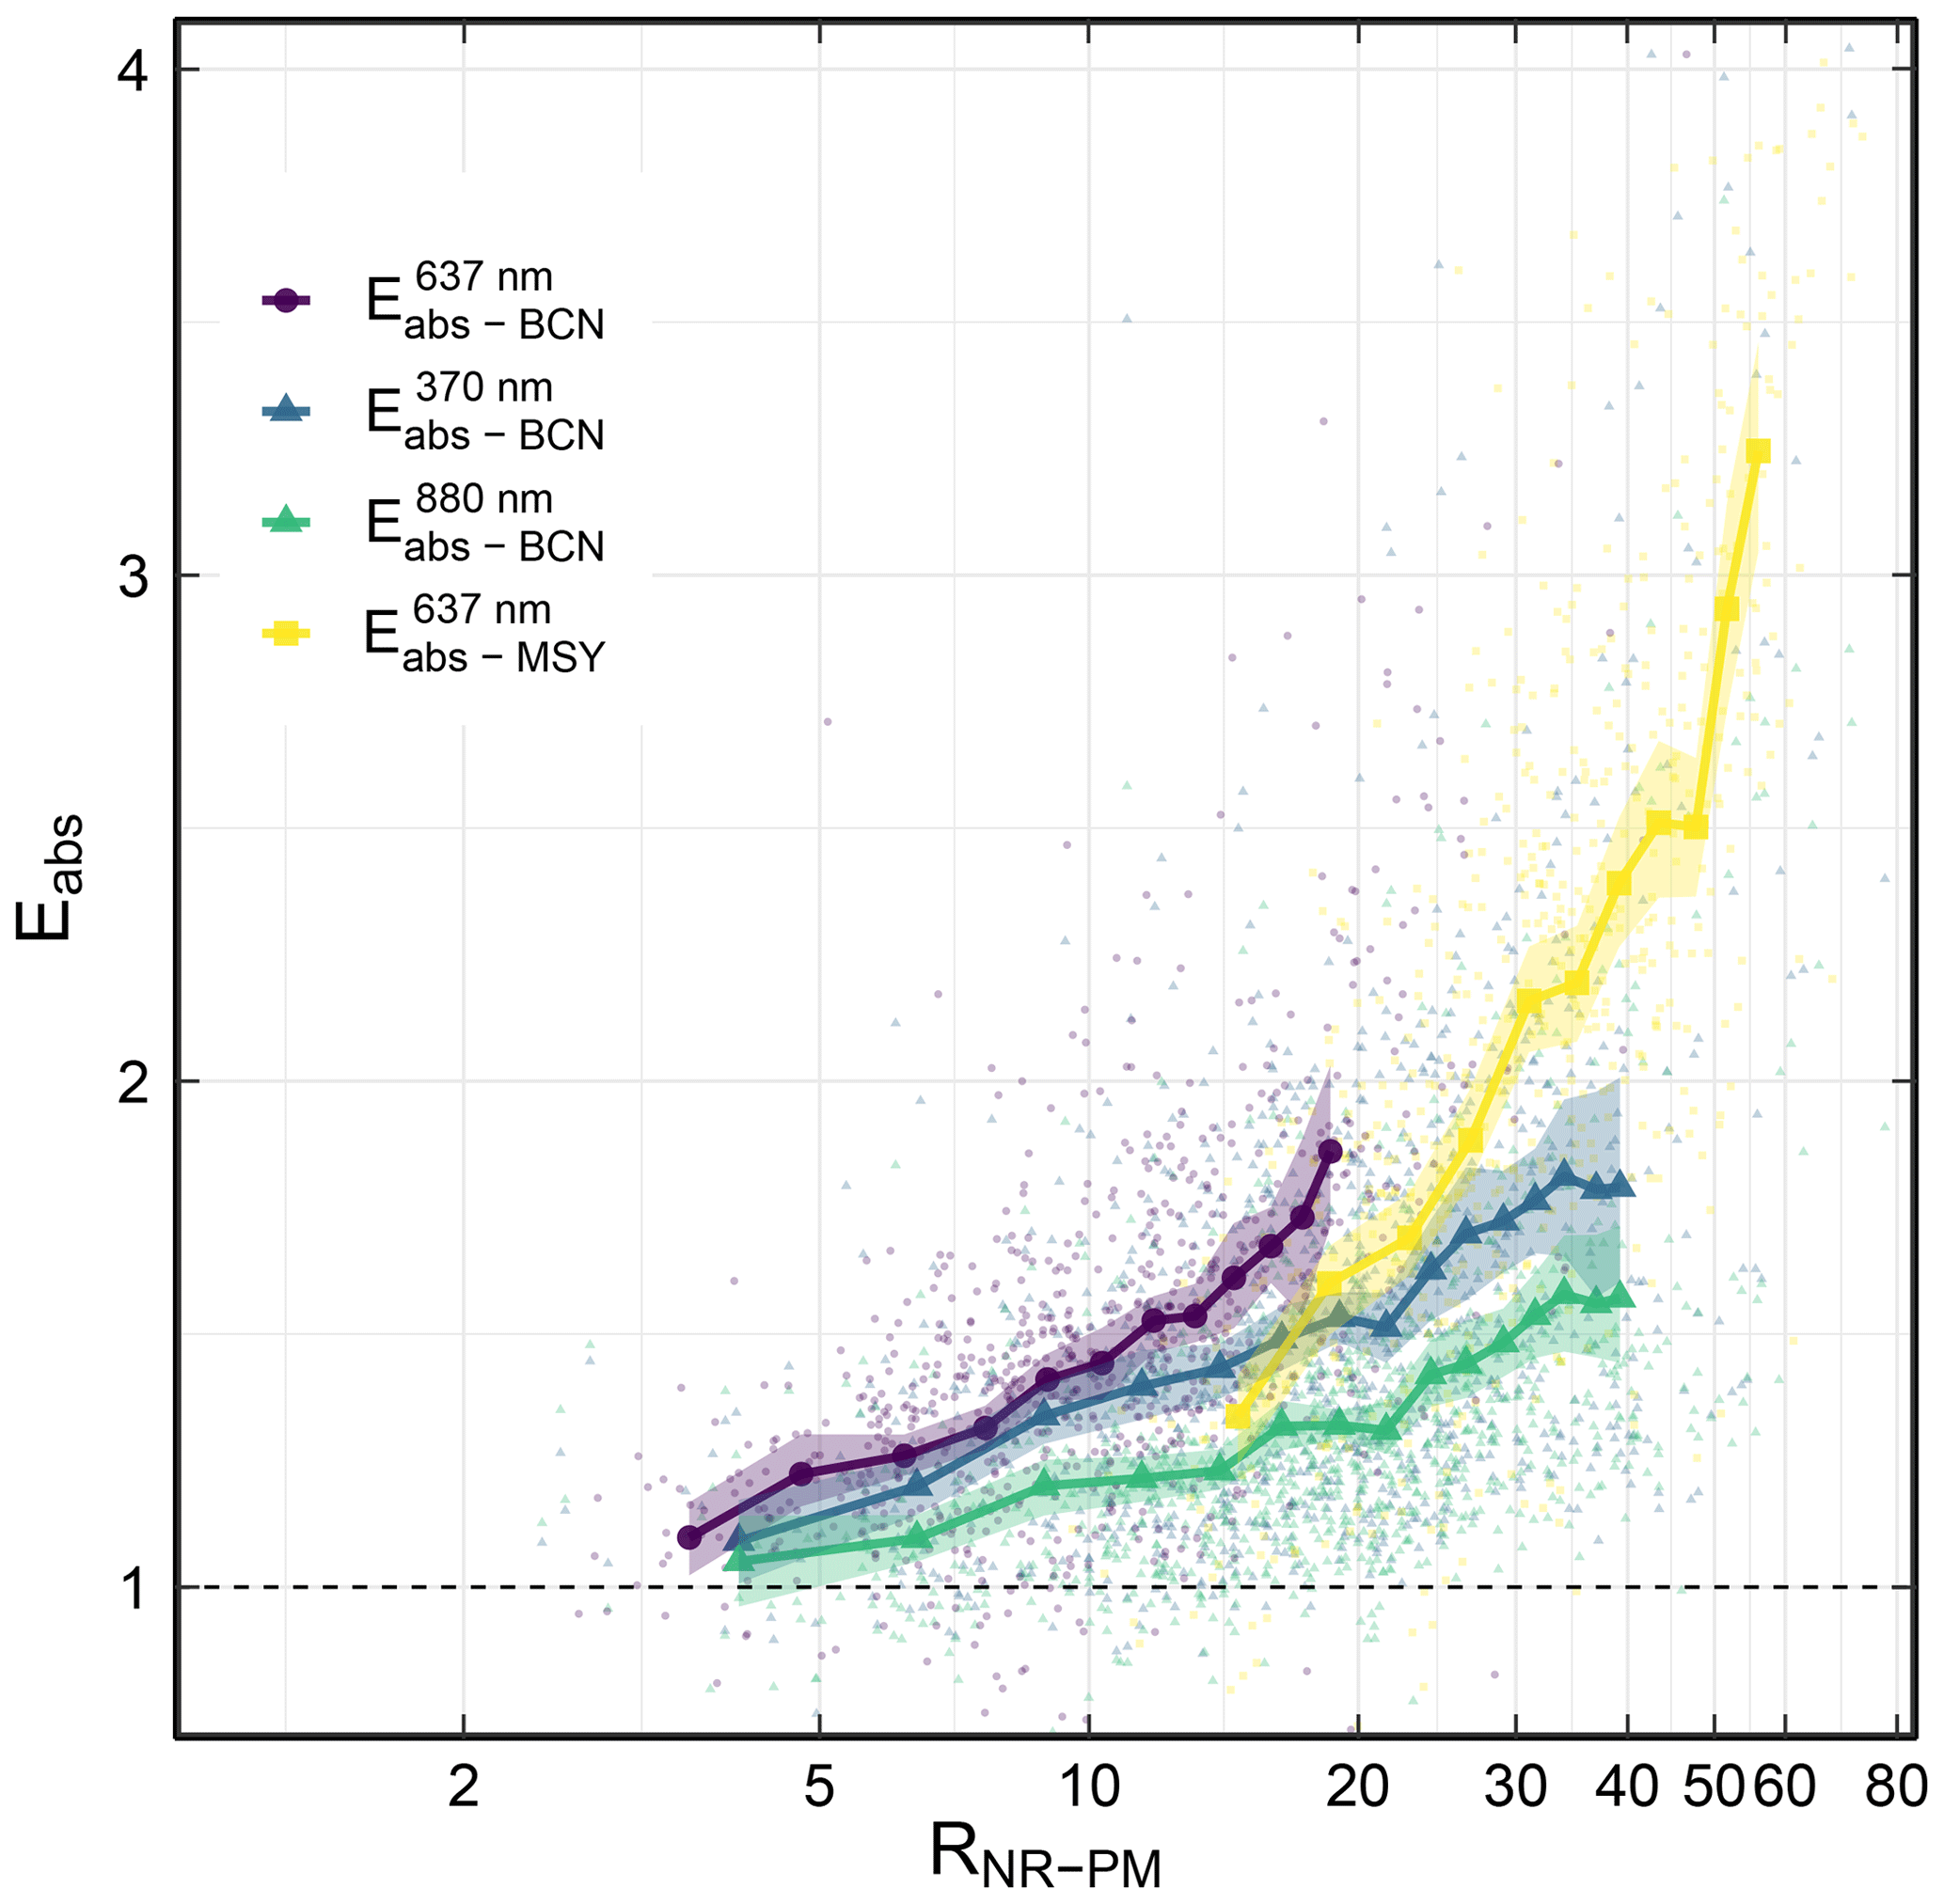
Figure 3Absorption enhancement (Eabs) as a function of the NR-PM to EC ratio at the Barcelona (BCN) and Montseny (MSY) stations. The offline Eabs measurements with a PM10 inlet at 637 nm were used for both BCN and MSY. Also, at BCN, online Eabs measurements with a PM2.5 inlet at the short UV (370 nm) and NIR (880 nm) wavelengths were used. The scatter points represent all the measurements, whereas the marked points show the mean of each bin, whilst the shadow of the line represents the standard deviation of each bin.
Figure 3 shows Eabs values as a function of RNR-PM at BCN (online and offline) and MSY (offline). Overall, we observed an exponential increase of Eabs with the amount of NR-PM coating material available for mixing (Fig. 3), which was consistent with some of the observed behaviour found in the literature (e.g. Fig. 1 in Cappa et al., 2019).
As shown in Fig. 3, the RNR-PM binned values from offline measurements at MSY spanned from around 15 up to around 55 µg m−3, whereas RNR-PM values were between around 3.5 and 20 µg m−3 in BCN. As a consequence, Eabs at MSY reached values up to around 3.25, whereas Eabs values remained lower than 2 in BCN. Thus, the higher RNR-PM at MSY implied that more material was available for BC coating at the regional site compared to BCN, thus leading to higher Eabs at MSY. Moreover, the lowest Eabs at MSY from binned data in Fig. 3 was around 1.3 indicating that on average BC particles reaching the MSY station have undergone longer ageing processes and were already coated, whereas in BCN, freshly emitted still-not-mixed BC particles were frequently measured, as denoted by Eabs values closer to 1. For the online measurements in BCN, RNR-PM showed a larger range of values (from around 4 to 40 µg m−3) compared to the offline measurements because of the higher time resolution of online measurements, allowing measuring events characterized by lower or higher RNR-PM compared to the 24 h offline measurements. The higher Eabs in BCN at 637 nm compared to Eabs at 370 nm was mostly associated with the different inlet cut-off sizes and, to a lesser extent, with the different periods used for the online and offline measurements. In fact, as shown in Fig. S12, the mean Eabs calculated from offline measurements in BCN, using the same period as for the online measurements (2018), was closer, but higher nevertheless, to the Eabs values obtained from online measurements at 880 and 370 nm. As shown in Fig. 3, the Eabs values from the online and offline datasets in BCN showed similar trends for smaller concentrations of RNR-PM. However, as the amount of mixing material increased, the offline method increased at a higher rate, reaching higher values for the largest RNR-PM measurements. This behaviour was also observed when only the 2018 period was used for the calculation of Eabs from offline measurements (cf. Fig. S12). These different trends between online and offline Eabs versus RNR-PM were probably due to two main factors: first, the offline measurements were made with a PM10 inlet versus the PM2.5 inlet of the online method (Fig. S1 in the Supplement), hence coarse nitrates and other coarse particles could have influenced Eabs, and, second, the large annual variability observed for the offline Eabs measurements (see Fig. S12) could have also contributed to the observed difference.
The availability of multi-wavelength Eabs values at the BCN station allowed a multi-wavelength analysis of Eabs versus RNR-PM. Since Eabs at 880 nm is influenced solely by the internal mixing of BC particles, the comparison of Eabs at 880 and 370 nm, when the external mixing influence on the absorption is the highest, showcased the influence that the mixing state had on the relationship between Eabs and RNR-PM. Figure 3 shows similar values for both wavelengths for the lowest amount of coating material, but as RNR-PM increased, the Eabs at 370 nm increased more rapidly than at 880 nm, mostly due to the fact that as RNR-PM increases, the contribution of externally mixed BrC becomes larger.
If a theoretical MAC reference was used instead, the Eabs values as a function of RNR-PM at BCN (online and offline) and MSY (offline) showed the same relationship (Fig. S13), albeit larger values were observed, especially for the AE33 measurements. These larger values were mostly due to the fact that the experimentally used MAC was higher than the theoretical ones (Fig. S6), resulting in larger Eabs values (Fig. S13).
3.3 Aerosol sources contribution to Eabs
The material available for coating on BC particles, which determines its Eabs properties (see Fig. 3), is formed by an array of different chemical compounds from different sources as a result of a succession of physical and chemical processes in the atmosphere. These different chemical compounds can exert different responses on Eabs (e.g. Zhang et al., 2018) and can increase the BC Eabs, depending on their relative amount compared to BC as shown in Fig. 3 and the literature (Zhang et al., 2018; Cappa et al., 2019, and therein).
Table 3Multivariate linear regression (mlr) analysis coefficients and standard deviation of the chemical fraction influence on the absorption enhancement, Eabs, for Barcelona at both 370 and 880 nm wavelengths using the Q-ACSM chemical sources (Via et al., 2021).
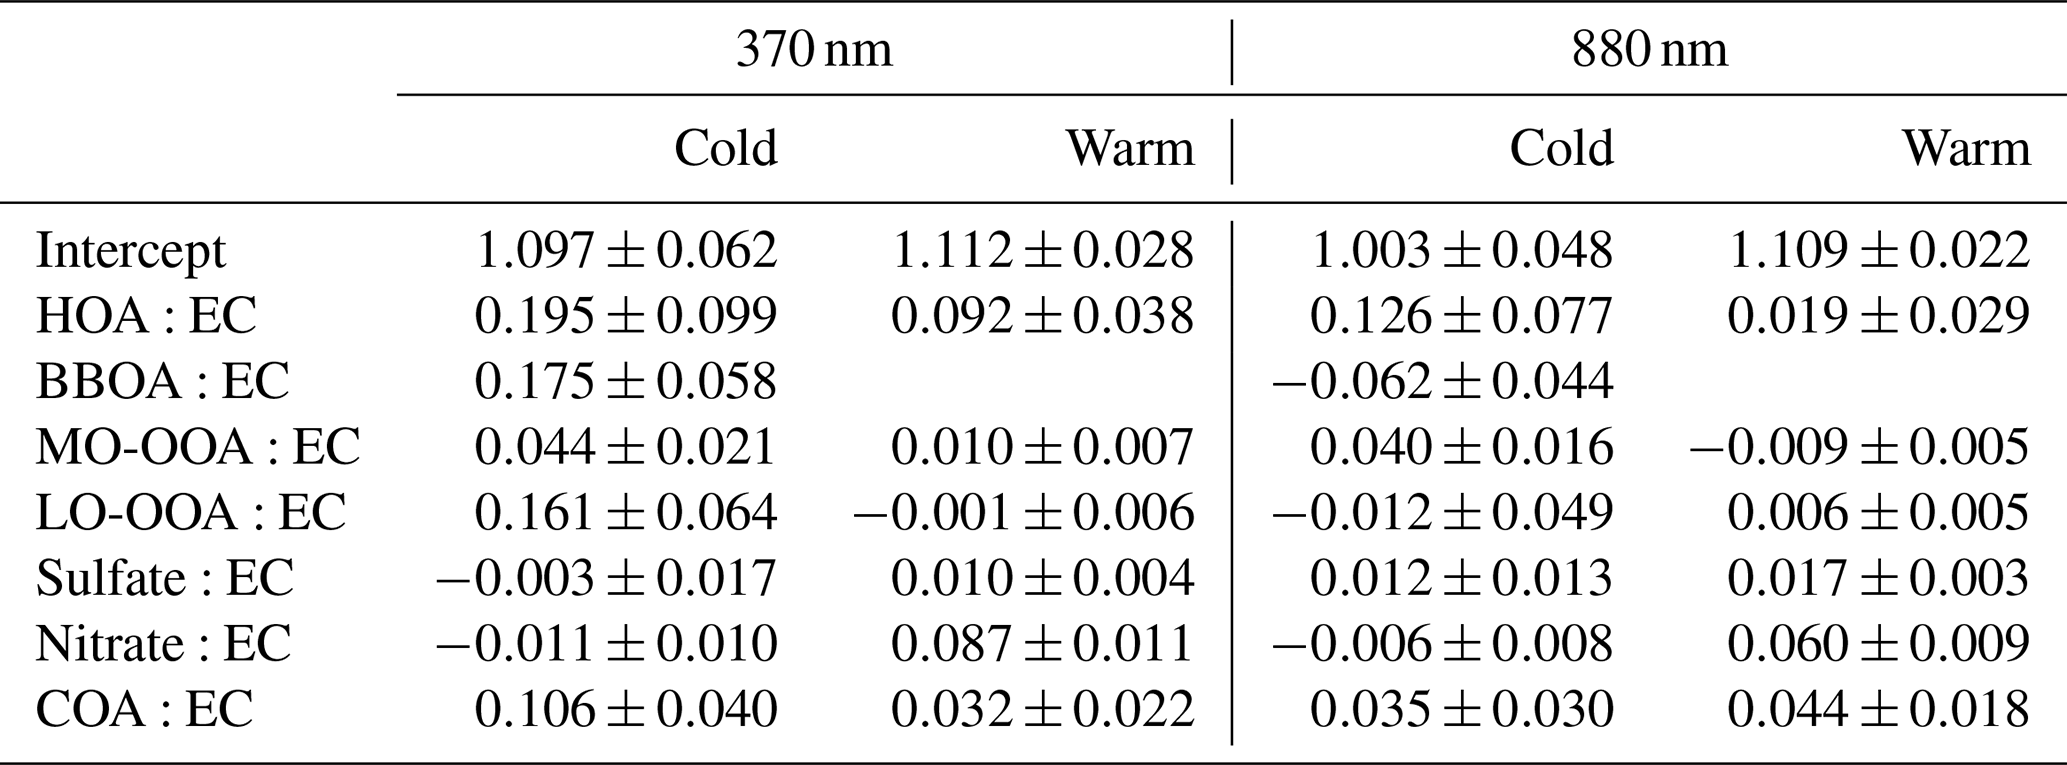
Here we analysed the contribution of different OA sources and chemical species, such as sulfate and nitrate, to Eabs calculated in BCN from online measurements via a mlr analysis. The OA sources were obtained by means of a PMF analysis on the Q-ACSM data in BCN and were published by Via et al. (2021). Given the differences in the seasonality that the OA sources can present, as also observed in BCN (cf. Fig. S9; Minguillón et al., 2015; Via et al., 2021), and given the observed Eabs seasonality (Fig. 2), we applied the mlr analysis separately to the warm and cold seasons. Furthermore, in order to separate the contribution of the different BC mixing states, we performed the mlr analyses at the same wavelengths as in Sect. 3.2, namely at 370 and 880 nm.
The results of the mlr analysis were reported in Table 3. Table 3 shows that overall, regardless of the season and the wavelength considered, the main contributors to Eabs in BCN were HOA (associated with the emissions from traffic), and COA (emissions related to cooking). These two sources contributed 12 % and 14 %, respectively, to the measured OA mass concentration (Via et al., 2021). Thus, in BCN, HOA and COA increased Eabs both by contributing to the BC coating (880 nm) and by acting as BrC species externally mixed with BC (370 nm), as suggested by the higher coefficients observed for these two OA sources at 370 nm compared to 880 nm (cf. Table 3). A major source of BC in BCN was traffic (Pandolfi et al., 2016; Via et al., 2021), thus likely explaining the high potential of HOA particles that contribute to Eabs. Moreover, some recent studies have also shown that HOA particles in urban environments can potentially have a high absorption efficiency in the UV–VIS range (Qin et al., 2018; Chen et al., 2020; Kasthuriarachchi et al., 2020). Regarding the COA particles, some studies have shown that this OA source has a lower absorption efficiency compared to HOA particles (e.g. Qin et al., 2018; Kasthuriarachchi et al., 2020; Chen et al., 2020). This was in agreement with the lower coefficients observed for COA compared to HOA (Table 3). In addition, during the cold season, both BBOA and LO-OOA presented large positive contributions to Eabs at 370 nm, whereas the contribution to Eabs from these two sources was negative at 880 nm. For the warm season, the contribution of LO-OOA was also very low at 880 nm and negative at 370 nm, whereas BBOA did not contribute in summer, as already stated. Zhang et al. (2018) also found a negative contribution to Eabs for BBOA at 880 nm. The higher coefficients observed for these sources (HOA, COA, BBOA, and LO-OOA) at 370 nm compared to 880 nm highlighted the potential of these OA sources to act as BrC species externally mixed with BC. The MO-OOA particles also contributed positively to Eabs at both 370 and 880 nm, especially during the cold season, likely due to the higher-relative contribution of MO-OOA to OA observed in this season compared to the warm season (Via et al., 2021). Recently, Kasthuriarachchi et al. (2020) reported higher absorption efficiency in the UV–VIS range for LO-OOA particles compared to MO-OOA particles, likely due to the photodegradation chemistry (photobleaching) of BrC chromophores in this aged MO-OOA fraction. The inorganic aerosol components presented a higher variability with regards to their contribution to Eabs, with sulfates, and especially nitrates, becoming an important source of coating during the warm season, whilst presenting a low impact during the colder season.

Figure 4Contribution to the absorption enhancement, Eabs, as a function of the amount of coating material RNR-PM for the different organic and inorganic sources found in BCN during the cold season (a, c) and warm season (b, d) for 370 (a, b) and 880 nm (c, d). The contribution for each source was computed by applying the coefficient obtained with the mlr analysis (see Table 3) to the ratio that compound-to-EC had as RNR-PM increased. It should be noted that for each season and wavelength, we have set the corresponding intercept of the mlr analysis as reference value above/below in which each compound presented a positive/negative influence on Eabs.
Figure 4 shows the contribution to Eabs from the OA sources and inorganic species included in the mlr analysis as RNR-PM increases. The contributions to Eabs reported in Fig. 4 were calculated as the product between the OA sources and inorganic species mass concentrations (provided by Via et al., 2021) to EC ratios and the coefficients reported in Table 3. As shown in Fig. 4, during the cold season in BCN the absolute contribution of OA to Eabs was much higher compared to the contribution from inorganic aerosols (nitrates and sulfates here) at both 370 and 880 nm (Fig. 4a, c). The HOA and MO-OOA were the major sources contributing to the lensing-driven absolute BC Eabs at 880 nm in BCN during the cold season. Conversely, the absolute contribution of LO-OOA and COA to Eabs was the highest at 370 nm, suggesting their importance as a BrC source in the area under study. During the warm season, as already noted, Eabs was lower compared to the cold season. The major difference compared with the cold season was that the contribution of SIAs increased. The contribution of sulfates at 880 nm as BC lensing-driving species was notable. Furthermore, Fig. 4 also shows that when the contributions were negative, these did not have a large effect on the overall Eabs.
3.4 Atmospheric ageing influence on Eabs
Atmospheric ageing and oxidation of OA particles have been shown to have an important effect on the Eabs (e.g. Liu et al., 2015; Zhang et al., 2018; Xu et al., 2018; Wu et al., 2018). Indeed, we have shown that the SOAs (LO-OOA + MO-OOA) were the main contributors to Eabs during the cold season (Table 3 and Fig. 4).
Here we studied the behaviour of Eabs with the ageing state of the aerosols. With this aim, we followed the visual method proposed by Ng et al. (2010) to characterize the ageing state of the particles, the so-called triangular plot, where the y axis shows the f44 factor ( 44 to total concentration in the ACSM component mass spectra ratio), which is a proxy of the ageing, and the x axis is the f43 factor ( 43 to total concentration in the component mass spectra ratio), which shows the differences in the sources and chemical pathways for the OOA formation. As particles become more oxidized, they converge towards higher f44 values and lower f43 values.
As observed in Table 3 and Fig. 4, overall primary sources such as HOA, COA, and BBOA were important drivers of Eabs, although SOA sources, especially during the cold season and for the shorter wavelengths, were also important sources contributing to Eabs. Figure 5 shows the f44–f43 relationship in BCN as a function of both Eabs values at 880 nm, where Eabs is driven by the lensing effect, and the SOA:POA ratio. Figure 5 shows a clear separation of the f44–f43 relationship between the cold and warm seasons. In fact, during the cold season at 880 nm, as aerosols become more oxidized (higher f44), the SOA:POA ratio increased altogether with an increase of Eabs. Conversely, during the warm season, although the SOA:POA ratio also increased with the degree of oxidation, Eabs did not increase significantly. Therefore, during the cold season as particles became more oxidized, BC particles internally mixed with SOA (mainly MO-OOA as shown in Fig. 4c) were the main sources responsible for the larger Eabs values, whereas during the warm season, since the main drivers of Eabs were the inorganic compounds (Fig. 4d) higher f44 values did not imply an increase in Eabs. Furthermore, Eabs at 370 nm (see Fig. S14) during the cold season showed a more pronounced increase as particles became more oxidized, mainly due to the role of externally mixed BrC, which, as reported in Fig. 4, were the main contributors to Eabs. Figure S14 showed that Eabs at 370 nm during the warmer period presented a slight increase as particles became oxidized, which could be attributed to the small contribution that MO-OOA particles exerted during this period (see Fig. 4b). This tendency toward higher Eabs values as particles become more oxidized has also been found in Paris by Zhang et al. (2018), and in London by Liu et al. (2015).
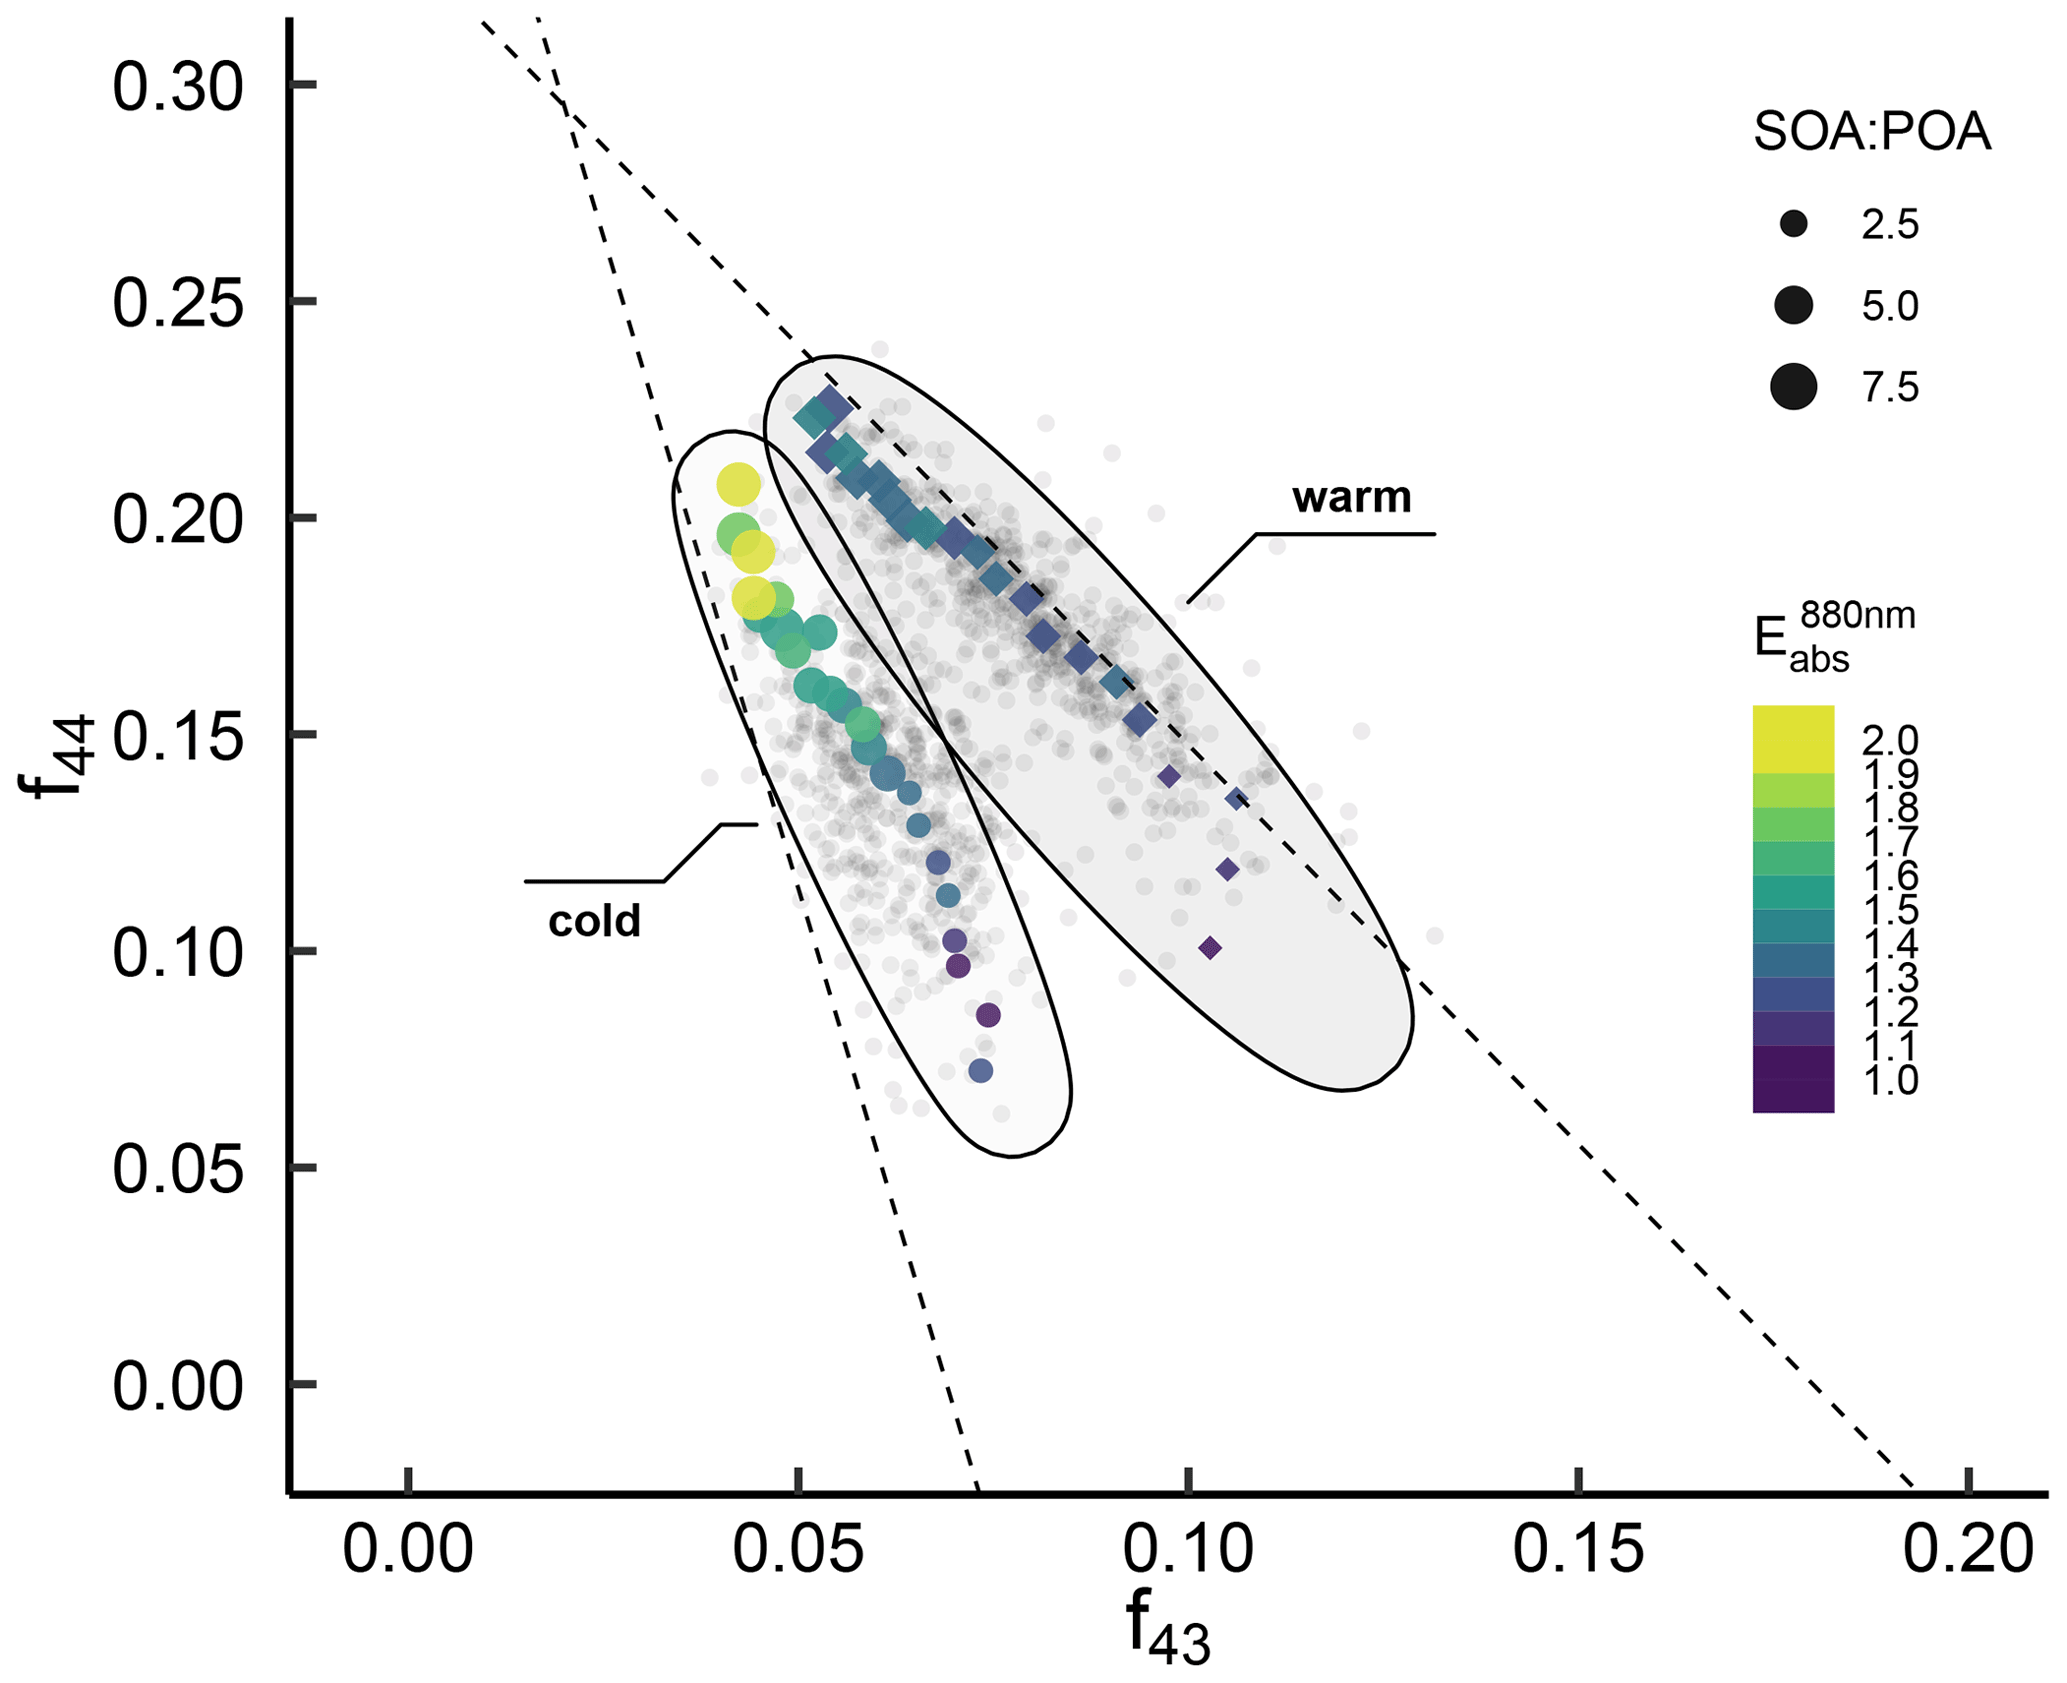
Figure 5Absorption enhancement, Eabs, at 880 nm in BCN using online measurements as a function of the primary to secondary organic aerosol ratio (SOA:POA), and the atmospheric ageing (following Ng et al. (2010) proposed triangle plot, f44 vs f43). The f44 and f43 factors used are the ones presented by Via et al. (2021) for the same time period from the Q-ACSM measurements.
3.5 Eabs trend analysis
As already stated, the average Eabs values obtained by the offline method in BCN and MSY at 637 nm were within the values found in the literature for similar urban/regional background stations. Given the impact that Eabs of BC particles has on climate, we performed a seasonal trend analysis of Eabs at both BCN (from 2011 to 2020), and MSY (from 2010 to 2020). In this trend analysis, as well as for the other results presented in this work, we excluded the days when Saharan dust outbreaks influenced the measurements to avoid UV absorption by dust in the analyses presented. Moreover, as already stated, the trend analysis was performed on Eabs calculated at 637 nm, where the contribution to Eabs from externally mixed OA was less relevant.
The method employed for the trend analysis was a Theil–Sen slope regression estimator. Previous studies performed at the MSY and BCN stations have shown statistically significant (s.s.) decreasing trends over time for the contributions from various anthropogenic sources, including traffic, industry, heavy-oil combustion, secondary sulfate and secondary nitrates mirroring the success of mitigation strategies adopted in Europe (Pandolfi et al., 2016; Veld et al., 2021). Moreover, recently Veld et al. (2021) have shown that the observed decreasing trends, in combination with the absence of a trend for OAs at both BCN and MSY stations, resulted in an increase in the relative proportion of OA in PM at these stations, and especially for SOA, which presents the higher values during the summer season.
The Eabs trends showed different behaviours during the spring–summer and autumn–winter seasons at the two urban and background stations considered here (Fig. 6). Figure 6 shows a s.s. increase of Eabs at the MSY station in summer (JJA), whereas no s.s. trends were observed in MSY during the other seasons. In BCN, the Eabs trends were not s.s. during all the seasons. During autumn (SON) and winter (DJF), Eabs showed a slight decrease at both stations although not s.s. The Eabs s.s. increase of a 8.16 % yr−1 during summer in MSY was linked to the observed increase of the OC:EC ratio (cf. Fig. S15), thus further confirming the importance of OA particles to form internal mixing with BC particles, thus increasing the Eabs. Conversely, the sulfate:EC ratio (Fig. S16) did not show any seasonal s.s. trend at both sites, mostly because both sulfate and EC concentrations decreased during the period under study (cf. Pandolfi et al., 2016; Veld et al., 2021). The observed OC:EC ratio increase at the MSY station in summer was mainly driven by the increase in the relative proportion of SOA particles as shown in Veld et al. (2021). We have shown here that as the aerosols become more oxidized, the SOA:POA ratio increased together with Eabs and the OC:EC s.s. trend observed further confirmed the importance of aged OA particles to form BC coating. In the case that the theoretical MAC was used as a reference (Bond and Bergstrom, 2006), Eabs showed the same behaviour with an increase at the regional station, MSY, during the summer months (Fig. S17).
During spring (MAM) of 2020, there was a notable Eabs increase at both stations, especially in BCN. During this period, a strict lockdown was established in Spain due to restrictions under the COVID-19 pandemic. The strict lockdown measures implied a significant decrease in the emission of BC and primary aerosols due to the orders to halt any non-essential activity (Tobías et al., 2020; Evangeliou et al., 2021; Querol et al., 2021). This decrease in the primary emissions resulted in an increase in the OC:EC ratio, as can be appreciated in Fig. S15a, which can be associated with an increase in Eabs.
The observed changing behaviour of Eabs under different SOA:POA ratios suggested that Eabs may undertake changes, and possibly an increase, upon new emission restrictions. In fact, as already stated and as shown in Veld et al. (2021), an increase in the relative proportion of OA in PM2.5 was observed at both BCN and MSY stations, and this relative increase was mostly due to SOA. Thus, based on our results, future increases of the SOA:POA ratio could cause an increase in Eabs.

Figure 6Absorption enhancement, Eabs, at 637 nm seasonal trend analysis between 2011 and 2020 at the (a) Barcelona and (b) Montseny station. The trend analysis was performed using a Theil–Sen function over the Eabs offline measurements.
Here we have presented the results of the analysis of the absorption enhancement analysis, Eabs, performed in the Barcelona (BCN, urban background) and Montseny (MSY, regional background) stations in the Mediterranean basin. We studied the main characteristics of Eabs and its dependence on other chemical compounds using both an intensive online measurement period in BCN (2018), and a decade-long offline dataset (2010–2020) available at both the BCN and MSY stations. The online approach consisted of co-located measurements at BCN of multi-wavelength absorption coefficients with an Aethalometer (AE33), OC:EC analysis through a semi-continuous Sunset analyser, and NR fine aerosol speciation and source apportionment with Q-ACSM. The offline method consisted of comparing the MAAP absorption coefficient measurements (at 637 nm) with 24 h offline OC:EC measurements performed via a thermal–optical carbon analyser, Sunset, following the EUSAAR2 protocol.
We calculated Eabs as the ratio between the ambient MAC obtained from the measurements and the reference MAC value for pure BC particles. We have used two distinct reference MAC values: one based on an experimental site-specific MAC for pure BC, and a theoretical value from Bond and Bergstrom (2006). Using the site-specific reference MAC value, we reported Eabs values of 1.28±0.36, and 1.45±0.51 for the online measurements in BCN at 880 and 370 nm, respectively, and of 1.42±0.40 and 1.87±0.63 for the offline analysis in BCN and MSY at 637 nm, respectively. The Eabs values reported in this work fall within the measured values reported in the literature (Liu et al., 2015; Zhang et al., 2018; Cappa et al., 2019). Moreover, our analysis confirmed the importance of OA particles as species that can increase Eabs when these are both internally and externally mixed with BC particles, as also reported in Zhang et al. (2018) for the Paris area (France).
Here we showed that the seasonal behaviour of Eabs was a strong function of the wavelength used. In BCN we observed an increase of Eabs at the short UV wavelengths during the cold season and we related the observed increase to the presence of BrC particles externally mixed with BC particles. Conversely, in the red and NIR spectral range, the Eabs variations were smaller. The relative contribution of BrC to the Eabs increased from 4.6 % during the warm season up to 20.3 % during the cold season, as expected due to the increase in the biomass burning activities during winter. The Eabs in MSY at 637 nm showed an increase during the warm season, mainly associated with the larger contribution of SOAs affecting the regional station due to the larger emission of biogenic precursors in summer.
In this study we performed an analysis on the influence of the amount of material available for BC coating exerted on Eabs. We showed, in agreement with some prior studies, an exponential growth of Eabs with the amount of NR aerosols. Thus, at the regional site, where the amount of material available for mixing reached higher values, so did the Eabs values. Moreover, when evaluating the different wavelengths for the online measurements, we obtained higher values for the short UV wavelength (370 nm), in comparison with the NIR wavelengths (880 nm), which were associated with the presence of externally mixed BrC increasing the absorption at the shorter wavelengths.
The ageing state influence on Eabs was examined using the triangular plot proposed by Ng et al. (2010) by means of the f44 and f43 factors derived from the Q-ACSM source analysis for online measurements at the BCN station. We observed larger Eabs values for more aged OAs, especially during the cold season, which was also related to a larger SOA:POA ratio.
The long database of offline filter and MAAP measurements at both the BCN and MSY stations allowed for a decade-long seasonal trend analysis of Eabs. Overall, no s.s. trends were observed at both stations. The exception, however, was the summer period at the MSY regional station where a s.s. increasing trend of 8.16 % yr−1 was observed for Eabs. This increase of Eabs in MSY in summer was mainly driven by a corresponding s.s. increase of the OC:EC ratio. A previous study recently performed in the area under study, reported an increasing trend of the relative contribution of OA to PM and of SOA to OA over time at the MSY regional station. Moreover, our analysis confirmed the importance of OA, and mostly of SOA, in contributing to the BC Eabs. Furthermore, at both BCN and MSY stations the forced COVID-19 lockdown in spring 2020 implied a sharp increase of Eabs, mainly associated with the increase in the OC:EC ratio for this period due to the large reduction of anthropogenic emissions, and especially of BC particles, in the BCN urban environment. The observed s.s. increasing trend of Eabs at the MSY station in summer, driven by a corresponding increase in the OC:EC ratio, suggested that Eabs could further increase during summer in the future due to the application of more restrictive measurements to reduce anthropogenic pollutant emissions. Thus, the higher absorption efficiency presented by the positive Eabs trend offsets, to some extent, the reduction of the absorption, would be associated with the decreasing trend of BC particles concentrations.
The Montseny datasets used for this publication are accessible online on the WDCA (World Data Centre for Aerosols) web page (http://ebas.nilu.no, last access: 29 June 2022) and at ACTRIS (https://actris.nilu.no/Data/?key=fa6cd01674284c04bb8736bd5aca0030, Pandolfi al., 2022). The Barcelona datasets were collected within different national and regional projects and/or agreements and are available upon request. The code used for analysis can be obtained upon request to the corresponding author.
The supplement related to this article is available online at: https://doi.org/10.5194/acp-22-8439-2022-supplement.
AA, MCM, AK, NP, CR, MP, MV, and JYD carried out the maintenance and supervision of the instrumentation at the BCN and MSY sites. AA, XQ, MCM, and MP helped in the processes of shaping the manuscript structure as well as with the data analysis. MV and MCM performed the analysis of the Q-ACSM data, and AK performed the measurements of OC and EC both online and offline. MI and MR provided support with the AE33 measurements. JYD processed and merged the different datasets, analysed the results, and summarized and expressed them in this article. All authors provided advice regarding the structure and content as well as contributed to the writing of the final manuscript.
At the time of the research, Martin Rigler and Matic Ivančič were also employed by the manufacturer of the Aethalometer AE33.
Publisher’s note: Copernicus Publications remains neutral with regard to jurisdictional claims in published maps and institutional affiliations.
We acknowledge support of the COST Action CA16109 COLOSSAL. IDAEA-CSIC is a Centre of Excellence Severo Ochoa (Spanish Ministry of Science and Innovation, grant no. CEX2018-000794-S). We would like to thank the Parc Natural i Reserva de la Biosfera del Montseny and the Diputació de Barcelona for the possibility of maintaining the regional background measurement station.
This research has been supported by the Ministerio de Asuntos Económicos y Transformación Digital, Gobierno de España (CAIAC project (grant no. PID2019-108990PB-100)), FEDER funds (grant no. EQC2018-004598-P), the Agència de Gestió d'Ajuts Universitaris i de Recerca (grant no. AGAUR 2017 SGR41), the European Commission, Horizon 2020 Framework Programme (ACTRIS IMP (grant no. 871115)), and the Ministerio de Ciencia e Innovación (grant no. CEX2018-000794-S).
The article processing charges for this open-access publication were covered by the CSIC Open Access Publication Support Initiative through its Unit of Information Resources for Research (URICI).
This paper was edited by Guangjie Zheng and reviewed by two anonymous referees.
Allan, J. D., Delia, A. E., Coe, H., Bower, K. N., Alfarra, M. R., Jimenez, J. L., Middlebrook, A. M., Drewnick, F., Onasch, T. B., Canagaratna, M. R., Jayne, J. T., and Worsnop, D. R.: A generalised method for the extraction of chemically resolved mass spectra from Aerodyne aerosol mass spectrometer data, J. Aerosol Sci., 35, 909–922, https://doi.org/10.1016/j.jaerosci.2004.02.007, 2004. a
Andreae, M. O. and Gelencsér, A.: Black carbon or brown carbon? The nature of light-absorbing carbonaceous aerosols, Atmos. Chem. Phys., 6, 3131–3148, https://doi.org/10.5194/acp-6-3131-2006, 2006. a
Bond, T. C. and Bergstrom, R. W.: Light absorption by carbonaceous particles: An investigative review, Aerosol Sci. Tech., 40, 27–67, https://doi.org/10.1080/02786820500421521, 2006. a, b, c, d, e, f, g, h, i
Bond, T. C., Doherty, S. J., Fahey, D. W., Forster, P. M., Berntsen, T., Deangelo, B. J., Flanner, M. G., Ghan, S., Kärcher, B., Koch, D., Kinne, S., Kondo, Y., Quinn, P. K., Sarofim, M. C., Schultz, M. G., Schulz, M., Venkataraman, C., Zhang, H., Zhang, S., Bellouin, N., Guttikunda, S. K., Hopke, P. K., Jacobson, M. Z., Kaiser, J. W., Klimont, Z., Lohmann, U., Schwarz, J. P., Shindell, D., Storelvmo, T., Warren, S. G., and Zender, C. S.: Bounding the role of black carbon in the climate system: A scientific assessment, J. Geophys. Res.-Atmos., 118, 5380–5552, 2013. a, b, c
Brean, J., Beddows, D. C. S., Shi, Z., Temime-Roussel, B., Marchand, N., Querol, X., Alastuey, A., Minguillón, M. C., and Harrison, R. M.: Molecular insights into new particle formation in Barcelona, Spain, Atmos. Chem. Phys., 20, 10029–10045, https://doi.org/10.5194/acp-20-10029-2020, 2020. a
Brines, M., Dall'Osto, M., Beddows, D. C. S., Harrison, R. M., and Querol, X.: Simplifying aerosol size distributions modes simultaneously detected at four monitoring sites during SAPUSS, Atmos. Chem. Phys., 14, 2973–2986, https://doi.org/10.5194/acp-14-2973-2014, 2014. a
Brines, M., Dall'Osto, M., Beddows, D. C. S., Harrison, R. M., Gómez-Moreno, F., Núñez, L., Artíñano, B., Costabile, F., Gobbi, G. P., Salimi, F., Morawska, L., Sioutas, C., and Querol, X.: Traffic and nucleation events as main sources of ultrafine particles in high-insolation developed world cities, Atmos. Chem. Phys., 15, 5929–5945, https://doi.org/10.5194/acp-15-5929-2015, 2015. a
Cappa, C. D., Onasch, T. B., Massoli, P., Worsnop, D. R., Bates, T. S., Cross, E. S., Davidovits, P., Hakala, J., Hayden, K. L., Jobson, B. T., Kolesar, K. R., Lack, D. A., Lerner, B. M., Li, S. M., Mellon, D., Nuaaman, I., Olfert, J. S., Petäjä, T., Quinn, P. K., Song, C., Subramanian, R., Williams, E. J., and Zaveri, R. A.: Radiative absorption enhancements due to the mixing state of atmospheric black carbon, Science, 337, 1078–1081, https://doi.org/10.1126/science.1223447, 2012. a, b, c
Cappa, C. D., Zhang, X., Russell, L. M., Collier, S., Lee, A. K., Chen, C. L., Betha, R., Chen, S., Liu, J., Price, D. J., Sanchez, K. J., McMeeking, G. R., Williams, L. R., Onasch, T. B., Worsnop, D. R., Abbatt, J., and Zhang, Q.: Light Absorption by Ambient Black and Brown Carbon and its Dependence on Black Carbon Coating State for Two California, USA, Cities in Winter and Summer, J. Geophys. Res.-Atmos., 124, 1550–1577, https://doi.org/10.1029/2018JD029501, 2019. a, b, c, d, e, f, g, h
Cavalli, F., Viana, M., Yttri, K. E., Genberg, J., and Putaud, J.-P.: Toward a standardised thermal-optical protocol for measuring atmospheric organic and elemental carbon: the EUSAAR protocol, Atmos. Meas. Tech., 3, 79–89, https://doi.org/10.5194/amt-3-79-2010, 2010. a
Chen, B., Bai, Z., Cui, X., Chen, J., Andersson, A., and Gustafsson, Ö.: Light absorption enhancement of black carbon from urban haze in Northern China winter, Environ. Pollut., 221, 418–426, https://doi.org/10.1016/j.envpol.2016.12.004, 2017. a
Chen, Y., Xie, X., Shi, Z., Li, Y., Gai, X., Wang, J., Li, H., Wu, Y., Zhao, X., Chen, M., and Ge, X.: Brown carbon in atmospheric fine particles in Yangzhou, China: Light absorption properties and source apportionment, Atmos. Res., 244, 105028, https://doi.org/10.1016/j.atmosres.2020.105028, 2020. a, b
City council of Barcelona: Volum de trànsit (Intensitat mitjana diària de vehicles en dia feiner) a les principals vies. 2014–2018, https://www.bcn.cat/estadistica/catala/dades/anuaris/anuari19/cap15/C1511010.htm, last access: 6 May 2021. a
Cui, X., Wang, X., Yang, L., Chen, B., Chen, J., Andersson, A., and Gustafsson, Ö.: Radiative absorption enhancement from coatings on black carbon aerosols, Sci. Total Environ., 551–552, 51–56, https://doi.org/10.1016/j.scitotenv.2016.02.026, 2016. a
Dayan, U., Ricaud, P., Zbinden, R., and Dulac, F.: Atmospheric pollution over the eastern Mediterranean during summer – a review, Atmos. Chem. Phys., 17, 13233–13263, https://doi.org/10.5194/acp-17-13233-2017, 2017. a
Drinovec, L., Močnik, G., Zotter, P., Prévôt, A. S. H., Ruckstuhl, C., Coz, E., Rupakheti, M., Sciare, J., Müller, T., Wiedensohler, A., and Hansen, A. D. A.: The “dual-spot” Aethalometer: an improved measurement of aerosol black carbon with real-time loading compensation, Atmos. Meas. Tech., 8, 1965–1979, https://doi.org/10.5194/amt-8-1965-2015, 2015. a, b
Ealo, M., Alastuey, A., Pérez, N., Ripoll, A., Querol, X., and Pandolfi, M.: Impact of aerosol particle sources on optical properties in urban, regional and remote areas in the north-western Mediterranean, Atmos. Chem. Phys., 18, 1149–1169, https://doi.org/10.5194/acp-18-1149-2018, 2018. a
European Commission: Establishing guidelines for demonstration and subtraction of exceedances attributable to natu- ral sources under the Directive 2008/50/EC on ambient air quality and cleaner air for Europe, SEC(2011) 208 final, Brussels, 15 February 2011, http://ec.europa.eu/environment/air/quality/legislation/pdf/sec_2011_0208.pdf (last access: 1 July 2022), 2011. a
Evangeliou, N., Platt, S. M., Eckhardt, S., Lund Myhre, C., Laj, P., Alados-Arboledas, L., Backman, J., Brem, B. T., Fiebig, M., Flentje, H., Marinoni, A., Pandolfi, M., Yus-Dìez, J., Prats, N., Putaud, J. P., Sellegri, K., Sorribas, M., Eleftheriadis, K., Vratolis, S., Wiedensohler, A., and Stohl, A.: Changes in black carbon emissions over Europe due to COVID-19 lockdowns, Atmos. Chem. Phys., 21, 2675–2692, https://doi.org/10.5194/acp-21-2675-2021, 2021. a
Jacobson, M. Z.: Global direct radiative forcing due to multicomponent anthropogenic and natural aerosols, J. Geophys. Res.-Atmos., 106, 1551–1568, 2001. a
Karanasiou, A., Panteliadis, P., Perez, N., Minguillón, M. C., Pandolfi, M., Titos, G., Viana, M., Moreno, T., Querol, X., and Alastuey, A.: Evaluation of the Semi-Continuous OCEC analyzer performance with the EUSAAR2 protocol, Sci. Total Environ., 747, 141266, https://doi.org/10.1016/j.scitotenv.2020.141266, 2020. a, b
Kasthuriarachchi, N. Y., Rivellini, L. H., Adam, M. G., and Lee, A. K.: Light Absorbing Properties of Primary and Secondary Brown Carbon in a Tropical Urban Environment, Environ. Sci. Technol., 54, 10808–10819, https://doi.org/10.1021/acs.est.0c02414, 2020. a, b, c, d
Kirchstetter, T. W., Novakov, T., and Hobbs, P. V.: Evidence that the spectral dependence of light absorption by aerosols is affected by organic carbon, J. Geophys. Res.-Atmos., 109, 1–12, https://doi.org/10.1029/2004JD004999, 2004. a
Knox, A., Evans, G. J., Brook, J. R., Yao, X., Jeong, C. H., Godri, K. J., Sabaliauskas, K., and Slowik, J. G.: Mass absorption cross-section of ambient black carbon aerosol in relation to chemical age, Aerosol Sci. Tech., 43, 522–532, https://doi.org/10.1080/02786820902777207, 2009. a
Lack, D. A. and Cappa, C. D.: Impact of brown and clear carbon on light absorption enhancement, single scatter albedo and absorption wavelength dependence of black carbon, Atmos. Chem. Phys., 10, 4207–4220, https://doi.org/10.5194/acp-10-4207-2010, 2010. a, b, c, d, e, f, g, h, i, j
Lack, D. A. and Langridge, J. M.: On the attribution of black and brown carbon light absorption using the Ångström exponent, Atmos. Chem. Phys., 13, 10535–10543, https://doi.org/10.5194/acp-13-10535-2013, 2013. a, b
Lack, D. A., Langridge, J. M., Bahreini, R., Cappa, C. D., Middlebrook, A. M., and Schwarz, J. P.: Brown carbon and internal mixing in biomass burning particles, P. Natl. Acad. Sci. USA, 109, 14802–14807, https://doi.org/10.1073/pnas.1206575109, 2012. a, b
Lack, D. A., Moosmüller, H., McMeeking, G. R., Chakrabarty, R. K., and Baumgardner, D.: Characterizing elemental, equivalent black, and refractory black carbon aerosol particles: A review of techniques, their limitations and uncertainties, Anal. Bioanal. Chem., 406, 99–122, https://doi.org/10.1007/s00216-013-7402-3, 2014. a
Laskin, A., Laskin, J., and Nizkorodov, S. A.: Chemistry of Atmospheric Brown Carbon, Chem. Rev., 115, 4335–4382, https://doi.org/10.1021/cr5006167, 2015. a
Liu, S., Aiken, A. C., Gorkowski, K., Dubey, M. K., Cappa, C. D., Williams, L. R., Herndon, S. C., Massoli, P., Fortner, E. C., Chhabra, P. S., Brooks, W. A., Onasch, T. B., Jayne, J. T., Worsnop, D. R., China, S., Sharma, N., Mazzoleni, C., Xu, L., Ng, N. L., Liu, D., Allan, J. D., Lee, J. D., Fleming, Z. L., Mohr, C., Zotter, P., Szidat, S., and Prévôt, A. S.: Enhanced light absorption by mixed source black and brown carbon particles in UK winter, Nat. Commun., 6, 8435, https://doi.org/10.1038/ncomms9435, 2015. a, b, c, d, e, f, g, h, i, j, k, l, m, n, o, p, q
Minguillón, M. C., Ripoll, A., Pérez, N., Prévôt, A. S. H., Canonaco, F., Querol, X., and Alastuey, A.: Chemical characterization of submicron regional background aerosols in the western Mediterranean using an Aerosol Chemical Speciation Monitor, Atmos. Chem. Phys., 15, 6379–6391, https://doi.org/10.5194/acp-15-6379-2015, 2015. a
Moise, T., Flores, J. M., and Rudich, Y.: Optical Properties of Secondary Organic Aerosols and Their Changes by Chemical Processes, Chem. Rev., 115, 4400–4439, https://doi.org/10.1021/cr5005259, 2015. a
Müller, T., Henzing, J. S., de Leeuw, G., Wiedensohler, A., Alastuey, A., Angelov, H., Bizjak, M., Collaud Coen, M., Engström, J. E., Gruening, C., Hillamo, R., Hoffer, A., Imre, K., Ivanow, P., Jennings, G., Sun, J. Y., Kalivitis, N., Karlsson, H., Komppula, M., Laj, P., Li, S.-M., Lunder, C., Marinoni, A., Martins dos Santos, S., Moerman, M., Nowak, A., Ogren, J. A., Petzold, A., Pichon, J. M., Rodriquez, S., Sharma, S., Sheridan, P. J., Teinilä, K., Tuch, T., Viana, M., Virkkula, A., Weingartner, E., Wilhelm, R., and Wang, Y. Q.: Characterization and intercomparison of aerosol absorption photometers: result of two intercomparison workshops, Atmos. Meas. Tech., 4, 245–268, https://doi.org/10.5194/amt-4-245-2011, 2011. a
Myhre, G., Shindell, D., Breéon, F.-M., Collins, W., Fuglestvedt, J., Huang, J., Koch, D., Lamarque, J.-F., Lee, D., Mendoza, B., Nakajima, T., Robock, A., Stephens, G., Takemura, T., and Zhang, H.: Anthropogenic and Natural Radiative Forcing, 8, Cambridge University Press, Cambridge, United Kingdom and New York, NY, USA, 659–740, https://doi.org/10.1017/CBO9781107415324.018, 2013. a, b
Ng, N. L., Canagaratna, M. R., Zhang, Q., Jimenez, J. L., Tian, J., Ulbrich, I. M., Kroll, J. H., Docherty, K. S., Chhabra, P. S., Bahreini, R., Murphy, S. M., Seinfeld, J. H., Hildebrandt, L., Donahue, N. M., DeCarlo, P. F., Lanz, V. A., Prévôt, A. S. H., Dinar, E., Rudich, Y., and Worsnop, D. R.: Organic aerosol components observed in Northern Hemispheric datasets from Aerosol Mass Spectrometry, Atmos. Chem. Phys., 10, 4625–4641, https://doi.org/10.5194/acp-10-4625-2010, 2010. a, b, c
Paatero, P.: The Multilinear Engine—A Table-Driven, Least Squares Program for Solving Multilinear Problems, Including the n-Way Parallel Factor Analysis Model, J. Comput. Graph. Stat., 8, 854–888, https://doi.org/10.1080/10618600.1999.10474853, 1999. a
Paatero, P. and Tapper, U.: Positive matrix factorization: A non-negative factor model with optimal utilization of error estimates of data values, Environmetrics, 5, 111–126, https://doi.org/10.1002/env.3170050203, 1994. a
Pandolfi, M., Cusack, M., Alastuey, A., and Querol, X.: Variability of aerosol optical properties in the Western Mediterranean Basin, Atmos. Chem. Phys., 11, 8189–8203, https://doi.org/10.5194/acp-11-8189-2011, 2011. a
Pandolfi, M., Alastuey, A., Querol, X., González Jiménez, J. L., Jorba, O. C., Ortega, A. M., Baldasano, J. M., Minguillón, M. C., Artíñano, B., Seco, R., Peñuelas, J., Lorente, J., and Pey, J.: Effects of sources and meteorology on particulate matter in the Western Mediterranean Basin: An overview of the DAURE campaign, J. Geophys. Res.-Atmos., 119, 4978–5010, 2014a. a, b
Pandolfi, M., Ripoll, A., Querol, X., and Alastuey, A.: Climatology of aerosol optical properties and black carbon mass absorption cross section at a remote high-altitude site in the western Mediterranean Basin, Atmos. Chem. Phys., 14, 6443–6460, https://doi.org/10.5194/acp-14-6443-2014, 2014b. a
Pandolfi, M., Alastuey, A., Pérez, N., Reche, C., Castro, I., Shatalov, V., and Querol, X.: Trends analysis of PM source contributions and chemical tracers in NE Spain during 2004–2014: a multi-exponential approach, Atmos. Chem. Phys., 16, 11787–11805, https://doi.org/10.5194/acp-16-11787-2016, 2016. a, b, c, d
Peng, J., Hu, M., Guo, S., Du, Z., Zheng, J., Shang, D., Zamora, M. L., Zeng, L., Shao, M., Wu, Y. S., Zheng, J., Wang, Y., Glen, C. R., Collins, D. R., Molina, M. J., and Zhang, R.: Markedly enhanced absorption and direct radiative forcing of black carbon under polluted urban environments, P. Natl. Acad. Sci. USA, 113, 4266–4271, https://doi.org/10.1073/pnas.1602310113, 2016. a
Pérez, N., Pey, J., Castillo, S., Viana, M., Alastuey, A., and Querol, X.: Interpretation of the variability of levels of regional background aerosols in the Western Mediterranean, Sci. Total Environ., 407, 527–540, 2008. a
Pandolfi, M., Yus-Díez, J., Perez, N., and Alstuey, A.: Aerosol Absorption Coefficient, ACTRIS [data set], https://actris.nilu.no/Data/?key=fa6cd01674284c04bb8736bd5aca0030, last access: 29 June 2022. a
Petzold, A. and Schönlinner, M.: Multi-angle absorption photometry – a new method for the measurement of aerosol light absorption and atmospheric black carbon, J. Aerosol Sci., 35, 421–441, 2004. a, b
Pey, J., Pérez, N., Castillo, S., Viana, M., Moreno, T., Pandolfi, M., López-Sebastián, J., Alastuey, A., and Querol, X.: Geochemistry of regional background aerosols in the Western Mediterranean, Atmos. Res., 94, 422–435, 2009. a
Qin, Y. M., Tan, H. B., Li, Y. J., Li, Z. J., Schurman, M. I., Liu, L., Wu, C., and Chan, C. K.: Chemical characteristics of brown carbon in atmospheric particles at a suburban site near Guangzhou, China, Atmos. Chem. Phys., 18, 16409–16418, https://doi.org/10.5194/acp-18-16409-2018, 2018. a, b, c
Querol, X., Alastuey, A., Rodriguez, S., Plana, F., Ruiz, C. R., Cots, N., Massagué, G., and Puig, O.: PM10 and PM2.5 source apportionment in the Barcelona Metropolitan area, Catalonia, Spain, Atmos. Environ., 35, 6407–6419, 2001. a, b
Querol, X., Pey, J., Pandolfi, M., Alastuey, A., Cusack, M., Pérez, N., Moreno, T., Viana, M., Mihalopoulos, N., Kallos, G., and Kleanthous, S.: African dust contributions to mean ambient PM10 mass-levels across the Mediterranean Basin, Atmos. Environ., 43, 4266–4277, 2009. a
Querol, X., Massagué, J., Alastuey, A., Moreno, T., Gangoiti, G., Mantilla, E., Duéguez, J. J., Escudero, M., Monfort, E., García-Pando, C. P., Oriol Jorba, H. P., Vázquez, V., de la Rosa Alberto Campos, J., Muñóz, M., Monge, S., Hervás, M., Javato, R., and Cornide, M. J.: Lessons from the COVID-19 air pollution decrease in Spain: Now what?, Sci. Total Environ., 779, 146380, https://doi.org/10.1016/j.scitotenv.2021.146380, 2021. a
Reche, C., Querol, X., Alastuey, A., Viana, M., Pey, J., Moreno, T., Rodríguez, S., González, Y., Fernández-Camacho, R., de la Rosa, J., Dall'Osto, M., Prévôt, A. S. H., Hueglin, C., Harrison, R. M., and Quincey, P.: New considerations for PM, Black Carbon and particle number concentration for air quality monitoring across different European cities, Atmos. Chem. Phys., 11, 6207–6227, https://doi.org/10.5194/acp-11-6207-2011, 2011. a
Rigler, M., Drinovec, L., Lavrič, G., Vlachou, A., Prévôt, A. S. H., Jaffrezo, J. L., Stavroulas, I., Sciare, J., Burger, J., Kranjc, I., Turšič, J., Hansen, A. D. A., and Močnik, G.: The new instrument using a TC–BC (total carbon–black carbon) method for the online measurement of carbonaceous aerosols, Atmos. Meas. Tech., 13, 4333–4351, https://doi.org/10.5194/amt-13-4333-2020, 2020. a
Rivas, I., Beddows, D. C. S., Amato, F., Green, D. C., Järvi, L., Hueglin, C., Reche, C., Timonen, H., Fuller, G. W., Niemi, J. V., Pérez, N., Aurela, M., Hopke, P. K., Alastuey, A., Kulmala, M., Harrison, R. M., Querol, X., and Kelly, F. J.: Source apportionment of particle number size distribution in urban background and traffic stations in four European cities, Environ. Int., 135, 105345, https://doi.org/10.1016/j.envint.2019.105345, 2020. a
Rodrıguez, S., Querol, X., Alastuey, A., Kallos, G., and Kakaliagou, O.: Saharan dust contributions to PM10 and TSP levels in Southern and Eastern Spain, Atmos. Environ., 35, 2433–2447, 2001. a
Rodríguez, S., Querol, X., Alastuey, A., and Plana, F.: Sources and processes affecting levels and composition of atmospheric aerosol in the western Mediterranean, J. Geophys. Res.-Atmos., 107, 4777, https://doi.org/10.1029/2001JD001488, 2002. a
Saleh, R.: From Measurements to Models: Toward Accurate Representation of Brown Carbon in Climate Calculations, Curr. Pollution Rep., 6, 90–104, https://doi.org/10.1007/s40726-020-00139-3, 2020. a, b, c, d, e
Saleh, R., Cheng, Z., and Atwi, K.: The Brown-Black Continuum of Light-Absorbing Combustion Aerosols, Environ. Sci. Tech. Lett., 5, 508–513, https://doi.org/10.1021/acs.estlett.8b00305, 2018. a, b, c, d, e
Samset, B. H., Sand, M., Smith, C. J., Bauer, S. E., Forster, P. M., Fuglestvedt, J. S., Osprey, S., and Schleussner, C. F.: Climate Impacts From a Removal of Anthropogenic Aerosol Emissions, Geophys. Res. Lett., 45, 1020–1029, https://doi.org/10.1002/2017GL076079, 2018. a
Seco, R., Peñuelas, J., Filella, I., Llusia, J., Schallhart, S., Metzger, A., Müller, M., and Hansel, A.: Volatile organic compounds in the western Mediterranean basin: urban and rural winter measurements during the DAURE campaign, Atmos. Chem. Phys., 13, 4291–4306, https://doi.org/10.5194/acp-13-4291-2013, 2013. a
Tobías, A., Carnerero, C., Reche, C., Massagué, J., Via, M., Minguillón, M. C., Alastuey, A., and Querol, X.: Changes in air quality during the lockdown in Barcelona (Spain) one month into the SARS-CoV-2 epidemic, Sci. Total Environ., 726, 138540, https://doi.org/10.1016/j.scitotenv.2020.138540, 2020. a
Veld, M. i. t., Alastuey, A., Pandolfi, M., Amato, F., Pérez, N., Reche, C., Via, M., Minguillón, M. C., Escudero, M., and Querol, X.: Compositional changes of PM2.5 in NE Spain during 2009–2018: A trend analysis of the chemical composition and source apportionment, Sci. Total Environ., 795, 148728, https://doi.org/10.1016/j.scitotenv.2021.148728, 2021. a, b, c, d, e, f, g, h
Via, M., Minguillón, M. C., Reche, C., Querol, X., and Alastuey, A.: Increase in secondary organic aerosol in an urban environment, Atmos. Chem. Phys., 21, 8323–8339, https://doi.org/10.5194/acp-21-8323-2021, 2021. a, b, c, d, e, f, g, h, i, j, k, l, m, n, o
Viana, M., Chi, X., Maenhaut, W., Cafmeyer, J., Querol, X., Alastuey, A., Mikuška, P., and Večeřa, Z.: Influence of sampling artefacts on measured PM, OC, and EC levels in carbonaceous aerosols in an urban area, Aerosol Sci. Tech., 40, 107–117, https://doi.org/10.1080/02786820500484388, 2006. a
WMO: WMO/GAW Aerosol Measurement Procedures, Guidelines and Recommendations, WMO-No. 1177, GAW Report-No. 227, 103, https://library.wmo.int/doc_num.php?explnum_id=3073 (last access: 1 July 2022), 2016. a
Wu, Y., Cheng, T., Liu, D., Allan, J. D., Zheng, L., and Chen, H.: Light Absorption Enhancement of Black Carbon Aerosol Constrained by Particle Morphology, Environ. Sci. Technol., 52, 6912–6919, https://doi.org/10.1021/acs.est.8b00636, 2018. a
Xu, X., Zhao, W., Qian, X., Wang, S., Fang, B., Zhang, Q., Zhang, W., Venables, D. S., Chen, W., Huang, Y., Deng, X., Wu, B., Lin, X., Zhao, S., and Tong, Y.: The influence of photochemical aging on light absorption of atmospheric black carbon and aerosol single-scattering albedo, Atmos. Chem. Phys., 18, 16829–16844, https://doi.org/10.5194/acp-18-16829-2018, 2018. a
Yus-Díez, J., Ealo, M., Pandolfi, M., Perez, N., Titos, G., Močnik, G., Querol, X., and Alastuey, A.: Aircraft vertical profiles during summertime regional and Saharan dust scenarios over the north-western Mediterranean basin: aerosol optical and physical properties, Atmos. Chem. Phys., 21, 431–455, https://doi.org/10.5194/acp-21-431-2021, 2021a. a
Yus-Díez, J., Bernardoni, V., Močnik, G., Alastuey, A., Ciniglia, D., Ivančič, M., Querol, X., Perez, N., Reche, C., Rigler, M., Vecchi, R., Valentini, S., and Pandolfi, M.: Determination of the multiple-scattering correction factor and its cross-sensitivity to scattering and wavelength dependence for different AE33 Aethalometer filter tapes: a multi-instrumental approach, Atmos. Meas. Tech., 14, 6335–6355, https://doi.org/10.5194/amt-14-6335-2021, 2021b. a, b, c, d, e
Zanatta, M., Gysel, M., Bukowiecki, N., Müller, T., Weingartner, E., Areskoug, H., Fiebig, M., Yttri, K. E., Mihalopoulos, N., Kouvarakis, G., Beddows, D., Harrison, R. M., Cavalli, F., Putaud, J. P., Spindler, G., Wiedensohler, A., Alastuey, A., Pandolfi, M., Sellegri, K., Swietlicki, E., Jaffrezo, J. L., Baltensperger, U., and Laj, P: A European aerosol phenomenology-5: Climatology of black carbon optical properties at 9 regional background sites across Europe, Atmos. Environ., 145, 346–364, 2016. a, b, c
Zhang, Y., Favez, O., Canonaco, F., Liu, D., Močnik, G., Amodeo, T., Sciare, J., Prévôt, A. S. H., Gros, V., and Albinet, A.: Evidence of major secondary organic aerosol contribution to lensing effect black carbon absorption enhancement, NPJ Clim. Atmos. Sci., 1, 47, https://doi.org/10.1038/s41612-018-0056-2, 2018. a, b, c, d, e, f, g, h, i, j, k, l, m, n, o, p, q, r
Zhang, Y., Albinet, A., Petit, J. E., Jacob, V., Chevrier, F., Gille, G., Pontet, S., Chrétien, E., Dominik-Sègue, M., Levigoureux, G., Močnik, G., Gros, V., Jaffrezo, J. L., and Favez, O.: Substantial brown carbon emissions from wintertime residential wood burning over France, Sci. Total Environ., 743, 140752, https://doi.org/10.1016/j.scitotenv.2020.140752, 2020. a, b, c, d