the Creative Commons Attribution 4.0 License.
the Creative Commons Attribution 4.0 License.
 | 28 Jun 2022
A new assessment of global and regional budgets, fluxes, and lifetimes of atmospheric reactive N and S gases and aerosols
Massimo Vieno
David S. Stevenson
Peter Wind
We used the EMEP MSC-W (European Monitoring and Evaluation Programme Meteorological Synthesizing Centre – West) model version 4.34 coupled with WRF (Weather Research and Forecasting) model version 4.2.2 meteorology to undertake a present-day (2015) global and regional quantification of the concentrations, deposition, budgets, and lifetimes of atmospheric reactive N (Nr) and S (Sr) species. These are quantities that cannot be derived from measurements alone. In areas with high levels of reduced Nr (RDN = NH3+ NH), oxidized Nr (OXN = NOx+ HNO3+ HONO + N2O5 + NO “Other OXN” species), and oxidized Sr (OXS = SO2+ SO), RDN is predominantly in the form of NH3 (NH typically <20 %), OXN has majority gaseous species composition, and OXS predominantly comprises SO except near major SO2 sources. Most continental regions are now “ammonia rich”, more so than previously, which indicates that, although reducing NH3 emissions will decrease the RDN concentration, decreasing these emissions will have little effect on mitigating secondary inorganic aerosol (SIA). South Asia is the most ammonia-rich region. Coastal areas around East Asia, northern Europe, and the north-eastern United States are “nitrate rich” where NH4NO3 formation is limited by NH3. These locations experience transport of OXN from the adjacent continent and/or direct shipping emissions of NOx, but NH3 concentrations are lower. The least populated continental areas and most marine areas are “sulfate rich”. Deposition of OXN (57.9 TgN yr−1, 51 %) and RDN (55.5 TgN yr−1, 49 %) contribute almost equally to total nitrogen deposition. OXS deposition is 50.5 TgS yr−1. Globally, wet and dry deposition contribute similarly to RDN deposition; for OXN and OXS, wet deposition contributes slightly more. Dry deposition of NH3 is the largest contributor to RDN deposition in most regions except for the Rest of Asia area and marine sectors where NH3 emissions are small and RDN deposition is mainly determined by the transport and rainout of NH (rather than rainout of gaseous NH3). Thus, reductions in NH3 would efficiently reduce the deposition of RDN in most continental regions. The two largest contributors to OXN deposition in all regions are HNO3 and coarse NO (via both wet and dry deposition). The deposition of fine NO is only important over East Asia. The tropospheric burden of RDN is 0.75 TgN, of which NH3 and NH comprise 32 % (0.24 TgN; lifetime of 1.6 d) and 68 % (0.51 TgN; lifetime of 8.9 d) respectively. The lifetime of RDN (4.9–5.2 d) is shorter than that of OXN (7.6–7.7 d), which is consistent with a total OXN burden (1.20 TgN) almost double that of RDN. The tropospheric burden of OXS is 0.78 TgS with a lifetime of 5.6–5.9 d. Total nitrate burden is 0.58 TgN with fine NO only constituting 10 % of this total, although fine NO dominates in eastern China, Europe, and eastern North America. It is important to account for contributions of coarse nitrate to global nitrate budgets. Lifetimes of RDN, OXN, and OXS species vary by a factor of 4 across different continental regions. In East Asia, lifetimes for RDN (2.9–3.0 d), OXN (3.9–4.5 d), and OXS (3.4–3.7 d) are short, whereas lifetimes in the Rest of Asia and Africa regions are about twice as long. South Asia is the largest net exporter of RDN (2.21 TgN yr−1, 29 % of its annual emission), followed by the Euro_Medi region. Despite having the largest RDN emissions and deposition, East Asia has only small net export and is therefore largely responsible for its own RDN pollution. Africa is the largest net exporter of OXN (1.92 TgN yr−1, 22 %), followed by Euro_Medi (1.61 TgN yr−1, 26 %). Considerable marine anthropogenic Nr and Sr pollution is revealed by the large net import of RDN, OXN, and OXS to these areas. Our work demonstrates the substantial regional variation in Nr and Sr budgets and the need for modelling to simulate the chemical and meteorological linkages underpinning atmospheric responses to precursor emissions.
- Article
(13057 KB) - Full-text XML
-
Supplement
(3002 KB) - BibTeX
- EndNote


Reactive N (Nr) and S (Sr) gases and particle species are critical determinants of air quality. The principal precursor gas emissions of NO and NO2 (collectively NOx), NH3, and SO2 are emitted from a wide range of human activities (Crippa et al., 2018; Hoesly et al., 2018). As the dominant alkaline gas in the atmosphere, NH3 exerts significant control on the acidity of deposition and on the formation of the secondary inorganic aerosol (SIA) components of fine particles (PM2.5) (Sutton et al., 2020). The latter derive from the reactions between NH3 and the sulfuric acid (H2SO4) and nitric acid (HNO3) that are oxidation products of SO2 and NOx (Xue et al., 2011; Behera et al., 2013a; Nenes et al., 2020). These particles have significant impacts on human health (Lelieveld et al., 2015; Cohen et al., 2017; Burnett et al., 2018) and on Earth's radiation budget (Bellouin et al., 2011; IPCC, 2021). Sulfur dioxide and sulfate aerosols (collectively referred to as oxidized S and abbreviated as OXS) also have an impact on cloud formation and the acidity of precipitation (Myhre et al., 2017; Aas et al., 2019; Thornhill et al., 2021; McHale et al., 2021).
In addition, oxidized N gases and aerosols such as NOx, HNO3, and NO (collectively abbreviated as OXN), and reduced N gases and aerosol (NH3 and NH, collectively abbreviated as RDN), act as powerful plant and microorganism nutrients when deposited to aquatic and terrestrial ecosystems. Excessive anthropogenic input of N can lead to exceedance of N critical loads, which in turn can lead to eutrophication and loss of ecosystem productivity and biodiversity (Erisman et al., 2005; Fowler et al., 2013; Sun et al., 2017). The increase in food production to support a burgeoning human population is increasing agricultural emissions of NH3 globally, in contrast to the globally declining emissions of SO2 and NOx (Fowler et al., 2020). A further factor contributing to the different trend in NH3 emissions is the lack of regulations in most countries specifically targeted at reducing NH3 emissions. The relative proportions of the Nr and Sr gas and aerosol species in the atmospheric burdens and the wet and dry deposition of RDN, OXN, and OXS vary substantially around the world because of the different magnitudes of precursor emissions and local meteorology. Knowledge of how these burdens and depositions vary regionally is important for understanding local impacts and mitigation actions.
This information can be derived from atmospheric chemistry transport models. An advantage of these models is that they can simulate concentrations and depositions of air pollutants at greater spatial and temporal resolution and coverage than can be achieved through ambient measurements. Furthermore, as these models simulate the underlying physical–chemical processes, they allow insight into the chemical and meteorological linkages between emissions, concentrations, and deposition of pollutants that measurements cannot reveal: for example, horizontal and vertical pollutant transport as well as the proportion of reduced nitrogen in precipitation that derives from rainout of gaseous NH3 or particulate NH. A number of global-scale modelling studies of atmospheric Nr and Sr have been undertaken previously. Lamarque et al. (2013) presented a multi-model ensemble of N and S deposition from 1850 to 2100, derived from the Atmospheric Chemistry and Climate Model Intercomparison Project (ACCMIP). The ACCMIP results for “present day” (year 2000 ACCMIP time slice) showed a multi-model mean deposition of 110 TgN yr−1 and 83 TgS yr−1. Hauglustaine et al. (2014) reported that present day (2000) fine nitrate and ammonium particles make important contributions to aerosol burdens and direct radiative forcing. Bian et al. (2017) conducted an evaluation of global NO aerosol in 2008 from nine models involved in the Aerosol Comparisons between Observations and Models (AeroCom) phase III and reported a large diversity in global tropospheric burdens of HNO3, NO, NH3, and NH between the models. Tan et al. (2018) calculated the global S and N deposition in 2010 utilizing results of 11 models from the second phase of the Task Force on Hemispheric Transport of Air Pollution (TF HTAP II). The results showed that global S and N depositions in 2010 were 84 TgS yr−1 and 123 TgN yr−1 respectively. Comparisons of their results with those from HTAP I indicated that global distributions of S and N deposition had changed considerably between 2001 and 2010. Globally, there was a reduction in S deposition of 2 TgS (3 %) during this period, with significant reductions in S deposition in Europe, North America, and Russia. In contrast, global N deposition increased by 7 TgN (6 %), particularly in South Asia, East Asia, and Southeast Asia. Ackerman et al. (2019) used the GEOS-Chem chemical transport model to estimate global inorganic N deposition from 1984 to 2016 and found an 8 % increase from 86.6 to 93.6 TgN yr−1.
These previous modelling studies provide an outlook on the distribution of sulfate–ammonium–nitrate aerosols in the early 2000s with predominant focus on S and oxidized N. However, a more up-to-date examination of the global state of Nr and Sr deposition, atmospheric burden, deposition, and lifetime is needed, particularly of the reduced Nr species NH3 and NH, which has not previously been comprehensively conducted. In recent years there have been large changes in global and regional NH3, NOx, and SOx emissions, especially over South Asia, East Asia, Europe, and North America (Crippa et al., 2018; Hoesly et al., 2018). For instance, Kurokawa and Ohara (2020) reported that emissions of SO2 and NOx in East Asia increased rapidly from 1950 to 2015, reaching their peaks during 2005–2015, but NH3 emissions continued to increase. On the other hand, NOx and SO2 emissions in South Asia continued to increase between 1996 and 2015 (Sadavarte and Venkataraman, 2014; Pandey et al., 2014; Kurokawa and Ohara, 2020). In Europe and the United States, there has been a general decreasing trend in N and S emissions over the last decade (Westervelt et al., 2017; UNECE, 2020; Westervelt et al., 2021).
An updated global modelling of Nr and Sr gases and aerosols with the latest available emission inventory is crucial to understand current differences in gas–aerosol partitioning, wet and dry deposition, tropospheric burden, and lifetime of separate RDN, OXN, and OXS species in separate regions, and as a basis for developing mitigation strategies according to regional conditions. In this study, we use the three-dimensional global EMEP MSC-W (European Monitoring and Evaluation Programme Meteorological Synthesizing Centre – West) model 4.34 coupled with WRF (Weather Research and Forecasting) 4.2.2 meteorology to calculate the atmospheric concentration, deposition, and tropospheric budget of Nr and Sr gases and aerosols in 2015. Section 2 details the framework of our model simulation, including emissions, meteorology, and the aerosol scheme. The global distribution and typical magnitude of the Nr and Sr concentration; regional deposition processes of RDN (NH3 and NH), OXN (NOx, HNO3, HONO, N2O5, fine NO, coarse NO, and “Other OXN” species), and OXS (SO2 and SO); tropospheric budgets; and lifetimes of major Nr and Sr species are described in Sect. 3. We summarize the conclusions of our study in Sect. 4.
2.1 Model description
We used version rv4.34 of the EMEP MSC-W (European Monitoring and Evaluation Programme Meteorological Synthesizing Centre – West) open-source atmospheric chemistry transport model (https://www.emep.int, last access: 20 December 2021), which is widely used in scientific research and policy development (Simpson et al., 2012; Bergström et al., 2012, 2014; Jonson et al., 2017; Karl et al., 2019; McFiggans et al., 2019; Fagerli et al., 2019; Pommier et al., 2020). The model was driven by meteorology from the Weather Research and Forecasting model (WRF; https://www.wrf-model.org, last access: 1 November 2021; https://github.com/wrf-model/WRF/releases/tag/v4.2.2, last access: 1 November 2021) version 4.2.2 at a 1∘ grid resolution (Vieno et al., 2010, 2014, 2016; Gu et al., 2021). The WRF simulation in this work assimilates data from the numerical weather prediction model meteorological reanalysis of the US National Center for Environmental Prediction (NCEP)/National Center for Atmospheric Research (NCAR) Global Forecast System (GFS) (Saha et al., 2010). The global EMEP-WRF configurations are detailed in Ge et al. (2021).
A detailed technical description of EMEP MSC-W rv4.0 is documented in Simpson et al. (2012). An overview of model updates from version rv4.0 to rv4.34 is presented in Simpson et al. (2020). The model has horizontal resolution of 1∘ × 1∘ and contains 21 terrain-following vertical layers from the surface to 100 hPa. The lowest model layer has a height of ∼ 50 m, and surface concentrations of most species were adjusted to correspond to 3 m above the surface, as described in Simpson et al. (2012, 2020).
The model aerosol scheme is the Equilibrium Simplified Aerosol Model V4 (EQSAM4clim) (Metzger et al., 2012, 2016, 2018), which efficiently parameterizes the aerosol water uptake and full gas–liquid–solid partitioning of mixtures of semi-volatile and non-volatile compounds. In addition to the SO–NO–NH scheme, the model includes the reactions between HNO3 and dust and sea salt to produce coarse nitrate. The aerosol scheme is described in more detail in the Supplement (Sect. S1.1).
Dry deposition of gaseous species is simulated utilizing deposition velocity as described in Simpson et al. (2012, 2020). Aerosol dry deposition follows a similar formulation to other studies (Lamaud, 1994; Gallagher et al., 1997; Nemitz et al., 2004), with modification for nitrogen compounds (Petroff et al., 2008a, b; Simpson et al., 2012). For wet deposition, all generic fine particles (e.g. SO, NH, NO_f) have the same wet scavenging ratio (in cloud) and size-dependent collection efficiency of aerosols by raindrops (below cloud), whilst coarse particles are divided into two groups (coarse sea salt and other coarse particles) with their own sets of parameters (Berge and Jakobsen, 1998; Laakso et al., 2003; Simpson et al., 2012).
2.2 Emissions
Anthropogenic emissions were derived from V6 of the ECLIPSE (Evaluating the CLimate and Air Quality ImPacts of Short-livEd Pollutant) emission inventory (https://iiasa.ac.at/web/home/research/researchPrograms/air/ECLIPSEv6.html, last access: 1 November 2021). This contains global annual emissions for 2015 of SO2, NO2, NH3, CO, CH4, NMVOC (non-methane volatile organic compounds), primary PM2.5, and primary coarse particulate matter (PMco) (Klimont et al., 2017) at a horizontal resolution of 0.5∘. All emissions were aggregated to a 1∘ resolution internally in the model. The ECLIPSE emission sector-layers were reassigned to 11 Selected Nomenclature for sources of Air Pollution (SNAP) sectors (Ge et al., 2021). Monthly emission profiles by country/region and by emission sector based on EDGAR (Emission Database for Global Atmospheric Research, v4.3.2 datasets) time series (Crippa et al., 2020) (https://edgar.jrc.ec.europa.eu/dataset_temp_profile, last access: 1 November 2021) were then applied to the ECLIPSE annual emissions for each pollutant. The calculation of the time-splitting factors for a given pollutant and country/region is given in Ge et al. (2021). The terminology “ECLIPSEE” is used here to refer to these monthly emissions.
Dimethyl sulfide (DMS), lightning NOx, soil NOx, and isoprene emissions were configured as reported in Simpson et al. (2017, 2020), as were the wind-derived emissions of sea-salt particles and dust (Tsyro et al., 2011; Simpson et al., 2012). Emissions from forest and vegetation fires as well as international shipping were also included.
2.3 Model performance
Ge et al. (2021) provide a comprehensive evaluation of surface concentrations and wet deposition of Nr and Sr species from this model configuration against global measurements from 10 monitoring networks. Comparisons of 2010 and 2015 surface concentrations between model and measurement demonstrate that the overall spatial and seasonal variations in the major inorganic pollutants NH3, NO2, SO2, HNO3, NH, NO, SO, and their wet deposition in East Asia, Southeast Asia, Europe, and North America are captured well by the model. Correlation coefficients between modelled and measured annual mean concentrations of all species are >0.78 except for HNO3 and SO2, and they are 0.78 and 0.63 for annual wet deposition of reduced N and oxidized N respectively. Given the intrinsic scale mismatch between a local site measurement and a global-scale chemistry model grid, these comparisons are good and are comparable with model evaluation statistics determined for models of similar resolution (Hauglustaine et al., 2014; Bellouin et al., 2011; Pringle et al., 2010; Xu and Penner, 2012).
Both model and measurement have uncertainty that constrains the extent to which statistical analyses between modelled and measured data can be utilized to assess a model's performance. Model uncertainty comes from uncertainty in emission and meteorology inputs and from parameterizations of chemical/physical processes, whereas measurement uncertainty comes from sampling and analytical procedures. Emission inventory compilation is partially based on reported measurement data and partially on expert estimation, which complicates assigning uncertainties to both emission magnitudes and their spatiotemporal profiles. It is therefore not possible to quantify the contribution of emissions uncertainty to model uncertainty, but it will surely vary regionally and for different species. In Ge et al. (2021), we demonstrated that modelled concentrations of secondary pollutants are less sensitive to the choice of emission inventory than for primary pollutants, as the former are influenced by multiple emissions and the timescales for their formation act to smooth out the differentials in primary emissions. On the other hand, if it is variation in measurement accuracy that contributes to regional variation in model–measurement agreement, then confidence in model output is maintained. Ge et al. (2021) showed better evaluation statistics with measurements in Southeast Asia, Europe, and North America than in East Asia, which suggests shortcomings in regional measurements and/or emissions in the latter network rather than substantial systematic issues with model parameterizations of chemical/physical processes. Ge et al. (2021) also evaluated model response to changes between 2010 and 2015 ECLIPSEE emissions and showed that modelled concentration changes of primary and secondary pollutants and of deposition of reduced N, oxidized N, and oxidized S were consistent with the trends in the corresponding measurements, given realistic uncertainties in emissions and measurements and of meteorological influences between the 2 years.
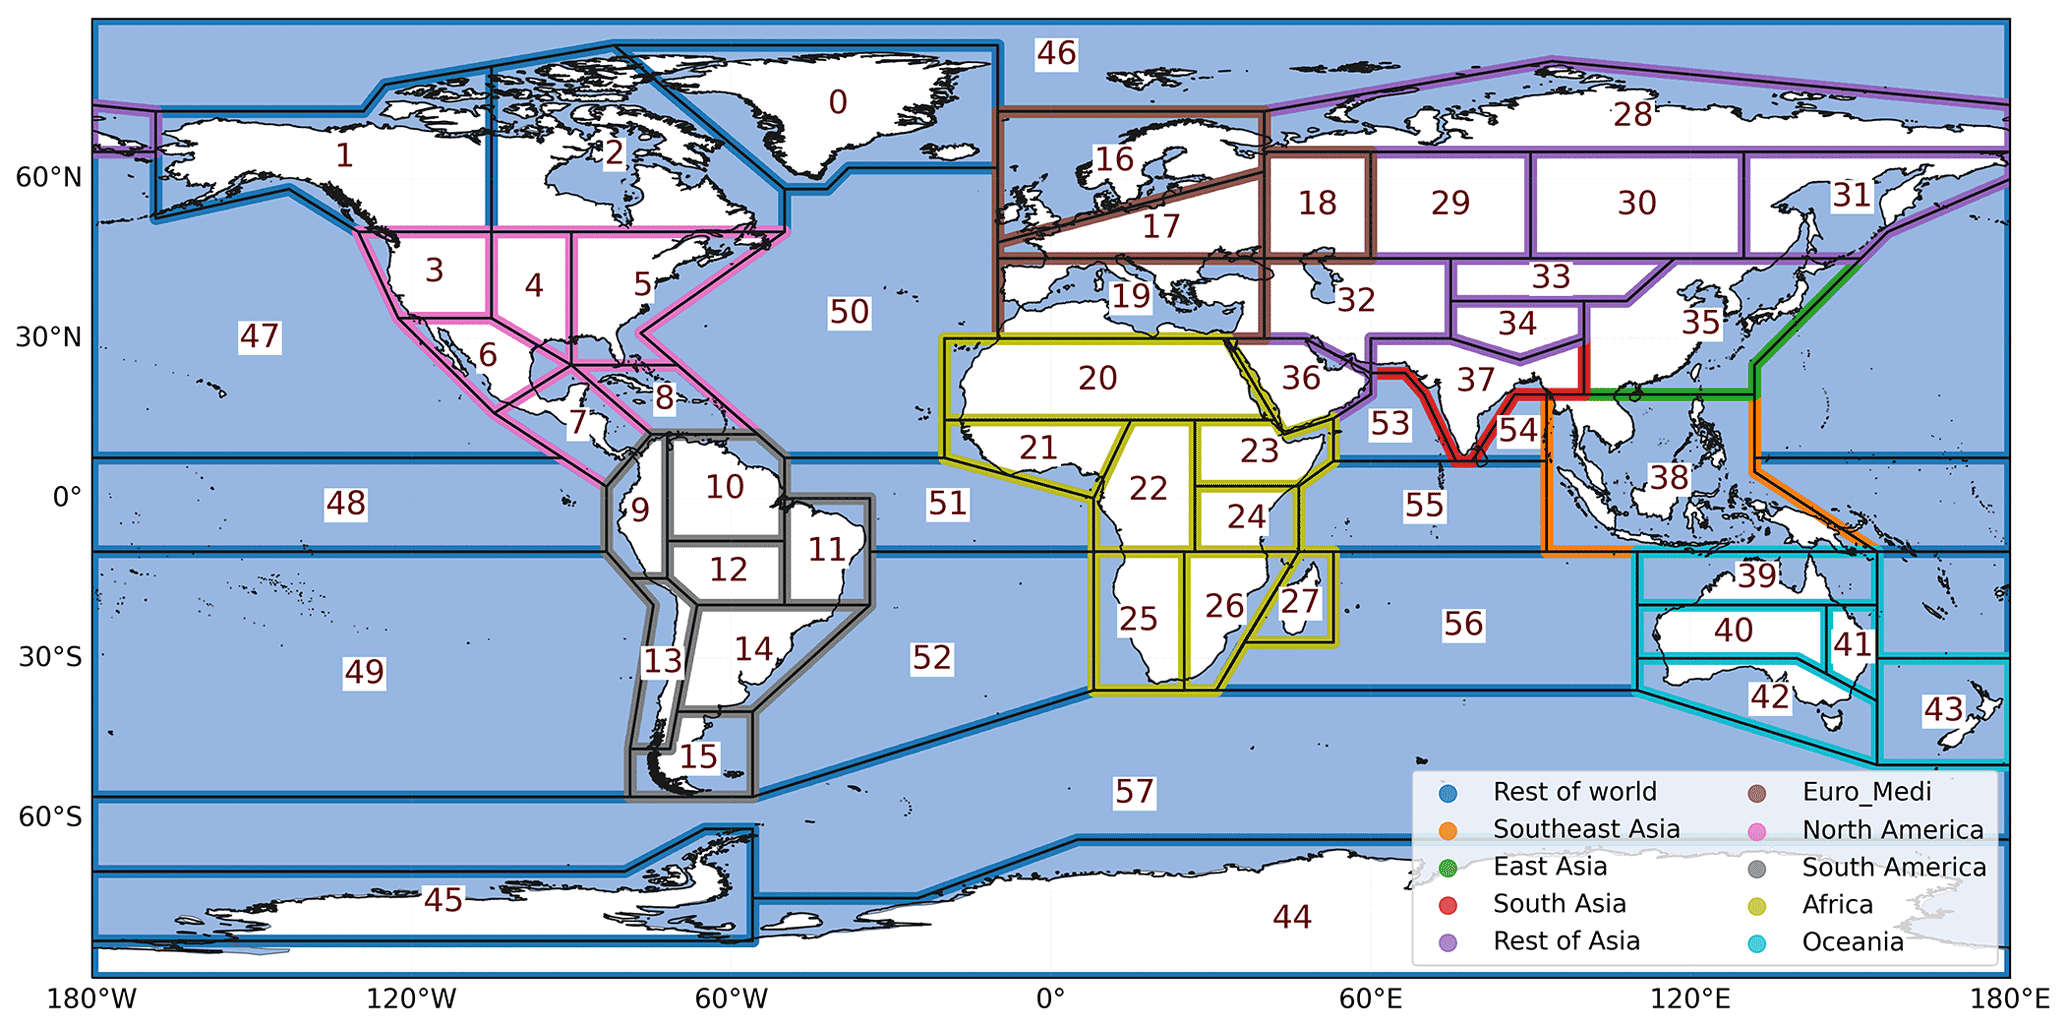
Figure 1The boundaries of the 10 world regions used in this study (based on the IPCC reference regions described in Iturbide et al., 2020).
Nevertheless, considering the fundamental uncertainties in emissions, model, and measurement, all numbers reported in this work should be considered as having underlying uncertainty, albeit that the latest available emission inventory and model version were used to minimize (as far as possible) uncertainties from the first two of these.
2.4 Definition of groups of chemical species
The following terminology is used to refer to groups of Nr and Sr species. RDN represents atmospheric reduced N and is the sum of NH3 and NH. OXN represents all oxidized N outputs in the model and consists of HNO3, NOx, NO_f, NO_c, and “Rest_OXN”. The latter comprises N2O5, HONO, and “Other OXN” species (mainly composed of organic oxidized N species, of which the predominant component is peroxyacetyl nitrate – PAN). Full details are given in Table S1. Total reactive N is the sum of RDN and OXN. OXS represents oxidized S and is the sum of SO2 and total SO.
In this paper, all concentrations, depositions, emissions, and burdens are expressed as mass of the species (e.g. µg m−3, mg m−2) unless otherwise specified (e.g. µgN m−3, µmol m−3, TgN yr−1).
2.5 Definition of world regions
To compare atmospheric budgets and deposition of Nr and Sr species around the world, we divide the world into the 10 regions illustrated in Fig. 1 (and listed in Table S2). These are based on the 58 reference land and ocean regions defined by the Intergovernmental Panel on Climate Change (IPCC) (Iturbide et al., 2020), each of which represents consistent regional climate features. The rationale behind their definition and their homogeneity is documented in Iturbide et al. (2020). Nine of our regions are continental (albeit with some local surrounding seas); our “Rest of world” region incorporates the majority of the oceans and the remotest continental areas of Antarctica and Greenland.
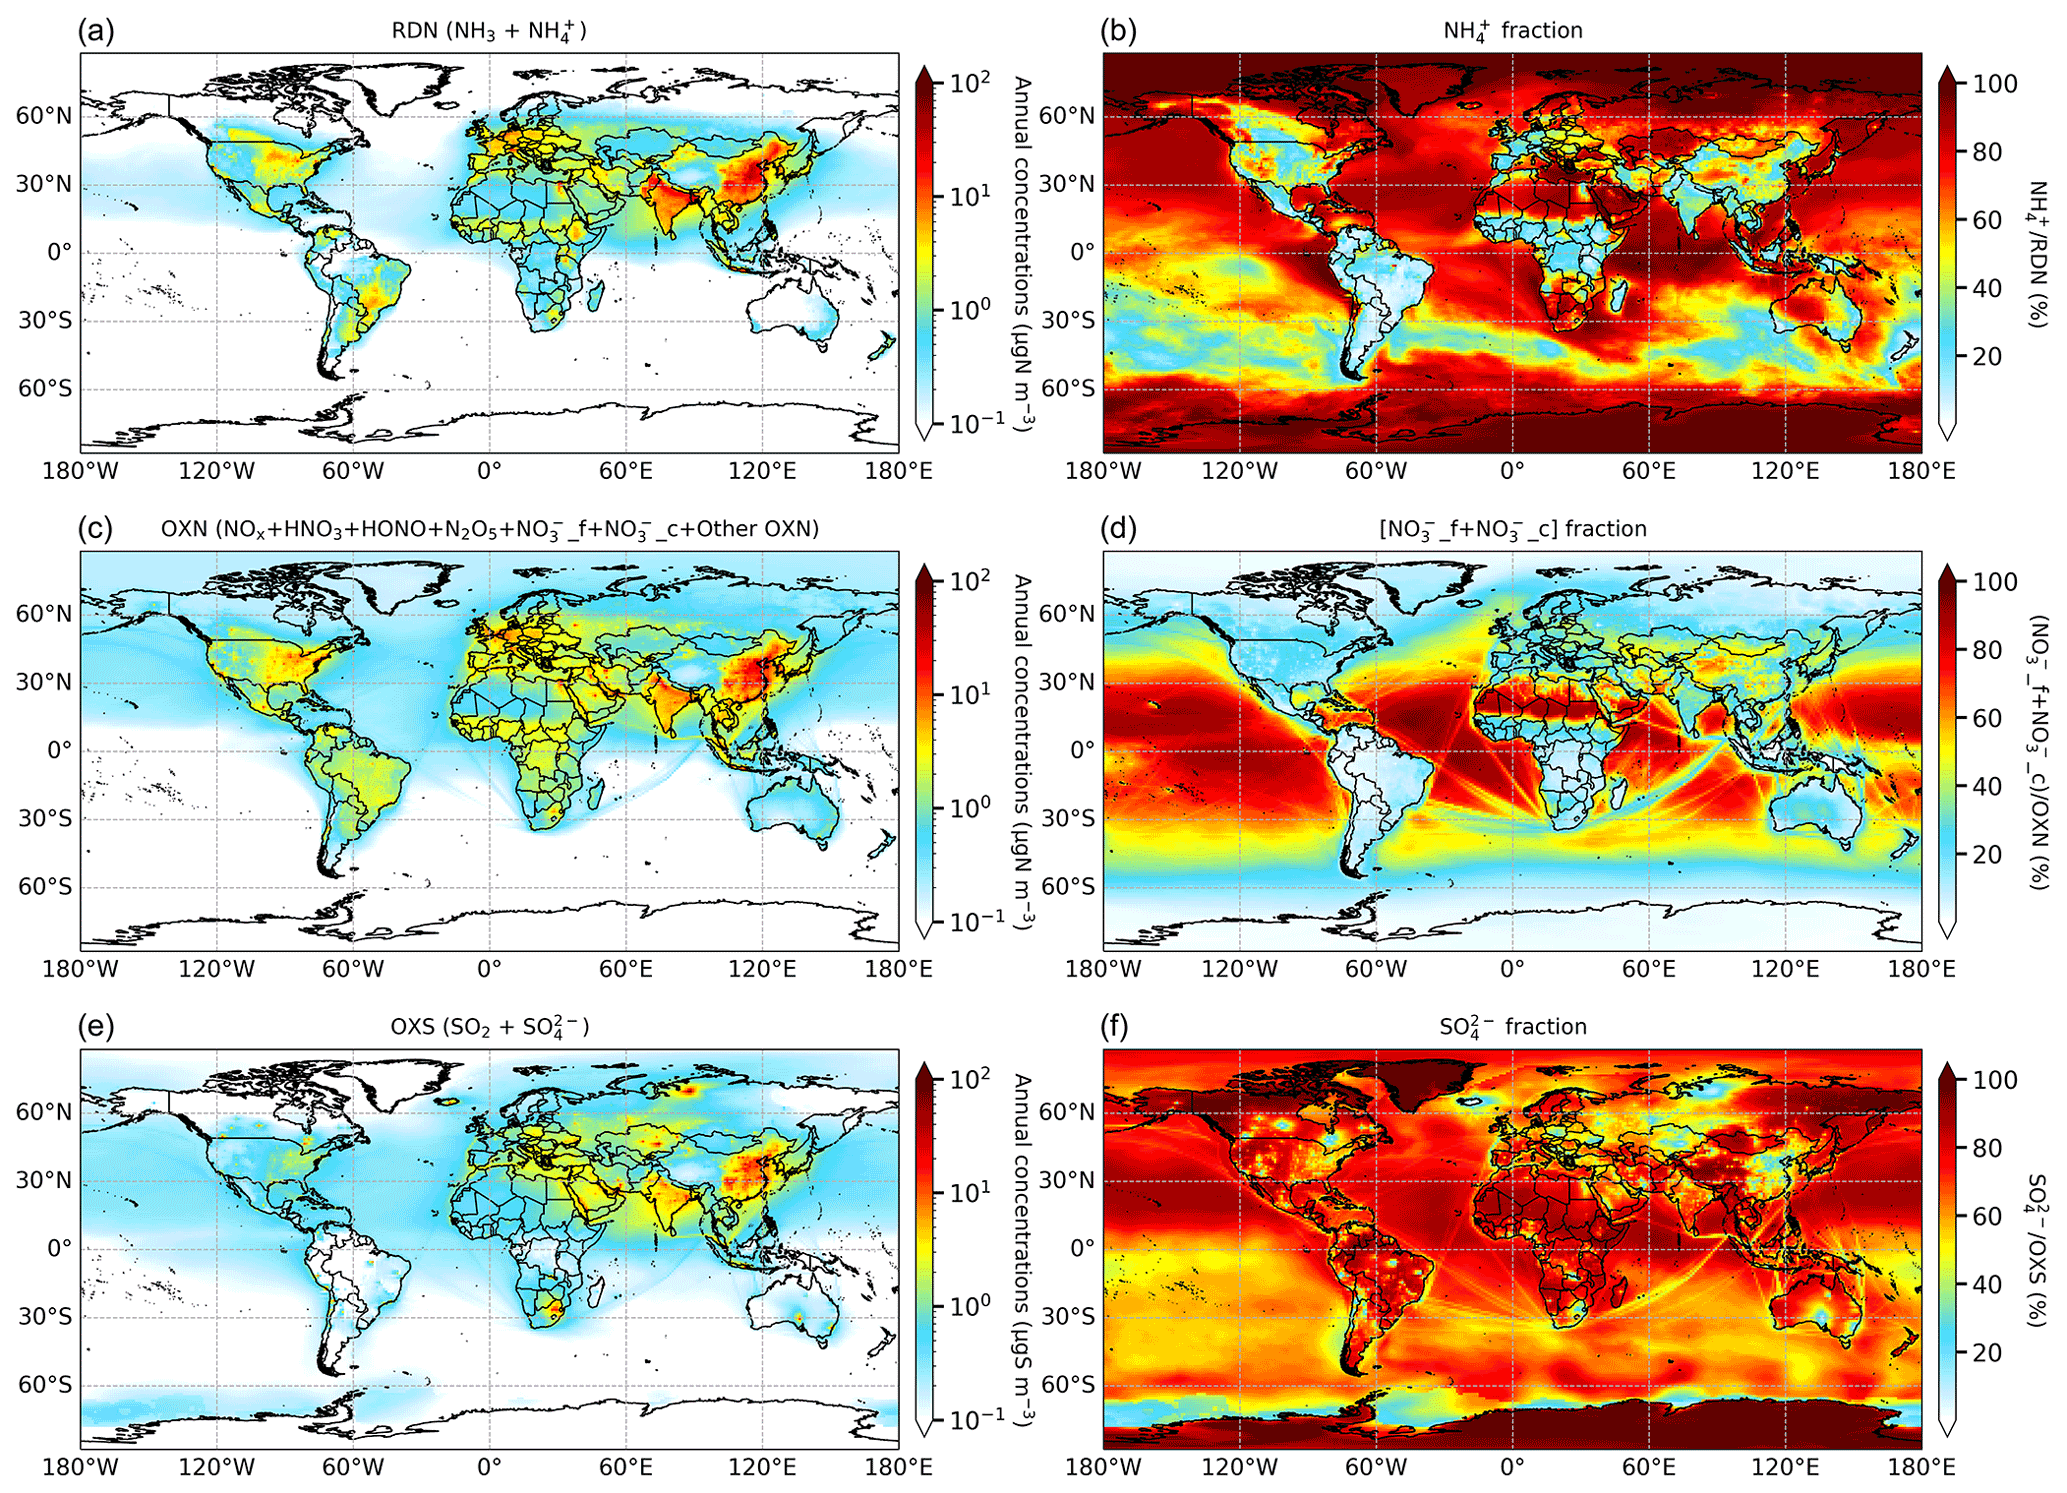
Figure 2(a, c, e) Annual mean surface concentrations (log scales) and (b, d, f) inorganic aerosol-phase fractions of (a, b) RDN, (c, d) OXN, and (e, f) OXS species. The full composition of OXN is listed in Table S1.
3.1 Global Nr and Sr concentration distributions
3.1.1 Surface distributions
Figure 2 shows the annual mean surface concentrations of RDN, OXN, and OXS and the proportions of each of these that are in the aerosol phase. Maximum concentrations of RDN, OXN, and OXS are observed over the continental regions, particularly eastern China and northern India. These are the regions with the largest population densities and emissions of NH3, NOx, and SOx, as shown in Ge et al. (2021). The surface distributions of these Nr and Sr species are broadly consistent with previous global modelling studies using GEOS-Chem (Zhu et al., 2015), STOCHEM-CRI (Khan et al., 2020), LMDz-INCA (Hauglustaine et al., 2014), and IMPACT (Xu and Penner, 2012).
The maximum RDN concentrations reach 39 µgN m−3 in eastern China; 27 µgN m−3 in northern India; 19 µgN m−3 in southern Europe; and 7–12 µgN m−3 in the eastern United States, south-eastern South America, and eastern Africa. Fertilizer application and livestock farming contribute most to NH3 emissions in East Asia, South Asia, Europe, and North America, while biomass burning plays an important role in NH3 emissions in central and eastern Africa (Aksoyoglu et al., 2020; Bray et al., 2018; Dammers et al., 2019; Wang et al., 2018; Whitburn et al., 2015). All of these regions combine both high concentrations of RDN and small proportions of NH (typically <20 %). Therefore, gaseous NH3 dominates RDN, indicating that, although reducing NH3 emissions over these regions will effectively decrease total RDN concentrations, it will have little effect on mitigating SIA formation. A clear increasing gradient of NH fraction from around 20 % to ∼ 80 % is observed away from these hotspots, indicating conversion of NH3 to NH as it disperses from emission sources. The longer lifetime and consequent longer travel distance of NH compared with NH3 (see further discussion on this in Sect. 3.3) means that NH accounts for over 90 % of RDN in remote areas, such as over the oceans, deserts, and polar regions.
In general, the concentrations of surface OXN and OXS are also greatest in regions of high RDN concentrations (Fig. 2). This is especially the case over eastern China (maximum of 49 µgN m−3 for OXN and 31 µgS m−3 for OXS) and northern India (maximum of 33 µgN m−3 for OXN and 14 µgS m−3 for OXS). The global maximum OXS concentration (54 µgS m−3) surrounds Norilsk in northern Russia where there are very large SO2 emissions from nickel and palladium mining and smelting operations (Fioletov et al., 2020). As illustration of the magnitude of the SOx emissions from that single model grid (560 Gg yr−1), it is double the SOx emissions for the whole of the UK (274 Gg yr−1) in 2015.
Over continental regions, OXN is predominantly gaseous (i.e. NOx, HNO3, HONO, N2O5, etc.) in areas with both high and low OXN concentrations apart from the remote arid regions of the Sahara, Arabia, and the Tibetan Plateau. The high proportion of gaseous OXN is driven by the widespread emissions of NOx wherever there is population. In contrast, NO is the major form of OXN over oceans, aside from the major shipping routes (e.g. the sea route from the southern edge of Africa to Southeast Asia) where there are also abundant NOx emissions. The general dominance of aerosol OXN over the oceans is driven both by sea-salt particles acting as an important marine source of coarse NO (Lee et al., 2014; Schwier et al., 2017) and the reduced depositional sink for gaseous OXN giving time for gas-to-aerosol OXN conversion.
The formation of fine NO and coarse NO follows different chemical pathways; therefore, their concentrations and spatial distributions are closely associated with the differing availability of their individual precursors. Figure S1 shows that fine NO predominates within total NO over eastern China, Europe, eastern North America, and south-eastern South America, reflecting a relative abundance of gaseous NH3 in these regions. In contrast, coarse NO accounts for >80 % of total nitrate over India, Africa, and most of the oceans, which indicates large sources of coarse particles in these regions. Karydis et al. (2016) reported a similar high contribution of coarse NO to total NO over India from their modelling of global aerosols. Studies of ambient measurements in India also conclude that the relatively high fraction of coarse nitrate is related to high levels of dust and/or sea salt over this region (Kumar et al., 2010; Boreddy et al., 2021).
OXS is globally dominated by the SO aerosol phase (Fig. 2); SO2 only accounts for more than a few percent of OXS in the locality of major SO2 emissions areas such as eastern China, northern Russia, eastern Kazakhstan, and South Africa. This reflects the fast oxidation of SO2 to SO and that OXS mainly exists in the form of SO during regional transport.
3.1.2 Spatial characterization of SO–NO–NH chemical domains
We apply the concept of chemical domains to characterize the state of ammonia neutralization of both sulfuric and nitric acids (Metzger et al., 2002a, b; Hauglustaine et al., 2014; Xu and Penner, 2012; Ansari and Pandis, 1998). Figure 3 shows the global spatial distribution in relative abundances of SO, fine NO, and NH when classified into four such domains. Global maps of the variation in the quantitative species ratios underpinning categorization into the domains shown in Fig. 3 are presented in Fig. S2a for the ratio of total ammonia (TA) to total sulfate (TS) and in Fig. S2b for the ratio of free ammonia (TA-free) to total nitrate (fine; TN-f). The definitions of these four quantities (in molar concentrations; µmol m−3) are given in Eqs. (1)–(4). The SO in TS refers to all of H2SO4, NH4HSO4, (NH4)3H(SO4)2, and (NH4)2SO4.
The TA-free term quantifies the amount of total ammonia that is in excess of that needed to fully neutralize the sulfate (i.e. the TA remaining when ). When , sufficient ammonia also exists to fully react with nitrate to form NH4NO3. An arbitrary threshold for the sum of the concentrations of fine SO, NO, and NH to be ≥ 0.5 µg m−3 has been applied to Fig. 3 in order to focus attention away from the most remote areas (Southern Hemisphere oceans and the poles) where the fine SIA concentration is very low and knowledge of the chemical domain is irrelevant for informing emissions mitigation strategies.
In the blue and yellow areas in Fig. 3, and sulfuric acid is not fully neutralized; thus, not all SO is in the form of NH4(SO4)2. Locations where this ratio is between 1 and 2 are coloured blue in Fig. 3 (green colours in Fig. S2a and grey areas in Fig. S2b) and are defined as “sulfate rich”. This is the state over Northern Hemisphere oceans and remote continental regions such as the Sahara Desert, Greenland, and Siberia. Over northern Russia and Southern Hemisphere oceans, where (yellow colour in Fig. 3), conditions can be characterized as “sulfate very rich”. As discussed in Sect. 3.1.1, northern Russia is an SO2 emission hotspot, but NH3 emissions are small. This is also the case around other very large point sources of anthropogenic SO2 emissions in Kazakhstan, southern Africa, and southern Australia. Over ocean areas, biogenic emission of dimethyl sulfide (DMS) is the major source of sulfur in marine aerosol (Fiddes et al., 2018; Jackson et al., 2020), but NH3 emission is again very small. A separation between “sulfate rich” and “sulfate very rich” regions arises because there is transport of anthropogenic continental NH3 emissions over the Northern Hemisphere oceans in the former areas. In these “sulfate rich” and “sulfate very rich” regions, essentially all NH3 has been converted to NH, as illustrated in Fig. 2 where RDN concentrations are almost entirely in the form of NH.
The green and orange areas in Fig. 3 (yellow to red in Fig. S2a) have and, consequently, (non-grey colours in Fig. S2b) and show where sulfuric acid is fully neutralized and excess NH3 remains to react with HNO3 to form NH4NO3. Most continental regions with significant SIA pollution are characterized by these conditions, including East Asia, Southeast Asia, South Asia, Europe, North America, south-eastern South America, western Africa, and eastern Australia.
The green areas in Fig. 3 have a ratio between 0 and 1 and indicate where NH3 is the limiting factor for NH4NO3 formation and, thus, where the chemical domain can be characterized as “NO rich”. The blue colours in Fig. S2b illustrate the quantitative extent of the HNO3 neutralization in these areas. This situation occurs over coastal areas around East Asia, northern Europe, and the north-eastern United States. These locations experience the transport of oxidized N from the adjacent continent and/or direct shipping emissions of NOx, but NH3 concentrations are lower because it deposits more quickly to land before transport off the coast.
The orange areas in Fig. 3 are where and are characterized as “NH3 very rich”, as the availability of nitrate limits NH4NO3 formation in these areas. This condition prevails over most of the temperate and tropical land surface in the Northern Hemisphere. Concentrations of SIA over a lot of the land in the Southern Hemisphere are (like over the Southern Hemisphere oceans) less than the 0.5 µg m−3 threshold applied to Fig. 3. Figure S2b shows that the most “NH3 rich” areas are in Central Africa, South Asia, East Asia, Southeast Asia, western Europe, South and Central America, North America, and New Zealand where there are intensive agricultural activities and/or large biomass burning and/or low NOx and SOx emissions.
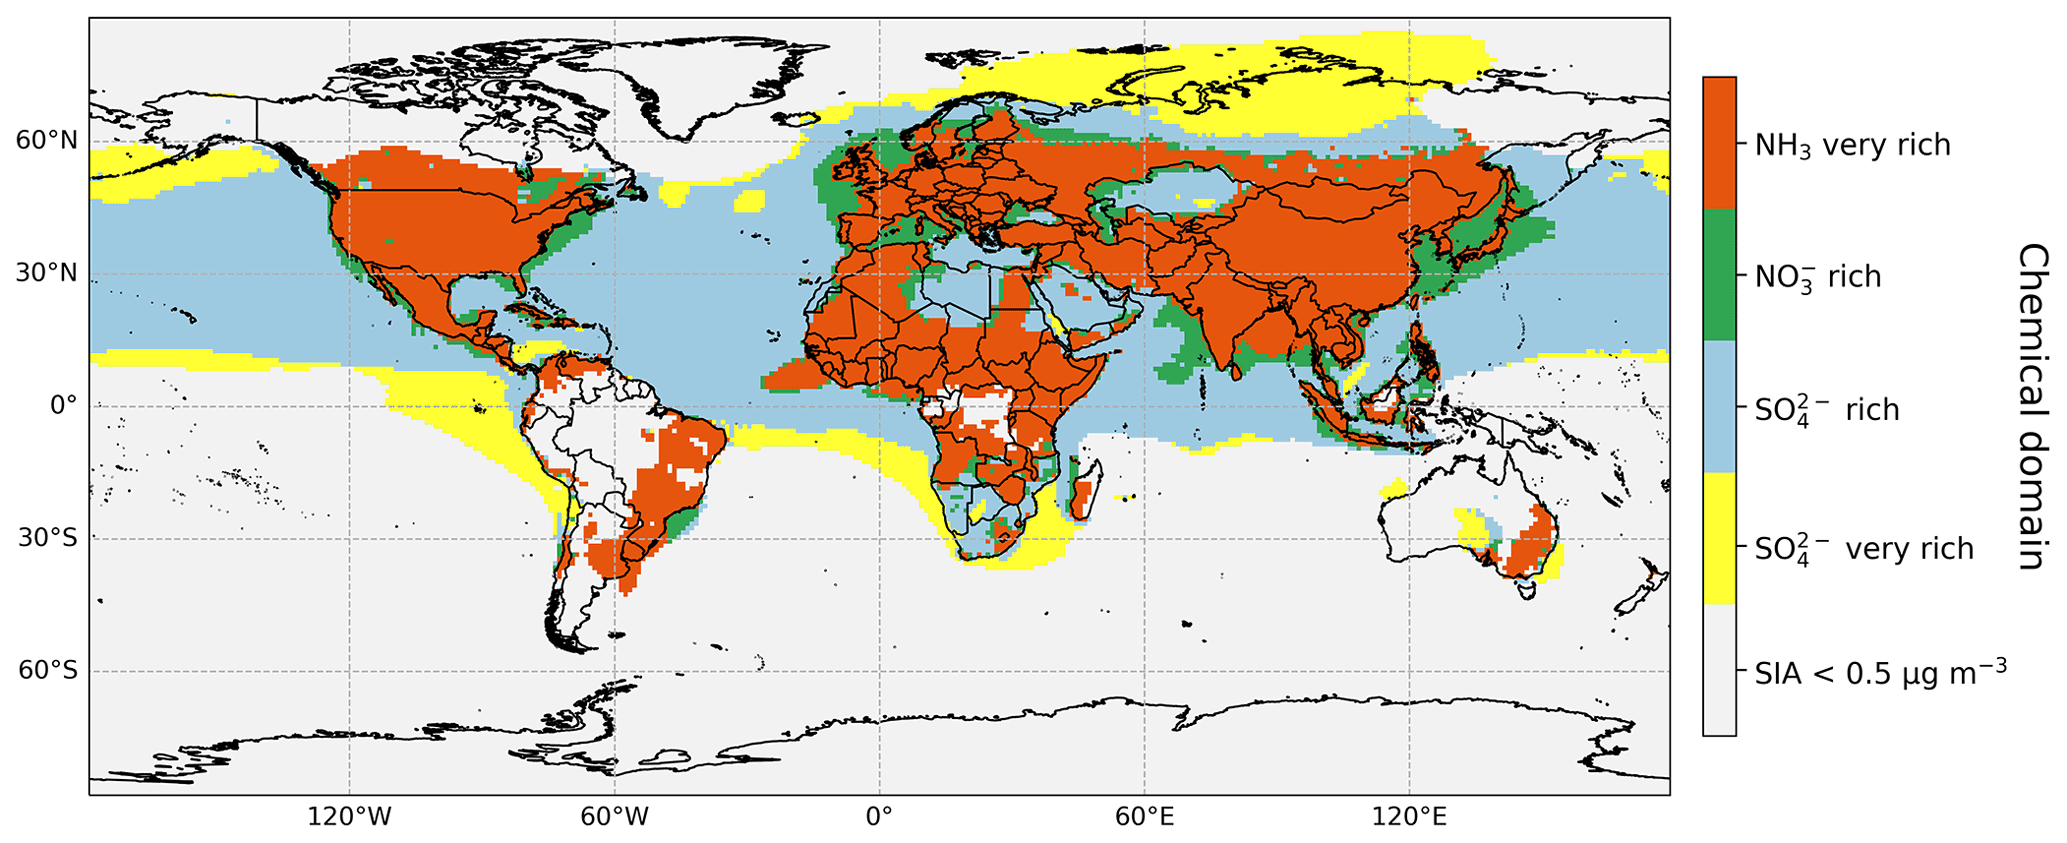
Figure 3The state of ammonia neutralization of sulfuric and nitric acids for areas where the SIA concentration in the fine-particle fraction (PM2.5) is ≥ 0.5 µg m−3. Definitions of the four chemical domains are given in the main text. Maps of the quantitative species ratios underpinning categorization into these chemical domains are given in Fig. S2.
Hauglustaine et al. (2014) and Xu and Penner (2012) reported similar findings, although both of these studies also showed “NH3 very rich” conditions over tropical oceans, which may be related to oceanic NH3 emissions if these were included in their simulations. They were not included in our model. Oceanic NH3 emissions are small (∼ 6 TgN yr−1, albeit highly uncertain; Fowler et al., 2015), compared with continental NH3 emissions (53.1 TgN yr−1; Table 1), and we deliberately exclude discussion of the chemical domain where the SIA concentration is small.
The continental values of calculated here for 2015 are larger than those reported for 2000. For instance, in western Europe, Xu and Penner (2012) and Hauglustaine et al. (2014) reported ratios of around 1.0–2.0 and 1.0–4.0 respectively, whereas we report values of around 4.0–10.0 (Fig. S2b). This temporal difference is driven not only by the increasing NH3 emissions associated with sustaining a food supply for the growing global population (Sutton et al., 2013; Behera et al., 2013b; Aneja et al., 2009) but also by the fact that a growing number of countries have been reducing NOx and SOx emissions while most have little or no control policy on NH3 emissions (Liu et al., 2018; Liu and Matsui, 2021; Aas et al., 2019; de Gouw et al., 2014). These changes in relative emissions of precursors mean an increasingly smaller proportion of gaseous NH3 is transformed to aerosol NH, which in turn increases NH3 concentrations and reduces the effectiveness of PM2.5 mitigation via NH3 emission reductions. For example, Liu et al. (2018) reported a significant growth in gaseous NH3 concentrations over the North China Plain from 2008 to 2016 allied to the rapid SO2 emission reductions.
Our results also indicate regional differences in terms of the extent of excess ammonia (Fig. S2b). Table S3 lists the maximum, median, and area-weighted mean ratios in different world regions. Among the regions with the largest RDN surface concentration, South Asia shows the most “NH3 rich” condition, with an area-weighted mean ratio of 9.6, followed by South America and Africa, whose area-weighted mean ratios are 8.6 and 7.2 respectively. For regions with an area-weighted mean ratio >1, Southeast Asia and Euro_Medi have the lowest area-weighted mean ratios of 1.9 and 2.5 respectively. This lower relative excess of NH3 of the former is associated with the large proportion of marine area in this region, while the smaller NH3 abundance in the latter is likely linked to more stringent NH3 emission targets in Europe than in other world regions via the Gothenburg Protocol and the EU National Emissions Ceilings Directive.
3.2 Global and regional Nr and Sr deposition
An important advantage of an atmospheric model is that it can apportion the different contributions to deposition that measurements cannot readily quantify. For instance, direct measurements of dry deposition are technically difficult and are very limited in terms of both spatial and temporal coverage. Furthermore, whilst measurement of NH in precipitation permits quantification of wet deposition of RDN, it cannot distinguish how much of it derives from rainout of gaseous NH3 and how much derives from rainout of particle NH. Similarly, measurements cannot distinguish between gaseous and particle sources to wet deposition of OXN and OXS. The models therefore provide additional information about the nature of Nr and Sr deposition. This is relevant because the form of deposited N affects the severity of nitrogen deposition impacts (Sutton et al., 2014; Bobbink et al., 2010). An important effect of deposited N gases and aerosols is the direct toxicity to above-ground parts of various plants. Van Herk et al. (2003) found that lichens are particularly sensitive to direct NH3 dry deposition, whilst Pescott et al. (2015) reported direct toxic effects of wet-deposited RDN for bryophytes. Additionally, it must be stressed that the lack of dry deposition comparison between model and measurement, due to the lack of measurement data, means that the numbers reported for modelled dry deposition in this section should be regarded as more uncertain.
3.2.1 RDN
Figure 4 shows the global distribution of annual RDN deposition in 2015 separately apportioned into the dry and wet deposition of NH3 and NH. The map of total RDN deposition (the sum of all panels of Fig. 4) is provided in Fig. S3. The relative contributions of the different sources of RDN deposition are illustrated in Fig. 5 for the 10 world regions outlined in Fig. 1. Figure 4a–d show similar spatial patterns of the highest depositions over East Asia, South Asia, Europe, eastern North America, south-eastern South America, and central Africa. The greatest RDN deposition (wet + dry) rate occurs in East Asia, exceeding 5300 mgN m−2 yr−1. The East Asia region receives more than one-fifth of the world's RDN deposition (Fig. 5). The maximum total RDN deposition in South Asia and Southeast Asia is in the range of 3800 to 4600 mgN m−2 yr−1, whilst in Europe, North America, South America, and Africa maximum total RDN deposition is in the range 1800 to 2200 mgN m−2 yr−1 (Fig. S3). These regions each receive 7 %–11 % of global total RDN deposition (Fig. 5). Around 15 % of RDN deposition occurs over the oceans (Rest of world in Fig. 5). In fact, as most of the other world regions also include areas of water, the proportion of global RDN depositing to seas will be greater than 15 %.
Globally, the total RDN deposition is 55.5 TgN yr−1, apportioned approximately equally (50 %) between dry and wet deposition. The global deposition can be further apportioned as 40 % NH3 dry deposition, 9 % NH dry deposition, 22 % NH3 wet deposition, and 29 % NH wet deposition (Table S4). Thus, whilst the large majority (82 %) of RDN dry deposition is in the form of NH3, the RDN wet deposition is more evenly split between rainout of gaseous NH3 (44 %) and rainout of particulate NH (56 %). Overall, 62 % and 38 % of total global RDN is removed from the atmosphere initially in the form of NH3 and NH respectively.
However, Fig. 5 shows that there are large regional variations in the contributions of different sources of RDN deposition. In South Asia, South America, and Oceania, more than 50 % of RDN deposition is in the form of NH3 dry deposition. In East Asia, Euro_Medi, North America, and Africa, dry deposition of NH3 is in the range of 42 %–49 %. Wet deposition of NH is dominant only in remote areas such as the Rest of world (54 %) and Rest of Asia (40 %) regions. Overall, the deposition of NH3 (dry + wet) accounts for well over half of total RDN deposition in all continental regions (except for Rest of Asia), which indicates that reducing NH3 emissions will be effective for reducing total RDN input from the atmosphere to continental ecosystems.
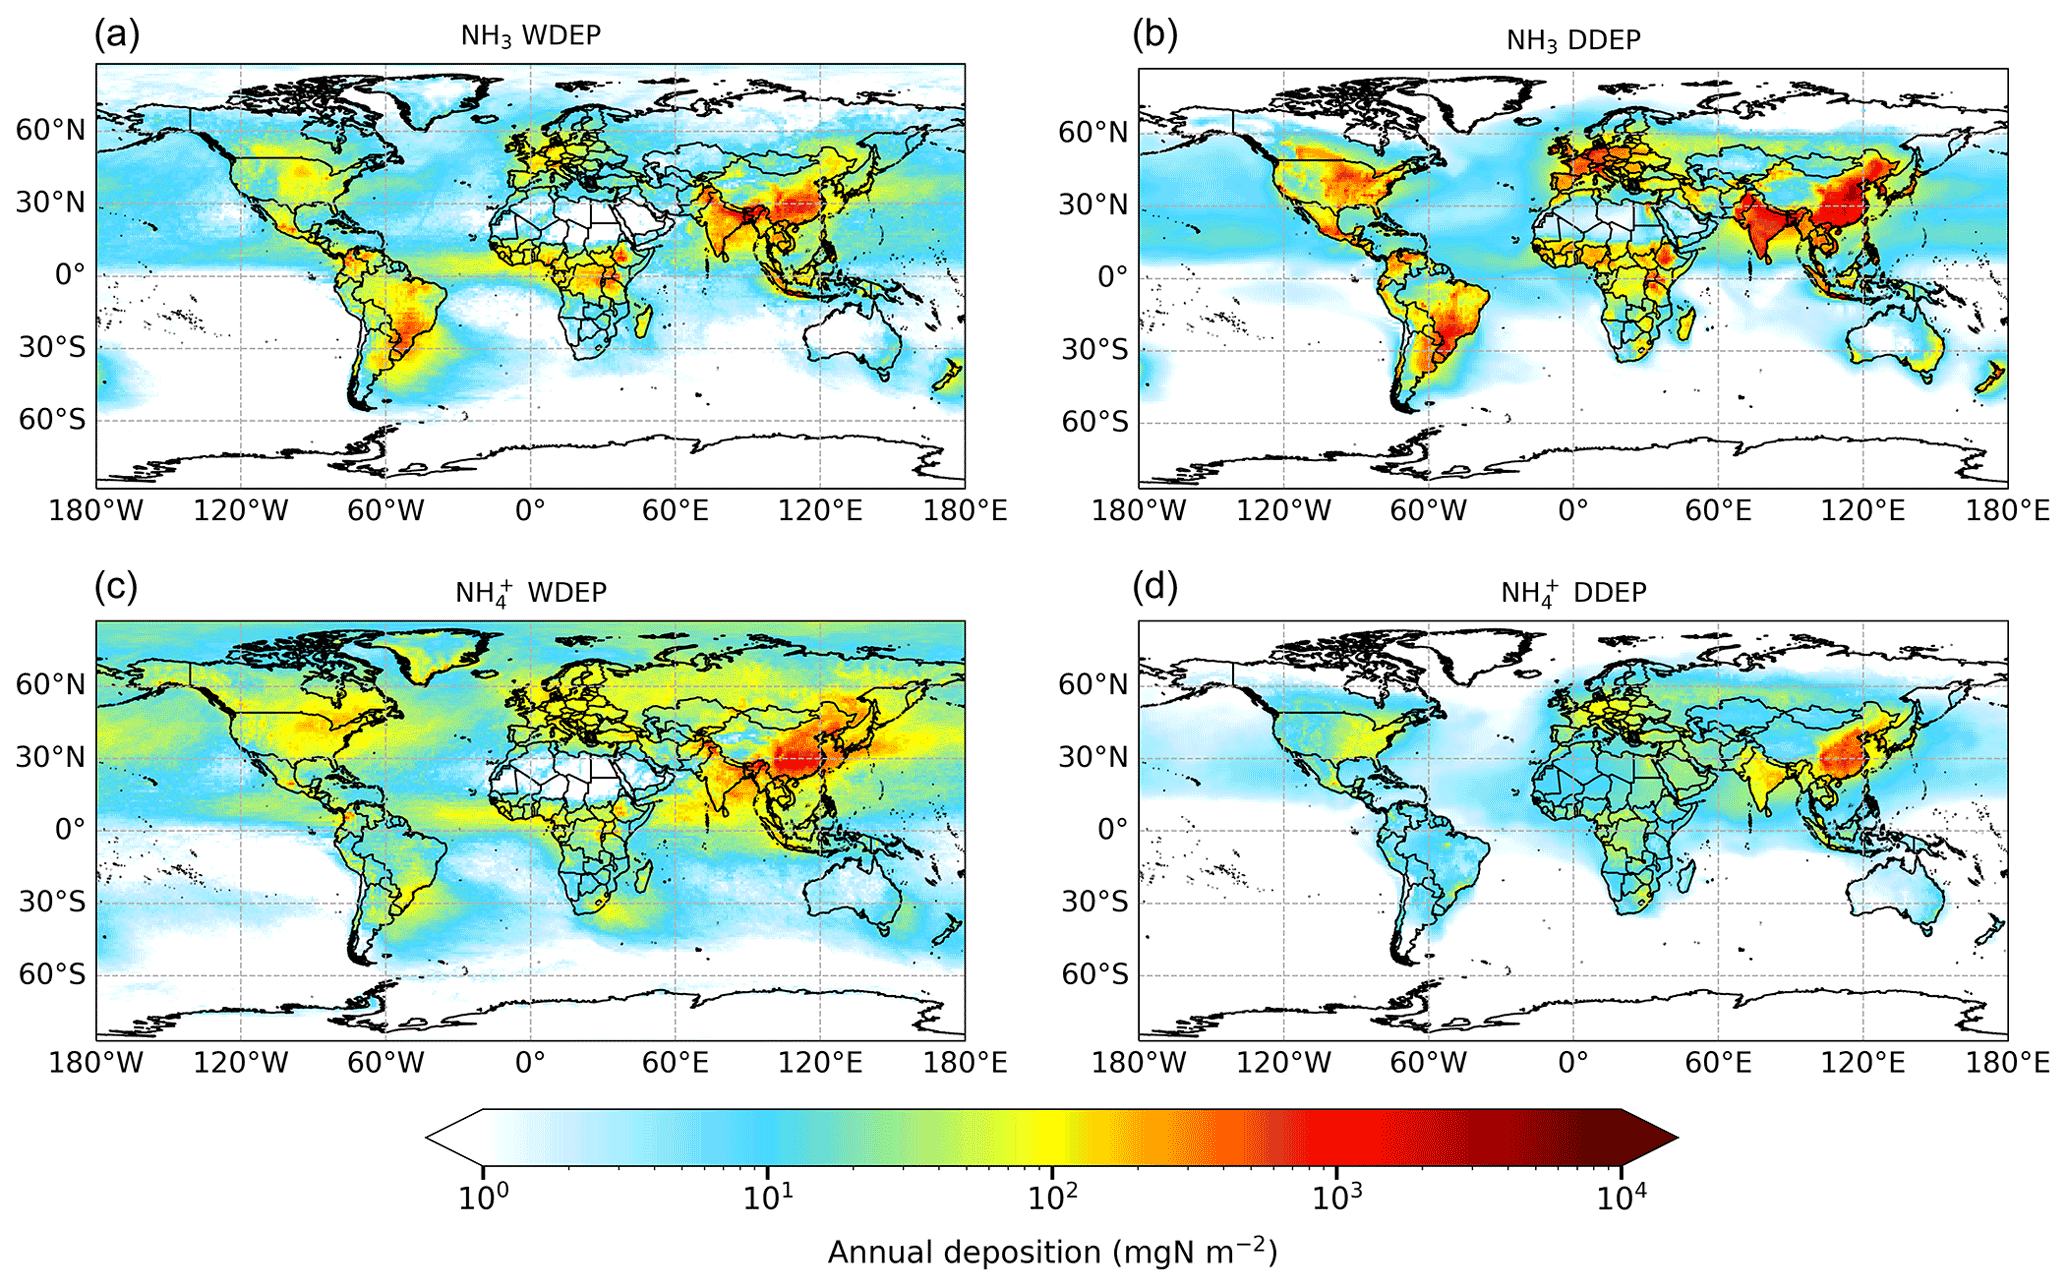
Figure 4Annual wet deposition (WDEP) and dry deposition (DDEP) of RDN components for 2015. “NH3 WDEP” and “NH WDEP” refer to wet deposition of RDN originally present in the atmosphere as gaseous NH3 or as aerosol NH respectively. Note the logarithmic scale.
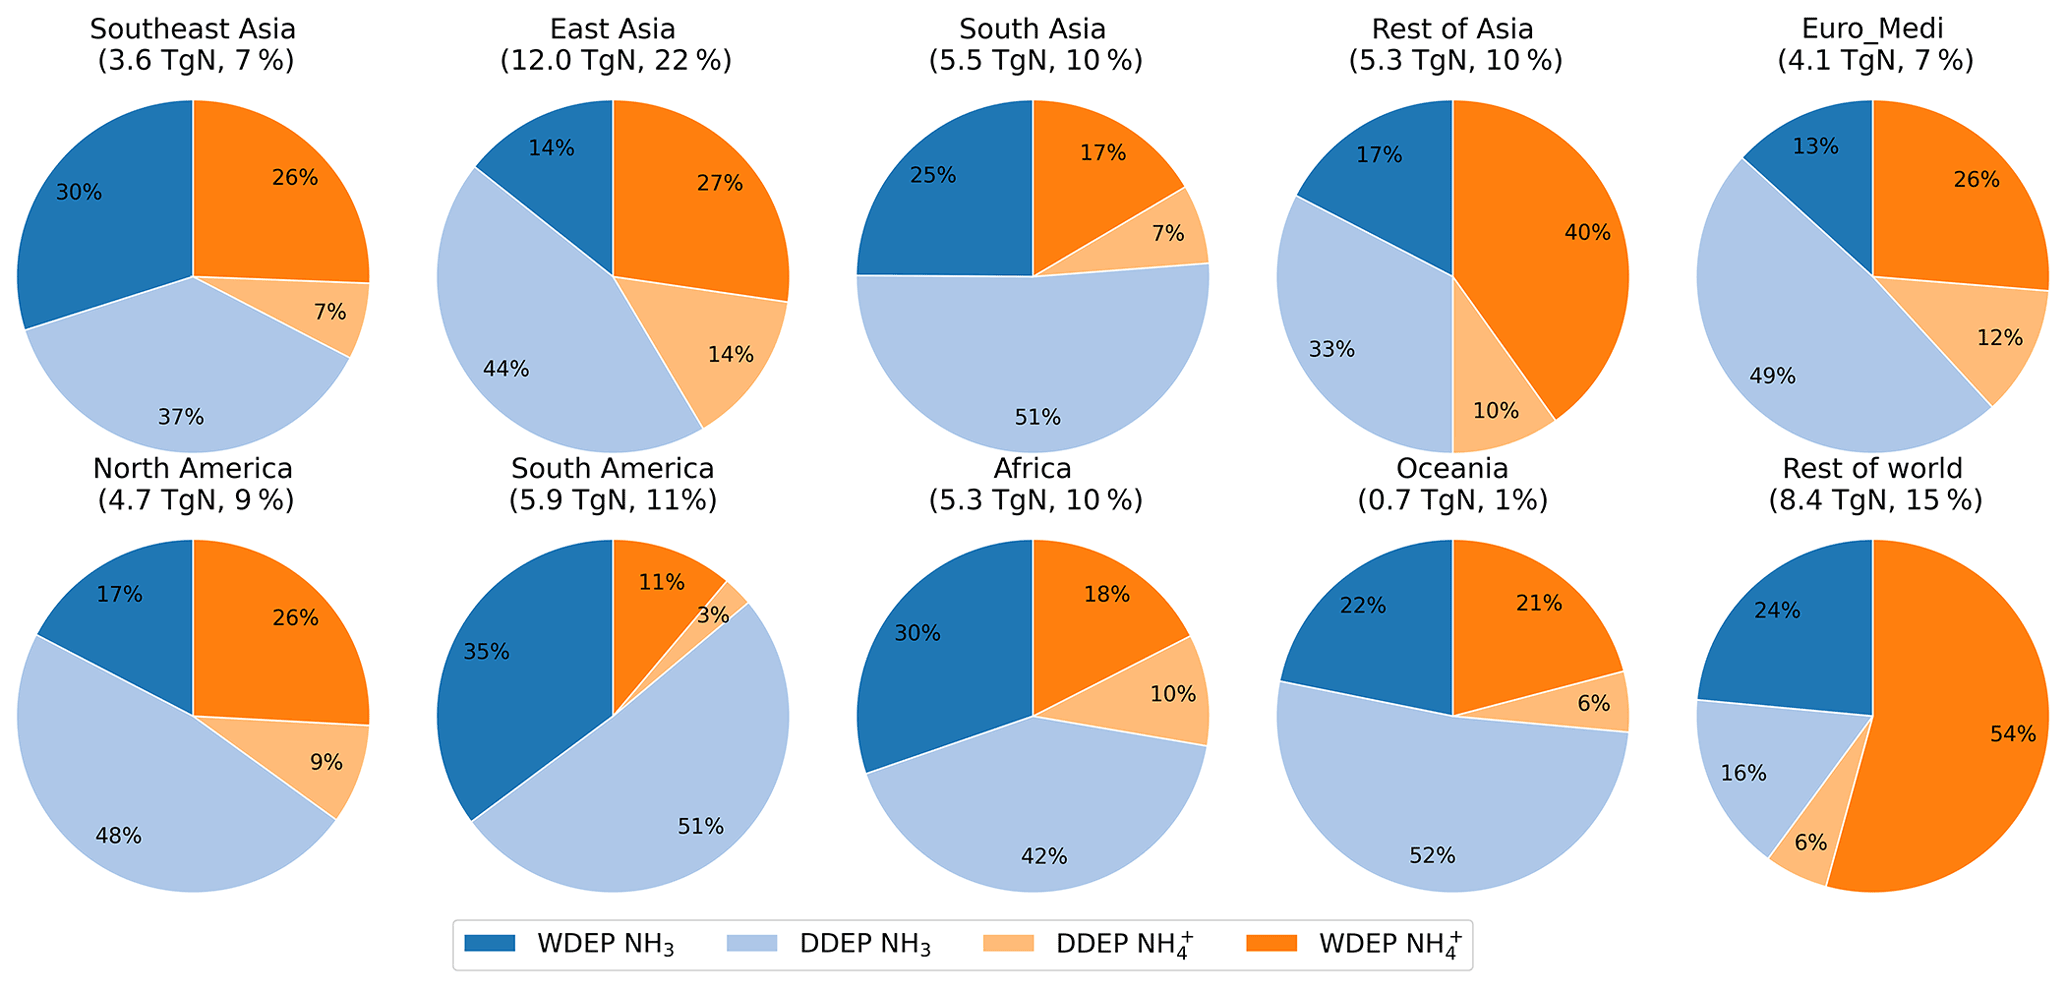
Figure 5Relative contributions to annual RDN deposition for the set of world regions defined in Fig. 1. The two darker colours collectively indicate wet deposition (WDEP), whereas the two lighter colours collectively indicate dry deposition (DDEP). The total deposited RDN (TgN) in each region and its fraction of global total RDN deposition are presented below each region name.
3.2.2 OXN
Figure 6 shows the global distribution of annual OXN deposition in 2015 apportioned into dry and wet deposition of gaseous OXN (i.e. NOx+ HNO3+ HONO + N2O5+ Other OXN species) and aerosol-phase OXN (NO_f + NO_c). The map of total OXN deposition is given in Fig. S4. As described above for RDN deposition, model simulations are able to distinguish in detail the ultimate atmospheric source of the OXN deposition, which measurements cannot; in particular, to distinguish whether dissolved nitrate in precipitation derives from gas- or aerosol-phase species as well as which species. The relative contributions of the different sources of OXN deposition for the 10 world regions outlined in Fig. 1 are shown in Fig. 7.
The regions of high OXN deposition in Fig. 6 are similar to those with high RDN deposition (Fig. 4), although shipping NOx emissions can be seen to have a notable impact on deposition of OXN over a large number of marine locations, which is not apparent for RDN deposition. The largest amounts of total OXN deposition are in East Asia (3300 mgN m−2 yr−1), followed by Southeast Asia (2800 mgN m−2 yr−1) and South Asia (1700 mgN m−2 yr−1) (Fig. S4). However, whilst the East Asia region receives 22 % of global RDN deposition (Fig. 5), this region receives only 14 % of global OXN deposition (Fig. 7). In North America, maximum OXN deposition is around 1900 mgN m−2 yr−1, whereas it is around 900 mgN m−2 yr−1 in Europe. A greater proportion of OXN deposition occurs over the oceans than is the case for RDN deposition (Rest of world proportions are 23 % and 15 % respectively), due both to the shipping emissions of NOx and the longer lifetime (hence, greater transport distance) of NO2 compared with NH3.
The global total OXN deposition in 2015 is 57.9 TgN yr−1, apportioned as 43 % dry deposition and 57 % wet deposition. The relative contributions of the individual OXN components to global OXN deposition are shown in Fig. S6. The global deposition is further apportioned as 28 % gaseous OXN dry deposition, 15 % aerosol-phase OXN dry deposition, 18 % gaseous OXN wet deposition, and 39 % aerosol-phase OXN wet deposition (Table S4). The global OXN dry deposition is almost equally split among HNO3 (34 %), coarse NO (29 %), and NOx (21 %, this is effectively dry deposition of NO2), whereas the rainout of coarse particulate NO (60 %) is the predominant form in OXN wet deposition, followed by the rainout of HNO3 (28 %). The dry-deposited fine NO and the rainout of fine NO only account for 7 % and 9 % of OXN dry deposition and OXN wet deposition respectively. The total deposition (wet + dry) of Other OXN species (predominantly PAN) contributes 5 % to global total OXN deposition, and the contributions from HONO and N2O5 are negligible. Compared with global RDN deposition, the majority of which derives from wet and dry deposition of gaseous NH3 (62 %), Fig. S6 shows that it is coarse particulate NO (46 %) that contributes most to global OXN deposition, followed by HNO3 (30 %). Overall, slightly greater OXN deposition derives from aerosol species (54 %) than from gaseous species (46 %) globally.
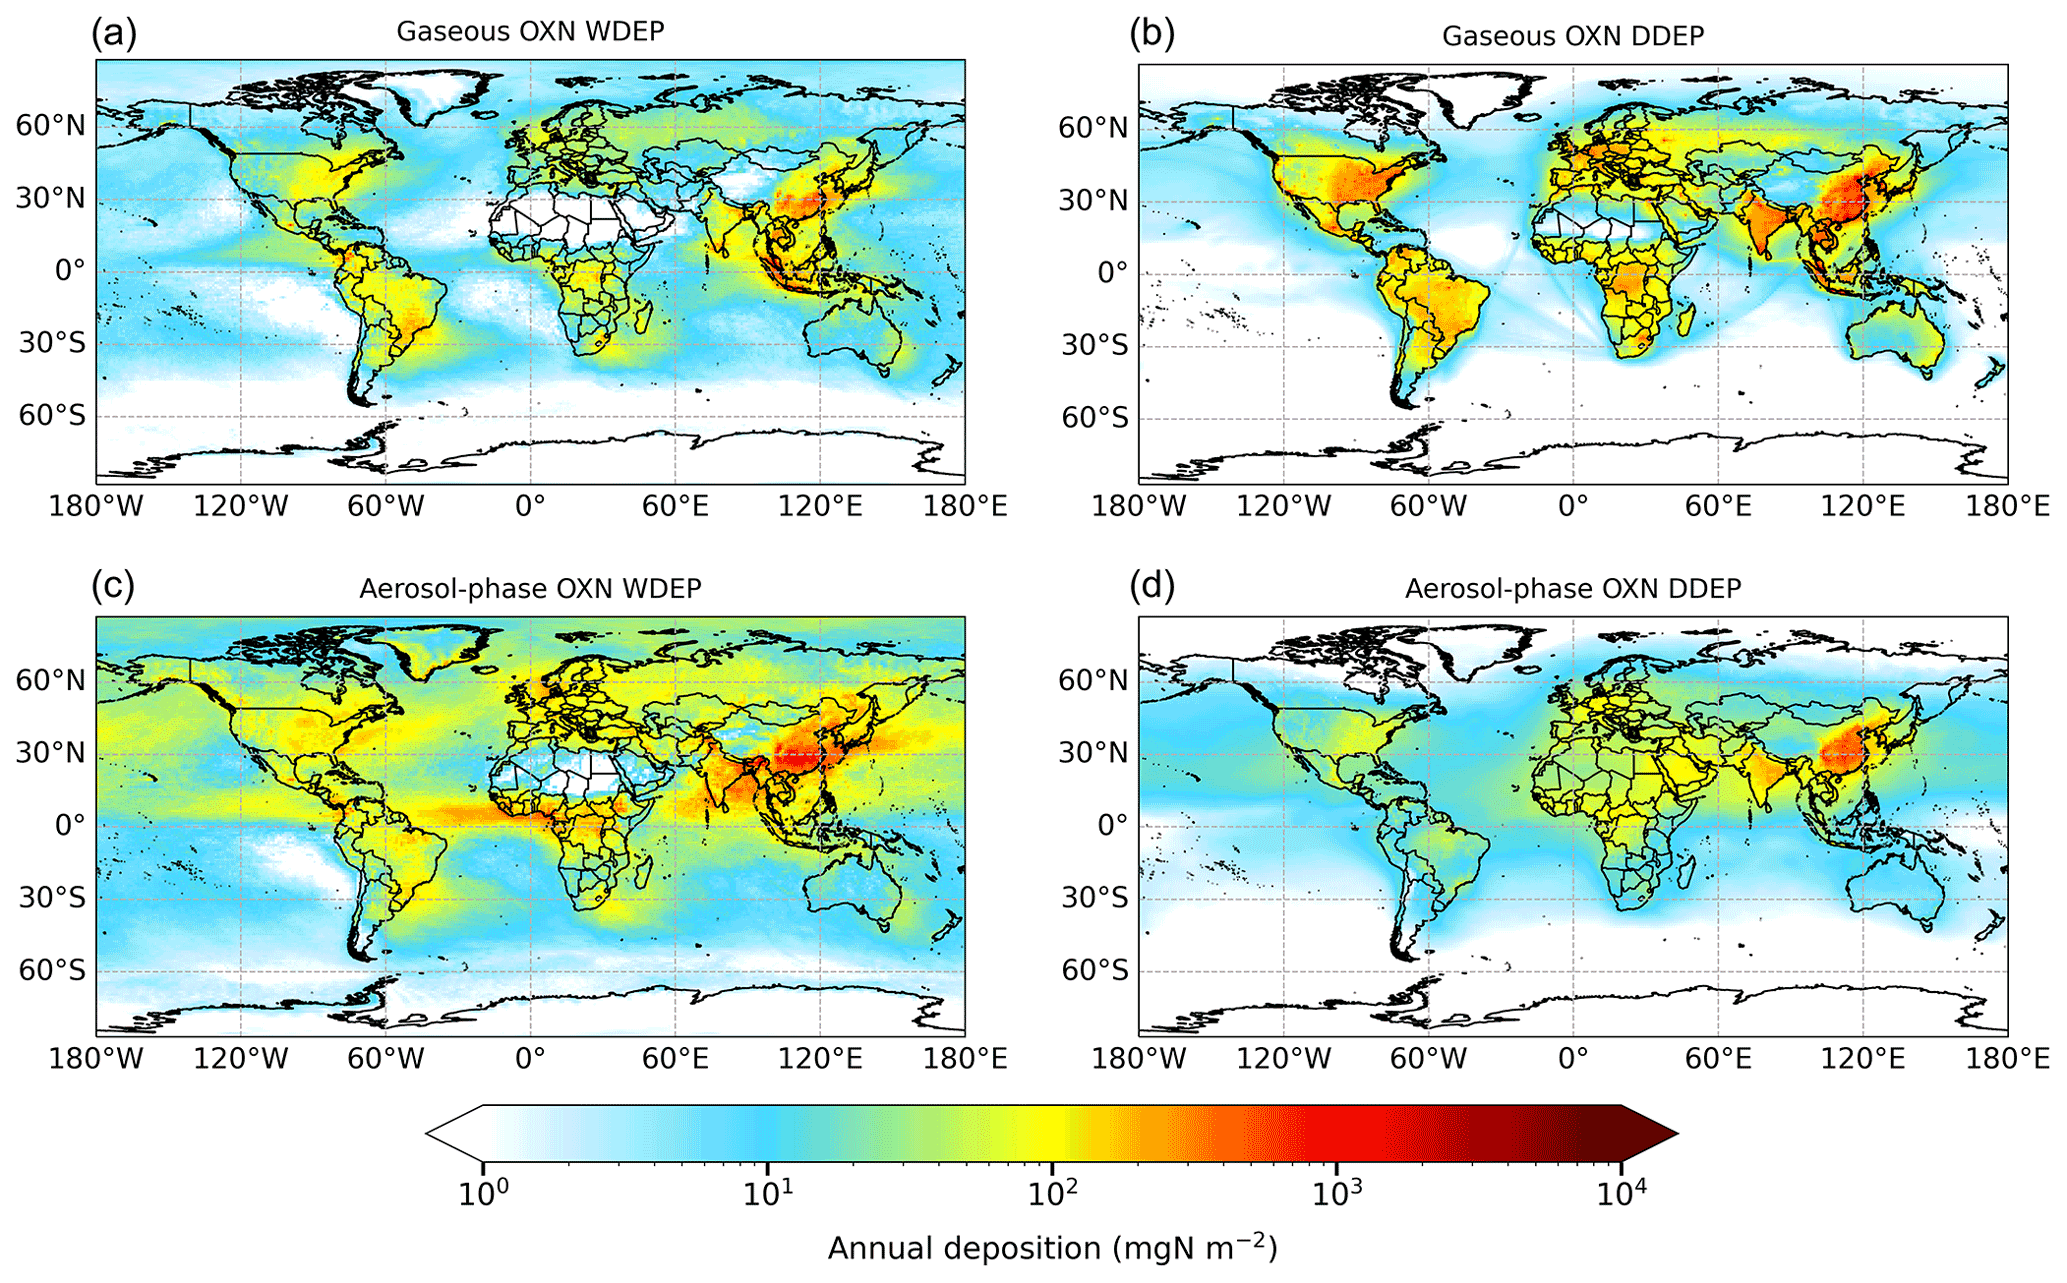
Figure 6Annual wet deposition (WDEP) and dry deposition (DDEP) of OXN components for 2015. “Gaseous OXN WDEP” and “Aerosol-phase OXN WDEP” refer to wet deposition of OXN originally present in the atmosphere as gaseous OXN or as aerosol-phase OXN respectively. The former consists of NOx, HNO3, HONO, N2O5, and Other OXN (predominantly PAN), whereas the latter consists of NO_f and NO_c (full compositional details in Table S1). Note the logarithmic scale.
Figure 7 shows that the 10 world regions can be viewed in four groups according to the nature of their OXN deposition. A group comprising Southeast Asia, South America, and Oceania is characterized by large contributions to total OXN deposition derived from wet and dry deposition of gaseous species. In Southeast Asia, wet and dry deposition of HNO3 constitutes over half (52 %) of total OXN deposition, with coarse NO (31 %) and NOx (7 %) being the second and third contributors. This indicates that it is the formation of gaseous species (mainly HNO3 and NO2) that is the most important determinant of OXN deposition in this region. Similar observations are made for South America and Oceania. Fine NO contributes very little to total OXN deposition in this group of regions.
In the regions of South Asia, Rest of Asia, Africa, and Rest of world, it is coarse NO (via both wet and dry deposition) that is the most significant contributor to total OXN deposition (wet + dry). This is consistent with the relatively greater abundance of coarse particulate NO in these regions (Fig. S1).
A third group of regions from Fig. 7 comprises North America and Euro_Medi. In these regions, the proportion contributions to total OXN deposition from wet and dry deposition of HNO3 and coarse NO are similar at 31 %–38 %, and there is also significant contribution from dry deposition of NOx (13 %–14 %) and Other OXN (6 % and 3 % for North America and Euro_Medi respectively). The relative contributions from NOx in these regions are well above their average contribution globally. There is also an important contribution (8 %–10 %) from wet and dry deposition of fine NO to total OXN deposition in these two regions.
Finally, the East Asia region is characterized by a substantial contribution (24 %) to total OXN deposition from wet and dry deposition of fine NO, a proportion that is more than double the fine NO contribution in North America and Euro_Medi. The formation of NH4NO3 aerosol is therefore an important influence on OXN deposition over East Asia, in addition to its important contribution to PM2.5 and to the latter's health effects. The atmospheric components HNO3 and coarse NO contribute an equal amount (30 %) to total wet and dry OXN deposition in East Asia.
Globally, our modelling shows that OXN (51 %) and RDN (49 %) account for almost equal proportions of the total nitrogen deposition (113.4 TgN yr−1). Other studies report similar values with OXN and RDN deposition amounts each varying in the range of 50 to 65 TgN yr−1 and contributing comparable amounts to total nitrogen deposition (Hauglustaine et al., 2014; Lamarque et al., 2013; Dentener et al., 2006; Bian et al., 2017; Xu and Penner, 2012; Tan et al., 2018).

Figure 7Relative contributions to annual OXN deposition for the set of world regions defined in Fig. 1. Labels for individual contributions <2 % are omitted to aid clarity. The darker colours collectively indicate wet deposition (WDEP), whereas the lighter colours collectively indicate dry deposition (DDEP). The “Other” OXN species category predominantly comprises PAN (full compositional details in Table S1). The total deposited OXN (TgN) in each region and its fraction of global total OXN deposition are presented below each region name.
3.2.3 OXS
Figure 8 shows the global distribution of annual OXS deposition apportioned into wet and dry deposition of SO2 and SO. The map of total OXS deposition is provided in Fig. S5. The relative contributions of the different sources of OXS deposition for the 10 world regions outlined in Fig. 1 are shown in Fig. 9. Higher levels of OXS deposition are found near emission sources in East Asia, South Asia, Europe, the eastern United States, and south-eastern Africa for all four deposition components. In addition, both wet and dry deposition of SO2 is high close to major metal smelting industry such as in northern Russia, where total OXS deposition exceeds 5400 mgS m−2 yr−1; eastern Kazakhstan; and South Africa. In East Asia and South Asia, the highest total (wet + dry) OXS depositions are around 4800 and 2400 mgS m−2 yr−1 respectively. OXS deposition in Europe and North America is much smaller, with the largest values in the range from 900 to 1100 mgS m−2 yr−1. A substantial proportion of total OXS deposition occurs over the oceans; 34 % occurs over the Rest of world region (Fig. 9), which reflects both deposition of S derived from oxidation of natural DMS emissions and the longer transport distances of anthropogenic aerosol SO. Of the continental regions, Fig. 9 shows that the greatest proportions of OXS deposition occur in the East Asia (16 %) and Rest of Asia (11 %) regions.
Globally, total OXS deposition in 2015 is 50.5 TgS yr−1, of which 54 % is via wet deposition and 46 % is via dry deposition. The largest contributions to total OXS deposition are wet deposition of aerosol SO (44 %) and dry deposition of SO2 (35 %) (Table S4). Rainout of SO2 into wet deposition contributes 11 %, and dry deposition of aerosol SO contributes 10 %. This means that, globally, slightly greater OXS deposition derives from aerosol SO (54 %) than from SO2 (46 %). This is a similar situation to that for OXN deposition but contrasts with RDN deposition, for which 62 % ultimately derives from the gaseous component (NH3) and only 38 % derives from the aerosol component (NH).
The total OXS deposition that we calculate for 2015 is around half that reported by Hauglustaine et al. (2014) for 2000 (107 TgS yr−1) and 40 % lower than that reported by Tan et al. (2018) for 2010 (84 TgS yr−1). It is also lower than the values for 2000 (range 75–100 TgS yr−1) from a 23-model intercomparison reported by Dentener et al. (2006). The lower OXS deposition value presented here is assumed to be due in part to the considerable reduction in global sulfur emissions from 2000 to 2015 (Fowler et al., 2020; Aas et al., 2019). A direct comparison of modelled S deposition between our work and other studies is confounded by the use of different inventories for both anthropogenic and natural emissions.
As for RDN and OXN, the relative contributions of the different sources of OXS deposition vary across the 10 world regions (Fig. 9). However, the regional composition patterns of OXS deposition are broadly similar to those of RDN deposition, with dry deposition of SO2 (23 %–46 %) and wet deposition of SO (34 %–56 %) being the two most important contributors in all world regions. The total depositions (wet + dry) of SO2 and SO contribute almost equal proportions to total OXS deposition in Southeast Asia, South Asia, North America, South America, and Oceania. In the East Asia and Euro_Medi regions, the sum of SO2 deposition contributes slightly more (55 %–56 %) to total OXS deposition, whereas it is SO that contributes most (57 %–67 %) to total OXS deposition in the Rest of Asia, Africa, and Rest of world regions.
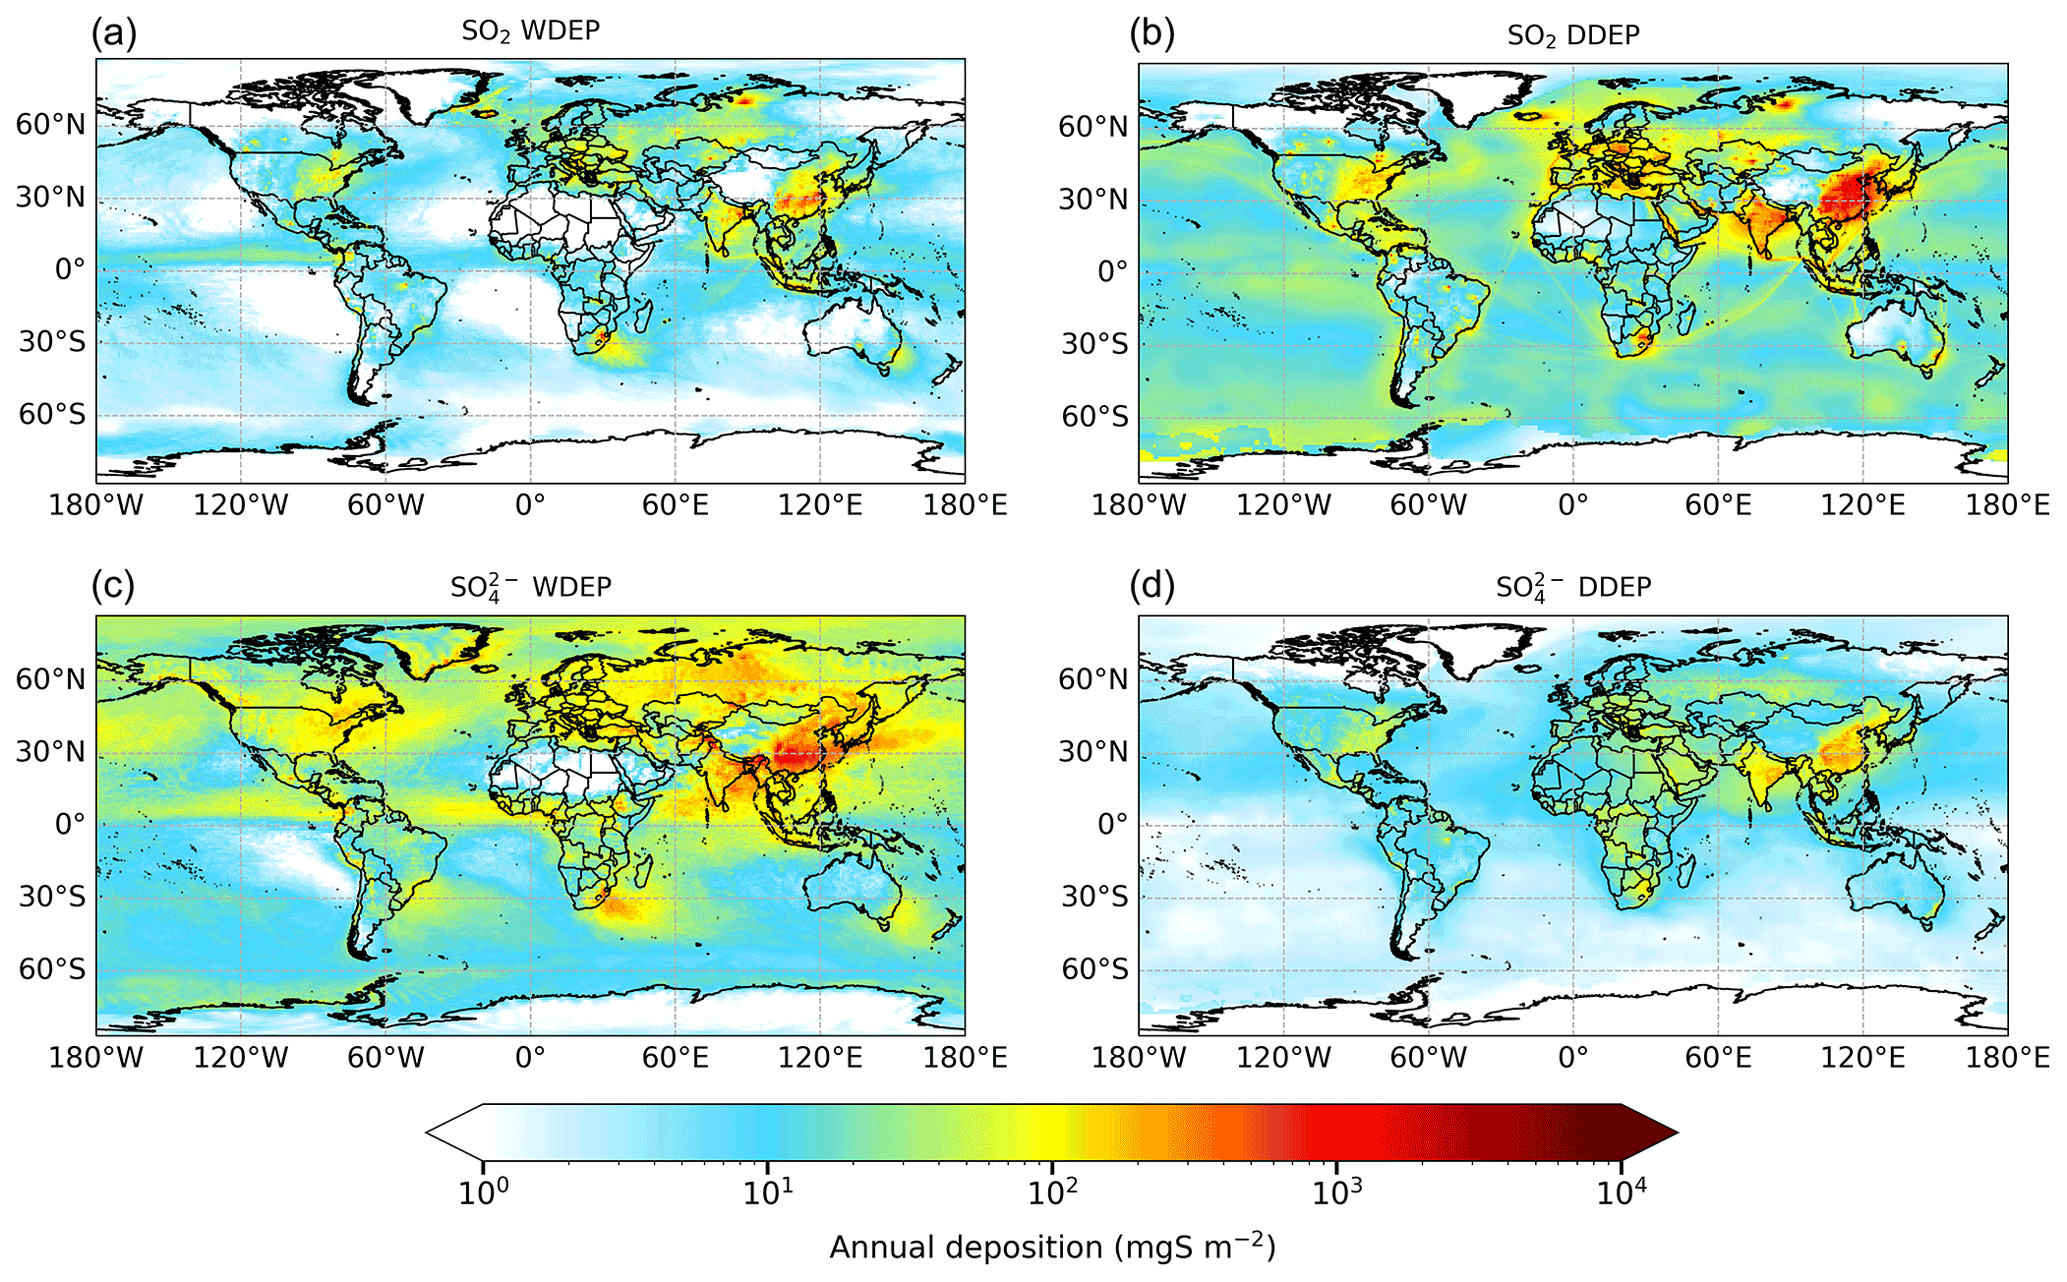
Figure 8Annual wet deposition (WDEP) and dry deposition (DDEP) of OXS components for 2015. “SO2 WDEP” and “SO WDEP” refer to wet deposition of OXS originally present in the atmosphere as gaseous SO2 or as aerosol SO respectively. Note the logarithmic scale.
In summary, on a global basis, wet deposition and dry deposition currently contribute equally to RDN deposition. For OXN and OXS, wet deposition contributes slightly more than dry deposition. These proportions vary regionally according to local precursor emission strengths and climatology. For RDN deposition, dry deposition of NH3 is the predominant contributor in most regions except for Rest of Asia and Rest of world (essentially oceans) where NH3 emissions are small and RDN deposition is largely determined by the transport of aerosol NH from other regions (see Sect. 3.2.1). Further reductions in NH3 would therefore efficiently reduce the deposition of RDN in most world regions. The two largest contributors to OXN deposition in all regions are HNO3 and coarse NO (both occurring by both wet and dry deposition). Dry deposition of NOx (i.e. NO2) is the third largest contributor in most regions except for East Asia and Rest of world. The deposition of fine NO is only important over East Asia and to a lesser extent in the Euro_Medi region. Due to the general dominance of aerosol-phase NO in OXN deposition, changes in primary NOx emissions may not have a direct and linear influence on the deposition of OXN. Sensitivity experiments focusing on the response of deposition to emission changes are required to gain more insight into this issue. For OXS deposition, SO2 and SO contribute almost equally to total OXS deposition in most regions. More specifically, the sum of dry deposition of SO2 and wet deposition of SO accounts for at least 67 % of total OXS deposition in all world regions.
3.3 Global and regional Nr and Sr budgets
3.3.1 Global budgets
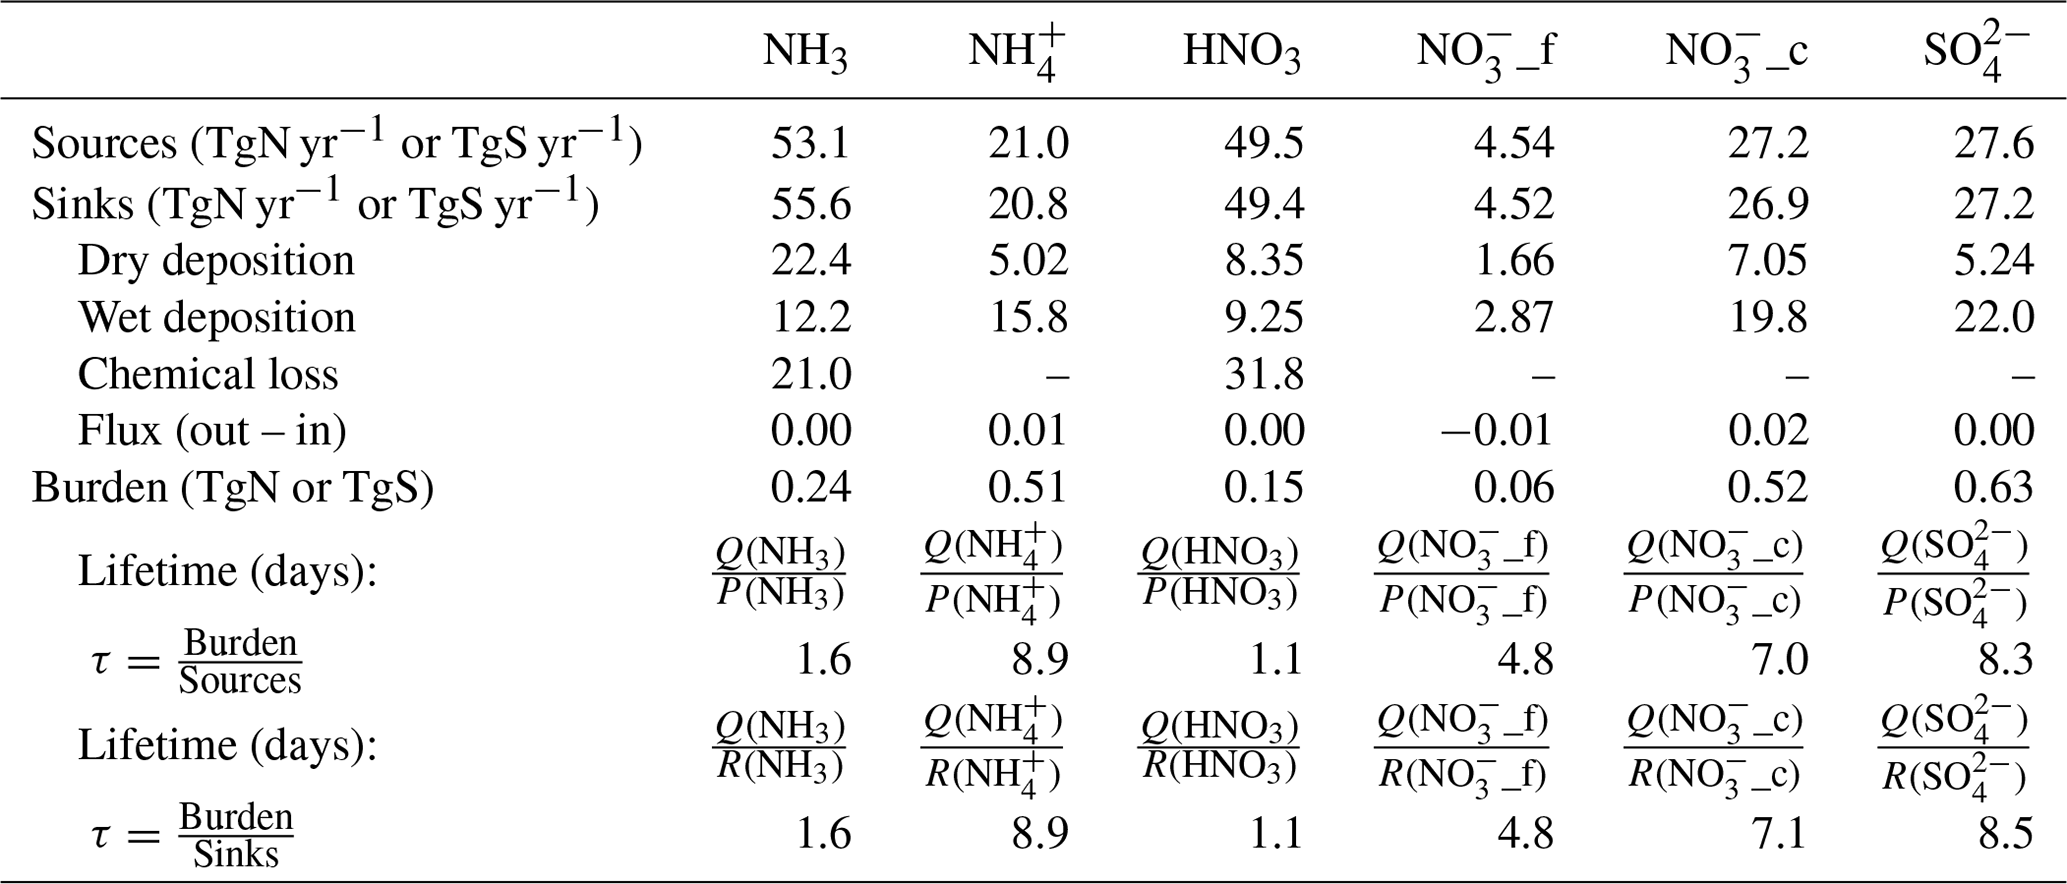
Table 1 summarizes global tropospheric budget data for RDN, OXN, and OXS for 2015. Table 2 does likewise for the individual components NH3, NH, HNO3, fine NO, coarse NO, and SO. In this study, the top of the troposphere is defined as the top of our model domain at 100 hPa. Table 1 shows that net exchange of chemical species at the top of the model domain (“Flux in” and “Flux out”) is negligible. We calculate atmospheric lifetimes based on both sources and sinks. The detailed calculation procedure is described in the Supplement (Sect. S1.2).
The only source of atmospheric RDN is the annual NH3 surface emission of 53.1 TgN. The annual average burden of RDN is 0.75 TgN, and it has a global lifetime of 4.9–5.2 d depending on how this is calculated (Table 1). The total deposition of NH3 is 34.6 TgN yr−1 (Table 2); this contributes 62 % of the sink of NH3 and occurs as 65 % dry deposition and 35 % wet deposition. Partitioning of NH3 into NH aerosol, which is also the only source of NH, contributes 21.0 TgN yr−1 (38 %) to the total sink of NH3. The NH loss comes mainly from wet deposition, 15.8 TgN yr−1 (76 %), and to a lesser extent from dry deposition, 5.02 TgN yr−1 (24 %). Net loss to the stratosphere is negligible. The global average tropospheric lifetime of NH (8.9 d) is much longer than that of NH3 (1.6 d), which is consistent with the annual average NH burden (0.51 TgN) being more than double that of NH3 (0.24 TgN) (Table 2).
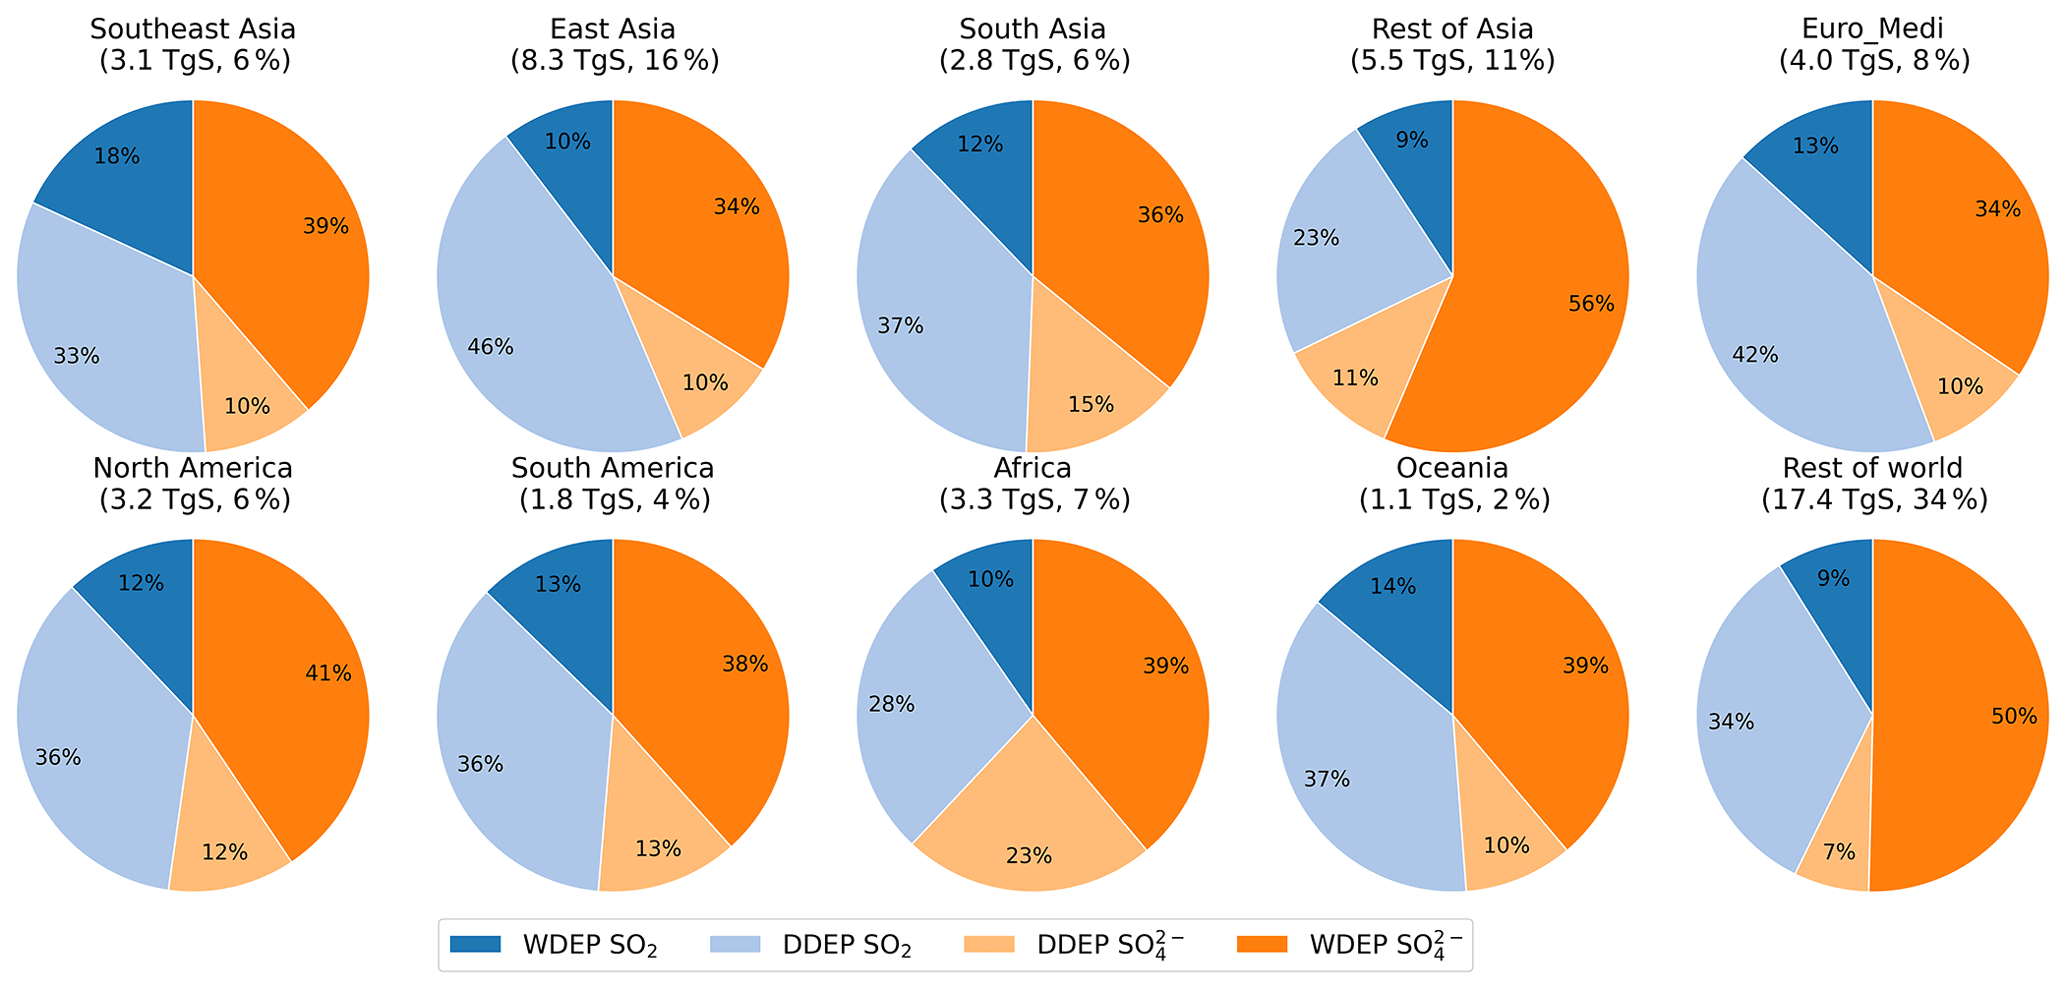
Figure 9Relative contributions to annual OXS deposition for the set of world regions defined in Fig. 1. The two darker colours collectively indicate wet deposition, whereas the two lighter colours collectively indicate dry deposition. The total deposited OXS (TgS) in each region and its fraction of global total OXS deposition are presented below each region name.
Xu and Penner (2012), Hauglustaine et al. (2014), and Bian et al. (2017) report similar global total NH3 emissions (50.5–53.6 TgN yr−1 for 2000 and 51.8 TgN yr−1 for 2008) but smaller burdens and shorter lifetimes of NH3 and NH than we report here. The respective burdens of NH3 and NH are 0.07 TgN (lifetime of 0.46 d) and 0.26 TgN (lifetime of 3.23 d) in Xu and Penner (2012) and 0.09 TgN (lifetime of 0.63 d) and 0.22 TgN (lifetime of 4.52 d) in Hauglustaine et al. (2014) for 2000. Burdens of NH3 and NH averaged across nine models in Bian et al. (2017) for 2008 are 0.16 and 0.25 TgN with a corresponding lifetime of 0.72 and 4.3 d respectively. It is important to note that the NH3 burden across the nine models in Bian et al. (2017) varied by a factor of 17. This indicates the sensitivity of burdens and lifetimes of NH3 and NH to the definition of model domain, the deposition pathways, and the interactions between NH3 and acidic species in different models.
Table 1Global tropospheric budgets of total RDN, OXN, and OXS in 2015. Flux (out – in) = Flux out – Flux in. Q is the annual average burden, P is the production pathway (i.e. sources), R is the removal pathway (i.e. sinks), and τ is atmospheric lifetime. The constituents of the three groups are listed in Table S1.

The global atmospheric OXN source and sink fluxes are 56.6 and 57.9 TgN yr−1 respectively (Table 1). The annual average OXN burden is 1.20 TgN, with a global mean lifetime of 7.6 or 7.7 d depending on how this is calculated. Detailed global budgets of HNO3 and fine and coarse NO are listed in Table 2. As quantification of the flux of HNO3 through photolysis and reaction with OH is not available as model output, the HNO3 budget presented here includes only deposition and aerosol nitrate formation. Xu and Penner (2012) and Hauglustaine et al. (2014) report that 6.9 %–10 % of HNO3 loss occurs via photolysis and reaction with OH, so these loss routes are relatively small. The total chemical production of HNO3 in our study is 49.5 TgN yr−1, which is 17 % higher than the 42.3 TgN yr−1 reported by Xu and Penner (2012) and 2 % higher than the 48.5 TgN yr−1 in Hauglustaine et al. (2014). The total loss of HNO3 is 49.4 TgN yr−1, of which 17.6 TgN yr−1 (36 %) is removed from the atmosphere by deposition, almost equally via dry deposition (8.35 TgN yr−1) and wet deposition (9.25 TgN yr−1). The remaining 64 % of the HNO3 loss goes into formation of 4.54 TgN yr−1 fine nitrate (14 % of the aerosol nitrate source) and 27.2 TgN yr−1 coarse nitrate (86 % of the aerosol nitrate source). The tropospheric annual average burden of HNO3 is 0.15 TgN with a lifetime of 1.1 d.
The loss of fine and coarse nitrate is only via deposition, and 72 % of total nitrate loss is due to wet deposition. The calculated nitrate lifetimes range between 4.8 and 7.1 d, which are in line with lifetimes (4.6–6.3 d) reported in other studies (Xu and Penner, 2012; Hauglustaine et al., 2014; Bian et al., 2017). Coarse nitrate (7.0–7.1 d) has a slightly longer lifetime than fine nitrate (4.8 d). Our calculated total nitrate annual average burden is 0.58 TgN, with fine NO comprising only 10 % of this total. This total nitrate burden is around 3 times greater than the value in Xu and Penner (2012) and Hauglustaine et al. (2014) for 2000 (0.17–0.18 TgN), which likely reflects a shift in gas–aerosol partitioning between 2000 and 2015 from gas-phase HNO3 more towards aerosol-phase NO, especially given that their HNO3 burden of 0.30 TgN is double our value. It is also possible that the simulation of nitrate burdens is more sensitive to coarse-particle emissions and the production of coarse nitrate in our model than in the models used by Xu and Penner (2012) and Hauglustaine et al. (2014).
The dominance of coarse nitrate in the global total nitrate burden is also observed in other global modelling studies. Hauglustaine et al. (2014), Xu and Penner (2012), and Bauer et al. (2007) reported a relative contribution of coarse-mode nitrate of 72 %, 77 %, and 79 % to the total nitrate burden in their respective models for 2000. Additionally, the lifetime of fine nitrate calculated in our work is comparable with other literature values. Park et al. (2004) reported a global fine-nitrate lifetime against deposition of 3.2 d for 2001, Feng et al. (2007) reported a global lifetime of total nitrate (fine + coarse) of 5.0 d for 1997, and Alexander et al. (2020) reported a global lifetime of inorganic nitrate (HNO3+ total NO) for the 2000–2015 period on the order of 3–4 d.
For OXS, emission of SO2 is the only source, and deposition (wet + dry) is almost the only sink pathway (Table 1). The annual average burden of OXS is 0.78 TgS with a lifetime of 5.6–5.9 d depending on how it is calculated. The total source of SO is 27.6 TgS yr−1 (Table 2). The dominant loss of SO is wet deposition (81 %) with the remaining loss (19 %) being dry deposition. The annual average SO burden in the troposphere is 0.63 TgS. The SO lifetime of 8.3–8.5 d is very similar to the NH lifetime, which can be explained by the close chemical association between these two species in atmospheric SIA.
Table 2Global tropospheric budgets of NH3, NH, HNO3, NO, and SO in 2015. Flux (out – in) = Flux out – Flux in. Q is the annual average burden, P is the production pathway (i.e. sources), R is the removal pathway (i.e. sinks), and τ is atmospheric lifetime.
Differences in species' lifetimes underpin the differences in the vertical and horizontal distributions of the species. For example, as discussed in Sect. 3.1.1, gaseous NH3, with a short lifetime, only shows a dominant contribution to the total RDN surface concentration in places near emission sources, whereas aerosol-phase NH, as a RDN reservoir species with a longer lifetime, is the major form of RDN over the remote continental regions and oceans.
The vertical distributions of Nr and Sr species shown in Fig. 10 also reflect the different species' lifetimes. All species exhibit strong vertical gradients of decreasing concentration from the surface up to 10 km. The gaseous species (NH3, NO2, and SO2) have peak concentrations at the surface between 20 and 40∘ N, as shown in their surface distribution maps (Sect. 3.1.1). These gaseous species are emitted at the surface, and their lifetimes are too short for significant mixing to high altitudes. Between the model surface layer (∼ 50 m) and ∼ 2.5 km, the maximum zonal mean of NH3 and SO2 decreases from 1.77 to 0.31 µg m−3 and from 1.78 to 0.23 µg m−3 respectively, whereas the concentration gradient of NO2 is steeper, with the maximum zonal mean decreasing from 4.11 to 0.10 µg m−3, reflecting that production and removal processes of NO2 mainly occur in the surface layer.
In contrast, the secondary species, NH, NO (fine + coarse), and SO, are mixed to higher altitudes than their precursors. The zonal mean concentrations of the secondary species also show a larger horizontal variation range (10–60∘ N), again reflecting their longer transport times. A notable observation from Fig. 10 is that the maximum concentrations of the secondary aerosol species are not at the surface, which is a feature that will not be apparent from surface measurements of these species. The maximum zonal mean of NH (1.20 µg m−3) and SO (2.58 µg m−3) occurs in the model level from 88 to 177 m above the surface, whereas the maximum NO (3.80 µg m−3) occurs in the 177–313 m model level. These elevated maxima in secondary components reflect their lack of surface emission and the time taken for the in-atmosphere oxidation and gas-to-particle chemistry.
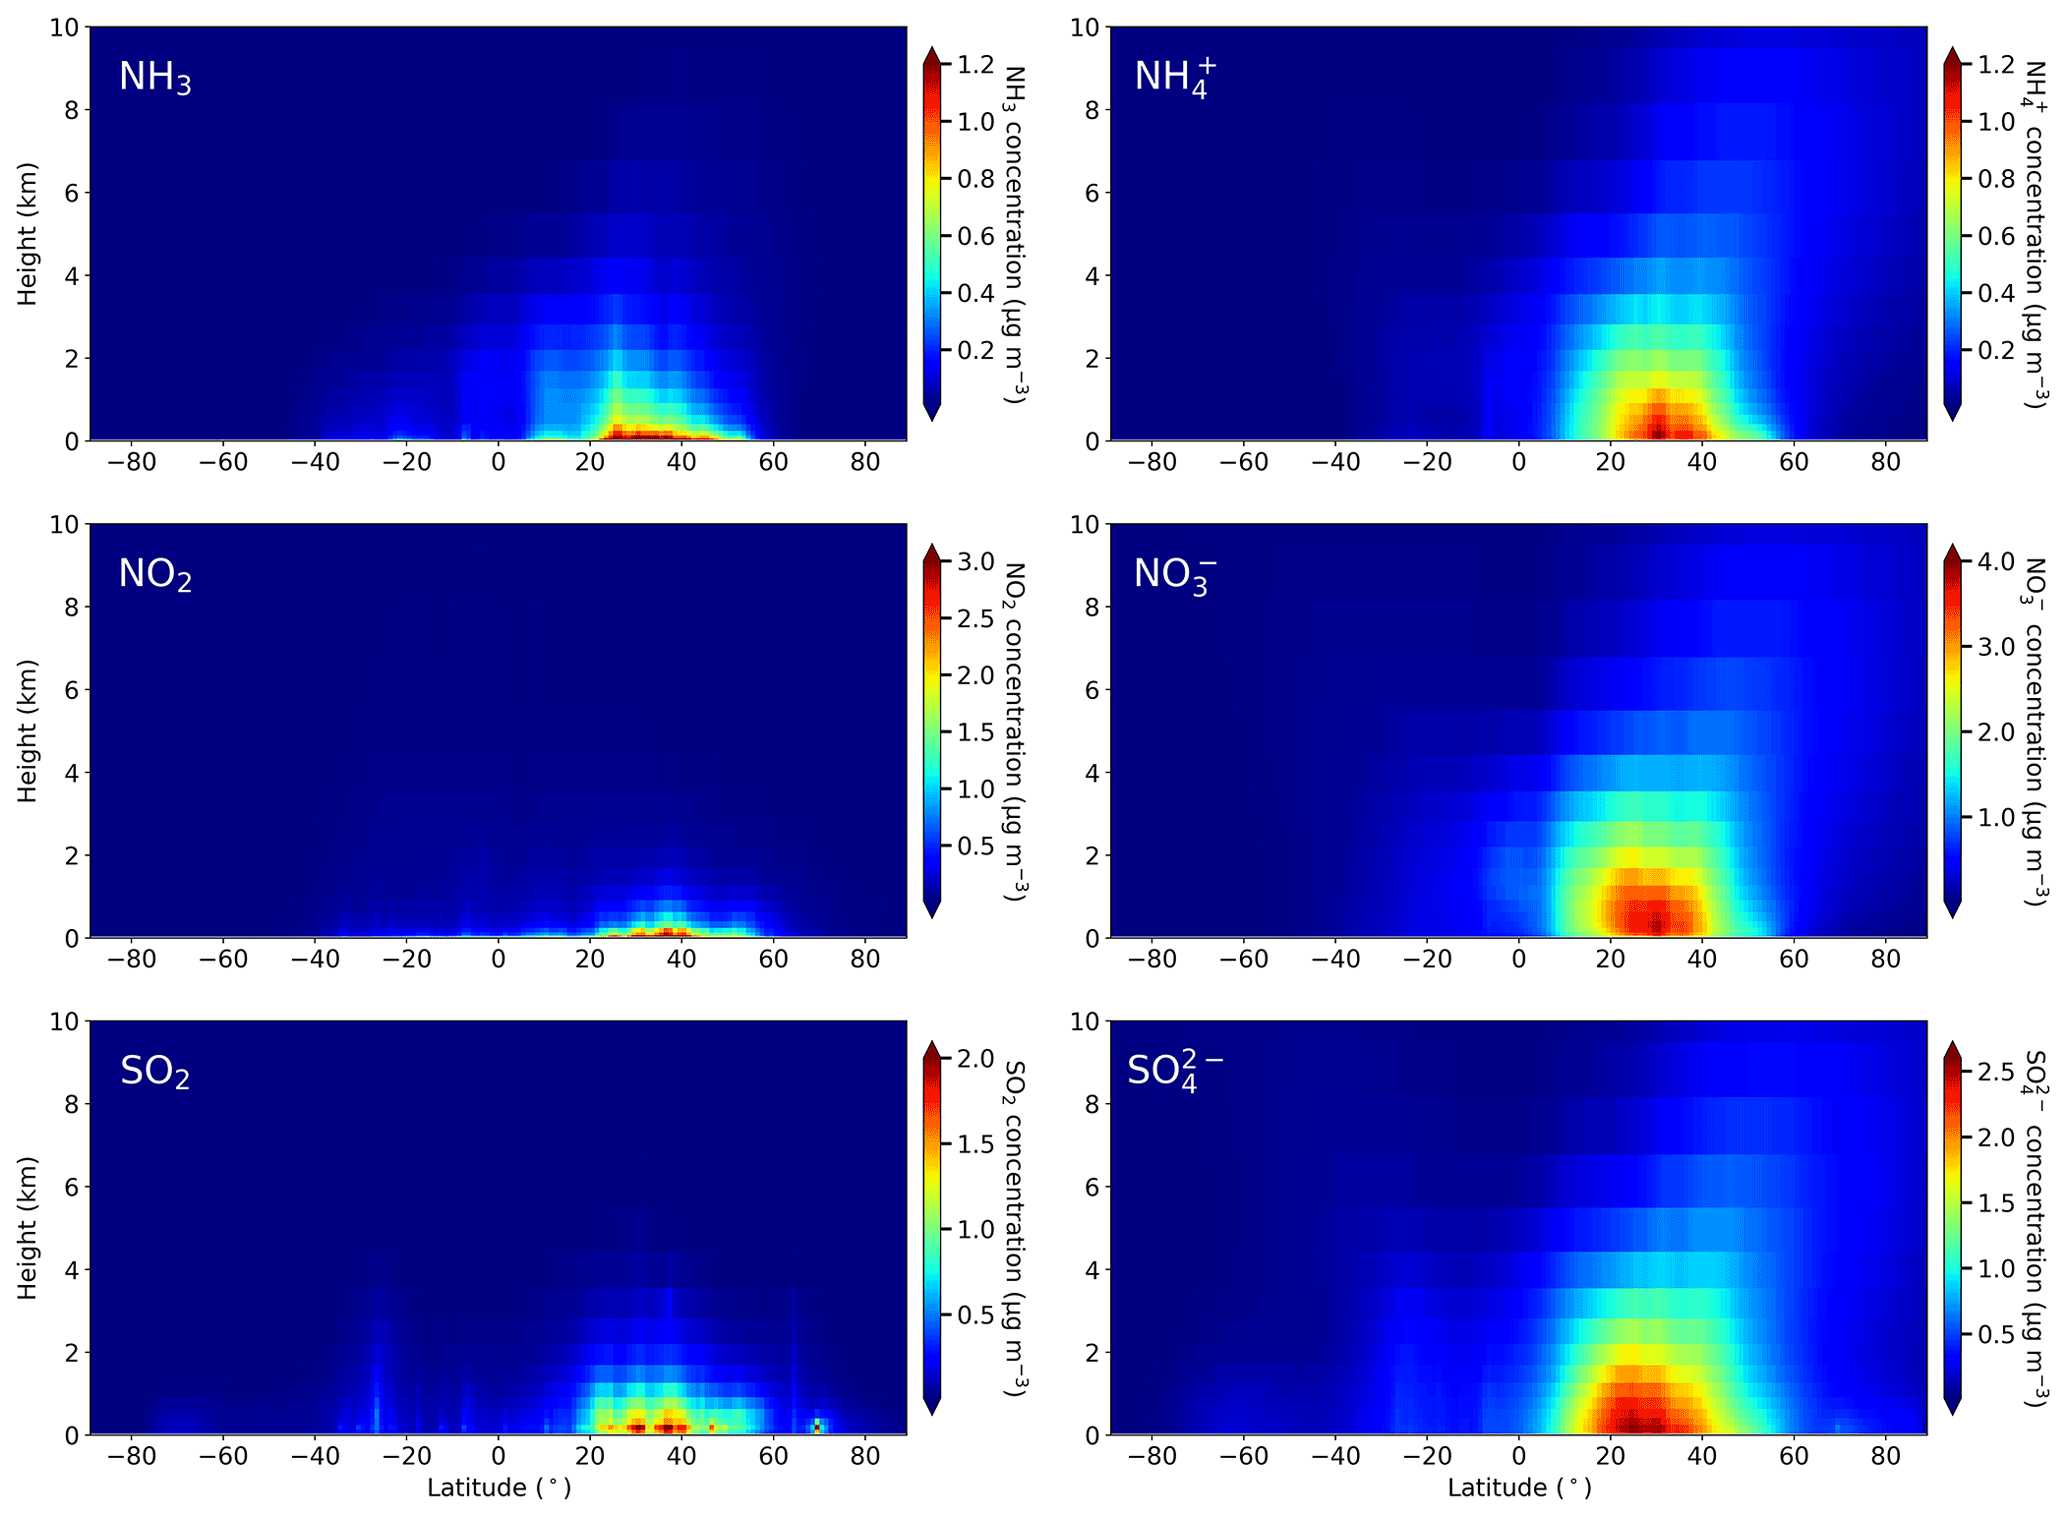
Figure 10Annual zonal mean vertical concentrations of NH3, NH, NO2, NO (fine + coarse), SO2, and SO.
3.3.2 Regional budgets
Figure 11 shows the differences between annual emissions and depositions for RDN, OXN, and OXS in the 10 world regions illustrated in Fig. 1. The corresponding absolute emission and deposition fluxes for each region are presented in Fig. S7.
For continental regions, the maximum fluxes for RDN are in East Asia (12.5 TgN yr−1 for RDN emission and 12.0 TgN yr−1 for RDN deposition), followed by South Asia (7.67 TgN yr−1 emission and 5.46 TgN yr−1 deposition) (Fig. S7). Both of these regions are characterized by intensive agricultural activities and have RDN fluxes that are larger than the OXN fluxes. Fluxes of RDN in the North America, Euro_Medi, and Southeast Asia regions are lower (3.46–5.14 TgN yr−1). The spatial distribution of the RDN concentrations presented in Fig. 2 are the consequence of these regional variations in RDN fluxes. Figure 11 shows that all regions are net exporters of RDN except for Southeast Asia and Rest of world, in which marine areas dominate. The net import of RDN in Southeast Asia is, however, very small. In contrast, deposition of RDN in the Rest of world region is nearly 16 times its annual emissions. The difference of 7.89 TgN yr−1 shows that RDN deposition is a notable source of continental anthropogenic pollution to the oceans. The region with greatest export of RDN is South Asia, at 2.21 TgN yr−1 or 29 % of its annual emissions (Fig. 11). Euro_Medi and Africa have the next greatest net exports (1.08 TgN yr−1 (21 % of emissions) and 0.95 TgN yr−1 (15 % of emissions) respectively). The relative differences between emissions and depositions over North America, South America, and Oceania are in the range of 6.0 %–8.0 %. Although East Asia is the region with the greatest RDN emissions, it only exports 3.8 % (0.48 TgN yr−1). This region is geographically generally self-contained from the other regions, but this means that East Asia is largely responsible for its own RDN pollution. The relatively high availability of acidic species also leads to shorter chemical lifetimes in this region.
For OXN, East Asia and Africa are the two continental regions with the largest annual emission and deposition fluxes (6.72–9.59 TgN yr−1), followed by South America and North America (5.49–7.02 TgN yr−1) (Fig. S7). In all of Southeast Asia, Euro_Medi, North America, South America, Africa, Oceania, and Rest of world, the OXN fluxes have larger influence on their total nitrogen budgets than the RDN fluxes, whereas, as noted above, in East Asia and South Asia fluxes of RDN comprise the majority. In contrast to our finding of higher RDN flux (12.0–12.5 TgN yr−1) than OXN flux (8.33–9.59 TgN yr−1) in East Asia, Tan et al. (2018) report higher OXN fluxes (10.5–11.4 TgN yr−1) than RDN fluxes (7.7–8.5 TgN yr−1). Such a difference in RDN and OXN fluxes is partially attributed to differences in emission inventories, model structures, meteorology input, and region definition between the two studies. It may also reflect an increase in NH3 emissions and a reduction in NOx emissions in this region between 2015 and 2010.
Figure 11 shows that the continental region with the greatest net export of OXN (1.92 TgN yr−1, 22 % of emissions) is Africa, followed by Euro_Medi (1.61 TgN yr−1, 26 %), South Asia (1.57 TgN yr−1, 34 %), and South America (1.51 TgN yr−1, 22 %). In particular, OXN deposition over Rest of world (13.4 TgN yr−1) is around 5 times larger than its emission (2.21 TgN yr−1, from shipping). The difference of 11.2 TgN yr−1 between OXN deposition and emission in this region is greater than the 7.89 TgN yr−1 difference for RDN. It is likely that the oxidation of NOx to reservoir organic nitrate species such as PAN facilitates the long-distance transport of OXN from the continent to the ocean, whereas the short lifetime of NH3 means less RDN is transported from its continental emission regions. Regardless of the explanation, the very large net deposition of OXN in the Rest of world region again indicates the scale of anthropogenic N deposition to marine areas.
Considering OXS, Fig. S7 shows that the Rest of world region has both the largest emission (10.6 TgS yr−1) and deposition (17.4 TgS yr−1) fluxes. The former is due to the substantial marine DMS emissions whose atmospheric oxidation ultimately produces SO2 and H2SO4 (Marandino et al., 2013; Schobesberger et al., 2013; Hoffmann et al., 2016). These OXS emissions largely deposit back to the oceans, but Fig. 11 shows that OXS deposition in the Rest of world is also substantially augmented by long-range transport of OXS pollution from other regions. For continental regions, East Asia has the largest OXS fluxes, with emission and deposition reaching 8.95 and 8.30 TgS yr−1 respectively, followed by Rest of Asia (5.48–6.21 TgS yr−1) and Euro_Medi (4.05–5.57 TgS yr−1) (Fig. S7). South Asia is the largest net exporter of OXS with 1.62 TgS yr−1 (37 % of its emission) being deposited outside this region (Fig. 11). Euro_Medi is the second largest net exporter of OXS (1.52 TgS yr−1, 27 %). All other continental regions are also either positive or negligible exporters of OXS except for Southeast Asia, which receives more OXS deposition than it emits. This is similar to the situation for RDN because, away from major NOx emission areas, NH is predominantly associated with SO.
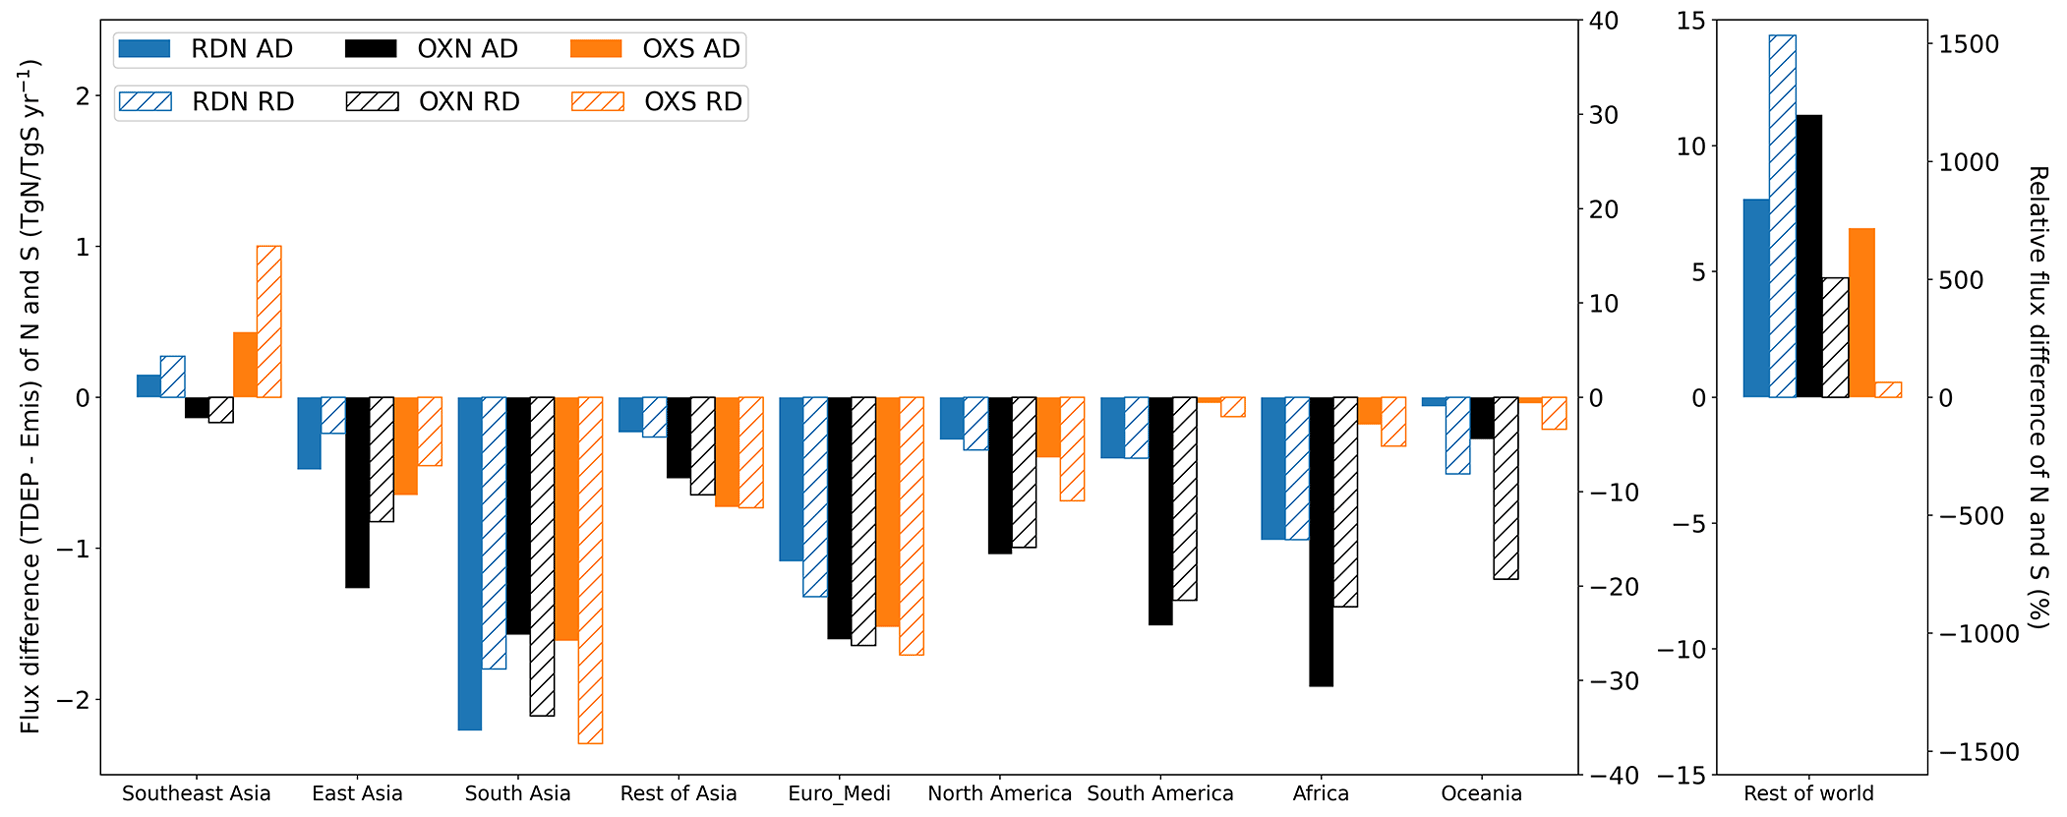
Figure 11Absolute differences (ADs) and relative differences (RDs) between emission and deposition fluxes of RDN (TgN yr−1), OXN (TgN yr−1), and OXS (TgS yr−1) for the 10 world regions defined in Fig. 1. Relative differences are expressed relative to emission fluxes. Difference values for the Rest of world region are much larger than for other regions. The constituents of RDN, OXN, and OXS are listed in Table S1. The corresponding emission and deposition fluxes are shown in Fig. S7.
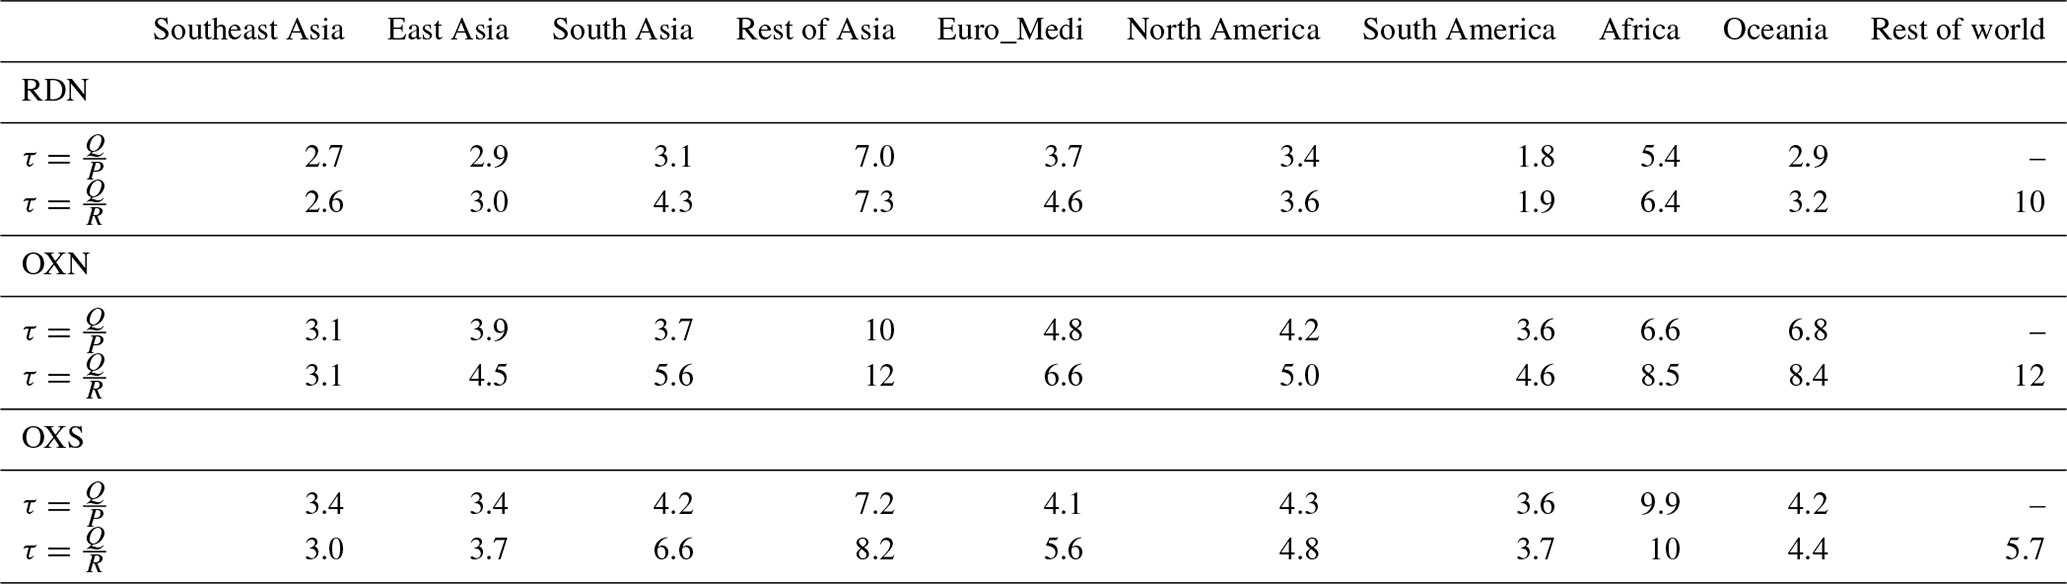
The tropospheric burden of each species is around 1 or 2 orders of magnitude smaller than its corresponding emission/deposition flux. Figures 12 and S8 respectively show the relative and absolute contributions of individual RDN and OXN species to the total tropospheric N burden and the contributions of the individual OXS species to the total tropospheric S burden, for each of the 10 world regions. In Table 3, we present the regional atmospheric lifetimes of RDN, OXN, and OXS as quantified against their total emission or deposition fluxes. These regional lifetimes are not fully accurate because they do not take the net transport of RDN, OXN, or OXS across the boundary of the region into account. However, given that, aside from the Rest of world region, the net transport in/out of a region is relatively small compared with the emission and deposition fluxes (Fig. 11), they should be reasonable estimates of the regional RDN, OXN, and OXS lifetimes. Table 3 shows that the regional RDN, OXN, and OXS lifetimes vary by up to a factor of 4 across the continental regions, generally being longest over Africa and Rest of Asia, where population and emissions are generally less dense, and shortest over East Asia, Southeast Asia, and South Asia.
The Rest of world region has the highest burdens of all regions with 0.23 TgN RDN, 0.44 TgN OXN, and 0.27 TgS OXS, representing 31 %, 37 %, and 35 % of the global RDN, OXN, and OXS burdens respectively, despite the relatively small emissions for RDN and OXN from this region. This observation is consistent with the conclusions from analyses of regional emission/deposition fluxes in Fig. 11 that the ocean areas are substantially impacted by the transport of Nr and Sr air pollutants from continental regions. The lifetimes of RDN, OXN, and OXS in Rest of world are also the longest of all regions (Table 3), reflecting that RDN, OXN, and OXS in this region predominantly exist as longer-lived species: SO in the case of Sr and NH, NO, and Rest OXN (predominantly PAN) in the case of Nr. East Asia, Rest of Asia, and Africa have moderate burdens of 0.09–0.11 TgN (12 %–14 % of the global burden) for RDN, 0.10–0.16 TgN (9 %–13 %) for OXN, and 0.08–0.12 TgS (11 %–16 %) for OXS. South Asia, Euro_Medi, and North America have smaller burdens with their contributions to global burdens ranging from 6 % to 9 % for RDN, from 4 % to 7 % for OXN, and from 5 % to 8 % for OXS.
The species contributions to N burdens differ between the regions (Fig. 12). RDN contributes 58 % and 49 % to the total N burden in South Asia and East Asia respectively, which is similarly reflected in the emission and deposition fluxes in the two regions, followed by Rest of Asia (42 %) and Euro_Medi (39 %). The largest relative contributions of OXN to the total N burden are in Oceania (82 %) and South America (70 %).
The largest contribution of NH3 to the RDN burden is in South America (67 %), and this large proportion of NH3 gives South America the shortest RDN lifetime (1.8–1.9 d) of any region. In other parts of the world, NH is the majority contributor to the RDN burden. The RDN lifetime in Southeast Asia and East Asia is relatively short (2.6–3.0 d), whereas Rest of Asia has the longest RDN lifetime (7.0–7.3 d) except for Rest of world.
For OXN, the contribution of HNO3 to the OXN burden reaches 28 %, 24 %, and 22 % in Southeast Asia, Oceania, and South America respectively, whereas HNO3 contributes only 5 %–12 % to OXN in other parts of the world (Fig. 12). NO_f only makes a significant contribution (20 %) to the total OXN burden over East Asia; its contribution is <6 % in other regions. This reflects the strong propensity for NH4NO3 formation in East Asia, which is similarly shown in the composition pattern of OXN deposition in this region as well (Sect. 3.2.2). Coarse NO is a significant contributor to the OXN burden, particularly in South Asia (59 %), Rest of Asia (54 %), and Africa (52 %). This is associated with an abundance of coarse particles like sea salt, dust, and sand in these regions. Therefore, it is critical to correctly account for contributions of coarse nitrate in models, as it overwhelmingly controls the atmospheric nitrate burden and determines the size distribution of nitrate aerosol. In all world regions, SO is the predominant form of the OXS burden (Fig. 12).
To mitigate atmospheric Nr and Sr burdens and their associated impacts on human health and ecosystems, tackling secondary inorganic species like NH as well as coarse NO3- and their precursors should be prioritized. The impacts of possible emission controls on atmospheric Nr and Sr concentrations, depositions, budgets, and lifetimes can be quantified by emission sensitivity tests.
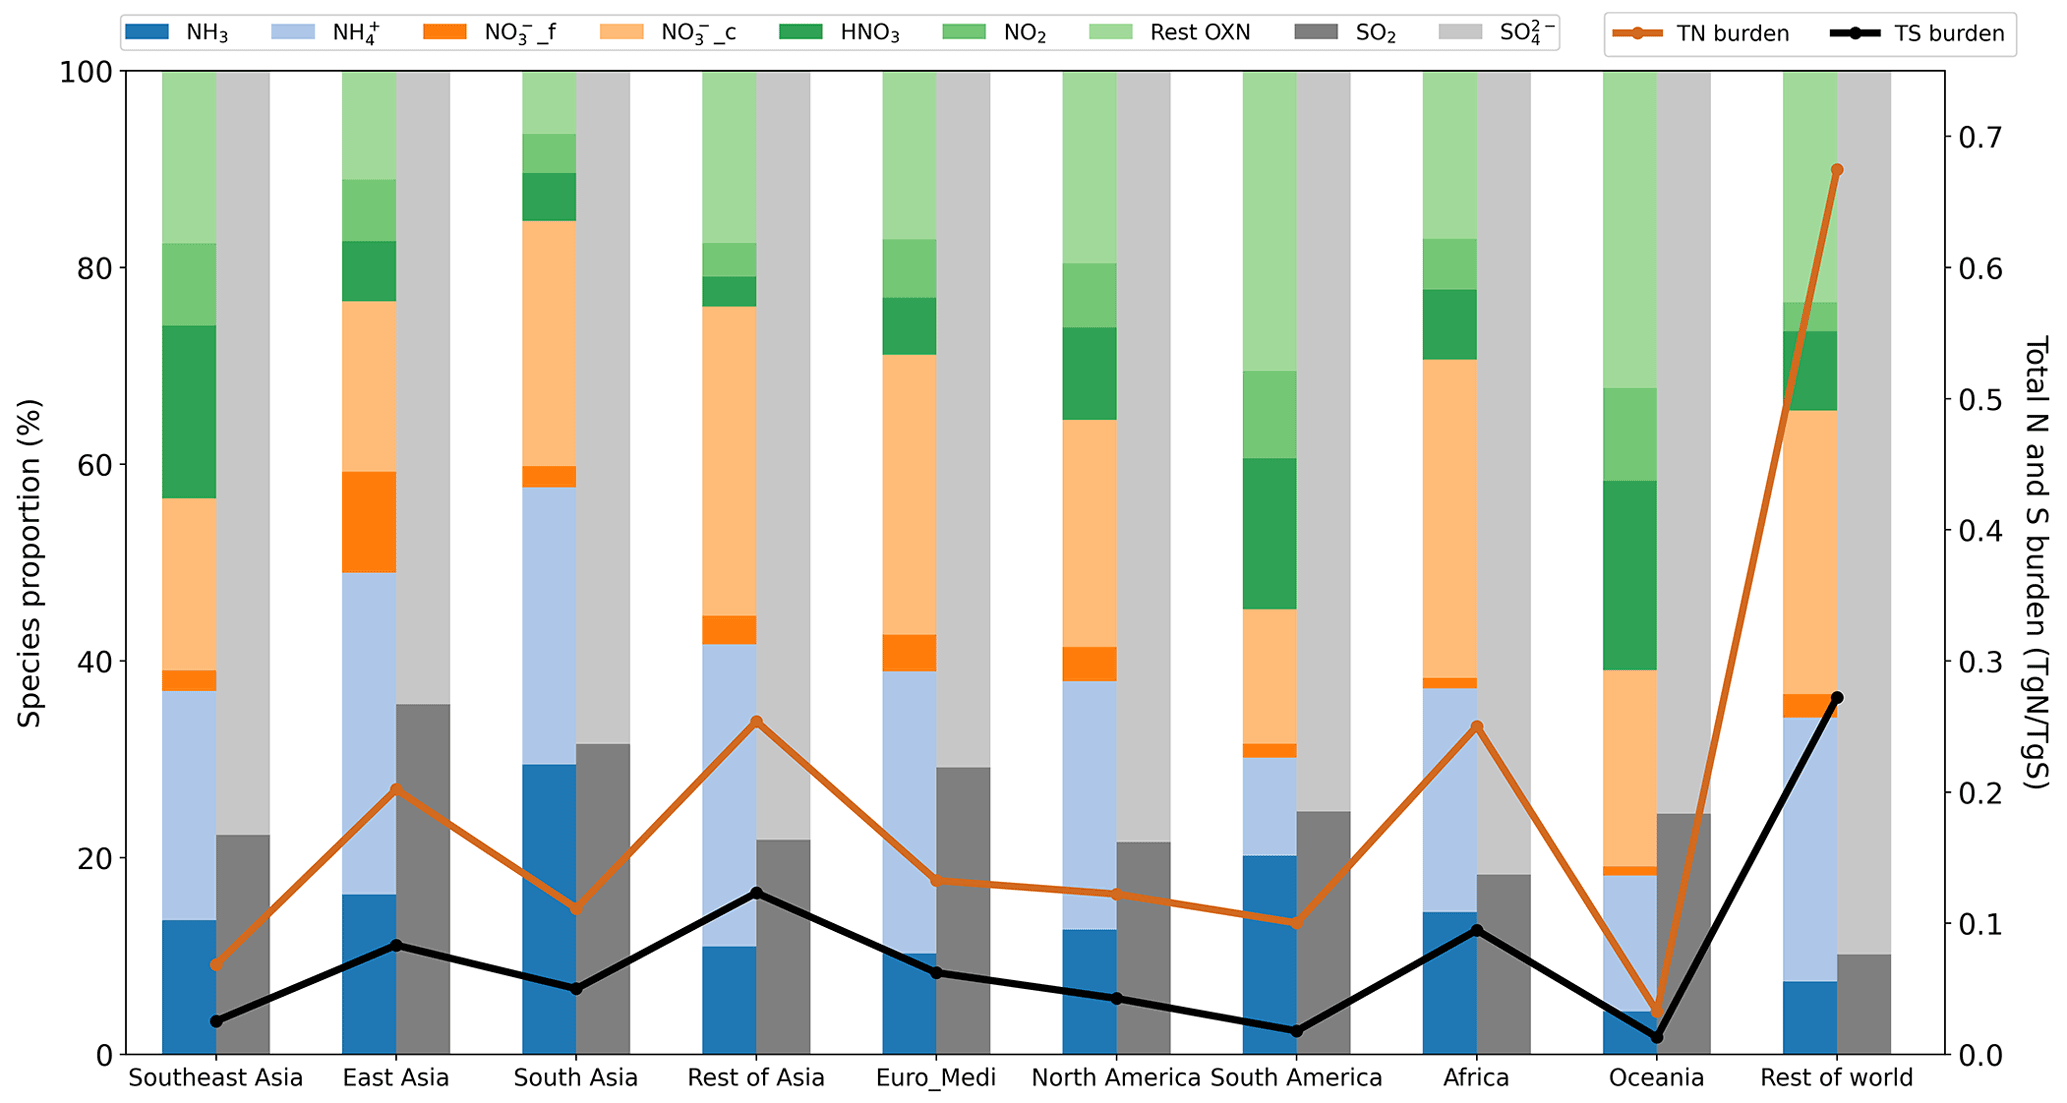
Figure 12Relative compositions of the tropospheric burdens in 2015 (stacked bar plots, left y axis) of total N (RDN + OXN) and total S (OXS) for the 10 world regions defined in Fig. 1. The total N (RDN + OXN) and S regional burdens are shown as the line plots (right y axis). Rest OXN includes HONO, N2O5, and Other OXN species (full list given in Table S1).
Table 3Regional atmospheric lifetimes (in days) for RDN, OXN, and OXS, calculated using either total emission or deposition fluxes. Q is the annual average burden, P is the production pathway (i.e. emissions), R is the removal pathway (i.e. depositions), and τ is atmospheric lifetime. These regional lifetimes are not fully accurate because they do not consider the net transport of RDN, OXN, or OXS across the boundary of the region, although these are relatively small for most continental regions. Please note that the lifetimes derived from the production pathway for Rest of world are not listed in this table because these numbers are highly skewed by the net transport of RDN, OXN, and OXS from other regions (full data are available in Table S5).
The model evaluation presented in Ge et al. (2021) shows that the model–measurement bias varies from one pollutant to another. For instance, the model underestimates annual global HNO3 surface concentration measurement by 34 % but overestimates NO2 by 23 %. Although it is difficult to diagnose the extent to which bias is contributed by bias intrinsic to the model (including emissions input to the model), by bias in measurements, or by model–measurement spatial representation mismatch, it is important to acknowledge that all numbers reported in this work may be biased somewhat low or high.
The intention here is to provide a new overview of how Nr and Sr budgets vary among different world regions and among different chemical species. As Ge et al. (2021) show that the EMEP model is capable of capturing the overall spatial variation in surface concentrations for major Nr and Sr pollutants and their wet deposition, and as our results are comparable with similar global modelling studies, we have confidence that we characterize the major regional differences in budgets. However, we also acknowledge that there are varying uncertainties in different regions, as revealed by our model evaluation study (Ge et al., 2021). Therefore, we have greater confidence in regional budgets in North America, Europe, and Southeast Asia than other world regions. Nevertheless, a modelling study cannot resolve whether different regional uncertainties derive from the emissions, model processes, measurements, or a combination of these aspects. Further evaluation studies of emissions and measurements are required to gain more insight.
We used the EMEP MSC-W model 4.34 coupled with WRF 4.2.2 meteorology to undertake a new present-day evaluation of global and regional concentrations, wet and dry deposition, fluxes, and lifetimes of reactive N and S species. These are quantities that cannot be derived from measurements alone. Simulations used the 2015 ECLIPSE annual emissions with EDGAR monthly profiles. Surface concentration and wet deposition outputs from this model configuration have been comprehensively evaluated against several measurement networks.
Our simulations show that the largest surface concentrations and deposition of RDN (NH3+ NH), OXN (NOx+ HNO3+ HONO + N2O5+ NO_f + NO_c + Other OXN species), and OXS (SO2 + SO) are in eastern China and northern India. In these areas, RDN concentrations are predominantly in the form of NH3 (NH is typically <20 %), as also in Europe and North America. NH comprises >90 % of RDN over oceans and remote continental areas. Gaseous OXN species constitute the majority of OXN over continental regions, whereas NO dominates OXN over oceans, except for major shipping routes. In eastern China, Europe, and eastern North America, fine NO dominates nitrate, but coarse NO dominates in India, as has been noted elsewhere. Aerosol SO is the major form of OXS nearly everywhere except in the vicinity of very large SO2 emission sources.
Most continental regions are now characterized as “ammonia rich”; this indicates that whilst reducing NH3 emissions will decrease the RDN concentration and deposition, it will have little effect on mitigating secondary inorganic aerosol. Our results show an increase in ammonia richness compared with model simulations for 2000 in other studies. This is driven not only by increasing NH3 emissions in parts of the world but also by the fact that a growing number of countries have been reducing NOx and SOx emissions much faster than NH3, for which many countries have yet to set emissions targets. In general, South Asia shows the most ammonia-rich condition. Coastal areas around East Asia, northern Europe, and the north-eastern United States can be characterized as “nitrate rich” where NH4NO3 formation is limited by NH3 not nitrate. These locations experience the transport of oxidized N from the adjacent continent and/or direct shipping emissions of NOx, but NH3 concentrations are lower because it deposits more quickly to land before transport off the coast.
Our modelling shows that OXN (57.9 TgN yr−1, 51 %) and RDN (55.5 TgN yr−1, 49 %) account for almost equal proportions of the total nitrogen deposition. Total sulfur (OXS) deposition is 50.5 TgS yr−1. Globally, wet and dry deposition contribute equally to RDN deposition. For OXN and OXS, wet deposition contributes slightly more than dry deposition; however, the contributions of different deposition components vary regionally. An advantage of modelling is that it can distinguish the individual deposition processes, which measurements cannot. For example, the model shows that the majority of the wet deposition of RDN derives from rainout of gaseous NH3 rather than of particle NH in many regions. For RDN deposition, dry deposition of NH3 is the predominant contributor in most regions except for Rest of Asia and Rest of world (essentially oceans), where NH3 emissions are small and RDN deposition is largely determined by the transport of aerosol NH from other regions. Thus, further reductions in NH3 would efficiently reduce the deposition of RDN in most world regions. The two largest contributors to OXN deposition in all regions are HNO3 and coarse NO (both occurring by both wet and dry deposition). The deposition of fine NO is only important over East Asia (24 %) and is <10 % in other regions. For OXS deposition, dry-deposited SO2 and wet-deposited SO are two largest contributors in all regions.
The annual average tropospheric burden of RDN is 0.75 TgN of which NH3 and NH comprise 32 % (0.24 TgN) and 68 % (0.51 TgN) respectively. The average tropospheric lifetime of NH3 is 1.6 d, whereas that of NH is more than 5 times longer (8.9 d). The annual average burden of HNO3 is 0.15 TgN with an average lifetime of only 1.1 d. The total nitrate burden is 0.58 TgN with fine NO only constituting 10 % of this total. The lifetime of fine nitrate (4.8 d) is shorter than that of coarse nitrate (7.0–7.1 d). The global lifetime of OXN (7.6–7.7 d) is longer than that of RDN (4.9–5.2 d), which is consistent with a total OXN burden (1.20 TgN) almost double that of RDN. The tropospheric burden of OXS is 0.78 TgS with a global lifetime of 5.6–5.9 d. The SO burden is 0.63 TgS, and its lifetime of 8.3–8.5 d is similar to that of NH, reflecting the close association between the two species in the atmosphere globally. It is notable that lifetimes of RDN, OXN, and OXS vary by a factor of 4 across different continental regions. East Asia has quite short lifetimes for RDN (2.9–3.0 d), OXN (3.9–4.5 d), and OXS (3.4–3.7 d), whereas the lifetimes in Rest of Asia and Africa are around twice as long, which is related to the regional differences in meteorological conditions and the compositions of RDN, OXN, and OXS burdens.
The model confirms that the longer lifetimes of the secondary Nr and Sr species are consistent with their greater vertical transport, which surface measurements cannot reveal. In addition, whilst the gaseous precursor species have maximum concentrations at the surface, maximum concentrations of the aerosol species are at higher altitudes because of the time taken for their formation.
Comparison of the absolute emission and deposition fluxes of RDN and OXN in different world regions shows that East Asia and South Asia are characterized by larger RDN fluxes than OXN fluxes, whereas most other world regions exhibit larger OXN fluxes than RDN fluxes, which likely reflects greater increases in NH3 emissions in the two regions.
Comparison of the difference between emission and deposition fluxes shows that the South Asia region is the largest net exporter of RDN (2.21 TgN yr−1, 29 % of its annual emission), followed by Euro_Medi, Africa, and other continental regions. Despite having the largest RDN emissions and deposition, East Asia has very small net export and is therefore largely responsible for its own RDN pollution. In contrast, Rest of world, which is mainly the ocean regions (as well as Southeast Asia which also contains a lot of marine area), receives more deposition of RDN than it emits.
For OXN, Africa is the largest net exporter of OXN at 22 % (1.92 TgN yr−1) of its emission, followed by South Asia. The Rest of world again receives substantial net import of OXN (11.2 TgN yr−1) which is even higher than the 7.89 TgN yr−1 net import of RDN. Oxidation of NOx to reservoir organic nitrate species such as PAN likely facilitates the long-distance transport of OXN from the continent to the ocean, whereas the short lifetime of NH3 means that less RDN is transported from its continental emission regions. The large flux imbalances of OXN and RDN in these areas indicate the scale of anthropogenic N pollution to marine areas.
The two regions with the largest net export of OXS are South Asia (1.62 TgS yr−1, equivalent to 37 % of its emission) and Euro_Medi (1.52 TgS yr−1, 27 %). All other continental regions are either positive or zero exporters of OXS except for Southeast Asia, which receives more OXS deposition than it emits. This is similar to the situation for RDN because, away from major NOx emission areas, NH is predominantly associated with SO.
The three largest contributors to the total N burden globally are NH, coarse NO, and Rest OXN (mainly PAN). In South Asia, Rest of Asia, and Africa, coarse NO constitutes over half of the OXN burden, attributable to an abundance of coarse sea-salt and dust particles in these regions. It is critical to account for the contributions of coarse nitrate, as it controls the atmospheric nitrate burden and the size distribution of nitrate aerosol. Aerosol SO is the predominant form of OXS in all regions.
As presented in this work, Nr and Sr species are abundant air pollutants impacting gas and particle concentrations and deposition globally. The chemical and meteorological linkages between emissions and Nr and Sr species' concentrations are complex, and the detail can only be revealed by process-based atmospheric modelling, as illustrated here, despite the uncertainties in emissions and model parameterizations.
As described and referenced in Sect. 2 of this paper, this study used two open-source global models: the European Monitoring and Evaluation Programme Meteorological Synthesizing Centre – West atmospheric chemistry transport model (EMEP MSC-W, 2020, version 4.34, source code available at https://doi.org/10.5281/zenodo.3647990) and the Weather Research and Forecasting meteorological model (WRF, version 3.9.1.1, https://www.wrf-model.org, Skamarock et al., 2008). The model output presented in figures and tables in this paper and the corresponding Python scripts are available at https://doi.org/10.5281/zenodo.5912055 (Ge, 2022).
The supplement related to this article is available online at: https://doi.org/10.5194/acp-22-8343-2022-supplement.
MRH, DSS, and MV conceptualized and supervised the study. MV and PW contributed to model development and set-up and provided modelling support. MV provided computing resource. YG contributed to the study design and undertook all model simulations, formal data analyses, visualization of the results, and data curation, with discussion and refinement by all authors. The original draft of the paper was written by YG with contributions and editing by MRH. All authors provided review comments and approval of the final version.
The contact author has declared that neither they nor their co-authors have any competing interests.
Publisher’s note: Copernicus Publications remains neutral with regard to jurisdictional claims in published maps and institutional affiliations.
Yao Ge gratefully acknowledges studentship funding from the University of Edinburgh and its School of Chemistry. This work was supported in part by the UK Natural Environment Research Council (NERC), including grant nos. NE/R016429/1 and NE/R000131/1 as part of the UK-SCAPE and SUNRISE programmes delivering UK National Capability, and the European Modelling and Evaluation Programme under the United Nations Economic Commission for Europe Convention on Long-range Transboundary Air Pollution.
This research has been supported by the Natural Environment Research Council (grant nos. NE/R016429/1 and NE/R000131/1) and the University of Edinburgh (PhD studentship).
This paper was edited by Leiming Zhang and reviewed by two anonymous referees.
Aas, W., Mortier, A., Bowersox, V., Cherian, R., Faluvegi, G., Fagerli, H., Hand, J., Klimont, Z., Galy-Lacaux, C., Lehmann, C. M. B., Myhre, C. L., Myhre, G., Olivié, D., Sato, K., Quaas, J., Rao, P. S. P., Schulz, M., Shindell, D., Skeie, R. B., Stein, A., Takemura, T., Tsyro, S., Vet, R., and Xu, X.: Global and regional trends of atmospheric sulfur, Sci. Rep., 9, 953, https://doi.org/10.1038/s41598-018-37304-0, 2019.
Ackerman, D., Millet, D. B., and Chen, X.: Global estimates of inorganic nitrogen deposition across four decades, Global Biogeochem. Cy., 33, 100–107, https://doi.org/10.1029/2018GB005990, 2019.
Aksoyoglu, S., Jiang, J., Ciarelli, G., Baltensperger, U., and Prévôt, A. S. H.: Role of ammonia in European air quality with changing land and ship emissions between 1990 and 2030, Atmos. Chem. Phys., 20, 15665–15680, https://doi.org/10.5194/acp-20-15665-2020, 2020.
Alexander, B., Sherwen, T., Holmes, C. D., Fisher, J. A., Chen, Q., Evans, M. J., and Kasibhatla, P.: Global inorganic nitrate production mechanisms: comparison of a global model with nitrate isotope observations, Atmos. Chem. Phys., 20, 3859–3877, https://doi.org/10.5194/acp-20-3859-2020, 2020.
Aneja, V. P., Schlesinger, W. H., and Erisman, J. W.: Effects of Agriculture upon the Air Quality and Climate: Research, Policy, and Regulations, Environ. Sci. Technol., 43, 4234–4240, https://doi.org/10.1021/es8024403, 2009.
Ansari, A. S. and Pandis, S. N.: Response of Inorganic PM to Precursor Concentrations, Environ. Sci. Technol., 32, 2706–2714, https://doi.org/10.1021/es971130j, 1998.
Behera, S. N., Betha, R., Liu, P., and Balasubramanian, R.: A study of diurnal variations of PM2.5 acidity and related chemical species using a new thermodynamic equilibrium model, Sci. Total Environ., 452/453, 286–295, https://doi.org/10.1016/j.scitotenv.2013.02.062, 2013a.
Behera, S. N., Sharma, M., Aneja, V. P., and Balasubramanian, R.: Ammonia in the atmosphere: a review on emission sources, atmospheric chemistry and deposition on terrestrial bodies, Environ. Sci. Pollut. Res., 20, 8092–8131, https://doi.org/10.1007/s11356-013-2051-9, 2013b.
Bellouin, N., Rae, J., Jones, A., Johnson, C., Haywood, J., and Boucher, O.: Aerosol forcing in the Climate Model Intercomparison Project (CMIP5) simulations by HadGEM2-ES and the role of ammonium nitrate, J. Geophys. Res.-Atmos., 116, D20206, https://doi.org/10.1029/2011JD016074, 2011.
Berge, E. and Jakobsen, H. A.: A regional scale multilayer model for the calculation of long-term transport and deposition of air pollution in Europe, Tellus B, 50, 205–223, https://doi.org/10.3402/tellusb.v50i3.16097, 1998.
Bergström, R., Denier van der Gon, H. A. C., Prévôt, A. S. H., Yttri, K. E., and Simpson, D.: Modelling of organic aerosols over Europe (2002–2007) using a volatility basis set (VBS) framework: application of different assumptions regarding the formation of secondary organic aerosol, Atmos. Chem. Phys., 12, 8499–8527, https://doi.org/10.5194/acp-12-8499-2012, 2012.
Bergström, R., Hallquist, M., Simpson, D., Wildt, J., and Mentel, T. F.: Biotic stress: a significant contributor to organic aerosol in Europe?, Atmos. Chem. Phys., 14, 13643–13660, https://doi.org/10.5194/acp-14-13643-2014, 2014.
Bian, H., Chin, M., Hauglustaine, D. A., Schulz, M., Myhre, G., Bauer, S. E., Lund, M. T., Karydis, V. A., Kucsera, T. L., Pan, X., Pozzer, A., Skeie, R. B., Steenrod, S. D., Sudo, K., Tsigaridis, K., Tsimpidi, A. P., and Tsyro, S. G.: Investigation of global particulate nitrate from the AeroCom phase III experiment, Atmos. Chem. Phys., 17, 12911–12940, https://doi.org/10.5194/acp-17-12911-2017, 2017.
Bobbink, R., Hicks, K., Galloway, J., Spranger, T., Alkemade, R., Ashmore, M., Bustamante, M., Cinderby, S., Davidson, E., Dentener, F., Emmett, B., Erisman, J. W., Fenn, M., Gilliam, F., Nordin, A., Pardo, L., and De Vries, W.: Global assessment of nitrogen deposition effects on terrestrial plant diversity: a synthesis, Ecol. Appl., 20, 30–59, https://doi.org/10.1890/08-1140.1, 2010.
Boreddy, S. K. R., Hegde, P., and Aswini, A. R.: Chemical Characteristics, Size Distributions, and Aerosol Liquid Water in Size-Resolved Coastal Urban Aerosols Allied with Distinct Air Masses over Tropical Peninsular India, ACS Earth Space Chem., 5, 457–473, https://doi.org/10.1021/acsearthspacechem.0c00282, 2021.
Bray, C. D., Battye, W., Aneja, V. P., Tong, D. Q., Lee, P., and Tang, Y.: Ammonia emissions from biomass burning in the continental United States, Atmos. Environ., 187, 50–61, https://doi.org/10.1016/j.atmosenv.2018.05.052, 2018.
Burnett, R., Chen, H., Szyszkowicz, M., Fann, N., Hubbell, B., Pope, C. A., Apte, J. S., Brauer, M., Cohen, A., Weichenthal, S., Coggins, J., Di, Q., Brunekreef, B., Frostad, J., Lim, S. S., Kan, H., Walker, K. D., Thurston, G. D., Hayes, R. B., Lim, C. C., Turner, M. C., Jerrett, M., Krewski, D., Gapstur, S. M., Diver, W. R., Ostro, B., Goldberg, D., Crouse, D. L., Martin, R. V., Peters, P., Pinault, L., Tjepkema, M., van Donkelaar, A., Villeneuve, P. J., Miller, A. B., Yin, P., Zhou, M., Wang, L., Janssen, N. A. H., Marra, M., Atkinson, R. W., Tsang, H., Quoc Thach, T., Cannon, J. B., Allen, R. T., Hart, J. E., Laden, F., Cesaroni, G., Forastiere, F., Weinmayr, G., Jaensch, A., Nagel, G., Concin, H., and Spadaro, J. V.: Global estimates of mortality associated with long-term exposure to outdoor fine particulate matter, P. Natl. Acad. Sci. USA, 115, 9592, https://doi.org/10.1073/pnas.1803222115, 2018.
Cohen, A. J., Brauer, M., Burnett, R., Anderson, H. R., Frostad, J., Estep, K., Balakrishnan, K., Brunekreef, B., Dandona, L., Dandona, R., Feigin, V., Freedman, G., Hubbell, B., Jobling, A., Kan, H., Knibbs, L., Liu, Y., Martin, R., Morawska, L., Pope, C. A., III, Shin, H., Straif, K., Shaddick, G., Thomas, M., van Dingenen, R., van Donkelaar, A., Vos, T., Murray, C. J. L., and Forouzanfar, M. H.: Estimates and 25-year trends of the global burden of disease attributable to ambient air pollution: an analysis of data from the Global Burden of Diseases Study 2015, Lancet, 389, 1907–1918, https://doi.org/10.1016/S0140-6736(17)30505-6, 2017.
Crippa, M., Guizzardi, D., Muntean, M., Schaaf, E., Dentener, F., van Aardenne, J. A., Monni, S., Doering, U., Olivier, J. G. J., Pagliari, V., and Janssens-Maenhout, G.: Gridded emissions of air pollutants for the period 1970–2012 within EDGAR v4.3.2, Earth Syst. Sci. Data, 10, 1987–2013, https://doi.org/10.5194/essd-10-1987-2018, 2018.
Crippa, M., Solazzo, E., Huang, G., Guizzardi, D., Koffi, E., Muntean, M., Schieberle, C., Friedrich, R., and Janssens-Maenhout, G.: High resolution temporal profiles in the Emissions Database for Global Atmospheric Research, Sci. Data, 7, 121, https://doi.org/10.1038/s41597-020-0462-2, 2020.
Dammers, E., McLinden, C. A., Griffin, D., Shephard, M. W., Van Der Graaf, S., Lutsch, E., Schaap, M., Gainairu-Matz, Y., Fioletov, V., Van Damme, M., Whitburn, S., Clarisse, L., Cady-Pereira, K., Clerbaux, C., Coheur, P. F., and Erisman, J. W.: NH3 emissions from large point sources derived from CrIS and IASI satellite observations, Atmos. Chem. Phys., 19, 12261–12293, https://doi.org/10.5194/acp-19-12261-2019, 2019.
de Gouw, J. A., Parrish, D. D., Frost, G. J., and Trainer, M.: Reduced emissions of CO2, NOx, and SO2 from U.S. power plants owing to switch from coal to natural gas with combined cycle technology, Earth's Future, 2, 75–82, https://doi.org/10.1002/2013EF000196, 2014.
Dentener, F., Drevet, J., Lamarque, J. F., Bey, I., Eickhout, B., Fiore, A. M., Hauglustaine, D., Horowitz, L. W., Krol, M., Kulshrestha, U. C., Lawrence, M., Galy-Lacaux, C., Rast, S., Shindell, D., Stevenson, D., Van Noije, T., Atherton, C., Bell, N., Bergman, D., Butler, T., Cofala, J., Collins, B., Doherty, R., Ellingsen, K., Galloway, J., Gauss, M., Montanaro, V., Müller, J. F., Pitari, G., Rodriguez, J., Sanderson, M., Solmon, F., Strahan, S., Schultz, M., Sudo, K., Szopa, S., and Wild, O.: Nitrogen and sulfur deposition on regional and global scales: A multimodel evaluation, Global Biogeochem. Cy., 20, GB4003, https://doi.org/10.1029/2005GB002672, 2006.
EMEP MSC-W: metno/emep-ctm: OpenSource rv4.34 (202001), Zenodo [code], https://doi.org/10.5281/zenodo.3647990, 2020.
Erisman, J. W., Domburg, N., de Vries, W., Kros, H., de Haan, B., and Sanders, K.: The Dutch N-cascade in the European perspective, Sci. China Ser. C, 48, 827–842, https://doi.org/10.1007/BF03187122, 2005.
Fagerli, H., Tsyro, S., Jonson, J. E., Nyíri, Á., Gauss, M., Simpson, D., Wind, P., Benetictow, A., Klein, H., Mortier, A., Aas, W., Hjellbrekke, A.-G., Solberg, S., Platt, S. M., Yttri, K. E., Tørseth, K., Gaisbauer, S., Mareckova, K., Matthews, B., Schindlbacher, S., Sosa, C., Tista, M., Ullrich, B., Wankmüller, R., Scheuschner, T., Bergström, R., Johanson, L., Jalkanen, J.-P., Metzger, S., van der Gon, H. A. C. D., Kuenen, J. J. P., Visschedijk, A. J. H., Barregård, L., Molnár, P., and Stockfelt, L.: Transboundary particulate matter, photo-oxidants, acidifying and eutrophying components, EMEP Status Report 1/2019, METEOROLOGISK INSTITUTT Norwegian Meteorological Institute, Oslo, Norway, ISSN 15046109, 244 pp., https://emep.int/publ/reports/2019/EMEP_Status_Report_1_2019.pdf (last access: 1 November 2021), 2019.
Feng, Y. and Penner, J. E.: Global modeling of nitrate and ammonium: Interaction of aerosols and tropospheric chemistry, J. Geophys. Res.-Atmos., 112, D01304, https://doi.org/10.1029/2005JD006404, 2007.
Fiddes, S. L., Woodhouse, M. T., Nicholls, Z., Lane, T. P., and Schofield, R.: Cloud, precipitation and radiation responses to large perturbations in global dimethyl sulfide, Atmos. Chem. Phys., 18, 10177–10198, https://doi.org/10.5194/acp-18-10177-2018, 2018.
Fioletov, V., McLinden, C. A., Griffin, D., Theys, N., Loyola, D. G., Hedelt, P., Krotkov, N. A., and Li, C.: Anthropogenic and volcanic point source SO2 emissions derived from TROPOMI on board Sentinel-5 Precursor: first results, Atmos. Chem. Phys., 20, 5591–5607, https://doi.org/10.5194/acp-20-5591-2020, 2020.
Fowler, D., Coyle, M., Skiba, U., Sutton, M. A., Cape, J. N., Reis, S., Sheppard, L. J., Jenkins, A., Grizzetti, B., Galloway, J. N., Vitousek, P., Leach, A., Bouwman, A. F., Butterbach-Bahl, K., Dentener, F., Stevenson, D., Amann, M., and Voss, M.: The global nitrogen cycle in the twenty-first century, Philos. T. R. Soc. B, 368, 20130164, https://doi.org/10.1098/rstb.2013.0164, 2013.
Fowler, D., Steadman, C. E., Stevenson, D., Coyle, M., Rees, R. M., Skiba, U. M., Sutton, M. A., Cape, J. N., Dore, A. J., Vieno, M., Simpson, D., Zaehle, S., Stocker, B. D., Rinaldi, M., Facchini, M. C., Flechard, C. R., Nemitz, E., Twigg, M., Erisman, J. W., Butterbach-Bahl, K., and Galloway, J. N.: Effects of global change during the 21st century on the nitrogen cycle, Atmos. Chem. Phys., 15, 13849–13893, https://doi.org/10.5194/acp-15-13849-2015, 2015.
Fowler, D., Brimblecombe, P., Burrows, J., Heal, M. R., Grennfelt, P., Stevenson, D. S., Jowett, A., Nemitz, E., Coyle, M., Liu, X., Chang, Y., Fuller, G. W., Sutton, M. A., Klimont, Z., Unsworth, M. H., and Vieno, M.: A chronology of global air quality, Philos. T. R. Soc. A, 378, 20190314, https://doi.org/10.1098/rsta.2019.0314, 2020.
Gallagher, M. W., Beswick, K. M., Duyzer, J., Westrate, H., Choularton, T. W., and Hummelshøj, P.: Measurements of aerosol fluxes to speulder forest using a micrometeorological technique, Atmos. Environ., 31, 359–373, https://doi.org/10.1016/S1352-2310(96)00057-X, 1997.
Ge, Y.: Datasets for a new assessment of global and regional budgets, fluxes and lifetimes of atmospheric reactive N and S gases and aerosols, Zenodo [code], https://doi.org/10.5281/zenodo.5912055, 2022.
Ge, Y., Heal, M. R., Stevenson, D. S., Wind, P., and Vieno, M.: Evaluation of global EMEP MSC-W (rv4.34) WRF (v3.9.1.1) model surface concentrations and wet deposition of reactive N and S with measurements, Geosci. Model Dev., 14, 7021–7046, https://doi.org/10.5194/gmd-14-7021-2021, 2021.
Gu, B., Zhang, L., Van Dingenen, R., Vieno, M., Van Grinsven, H. J., Zhang, X., Zhang, S., Chen, Y., Wang, S., Ren, C., and Rao, S.: Abating ammonia is more cost-effective than nitrogen oxides for mitigating PM2.5 air pollution, Science, 374, 758–762, https://doi.org/10.1126/science.abf8623, 2021.
Hauglustaine, D. A., Balkanski, Y., and Schulz, M.: A global model simulation of present and future nitrate aerosols and their direct radiative forcing of climate, Atmos. Chem. Phys., 14, 11031–11063, https://doi.org/10.5194/acp-14-11031-2014, 2014.
Hoesly, R. M., Smith, S. J., Feng, L., Klimont, Z., Janssens-Maenhout, G., Pitkanen, T., Seibert, J. J., Vu, L., Andres, R. J., Bolt, R. M., Bond, T. C., Dawidowski, L., Kholod, N., Kurokawa, J. I., Li, M., Liu, L., Lu, Z., Moura, M. C. P., O'Rourke, P. R., and Zhang, Q.: Historical (1750–2014) anthropogenic emissions of reactive gases and aerosols from the Community Emissions Data System (CEDS), Geosci. Model Dev., 11, 369–408, https://doi.org/10.5194/gmd-11-369-2018, 2018.
Hoffmann, E. H., Tilgner, A., Schrödner, R., Bräuer, P., Wolke, R., and Herrmann, H.: An advanced modeling study on the impacts and atmospheric implications of multiphase dimethyl sulfide chemistry, P. Natl. Acad. Sci. USA, 113, 11776, https://doi.org/10.1073/pnas.1606320113, 2016.
IPCC: Summary for Policymakers. In: Climate Change 2021: The Physical Science Basis. Contribution of Working Group I to the Sixth Assessment Report of the Intergovernmental Panel on Climate Change, edited by: Masson-Delmotte, V., Zhai, P., Pirani, A., Connors, S. L., Péan, C., Berger, S., Caud, N., Chen, Y., Goldfarb, L., Gomis, M. I., Huang, M., Leitzell, K., Lonnoy, E., Matthews, J. B. R., Maycock, T. K., Waterfield, T., Yelekçi, O., Yu, R., and Zhou, B., Cambridge University Press, Cambridge, United Kingdom and New York, NY, USA, 3−-32, https://doi.org/10.1017/9781009157940.001, 2021.
Iturbide, M., Gutiérrez, J. M., Alves, L. M., Bedia, J., Cerezo-Mota, R., Cimadevilla, E., Cofiño, A. S., Di Luca, A., Faria, S. H., Gorodetskaya, I. V., Hauser, M., Herrera, S., Hennessy, K., Hewitt, H. T., Jones, R. G., Krakovska, S., Manzanas, R., Martínez-Castro, D., Narisma, G. T., Nurhati, I. S., Pinto, I., Seneviratne, S. I., van den Hurk, B., and Vera, C. S.: An update of IPCC climate reference regions for subcontinental analysis of climate model data: definition and aggregated datasets, Earth Syst. Sci. Data, 12, 2959–2970, https://doi.org/10.5194/essd-12-2959-2020, 2020.
Jackson, R. L., Gabric, A. J., Cropp, R., and Woodhouse, M. T.: Dimethylsulfide (DMS), marine biogenic aerosols and the ecophysiology of coral reefs, Biogeosciences, 17, 2181–2204, https://doi.org/10.5194/bg-17-2181-2020, 2020.
Jonson, J. E., Borken-Kleefeld, J., Simpson, D., Nyíri, A., Posch, M., and Heyes, C.: Impact of excess NOx emissions from diesel cars on air quality, public health and eutrophication in Europe, Environ. Res. Lett., 12, 094017, https://doi.org/10.1088/1748-9326/aa8850, 2017.
Karl, M., Jonson, J. E., Uppstu, A., Aulinger, A., Prank, M., Sofiev, M., Jalkanen, J. P., Johansson, L., Quante, M., and Matthias, V.: Effects of ship emissions on air quality in the Baltic Sea region simulated with three different chemistry transport models, Atmos. Chem. Phys., 19, 7019–7053, https://doi.org/10.5194/acp-19-7019-2019, 2019.
Karydis, V. A., Tsimpidi, A. P., Pozzer, A., Astitha, M., and Lelieveld, J.: Effects of mineral dust on global atmospheric nitrate concentrations, Atmos. Chem. Phys., 16, 1491–1509, https://doi.org/10.5194/acp-16-1491-2016, 2016.
Khan, M. A. H., Lowe, D., Derwent, R. G., Foulds, A., Chhantyal-Pun, R., McFiggans, G., Orr-Ewing, A. J., Percival, C. J., and Shallcross, D. E.: Global and regional model simulations of atmospheric ammonia, Atmos. Res., 234, 104702, https://doi.org/10.1016/j.atmosres.2019.104702, 2020.
Klimont, Z., Kupiainen, K., Heyes, C., Purohit, P., Cofala, J., Rafaj, P., Borken-Kleefeld, J., and Schöpp, W.: Global anthropogenic emissions of particulate matter including black carbon, Atmos. Chem. Phys., 17, 8681–8723, https://doi.org/10.5194/acp-17-8681-2017, 2017.
Kumar, A. and Sarin, M. M.: Atmospheric water-soluble constituents in fine and coarse mode aerosols from high-altitude site in western India: Long-range transport and seasonal variability, Atmos. Environ., 44, 1245–1254, https://doi.org/10.1016/j.atmosenv.2009.12.035, 2010.
Kurokawa, J. and Ohara, T.: Long-term historical trends in air pollutant emissions in Asia: Regional Emission inventory in ASia (REAS) version 3, Atmos. Chem. Phys., 20, 12761–12793, https://doi.org/10.5194/acp-20-12761-2020, 2020.
Laakso, L., Grönholm, T., Rannik, Ü., Kosmale, M., Fiedler, V., Vehkamäki, H., and Kulmala, M.: Ultrafine particle scavenging coefficients calculated from 6 years field measurements, Atmos. Environ., 37, 3605–3613, https://doi.org/10.1016/S1352-2310(03)00326-1, 2003.
Lamarque, J. F., Dentener, F., McConnell, J., Ro, C. U., Shaw, M., Vet, R., Bergmann, D., Cameron-Smith, P., Dalsoren, S., Doherty, R., Faluvegi, G., Ghan, S. J., Josse, B., Lee, Y. H., MacKenzie, I. A., Plummer, D., Shindell, D. T., Skeie, R. B., Stevenson, D. S., Strode, S., Zeng, G., Curran, M., Dahl-Jensen, D., Das, S., Fritzsche, D., and Nolan, M.: Multi-model mean nitrogen and sulfur deposition from the Atmospheric Chemistry and Climate Model Intercomparison Project (ACCMIP): evaluation of historical and projected future changes, Atmos. Chem. Phys., 13, 7997–8018, https://doi.org/10.5194/acp-13-7997-2013, 2013.
Lamaud, E., Brunet, Y., Labatut, A., Lopez, A., Fontan, J., and Druilhet, A.: The Landes experiment: Biosphere-atmosphere exchanges of ozone and aerosol particles above a pine forest, J. Geophys. Res.-Atmos., 99, 16511–16521, https://doi.org/10.1029/94JD00668, 1994.
Lee, Y. N., Springston, S., Jayne, J., Wang, J., Hubbe, J., Senum, G., Kleinman, L., and Daum, P. H.: Chemical composition and sources of coastal marine aerosol particles during the 2008 VOCALS-REx campaign, Atmos. Chem. Phys., 14, 5057–5072, https://doi.org/10.5194/acp-14-5057-2014, 2014.
Lelieveld, J., Evans, J. S., Fnais, M., Giannadaki, D., and Pozzer, A.: The contribution of outdoor air pollution sources to premature mortality on a global scale, Nature, 525, 367–371, https://doi.org/10.1038/nature15371, 2015.
Liu, M., Huang, X., Song, Y., Xu, T., Wang, S., Wu, Z., Hu, M., Zhang, L., Zhang, Q., Pan, Y., Liu, X., and Zhu, T.: Rapid SO2 emission reductions significantly increase tropospheric ammonia concentrations over the North China Plain, Atmos. Chem. Phys., 18, 17933–17943, https://doi.org/10.5194/acp-18-17933-2018, 2018.
Liu, M. and Matsui, H.: Aerosol radiative forcings induced by substantial changes in anthropogenic emissions in China from 2008 to 2016, Atmos. Chem. Phys., 21, 5965–5982, https://doi.org/10.5194/acp-21-5965-2021, 2021.
Marandino, C. A., Tegtmeier, S., Krüger, K., Zindler, C., Atlas, E. L., Moore, F., and Bange, H. W.: Dimethylsulphide (DMS) emissions from the western Pacific Ocean: a potential marine source for stratospheric sulfur?, Atmos. Chem. Phys., 13, 8427–8437, https://doi.org/10.5194/acp-13-8427-2013, 2013.
McFiggans, G., Mentel, T. F., Wildt, J., Pullinen, I., Kang, S., Kleist, E., Schmitt, S., Springer, M., Tillmann, R., Wu, C., Zhao, D., Hallquist, M., Faxon, C., Le Breton, M., Hallquist, Å. M., Simpson, D., Bergström, R., Jenkin, M. E., Ehn, M., Thornton, J. A., Alfarra, M. R., Bannan, T. J., Percival, C. J., Priestley, M., Topping, D., and Kiendler-Scharr, A.: Secondary organic aerosol reduced by mixture of atmospheric vapours, Nature, 565, 587–593, https://doi.org/10.1038/s41586-018-0871-y, 2019.
McHale, M. R., Ludtke, A. S., Wetherbee, G. A., Burns, D. A., Nilles, M. A., and Finkelstein, J. S.: Trends in precipitation chemistry across the U.S. 1985–2017: Quantifying the benefits from 30 years of Clean Air Act amendment regulation, Atmos. Environ., 247, 118219, https://doi.org/10.1016/j.atmosenv.2021.118219, 2021.
Metzger, S., Dentener, F., Krol, M., Jeuken, A., and Lelieveld, J.: Gas/aerosol partitioning 2. Global modeling results, J. Geophys. Res., 107, https://doi.org/10.1029/2001JD001103, 2002a.
Metzger, S., Dentener, F., Pandis, S., and Lelieveld, J.: Gas/aerosol partitioning: 1. A computationally efficient model, J. Geophys. Res., 107, https://doi.org/10.1029/2001JD001102, 2002b.
Metzger, S., Steil, B., Xu, L., Penner, J. E., and Lelieveld, J.: New representation of water activity based on a single solute specific constant to parameterize the hygroscopic growth of aerosols in atmospheric models, Atmos. Chem. Phys., 12, 5429–5446, https://doi.org/10.5194/acp-12-5429-2012, 2012.
Metzger, S., Steil, B., Abdelkader, M., Klingmüller, K., Xu, L., Penner, J. E., Fountoukis, C., Nenes, A., and Lelieveld, J.: Aerosol water parameterisation: a single parameter framework, Atmos. Chem. Phys., 16, 7213–7237, https://doi.org/10.5194/acp-16-7213-2016, 2016.
Metzger, S., Abdelkader, M., Steil, B., and Klingmüller, K.: Aerosol water parameterization: long-term evaluation and importance for climate studies, Atmos. Chem. Phys., 18, 16747–16774, https://doi.org/10.5194/acp-18-16747-2018, 2018.
Myhre, G., Aas, W., Cherian, R., Collins, W., Faluvegi, G., Flanner, M., Forster, P., Hodnebrog, Ø., Klimont, Z., Lund, M. T., Mülmenstädt, J., Lund Myhre, C., Olivié, D., Prather, M., Quaas, J., Samset, B. H., Schnell, J. L., Schulz, M., Shindell, D., Skeie, R. B., Takemura, T., and Tsyro, S.: Multi-model simulations of aerosol and ozone radiative forcing due to anthropogenic emission changes during the period 1990–2015, Atmos. Chem. Phys., 17, 2709–2720, https://doi.org/10.5194/acp-17-2709-2017, 2017.
Nemitz, E., Sutton, M. A., Wyers, G. P., Otjes, R. P., Mennen, M. G., van Putten, E. M., and Gallagher, M. W.: Gas-particle interactions above a Dutch heathland: II. Concentrations and surface exchange fluxes of atmospheric particles, Atmos. Chem. Phys., 4, 1007–1024, https://doi.org/10.5194/acp-4-1007-2004, 2004.
Nenes, A., Pandis, S. N., Weber, R. J., and Russell, A.: Aerosol pH and liquid water content determine when particulate matter is sensitive to ammonia and nitrate availability, Atmos. Chem. Phys., 20, 3249–3258, https://doi.org/10.5194/acp-20-3249-2020, 2020.
Pandey, A., Sadavarte, P., Rao, A. B., and Venkataraman, C.: Trends in multi-pollutant emissions from a technology-linked inventory for India: II. Residential, agricultural and informal industry sectors, Atmos. Environ., 99, 341–352, https://doi.org/10.1016/j.atmosenv.2014.09.080, 2014.
Park, R. J., Jacob, D. J., Field, B. D., Yantosca, R. M., and Chin, M.: Natural and transboundary pollution influences on sulfate-nitrate-ammonium aerosols in the United States: Implications for policy, J. Geophys. Res.-Atmos,, 109, D15204, https://doi.org/10.1029/2003JD004473, 2004.
Petroff, A., Mailliat, A., Amielh, M., and Anselmet, F.: Aerosol dry deposition on vegetative canopies, Part I: Review of present knowledge, Atmos. Environ., 42, 3625–3653, https://doi.org/10.1016/j.atmosenv.2007.09.043, 2008a.
Petroff, A., Mailliat, A., Amielh, M., and Anselmet, F.: Aerosol dry deposition on vegetative canopies, Part II: A new modelling approach and applications, Atmos. Environ., 42, 3654–3683, https://doi.org/10.1016/j.atmosenv.2007.12.060, 2008b.
Pescott, O. L., Simkin, J. M., August, T. A., Randle, Z., Dore, A. J., and Botham, M. S.: Air pollution and its effects on lichens, bryophytes, and lichen-feeding Lepidoptera: review and evidence from biological records, Biol. J. Linn. Soc., 115, 611–635, https://doi.org/10.1111/bij.12541, 2015.
Pommier, M., Fagerli, H., Schulz, M., Valdebenito, A., Kranenburg, R., and Schaap, M.: Prediction of source contributions to urban background PM10 concentrations in European cities: a case study for an episode in December 2016 using EMEP/MSC-W rv4.15 and LOTOS-EUROS v2.0 – Part 1: The country contributions, Geosci. Model Dev., 13, 1787–1807, https://doi.org/10.5194/gmd-13-1787-2020, 2020.
Pringle, K. J., Tost, H., Metzger, S., Steil, B., Giannadaki, D., Nenes, A., Fountoukis, C., Stier, P., Vignati, E., and Lelieveld, J.: Description and evaluation of GMXe: a new aerosol submodel for global simulations (v1), Geosci. Model Dev., 3, 391–412, https://doi.org/10.5194/gmd-3-391-2010, 2010.
Sadavarte, P. and Venkataraman, C.: Trends in multi-pollutant emissions from a technology-linked inventory for India: I. Industry and transport sectors, Atmos. Environ., 99, 353–364, https://doi.org/10.1016/j.atmosenv.2014.09.081, 2014.
Saha, S., Moorthi, S., Pan, H.-L., Wu, X., Wang, J., Nadiga, S., Tripp, P., Kistler, R., Woollen, J., Behringer, D., Liu, H., Stokes, D., Grumbine, R., Gayno, G., Wang, J., Hou, Y.-T., Chuang, H.-y., Juang, H.-M. H., Sela, J., Iredell, M., Treadon, R., Kleist, D., Van Delst, P., Keyser, D., Derber, J., Ek, M., Meng, J., Wei, H., Yang, R., Lord, S., van den Dool, H., Kumar, A., Wang, W., Long, C., Chelliah, M., Xue, Y., Huang, B., Schemm, J.-K., Ebisuzaki, W., Lin, R., Xie, P., Chen, M., Zhou, S., Higgins, W., Zou, C.-Z., Liu, Q., Chen, Y., Han, Y., Cucurull, L., Reynolds, R. W., Rutledge, G., and Goldberg, M.: The NCEP Climate Forecast System Reanalysis, Bull. Am. Meteorol. Soc., 91, 1015–1058, https://doi.org/10.1175/2010BAMS3001.1, 2010.
Schobesberger, S., Junninen, H., Bianchi, F., Lönn, G., Ehn, M., Lehtipalo, K., Dommen, J., Ehrhart, S., Ortega, I. K., Franchin, A., Nieminen, T., Riccobono, F., Hutterli, M., Duplissy, J., Almeida, J., Amorim, A., Breitenlechner, M., Downard, A. J., Dunne, E. M., Flagan, R. C., Kajos, M., Keskinen, H., Kirkby, J., Kupc, A., Kürten, A., Kurtén, T., Laaksonen, A., Mathot, S., Onnela, A., Praplan, A. P., Rondo, L., Santos, F. D., Schallhart, S., Schnitzhofer, R., Sipilä, M., Tomé, A., Tsagkogeorgas, G., Vehkamäki, H., Wimmer, D., Baltensperger, U., Carslaw, K. S., Curtius, J., Hansel, A., Petäjä, T., Kulmala, M., Donahue, N. M., and Worsnop, D. R.: Molecular understanding of atmospheric particle formation from sulfuric acid and large oxidized organic molecules, P. Natl. Acad. Sci. USA, 110, 17223, https://doi.org/10.1073/pnas.1306973110, 2013.
Schwier, A. N., Sellegri, K., Mas, S., Charrière, B., Pey, J., Rose, C., Temime-Roussel, B., Jaffrezo, J. L., Parin, D., Picard, D., Ribeiro, M., Roberts, G., Sempéré, R., Marchand, N., and D'Anna, B.: Primary marine aerosol physical flux and chemical composition during a nutrient enrichment experiment in mesocosms in the Mediterranean Sea, Atmos. Chem. Phys., 17, 14645–14660, https://doi.org/10.5194/acp-17-14645-2017, 2017.
Simpson, D., Benedictow, A., Berge, H., Bergström, R., Emberson, L. D., Fagerli, H., Flechard, C. R., Hayman, G. D., Gauss, M., Jonson, J. E., Jenkin, M. E., Nyíri, A., Richter, C., Semeena, V. S., Tsyro, S., Tuovinen, J. P., Valdebenito, Á., and Wind, P.: The EMEP MSC-W chemical transport model – technical description, Atmos. Chem. Phys., 12, 7825–7865, https://doi.org/10.5194/acp-12-7825-2012, 2012.
Simpson, D., Bergström, R., Imhof, H., and Wind, P.: Updates to the EMEP/MSC-W model, 2016–2017, in: Transboundary particulate matter, photo-oxidants, acidifying and eutrophying components, Status Report 1/2017, The Norwegian Meteorological Institute, Oslo, Norway, 115–122, https://emep.int/publ/reports/2017/EMEP_Status_Report_1_2017.pdf (last access: 1 November 2021), 2017.
Simpson, D., Bergström, R., Briolat, A., Imhof, H., Johansson, J., Priestley, M., and Valdebenito, A.: GenChem v1.0 – a chemical pre-processing and testing system for atmospheric modelling, Geosci. Model Dev., 13, 6447–6465, https://doi.org/10.5194/gmd-13-6447-2020, 2020.
Skamarock, W. C., Klemp, J. B., Dudhia, J., Gill, D. O., Barker, D., Duda, M. G., Huang, X.-Y., Wang, W., and Powers, J. G.: A Description of the Advanced Research WRF Version 3 (No. NCAR/TN-475+STR), University Corporation for Atmospheric Research, https://doi.org/10.5065/D68S4MVH, 2008 (data available at: http://www.wrf-model.org, last access: 01 Nov 2021).
Sun, J., Fu, J. S., Lynch, J. A., Huang, K., and Gao, Y.: Climate-driven exceedance of total (wet + dry) nitrogen (N) + sulfur (S) deposition to forest soil over the conterminous US, Earth's Future, 5, 560–576, https://doi.org/10.1002/2017EF000588, 2017.
Sutton, M. A., Reis, S., Riddick, S. N., Dragosits, U., Nemitz, E., Theobald, M. R., Tang, Y. S., Braban, C. F., Vieno, M., Dore, A. J., Mitchell, R. F., Wanless, S., Daunt, F., Fowler, D., Blackall, T. D., Milford, C., Flechard, C. R., Loubet, B., Massad, R., Cellier, P., Personne, E., Coheur, P. F., Clarisse, L., Van Damme, M., Ngadi, Y., Clerbaux, C., Skjøth, C. A., Geels, C., Hertel, O., Wichink Kruit, R. J., Pinder, R. W., Bash, J. O., Walker, J. T., Simpson, D., Horváth, L., Misselbrook, T. H., Bleeker, A., Dentener, F., and de Vries, W.: Towards a climate-dependent paradigm of ammonia emission and deposition, Philos. T. R. Soc. B, 368, 20130166, https://doi.org/10.1098/rstb.2013.0166, 2013.
Sutton, M. A., Mason, K. E., Sheppard, L. J., Sverdrup, H., Haeuber, R., and Hicks, W. K.: Nitrogen Deposition, Critical Loads and Biodiversity, Springer, Dordrecht, 535 pp., https://doi.org/10.1007/978-94-007-7939-6, 2014.
Sutton, M. A., van Dijk, N., Levy, P. E., Jones, M. R., Leith, I. D., Sheppard, L. J., Leeson, S., Sim Tang, Y., Stephens, A., Braban, C. F., Dragosits, U., Howard, C. M., Vieno, M., Fowler, D., Corbett, P., Naikoo, M. I., Munzi, S., Ellis, C. J., Chatterjee, S., Steadman, C. E., Móring, A., and Wolseley, P. A.: Alkaline air: changing perspectives on nitrogen and air pollution in an ammonia-rich world, Philosophical Transactions of the Royal Society A: Mathematical, Phys. Eng. Sci., 378, 20190315, https://doi.org/10.1098/rsta.2019.0315, 2020.
Tan, J., Fu, J. S., Dentener, F., Sun, J., Emmons, L., Tilmes, S., Sudo, K., Flemming, J., Jonson, J. E., Gravel, S., Bian, H., Davila, Y., Henze, D. K., Lund, M. T., Kucsera, T., Takemura, T., and Keating, T.: Multi-model study of HTAP II on sulfur and nitrogen deposition, Atmos. Chem. Phys., 18, 6847–6866, https://doi.org/10.5194/acp-18-6847-2018, 2018.
Thornhill, G. D., Collins, W. J., Kramer, R. J., Olivié, D., Skeie, R. B., O'Connor, F. M., Abraham, N. L., Checa-Garcia, R., Bauer, S. E., Deushi, M., Emmons, L. K., Forster, P. M., Horowitz, L. W., Johnson, B., Keeble, J., Lamarque, J. F., Michou, M., Mills, M. J., Mulcahy, J. P., Myhre, G., Nabat, P., Naik, V., Oshima, N., Schulz, M., Smith, C. J., Takemura, T., Tilmes, S., Wu, T., Zeng, G., and Zhang, J.: Effective radiative forcing from emissions of reactive gases and aerosols – a multi-model comparison, Atmos. Chem. Phys., 21, 853–874, https://doi.org/10.5194/acp-21-853-2021, 2021.
Tsyro, S., Aas, W., Soares, J., Sofiev, M., Berge, H., and Spindler, G.: Modelling of sea salt concentrations over Europe: key uncertainties and comparison with observations, Atmos. Chem. Phys., 11, 10367–10388, https://doi.org/10.5194/acp-11-10367-2011, 2011.
UNECE: Assessment Report on Ammonia – 2020, https://unece.org/fileadmin/DAM/env/documents/2020/AIR/WGSR/Final_Assessment_Report_on_Ammonia_v2_20201126_b.pdf (last access: 27 January 2022), 2020.
Van Herk, C. M., Mathijssen-Spiekman, E. A. M., and de Zwart, D.: Long distance nitrogen air pollution effects on lichens in Europe, Lichenologist, 35, 347–359, https://doi.org/10.1016/S0024-2829(03)00036-7, 2003.
Vieno, M., Dore, A. J., Stevenson, D. S., Doherty, R., Heal, M. R., Reis, S., Hallsworth, S., Tarrason, L., Wind, P., Fowler, D., Simpson, D., and Sutton, M. A.: Modelling surface ozone during the 2003 heat-wave in the UK, Atmos. Chem. Phys., 10, 7963–7978, https://doi.org/10.5194/acp-10-7963-2010, 2010.
Vieno, M., Heal, M. R., Hallsworth, S., Famulari, D., Doherty, R. M., Dore, A. J., Tang, Y. S., Braban, C. F., Leaver, D., Sutton, M. A., and Reis, S.: The role of long-range transport and domestic emissions in determining atmospheric secondary inorganic particle concentrations across the UK, Atmos. Chem. Phys., 14, 8435–8447, https://doi.org/10.5194/acp-14-8435-2014, 2014.
Vieno, M., Heal, M. R., Williams, M. L., Carnell, E. J., Nemitz, E., Stedman, J. R., and Reis, S.: The sensitivities of emissions reductions for the mitigation of UK PM2.5, Atmos. Chem. Phys., 16, 265–276, https://doi.org/10.5194/acp-16-265-2016, 2016.
Wang, C., Yin, S., Bai, L., Zhang, X., Gu, X., Zhang, H., Lu, Q., and Zhang, R.: High-resolution ammonia emission inventories with comprehensive analysis and evaluation in Henan, China, 2006–2016, Atmos. Environ., 193, 11–23, https://doi.org/10.1016/j.atmosenv.2018.08.063, 2018.
Westervelt, D. M., Conley, A. J., Fiore, A. M., Lamarque, J. F., Shindell, D., Previdi, M., Faluvegi, G., Correa, G., and Horowitz, L. W.: Multimodel precipitation responses to removal of U.S. sulfur dioxide emissions, J. Geophys. Res.-Atmos., 122, 5024–5038, https://doi.org/10.1002/2017JD026756, 2017.
Westervelt, D. M., Fiore, A. M., Baublitz, C. B., and Correa, G.: Impact of regional Northern Hemisphere mid-latitude anthropogenic sulfur dioxide emissions on local and remote tropospheric oxidants, Atmos. Chem. Phys., 21, 6799–6810, https://doi.org/10.5194/acp-21-6799-2021, 2021.
Whitburn, S., Van Damme, M., Kaiser, J. W., van der Werf, G. R., Turquety, S., Hurtmans, D., Clarisse, L., Clerbaux, C., and Coheur, P. F.: Ammonia emissions in tropical biomass burning regions: Comparison between satellite-derived emissions and bottom-up fire inventories, Atmos. Environ., 121, 42–54, https://doi.org/10.1016/j.atmosenv.2015.03.015, 2015.
Xu, L. and Penner, J. E.: Global simulations of nitrate and ammonium aerosols and their radiative effects, Atmos. Chem. Phys., 12, 9479–9504, https://doi.org/10.5194/acp-12-9479-2012, 2012.
Xue, J., Lau, A. K. H., and Yu, J. Z.: A study of acidity on PM2.5 in Hong Kong using online ionic chemical composition measurements, Atmos. Environ., 45, 7081–7088, https://doi.org/10.1016/j.atmosenv.2011.09.040, 2011.
Zhu, L., Henze, D., Bash, J., Jeong, G. R., Cady-Pereira, K., Shephard, M., Luo, M., Paulot, F., and Capps, S.: Global evaluation of ammonia bidirectional exchange and livestock diurnal variation schemes, Atmos. Chem. Phys., 15, 12823–12843, https://doi.org/10.5194/acp-15-12823-2015, 2015.