the Creative Commons Attribution 4.0 License.
the Creative Commons Attribution 4.0 License.
 | 22 Jun 2022
Measurement report: Atmospheric new particle formation in a coastal agricultural site explained with binPMF analysis of nitrate CI-APi-TOF spectra
Magdalena Okuljar
Matti P. Rissanen
Joni Kalliokoski
Jiali Shen
Lubna Dada
Markus Lampimäki
Yusheng Wu
Annalea Lohila
Jonathan Duplissy
Mikko Sipilä
Tuukka Petäjä
Markku Kulmala
Miikka Dal Maso
The occurrence of new particle formation (NPF) events detected in a coastal agricultural site, at Qvidja, in Southwestern Finland, was investigated using the data measured with a nitrate ion-based chemical-ionization atmospheric-pressure-interface time-of-flight (CI-APi-TOF) mass spectrometer. The binned positive matrix factorization method (binPMF) was applied to the measured spectra. It resulted in eight factors describing the time series of ambient gas and cluster composition at Qvidja during spring 2019. The most interesting factors related to the observed NPF events were the two factors with the highest mass-to-charge ratios, numbered 7 and 8, both having profiles with patterns of highly oxygenated organic molecules with one nitrogen atom. It was observed that factor 7 had elevated intensities during the NPF events. A variable with an even better connection to the observed NPF events is fF7, which denotes the fraction of the total spectra within the studied mass-to-charge ratio range between 169 and 450 Th being in a form of factor 7. Values of fF7 higher than 0.50±0.05 were observed during the NPF events, of which durations also correlated with the duration of fF7 exceeding this critical value. It was also observed that factor 8 acts like a precursor for factor 7 with solar radiation and that the formation of factor 8 is associated with ozone levels.
- Article
(6320 KB) - Full-text XML
-
Supplement
(1307 KB) - BibTeX
- EndNote


Atmospheric new particle formation (NPF) and primary emissions are both important sources of the total particle number concentration and cloud condensation nuclei in the global troposphere and in the continental boundary layer (Merikanto et al., 2009; Fountoukis et al., 2012; Posner and Pandis, 2015; Dunne et al., 2016; Kulmala et al., 2016; Gordon et al., 2017; Kerminen et al., 2018; Olin et al., 2022). NPF occurring in different environments has a very diverse behavior and is also not well quantified (Kerminen et al., 2018).
Atmospheric particle measurements and related analyses of NPF events, i.e., events of the formation of new small particles and their subsequent growth, have been performed in a wide range of environments. NPF events seem to be occurring almost everywhere in the world in all seasons, but their occurrence varies a lot between sites and seasons (Kerminen et al., 2018). Probably the most intensively studied environments in terms of NPF are boreal forests and urban areas. In this study, we present the gas, particle, and cluster data measured in a coastal agricultural site and search for parameters favoring or disfavoring NPF events. NPF often occurs as regional NPF events over large spatial areas of even hundreds of kilometers. On the other hand, it can be more local (Junninen et al., 2022).
Several parameters influencing the occurrence of NPF events have been proposed in the literature, but a consistent and universal parameterization is still lacking since the optimal parameters predicting NPF events in different locations vary significantly (Kerminen et al., 2018). Variables for predicting NPF most frequently reported are solar radiation (Birmili and Wiedensohler, 2000; Birmili et al., 2003; Guo et al., 2012; Jun et al., 2014; Pierce et al., 2014; Qi et al., 2015), preexisting particle loadings (Birmili et al., 2003; Dal Maso et al., 2007; Pikridas et al., 2012; Salma et al., 2016; Dada et al., 2017), relative humidity (RH) (Birmili et al., 2003; Wu et al., 2007; Guo et al., 2012; Jun et al., 2014), temperature (T) (Paasonen et al., 2013; Dunne et al., 2016; Dada et al., 2017), and the concentration of sulfuric acid (H2SO4) (Birmili et al., 2003; Kulmala et al., 2006; Wang et al., 2011; Qi et al., 2015; Yao et al., 2018) or its main precursor, sulfur dioxide (SO2) (Birmili and Wiedensohler, 2000; Woo et al., 2001; Guo et al., 2012). Of those, high solar irradiances and high H2SO4 concentrations ([H2SO4]) typically favor the occurrence of NPF events. Instead, high preexisting particle loadings, such as condensation sink (CS) consuming possibly nucleating precursors, and high RH typically disfavor them. Instead, T and SO2 concentration ([SO2]) are inconclusive, as their roles in NPF events are ambiguous between different data sets. Also, organic compounds with low enough volatilities or highly oxygenated organic molecules (HOMs) have recently been connected to atmospheric NPF (Dada et al., 2017; Bianchi et al., 2019). Specific to coastal environments are the roles of iodine compounds (O'Dowd et al., 2002), such as iodic acid (HIO3) (Sipilä et al., 2016; Baccarini et al., 2020; He et al., 2021) and methanesulfonic acid (CH4SO3) (Dawson et al., 2012; Beck et al., 2021) in NPF. Ammonia (NH3), as a base, is known to enhance H2SO4-driven nucleation through stabilizing critical clusters (Kulmala et al., 2014), which can be important in agricultural environments since it is a substantial component in fertilizers. Studies on NPF from agricultural land emissions have usually been related to NH3, but also, e.g., skatole is suggested (Ciuraru et al., 2021), which is an organic compound in sewage sludge used in fertilizers.
Additionally, general criteria for the occurrence of NPF events have been searched for, but still, no suitable estimator covering a variety of different environments has been found. Another difficulty with these criteria is that they usually require specific information on multiple variables, such as particle size distributions or growth rates or precursor concentrations. In this study, we propose another parameter (named here fF7) for predicting NPF events, which can be used in examining the occurrence of NPF events in coastal or agricultural areas or even in searching for the general criteria. Surprisingly, fF7 does not include any particle variables but is solely based on mass spectrometric data of airborne molecules analyzed using the binned positive matrix factorization method (binPMF) instead. More specifically, fF7 denotes how much of the observed mass spectra is in a specific form of the mixture of organic compounds. Additionally, the suggested explanation or routing of the observed NPF events gives insights into particle formation mechanisms occurring in the studied environment. The actual origins of the detected compounds and binPMF factors are not examined in this measurement report.
2.1 Measurement site and time range
Measurements were performed at a pilot agricultural farm for regenerative farming, at Qvidja, located in a coastal environment in the Turku archipelago, in Southwestern Finland. The measurement site is located in the middle of fields and has the shortest distance to the sea of 500 m and to the nearest forest of 100 m. The nearest town, Parainen, with ∼15 000 inhabitants, is located 5 km to the west, and a larger city, Turku, with ∼195 000 inhabitants, is located ∼18 km toward the inland. The fields have clayey soil and they consist of several grass and clover species. Since 2017, sustainable and environmentally friendly field management practices have been conducted at the farm. More detailed information on the location, species, and management practices of Qvidja can be found in Heimsch et al. (2021).
The data used in this study are a part of long-term measurements provided by the instruments installed in a container in the middle of the fields. Additionally, a laboratory van, ATMo-Lab, was parked next to the container for the time range between 2 April and 26 June 2019. As the key instrument of this study, a mass spectrometer was located in the van; only the data from this time range from the longer time series are utilized in this study.
2.2 Measurement instruments
The measurement instruments in the container include several gas analyzers, devices measuring environmental parameters, and aerosol samplers. Gas analyzers utilized in this study measure the concentrations of SO2, ozone (O3), carbon monoxide (CO), nitric oxide (NO), nitrogen oxides (NOx), and NH3. Utilized environmental parameters are temperature (T), relative humidity (RH), and net radiation (NetRad). The aerosol samplers used were two particle size magnifiers (PSM,A and PSM,B), a neutral cluster and air ion spectrometer (NAIS), and a differential mobility particle sizer (DMPS). PSM,A and PSM,B were used to determine the particle size distributions in the size ranges of 1.15–2.8 and 1.3–2.8 nm, respectively. NAIS was used here to detect particles in the size range of 2.7–6.5 nm using its negative-polarity charger. DMPS was used to determine the particle size distribution in the size range of 6–823 nm and CS, which was calculated with the method by Kulmala et al. (2012) using a common approximation of assuming H2SO4 as the condensing vapor.
A nitrate-ion-based (-based) chemical-ionization atmospheric-pressure-interface time-of-flight (CI-APi-TOF) mass spectrometer (Aerodyne Research Inc.; USA and Tofwerk AG, Switzerland; Jokinen et al., 2012) was installed in the laboratory van. It consists of a chemical-ionization (CI) inlet (Eisele and Tanner, 1993) and an APi-TOF mass spectrometer (Junninen et al., 2010). was produced by adding nitric acid (HNO3) vapor to the sheath air, which was then exposed to X-ray radiation inside the CI inlet. The HNO3 vapor was produced by directing 10 sccm flow of the sheath air through a glass vial containing liquid HNO3. The sheath air was a 20 slpm flow of outdoor air filtered using an activated carbon filter and a HEPA filter. The outdoor air sample was drawn to the CI inlet with the flow rate of 8.3 slpm through a side hatch of the van with a 16 mm pipe of 60 cm length, which also acts as a laminarization tube for the CI inlet. The APi-TOF mass spectrometer provided the mass resolving power of 3500–4000 Th/Th for the studied mass range with the voltage settings used.
The data were recorded in 4 s time resolution but were first averaged to 600 s resolution (ta) in order to increase signal-to-noise ratios (SNRs) but still maintain an adequate time resolution for the campaign. The averaging was performed with a TOF mass spectrometer data processing code for MATLAB, tofTools, resulting in 9970 valid time bins. The averaged TOF spectra were then calibrated with the tofTools code against known mass-to-charge ratios () of always existing ions with a -based CI inlet, , ⋅ HNO3, and ⋅ (HNO3)2 or ⋅ nitrophenol (C6H4OHNO2).
3.1 Potential new particle-forming acids
Compounds previously most associated with NPF observed in a coastal environment measured using the CI-APi-TOF are the acids H2SO4, HIO3, and CH4SO3.
[H2SO4] is calculated as by Olin et al. (2020) with the equation
where C is the calibration coefficient for H2SO4 (i.e., ) determined with known H2SO4 concentrations (details of the method are well described in Kürten et al., 2012) at the measurement site (once a month), P is the penetration efficiency of H2SO4 in the 60 cm long sampling pipe with a flow rate of 8.3 slpm (i.e., 0.58±0.03) determined with the function by Gormley and Kennedy (1948), and the curly brackets denote the areas of the peaks at the corresponding mass-to-charge ratios in the high-resolution mass spectra obtained from the tofTools code. [H2SO4] has a relative uncertainty of 15 %, originating mostly from the uncertainty in C, determined with its variation between three calibration runs during the campaign. However, because a single calibration run also involves its own systematic uncertainty (Kürten et al., 2012) – which is not easily quantified – the uncertainty in [H2SO4] can be higher (a frequently used rough approximation is −50 %/+100 %).
Although generally untypical, there was another peak overlapping with the bisulfate ion, , peak (96.96 Th) at 96.97 Th in these data. The overlapping peak corresponds to (hydrochloric acid, HCl, and carbonic acid, H2CO3, were also detected separately), and it covered 10 %–90 % of the area of the total peak at 97 Th. Therefore, high-resolution fitting was a necessity in determining [H2SO4] in this case, whereas fitting with the unit mass resolution (UMR) is sufficient in many cases. The detection of H2CO3 with ionization is untypical, and it usually implies insufficient HNO3 in the ionizer. This potentially leads to detecting less bound product ⋅ adducts, i.e., decreasing the selectivity (Hyttinen et al., 2015), yet it is not an easy task to estimate how much. This was not observed, but it should be kept in mind that the data from the last 3 weeks (during which the H2CO3 signal was at its highest) have to be interpreted with caution.
The concentrations of HIO3 ([HIO3]) and CH4SO3 ([CH4SO3]) were calculated as for H2SO4, with the exception of the peaks and , respectively, as a numerator in Eq. (1). Due to the lack of calibration methods for compounds other than H2SO4, we used a common approximation in which the values of C and P determined for H2SO4 were used for these compounds too. That is because these species (HIO3 and CH4SO3) have collision-limited charging efficiency when reacting with ions (Simon et al., 2020; Beck et al., 2021; Wang et al., 2021). Uncertainties in [HIO3] and in [CH4SO3] are not easily quantified, but the relative uncertainty of 15 % in [H2SO4] (or −50 %/+100 %) can be used in estimating relative uncertainties during the campaign. However, the absolute levels of [HIO3] and [CH4SO3] can still differ more due to the approximation of using C and P determined for H2SO4, but the difference between the calibration coefficients for different compounds is expected to be nearly constant during the campaign.
3.2 binPMF analysis
The mass spectra between 169 and 450 Th obtained from the tofTools code were analyzed using the binPMF analysis method described by Zhang et al. (2019). Ions smaller than 169 Th were omitted because there are many organic compounds that are unlikely the key compounds in NPF and have relatively high signals possibly causing issues in the binPMF analysis. Compounds with lower masses typically have higher volatilities and are thus more unlikely participating in nucleation and condensation. However, it is not generally true since, e.g., H2SO4 and CH4SO3 are below 169 Th but are still known to contribute to NPF. Therefore, they were analyzed separately to the binPMF analysis. One of the highest peaks in the spectra, malonic acid– cluster (166 Th), with its isotopes, was the largest of the omitted ions. Ions larger than 450 Th were also omitted due to their reduced transmission efficiency inside the APi-TOF device with the voltage settings used. Additionally, ions between 188 and 190 Th were omitted because the nitrate trimer – one of the reagent ions – with its isotopes falls in that range.
As by Zhang et al. (2019), the spectra were binned to bins with a width of 0.02 Th between N−0.2 and N+0.3 Th where N is an integer mass, resulting in 25 bins per integer, i.e., in 6975 bins in total in this case. The basis of PMF, in general, is to express the measured data matrix (X) with a time series matrix of factor intensities (TS), a factor mass spectra matrix (MS), and a residual matrix (R). The minimization of the residuals is attempted so that the factor construction would describe the measured spectra most realistically. The number of factors, p, is a free parameter, and its optimal value can be estimated by minimizing the residuals. In this case of binPMF, this is mathematically expressed with the equation
The data matrix X was normalized before running the binPMF code with the reagent ion signals, as is done with the denominator in Eq. (1) for calculating [H2SO4]. This way the data matrix becomes dimensionless and is expressed relative to the concentration.
The binPMF code tries to find the matrices TS and MS producing the lowest possible value for the sum of the scaled residuals,
where S is the uncertainty matrix. S was estimated from the ambient data via the method suggested by Yan et al. (2016), i.e., through approximating instrument noise as the difference between the measured signal and its moving median over five data points. The differences are determined separately for all 9970 time bins and for all 6975 bins. Assuming that the counting statistics follow the Poisson distribution, the function
where a is the correcting factor incorporating any unaccounted contributions to the uncertainty (Allan et al., 2003), and I is the signal intensity in counts per second (cps), can be described to express the instrument noise. The values for a and σnoise were first determined for all bins separately by fitting the differences between the measured signal and the moving median for different levels of I using all time bins and Eq. (4). The obtained a and σnoise values were then averaged over all bins using the successes of the fittings as weighting factors. Finally, the values of and were obtained, and the function for calculating the uncertainty matrix became
The value of a obtained here, 1.35±0.22, is on a similar level to the values in the study by Yan et al. (2016), 1.28±0.09 or 1.1±0.3. Similar to the matrix X, the matrix S was also normalized with the reagent ion signals before running the binPMF code to have them expressed with the same units (dimensionless).
The binPMF code used in this study (customized MATLAB's nnmf function) includes similar downweighting schemes for signals with low SNRs and for outliers with to the code used by Zhang et al. (2019). A theoretically expected Q value (Qexp) can be calculated as the number of non-downweighted elements in X subtracted by the number of elements in TS and MS in total. The code was run with increasing p until the ratio set to a level with no further decrease. Because a PMF analysis depends on the initial guesses of TS and MS (seeds), the code was run with 50 random seeds per every p to find the optimal p and finally with 300 random seeds with the optimal p, of which the seed providing the lowest Q value was selected for further analysis. The lowest is not necessarily the best solution of PMF because the solution of PMF is not unique due to the nature of PMF. For example, due to its rotational ambiguity, there are basically an infinite number of solutions providing equal Q values (Paatero et al., 2002). Rotational ambiguity is, however, not considered in this study because it is typically not a problem with ambient measurement data, which usually contain enough data points with values near zero (Zhang et al., 2019).
Because the factor intensity matrix TS is a dimensionless variable, it is further converted to a practical variable using the calibration coefficient and penetration efficiency of H2SO4, also for the factor intensities. Hence, the factor intensities denote hereafter the total concentrations of all compounds within a factor. However, it should be noted that a total concentration of a factor would only be true if all the compounds had responses between concentrations and the normalized signals and the penetration efficiencies similar to H2SO4. Penetration efficiencies are not expected to differ notably between H2SO4 and the compounds with of 169–450 Th, detected by nitrate CI-APi-TOF, but calibration coefficients are. C for H2SO4 denotes a value near the highest possible sensitivity, since the charging efficiency of H2SO4 is collision-limited (Simon et al., 2020). However, C can be even orders of magnitude higher for compounds with weaker binding energies with (Hyttinen et al., 2015). Therefore, the sensitivity of the system used can be much lower for some compounds. This is especially true for organic compounds with low oxygen-to-carbon (O:C) ratios, since organic compounds with an adequately large number of carbon atoms with are estimated to have similar collision-limited charging efficiencies to H2SO4 (Simon et al., 2020), but the binPMF factors of this study include compounds with lower O:C ratios too. As it is practically impossible to determine calibration coefficients for all detectable compounds, this commonly used approximation is only used here to convert the dimensionless variables in TS to a practical concentration-based unit.
From all 84 measurements days, 25 d show clear features of NPF events, during which a new particle mode appears by growing from the very small particle sizes near 1 nm toward a larger-sized background mode and finally merges with it. Instead, 37 d have hardly any NPF event features, and 19 d have unclear features and cannot thus be classified as event or non-event days. The remaining 3 d remain uncertain due to gaps in the measurement data. These classifications are listed in Table S1 in the Supplement.
4.1 Time series of measured variables
Figure 1 presents time series of particle size distribution contours with variables most likely promoting NPF for three example time ranges. The time range before the fertilization (Fig. 1a) represents a great example of a quite constant background particle mode around 100 nm during the first 3 d followed by a clear and strong (the strength of a NPF event is defined as the duration of continuing NPF during a NPF event) NPF event (28 April). The subsequent 3 d also have NPF event features, but they become weaker every day, and the last one (1 May) just has hints of a very short NPF event. The reason for the inexistent NPF during the first 3 d is probably the suppression due to a high CS level (0.01–0.02 s−1). The reason for the strong NPF event on 28 April and the subsequent weakening events cannot be clearly explained with any of the measured variables. Nevertheless, the most promising particle-forming compound measured is H2SO4 because its concentration is elevated approximately at the same time as the events. However, it does not show a decreasing trend during the weakening trend of the NPF events, and CS also remains on a lower level (∼0.005 s−1). [HIO3] is also elevated during the daytime, but its levels do not explain these NPF events because it is its highest on the last 2 d, with no clear NPF events. [NH3] and [CH4SO3] seem to not clearly explain any changes in particle size distribution data.
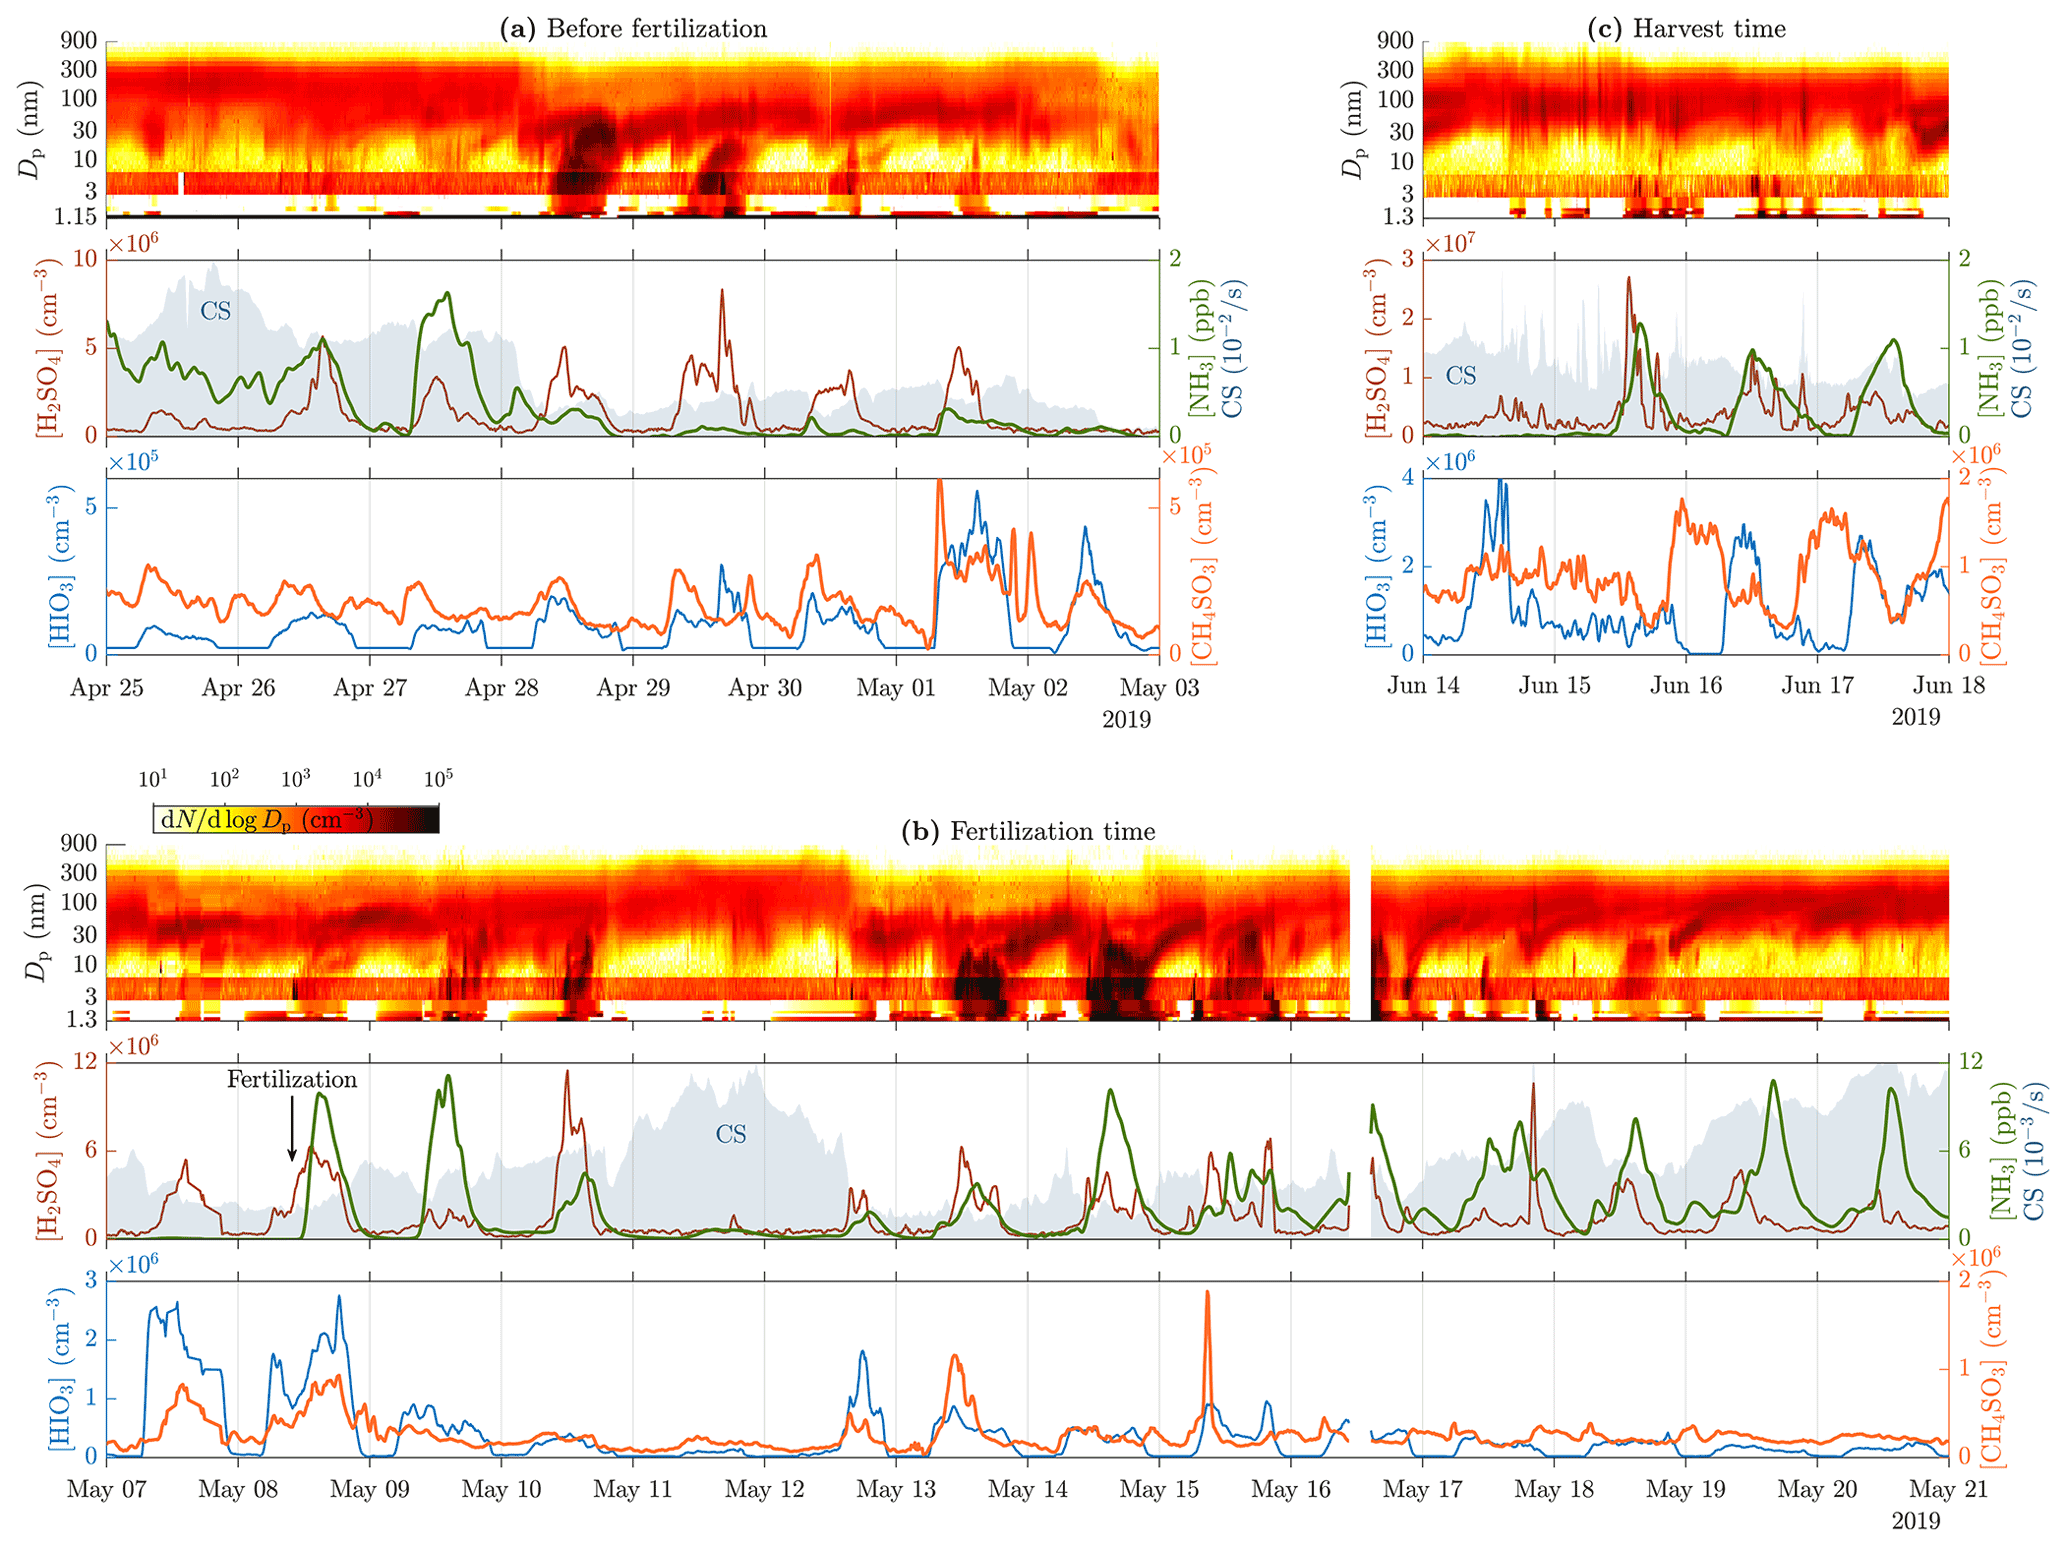
Figure 1Time series of particle size distribution contours (top panels), [H2SO4], [NH3], CS (shaded areas in the middle panels), [HIO3], and [CH4SO3] (bottom panels) for different example time ranges, (a) before the fertilization, (b) during and right after the fertilization, and (c) during the harvest. Particle data below 3 nm are from a PSM, data over 6 nm are from the DMPS, and the remaining data between them are from the NAIS. The data from the NAIS show red banners due to its general tendency to overestimate concentrations at these particle sizes (Gagné et al., 2011; Mirme and Mirme, 2013; Kangasluoma et al., 2020). Note that the PSM data shown in (a) are from the PSM,A, whereas the data shown in (b) and (c) are from the PSM,B due to different coverage of the devices. Also, note different scales of the y axes between the subfigures.
The time range during the fertilization (8 May) and right after it (Fig. 1b) includes one of the strongest NPF events (14 May) during this measurement. Noteworthy is that the fertilization increases daytime [NH3] remarkably (100-fold compared to the time right before the fertilization and 10-fold compared to the average of the preceding days). However, the occurrence of NPF events does not increase after the fertilization, even though [NH3] remains high, implying that, on the one hand, NH3 is not a key compound or is not a limiting factor in NPF events during these measurements, and on the other hand, [NH3] seems to be higher during the days showing NPF features, with the exception of the last days, during which CS begins to approach and exceed the level of 0.01 s−1, showing high [NH3] but no NPF. [H2SO4] seems promising here too, but still no clear criterion for the occurrence of an NPF event at this site can be constructed from any of the measured variables.
The time range during the harvest (Fig. 1c) shows another type of changes in particle size distribution data. There are short spikes of increased particle concentrations within the size range of 20–200 nm and thus in CS too, occurring several times a day. They originate probably from direct emission sources, e.g., from tractors harvesting the fields, rather than via NPF because there is no simultaneous concentration increase in particles smaller than those. It can be observed that the [H2SO4] time series also contains spikes at the coincident time moments, highlighting the possibility of tractors as the source of 20–200 nm particles.
4.2 binPMF results
Previously presented analysis on the measured variables did not provide any clear formula for the occurrence of the NPF events in this measurement site. Next, we concentrate on the results from the binPMF analysis and how they can be related to the occurrence of the events.
4.2.1 Determining the optimal number of factors
Figure 2 presents the lowest obtained ratios with different random seeds and with different numbers of factors (p). It can be seen that decreases with increasing p, as expected. The decrease rate is at its greatest when p increases from 2 to 6. This denotes that there is a significant improvement in every step in which the measured spectra are described with an additional factor beginning from the set of two factors only. It also denotes that there could be six main sources resulting in the measured spectra. However, still decreases slightly from p=6 to p=9, denoting that taking more than six sources into account provides a slight improvement in describing the spectra with more factors. The decreasing rate of diminishes almost totally after p=9 and sets to 4. Theoretically, should set to 1 if the uncertainty matrix S has been constructed ideally. Thus, of 4 being over 1 denotes that underestimations exist in estimating the uncertainties of the measured spectra. According to the decrease rates, the optimal p would be in the range of 6–9. The lowest sensible p is preferred because it simplifies further analysis. Because organic compounds are in a key role in this study, the value p=8 was selected for further analysis because it is the lowest value producing the MS matrix, which includes at least four different factor profiles with organic patterns separated with 14–16 Th (three factor profiles with organic patterns with p=6 or p=7; see Fig. S1 in the Supplement). These separations correspond to the increments of mass due to additional oxygen molecules or due to different carbon chain lengths.

4.2.2 Selected set of factors
Figure 3 presents an overview of the factor profiles (arranged according to their average masses) and Fig. 4 their diurnal variations obtained with p=8. It can be observed with a rough examination that factors 4, 5, 7, and 8 have organic patterns. In addition to these, factors 2 and 6 have sharp peaks repeating with 18 Th, which correspond to the nitrate monomer and dimer clustered with different numbers of water molecules. Conversely, the remaining factors, 1 and 3, have peaks located with no clear patterns. The diurnal variations show that factors 1, 3, 4, and 7 are typically encountered in the daytime, while the rest are at their highest during mornings.

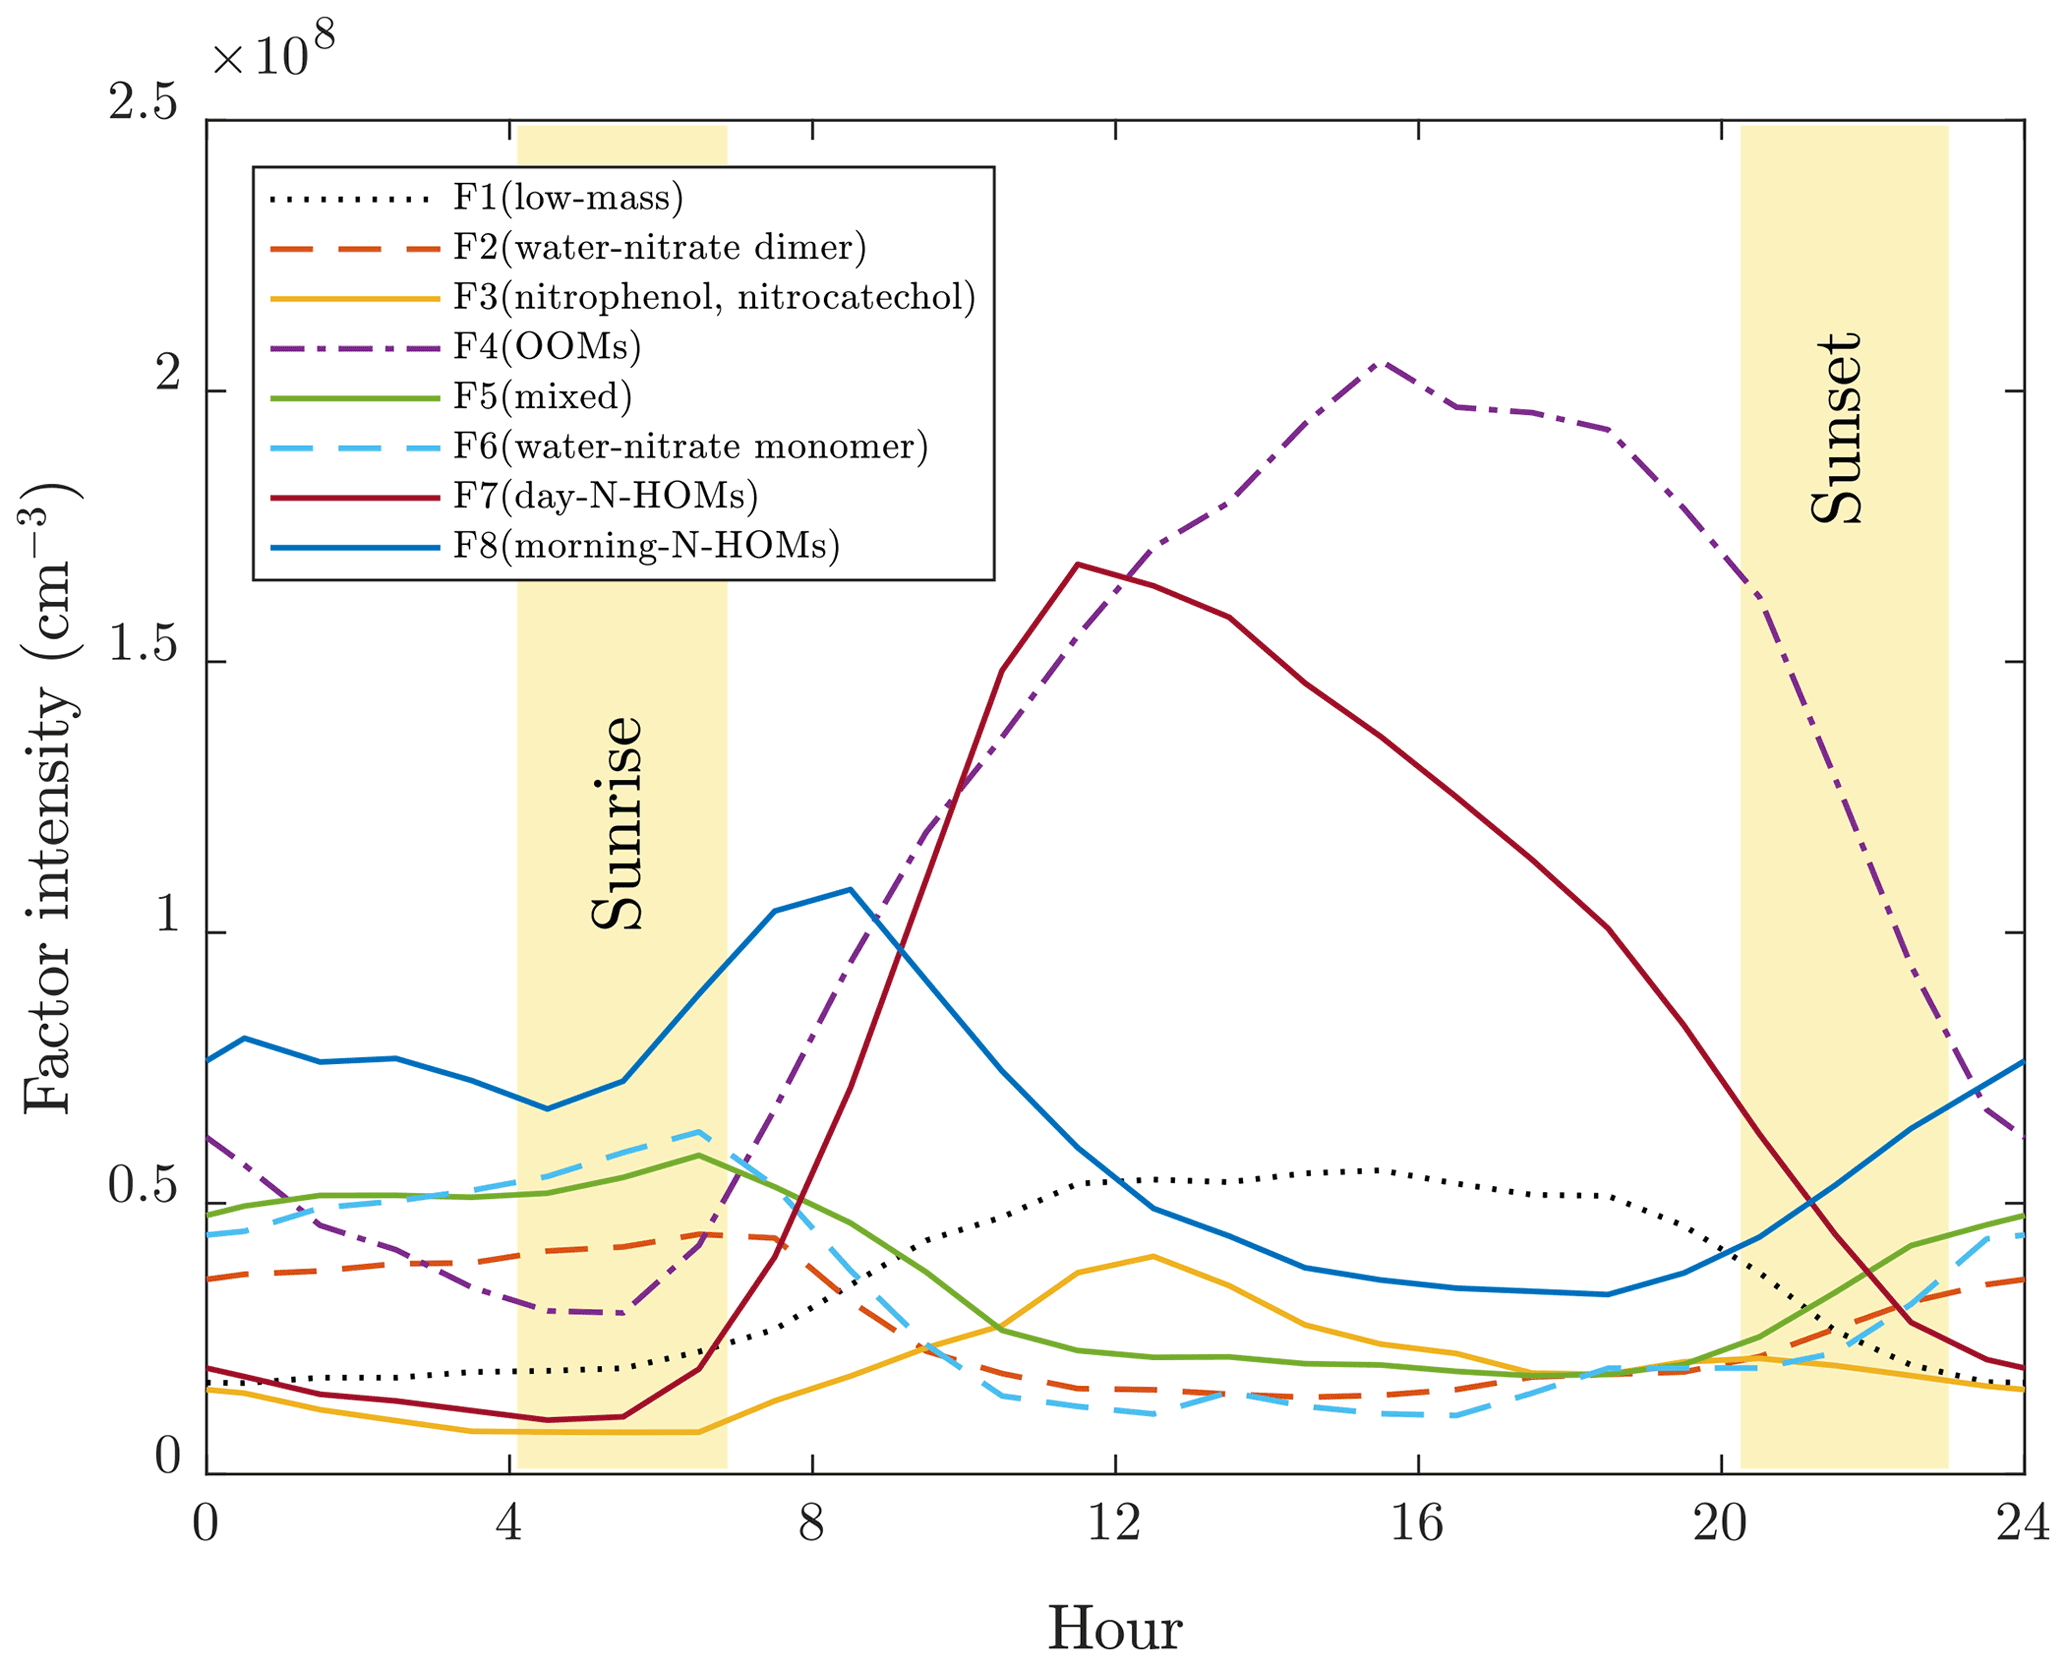
Figure 4Mean diurnal variations of the factor intensities. The yellow areas denote the variation in sunrise and sunset times during the experiments.
The key strength of a binPMF analysis is its applicability in examining the factor profiles with high mass resolution. A more thorough examination of the factor profiles and their naming is performed next. Several peaks were identified from the profiles using the tofTools code, and the highest ones in every profile are presented in Table 1. A more extensive peak list can be found in Table S2.
Table 1The highest peaks in the binPMF factors. Observed ratiosa, chemical formulae corresponding best to them (in neutral forms, i.e., without the nitrate ion or with an added proton)b, errors between the observed and exact ratiosc, possible compound namesd, and confidence levels of the identificationse are presented. The confidence levels are based on subjective estimations on the success of peak fitting (aided by the errors of water clusters at specific ratios and by the known isotopic patterns) and on the expectation of the compound to be detected with the instrumentation used. A more extensive peak list can be found in Table S2.
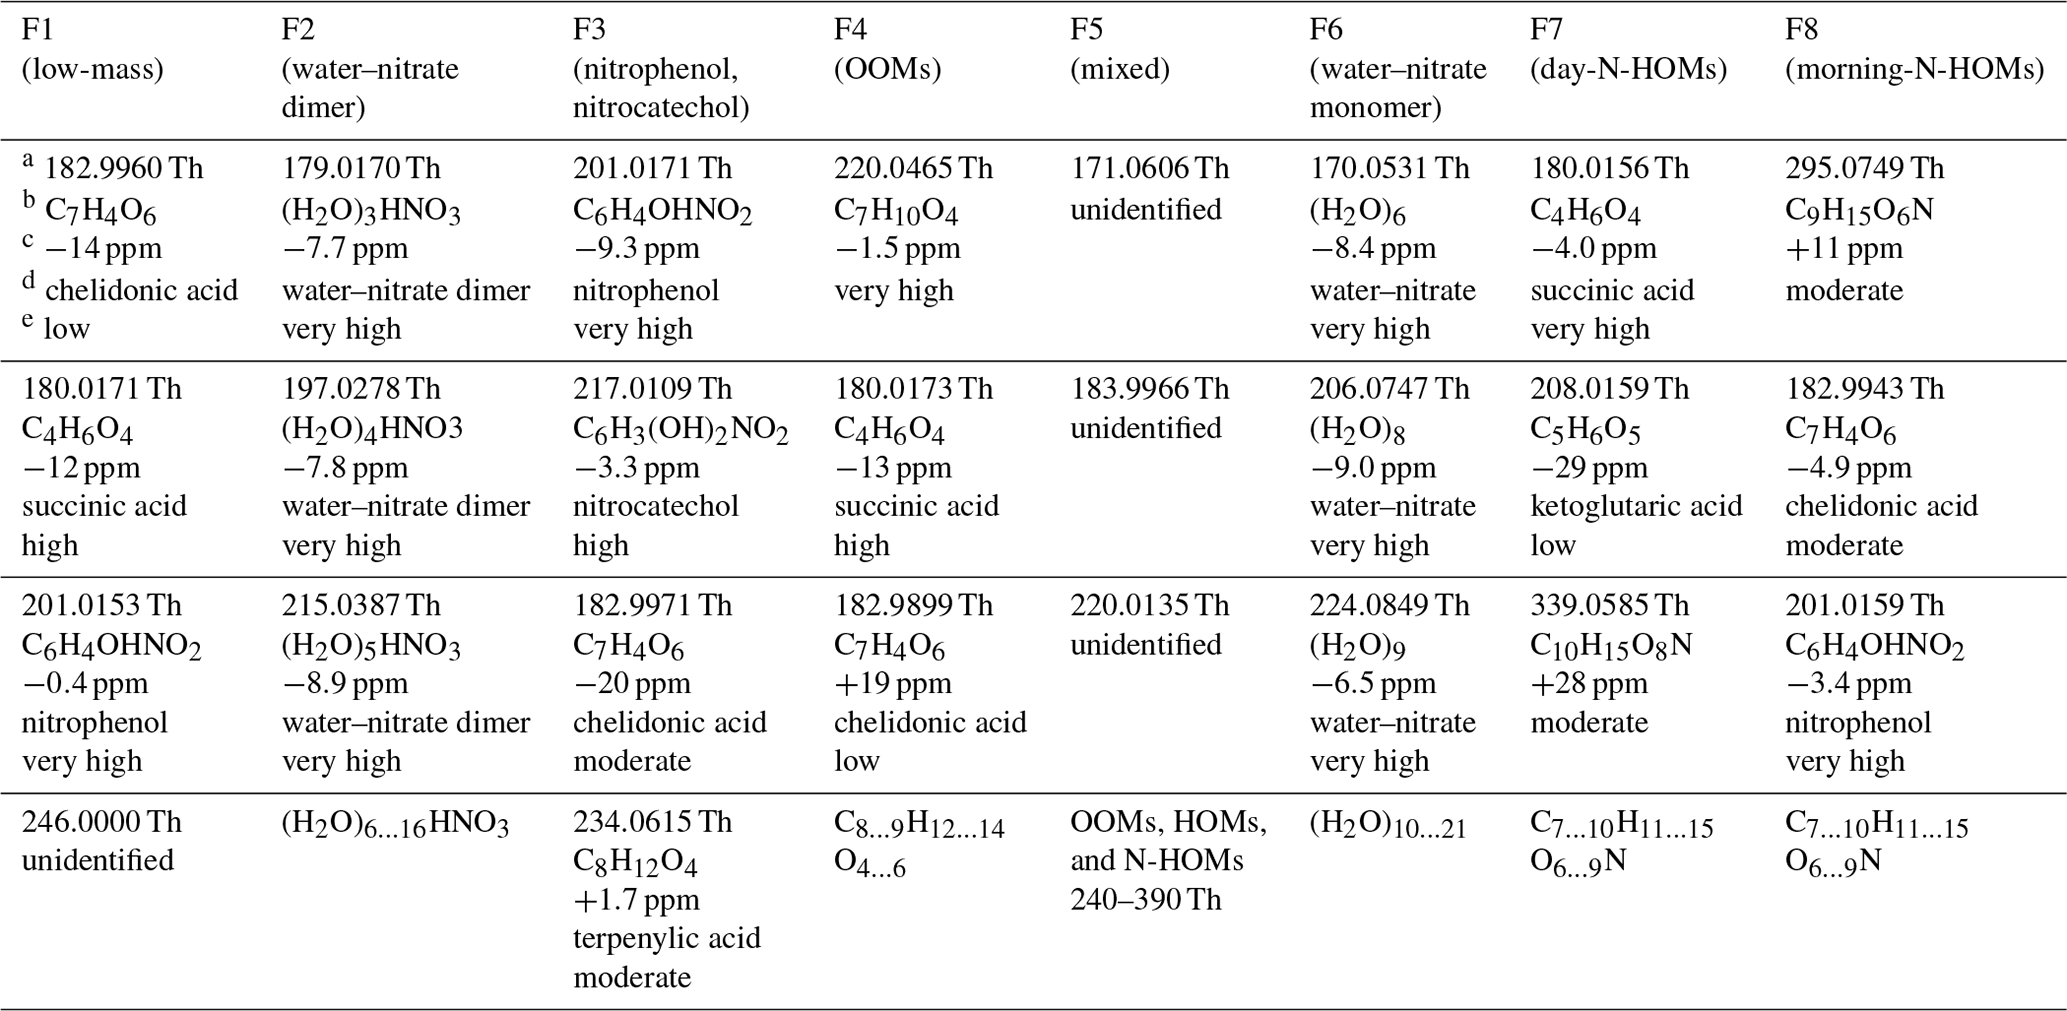
It is worthwhile to note that the axis was calibrated using the known compounds within the range of 62–201 Th, causing the peaks at the higher end of the spectra to be systematically slightly shifted toward larger values. The median error of the calibration during the campaign was 0.4 ppm. However, the errors were as high as 80 ppm during eight nights near the end of the campaign due to high H2CO3 signals causing overlapping signals to the and peaks used in the calibration. Nevertheless, the result of the calibration, which is the parameters used to convert time-of-flight to , did not include any significant deviation during those nights, implying that the calibration itself was successful although the choice of the peaks for the calibration were not optimal for those nights. Additionally, due to the limited mass resolution of a binPMF analysis, the spectra in the factor profiles can be further mispositioned slightly. Nevertheless, identifying possible chemical formulae from the observed peaks was still done with relatively high confidence for several peaks, aided by observed errors of ratios of water clusters (see Sect. 4.2.3). Note that determining correct isomers of identified chemical formulae is generally impossible with the TOF mass spectrometer.
4.2.3 Characteristics of factors 2 and 6
Factors 2 and 6 are the factor profiles which include the clearest and most confidently identified peaks and their repeating pattern. The factor profiles consist almost solely of the clusters of nitrate dimer (factor 2) or nitrate monomer (factor 6) and 3–16 (factor 2) or 6–21 (factor 6) water molecules. They also have similar morning-type diurnal patterns but are still separated into different factors because factor 2 has a higher intensity in the beginning part of the measurement period and factor 6 vice versa. These water clusters are instrumental impurities caused by humidity inside the CI inlet, where water molecules cluster with newly formed nitrate ions. In this article, these factors are named F2(water–nitrate dimer) and F6(water–nitrate monomer).
Because the water cluster peaks in F2(water–nitrate dimer) and F6(water–nitrate monomer) are detected with very high confidence up to 400 Th, their errors can be used as another type of mass calibration, performed after the binPMF analysis. The water cluster peaks have errors between −10 and 0 ppm when is below 280 Th and increase from 0 to +50 ppm when increases from 280 to 400 Th. Hence, also the peaks in the other factors are expected to have similar error levels.
4.2.4 Characteristics of factor 3
Factor 3 comprises mainly of a peak typically encountered with nitrate ionization, (nitrophenol, C6H4OHNO2, clustered with a nitrate ion), and a peak at 217.0109 Th. The latter one is possibly from C6H3(OH)2NO2, which corresponds to nitrocatechol (or its isomer). Both nitrophenol and nitrocatechol are connected at least to biomass burning (Iinuma et al., 2010). Additionally, other peaks were located with no clear pattern but with much lower intensities existing in factor 3. The ones of these with the highest intensities include peaks at 182.9971 and 234.0615 Th, which correspond best with and with , respectively. One possibility is that they are from chelidonic and terpenylic acid, both connected to vegetation. This factor is named here F3(nitrophenol, nitrocatechol).
4.2.5 Characteristics of factor 4
The next clearest of the factor profiles is factor 4. It consists mainly of oxidized organic molecules (OOMs) within the range of 200–350 Th (including clustered nitrate ions, which are hereafter omitted from the shown chemical formulae for convenience) with the chemical formulae of a form of CxHyOz, of which the peaks identified with high confidence have x of 7, 8, or 9, y of 10, 12, or 14, and z of 4, 5, or 6. The largest of these molecules can also be considered HOMs, by the definition of a HOM having at least six oxygen atoms (Bianchi et al., 2019). Additionally, factor 4 includes peaks corresponding likely with succinic acid and possibly with chelidonic acid (at 182.9899 Th). Succinic acid together with peaks with lower intensities and lower confidence levels also likely found, fumaric and malic acid, belong in the citric acid cycle, which is a metabolic pathway of aerobic organisms, including plants. However, the peak at 182.9899 Th can potentially be something other than chelidonic acid, at least a different compound than in other factors with a peak at ∼183 Th because the peak in this factor falls on the other side of the exact mass of deprotonated chelidonic acid (182.9935 Th) compared to the other factors. A lower error than for chelidonic acid (+19 ppm) is achieved with C2H3O5N (−3 ppm), which could be peroxyacetyl nitrate, but its detection with -based ionization has not been reported before. This factor is named here F4(OOMs).
4.2.6 Characteristics of factors 7 and 8
Factors 7 and 8 have repeating organic patterns (mainly N-HOMs which are HOMs with an extra nitrogen atom) in the range of 230–410 Th. These N-HOMs have the chemical formulae of a form of CxHyOzN, of which the peaks identified with high confidence have x of 7, 8, 9, or 10, y of 11, 13, or 15, and z of 6, 7, 8, or 9. Though the transmission efficiency decreases with increasing , a high peak at 339.0585 Th being likely C10H15O8N in factor 7 and a very high peak at 295.0749 Th being likely C9H15O6N in factor 8 are distinguished clearly from the profiles. The first indication of the connection between C10H15O8N and atmospheric nucleation was reported by Kulmala et al. (2013).
The profiles of factors 7 and 8 differ also in a way that the peaks at the lower end of the range are of higher intensity in factor 7 than in factor 8. These peaks in factor 7 also include compounds that can be related to the citric acid cycle, e.g., succinic, ketoglutaric, and malic acid. Instead, no citric-acid-cycle-related compounds exist in factor 8, but nitrophenol and possible chelidonic acid do. According to their diurnal patterns, these factors are named here F7(day-N-HOMs) and F8(morning-N-HOMs).
4.2.7 Characteristics of factor 5
Factor 5 is elevated at nighttime and consists of several unidentified peaks in the lower end of the range and of OOMs, HOMs, and N-HOMs mixed with each other in the range of 240–390 Th. No clear pattern can be observed from this mixture.
One key feature in factor 5 is also its clearly increasing intensity toward the summer, while the other factors do not show that kind of behavior. Although with low intensity and confidence, there are also peaks suggesting citric-acid-cycle-related compounds, e.g., fumaric, malic, and aconitic acid. Additionally, although not directly included in factor 5, pyruvic acid (at 87.0088 Th in the spectra before binPMF), a key compound in the beginning of the citric acid cycle, seems to be encountered simultaneously with factor 5. This factor is named here F5(mixed).
4.2.8 Characteristics of factor 1
The last one of the factor profiles, factor 1, is elevated at daytime and consists mostly of low-mass compounds, including nitrophenol, succinic acid, probably chelidonic and malic acid, and several other peaks without any clear pattern between them. This factor is named here F1(low-mass).
4.3 Correlations between variables
Figure 5 presents Pearson's correlation coefficients (R) between all possible pairs of measured variables and binPMF factors in 10 min time resolution. Connecting any variable to NPF events can be estimated with correlations to particle variables, such as to the number concentration (N) measured by PSMs, NAIS, or DMPS and to CS. It should be noted that this is only an estimation of the connections between variables and NPF events. Thus, it cannot be proved with certainty that a variable is actually forming new particles or growing them by examining the correlations. There is always a possibility that a variable is only observed simultaneously with NPF events due to the similarity of its source and the source of the precursor really causing the NPF events. This kind of uncertainty is, however, present in all similar studies as well, and therefore, the observed correlations should also be assessed by considering whether they are physically reasonable or not. In Fig. 5, the number concentrations from the different devices represent different particle size ranges; additionally, only refers to particles detected using the negative-polarity charger. It can be seen that clearly positive correlations for all particle sizes are observed with F3(nitrophenol, nitrocatechol), F7(day-N-HOMs), [SO2], [NH3], [H2SO4], T, and NetRad, of which F3(nitrophenol, nitrocatechol) and [H2SO4] have the strongest ones. It is clear why T and NetRad are positively correlated with particles because NPF events almost exclusively occur during the daytime. The connections of [NH3] and [H2SO4] to NPF were observed already with Fig. 1b, which also explains the correlation of [SO2] because H2SO4 is formed from SO2. The strongest negative correlations are observed with RH, which is obvious due to the fact that NPF events generally occur mostly with low RH.
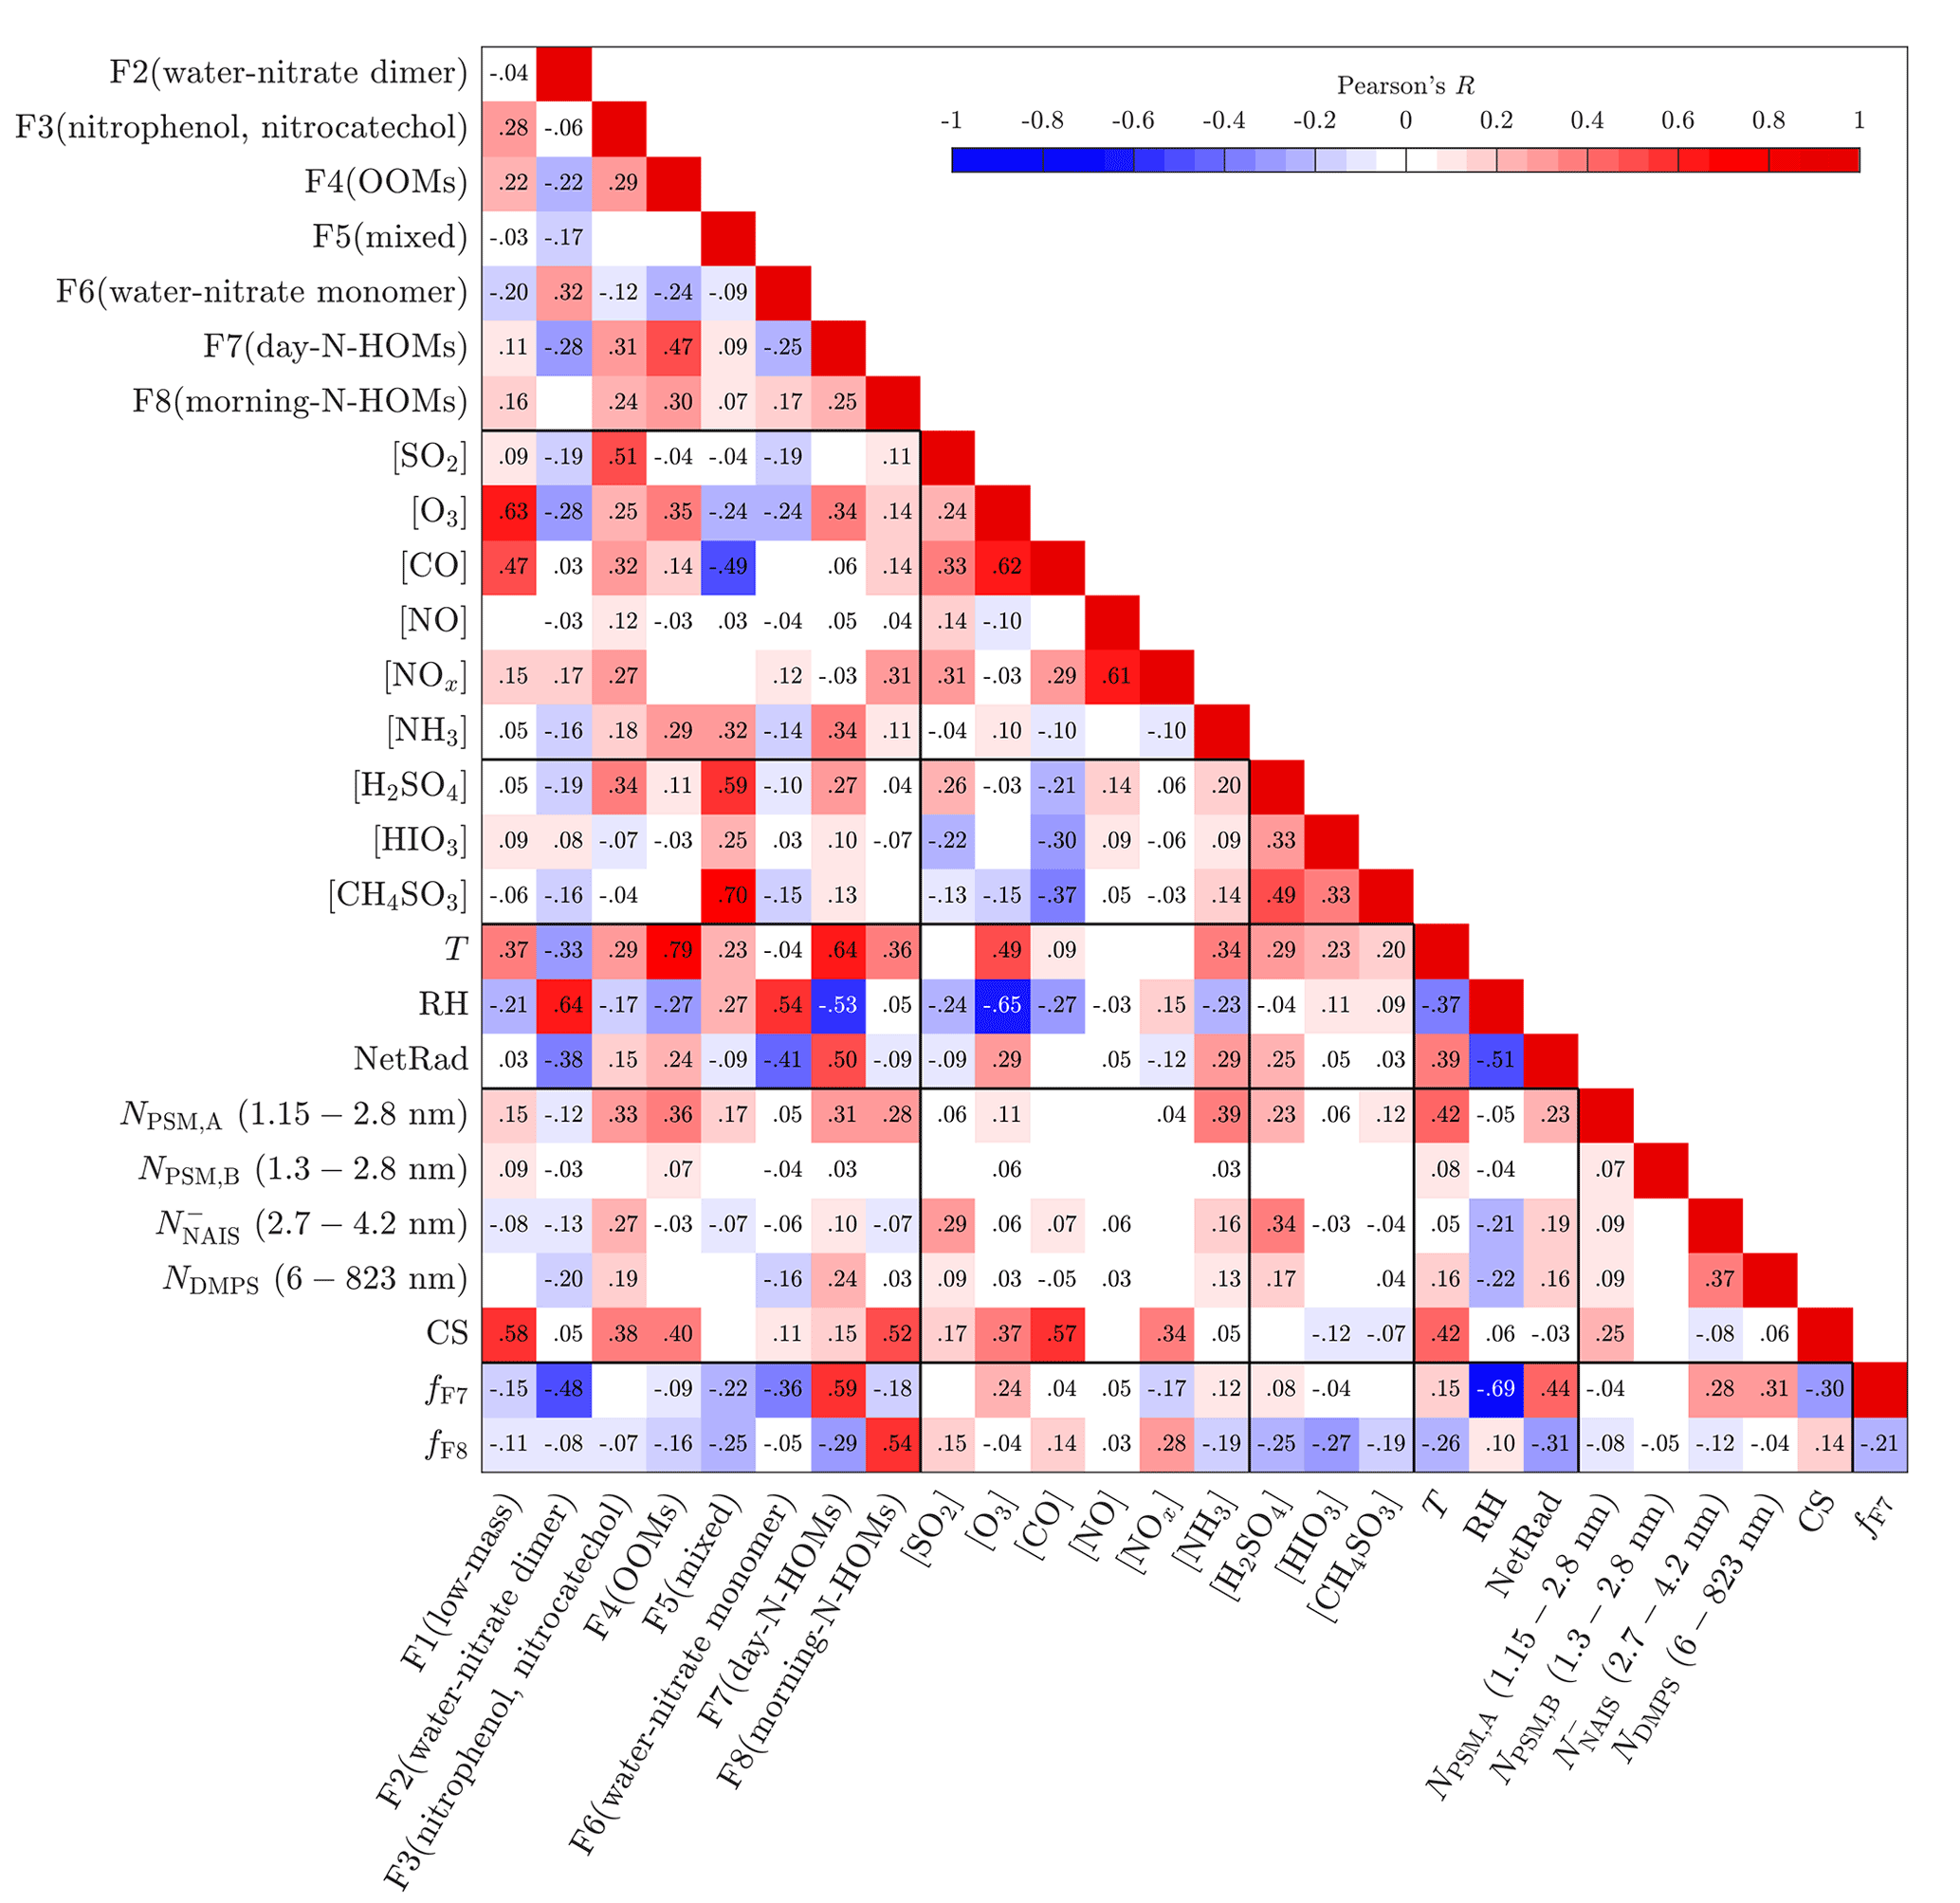
Figure 5Pearson's correlation coefficient (R) matrix between measured variables and binPMF factors. Values of R are shown as colors and numerically. They are shown only for statistically significant pairs (p value below 0.05).
The correlations between the binPMF factors and the other variables give hints for the contents and sources of the factors. F1(low-mass) correlates relatively well with [O3], suggesting that F1(low-mass) includes compounds related to ozonolysis. F2(water–nitrate dimer) and F6(water–nitrate monomer) correlate well with RH because they consist mainly of the water clusters of nitrate, which are more abundant in high RH. F3(nitrophenol, nitrocatechol) correlates well with [SO2], [CO], [NOx], and [H2SO4], which suggests that F3(nitrophenol, nitrocatechol) could be originated from combustion sources, such as from tractors, as already discussed before. F4(OOMs) has the highest correlations with [O3] and [NH3] and also a very high correlation with T. A deeper examination between F4(OOMs) and T shows that an even higher correlation is achieved with a vapor-pressure-type function of T, exp (AT+B), which implies that the origin of F4(OOMs) could be related to the evaporation of some compounds, possibly requiring O3 to be detected as HOMs with the CI-APi-TOF. F5(mixed) correlates well with the concentrations of inorganic compounds, such as with [NH3], [H2SO4], [HIO3], and [CH4SO3].
F7(day-N-HOMs) correlates well with [O3], [NH3], and [H2SO4], whereas F8(morning-N-HOMs) correlates well with [NOx]. Their strongest correlations, however, are against T, RH, and NetRad, of which T correlates positively with both F7(day-N-HOMs) and F8(morning-N-HOMs), but RH and NetRad behave differently. F7(day-N-HOMs) has a strong negative correlation with RH and a strong positive correlation with NetRad, whereas F8(morning-N-HOMs) has weak correlations with RH and NetRad in the opposite directions. F7(day-N-HOMs) and F8(morning-N-HOMs) are further examined by defining variables fF7 and fF8, which refer to their fractions in the total spectrum. In other words, e.g., fF7 denotes how much of the spectrum is in an F7-like form. A positive correlation of fF7 with NetRad and a negative correlation of fF8 with NetRad denote that the spectrum prefers the F7-like form over the F8-like form with higher NetRad levels. This can be interpreted so that N-HOMs are in the F8-like form in the mornings, but solar radiation seemingly transforms them into the F7-like form for daytime. It cannot be proven with these measurements that this transformation is actually a real chemical process since the behavior of the factors with NetRad levels can also be resulted, e.g., from possibly different origins of the air masses between the daytime and the nighttime. Nevertheless, the current knowledge cannot at least exclude the transformation via radiation because the compounds in F7(day-N-HOMs) are basically more oxidized than the ones in F8(morning-N-HOMs) (discussed later in Sect. 4.4) being physically reasonable since photochemistry typically leads to oxidation.
Particle concentrations are expressed with only four size ranges (total concentrations from PSM,A, PSM,B, NAIS, and DMPS) and with CS in Fig. 5. The connection between NPF events and the measured variables can be further examined by expressing the correlation coefficients for all particle sizes (Fig. 6a). Notable is that the correlation coefficients for [H2SO4], [NH3], and [SO2] are positive from the smallest particle sizes up to around 30 nm. It suggests that they are involved in forming new particles and growing them to those sizes but not to larger sizes because the correlation coefficients approach zero near 30 nm. It is known that high NetRad and low RH favor NPF events. This can be observed in Fig. 6a as positive and negative correlation coefficients, respectively, from the smallest sizes up to ∼60 nm, which can be interpreted as a rough validation of this method in examining connections between variables and NPF events. The most interesting particle size range in terms of a NPF event in this case is around 10–40 nm because the background aerosol is usually in larger sizes and the newly formed particles in smaller sizes. Particle concentrations within this size range increase mainly during NPF events only; the size distributions of the newly formed particles sweep past this size range (see Fig. 1). In Fig. 6a, only the correlation coefficient for dwes-2020-37 stays clearly positive (and clearly negative for RH) within the size range of 10–40 nm.
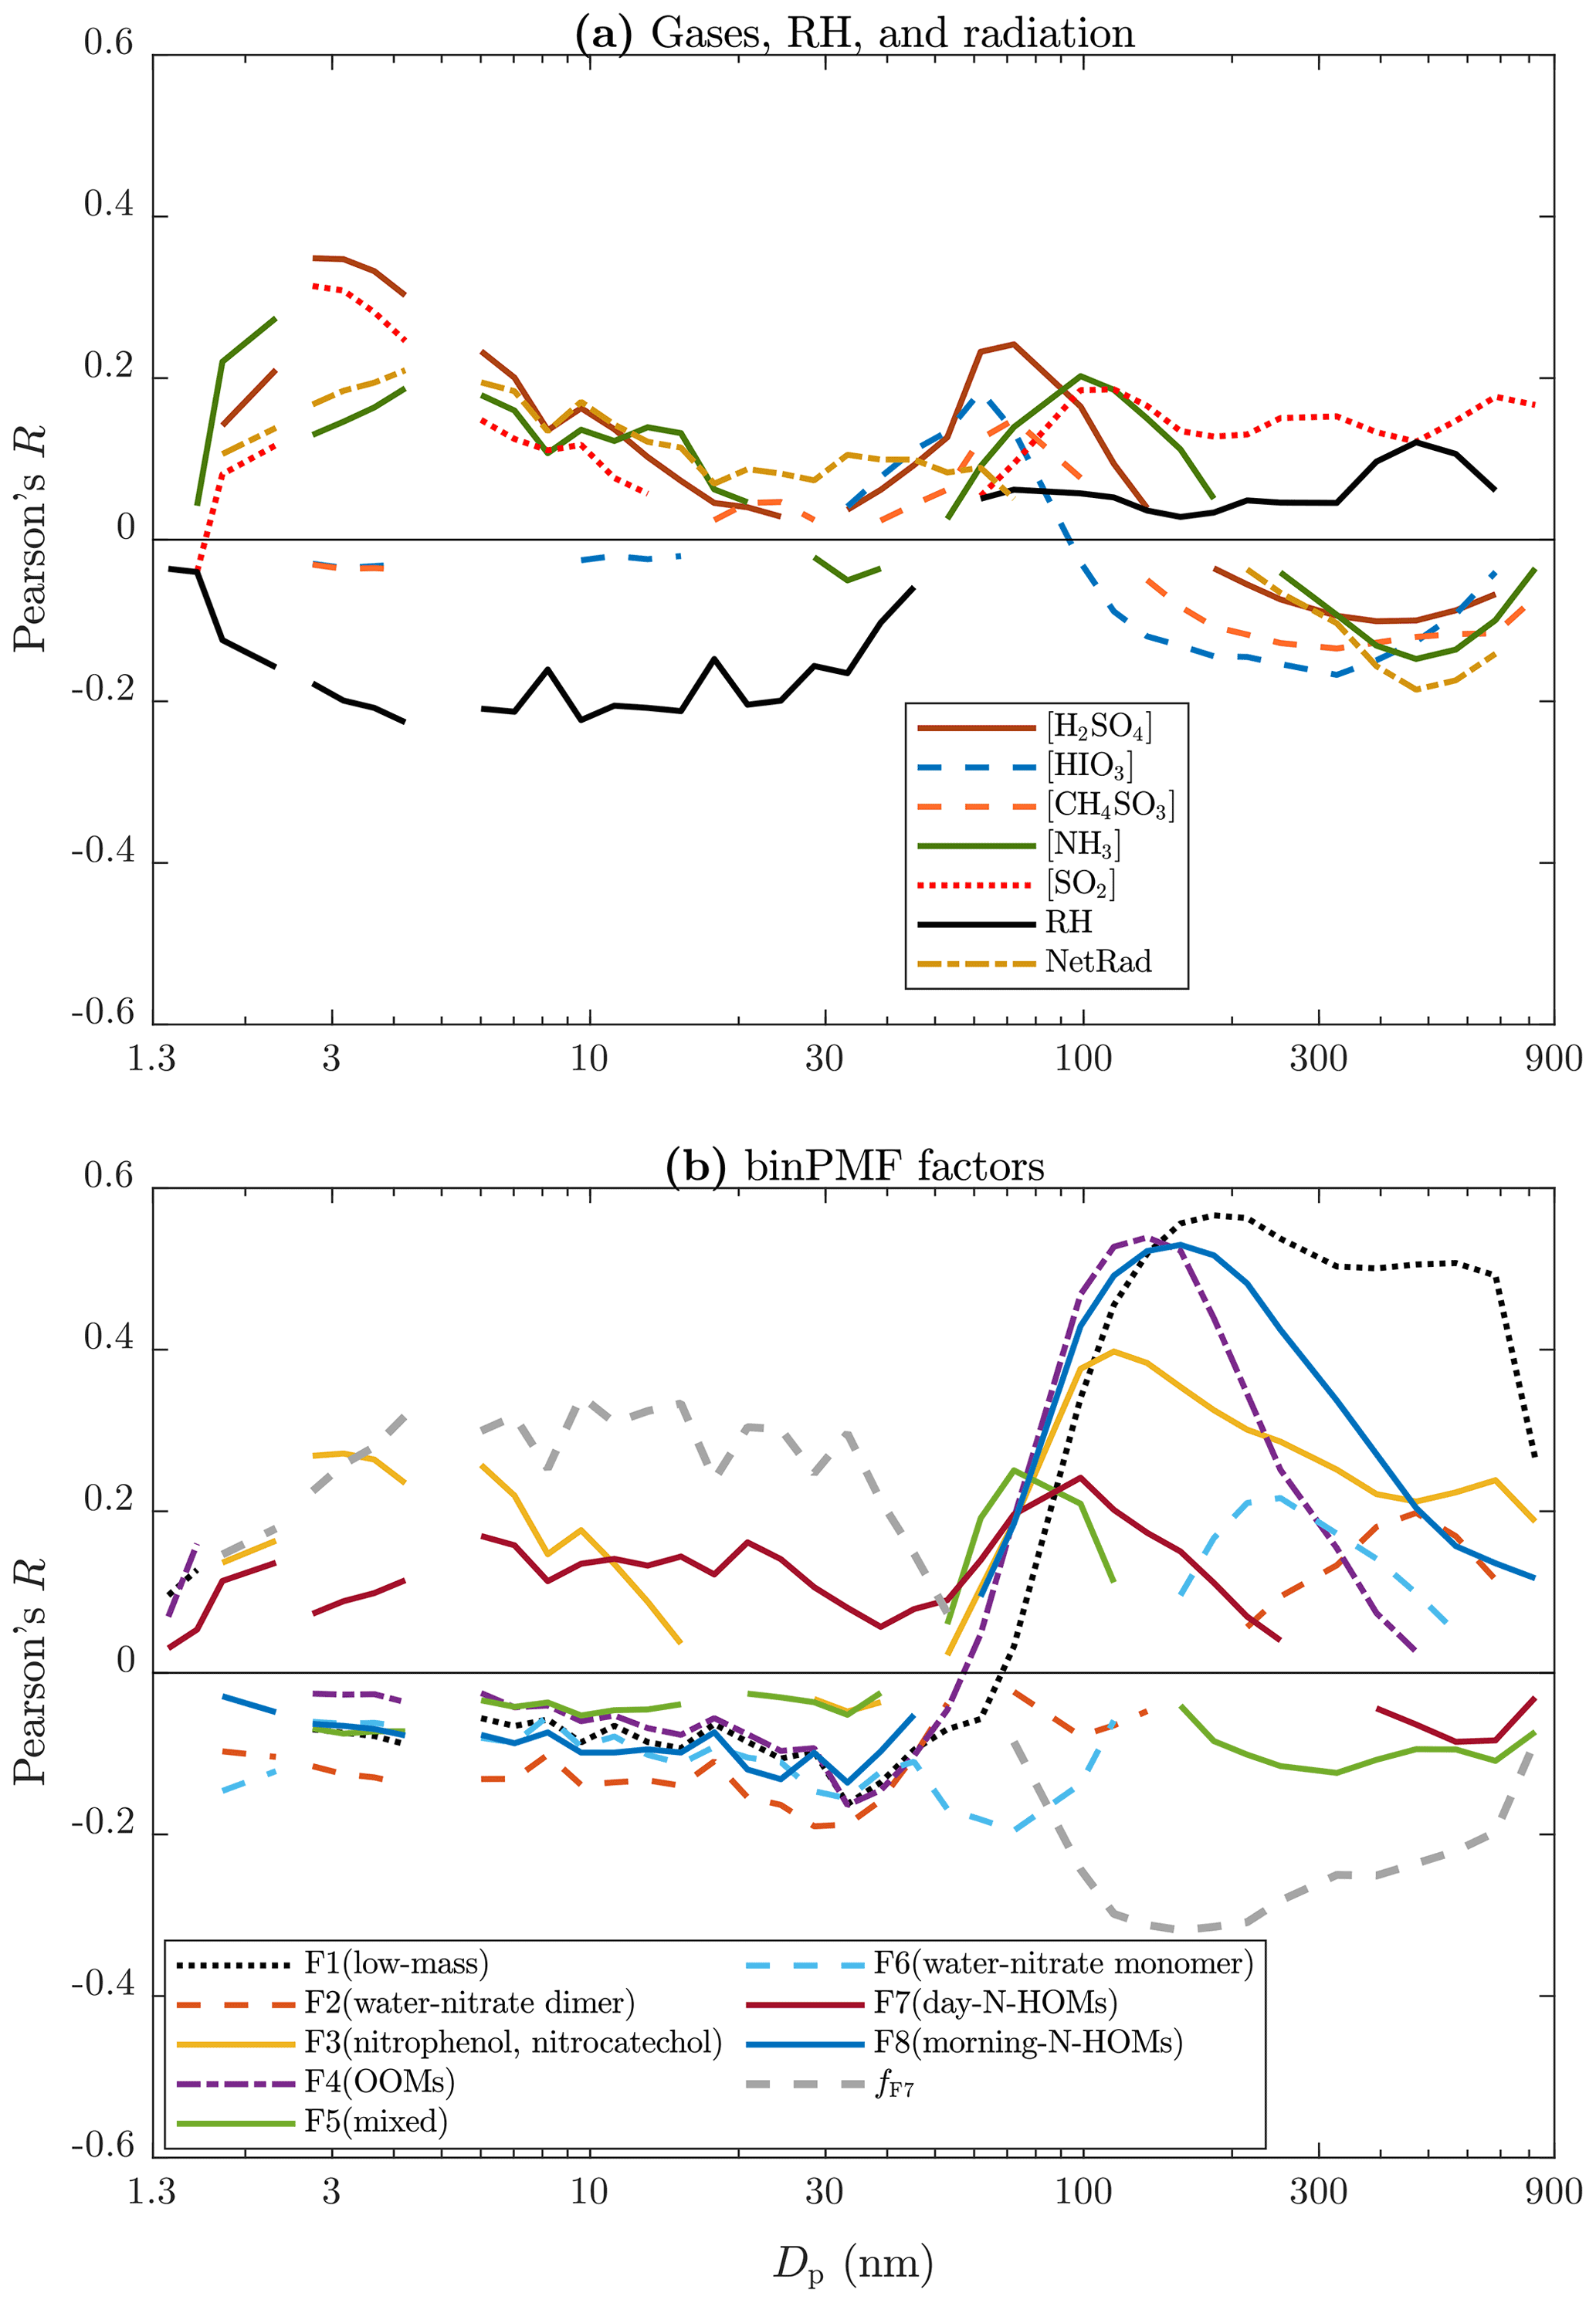
Figure 6Pearson's correlation coefficient (R) between all particle size bins and (a) measured variables and (b) binPMF factors. Data below 3 nm are from a PSM, data over 5 nm are from the DMPS, and the remaining data between them are from the NAIS. Lines are only shown for statistically significant pairs (p value below 0.05).
Figure 6b presents the correlation coefficients for the binPMF factors as a function of particle size. F3(nitrophenol, nitrocatechol) seems to be somehow involved in forming new particles but not in growing them past the 10–40 nm size range. The correlation coefficient for F7(day-N-HOMs), instead, stays on the positive side even up to 300 nm, while for all other factors they are on the negative side within the lower half of the whole particle size range. Within the size range of 10–40 nm, F7(day-N-HOMs) is the only one of the factors having positive correlation coefficients. Even stronger correlations are achieved when examining the fraction of F7(day-N-HOMs) in the total spectrum, fF7. From these plots (Fig. 6), it can be hypothesized that [H2SO4], [NH3], F3(nitrophenol, nitrocatechol), and F7(day-N-HOMs) participate in forming new particles, but only F7(day-N-HOMs) is related to growing the particles large enough to provide a full NPF event. Figure S10 presents similar plots for [H2SO4], [NH3], F3(nitrophenol, nitrocatechol), F7(day-N-HOMs), and fF7 separately for days with and without NPF events. It can be seen that correlations are stronger during the days with NPF events for particle sizes up to ∼40 nm.
4.4 Time series with binPMF factors
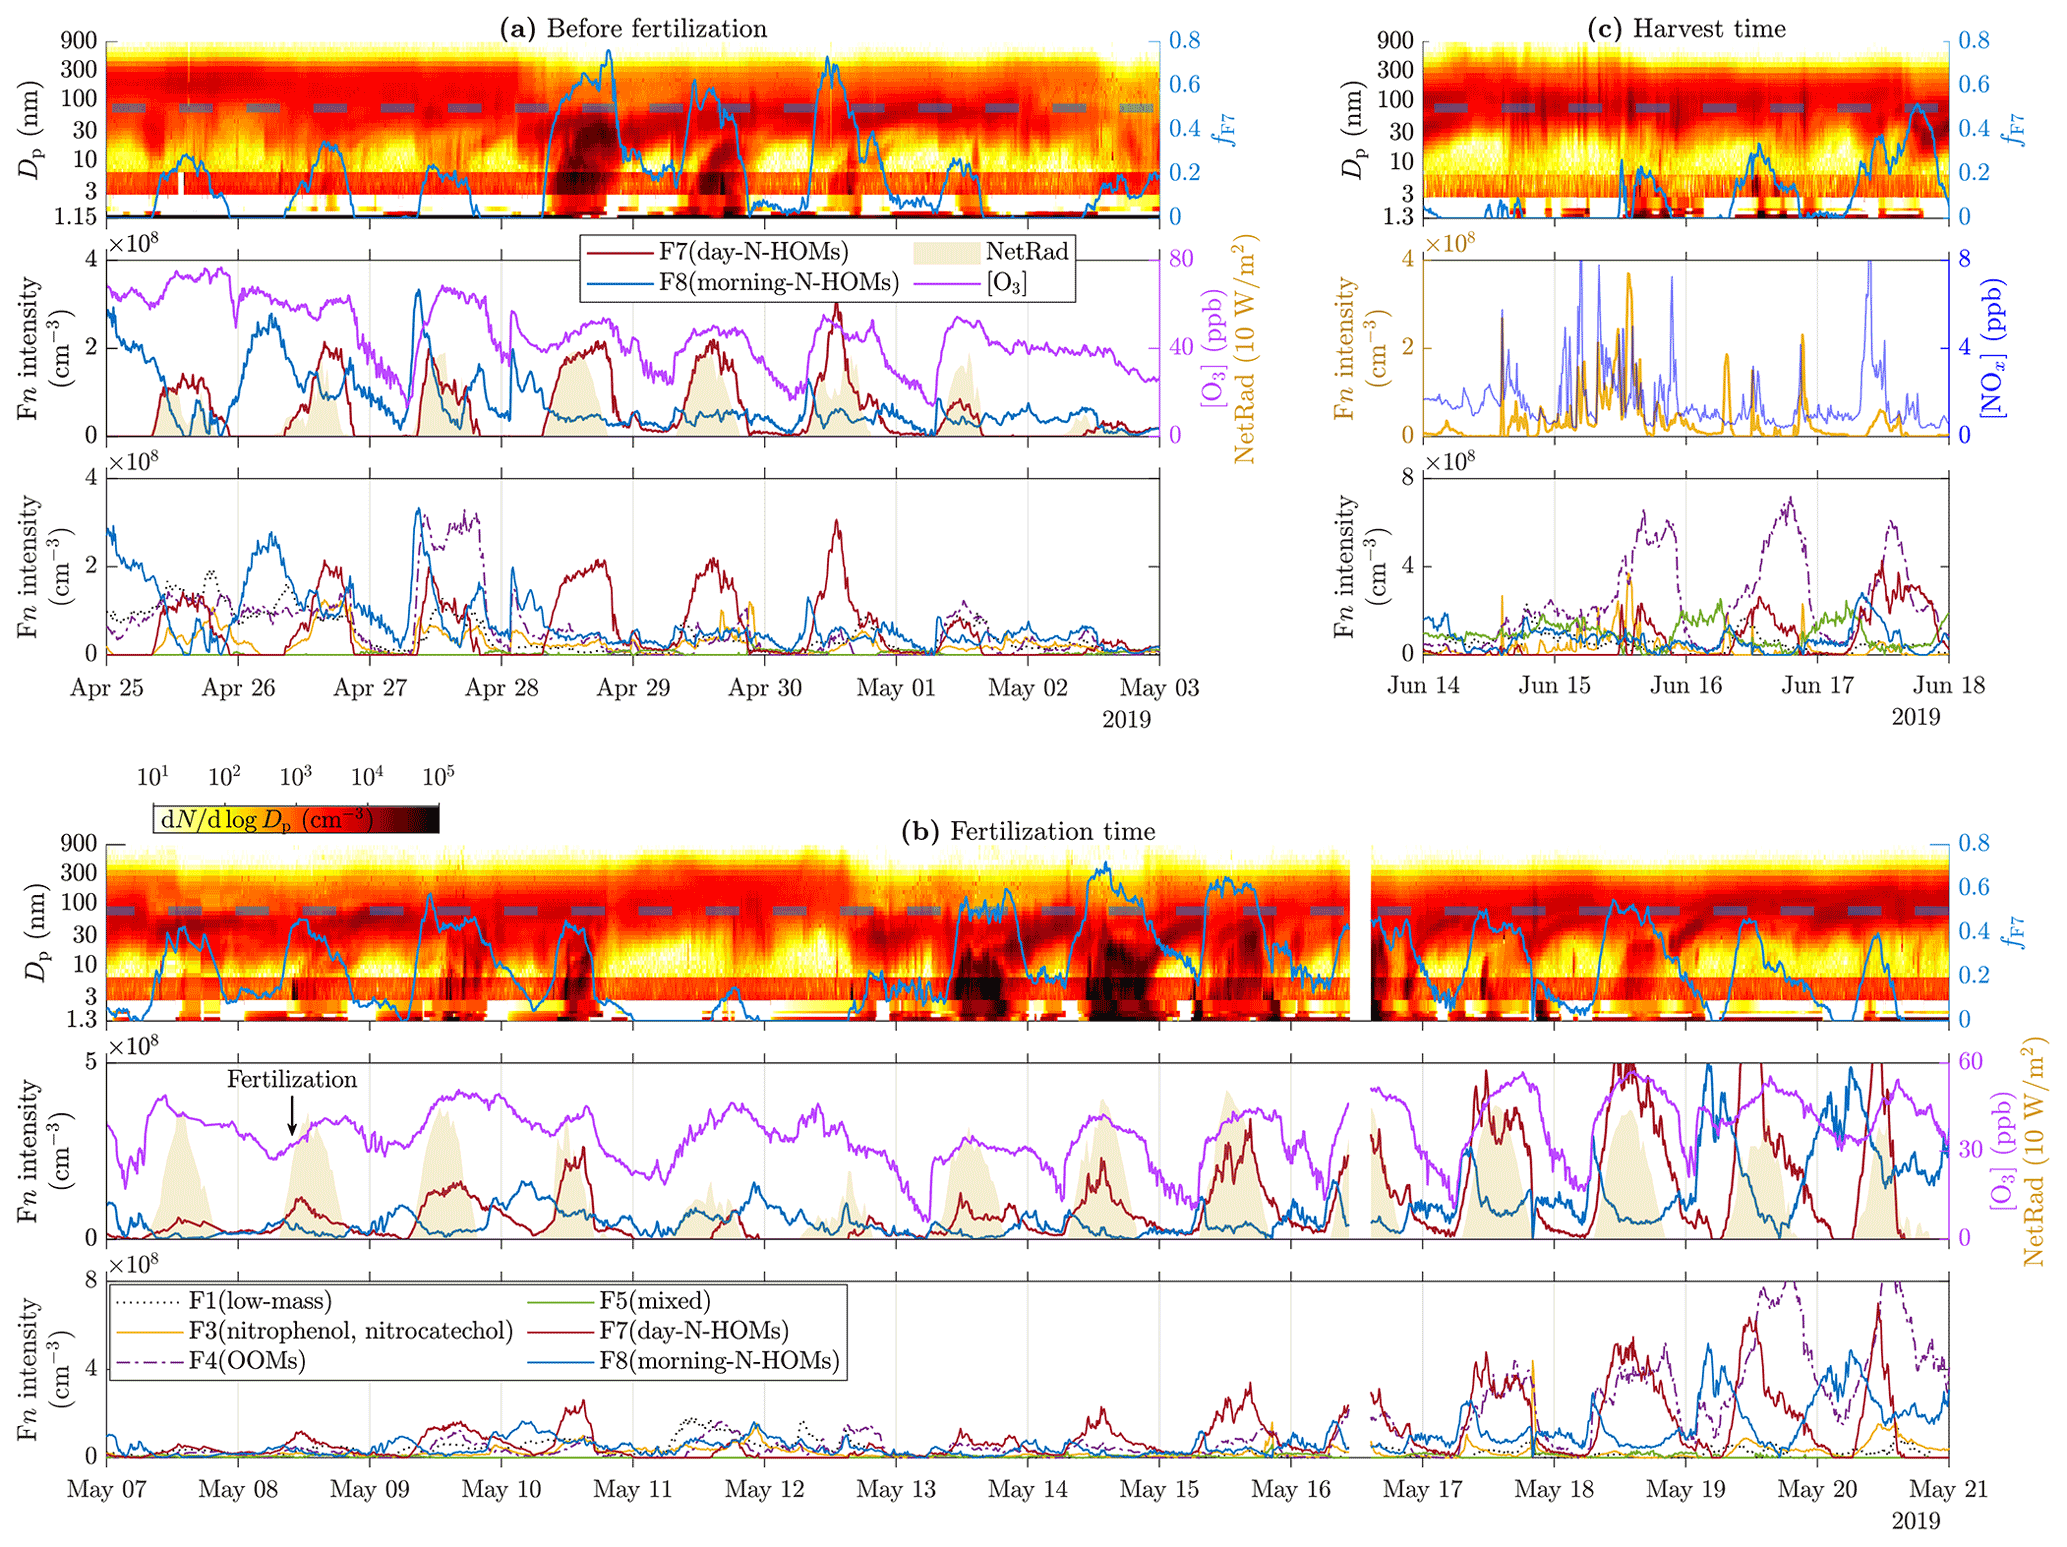
Figure 7Time series of particle size distribution contours and fF7 (top panels), F7(day-N-HOMs) and F8(morning-N-HOMs) intensities, [O3], NetRad (shaded areas in the middle panels), and other factor intensities except for the water-cluster-based ones (bottom panels; the legend is shown in the bottom panel of c) for different example time ranges: (a) before the fertilization, (b) during and right after the fertilization, and (c) during the harvest. Note that, in (c), the middle panel presents F3(nitrophenol, nitrocatechol) intensity and [NOx] instead. The dashed lines shown in the top panels denote the critical fF7 value of 0.50±0.05. Particle data below 3 nm are from a PSM, data over 6 nm are from the DMPS, and the remaining data between them are from the NAIS. Note that the PSM data shown in (a) are from the PSM,A, whereas the data shown in (b) and (c) are from the PSM,B due to different coverage of the devices. Also note different scales of the y axes between the subfigures.
Figure 7 presents time series of particle size distribution contours with factor intensities and [O3] or [NOx] for the three example time ranges. It can be observed from Fig. 7a and b that F8(morning-N-HOMs), firstly, increases simultaneously with [O3] and, secondly, seemingly transforms to F7(day-N-HOMs) with increased NetRad levels. NPF events seem to occur when the intensity of F7(day-N-HOMs) is high enough, but it is not simply controlling the strength of a NPF event. For example in Fig. 7b, the daytime intensity of F7(day-N-HOMs) has an increasing trend beginning on 12 May, but the NPF event strength has a decreasing trend already beginning on 12 May. Notable is that also other factors, especially F4(OOMs), have increasing trends during that time range. Therefore, when investigating the fraction fF7, it can be seen that it has a decreasing trend beginning on 14 May as well. For the whole studied 3-month time range, fF7 seems to correlate well with the existence or the strength of a NPF event. There seems to be a critical value for fF7 (0.50±0.05), which when exceeded induces a full NPF event. Additionally, when fF7 decreases below the critical value during a NPF event, the event is usually terminated. The diurnal average of fF7 is 0.31 on the days showing clear features of NPF events and 0.10 on the days showing hardly any features of NPF events. If considering only a typical time range of observed NPF events, from 10:00 to 20:00, the average of fF7 on the days with NPF events is 0.46. In conclusion, other factors than F7(day-N-HOMs) seem to act as an inhibitor for a NPF event, similarly to CS; however, the mechanism behind disfavoring NPF events by the sum of other factors is unknown. Notable is that fF7 does not include any particle variables even though particles should act as a sink for particle-forming vapors and thus disfavor NPF events. This could be explained partly by the fact that CS and fF7 are negatively correlated ().
Particle spikes during harvest time in Fig. 7c occur simultaneously with the F3(nitrophenol, nitrocatechol) intensity and [NOx]. As discussed before in Sect. 4.1, the spikes may be related to tractor emissions. The spikes in [NOx] support the hypothesis of these particles being emitted by tractors, but F3(nitrophenol, nitrocatechol) consists mostly of compounds related to vegetation and biomass burning; thus, it is not obvious why it spikes too. The reasons could be that fossil-fuel-combusting vehicles emit some compounds found in F3(nitrophenol, nitrocatechol) or that they are released from cut grass during the harvesting process. As already seen from Fig. 6b, increased F3(nitrophenol, nitrocatechol) intensity is connected to increased particle concentrations below 20 nm but not to growing them toward larger sizes and thus not to inducing a NPF event.
It is evident that F7(day-N-HOMs) is connected to the particle formation and growth process, and F8(morning-N-HOMs) acts like a precursor for F7(day-N-HOMs) because the F8(morning-N-HOMs) level decreases with increasing F7(day-N-HOMs). Assuming similar sensitivities of F7(day-N-HOMs) and F8(morning-N-HOMs) in the CI-APi-TOF, the mean intensity of F8(morning-N-HOMs) is 2-fold the mean intensity of F7(day-N-HOMs), with low radiation levels (); conversely, the mean intensity of F7(day-N-HOMs) is 3-fold the mean intensity of F8(morning-N-HOMs), with high radiation levels. This supports the role of radiation in transforming N-HOMs from the F8-like form into the F7-like form. The difference in their profiles is further examined in Fig. 8. It can be seen that the clearest differences are, e.g., more C4H6O4 (possibly succinic acid) and C5H6O5 (possibly ketoglutaric acid) existent in F7(day-N-HOMs) and more C7H4O6 (possibly chelidonic acid), C7H10O4, and C9H15O6N existent in F8(morning-N-HOMs). In general, the compounds existing more in F8(morning-N-HOMs) have O:C ratios of around 0.7, but the ones in F7(day-N-HOMs) have O:C ratios of around 0.9, indicating that solar radiation transforming F8(morning-N-HOMs) to F7(day-N-HOMs) is related to oxidation of organic compounds.
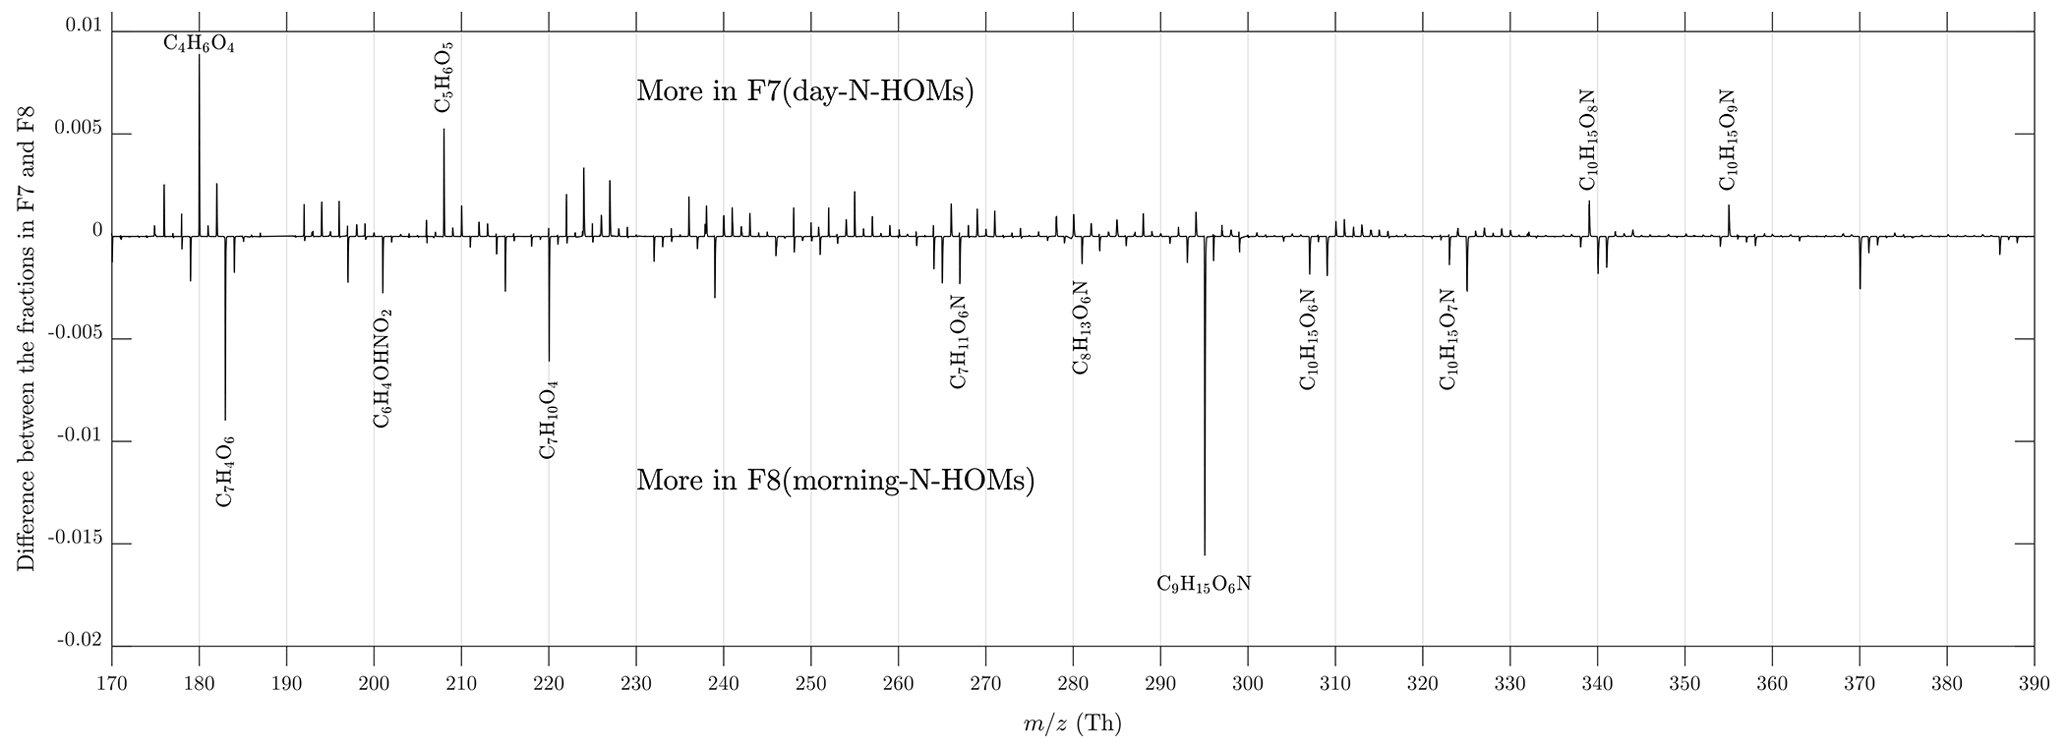
Figure 8Difference between factors 7 and 8, i.e., the fractions in the F8(morning-N-HOMs) profile subtracted from the fractions in the F7(day-N-HOMs) profile. Identified peaks with the most clear differences between the factor profiles are also presented.
4.5 Suggested explanation for particle formation
Figure 9 presents a suggested explanation for particle formation and growth observed in the studied area. The green arrows denote the route leading to a NPF event, which requires ozone to form F8(morning-N-HOMs), which then transforms to F7(day-N-HOMs) with available solar radiation. Finally, the fraction fF7 needs to be high enough () for a NPF event to be induced.
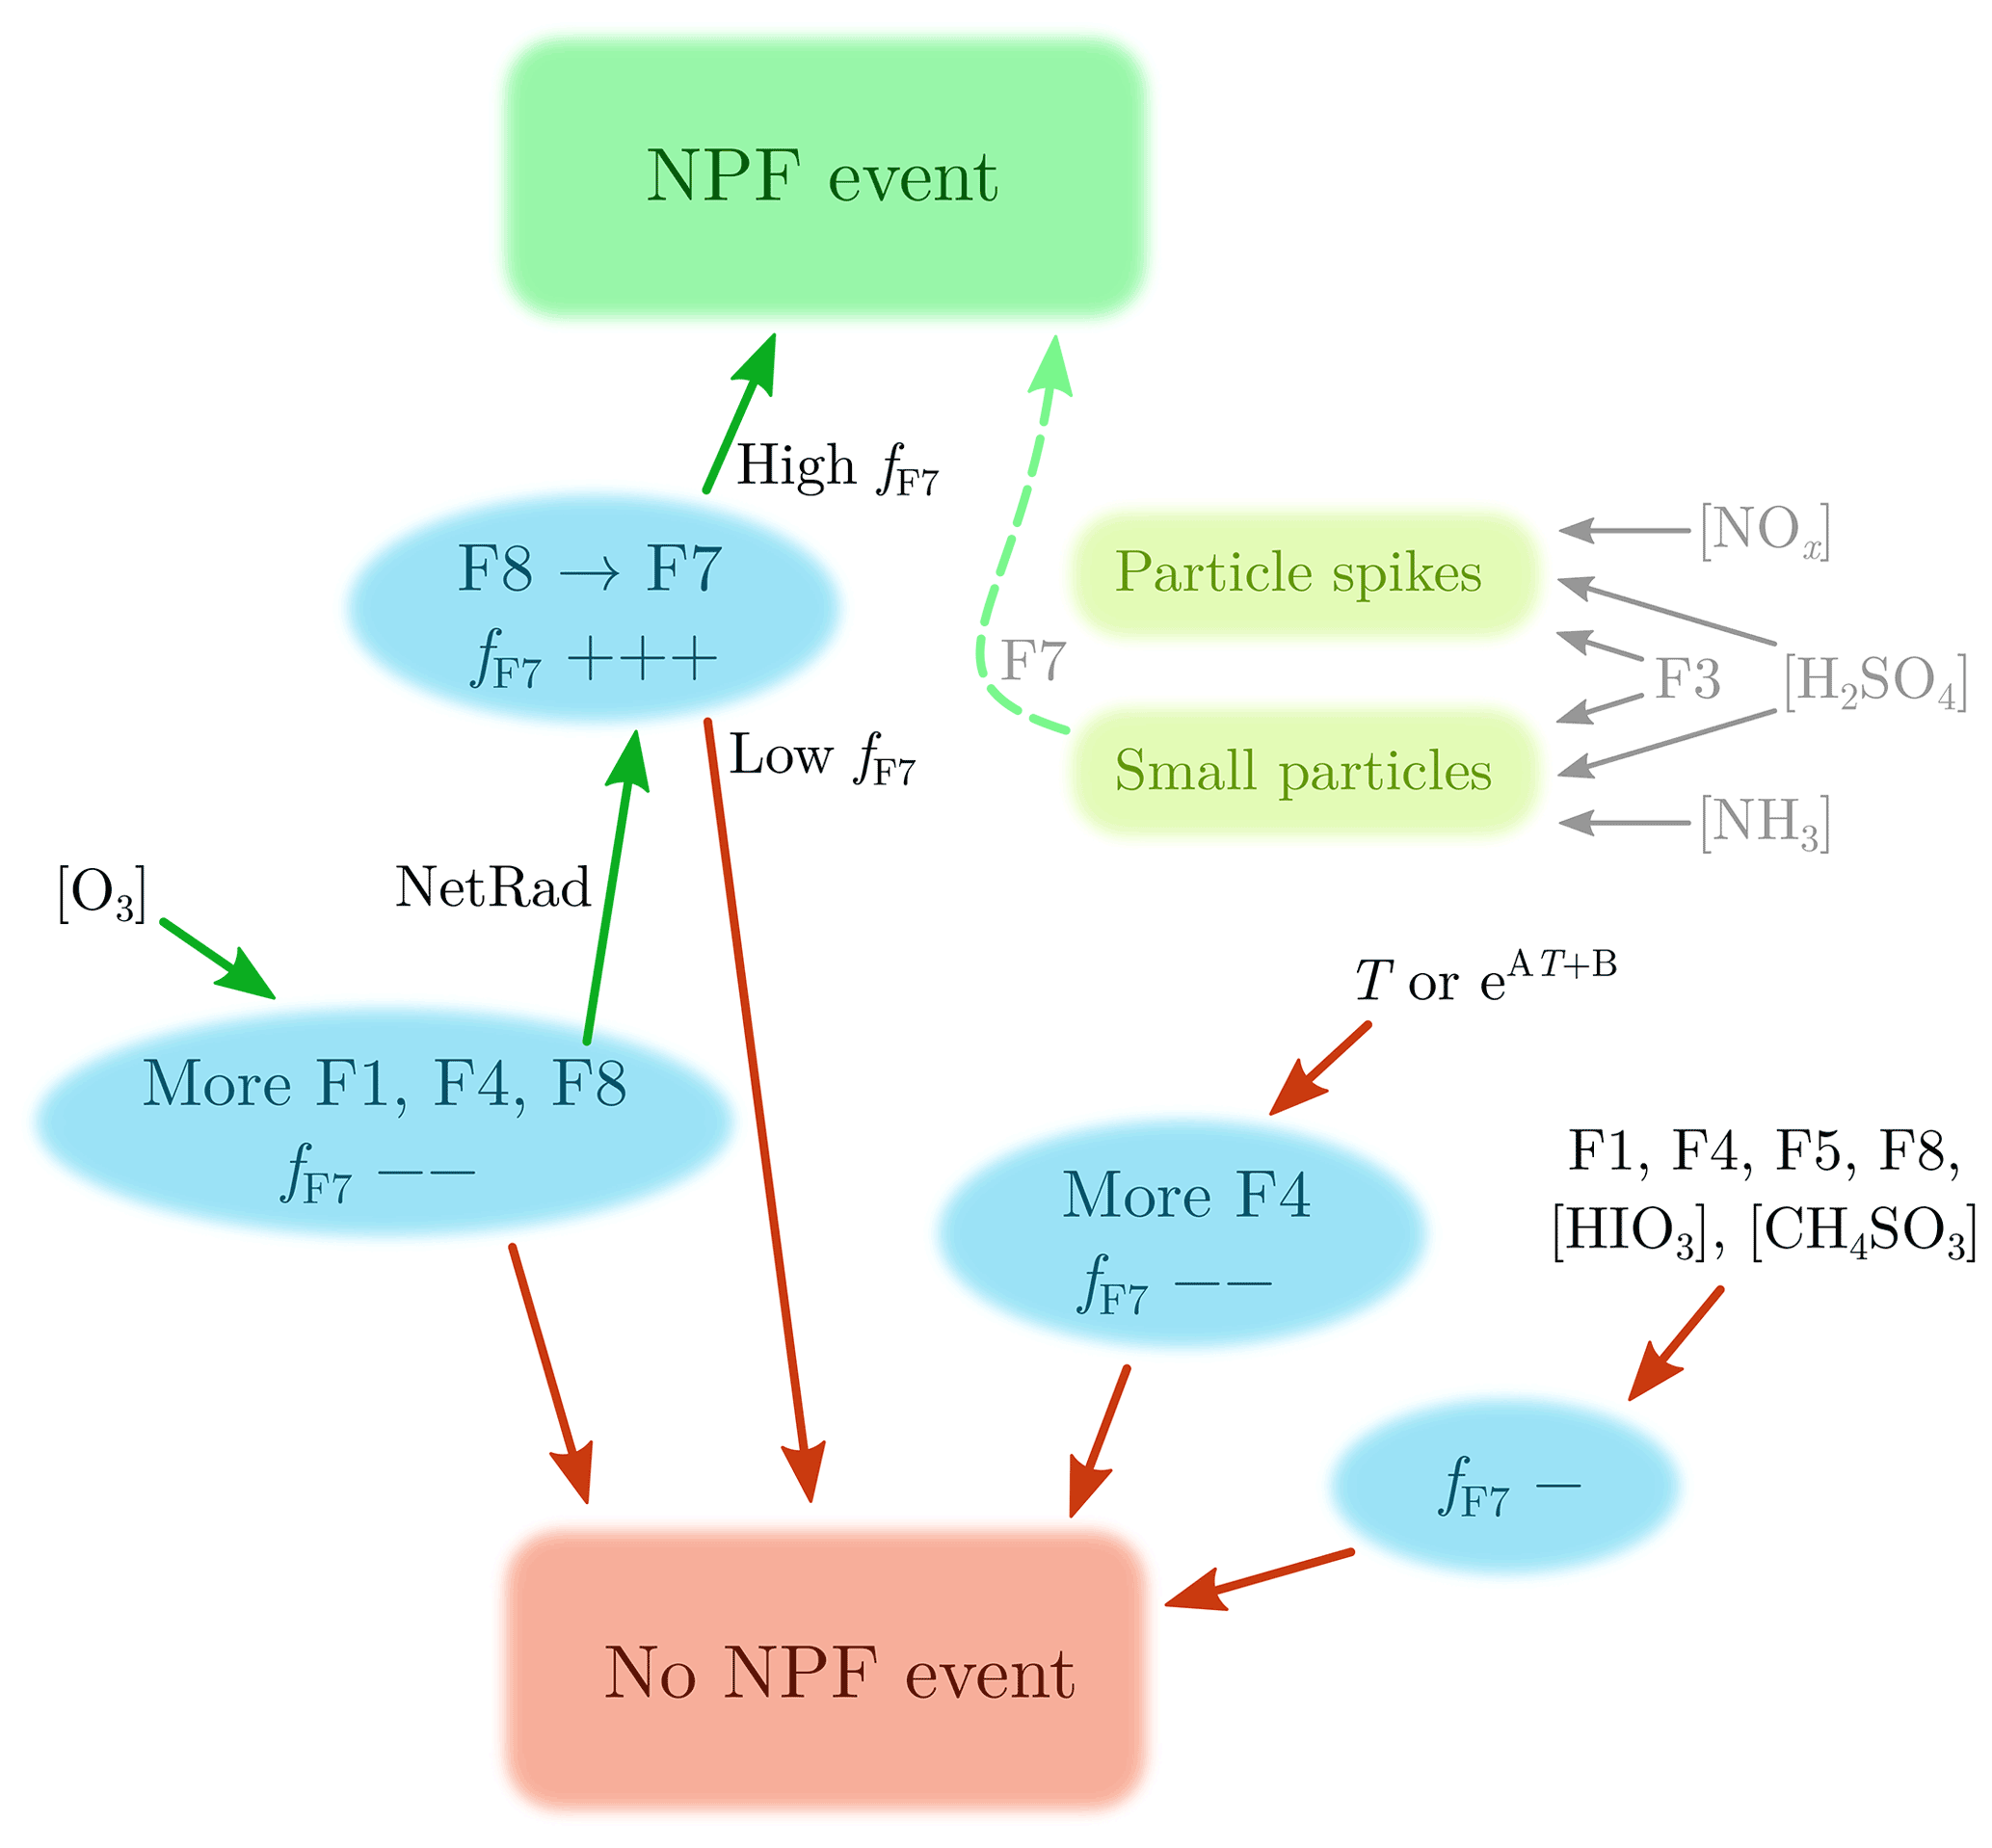
Figure 9Suggested explanation for particle formation and growth observed in the studied area. The green arrows, including ozone, radiation, and high fF7, denote the route leading to a NPF event. The red arrows present which variables decrease the probability of a NPF event. The + and − signs after fF7 denote the direction and the strength of the change of fF7, which needs to be high (0.50±0.05) for a NPF event to be induced. Additionally, increased [NOx], [H2SO4], and F3(nitrophenol, nitrocatechol) levels can be seen as particle spikes at the diameters of 20–200 nm. Moreover, increased [NH3], [H2SO4], and F3(nitrophenol, nitrocatechol) levels can lead to sub-10 nm particles, which can be grown larger with the assistance of F7(day-N-HOMs).
Because the occurrence of NPF events seems to be controlled by fF7, other factors than F7(day-N-HOMs) can inhibit NPF events if their intensities increase. Additionally, increasing temperature (or its exponential form) leads to more F4(OOMs), which does not favor a NPF event but more likely disfavors it. Hence, radiation is connected to inducing NPF events but high temperature to disfavoring them. These are typically also connected to each other, but their different roles in NPF may explain why NPF events are generally observed in all seasons, with high radiation levels but with high T in summer and vice versa in winter. Other variables (F1(low-mass), F5(mixed), F8(morning-N-HOMs), [HIO3], and [CH4SO3]) were observed to not induce a NPF event; instead, F1(low-mass), F5(mixed), and F8(morning-N-HOMs) are slightly connected to lowering fF7.
As demonstrated in Figs. 1c and 7c, spikes in [NOx], [H2SO4], and F3(nitrophenol, nitrocatechol) lead to particle spikes at the diameters of 20–200 nm, probably due to nearby tractor emissions. The particle spikes are, however, different from NPF events in terms of their timescales and particle sizes. Figure 6 suggests that [NH3], [H2SO4], and F3(nitrophenol, nitrocatechol) can form sub-10 nm particles but not larger. In theory, there is a possibility that the smallest particles are, in some cases, formed via these, but their growth occurs via F7(day-N-HOMs), and a NPF will eventually be observed. Also possible is that particles are both formed and grown via F7(day-N-HOMs). It should be noted that the studied farm may not be the actual source of particle-forming precursors as the site is close to the sea and forest as well and that F7(day-N-HOMs) may not include the actual compound(s) behind the particle formation and growth but is observed simultaneously with the actual compound(s) instead.
4.6 Applications in other studies with nitrate CI-APi-TOF spectra
Estimating the binPMF factors extracted from this study in analyses of other studies can be done without performing a binPMF analysis using unit mass resolution (UMR) tracers. Table S3 presents Pearson's correlation coefficients between the most important binPMF factors and UMR data. UMR data are simply the sums from the spectra between, e.g., N−0.5 and N+0.5 Th. However, UMR data can lack important information on multiple compounds overlapping at the same UMR mass-to-charge ratio.
For example, one can estimate how F7(day-N-HOMs) would behave in another study by the time series of the spectra between 284.5 and 285.5 Th (UMR285). Pearson's R between UMR285 and F7(day-N-HOMs) is 0.91, whereas between UMR285 and F8(morning-N-HOMs) R is only 0.36 (for comparison, R=0.25 between F7(day-N-HOMs) and F8(morning-N-HOMs)), and between UMR285 and F4(OOMs) R is only 0.65 (R=0.47 between F7(day-N-HOMs) and F4(OOMs)). The most selective UMR tracer would be one that has R=1 for the factor in question but near the ones in Fig. 5 for the all other factors. However, this is not the case for any factor, but the ones in Table S3 denote the most promising ones with their correlation coefficients. If one needs to estimate the variable fF7, the most promising tracers are UMR271 divided by UMR260 (R=0.86 between the division and fF7), UMR285 divided by UMR197 (R=0.84), and UMR313 divided by UMR260 (R=0.84). However, it should be noted that the critical value depends on the selected UMR tracers.
New particle formation events occurring in a coastal agricultural site were examined by performing measurements of gases, molecular clusters, particles, and environmental parameters. The area is a pilot agricultural farm for regenerative farming, Qvidja, located in Southwestern Finland. This study covers roughly 3 months of the measurement data recorded between April and June in 2019. The CI-APi-TOF mass spectrometer was used to measure potential new particle-forming acids, sulfuric acid, iodic acid, and methanesulfonic acid, together with a multitude of other compounds. In addition to these acids, the high-resolution mass spectra between 169 and 450 Th were elaborated via the binned positive matrix factorization (binPMF) method. Eight binPMF factors were selected as the optimal set of factors.
From all 84 measurement days, 25 d showed clear features of NPF events. The NPF event days can be partly explained with ammonia, sulfuric acid, and condensation sink levels. The concentrations of ammonia and sulfuric acid were generally higher and condensation sink lower during the NPF events but still without a clear formula on the occurrence of the events. Iodic acid and methanesulfonic acid were observed to not correlate with the NPF events, although the site is located near the sea. An even better explanation is, instead, achieved when examining the levels of the binPMF factors. It was observed that factor F7(day-N-HOMs) is high during the NPF events. Further examination shows that the events can be explained very accurately using a single variable, fF7, which denotes the fraction of the spectra between 169 and 450 Th that is in the form of F7(day-N-HOMs). In all NPF events, fF7 exceeded a critical value of 0.50±0.05, and the total time of the exceeding corresponds to the length of the event. Surprisingly, no particle values are needed to predict NPF events in this case, even though the condensation sink generally disfavors the events.
Examination of time series revealed that the intensity of F7(day-N-HOMs) is elevated with solar radiation when F8(morning-N-HOMs) exists, like F8(morning-N-HOMs) is transformed to F7(day-N-HOMs). Instead, F8(morning-N-HOMs) seems to be formed through ozonolysis because its intensity is elevated simultaneously with the ozone concentration. In conclusion, NPF events observed at the studied coastal agricultural environment seem to follow this routing: ozone levels elevate which causes F8(morning-N-HOMs) intensity to elevate, which is then transformed to F7(day-N-HOMs) via radiation; if F7(day-N-HOMs) is the major form in the spectra, a NPF event is observed.
Investigation of the high resolution-spectra of F7(day-N-HOMs) and F8(morning-N-HOMs) shows that they both consist mainly of HOMs with an extra nitrogen atom, but the compounds existing more in F7(day-N-HOMs) have higher oxygen-to-carbon ratios than the ones in F8(morning-N-HOMs). Additionally, there seem to be compounds related to the citric acid cycle in F7(day-N-HOMs) but not in F8(morning-N-HOMs). Notable compounds in their spectra are C10H15O8N (339.0585 Th) in F7(day-N-HOMs) and C9H15O6N (295.0749 Th) in F8(morning-N-HOMs). C10H15O8N is the compound with which the first indication of the connection between HOMs and atmospheric nucleation was observed (Kulmala et al., 2013). Another factor containing HOMs was also obtained from the binPMF analysis, F4(OOMs). It was observed to not favor NPF events but more likely to disfavor instead, due to its elevated intensity with higher temperatures causing lower fF7.
Time series data measured at the Qvidja farm from April to June 2019 together with the raw spectra of the binPMF factors are freely available at https://doi.org/10.5281/zenodo.6394454 (Olin, 2022).
The supplement related to this article is available online at: https://doi.org/10.5194/acp-22-8097-2022-supplement.
MDM, MS, TP, and MK designed the research. MiO, MaO, JK, ML, YW, and JD performed the measurements. MiO and MaO handled the measurement data. MiO performed the PMF analysis and prepared the paper, with contributions from all co-authors.
At least one of the (co-)authors is a member of the editorial board of Atmospheric Chemistry and Physics. The peer-review process was guided by an independent editor, and the authors also have also no other competing interests to declare.
Publisher’s note: Copernicus Publications remains neutral with regard to jurisdictional claims in published maps and institutional affiliations.
University of Helsinki and Qvidja technical staff and Qvidja farm owners are acknowledged for their support on the site. We thank the tofTools team for providing tools for mass spectrometry analysis.
This research has been supported by the Academy of Finland through the Condenz project (grant nos. 310627 and 326437), through the ACCC Flagship grant (no. 337551), and through the Academy Research Fellow grant (no. 331207).
This paper was edited by Ivan Kourtchev and reviewed by two anonymous referees.
Allan, J. D., Jimenez, J. L., Williams, P. I., Alfarra, M. R., Bower, K. N., Jayne, J. T., Coe, H., and Worsnop, D. R.: Quantitative sampling using an Aerodyne aerosol mass spectrometer 1. Techniques of data interpretation and error analysis, J. Geophys. Res.-Atmos., 108, 4090, https://doi.org/10.1029/2002JD002358, 2003. a
Baccarini, A., Karlsson, L., Dommen, J., Duplessis, P., Vüllers, J., Brooks, I. M., Saiz-Lopez, A., Salter, M., Tjernström, M., Baltensperger, U., Zieger, P., and Schmale, J.: Frequent new particle formation over the high Arctic pack ice by enhanced iodine emissions, Nat. Comm., 11, 1–11, https://doi.org/10.1038/s41467-020-18551-0, 2020. a
Beck, L. J., Sarnela, N., Junninen, H., Hoppe, C. J., Garmash, O., Bianchi, F., Riva, M., Rose, C., Peräkylä, O., Wimmer, D., Kausiala, O., Jokinen, T., Ahonen, L., Mikkilä, J., Hakala, J., He, X. C., Kontkanen, J., Wolf, K. K., Cappelletti, D., Mazzola, M., Traversi, R., Petroselli, C., Viola, A. P., Vitale, V., Lange, R., Massling, A., Nøjgaard, J. K., Krejci, R., Karlsson, L., Zieger, P., Jang, S., Lee, K., Vakkari, V., Lampilahti, J., Thakur, R. C., Leino, K., Kangasluoma, J., Duplissy, E. M., Siivola, E., Marbouti, M., Tham, Y. J., Saiz-Lopez, A., Petäjä, T., Ehn, M., Worsnop, D. R., Skov, H., Kulmala, M., Kerminen, V. M., and Sipilä, M.: Differing Mechanisms of New Particle Formation at Two Arctic Sites, Geophys. Res. Lett., 48, e2020GL091334, https://doi.org/10.1029/2020GL091334, 2021. a, b
Bianchi, F., Kurtén, T., Riva, M., Mohr, C., Rissanen, M. P., Roldin, P., Berndt, T., Crounse, J. D., Wennberg, P. O., Mentel, T. F., Wildt, J., Junninen, H., Jokinen, T., Kulmala, M., Worsnop, D. R., Thornton, J. A., Donahue, N., Kjaergaard, H. G., and Ehn, M.: Highly Oxygenated Organic Molecules (HOM) from Gas-Phase Autoxidation Involving Peroxy Radicals: A Key Contributor to Atmospheric Aerosol, Chem. Rev., 119, 3472–3509, https://doi.org/10.1021/acs.chemrev.8b00395, 2019. a, b
Birmili, W. and Wiedensohler, A.: New particle formation in the continental boundary layer: Meteorological and gas phase parameter influence, Geophys. Res. Lett., 27, 3325–3328, https://doi.org/10.1029/1999GL011221, 2000. a, b
Birmili, W., Berresheim, H., Plass-Dülmer, C., Elste, T., Gilge, S., Wiedensohler, A., and Uhrner, U.: The Hohenpeissenberg aerosol formation experiment (HAFEX): a long-term study including size-resolved aerosol, H2SO4, OH, and monoterpenes measurements, Atmos. Chem. Phys., 3, 361–376, https://doi.org/10.5194/acp-3-361-2003, 2003. a, b, c, d
Ciuraru, R., Kammer, J., Decuq, C., Vojkovic, M., Haider, K., Carpentier, Y., Lafouge, F., Berger, C., Bourdat-Deschamps, M., Ortega, I. K., Levavasseur, F., Houot, S., Loubet, B., Petitprez, D., and Focsa, C.: New particle formation from agricultural recycling of organic waste products, npj Clim. Atmos. Sci., 4, 1–10, https://doi.org/10.1038/s41612-021-00160-3, 2021. a
Dada, L., Paasonen, P., Nieminen, T., Buenrostro Mazon, S., Kontkanen, J., Peräkylä, O., Lehtipalo, K., Hussein, T., Petäjä, T., Kerminen, V.-M., Bäck, J., and Kulmala, M.: Long-term analysis of clear-sky new particle formation events and nonevents in Hyytiälä, Atmos. Chem. Phys., 17, 6227–6241, https://doi.org/10.5194/acp-17-6227-2017, 2017. a, b, c
Dal Maso, M., Sogacheva, L., Aalto, P. P., Riipinen, I., Komppula, M., Tunved, P., Korhonen, L., Suur-Uski, V., Hirsikko, A., Kurtén, T., Kerminen, V.-M., Lihavainen, H., Viisanen, Y., Hansson, H.-C., and Kulmala, M.: Aerosol size distribution measurements at four Nordic field stations: identification, analysis and trajectory analysis of new particle formation bursts, Tellus B, 59, 350–361, https://doi.org/10.1111/j.1600-0889.2007.00267.x, 2007. a
Dawson, M. L., Varner, M. E., Perraud, V., Ezell, M. J., Gerber, R. B., and Finlayson-Pitts, B. J.: Simplified mechanism for new particle formation from methanesulfonic acid, amines, and water via experiments and ab initio calculations, P. Natl. Acad. Sci. USA, 109, 18719–18724, https://doi.org/10.1073/pnas.1211878109, 2012. a
Dunne, E. M., Gordon, H., Kürten, A., ao Almeida, J., Duplissy, J., Williamson, C., Ortega, I. K., Pringle, K. J., Adamov, A., Baltensperger, U., Barmet, P., Benduhn, F., Bianchi, F., Breitenlechner, M., Clarke, A., Curtius, J., Dommen, J., Donahue, N. M., Ehrhart, S., Flagan, R. C., Franchin, A., Guida, R., Hakala, J., Hansel, A., Heinritzi, M., Jokinen, T., Kangasluoma, J., Kirkby, J., Kulmala, M., Kupc, A., Lawler, M. J., Lehtipalo, K., Makhmutov, V., Mann, G., Mathot, S., Merikanto, J., Miettinen, P., Nenes, A., Onnela, A., Rap, A., Reddington, C. L. S., Riccobono, F., Richards, N. A. D., Rissanen, M. P., Rondo, L., Sarnela, N., Schobesberger, S., Sengupta, K., Simon, M., Sipilä, M., Smith, J. N., Stozkhov, Y., Tomé, A., Tröstl, J., Wagner, P. E., Wimmer, D., Winkler, P. M., Worsnop, D. R., and Carslaw, K. S.: Global atmospheric particle formation from CERN CLOUD measurements, Science, 354, 1119–1124, https://doi.org/10.1126/science.aaf2649, 2016. a, b
Eisele, F. L. and Tanner, D. J.: Measurement of the gas phase concentration of H2SO4 and methane sulfonic acid and estimates of H2SO4 production and loss in the atmosphere, J. Geophys. Res.-Atmos., 98, 9001–9010, https://doi.org/10.1029/93JD00031, 1993. a
Fountoukis, C., Riipinen, I., Denier van der Gon, H. A. C., Charalampidis, P. E., Pilinis, C., Wiedensohler, A., O'Dowd, C., Putaud, J. P., Moerman, M., and Pandis, S. N.: Simulating ultrafine particle formation in Europe using a regional CTM: contribution of primary emissions versus secondary formation to aerosol number concentrations, Atmos. Chem. Phys., 12, 8663–8677, https://doi.org/10.5194/acp-12-8663-2012, 2012. a
Gagné, S., Lehtipalo, K., Manninen, H. E., Nieminen, T., Schobesberger, S., Franchin, A., Yli-Juuti, T., Boulon, J., Sonntag, A., Mirme, S., Mirme, A., Hõrrak, U., Petäjä, T., Asmi, E., and Kulmala, M.: Intercomparison of air ion spectrometers: an evaluation of results in varying conditions, Atmos. Meas. Tech., 4, 805–822, https://doi.org/10.5194/amt-4-805-2011, 2011. a
Gordon, H., Kirkby, J., Baltensperger, U., Bianchi, F., Breitenlechner, M., Curtius, J., Dias, A., Dommen, J., Donahue, N. M., Dunne, E. M., Duplissy, J., Ehrhart, S., Flagan, R. C., Frege, C., Fuchs, C., Hansel, A., Hoyle, C. R., Kulmala, M., Kürten, A., Lehtipalo, K., Makhmutov, V., Molteni, U., Rissanen, M. P., Stozkhov, Y., Tröstl, J., Tsagkogeorgas, G., Wagner, R., Williamson, C., Wimmer, D., Winkler, P. M., Yan, C., and Carslaw, K. S.: Causes and importance of new particle formation in the present-day and preindustrial atmospheres, J. Geophys. Res.-Atmos., 122, 8739–8760, https://doi.org/10.1002/2017JD026844, 2017. a
Gormley, P. G. and Kennedy, M.: Diffusion from a Stream Flowing through a Cylindrical Tube, P. Roy. Irish Acad. A, 52, 163–169, https://doi.org/10.2307/20488498, 1948. a
Guo, H., Wang, D. W., Cheung, K., Ling, Z. H., Chan, C. K., and Yao, X. H.: Observation of aerosol size distribution and new particle formation at a mountain site in subtropical Hong Kong, Atmos. Chem. Phys., 12, 9923–9939, https://doi.org/10.5194/acp-12-9923-2012, 2012. a, b, c
He, X. C., Tham, Y. J., Dada, L., Wang, M., Finkenzeller, H., Stolzenburg, D., Iyer, S., Simon, M., Kürten, A., Shen, J., Rörup, B., Rissanen, M., Schobesberger, S., Baalbaki, R., Wang, D. S., Koenig, T. K., Jokinen, T., Sarnela, N., Beck, L. J., Almeida, J., Amanatidis, S., Amorim, A., Ataei, F., Baccarini, A., Bertozzi, B., Bianchi, F., Brilke, S., Caudillo, L., Chen, D., Chiu, R., Chu, B., Dias, A., Ding, A., Dommen, J., Duplissy, J., Haddad, I. E., Carracedo, L. G., Granzin, M., Hansel, A., Heinritzi, M., Hofbauer, V., Junninen, H., Kangasluoma, J., Kemppainen, D., Kim, C., Kong, W., Krechmer, J. E., Kvashin, A., Laitinen, T., Lamkaddam, H., Lee, C. P., Lehtipalo, K., Leiminger, M., Li, Z., Makhmutov, V., Manninen, H. E., Marie, G., Marten, R., Mathot, S., Mauldin, R. L., Mentler, B., Möhler, O., Müller, T., Nie, W., Onnela, A., Petäjä, T., Pfeifer, J., Philippov, M., Ranjithkumar, A., Saiz-Lopez, A., Salma, I., Scholz, W., Schuchmann, S., Schulze, B., Steiner, G., Stozhkov, Y., Tauber, C., Tomé, A., Thakur, R. C., Väisänen, O., Vazquez-Pufleau, M., Wagner, A. C., Wang, Y., Weber, S. K., Winkler, P. M., Wu, Y., Xiao, M., Yan, C., Ye, Q., Ylisirniö, A., Zauner-Wieczorek, M., Zha, Q., Zhou, P., Flagan, R. C., Curtius, J., Baltensperger, U., Kulmala, M., Kerminen, V. M., Kurtén, T., Donahue, N. M., Volkamer, R., Kirkby, J., Worsnop, D. R., and Sipilä, M.: Role of iodine oxoacids in atmospheric aerosol nucleation, Science, 371, 589–595, https://doi.org/10.1126/science.abe0298, 2021. a
Heimsch, L., Lohila, A., Tuovinen, J.-P., Vekuri, H., Heinonsalo, J., Nevalainen, O., Korkiakoski, M., Liski, J., Laurila, T., and Kulmala, L.: Carbon dioxide fluxes and carbon balance of an agricultural grassland in southern Finland, Biogeosciences, 18, 3467–3483, https://doi.org/10.5194/bg-18-3467-2021, 2021. a
Hyttinen, N., Kupiainen-Määttä, O., Rissanen, M. P., Muuronen, M., Ehn, M., and Kurtén, T.: Modeling the Charging of Highly Oxidized Cyclohexene Ozonolysis Products Using Nitrate-Based Chemical Ionization, J. Phys. Chem. A, 119, 6339–6345, https://doi.org/10.1021/acs.jpca.5b01818, 2015. a, b
Iinuma, Y., Böge, O., Gräfe, R., and Herrmann, H.: Methyl-Nitrocatechols: Atmospheric Tracer Compounds for Biomass Burning Secondary Organic Aerosols, Environ. Sci. Technol., 44, 8453–8459, https://doi.org/10.1021/es102938a, 2010. a
Jokinen, T., Sipilä, M., Junninen, H., Ehn, M., Lönn, G., Hakala, J., Petäjä, T., Mauldin III, R. L., Kulmala, M., and Worsnop, D. R.: Atmospheric sulphuric acid and neutral cluster measurements using CI-APi-TOF, Atmos. Chem. Phys., 12, 4117–4125, https://doi.org/10.5194/acp-12-4117-2012, 2012. a
Jun, Y.-S., Jeong, C.-H., Sabaliauskas, K., Richard Leaitch, W., and Evans, G. J.: A year-long comparison of particle formation events at paired urban and rural locations, Atmos. Pollut. Res., 5, 447–454, https://doi.org/10.5094/APR.2014.052, 2014. a, b
Junninen, H., Ehn, M., Petäjä, T., Luosujärvi, L., Kotiaho, T., Kostiainen, R., Rohner, U., Gonin, M., Fuhrer, K., Kulmala, M., and Worsnop, D. R.: A high-resolution mass spectrometer to measure atmospheric ion composition, Atmos. Meas. Tech., 3, 1039–1053, https://doi.org/10.5194/amt-3-1039-2010, 2010. a
Junninen, H., Ahonen, L., Bianchi, F., Quéléver, L., Schallhart, S., Dada, L., Manninen, H., Leino, K., Lampilahti, J., Mazon, S., Rantala, P., Räty, M., Kontkanen, J., Negri, S., Aliaga, D., Garmash, O., Alekseychik, P., Lipp, H., Tamme, K., Levula, J., Sipilä, M., Ehn, M., Worsnop, D., Zilitinkevich, S., Mammarella, I., Rinne, J., Vesala, T., Petäjä, T., Kerminen, V.-M., and Kulmala, M.: Terpene emissions from boreal wetlands can initiate stronger atmospheric new particle formation than boreal forests, Commun. Earth Environ., 3, 93, https://doi.org/10.1038/s43247-022-00406-9, 2022. a
Kangasluoma, J., Cai, R., Jiang, J., Deng, C., Stolzenburg, D., Ahonen, L. R., Chan, T., Fu, Y., Kim, C., Laurila, T. M., Zhou, Y., Dada, L., Sulo, J., Flagan, R. C., Kulmala, M., Petäjä, T., and Lehtipalo, K.: Overview of measurements and current instrumentation for 1–10 nm aerosol particle number size distributions, J. Aerosol Sci., 148, 105584, https://doi.org/10.1016/j.jaerosci.2020.105584, 2020. a
Kerminen, V.-M., Chen, X., Vakkari, V., Petäjä, T., Kulmala, M., and Bianchi, F.: Atmospheric new particle formation and growth: review of field observations, Environ. Res. Lett., 13, 103003, https://doi.org/10.1088/1748-9326/aadf3c, 2018. a, b, c, d
Kulmala, M., Lehtinen, K. E. J., and Laaksonen, A.: Cluster activation theory as an explanation of the linear dependence between formation rate of 3nm particles and sulphuric acid concentration, Atmos. Chem. Phys., 6, 787–793, https://doi.org/10.5194/acp-6-787-2006, 2006. a
Kulmala, M., Petäjä, T., Nieminen, T., Sipilä, M., Manninen, H. E., Lehtipalo, K., Dal Maso, M., Aalto, P. P., Junninen, H., Paasonen, P., Riipinen, I., Lehtinen, K. E. J., Laaksonen, A., and Kerminen, V.-M.: Measurement of the nucleation of atmospheric aerosol particles, Nat. Protoc., 7, 1651–1667, 2012. a
Kulmala, M., Kontkanen, J., Junninen, H., Lehtipalo, K., Manninen, H., Nieminen, T., Petäjä, T., Sipilä, M., Schobesberger, S., Rantala, P., Franchin, A., Jokinen, T., Järvinen, E., Äijälä, M., Kangasluoma, J., Hakala, J., Aalto, P., Paasonen, P., Mikkilä, J., Vanhanen, J., Aalto, J., Hakola, H., Makkonen, U., Ruuskanen, T., Mauldin III, R., Duplissy, J., Vehkamäki, H., Bäck, J., Kortelainen, A., Riipinen, I., Kurtén, T., Johnston, M., Smith, J., Ehn, M., Mentel, T., Lehtinen, K., Laaksonen, A., Kerminen, V.-M., and Worsnop, D.: Direct observations of atmospheric aerosol nucleation, Science, 339, 943–946, https://doi.org/10.1126/science.1227385, 2013. a, b
Kulmala, M., Petäjä, T., Ehn, M., Thornton, J., Sipilä, M., Worsnop, D., and Kerminen, V.-M.: Chemistry of Atmospheric Nucleation: On the Recent Advances on Precursor Characterization and Atmospheric Cluster Composition in Connection with Atmospheric New Particle Formation, Annu. Rev. Phys. Chem., 65, 21–37, https://doi.org/10.1146/annurev-physchem-040412-110014, 2014. a
Kulmala, M., Luoma, K., Virkkula, A., Petäjä, T., Paasonen, P., Kerminen, V.-M., Nie, W., Qi, X., Shen, Y., Chi, X., and Ding, A.: On the mode-segregated aerosol particle number concentration load: contributions of primary and secondary particles in Hyytiälä and Nanjing, Boreal Environ. Res., 21, 319–331, 2016. a
Kürten, A., Rondo, L., Ehrhart, S., and Curtius, J.: Calibration of a Chemical Ionization Mass Spectrometer for the Measurement of Gaseous Sulfuric Acid, J. Phys. Chem. A, 116, 6375–6386, https://doi.org/10.1021/jp212123n, 2012. a, b
Merikanto, J., Spracklen, D. V., Mann, G. W., Pickering, S. J., and Carslaw, K. S.: Impact of nucleation on global CCN, Atmos. Chem. Phys., 9, 8601–8616, https://doi.org/10.5194/acp-9-8601-2009, 2009. a
Mirme, S. and Mirme, A.: The mathematical principles and design of the NAIS – a spectrometer for the measurement of cluster ion and nanometer aerosol size distributions, Atmos. Meas. Tech., 6, 1061–1071, https://doi.org/10.5194/amt-6-1061-2013, 2013. a
O'Dowd, C. D., Jimenez, J. L., Bahreini, R., Flagan, R. C., Seinfeld, J. H., Hämeri, K., Pirjola, L., Kulmala, M., and Hoffmann, T.: Marine aerosol formation from biogenic iodine emissions, Nature, 417, 632–636, https://doi.org/10.1038/nature00775, 2002. a
Olin, M.: Atmospheric data measured in Qvidja, Finland, from Apr to Jun 2019, Zenodo [data set], https://doi.org/10.5281/zenodo.6394454, 2022. a, b
Olin, M., Kuuluvainen, H., Aurela, M., Kalliokoski, J., Kuittinen, N., Isotalo, M., Timonen, H. J., Niemi, J. V., Rönkkö, T., and Dal Maso, M.: Traffic-originated nanocluster emission exceeds H2SO4-driven photochemical new particle formation in an urban area, Atmos. Chem. Phys., 20, 1–13, https://doi.org/10.5194/acp-20-1-2020, 2020. a
Olin, M., Patoulias, D., Kuuluvainen, H., Niemi, J. V., Rönkkö, T., Pandis, S. N., Riipinen, I., and Dal Maso, M.: Contribution of traffic-originated nanoparticle emissions to regional and local aerosol levels, Atmos. Chem. Phys., 22, 1131–1148, https://doi.org/10.5194/acp-22-1131-2022, 2022. a
Paasonen, P., Asmi, A., Petäjä, T., Kajos, M. K., Äijälä, M., Junninen, H., Holst, T., Abbatt, J. P., Arneth, A., Birmili, W., Denier Van Der Gon, H., Hamed, A., Hoffer, A., Laakso, L., Laaksonen, A., Leaitch, W. R., Plass-Dülmer, C., Pryor, S. C., Räisänen, P., Swietlicki, E., Wiedensohler, A., Worsnop, D. R., Kerminen, V. M., and Kulmala, M.: Warming-induced increase in aerosol number concentration likely to moderate climate change, Nat. Geosci., 6, 438–442, https://doi.org/10.1038/ngeo1800, 2013. a
Paatero, P., Hopke, P. K., Song, X.-H., and Ramadan, Z.: Understanding and controlling rotations in factor analytic models, Chemometr. Intell. Lab., 60, 253–264, https://doi.org/10.1016/S0169-7439(01)00200-3, 2002. a
Pierce, J. R., Westervelt, D. M., Atwood, S. A., Barnes, E. A., and Leaitch, W. R.: New-particle formation, growth and climate-relevant particle production in Egbert, Canada: analysis from 1 year of size-distribution observations, Atmos. Chem. Phys., 14, 8647–8663, https://doi.org/10.5194/acp-14-8647-2014, 2014. a
Pikridas, M., Riipinen, I., Hildebrandt, L., Kostenidou, E., Manninen, H., Mihalopoulos, N., Kalivitis, N., Burkhart, J. F., Stohl, A., Kulmala, M., and Pandis, S. N.: New particle formation at a remote site in the eastern Mediterranean, J. Geophys. Res.-Atmos., 117, 12205, https://doi.org/10.1029/2012JD017570, 2012. a
Posner, L. N. and Pandis, S. N.: Sources of ultrafine particles in the Eastern United States, Atmos. Environ., 111, 103–112, https://doi.org/10.1016/j.atmosenv.2015.03.033, 2015. a
Qi, X. M., Ding, A. J., Nie, W., Petäjä, T., Kerminen, V.-M., Herrmann, E., Xie, Y. N., Zheng, L. F., Manninen, H., Aalto, P., Sun, J. N., Xu, Z. N., Chi, X. G., Huang, X., Boy, M., Virkkula, A., Yang, X.-Q., Fu, C. B., and Kulmala, M.: Aerosol size distribution and new particle formation in the western Yangtze River Delta of China: 2 years of measurements at the SORPES station, Atmos. Chem. Phys., 15, 12445–12464, https://doi.org/10.5194/acp-15-12445-2015, 2015. a, b
Salma, I., Németh, Z., Kerminen, V.-M., Aalto, P., Nieminen, T., Weidinger, T., Molnár, Á., Imre, K., and Kulmala, M.: Regional effect on urban atmospheric nucleation, Atmos. Chem. Phys., 16, 8715–8728, https://doi.org/10.5194/acp-16-8715-2016, 2016. a
Simon, M., Dada, L., Heinritzi, M., Scholz, W., Stolzenburg, D., Fischer, L., Wagner, A. C., Kürten, A., Rörup, B., He, X.-C., Almeida, J., Baalbaki, R., Baccarini, A., Bauer, P. S., Beck, L., Bergen, A., Bianchi, F., Bräkling, S., Brilke, S., Caudillo, L., Chen, D., Chu, B., Dias, A., Draper, D. C., Duplissy, J., El-Haddad, I., Finkenzeller, H., Frege, C., Gonzalez-Carracedo, L., Gordon, H., Granzin, M., Hakala, J., Hofbauer, V., Hoyle, C. R., Kim, C., Kong, W., Lamkaddam, H., Lee, C. P., Lehtipalo, K., Leiminger, M., Mai, H., Manninen, H. E., Marie, G., Marten, R., Mentler, B., Molteni, U., Nichman, L., Nie, W., Ojdanic, A., Onnela, A., Partoll, E., Petäjä, T., Pfeifer, J., Philippov, M., Quéléver, L. L. J., Ranjithkumar, A., Rissanen, M. P., Schallhart, S., Schobesberger, S., Schuchmann, S., Shen, J., Sipilä, M., Steiner, G., Stozhkov, Y., Tauber, C., Tham, Y. J., Tomé, A. R., Vazquez-Pufleau, M., Vogel, A. L., Wagner, R., Wang, M., Wang, D. S., Wang, Y., Weber, S. K., Wu, Y., Xiao, M., Yan, C., Ye, P., Ye, Q., Zauner-Wieczorek, M., Zhou, X., Baltensperger, U., Dommen, J., Flagan, R. C., Hansel, A., Kulmala, M., Volkamer, R., Winkler, P. M., Worsnop, D. R., Donahue, N. M., Kirkby, J., and Curtius, J.: Molecular understanding of new-particle formation from α-pinene between −50 and +25∘C, Atmos. Chem. Phys., 20, 9183–9207, https://doi.org/10.5194/acp-20-9183-2020, 2020. a, b, c
Sipilä, M., Sarnela, N., Jokinen, T., Henschel, H., Junninen, H., Kontkanen, J., Richters, S., Kangasluoma, J., Franchin, A., Peräkylä, O., Rissanen, M. P., Ehn, M., Vehkamäki, H., Kurten, T., Berndt, T., Petäjä, T., Worsnop, D., Ceburnis, D., Kerminen, V. M., Kulmala, M., and O'Dowd, C.: Molecular-scale evidence of aerosol particle formation via sequential addition of HIO3, Nature, 537, 532–534, https://doi.org/10.1038/nature19314, 2016. a
Wang, M., He, X.-C., Finkenzeller, H., Iyer, S., Chen, D., Shen, J., Simon, M., Hofbauer, V., Kirkby, J., Curtius, J., Maier, N., Kurtén, T., Worsnop, D. R., Kulmala, M., Rissanen, M., Volkamer, R., Tham, Y. J., Donahue, N. M., and Sipilä, M.: Measurement of iodine species and sulfuric acid using bromide chemical ionization mass spectrometers, Atmos. Meas. Tech., 14, 4187–4202, https://doi.org/10.5194/amt-14-4187-2021, 2021. a
Wang, Z. B., Hu, M., Yue, D. L., Zheng, J., Zhang, R. Y., Wiedensohler, A., Wu, Z. J., Nieminen, T., and Boy, M.: Evaluation on the role of sulfuric acid in the mechanisms of new particle formation for Beijing case, Atmos. Chem. Phys., 11, 12663–12671, https://doi.org/10.5194/acp-11-12663-2011, 2011. a
Woo, K. S., Chen, D. R., Pui, D. Y. H., and Mcmurry, P. H.: Measurement of Atlanta Aerosol Size Distributions: Observations of Ultrafine Particle Events, Aerosol Sci. Tech., 34, 75–87, https://doi.org/10.1080/02786820120056, 2001. a
Wu, Z., Hu, M., Liu, S., Wehner, B., Bauer, S., Maßling, A., Wiedensohler, A., Petäjä, T., Dal Maso, M., and Kulmala, M.: New particle formation in Beijing, China: Statistical analysis of a 1-year data set, J. Geophys. Res.-Atmos., 112, 9209, https://doi.org/10.1029/2006JD007406, 2007. a
Yan, C., Nie, W., Äijälä, M., Rissanen, M. P., Canagaratna, M. R., Massoli, P., Junninen, H., Jokinen, T., Sarnela, N., Häme, S. A. K., Schobesberger, S., Canonaco, F., Yao, L., Prévôt, A. S. H., Petäjä, T., Kulmala, M., Sipilä, M., Worsnop, D. R., and Ehn, M.: Source characterization of highly oxidized multifunctional compounds in a boreal forest environment using positive matrix factorization, Atmos. Chem. Phys., 16, 12715–12731, https://doi.org/10.5194/acp-16-12715-2016, 2016. a, b
Yao, L., Garmash, O., Bianchi, F., Zheng, J., Yan, C., Kontkanen, J., Junninen, H., Mazon, S. B., Ehn, M., Paasonen, P., Sipilä, M., Wang, M., Wang, X., Xiao, S., Chen, H., Lu, Y., Zhang, B., Wang, D., Fu, Q., Geng, F., Li, L., Wang, H., Qiao, L., Yang, X., Chen, J., Kerminen, V.-M., Petäjä, T., Worsnop, D. R., Kulmala, M., and Wang, L.: Atmospheric new particle formation from sulfuric acid and amines in a Chinese megacity, Science, 361, 278–281, https://doi.org/10.1126/science.aao4839, 2018. a
Zhang, Y., Peräkylä, O., Yan, C., Heikkinen, L., Äijälä, M., Daellenbach, K. R., Zha, Q., Riva, M., Garmash, O., Junninen, H., Paatero, P., Worsnop, D., and Ehn, M.: A novel approach for simple statistical analysis of high-resolution mass spectra, Atmos. Meas. Tech., 12, 3761–3776, https://doi.org/10.5194/amt-12-3761-2019, 2019. a, b, c, d