the Creative Commons Attribution 4.0 License.
the Creative Commons Attribution 4.0 License.
 | 22 Jun 2022
Chemical properties, sources and size-resolved hygroscopicity of submicron black-carbon-containing aerosols in urban Shanghai
Shijie Cui
Dan Dan Huang
Yangzhou Wu
Junfeng Wang
Fuzhen Shen
Jiukun Xian
Yunjiang Zhang
Hongli Wang
Cheng Huang
Hong Liao
Refractory black carbon (rBC) aerosols play an important role in air quality and climate change, yet highly time-resolved and detailed investigations on the physicochemical properties of rBC and its associated coating are still scarce. In this work, we used a laser-only Aerodyne soot particle aerosol mass spectrometer (SP-AMS) to exclusively measure rBC-containing (rBCc) particles, and we compared their properties with those of the total nonrefractory submicron particles (NR-PM1) measured in parallel by a high-resolution AMS (HR-AMS) in Shanghai. Observations showed that, overall, rBC was thickly coated, with an average mass ratio of coating to rBC core (RBC) of ∼5.0 (±1.7). However, the ratio of the mass of the rBC-coating species to the mass of those species in NR-PM1 was only 19.1 (±4.9) %; sulfate tended to condense preferentially on non-rBC particles, so the ratio of the sulfate on rBC to the NR-PM1 sulfate was only 7.4 (±2.2) %, while the majority (72.7±21.0 %) of the primary organic aerosols (POA) were associated with rBC. Positive matrix factorization revealed that organics emitted from cooking did not coat rBC, and a portion of the organics that coated rBC was from biomass burning; such organics were unidentifiable in NR-PM1. Small rBCc particles were predominantly from traffic, while large-sized ones were often mixed with secondary components and typically had a thick coating. Sulfate and secondary organic aerosol (SOA) species were generated mainly through daytime photochemical oxidation (SOA formation, likely associated with in situ chemical conversion of traffic-related POA to SOA), while nocturnal heterogeneous formation was dominant for nitrate; we also estimated an average time of 5–19 h for those secondary species to coat rBC. During a short period that was affected by ship emissions, particles were characterized as having a high vanadium concentration (on average 6.3±3.1 ng m−3) and a mean vanadium/nickel mass ratio of 2.0 (±0.6). Furthermore, the size-resolved hygroscopicity parameter (κrBCc) of rBCc particles was obtained based on their full chemical characterization, and was parameterized as κrBCc(x)=0.29–0.14 × (where x ranges from 150 to 1000 nm). Under critical supersaturations (SSC) of 0.1 % and 0.2 %, the D50 values were 166 (±16) and 110 (±5) nm, respectively, and 16 (±3) % and 59 (±4) %, respectively, of the rBCc particles by number could be activated into cloud condensation nuclei (CCN). Our findings are valuable for advancing the understanding of BC chemistry as well as the effective control of atmospheric BC pollution.
- Article
(3096 KB) - Full-text XML
-
Supplement
(2567 KB) - BibTeX
- EndNote


Refractory black carbon (rBC) aerosols can directly absorb solar radiation, indirectly change the nature of clouds and alter the albedo of snow or glaciers (Jacobi et al., 2015), resulting in a positive radiative forcing that is second only to carbon dioxide at both regional and global scales (Ramanathan and Carmichael, 2008; Bond et al., 2013). The fresh rBC particles produced by incomplete combustion of biomass and fossil fuel tend to be fractal in morphology and can mix with many other components (Peng et al., 2016; Li et al., 2021). After entering into the atmosphere, fresh rBC can further mix externally or internally with organic/inorganic species that have undergone primary emission or are formed secondarily, and such aged rBC-containing (rBCc) particles (Chen et al., 2017; Lee et al., 2017) may have contrasting chemical properties and morphologies (or mixing states) (D. Liu et al., 2017; Lee et al., 2019; Xie et al., 2019). In addition, when rBC mixes with hydrophilic materials, its hygroscopicity, cloud condensation nuclei (CCN) activity, size distribution, etc., can be significantly changed, which subsequently affects its atmospheric behavior, impact and lifecycle (Liu et al., 2013; Lambe et al., 2015). Therefore, it is necessary to elucidate the physicochemical characteristics and sources of rBC cores and their associated coating materials so as to better understand their influences on the climate and air quality.
The chemical composition of ambient rBCc particles is largely dependent upon the atmospheric conditions and emission sources. In general, the thickness of the coating, the mass contributions of secondary components (such as sulfate, nitrate and secondary organic aerosol (SOA) species) and the oxidation degree of the organics that coat rBCc cores increase with the aging time or oxidation capacity of the ambient environment (Cappa et al., 2012; Liu et al., 2015; Wang et al., 2017, 2019; Collier et al., 2018), except in some specific cases where thickly coated rBCc particles can be dominated by particles that have undergone primary emission (such as those from biomass burning; Wang et al., 2017). Recent field observations report that SOA species coated on rBC cores could account for 35 % and 41 % of the total SOA mass near traffic emission sources and in a polluted offshore environment, respectively (Massoli et al., 2012, 2015). A study of rBCc particles in Singapore found that over 90 % of the rBC was derived from local combustion sources (mainly traffic), while 30 % of the rBC was associated with fresh SOA generated under the influences of daytime shipping and industrial emissions (Rivellini et al., 2020). The SOA material concentrated on the surface of rBC was found to be chemically different from the SOA that was externally mixed with rBC (Lee et al., 2017) in Fontana, California, and another study in Shenzhen, China, revealed that more oxidized SOA preferred to mix with rBC, as the abundant transition metals detected in rBC cores can act as catalysts to convert less oxidized SOA to more oxidized SOA in an aerosol aqueous phase (Cao et al., 2022). rBC can catalyze SO2 to form sulfate as well, as observed in Beijing (Zhang et al., 2020) and Guangzhou (Zhang et al., 2021), China. Besides SOA, cooking-related organic aerosol (OA) was found to be externally mixed with rBC (Lee et al., 2017; Wang et al., 2019), and a unique biomass-burning-related OA factor was identified that was only present in rBCc, not non-rBC, particles during summertime in Beijing (J. Wang et al., 2020).
The size distribution of rBCc particles is also modulated greatly by their original sources and aging processes. For example, a study in Shanghai showed a bimodal size distribution of rBCc particles, with a condensation mode dominated by traffic emissions (small core size and thin coating) and a droplet mode including highly aged biomass burning particles (large core size and thick coating) and highly aged traffic particles (small core size and very thick coating) (Gong et al., 2016). Another study in Beijing (Liu et al., 2019) further resolved four size modes of rBCc particles related to traffic (small core, thin coating), coal or biomass burning (moderate coating, both small and large cores), coal combustion (large core, thin coating) and secondary processes (thick coating, both small and large cores).
Moreover, water uptake by and CCN activity of rBCc particles can increase with the encapsulation of water-soluble substances such as sulfate, nitrate and SOA (Liu et al., 2013; Wu et al., 2019). Based on the measured chemical composition of rBCc particles, our previous work established a method for calculating the size-resolved hygroscopicity parameter of rBCc particles (κrBCc) and determined the CCN activation diameters of rBCc particles for given critical supersaturation (SSC) values (Wu et al., 2019).
Highly time-resolved chemical characterization of rBCc particles is seldom reported in China and is still lacking in Shanghai. In this study, we utilized an Aerodyne soot particle aerosol mass spectrometer (SP-AMS) to determine the concentration, composition and size distribution of rBCc particles exclusively (see Sect. 2.1 for further technical details) in urban Shanghai for the first time. We also compared the SP-AMS measurement results with those from a colocated Aerodyne high-resolution time-of-flight aerosol mass spectrometer (HR-AMS) to comprehensively investigate the characteristics of rBCc particles. We analyzed κrBCc and estimated the proportions of activated rBCc particles at given SSC values as well.
2.1 Sampling site and instrumentation
Field measurements were conducted from 31 October to 2 December 2018, during which the instruments were deployed on the eighth floor of the building of the Shanghai Academy of Environmental Sciences (SAES) (31∘10′33.348′′ N, 121∘26′10.978′′ E). Shanghai is representative of densely populated megacities around the world. The measurement period also belonged to the cold season, when sources of rBCc particles can be complex, which can offer rich information about the rBCc particles; of course, future measurements in other seasons are still essential to achieve a complete understanding of rBCc particles. East of the sampling site is a large commercial shopping center, and the site is surrounded by residential areas with two busy arterial roads directly to the east (∼450 m) and south (∼150 m), respectively (Fig. S1 in the Supplement). In addition, the adjacent areas are densely populated with roadside residents, office workers and market traders, as well as with crowds moving in and out of the Caobao Road Metro station (∼100 m). The measurement period was dominated by northeasterly winds, while many international freight companies are located on the northeastern side of the site, and many freighters were reposing on the Huangpu River. Overall, the sampling site was probably influenced by vehicular emissions, residential activities and cargo ship emission plumes from the northeast, etc.
An Aerodyne SP-AMS and an HR-AMS were operated in parallel during the campaign. The two AMSs shared a sampling line with a PM2.5 cyclone (model URG-2000-30EN) in front to remove coarse particles. Ambient air pulled through the sampling line was dried using a diffusion dryer filled with silicon gel and was subsequently drawn into both instruments. Due to the transmission efficiency of the inlet lens, both AMSs mainly measured 30–1200 nm particles (denoted as PM1).
The working principle of SP-AMS has been described in detail previously (Onasch et al., 2012). However, in this work, we used only the intracavity infrared laser vaporizer to selectively measure rBCc particles (rBC cores and associated coating materials), as rBC can absorb 1064 nm laser light. The thermal tungsten vaporizer had to be physically detached, otherwise non-rBC particles could still be detected, as the filament could heat the vaporizer to ∼200 ∘C even if it was turned off. Before sampling, the SP-AMS was tuned and calibrated, following steps described previously (Lee et al., 2015; Willis et al., 2016; Wang et al., 2017). During sampling, due to relatively low rBCc-particle mass loadings, the SP-AMS was operated in two mass-sensitive V modes (2.5 min per cycle), one with a particle time-of-flight (PToF) mode (30 s) and the other (120 s) with a mass-spectral mode with mass-to-charge () ratios of up to 500. Filtered air was also measured in the middle of the campaign (for 60 min) to determine the limits of detection (LOD, 3 times the standard deviation) of various aerosol species and to adjust the air-influenced mass-spectral signals (Zhang et al., 2005).
Before the removal of the tungsten heater, calibrations of the ionization efficiency (IE) of nitrate and relative ionization efficiency (RIE) of sulfate were performed by using pure ammonium nitrate and ammonium sulfate particles (Jayne et al., 2000), and the values were assumed to be unchanged throughout the whole campaign (Willis et al., 2016). The RIE of rBC towards nitrate was calibrated by using size-selected (300 nm) BC particles (REGAL 400R pigment black, Cabot Corp.) (Onasch et al., 2012), and the average ratio of to was calculated to be 0.584 and used to correct the interference with from other organics. The RIEs of ammonium, nitrate, sulfate and rBC were determined as 4.53, 1.10, 1.01 and 0.17, respectively, and the default RIE value for organics, 1.4, was used (Canagaratna et al., 2007). The size was calibrated with polystyrene latex (PSL) spheres (100–700 nm) (Duke Scientific Corp., Palo Alto, CA) before the measurement. This study applied a collection efficiency (CE) of 0.5 for SP-AMS.
The colocated HR-AMS (DeCarlo et al., 2006) was used to measure all PM1, including both rBCc and non-rBC particles, but it detected only nonrefractory species (NR-PM1 species), as its 600 ∘C thermal heater was unable to vaporize rBC and other refractory components. In addition, mass concentrations of gaseous pollutants, carbon monoxide (CO), ozone (O3), nitrogen dioxide (NO2) and sulfur dioxide (SO2) were measured by the Thermo Scientific analyzers provided by SAES. Meteorological parameters including air temperature (T), relative humidity (RH), wind speed (WS), wind direction (WD) and precipitation were obtained from the Xujiahui Environmental Monitoring Station of Shanghai (31∘11′49.1424′′ N, 121∘26′34.44′′ E) (∼2400 m away from the site). The concentrations of particle-phase vanadium (V) and nickel (Ni) that were used to investigate the influence of ships were measured independently by an atmospheric heavy metal analyzer (XHAM-2000A, SAIL HERO, China).
2.2 Data analysis
The AMS data (both SP-AMS and HR-AMS) were analyzed using standard ToF-AMS data analysis tools (Squirrel version 1.59D and Pika version 1.19D) based on Igor Pro 6.37 (Wavemetrics, Lake Oswego, OR, USA). The mass concentrations and high-resolution mass spectra (HRMS) of rBC and coating species (rBCCT) were calculated from high-resolution (HR) fitting of V-mode data. Size distributions of rBCc components were determined from the PToF data with unit mass resolution and were scaled to the mass concentrations obtained as described above. In particular, the size distribution of rBC was scaled to that of 24 () (the scaling factor was the ratio of the rBC mass concentration to that calculated based on its size distribution) because 24 is an rBC fragment, so it has the least interference from other organic or inorganic species; such a treatment was adopted in earlier studies too (Collier et al., 2018; Wang et al., 2016, 2019).
The HR ion fitting of AMS data is able to distinguish various ions and isotopic ions and to calculate elemental ratios of organics, such as oxygen-to-carbon (), hydrogen-to-carbon (), nitrogen-to-carbon () and organic mass to organic carbon () ratios, via the original Aiken-ambient (A-A) method (Aiken et al., 2008) and the improved method (I-A) (Canagaratna et al., 2015b). The outcomes of both methods correlated well. Average , and ratios from the I-A method used in this work were 24.9 %, 7.3 % and 5.6 % higher, respectively, than those from the A-A method.
Furthermore, we performed positive matrix factorization (PMF) (Paatero and Tapper, 1994) analysis of the HRMS of organics measured by the SP-AMS via the PMF Evaluation Tool (Ulbrich et al., 2009). The PMF solutions were thoroughly evaluated by following the protocols documented in Zhang et al. (2011). Finally, a six-factor solution was chosen as the optimal one. The final result included four primary OA (POA) factors, namely OA enriched in hydrocarbon-like species (HOA-rich), rBC-enriched OA (rBC-rich), biomass-burning OA (BBOA), OA enriched in water-soluble hydrocarbon-like species OA (WS-HOA), and two secondary OA (SOA) factors: less-oxidized oxygenated OA (LO-OOArBC) and more-oxidized oxygenated OA (MO-OOArBC) (key diagnostic plots are shown in Fig. S2). As a comparison, the mass spectra of five-factor and seven-factor solutions are illustrated in Fig. S3 (for the five-factor solution, factor 3 is a mixed factor with BBOA and WS-HOA; for the seven-factor solution, MO-OOA clearly splits into factor 5 and factor 2). The HR-AMS data were processed in a similar way, and four factors of NR-PM1 organics were resolved, including hydrocarbon-related OA (HOA), cooking OA (COA), less-oxidized oxygenated OA (LO-OOA) and more-oxidized oxygenated OA (MO-OOA) (mass spectra and time series are shown in Fig. S4).
2.3 Calculation of the size-resolved hygroscopicity of rBCc particles
The hygroscopicity parameter κ is a single parameter representing the hygroscopicity of particles, which is calculated based essentially on the chemical composition (Petters and Kreidenweis, 2007). SP-AMS-measured size-resolved chemical compositions of rBCc particles can thus give the size-resolved hygroscopicity of rBCc particles (κrBCc) (Wu et al., 2019; Hu et al., 2021). This study applied a similar method proposed by Wu et al. (2019), and the critical parameters involved in the calculation are detailed in Table S1 in the Supplement. The procedures are briefly as follows: (1) obtain the matrix of size-resolved mass concentrations of each rBCc-particle component from SP-AMS analysis; (2) convert the size-resolved concentration matrix of inorganic ions (, and ) to the corresponding matrix of inorganic salts (NH4NO3, NH4HSO4 and (NH4)2SO4) using a simplified solution of ion pairs (Gysel et al., 2007); (3) convert the size-resolved mass matrix of all components (inorganic salts, OA and rBC) to that of the size-resolved volume fractions (Gysel et al., 2007; Chang et al., 2010; Wu et al., 2016); (4) combine with previously reported hygroscopic parameters (Gysel et al., 2007; Chang et al., 2010; Wu et al., 2016) to obtain the volumetric contribution of each component to the hygroscopicity of rBCc particles; and (5) use the Zdanovskii–Stokes–Robinson (ZSR) rule to derive the size-resolved hygroscopicity of rBCc particles (κrBCc) (Topping et al., 2005a, b).
3.1 Overview of the chemical characteristics of rBCc and NR-PM1 particles
Figure 1 presents the time series of meteorological parameters, concentrations of gaseous pollutants (CO, NO2, O3 and SO2), ship emission tracers (vanadium and nickel), rBC and rBCCT species and their mass percentages with respect to the total rBCc mass, and PMF-resolved OA factors and their corresponding fractional contributions. The sampling period featured relatively moderate temperatures and very stagnant conditions, with an average (±1σ) temperature of 15.3 (±2.9) ∘C and wind speed (WS) of 0.16 (±0.29) m s−1. Winds with speeds < 0.5 m s−1 dominated on most of the sampling days and there was near-zero wind during 42 % of the sampling time; therefore, the overall influence of WS and WD on the surface mass loadings of rBCc particles was insignificant. Yet, one should keep in mind that WD can affect rBCc-particle sources and the WS might be stronger at higher altitudes, so long-range transport of air pollutants was still possible. The average concentrations of CO, NO2, O3, SO2, V and Ni were determined as 0.60 (±0.26) ppm, 29.20 (±17.07) ppt, 27.10 (±15.97) ppt, 1.27 (±0.72) ppt, 4.05 (±3.19) ng m−3 and 3.06 (±2.45) ng m−3, respectively.
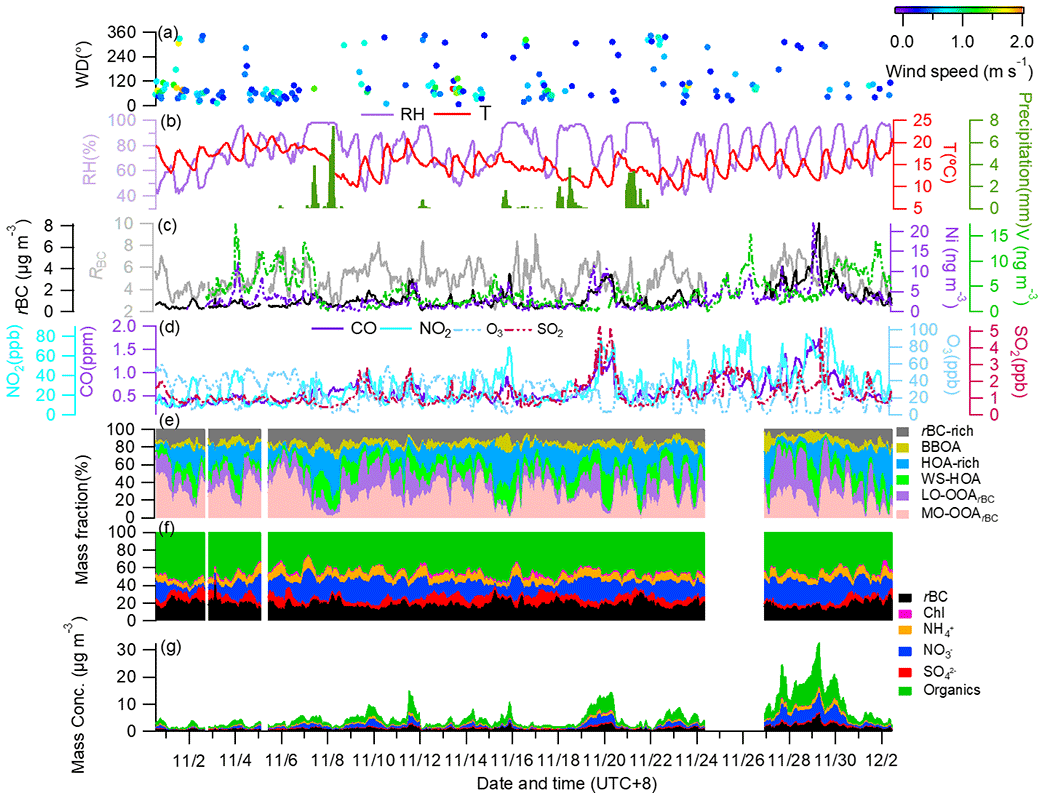
Figure 1Time series of: (a) wind direction (WD) colored by wind speed (WS); (b) air temperature (T), relative humidity (RH) and precipitation; (c) mass concentrations of rBC, Ni, V and RBC (mass ratio of all coating species to rBC); (d) mass concentrations of the gas pollutants CO, NO2, O3 and SO2; (e) mass fractions (%) of different OA factors with respect to the total rBCc OA; (f) mass fractions (%) of different components to the total rBCc mass; and (g) mass concentrations of stacked rBCc-particle components.
The mass loadings of rBC and rBCCT ranged from 0.04 to 11.00 µg m−3 and from 0.37 to 30.47 µg m−3, respectively, with campaign-mean values (±1σ) of 0.92 (±0.81) µg m−3 and 4.55 (±4.40) µg m−3. The coating materials accounted for 81.8 (±5.3) % of the total rBCc mass, of which organics were the most abundant species (2.54±2.52 µg m−3, 46.6±6.4 %), followed by nitrate (1.20±1.30 µg m−3, 18.5±8.0 %), ammonium (0.44±0.40 µg m−3, 8.0±2.0 %), sulfate (0.30±0.19 µg m−3, 7.1±3.6 %) and chloride (0.07±0.05 µg m−3, 1.7±1.0 %). The mass ratio of rBCCT to rBC (RBC) ranged from 2.2 to 9.0, with an average of ∼5.0 (±1.7). The average RBC was higher than those in California (RBC=2.3) (Collier et al., 2018) and in Shenzhen (RBC=2.5) (Cao et al., 2022), lower than that in the Tibetan Plateau (RBC=7.7) (Wang et al., 2017) and similar to that in Beijing (RBC=5.0) (Wang et al., 2019), suggesting that rBC was relatively thickly coated throughout the campaign. The correlation between rBC and rBCCT was moderate (Pearson's r=0.76). The correlation coefficients (r) of chloride, nitrate, sulfate and organics with rBC were 0.72, 0.87, 0.71 and 0.73, respectively, suggesting variability of sources among different coating components.
Figure 2 compares the campaign-averaged diurnal patterns of rBCc-particle and NR-PM1 species, the chemical compositions of rBCc particles and NR-PM1, and the mass ratios of the species coated on rBC to those on NR-PM1. We found that the diurnal variations of nitrate, sulfate, ammonium and chloride were very similar (r>0.92) for the two particle groups, while an apparent difference was found for organics on rBCc particles, with a much more obvious morning rush-hour peak (06:00–09:00 LT). The results indicate that the formation processes of the inorganic salts coated on rBC were similar to those not coated on rBC, but there were large differences regarding the sources of/processes for organics. For rBC itself, the diurnal cycle presented clear morning and evening peaks, likely related to rush-hour traffic emissions (CO showed a similar pattern). On the contrary, RBC had a minimum in the morning and dropped to a low level in the late afternoon, probably under the influence of traffic-emitted fresh and barely coated rBC particles (further details are given in Sect. 3.2.1).
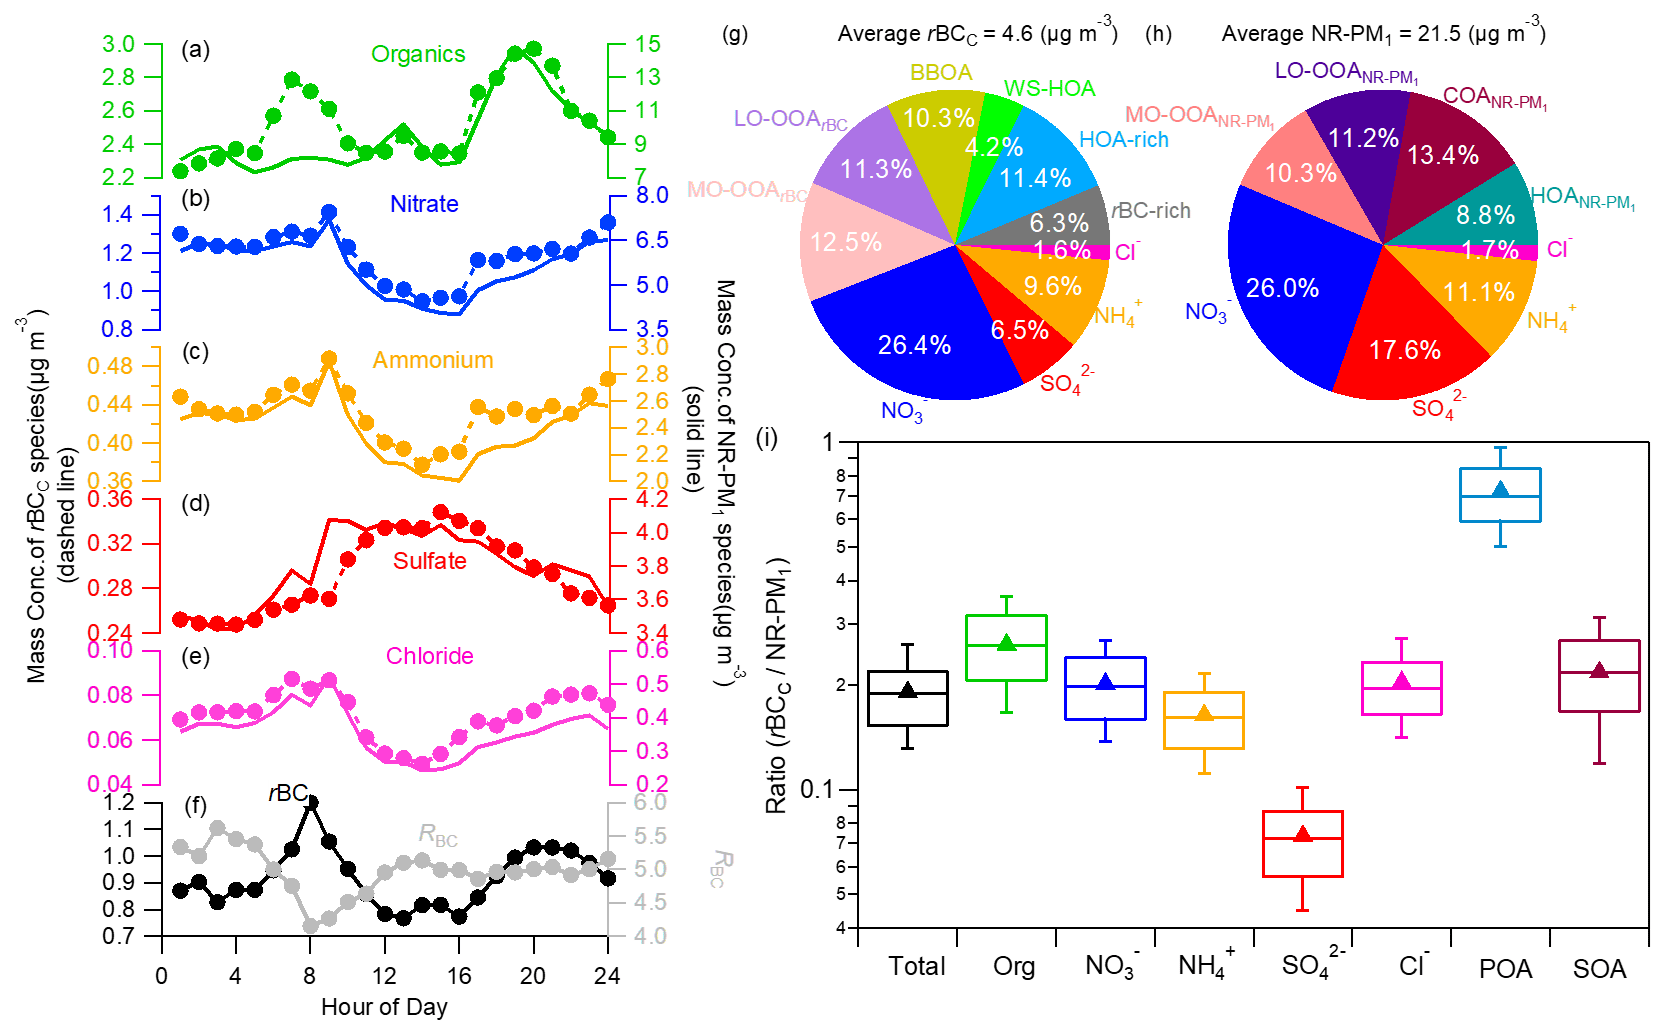
Figure 2Diurnal cycles of the mass concentrations of (a–e) rBCc-particle and NR-PM1 species (organics, nitrate, ammonium, sulfate and chloride) and (f) rBC and RBC. The campaign-average chemical compositions of rBCc particles (g) and NR-PM1 (h) are also shown. (i) Mass ratios of species in rBCc particles with respect to those species in NR-PM1 (the whiskers above and below the boxes mark the 90 % and 10 % percentiles, respectively; the upper and lower edges of the boxes represent the 75 % and 25 % percentiles, respectively; and the lines and triangles inside the boxes denote the median and mean values, respectively; SOA represents ([LO-OOArBC] + [MO-OOArBC])([LO-OOA] + [LV-OOA]) and POA represents ([rBC-rich + HOA-rich + BBOA + WS-HOA])HOA).
Distributions of species were also different in rBCc and non-rBC particles, leading to different chemical compositions (Fig. 2g and h). Sulfate tended to preferentially condense on non-rBC particles, as its contribution to the total rBCc mass was only 6.5 (±4.2) % while its contribution to the total NR-PM1 was 17.6 (±8.3) %. The apportionment of nitrate between rBCc and non-rBC particles was about even, as it occupied ∼26 % of both the total rBCc mass and the NR-PM1 mass. Organics occupied 55.9 (±9.2) % of the rBCc mass, larger than in NR-PM1 (43.7±11.7 %), as primary OA species preferentially associated with rBC. Such a result is similar to that observed in winter in Beijing but contrary to the result that SOA was more abundant in rBCc particles in Shenzhen (Cao et al., 2022).
On average, rBCc particles accounted for 19.1 % of the total NR-PM1 mass loading (21.61±15.80 µg m−3) (Fig. 2i) – comparable to that in Fontana, California (Lee et al., 2017). This finding reveals that significant fractions of aerosol species were externally mixed with rBC. Individually, sulfate captured by rBC represented only 7.4 (±2.2) % of the NR-PM1 sulfate, which was similar to earlier results (Lee et al., 2017; J. Wang et al., 2020; Cao et al., 2022; Ma et al., 2020); mass fractions of rBCc-particle nitrate (20.1±5.2 %) and chloride (20.4±5.5 %) with respect to the masses of those species in NR-PM1 were similar to the portion of total rBCc mass (19.1±4.9 %) with respect to the NR-PM1 mass, while the mass fraction of organics in rBCc particles with respect to the NR-PM1 organic mass was higher (26.1±7.3 %). The lower fraction of sulfate than nitrate in rBCc was likely due to a few reasons. One probable reason is that traffic was a dominant source of rBC (see Sect. 3.2.1 for details), and NO2 is known to originate mainly from traffic as well, so secondarily formed nitrate was easy to condense on co-emitted rBC, whereas SO2 came mainly from other sources rather than traffic. Another possible cause is that the rBC concentration was relatively high during nighttime, and nighttime formation of nitrate was significant. Sulfate, on the other hand, was mostly formed in the afternoon (due to photochemical oxidation) in this study (see Sect. 3.3.2 for details), whereas the afternoon rBC concentration was low. The relatively high ratio of organics was attributed to the fact that the majority of the POA species were coated on rBC (average ratio of 72.7±21.0 %), while the rBC-related SOA was 21.8 (±7.7) % of the total. Note that the rBC-related POA included all four POA factors, and COA did not coat the rBC so it was not included in the calculation.
3.2 Distinctive sources of OA in rBCc particles and NR-PM1
As shown previously, the OA source apportionment results for rBCc particles and NR-PM1 were different. This section discusses in detail the characteristics of the sources of the OA in rBCc particles and bulk NR-PM1.

Figure 3High-resolution mass spectra of the (a) rBC-rich factor, (b) BBOA, (c) HOA-rich factor, (d) WS-HOA, (e) LO-OOArBC and (f) MO-OOArBC. (g–l) Time series of the corresponding factors, their tracers (rBC, C2H4O), C4H + 9, ALWC, nitrate and sulfate), as well as the correlation coefficients. ALWC refers to the aerosol liquid water content, which was estimated using Extended Aerosol Inorganic Model II (E-AIM II); Clegg et al., 1998). Calculation details and results for different RH values are described in the caption and shown in Fig. S6.
3.2.1 Source apportionment of OA in rBCc particles
Figure 3 shows the HRMSs and temporal variations of the six OA factors resolved from the PMF analysis of rBCc-particle organics. Note that the PMF analysis included rBC signals (i.e., ions) to aid the identification of different factors, yet calculations of the elemental ratios of these OA factors did not include ions in order to explicitly explore the properties of the organic coating. The HRMSs of the HOA-rich and rBC-rich factors were similar to those of the OA previously reported in urban environments near traffic emissions and/or in gasoline/diesel vehicle exhaust (Massoli et al., 2012; Lee et al., 2015, 2017; Enroth et al., 2016; Saarikoski et al., 2016; Willis et al., 2016); therefore, both factors were traffic related. The HOA-rich factor mass spectrum featured an intense hydrocarbon ion series (i.e., and ions in Fig. 3c) and the lowest ratio of 0.07. The mass fraction of rBC signals (i.e., ions, such as 12, 24, 36, 48, and 60, etc.) in the HOA-rich factor was 8.1 %. The mass spectrum of the rBC-rich factor had a remarkable contribution from rBC (24.2 %). Besides ions, the rBC-rich factor contained more oxygenated organic fragments and presented a higher ratio of 0.21 than the HOA-rich factor, similar to previous studies (Willis et al., 2016; Lee et al., 2017). This result is reasonable, as previous studies (Corbin et al., 2014; Malmborg et al., 2017) found that refractory organics could generate oxygenated ion fragments (such as CO+ and derived from oxygenated species on a soot surface or inside a soot nanostructure). The HOA-rich factor correlated very well with the common AMS tracer of vehicular OA, (r=0.95, Fig. 3i), while the rBC-rich factor matched the variation of rBC well (r=0.90, Fig. 3g). Since diesel combustion often releases more rBC than gasoline combustion, it is likely that the rBC-rich factor is representative of diesel vehicle exhaust while the HOA-rich factor represents gasoline combustion emissions. This result demonstrates that laser-only SP-AMS is capable of distinguishing particles from diesel and gasoline burning, which typically cannot be separated by other AMS measurements. Further verification should be the subject of future work.
In this work, a multiple linear regression of the three-dimension size-resolved mass spectra according to the method provided in Ulbrich et al. (2012) was used to resolve the average size distributions of the six OA factors. The diagnostic plots are shown in Fig. S5. Overall, the lumped size distribution of the six OA factors reproduced that of the total OA well (except for a few size bins, most deviations were within 10 %). The correlation between the measured and reconstructed OA in all size bins was very tight, with an r of 0.99 and a slope of 0.97, indicating the robustness of the regressed size distributions of all OA factors. The results, together with the size distributions of rBCc-particle components and the corresponding mass fractional contributions of different components in all size bins, are illustrated in Fig. 4. The average HOA-rich factor size distribution peaked around 150 nm (Dva, vacuum aerodynamic diameter), generally matching with previously reported size distributions of HOA (Sun et al., 2012; Ulbrich et al., 2012; Zhou et al., 2016). Interestingly, the size distribution of the rBC-rich factor presented two modes, with one peaking at ∼260 nm and the other (more pronounced) peaking at ∼580 nm (Fig. 4a).
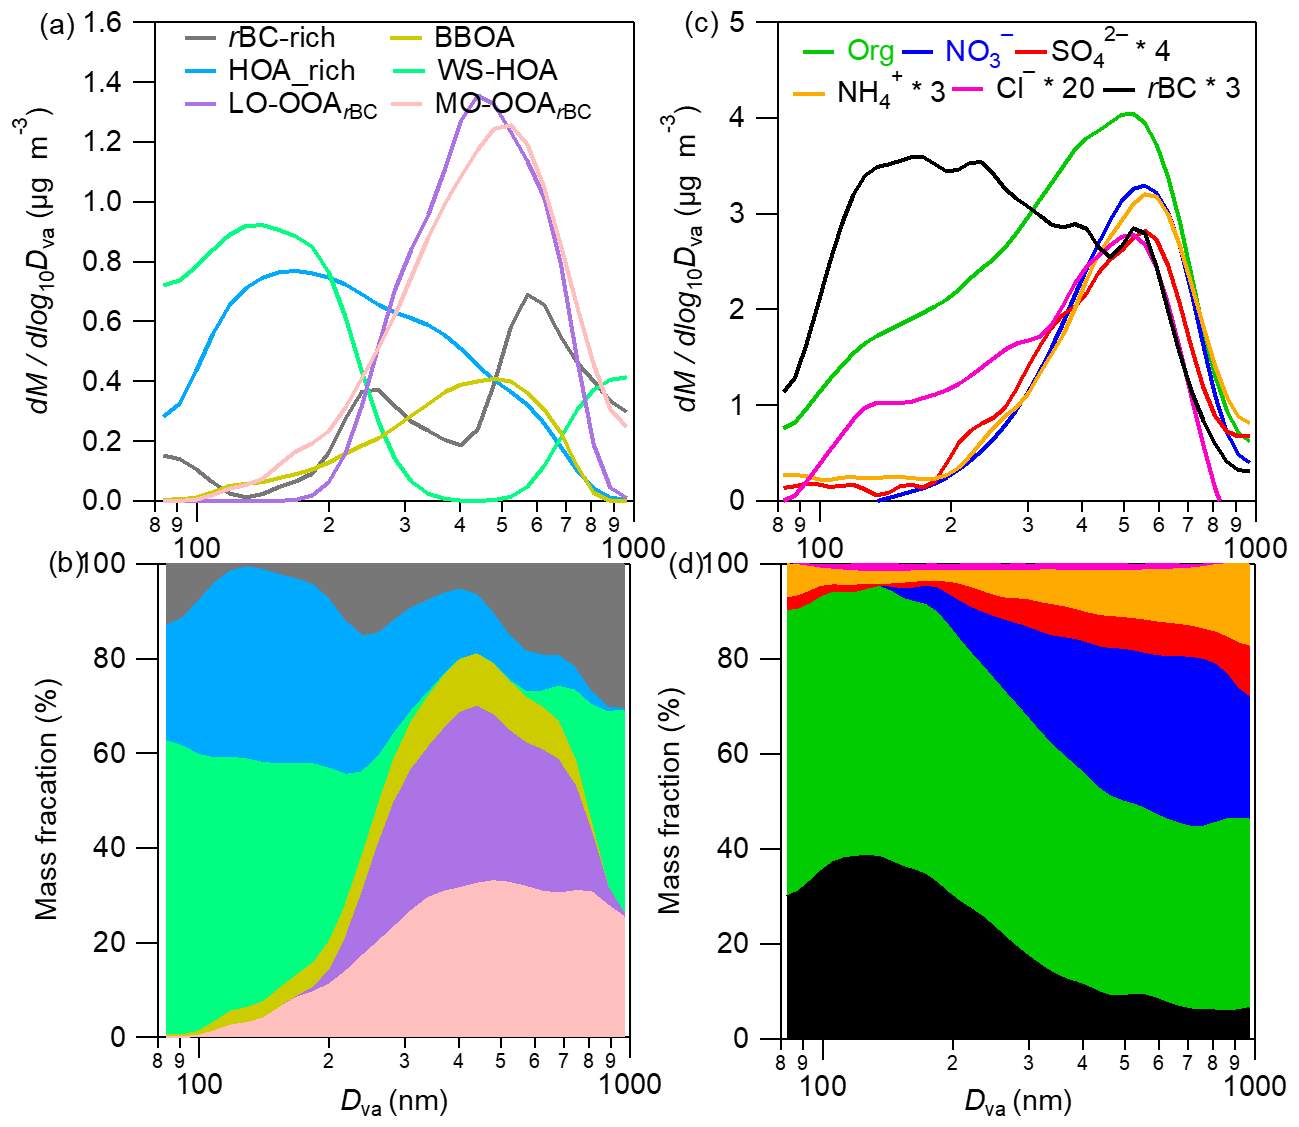
Figure 4Campaign-average size distributions of the six rBCc-particle OA factors (a) and individual rBCc-particle components (b), corresponding mass contributions of the six factors to the total rBCc-particle OA (c) and the major components of the total rBCc particles (d) at different sizes (80–1000 nm).
The BBOA was identified owing to its obviously higher signals of (2.03 %) and (1.62 %) than in other factors, as these two ions are well-known AMS fragments of the biomass-burning tracer levoglucosan (Mohr et al., 2009; Cubison et al., 2011). The time series of BBOA correlated particularly tightly with both marker ions (r of 0.86 and 0.80, respectively); it in fact also correlated well with K+ (r=0.79), another tracer of biomass-burning emissions. The and ratios of BBOA were 0.12 and 1.78, respectively, and ions accounted for 9.1 % of the BBOA, all suggesting that the factor was fresh and might be co-emitted with rBC. A relatively high ratio (0.033) was found for BBOA, which could be attributed to the large amounts of nitrogen-containing organic species in biomass-burning OA (Laskin et al., 2009). In addition, the size distribution of BBOA (Fig. 4a) (peak size ∼500 nm) was similar to that of biomass-burning BC-containing particles obtained using single-particle mass spectrometry in Shanghai (Gong et al., 2016).
The PMF analysis deconvolved a unique OA factor that was coated on rBC, namely WS-HOA. Firstly, the WS-HOA mass spectrum had a series of hydrocarbon ion fragments, and its time series correlated well with them (e.g., r of 0.90 and 0.92 for WS-HOA vs. and , respectively). Secondly, this factor correlated better (r=0.57) than the other five OA factors (all r<0.2) with aerosol liquid water content (ALWC) (Fig. 3j) . Thirdly, a previous study (Ye et al., 2017) that specially investigated the water-soluble fraction of OA via PMF analysis also separated an HOA factor that contained significant nitrogen-containing organic fragments, had the highest ratio among all the factors and correlated well with those nitrogenated fragments. The WS-HOA defined here showed similar characteristics, with the highest (0.037) among all the factors and tight correlations with nitrogen-containing fragments (r>0.80). Lastly, although WS-HOA had a relatively high (0.31) with remarkable contributions from C2H3O+ and , its correlations with these two ions were in fact not strong (r of 0.46 and 0.44, respectively), and WS-HOA had the lowest fraction of rBC fragments (0.9 %; note that rBC is hydrophobic) – even less than the two SOAs (Fig. 3d). Both results suggest that this factor is a collection of water-soluble primary OA species. The peak of the WS-HOA size distribution was ∼150 nm, close to that of the HOA-rich factor (Fig. 4a). Aqueous-phase-processed SOA (aqSOA) typically had a very high ratio (Xu et al., 2019), and the size distribution of aqSOA often presented a droplet mode, peaking at relatively large sizes (such as 500–600 nm) (Gilardoni et al., 2016; Wang et al., 2021; Ge et al., 2012). Therefore, the moderate (0.31) and small mode size of WS-HOA again show that it was not from aqueous-phase reactions but was more likely the water-soluble fraction of POA.
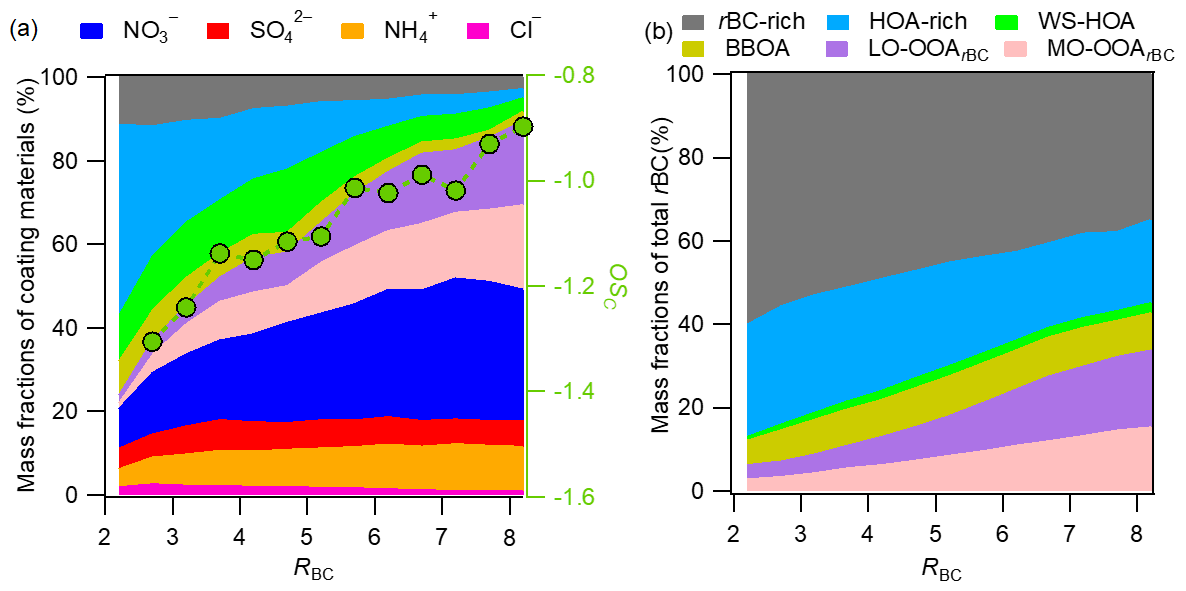
Figure 5(a) Plot of variations of the mass fractions of the major rBCc-particle components against RBC. (b) Plot of variations of the mass contributions of the individual rBCc-particle OA factors to rBC against RBC.
The PMF analyses separated two SOA factors, LO-OOArBC and MO-OOArBC. Mass spectral features of the two SOAs were consistent with previous studies: the LO-OOArBC was rich in ions (38.7 %) such as C2H3O+ at 43, but had less of a contribution from ions (7.6 %) and an overall moderate ratio (0.25), while MO-OOArBC had much more of a contribution from the ion family (22.7 %), such as at 44, and from ions (44.7 %), with a high ratio (0.56). In addition, LO-OOArBC correlated better with nitrate (r=0.83) than it did with sulfate (r=0.69), while the correlation between MO-OOArBC and sulfate (r=0.84) was better than that with nitrate (r=0.76). Size distributions of the two SOAs were also in accord with their secondary behaviors, with both accumulating at larger sizes (∼450 nm for LO-OOArBC, and a bit larger mode size of ∼500 nm for MO-OOArBC), in agreement with previous observations (Sun et al., 2012; Ulbrich et al., 2012; Zhou et al., 2016).
In total, traffic-related POA (the sum of the HOA-rich, rBC-rich and WS-HOA factors) was the most abundant source of rBCc-particle organics (39.1 %); BBOA provided ∼18.4 %; and the contributions of the two SOAs were on par with each other (20.2 % for LO-OOArBC and 22.3 % for MO-OOArBC) (Fig. 2g). Among the traffic POA, the gasoline-derived HOA-rich factor outweighed the diesel-derived rBC-rich factor (11.4 % vs. 6.3 % of the total rBCc-particle organics). The contributions of the different factors varied greatly for different sizes of rBCc particles (Fig. 4b). Small-sized particles were overwhelmingly dominated by traffic POA; SOA contributions increased with increasing size and dominated over POA for 300–800 nm particles; the contribution of BBOA was also larger for 300–800 nm particles than for other particle sizes; and the very large particles (800–1000 nm) were found to be affected mainly by traffic POA in this work. Correspondingly, for the total rBCc particles, rBC cores peaked at ∼170 nm, while other secondary inorganic components behaved like SOA factors, peaking at a big particle size (∼550 nm) (Fig. 4c), and their mass percentages were also large for large-sized particles (Fig. 4d).
Figure 5a further demonstrates the changes in the mass fraction of each rBCc-particle component as a function of RBC. RBC is a proxy for coating thickness. It was found that the thinly coated rBCc particles (RBC<3) were dominated (up to ∼80 %) by traffic-related POA. With increasing RBC, the contributions of secondary components increased gradually, especially the two SOAs and nitrate (sulfate showed little change across the whole RBC range); SOA and nitrate contributions reached 40.2 % and 31.3 % at RBC=8, respectively. Accordingly, the oxidation degree (OSc = 2 ⋅ -) (Kroll et al., 2011) of coated organics increased with RBC. In Fig. 5b, we present the mass contributions of the OA factors to the rBC mass at different RBC values. The rBC was, as expected, predominantly associated with POA (its contribution ranged from 94 % at RBC<2 to 66 % at RBC>8), similar to the results from Fontana (Lee et al., 2017). The contribution of the rBC-rich factor obviously decreased and those of the SOA factors increased with RBC. The contributions of the HOA-rich, WS-HOA and BBOA factors changed little.
3.2.2 Comparisons with NR-PM1 organics
As shown in Fig. S4, PMF analysis separated four OA factors for NR-PM1 organics. Two SOA factors (LO-OOA and MO-OOA) were resolved for both rBCc particles and NR-PM1, and their contributions to the rBCc particles and NR-PM1 were also similar (Fig. 2g and h). The correlations between the time series of the two LO-OOA factors and between the time series of the two MO-OOA factors were also tight (r of 0.94 and 0.90, respectively), indicating similar formation processes for each SOA. But, of course, the SOAs from rBCc particles and from NR-PM1 were not entirely the same, as those from the latter had higher O/C ratios (0.52 for LO-OOA and 0.62 for MO-OOA). On average, the LO-OOA coated on rBC corresponded to 21.6 % of the mass of LO-OOA in total NR-PM1, and this portion was 26.0 % for MO-OOA. This result suggests that there were some differences regarding the partitioning of LO-OOA and MO-OOA onto rBCc and non-rBC particles.
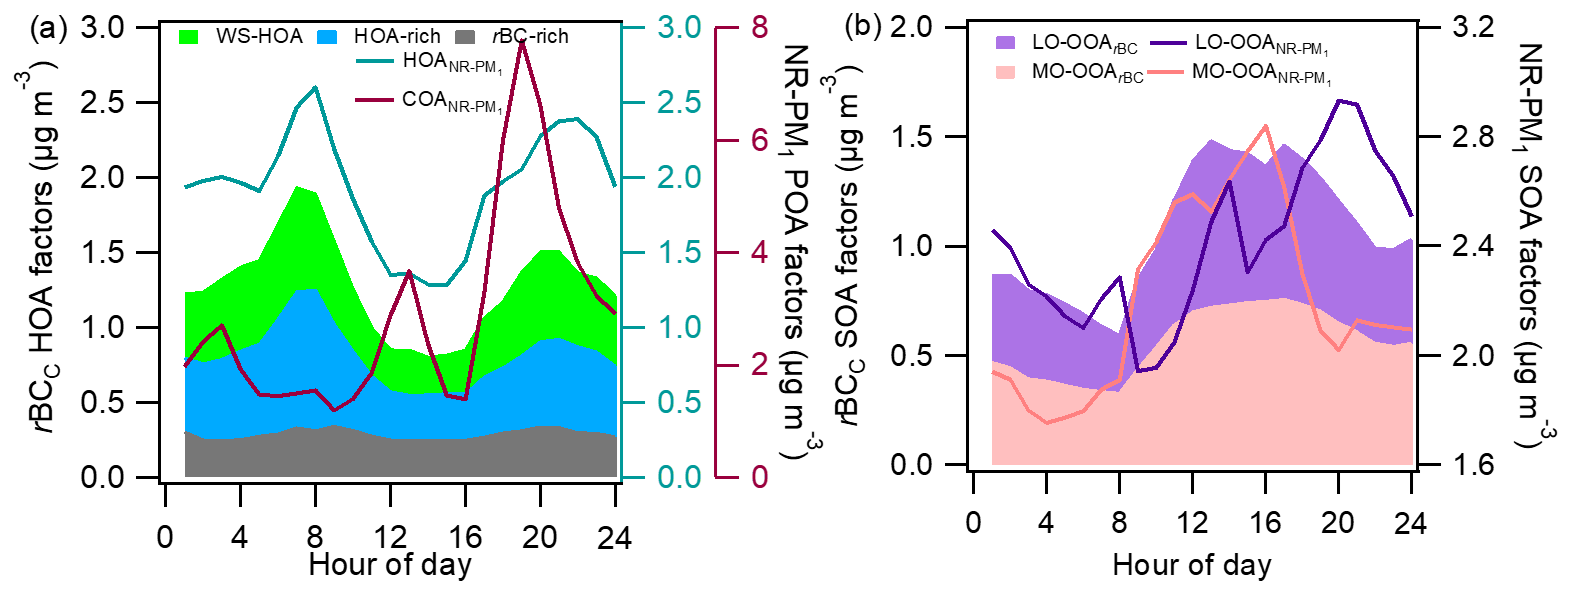
Figure 6Comparisons of the diurnal patterns of different POA factors (a) and SOA factors (b) of rBCc particles and NR-PM1.
Compared with the SOAs, the source apportionment results for POA were quite distinct. Firstly, only one HOA factor was resolved for NR-PM1, while three HOA factors were separated for rBCc particles. Note that the rBC-rich and WS-HOA factors occupied merely 3.1 % and 2.1 % of the NR-PM1 OA mass, respectively, which is probably why they were not identified in NR-PM1 OA. Nevertheless, the mass loading of the sum of the HOA-rich, rBC-rich and WS-HOA factors (termed HOArBC) agreed quite well with that of HOA (r=0.95) (Fig. S7), verifying both source apportionment results. Also, HOArBC took up 63.7 % of the HOA, while previous studies reported that 81 % (Massoli et al., 2012) and 87 % (Massoli et al., 2015) of the HOA were associated with rBC. These results imply that HOA species in NR-PM1 were largely internally mixed with rBC affected by vehicular emissions. Secondly, COA was only identified in NR-PM1 OA. AMS-resolved COA is mainly from cooking oil and food ingredients, so it negligibly internally mixes with rBC. This result is consistent with previous observations (Lee et al., 2015, ; Willis et al., 2016; Collier et al., 2018). Lastly, BBOA was identified in rBCc-particle OA but not in NR-PM1 OA. One plausible reason for this was that the BBOA mass contribution was minor (equivalent to <5 % of the NR-PM1 OA mass); therefore, it was not possible to separate it from other OA factors. Another speculation is that laser-only SP-AMS can detect refractory species that HR-AMS cannot, and a portion of those refractory species are likely rich in biomass-burning OA. BBOA was identified in rBCc particles rather than in simultaneously measured total NR-PM1 in Tibet (Wang et al., 2017) and Beijing (J. Wang et al., 2020). The role of this BBOA and its interplay with the rBC core remain a subject for future work.
The diurnal cycles of the POA and SOA factors from both PMF analyses are compared in Fig. 6a and b. The diurnal pattern of stacked HOArBC did indeed agree with that of HOA (both showed two peaks in the morning and evening rush hours), and the patterns of the rBC-rich, HOA-rich and WS-HOA factors showed similar behaviors individually (Fig. 6a). The diurnal variation of COA had pronounced peaks during lunch and dinner times, and its percentage in NR-PM1 OA reached 54 % at night. The diurnal patterns of the two LO-OOA factors were somewhat different (r=0.35) (Fig. 6b): LO-OOArBC had a major peak in the afternoon, while the LO-OOA concentration rose in the afternoon too but peaked in the early evening (∼ 20:00 LT). The daily variations of the two MO-OOA factors were similar (r=0.83), with both peaking at 16:00 LT. The afternoon increases in both SOAs indicate an important role of photochemical reactions; yet, differences in the formation mechanisms, volatilities and partitioning behaviors of SOA products could lead to diversity in their diurnal patterns and HRMSs.
3.3 Evolution and formation of rBCc-particle components
3.3.1 Behaviors of rBC cores
The size distribution of rBC cores (shown in Fig. 4c) was relatively wide. Besides the main peak at ∼170 nm, it extended significantly to large sizes and had a small peak at ∼550 nm, which was close to the peak of secondary components. Using the results shown in Fig. 5a, we found that small rBC cores were often thinly coated, while thickly coated rBCc particles were often highly aged and a portion of them also had large-sized rBC cores. This result likely arises because the oxidation of rBC-bound organics and/or the condensation of secondary species onto the rBC surface can induce the restructuring of soot aggregates to form compact and large cores (Chen et al., 2016, 2018). Such a phenomenon is in line with earlier studies (Liu et al., 2019; Gong et al., 2016). We further show an image plot of the size distribution of rBC at different RBC values in Fig. S8a. It was found that the rBC mass is to a large part concentrated in particles with an RBC of 5–8, and there was indeed a significant portion of the rBC that appeared in the large size range (400–800 nm) and had a very thick coating (RBC of 8–9).
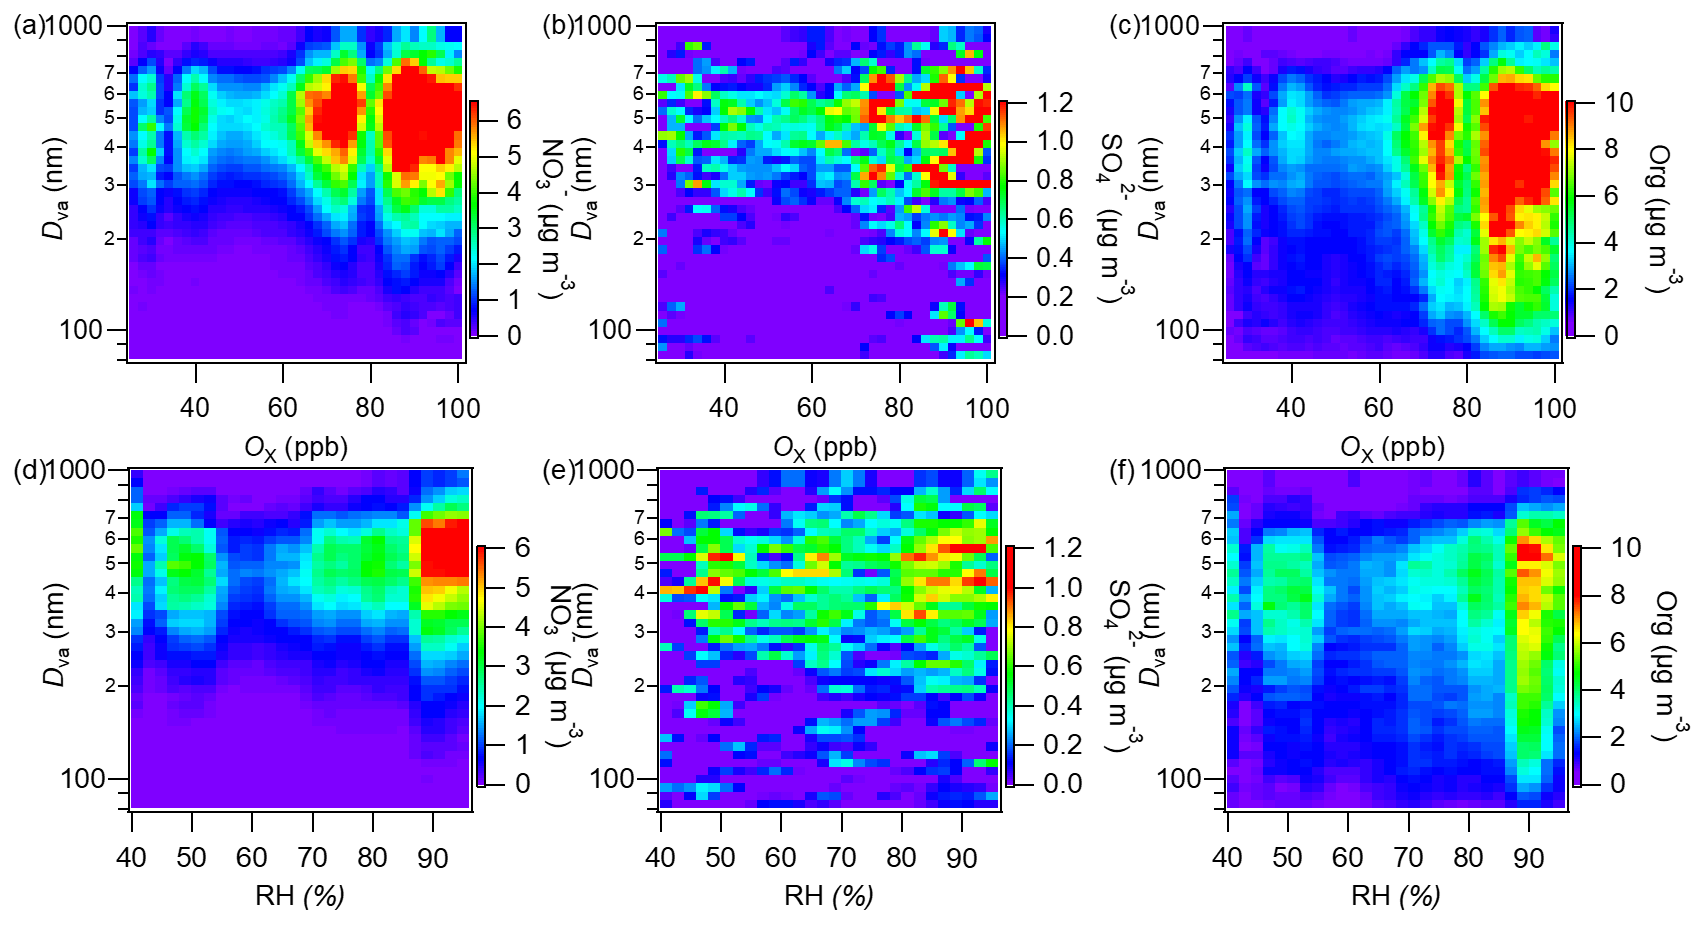
Figure 7Image plots of the size distributions of rBCc-particle nitrate, sulfate and organics as functions of (a–c) Ox and (d–f) RH, respectively (the color represents the concentration).
3.3.2 Formation of inorganic salts
Sulfate and nitrate both peaked at a big particle size (∼550 nm; Fig. 4c) and were mainly associated with thickly coated rBCc particles (RBC>6; Fig. S8d and e). To investigate the impacts of photochemistry and aqueous/heterogeneous chemistry on the formation of rBCCT species, we plotted image plots of the size distributions of nitrate, sulfate and organics versus Ox (O3 + NO2) and relative humidity (RH) in Fig. 7. Here, Ox is used as a proxy for photochemical activity (Xu et al., 2017) and RH is an indicator of aqueous reactions (Wu et al., 2018). Nitrate was significantly concentrated in the 65–100 ppb Ox range, but there was a weak accumulation at low Ox as well (Fig. 7a), while in Fig. 8d, nitrate shows a prominent hotspot at RH > 85 %. Generally, both strong photochemical activity and high RH could promote nitrate formation. For sulfate, although the distribution was scattered due to the low mass loadings, the high Ox level seemed to favor sulfate formation (Fig. 7b); sulfate was scattered across the whole RH range, and there were some enhancements at high RH (>80 %), but they were much less clear-cut (Fig. 7e). Therefore, the aqueous-phase production of sulfate was not important in this campaign.
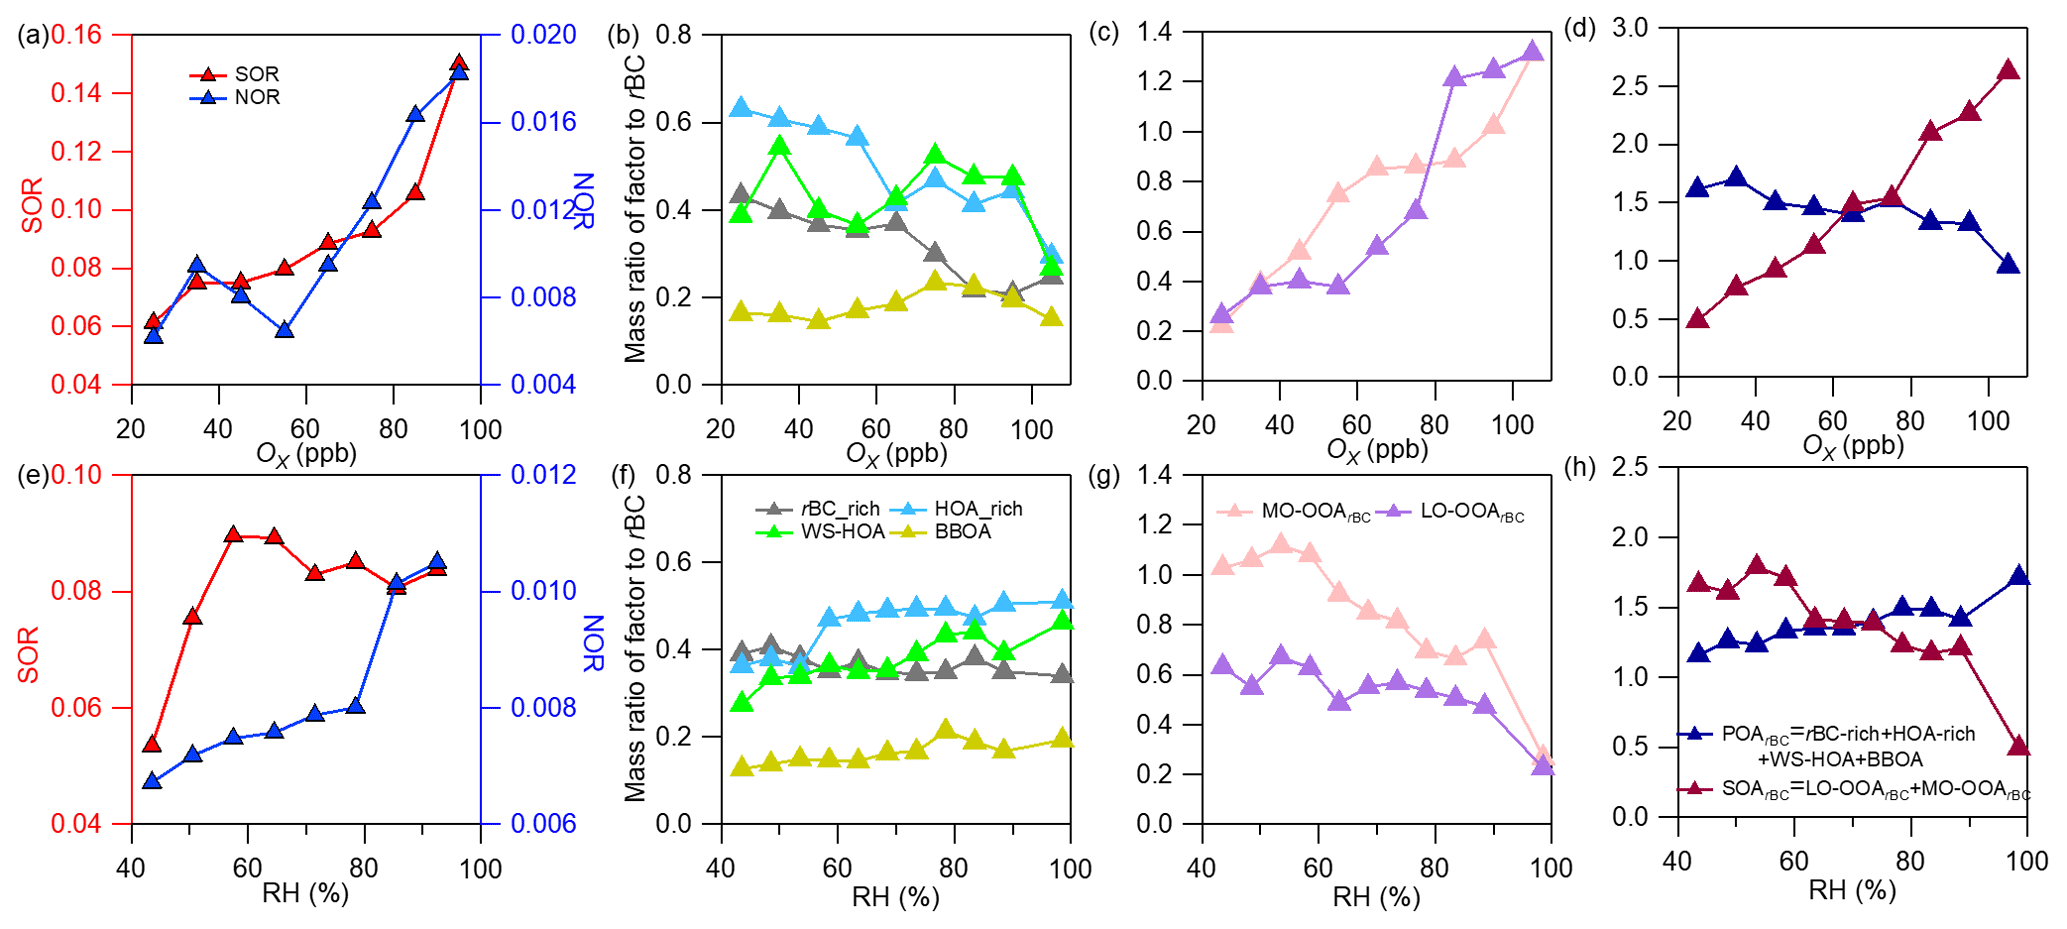
Figure 8Plots showing variations of the nitrogen oxidation ratio (NOR) and the sulfur oxidation ratio, the mass ratios of different POA factors and SOA factors and the total POA and total SOA to rBC against Ox (a–d) and RH (e–h) (NOR = ) and SOR = ), where , , nNO2, nNO and nSO2 are the molar concentrations of particle-phase sulfate, nitrate, gaseous NO2, NO and SO2, respectively).
We further calculated the sulfur oxidation ratio (SOR) and nitrogen oxidation ratio (NOR) (Xu et al., 2014), and their variations against Ox and RH are plotted in Fig. 8a and e, respectively. The NOR rose substantially at Ox>60 ppb but showed no increase at Ox<60 ppb, while it increased continuously with RH. The mass ratio of nitrate to rBC stayed at a high level during nighttime when RH was high as well (the overall diurnal trend in rBC was similar to that of RH, see Fig. S9a and d). This result indicates a likely more important role of nocturnal nitrate formation (N2O5 hydrolysis) (Pathak et al., 2011; Sun et al., 2011) than photochemical production of nitrate during this campaign; moreover, a low temperature and high RH favor nitrate partitioning into the particle phase during nighttime too (Gao et al., 2011). For sulfate, the SOR increased with Ox, while it increased with RH under relatively dry conditions (<60 %) but decreased with RH when RH > 60 %. This result, on the other hand, highlights that photochemical production is more important than aqueous/heterogeneous formation for sulfate. In addition, the mass ratio of sulfate to rBC was enhanced remarkably during daytime and peaked in the afternoon (Fig. S9e), supporting a key role of the photochemical formation of sulfate. The sulfate precursor SO2 was at a high level during daytime too. The main formation pathway of sulfate is strikingly different from that observed in winter in Nanjing (Wu et al., 2018), suggesting significant seasonal variability of sulfate formation, even in the same region.
3.3.3 Evolution of organics
Organics had a broad average size distribution (Fig. 4c) but, unlike rBC, their main peak appeared at 500–600 nm. Figure S8b shows that the majority of organics partitioned in rBCc particles with RBC values of 5.0–9.0 and a wide size coverage (300–800 nm). Regarding their dependences on Ox and RH, they mainly accumulated at Ox>70 ppb (Fig. 7c) and at very high RH (∼90 %) (Fig. 7f). Consistent with this, the ratio and OSc both peaked in the afternoon (Fig. S9b), all of which suggests a critical influence of photochemistry on the behavior of organics.
Figure 8 illustrates the variation in the mass ratio of each OA factor to rBC with Ox and RH. The mass ratios of all four POA factors generally presented decreasing trends (despite some fluctuations) against Ox (Fig. 8b), and the total POArBC showed an evident decrease with increasing Ox (Fig. 8d). In contrast, both LO-OOArBC and MO-OOArBC, as well as their sum (SOArBC), increased continuously with Ox (Fig. 8c and d). This result proves that photochemical oxidation contributed significantly to both LO-OOArBC and MO-OOArBC formation. Comparatively, decreases in POArBC perhaps point to its reaction loss upon photochemical oxidation. With regard to the RH, besides WS-HOA, the other three POArBC factors showed almost no dependence on RH (Fig. 8f); note that the increase of WS-HOA with RH did not indicate aqueous production of WS-HOA (see the discussion in Sect. 3.2.1), but was a result of enhanced dissolution with increasing moisture. An overall small increase of POArBC (Fig. 8h) with RH was mainly attributed to WS-HOA. Contrary to the trends seen with Ox, the mass ratios of the two SOA factors as well as the total SOA to rBC went down with increasing RH (Fig. 8g and h), indicating a trivial role of aqueous/heterogeneous oxidation in the SOA coated on rBC observed during this campaign.
The aging of OA is generally characterized by an increase of and a decrease of (Ng et al., 2011; Zhao et al., 2019). The different aging pathways of OA follow different slopes in the Van Krevelen (VK) diagram (Heald et al., 2010). For example, the addition of only one oxygen atom to the carbon skeleton results in a slope equal to 0, while the replacement of the hydrogen atom with a carboxylic acid group (−COOH) results in a slope of −1 without fragmentation (C–C bond breaking) and −0.5 with fragmentation (Heald et al., 2010; Ng et al., 2011; Zhao et al., 2019). As presented in Fig. 10a, fitting all the OA data yielded a slope of −0.96, very close to −1, suggesting that the OA aging process resembled hydrogen substitution with a −COOH group (carboxylation). Interestingly, the four OA factors (the HOA-rich factor, WS-HOA, LO-OOArBC and MO-OOArBC) were aligned almost in a straight line with a slope of −0.77 (Fig. 9a): also close to −1. Figure S10 further reveals that there was a strong anticorrelation between the mass fractions of the sum of the HOA-rich factor and WS-HOA and the sum of LO-OOArBC and MO-OOArBC (); the slope of the fitted line was −0.86. All these results suggest that OA evolution may involve a channel of photochemical transformations from the HOA-rich factor and WS-HOA to LO-OOArBC and then to MO-OOArBC. This result is also in line with the observed decrease of POArBC and increase of SOArBC against Ox.
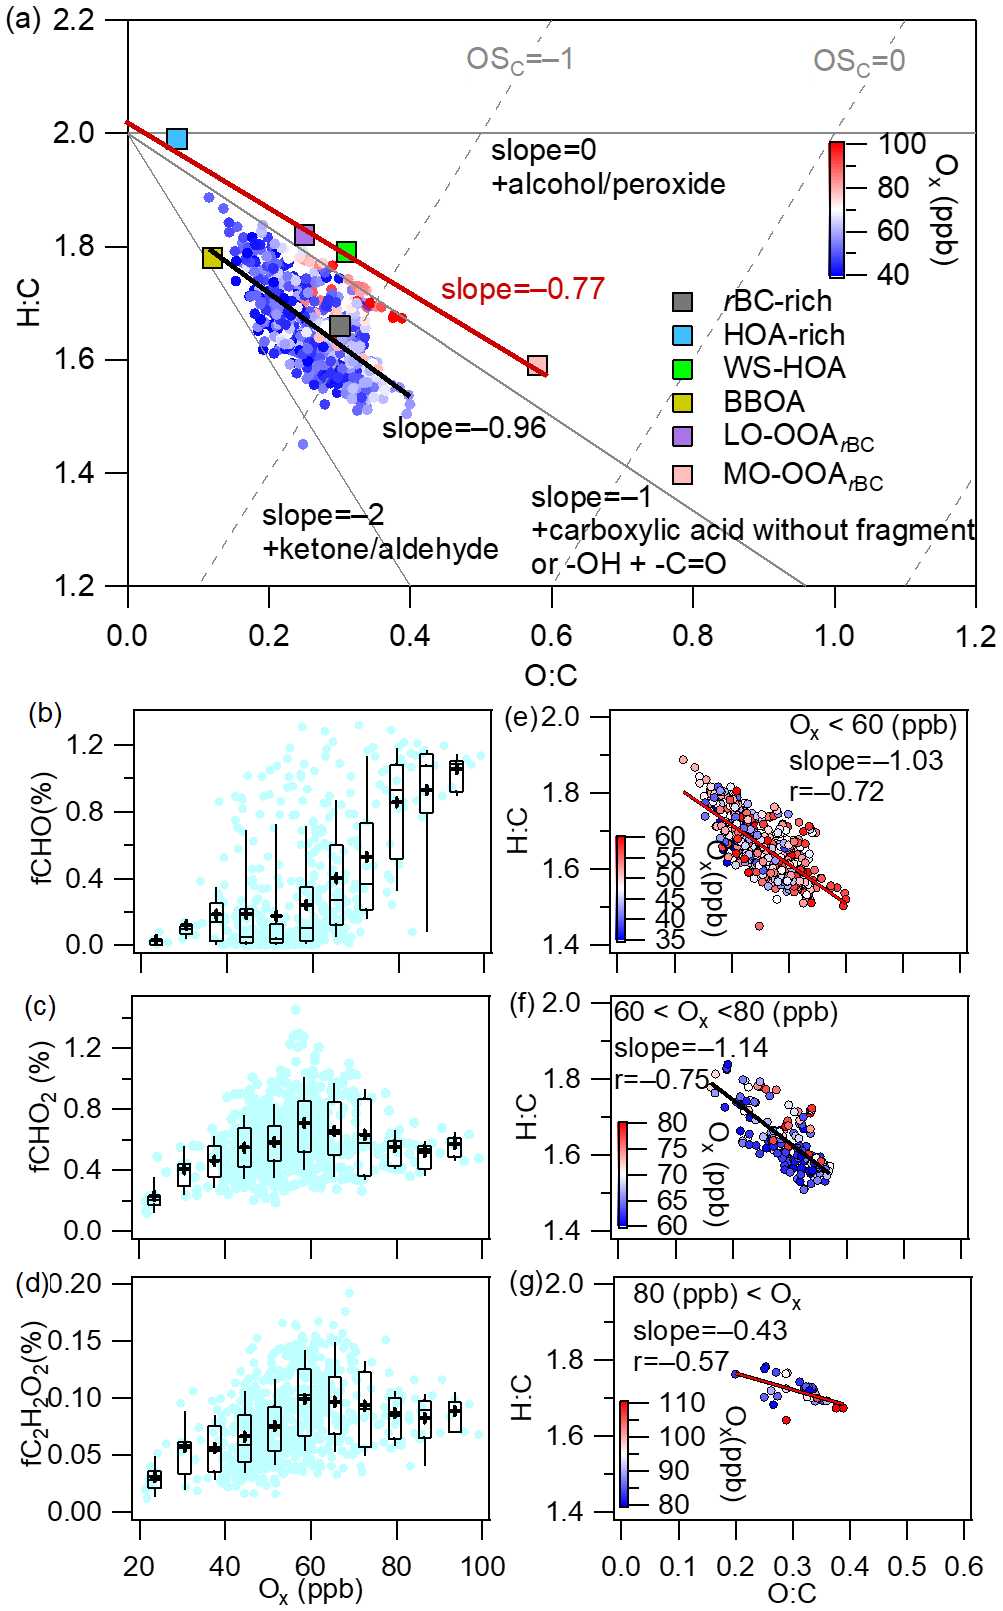
Figure 9(a) Van Krevelen diagram of the ratio versus the ratio for all rBCc-particle OA and the six factors colored by Ox concentration (the black line represents the linear fit to all OA data, and the red line is the fit to the four OA factors). (b–d) Mass fractions of selected oxygenated ion fragments as a function of Ox (the meanings of the boxes are the same as those described for Fig. 2). (e–g) Scatter plots of the ratio versus the ratio at different Ox levels (data are colored by Ox concentration).
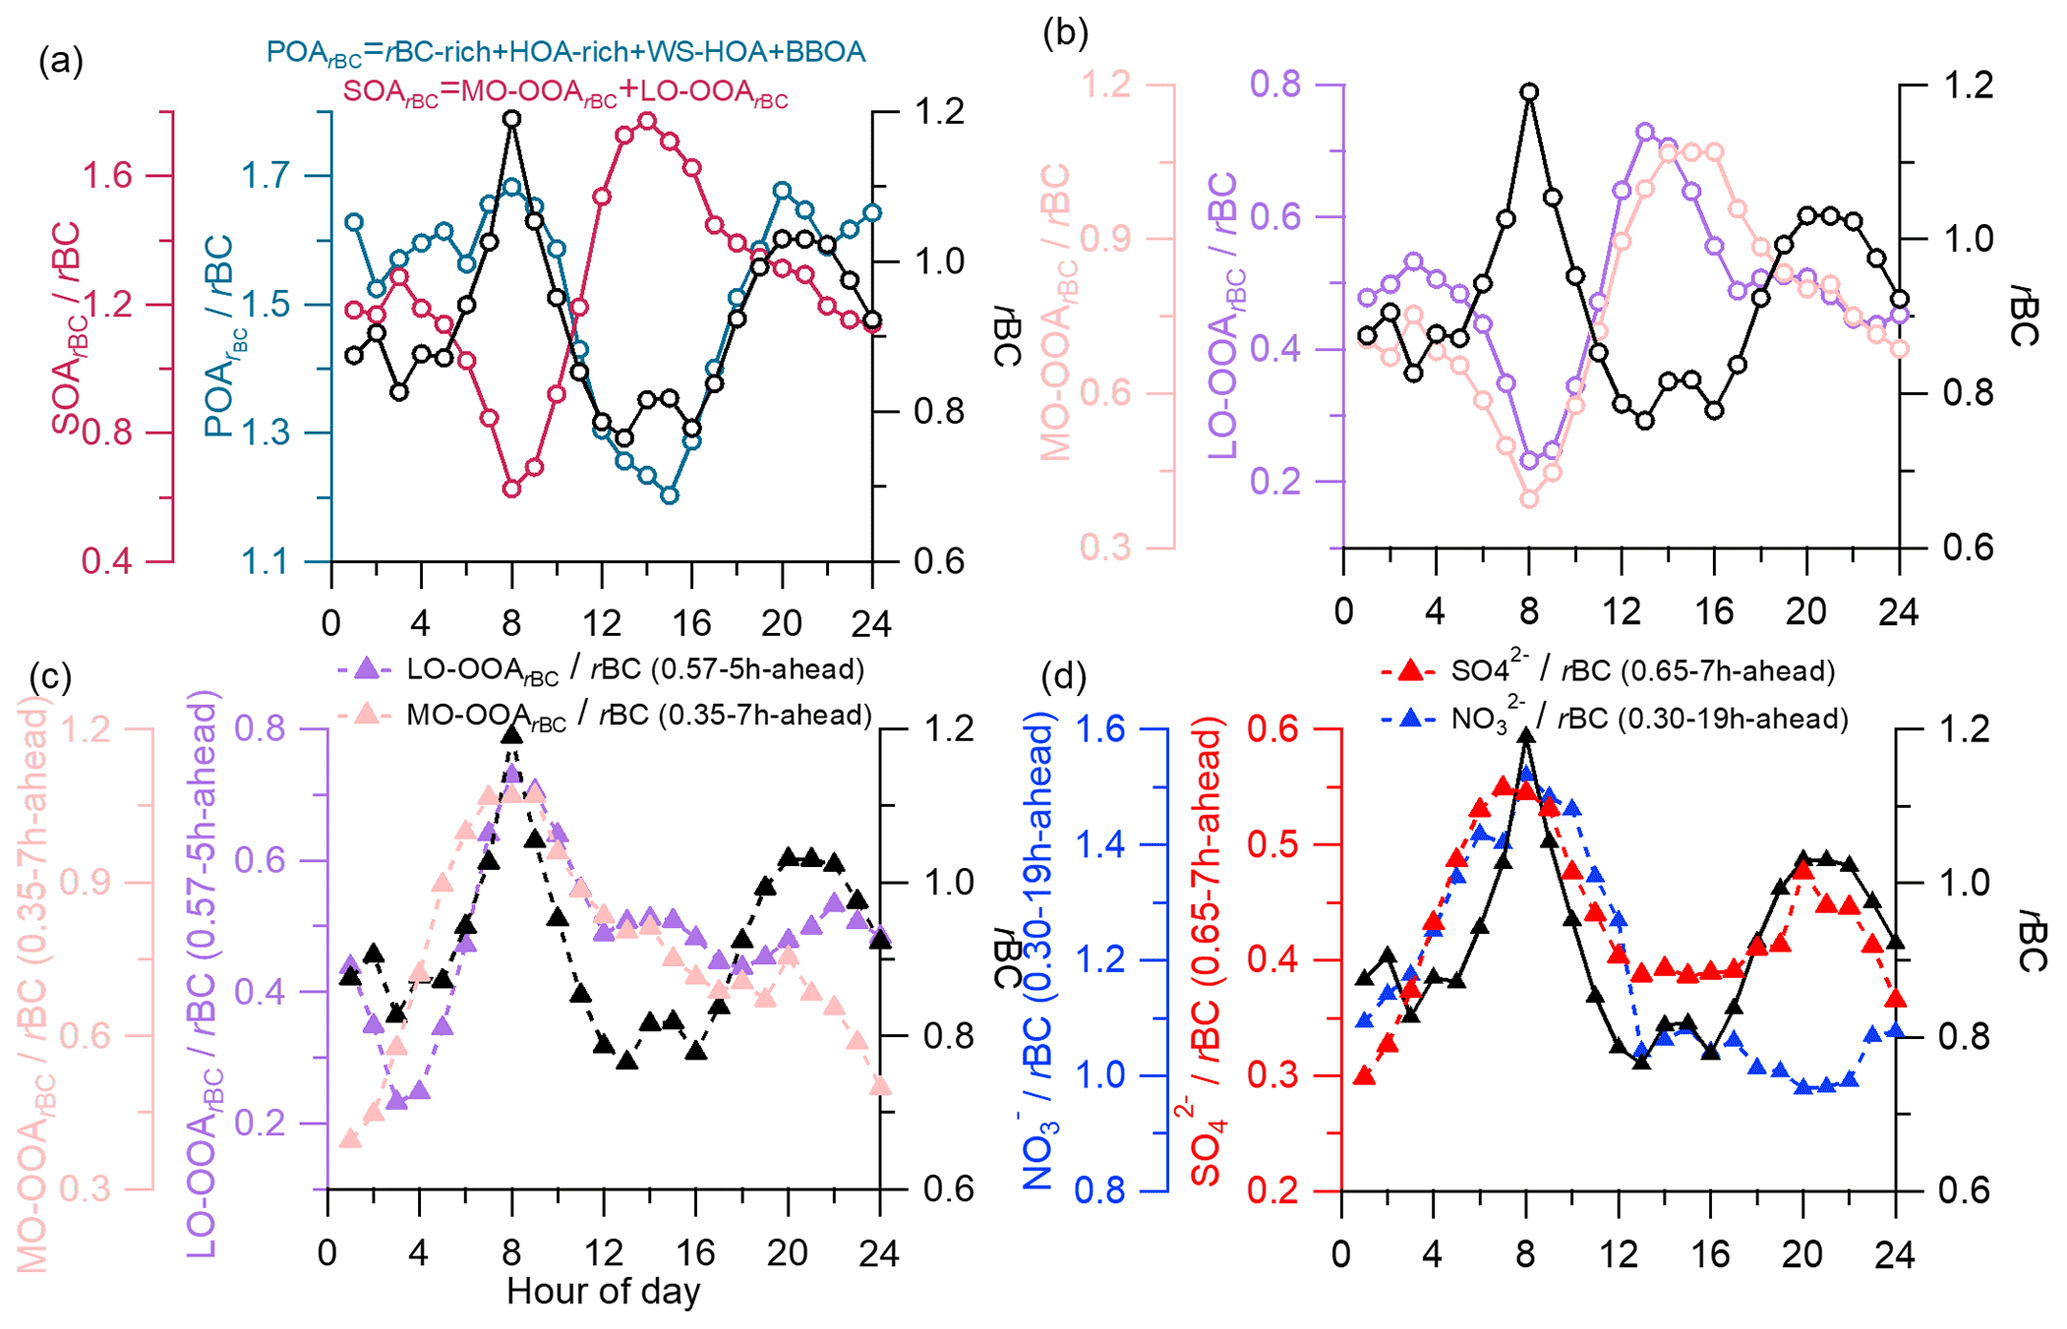
Figure 10Campaign-average diurnal patterns of (a) rBC, POArBC and SOArBC and (b) rBC, MO-OOArBC and LO-OOArBC. Diurnal patterns adjusted for the average coating time (ACT) for (c) LO-OOArBC and MO-OOArBC and for (d) rBC and rBC.
CHO+, and are the AMS tracer ions for carbonyl, carboxylic acid and glyoxal, respectively (S. Wang et al., 2020; Canagaratna et al., 2015a; Yu et al., 2014). The mass fractions of these three fragment ions presented decreasing trends (or no clear trends) against RH (Fig. S11), suggesting again that aqueous processing is not an important pathway in OA evolution during this campaign. Conversely, the fractional contributions of these three ions presented increasing trends versus Ox, supporting the dominance of the photochemical oxidation pathway (Fig. 9b–d). Figure 9e–g show scatter plots of vs. at different Ox concentrations. The regressed slope was −1.03 for low-Ox (<60 ppb) conditions (Fig. 9e), indicating that the OA aging at low Ox levels is mainly analogous to the carboxylation process. This result corresponds precisely to the fact that the mass fractions of and increased gradually with Ox at low Ox, whereas that of CHO+ remained essentially unchanged (Fig. 9b–d). The fitted slope was −1.14 for moderate Ox conditions (60–80 ppb); this changed to −0.43 for high Ox levels (>80 ppb), but the correlation became weaker (). This result implies that the OA evolution under high-Ox conditions might include oxidations by the addition of alcohols and peroxides and carboxylation. In all, the evolution of rBCc-particle OA in Shanghai during this campaign was governed by photochemistry rather than aqueous chemistry, but with different oxidation pathways at different Ox levels.
3.3.4 Coating times of secondary species onto rBC
Although the rBCc-particle organics were dominated by primary sources (Fig. 2g), the diurnal variations of OSc, and of the total organics were controlled predominantly by the two SOA factors. Correlations between the diurnal cycles of MO-OOArBC and OSc were extremely strong (r=0.97 with OSC and r=0.98 with ), and those of LO-OOArBC were also tight (r=0.91 with OSC and r=0.92 with ). The correlations with LO-OOArBC were a bit weaker than those of MO-OOArBC, indicating that MO-OOArBC was probably the final product and was more important in governing the overall oxidation level of the organic coating. Figure 10a depicts the diurnal variations of SOArBC and POArBC. The diurnal variations of POArBC and rBC were similar overall, while the daily pattern of SOArBC was almost opposite to that of rBC. This result likely indicates that most POArBC species were co-emitted and coated rBC cores originally, so the coating process during the rBCc particle lifecycle was mainly relevant to SOA species rather than POA species. This process occurs mainly through photochemical reactions, including in situ oxidation of originally coated POA species (for example, oxidation of the HOA-rich factor plus WS-HOA to LO-OOArBC and then to MO-OOArBC) and partitioning of secondary species formed in gas-phase reactions onto the rBC surface. In addition, sulfate and nitrate were both formed secondarily, but sulfate was dominated by photochemical production while nitrate was governed by nocturnal heterogeneous formation (as discussed in Sect. 3.3.2); their different diurnal patterns (Fig. S9) point to different coating processes too.
In this regard, we hereby propose the concept of the average coating time (ACT), which is used to roughly estimate the timescales required for secondary components to be coated onto rBC. The specific method is listed as follows:
-
Move the diurnal variation of SArBC (SA represents a secondary aerosol species) forward by n hours to get a new SArBC diurnal pattern labeled “SArBC(r-nh-ahead)”. Here, the r value is the linear correlation coefficient between the new SArBC diurnal pattern and that of rBC.
-
Choose the best correlation coefficient (r-nh-ahead), where nh corresponds to the ACT for this secondary component.
It should be noted that the diurnal pattern of rBC might be affected by the changes in the planetary boundary layer (PBL) height, so that a low PBL height could lead to high rBC concentrations during nighttime. We thus used SArBC rather than SArBC here to perform the correlation analyses with rBC. The relative variability of secondary species to rBC might be a good way to eliminate the impacts of the PBL and better represent the coating process. Nevertheless, one should be cautious, as this treatment is only a rough approximation of the coating process. Diurnal patterns of LO-OOArBC and MO-OOArBC are depicted in Fig. 10b. They were both opposite to the trend in rBC, and they were similar to each other, except that MO-OOArBC peaked hours later in the afternoon, signifying that MO-OOArBC needs a longer time to coat rBC than LO-OOArBC does, which is consistent with the fact that MO-OOArBC was more aged. Correspondingly, we obtained an ACT of 7 h for MO-OOArBC (0.35–7 h-ahead) and 5 h for LO-OOArBC (0.57–5 h-ahead) (Fig. 10c) using the method described above. The ACTs of sulfate (0.65–7 h-ahead) and nitrate (0.30–19 h-ahead) were 7 and 19 h, respectively (Fig. 10d). The results suggest that the rBC emitted mainly in the morning rush hours requires a few hours to be adequately coated by LO-OOArBC, MO-OOArBC and sulfate, as these three species are mainly produced in the afternoon by photochemical reactions, while photochemical production of nitrate is insignificant, so rBC was coated by nitrate until late at night when nitrate was formed efficiently by heterogeneous N2O5 hydrolysis. Note that the best r values were not high (for example, 0.35 for MO-OOArBC and 0.30 for nitrate), yet the adjusted trends in all secondary components (Fig. 10c and d) matched that in rBC quite well during 03:00–12:00 LT (r of 0.90, 0.91, 0.84 and 0.84 for MO-OOArBC, LO-OOArBC, sulfate and nitrate, respectively), likely meaning that daytime variations of two SOAs and sulfate were indeed controlled by the coating process while the governing factors of their nighttime variations might be complex, and vice versa for nitrate.
3.4 Size-resolved hygroscopicity of rBCc particles
By using the method in Sect. 2.3, we calculated the size-resolved hygroscopicity parameters for the total rBCc particles (κrBCc) and the coating materials (κCT) across the whole campaign. The image plots are illustrated in Fig. 11a and b. Generally, large κrBCc and κCT values occurred at big particle sizes, and this result was similar overall to that obtained in Nanjing during winter (Wu et al., 2019). We further illustrate the size-resolved κrBCc as a function of RBC in Fig. 11c. The figure shows that, overall, κrBCc became larger with increasing particle size regardless of the coating thickness. However, there were some relatively high (though not significant) κrBCc values in the range of 80–150 nm (bottom left and bottom right in Fig. 11c).
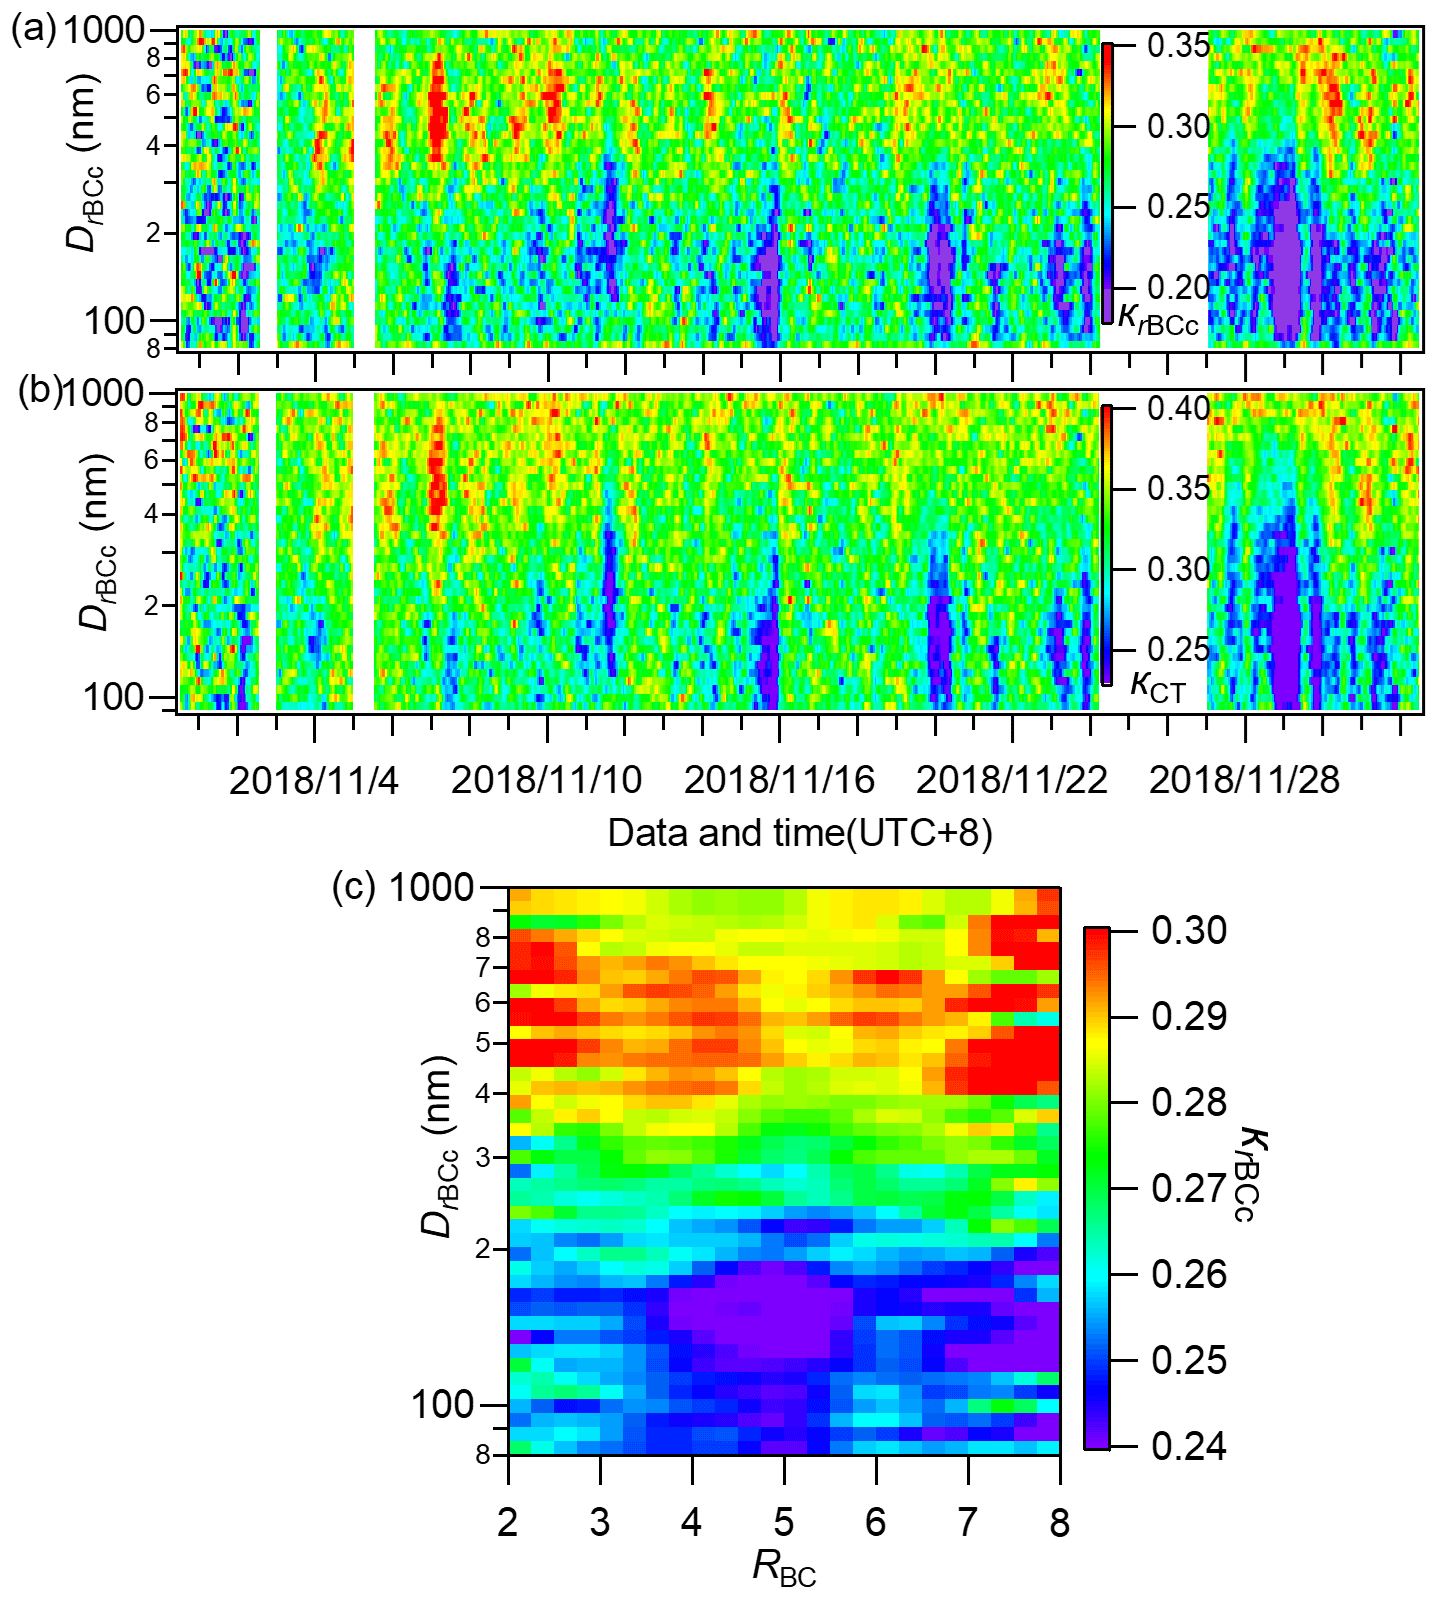
Figure 11Image plots of the size-resolved hygroscopicity parameters of (a) rBCc particles (κrBCc) and (b) their coating materials (κCT) during the whole campaign, and (c) the campaign-average size-resolved κrBCc at different RBC values.
In Fig. 12a and b, we further present the average size-resolved κrBCc and κCT as a function of the coated diameter (DrBCc). Both the κrBCc and κCT values were relatively high at DrBCc<100 nm and presented slight decreases from 100 to 150 nm. This is distinct from those observed in Nanjing, where κCT increased with DrBCc from 50 nm (Wu et al., 2019). From Fig. 4b and d, it can be seen that rBCc particles with DrBCc<150 nm were dominated by the portions of ammonium and sulfate (8 %–10 %) and organics (∼60 %), and those organics were dominated by WS-HOA. Such a composition explains the relatively high hygroscopicity at DrBCc<150 nm, as both ammonium sulfate and WS-HOA are hydrophilic; a slight decrease of the hygroscopicity from 100 to 150 nm DrBCc was also a response to the decreased mass contributions of ammonium sulfate and WS-HOA (and the increase in the hydrophobic HOA-rich factor contribution).
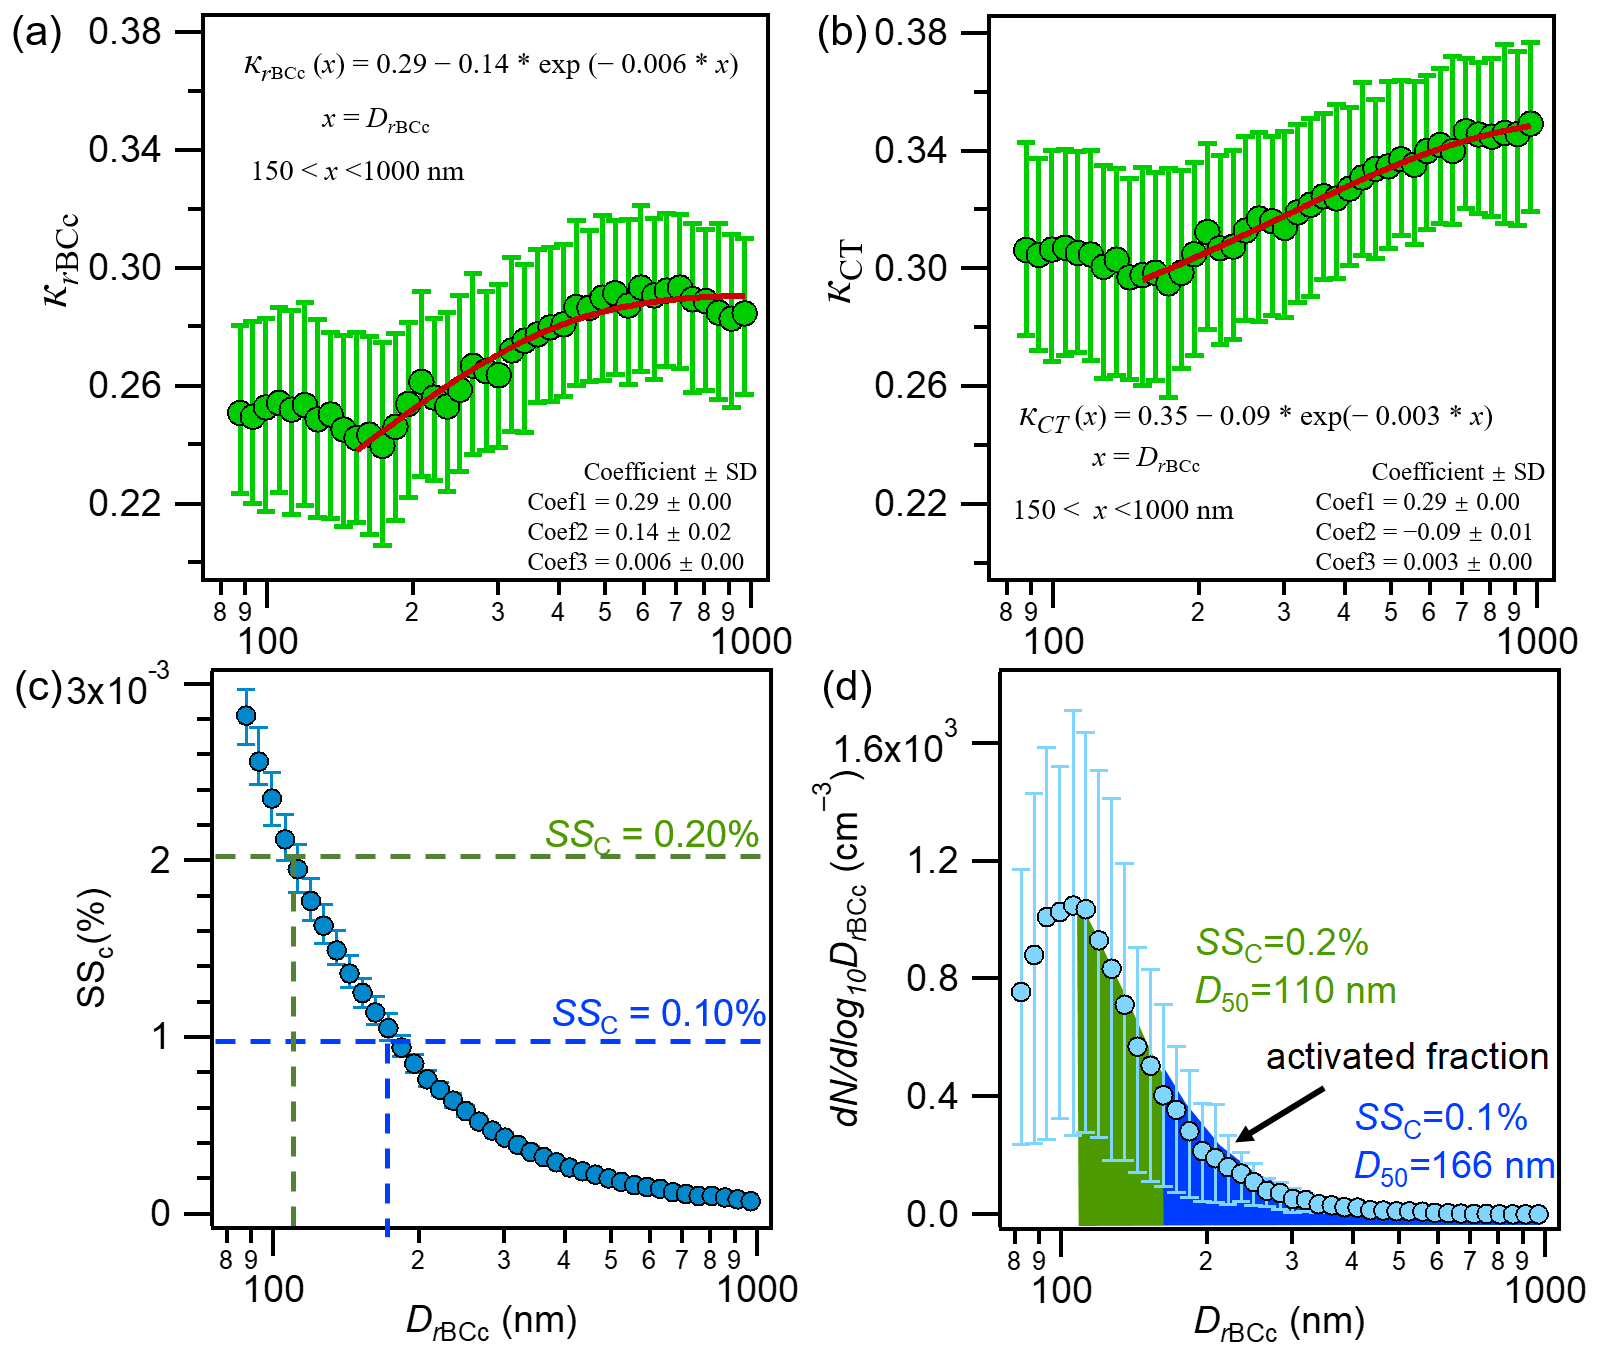
Figure 12Campaign-average size-resolved hygroscopic parameters for rBCc particles (κrBCc) and (a) for their coatings (κCT) (b) (the red lines are exponential fits of the data for 150–1000 nm). (c) Campaign-average size-resolved critical supersaturation (SSC) and (d) the predicted activated fraction of the rBCc-particle number concentration based on D50 at SSC values of 0.1 % (166 nm) and 0.2 % (110 nm) (the solid circles are mean values and the upper and lower lines are the 75th and 25th percentiles, respectively).
Figure 12a and b also provide the fitted exponential functions for the mean κrBCc and κCT with DrBCc. The equations are: and (x is DrBCc, nm). Here, 0.29 and 0.35 are the upper limits of κrBCc and κCT, which are higher than those reported for Nanjing (0.28 and 0.30 for κrBCc and κCT, respectively); yet, the rates of increase in κrBCc and κCT with DrBCc are 0.14 and 0.09, respectively, which are much lower than those from Nanjing (0.35 and 0.27 for κrBCc and κCT, respectively) (Wu et al., 2019). A smaller increase in the contribution of hydrophilic secondary species from 150 to 1000 nm in Shanghai than from 100 to 1000 nm in Nanjing is likely the cause of the smaller rates of increase in hygroscopicity parameters. In addition, it should be noted that the hygroscopicity is not only determined by the bulk composition; it is also affected by the phase state of the particles. For instance, a recent study revealed that the hygroscopic growth of phase-separated particles (with ammonium sulfate cores) can be reduced by secondary organic shells and is dependent on the thickness of the organic coating (Li et al., 2021).
The critical supersaturation (SSC) for a selected dry diameter (DrBCc, measured by SP-AMS) of an rBCc particle with a hygroscopicity parameter κrBCc can be calculated by the κ-Kohler theory equation (Petters and Kreidenweis, 2007). Based on the size-resolved κrBCc, the CCN activation diameter (D50) of particles at a given critical SSC can be calculated (Wu et al., 2019). Then, by combining the measured rBCc-particle number size distribution and the D50 value, the activation fraction (fAC) of the rBCc-particle number population (i.e., the fraction greater than D50) can be obtained. Figure 12c shows SSC as a function of DrBCc for the entire sampling period, which was used to obtain the D50 at a specific SSC. The D50 values of the rBCc particles were determined as 166 (±16) nm and 110 (±5) nm for SSC values of 0.1 % and 0.2 %, respectively. These two D50 values are smaller than those determined for rBCc particles in Nanjing (Wu et al., 2019), likely owing to the presence of WS-HOA in Shanghai. Figure 12d shows that the fAC at an SSC of 0.1 % (D50 of 166 nm) was 16 (±3) % and the fAC at an SSC of 0.2 % (D50 of 110 nm) was 59 (±4) %.
3.5 A case study influenced by ship emissions
3.5.1 Potential source areas of rBCc particles
To explore the potential geographic origins of rBCc particles at the receptor site, the hybrid single-particle Lagrangian integrated trajectory (HYSPLIT) model (version 4.9) was applied here (Petit et al., 2017). The backward trajectories were classified into four air mass clusters (Fig. S12a), including one long-range transport from the northern sea (Cluster1), one long-range transport from the northeastern sea (Cluster2), a local one from eastern ports (Cluster3), and one from the northwestern inland region (Cluster4). The four clusters occupied 23.8 %, 33.8 %, 37.3 % and 5.0 % of the total trajectories, respectively. It is clear that the sampling period was influenced by offshore air masses most of the time (95 %). Cluster3 had the highest mean rBCc-particle concentrations (13.2±10.9 µg m−3), while the mean concentrations of the other three clusters were apparently lower (4.3–5.2 µg m−3). This result is plausible, as Cluster3 was the shortest in length and therefore the least diluted of the clusters. The average chemical compositions of the rBCc particles from the four clusters (Fig. S12b) showed some differences as well: Cluster1 and Cluster2 had higher MO-OOArBC contributions, possibly owing to the interceptions of more aged SOA species during the long-range transports; also, Cluster4 had a lower MO-OOArBC but a slightly higher POArBC contribution, which is likely attributable to the emission of more primary species in inland regions (similarly, the higher fraction of nitrate was likely because of enhanced NO2 emissions).
3.5.2 A typical case of rBCc particles affected by ship emissions
Ship emissions are found to have an important impact on the air quality of Shanghai and the Yangtze River Delta (Zhao et al., 2013; Fan et al., 2016; Z. Liu et al., 2017; Chen et al., 2019). Ship engines usually burn heavy fuel oil (HFO), and vanadium (V) and nickel (Ni) can be adopted as reliable tracers for ship-emitted particles (Ault et al., 2009, 2010; Moldanová et al., 2009). The long-term variation of the ratio in ship-emitted particles in Shanghai has recently been reported (Yu et al., 2021). The main conclusion was that the ratio was close to 0.4 in 2018, while it became greater than 2.0 in 2020. Our measurements were carried out in 2018, and we therefore chose the period from 3 to 5 November as a typical case affected by ship emissions (the SEP period), since the average ratio was ∼0.50 and high concentrations of both Ni and V were found. Figure S13 shows the concentration-weighted trajectories (CWT) of the ship emission tracers (V, Ni), rBC and the rBC-rich factor during the SEP, which show that these components came mainly from the sea. During the SEP, the correlation coefficient (r) between V(Ni) and rBC was 0.69 (0.74), indicating that the SEP was indeed impacted by ship emissions.
Figure 13 displays the chemical characteristics of the rBCc-particle and NR-PM1 components (especially the OA factors), V and Ni, gaseous pollutants and the meteorological parameters during the SEP. As a comparison, we also selected a period with no ship emissions that had the same time span as the SEP (from 00:00 LT on 10 November to 00:00 LT on 12 November, termed the “non-SEP”), and a similar plot for the non-SEP is presented in Fig. S14. During the SEP, the wind blew mainly from the east, and the average wind speed was ∼0.5 (±0.3) m s−1; Wusong, Luojing and Waigaoqiao ports located northeast of the sampling site (Fig. S1). However, the wind was mainly from the north during the non-SEP. During the SEP, the average mass concentrations of V and Ni were 6.3 (±3.1) ng m−3 and 3.2 (±1.4) ng m−3, respectively, while those during the non-SEP were only 2.9 (±1.4) ng m−3 and 2.6 (±1.6) ng m−3. The average mass ratio of during the SEP was 2.0, in agreement with those reported for ship-influenced PM1 (Mazzei et al., 2008; Mar et al., 2009) and within the range of 1.9 to 3.5 for domestic HFO (Zhao et al., 2013), while the average ratio of (1.1±0.8) during the non-SEP was outside the range. Moreover, the major air pollutants emitted from ships include nitrogen oxides (NOx), sulfur oxides (SO2), carbon monoxide (CO), hydrocarbons and primary/secondary particles (Becagli et al., 2017; Wu et al., 2021). As demonstrated in Figs. 13b and S14b, the SO2 concentration was higher overall during the SEP (not including 10:00–16:00 LT on 11 November), while the mass loading of NO2 was higher during the rush hours of the non-SEP but higher at night (no traffic) during the SEP. The mass proportion of sulfate in NR-PM1 during the SEP was also higher than that during the non-SEP (22.7±8.1 % vs. 19.1±5.3 %), but vice versa for nitrate (17.8 (±9.9) % during the SEP vs. 26.2 (±9.1) % during the non-SEP).
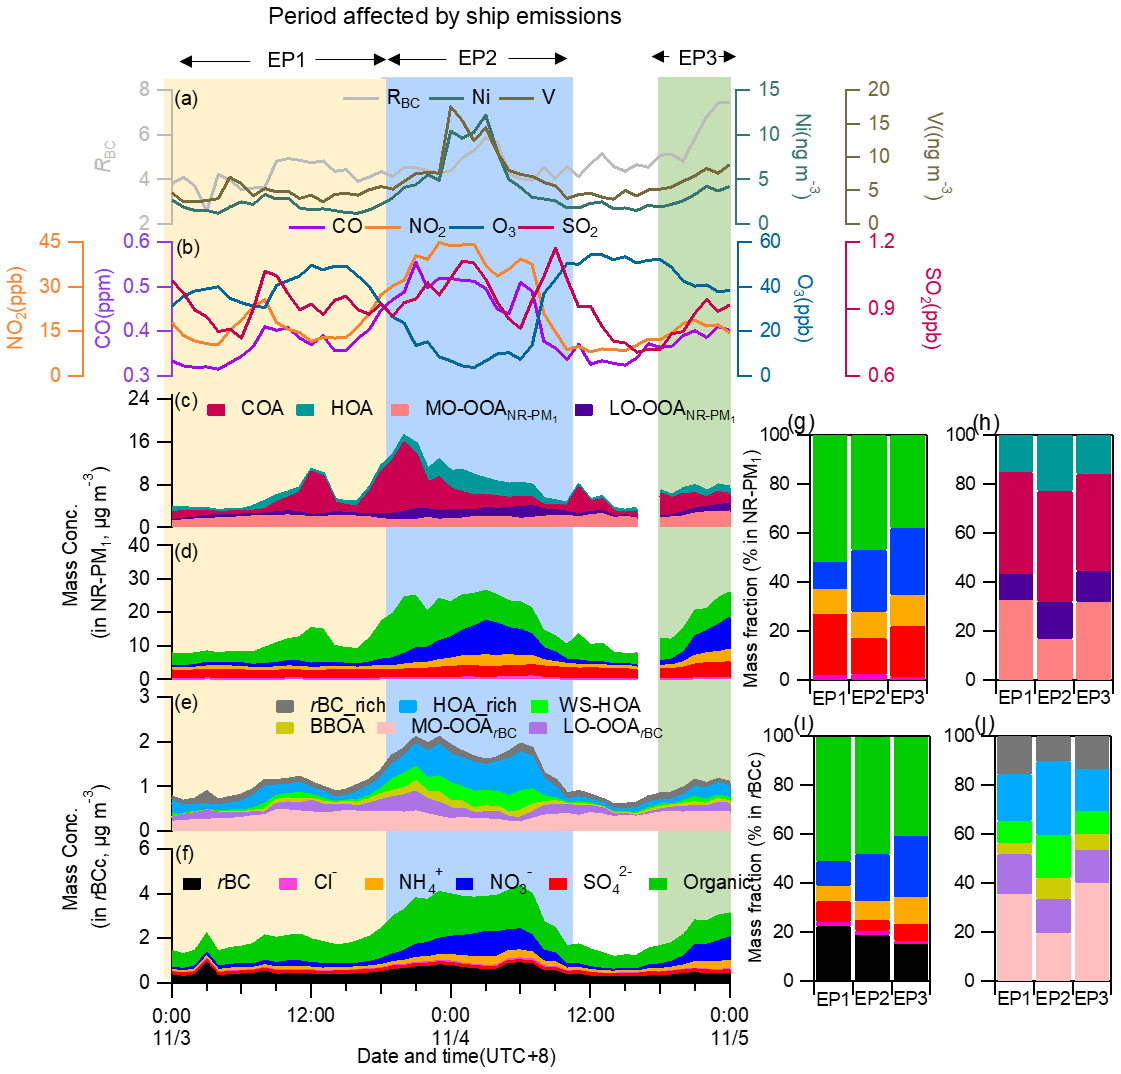
Figure 13Time series of (a) the mass concentrations of particle-phase Ni and V and RBC; (b) the mass concentrations of CO, NO2, O3 and SO2; and the stacked concentrations of (c) NR-PM1 OA factors, (d) NR-PM1 species, (e) rBCc-particle OA factors and (f) rBCc-particle components during the ship emission period (SEP). Mass contributions of (g) different components to NR-PM1, (h) different OA factors to the total NR-PM1 OA, (i) different components to rBCc particles and (j) different OA factors to the total rBCc-particle OA for the three episodes (EP1, EP2 and EP3).
We further investigated the dependences of rBCc-particle and NR-PM1 species on V during the SEP and non-SEP, as shown in Fig. S15. Here, we only used V, since the Ni level might be influenced by other emission sources such as the refining industry (Jang et al., 2007; Kim et al., 2014) in urban Shanghai, and Ni still presented a good correlation with rBC during the non-SEP (r=0.80). During the SEP, V concentrations (most of them were >4 ng m−3) positively correlated with both sulfate and nitrate (except for rBCc sulfate) overall (Fig. S15a). Considering that the V concentration was independently measured for all fine particles, a better correlation with total NR-PM1 sulfate than with rBCc-particle sulfate is reasonable. Similarly, V-rich particles had positive correlations with traffic-related OA and LO-OOA no matter whether rBCc particles or the total NR-PM1 was considered (Fig. S15b). Conversely, during the non-SEP, particles with a low V content (most of which had <4 ng m−3) had no clear links with sulfate, nitrate, POA and SOA species (and even showed anti-correlations for V>2.5 ng m−3) (Fig. S15c and d; a detailed comparison of the correlation coefficients of V with OA factors of rBCc particles and NR-PM1 organics is provided in Table S2). The results above demonstrate that, during the SEP, the chemical properties of the particles (both fresh and aged ones) were clearly linked with ship influences.
Previous studies (Ault et al., 2009, 2010; Z. Liu et al., 2017) have shown that the fresh ship-emitted V-rich particles are typically accompanied by high sulfate contributions, while aged V-containing ship particles, on the other hand, show relatively high nitrate contributions. In order to further probe the chemical characteristics and evolution processes of particles influenced by ship emissions, we divided the SEP into three episodes (i.e., EP1–EP3, marked in Fig. 13). During EP1, the rBC content was the highest (Fig. 13i) and the coating was the thinnest (Fig. S16i), indicating that the particles were relatively fresh; nevertheless, the SOA contents were not low (Fig. 13h and j), OSC was moderate (Fig. S16j), the sulfate portions in NR-PM1 and rBCc were both the highest (26.5 %), and the nitrate portion was the lowest (9.8 %) among the three episodes (Fig. 13g and i). Such a composition is not common in other cases, demonstrating that this was a specific period impacted by fresh ship emissions. EP2 had the highest mass loadings of V and gas pollutants as well as the lowest PBL height (∼200 m) (Fig. S16). The mass contribution of nitrate increased, that of sulfate decreased, and the rBC content decreased from those during EP1, signifying that the particle population likely contained some aged ship-emitted particles. Undoubtedly, the particle composition during EP2 was also influenced by the formation mechanisms of secondary species: most of EP2 occurred during nighttime, so photochemical formation of sulfate and SOA was weak (as shown in Fig. 13g and j, the sulfate contribution was only 15.1 % and the SOA contribution was only 33.7 %), while nitrate formation was enhanced due to the nocturnal process. During EP3, rBC was the lowest, sulfate and V were moderate, nitrate and SOA were highest in both rBCc particles and NR-PM1, and OSC and RBC were highest in rBCc particles among the three episodes (Figs. 13i, j and S16i–k). Therefore, it was also a period with an influence from aged ship-emitted particles; the difference from EP2 was that photochemically formed sulfate and SOA were still significant as EP3 occurred in the late afternoon and early evening, though heterogeneously formed nitrate played a non-negligible role too (see the increase of RH and the increase of nitrate and decrease of O3 concentrations from the beginning of EP3 in Fig. 13).
We conducted field measurements during November 2018 in urban Shanghai, China, focusing on the elucidation of physical and chemical properties of ambient particles containing rBC cores (rBCc) using a laser-only SP-AMS together with an HR-AMS. The campaign-average rBCc-particle concentration was 4.6 (±4.4) µg m−3, occupying ∼19.1 (±4.9) % of the total NR-PM1 mass. The average mass ratio of the coating to the rBC core (RBC) was ∼5.0 (±1.7), indicating a thick coating overall compared with the rBCc particles near the combustion source. Sulfate was found to preferentially condense on non-rBC particles, leading to a low fraction of rBCc-particle sulfate with respect to that in NR-PM1 (7.4 % ± 2.2 %), while there was no obvious difference in nitrate levels between the rBCc and non-rBC particles. PMF analysis of rBCc-particle and NR-PM1 OA revealed that cooking-related organics were externally mixed with rBC, and only a small portion of organics from biomass burning was present in rBCc particles; however, a large part of the traffic-related OA species was internally mixed with rBC.
A regression algorithm was applied to deconvolute the size distributions of individual rBCc-particle OA factors, and results show that small rBCc particles were predominantly generated from traffic; such particles could grow bigger because of the condensation of secondary inorganic and organic components, resulting in a thick coating.
Investigation of the diurnal patterns of the rBCc species revealed that sulfate and two SOA factors (LO-OOArBC and MO-OOArBC) were generated mainly through daytime photochemical oxidation; nitrate, on the other hand, was governed mainly by nocturnal N2O5 hydrolysis. SOA was found to be partially produced through in situ photochemical conversion from traffic-related POA. An average coating time (ACT) was proposed to roughly estimate the timescales required for the secondary species to coat rBC, and the ACTs of sulfate, LO-OOArBC, MO-OOArBC and nitrate were approximately 7, 5, 7 and 19 h, respectively.
Moreover, the size-resolved hygroscopicity parameters of rBCc particles (κrBCc) and the coating material (κCT) were obtained based on the elucidated composition of rBCc particles. The fitted equations are: and (x is DrBCc, nm). The minima of both κrBCc and κCT were at ∼150 nm due to the abundance of hydrophobic rBC cores and traffic-related HOA at this size. Under critical supersaturations (SSC) of 0.1 % and 0.2 %, the D50 values were estimated to be 166 (±16) and 110 (±5) nm and the activated number fractions of rBCc particles were 16 (±3) % and 59 (±4) %, respectively. Finally, a typical case with an influence from ship emissions was investigated. During this period, the rBCc particles were enriched in V (6.3±3.1 ng m−3), with a ratio of 2.0 (±0.6), and various secondary formation processes affected the ship-emitted particles at different times of the day.
In summary, the findings from this comprehensive study on rBCc particles provide rich information regarding the various primary sources and secondary formation pathways of species coated on rBC, as well as the features of the distributions of those species between rBC and non-rBC particles. In particular, different types of rBCc particles from diesel and gasoline vehicle emissions were resolved, and the elucidation of their properties will be useful for effectively controlling them in the future. An understanding of the formation processes and coating timescales of secondary components is helpful to understand the impact of ambient BC particles too. Lastly, the parameterized relationship of hygroscopicity to the size distribution is useful for modeling the effect of rBC on the climate (alternation of cloud properties).
The software code to analyze the AMS data is publicly available at: https://cires1.colorado.edu/jimenez-group/ToFAMSResources/ToFSoftware/index.html (Sueper, 2022).
The data in this study are available from the authors upon request (caxinra@163.com).
The supplement related to this article is available online at: https://doi.org/10.5194/acp-22-8073-2022-supplement.
SC, DDH, YW, JW, FS and XG conducted the field measurement. SC, DDH, YW, JW and JX analyzed the data. YZ, HW, CH and HL reviewed the paper and provided useful suggestions. SC and XG wrote the paper.
The contact author has declared that neither they nor their co-authors have any competing interests.
Publisher's note: Copernicus Publications remains neutral with regard to jurisdictional claims in published maps and institutional affiliations.
We sincerely thank SAES for providing data on gaseous pollutants and particulate V and Ni, and for the logistic help during the campaign.
This research has been supported by the National Natural Science Foundation of China (grant nos. 42021004, 21976093 and 21777073).
This paper was edited by Dantong Liu and reviewed by two anonymous referees.
Aiken, A. C., DeCarlo, P. F., Kroll, J. H., Worsnop, D. R., Huffman, J. A., Docherty, K. S., Ulbrich, I. M., Mohr, C., Kimmel, J. R., Sueper, D., Sun, Y., Zhang, Q., Trimborn, A., Northway, M., Ziemann, P. J., Canagaratna, M. R., Onasch, T. B., Alfarra, M. R., Prevot, A. S. H., Dommen, J., Duplissy, J., Metzger, A., Baltensperger, U., and Jimenez, J. L.: O/C and OM/OC ratios of primary, secondary, and ambient organic aerosols with high-resolution time-of-flight aerosol mass spectrometry, Environ. Sci. Technol., 42, 4478–4485, https://doi.org/10.1021/es703009q, 2008.
Ault, A. P., Moore, M. J., Furutani, H., and Prather, K. A.: Impact of emissions from the Los Angeles port region on San Diego air quality during regional transport events, Environ. Sci. Technol., 43, 3500–3506, https://doi.org/10.1021/es8018918, 2009.
Ault, A. P., Gaston, C. I., Ying, W., Gerardo, D., Thiemens, M. H., and Prather, K. A.: Characterization of the single particle mixing state of individual ship plume events measured at the Port of Los Angeles, Environ. Sci. Technol., 44, 1954–1961, https://doi.org/10.1021/es902985h, 2010.
Becagli, S., Anello, F., Bommarito, C., Cassola, F., Calzolai, G., Di Iorio, T., di Sarra, A., Gómez-Amo, J.-L., Lucarelli, F., Marconi, M., Meloni, D., Monteleone, F., Nava, S., Pace, G., Severi, M., Sferlazzo, D. M., Traversi, R., and Udisti, R.: Constraining the ship contribution to the aerosol of the central Mediterranean, Atmos. Chem. Phys., 17, 2067–2084, https://doi.org/10.5194/acp-17-2067-2017, 2017.
Bond, T. C., Doherty, S. J., Fahey, D. W., Forster, P. M., Berntsen, T., DeAngelo, B. J., Flanner, M. G., Ghan, S., Kärcher, B., Koch, D., Kinne, S., Kondo, Y., Quinn, P. K., Sarofim, M. C., Schultz, M. G., Schulz, M., Venkataraman, C., Zhang, H., Zhang, S., Bellouin, N., Guttikunda, S. K., Hopke, P. K., Jacobson, M. Z., Kaiser, J. W., Klimont, Z., Lohmann, U., Schwarz, J. P., Shindell, D., Storelvmo, T., Warren, S. G., and Zender, C. S.: Bounding the role of black carbon in the climate system: A scientific assessment, J. Geophys. Res.-Atmos., 118, 5380–5552, https://doi.org/10.1002/jgrd.50171, 2013.
Canagaratna, M. R., Jayne, J. T., Jimenez, J. L., Allan, J. D., Alfarra, M. R., Zhang, Q., Onasch, T. B., Drewnick, F., Coe, H., Middlebrook, A., Delia, A., Williams, L. R., Trimborn, A. M., Northway, M. J., DeCarlo, P. F., Kolb, C. E., Davidovits, P., and Worsnop, D. R.: Chemical and microphysical characterization of ambient aerosols with the aerodyne aerosol mass spectrometer, Mass Spectrom. Rev., 26, 185–222, https://doi.org/10.1002/mas.20115, 2007.
Canagaratna, M. R., Jimenez, J. L., Kroll, J. H., Chen, Q., Kessler, S. H., Massoli, P., Hildebrandt Ruiz, L., Fortner, E., Williams, L. R., Wilson, K. R., Surratt, J. D., Donahue, N. M., Jayne, J. T., and Worsnop, D. R.: Elemental ratio measurements of organic compounds using aerosol mass spectrometry: characterization, improved calibration, and implications, Atmos. Chem. Phys., 15, 253–272, https://doi.org/10.5194/acp-15-253-2015, 2015a.
Canagaratna, M. R., Massoli, P., Browne, E. C., Franklin, J. P., Wilson, K. R., Onasch, T. B., Kirchstetter, T. W., Fortner, E. C., Kolb, C. E., Jayne, J. T., Kroll, J. H., and Worsnop, D. R.: Chemical compositions of black carbon particle cores and coatings via soot particle aerosol mass spectrometry with photoionization and electron ionization, J. Phys. Chem. A, 119, 4589–4599, https://doi.org/10.1021/jp510711u, 2015b.
Cao, L.-M., Wei, J., He, L.-Y., Zeng, H., Li, M.-L., Zhu, Q., Yu, G.-H., and Huang, X.-F.: Aqueous aging of secondary organic aerosol coating onto black carbon: Insights from simultaneous L-ToF-AMS and SP-AMS measurements at an urban site in southern China, J. Clean Prod., 330, 129888, https://doi.org/10.1016/j.jclepro.2021.129888, 2022.
Cappa, C. D., Onasch, T. B., Massoli, P., Worsnop, D. R., Bates, T. S., Cross, E. S., Davidovits, P., Hakala, J., Hayden, K. L., Jobson, B. T., Kolesar, K. R., Lack, D. A., Lerner, B. M., Li, S.-M., Mellon, D., Nuaaman, I., Olfert, J. S., Petäjä, T., Quinn, P. K., Song, C., Subramanian, R., Williams, E. J., and Zaveri, R. A.: Radiative Absorption Enhancements Due to the Mixing State of Atmospheric Black Carbon, Science, 337, 1078–1081, https://doi.org/10.1126/science.1230260, 2012.
Chang, R. Y. W., Slowik, J. G., Shantz, N. C., Vlasenko, A., Liggio, J., Sjostedt, S. J., Leaitch, W. R., and Abbatt, J. P. D.: The hygroscopicity parameter (κ) of ambient organic aerosol at a field site subject to biogenic and anthropogenic influences: relationship to degree of aerosol oxidation, Atmos. Chem. Phys., 10, 5047–5064, https://doi.org/10.5194/acp-10-5047-2010, 2010.
Chen, B., Bai, Z., Cui, X., Chen, J., Andersson, A., and Gustafsson, O.: Light absorption enhancement of black carbon from urban haze in Northern China winter, Environ. Pollut., 221, 418–426, https://doi.org/10.1016/j.envpol.2016.12.004, 2017.
Chen, C., Fan, X., Shaltout, T., Qiu, C., Ma, Y., Goldman, A., and Khalizov, A. F.: An unexpected restructuring of combustion soot aggregates by subnanometer coatings of polycyclic aromatic hydrocarbons, Geophys. Res. Lett., 43, 11080–11088, https://doi.org/10.1002/2016GL070877, 2016.
Chen, C., Enekwizu, O. Y., Fan, X., Dobrzanski, C. D., Ivanova, E. V., Ma, Y., Gor, G. Y., and Khalizov, A. F.: Single Parameter for Predicting the Morphology of Atmospheric Black Carbon, Environ. Sci. Technol., 52, 14169–14179, https://doi.org/10.1021/acs.est.8b04201, 2018.
Chen, D., Tian, X., Lang, J., Zhou, Y., Li, Y., Guo, X., Wang, W., and Liu, B.: The impact of ship emissions on PM2.5 and the deposition of nitrogen and sulfur in Yangtze River Delta, China, Sci. Total Environ., 649, 1609–1619, https://doi.org/10.1016/j.scitotenv.2018.08.313, 2019.
Clegg, S. L., Brimblecombe, P., and Wexler, A. S.: Thermodynamic model of the system H+––––H2O at tropospheric temperatures, J. Phys. Chem. A, 102, 2155–2171, https://doi.org/10.1021/jp973043j, 1998.
Collier, S., Williams, L. R., Onasch, T. B., Cappa, C. D., Zhang, X., Russell, L. M., Chen, C.-L., Sanchez, K. J., Worsnop, D. R., and Zhang, Q.: Influence of Emissions and Aqueous Processing on Particles Containing Black Carbon in a Polluted Urban Environment: Insights From a Soot Particle-Aerosol Mass Spectrometer, J. Geophys. Res.-Atmos., 123, 6648–6666, https://doi.org/10.1002/2017jd027851, 2018.
Corbin, J. C., Sierau, B., Gysel, M., Laborde, M., Keller, A., Kim, J., Petzold, A., Onasch, T. B., Lohmann, U., and Mensah, A. A.: Mass spectrometry of refractory black carbon particles from six sources: carbon-cluster and oxygenated ions, Atmos. Chem. Phys., 14, 2591–2603, https://doi.org/10.5194/acp-14-2591-2014, 2014.
Cubison, M. J., Ortega, A. M., Hayes, P. L., Farmer, D. K., Day, D., Lechner, M. J., Brune, W. H., Apel, E., Diskin, G. S., Fisher, J. A., Fuelberg, H. E., Hecobian, A., Knapp, D. J., Mikoviny, T., Riemer, D., Sachse, G. W., Sessions, W., Weber, R. J., Weinheimer, A. J., Wisthaler, A., and Jimenez, J. L.: Effects of aging on organic aerosol from open biomass burning smoke in aircraft and laboratory studies, Atmos. Chem. Phys., 11, 12049–12064, https://doi.org/10.5194/acp-11-12049-2011, 2011.
DeCarlo, P. F., Kimmel, J. R., Trimborn, A., Northway, M. J., Jayne, J. T., Aiken, A. C., Gonin, M., Fuhrer, K., Horvath, T., Docherty, K. S., Worsnop, D. R., and Jimenez, J. L.: Field-Deployable, High-Resolution, Time-of-Flight Aerosol Mass Spectrometer, Anal. Chem. , 78, 8281–8289, https://doi.org/10.1021/ac061249n, 2006.
Enroth, J., Saarikoski, S., Niemi, J., Kousa, A., Ježek, I., Moènik, G., Carbone, S., Kuuluvainen, H., Rönkkö, T., Hillamo, R., and Pirjola, L.: Chemical and physical characterization of traffic particles in four different highway environments in the Helsinki metropolitan area, Atmos. Chem. Phys., 16, 5497–5512, https://doi.org/10.5194/acp-16-5497-2016, 2016.
Fan, Q., Zhang, Y., Ma, W., Ma, H., Feng, J., Yu, Q., Yang, X., Ng, S. K., Fu, Q., and Chen, L.: Spatial and Seasonal Dynamics of Ship Emissions over the Yangtze River Delta and East China Sea and Their Potential Environmental Influence, Environ. Sci. Technol., 50, 1322–1329, https://doi.org/10.1021/acs.est.5b03965, 2016.
Gao, X., Yang, L., Cheng, S., Gao, R., Zhou, Y., Xue, L., Shou, Y., Wang, J., Wang, X., Nie, W., Xu, P., and Wang, W.: Semi-continuous measurement of water-soluble ions in PM2.5 in Jinan, China: Temporal variations and source apportionments, Atmos. Environ., 45, 6048–6056, https://doi.org/10.1016/j.atmosenv.2011.07.041, 2011.
Ge, X., Zhang, Q., Sun, Y., Ruehl, C. R., and Setyan, A.: Effect of aqueous-phase processing on aerosol chemistry and size distributions in Fresno, California, during wintertime, Environ. Chem., 9, 221–235, https://doi.org/10.1071/EN11168, 2012.
Gilardoni, S., Massoli, P., Paglione, M., Giulianelli, L., Carbone, C., Rinaldi, M., Decesari, S., Sandrini, S., Costabile, F., Gobbi, G. P., Pietrogrande, M. C., Visentin, M., Scotto, F., Fuzzi, S., and Facchini, M. C.: Direct observation of aqueous secondary organic aerosol from biomass-burning emissions, P. Natl. Acad. Sci. USA, 113, 10013–10018, https://doi.org/10.1073/pnas.1602212113, 2016.
Gong, X., Zhang, C., Chen, H., Nizkorodov, S. A., Chen, J., and Yang, X.: Size distribution and mixing state of black carbon particles during a heavy air pollution episode in Shanghai, Atmos. Chem. Phys., 16, 5399–5411, https://doi.org/10.5194/acp-16-5399-2016, 2016.
Gysel, M., Crosier, J., Topping, D. O., Whitehead, J. D., Bower, K. N., Cubison, M. J., Williams, P. I., Flynn, M. J., McFiggans, G. B., and Coe, H.: Closure study between chemical composition and hygroscopic growth of aerosol particles during TORCH2, Atmos. Chem. Phys., 7, 6131–6144, https://doi.org/10.5194/acp-7-6131-2007, 2007.
Heald, C. L., Kroll, J. H., Jimenez, J. L., Docherty, K. S., DeCarlo, P. F., Aiken, A. C., Chen, Q., Martin, S. T., Farmer, D. K., and Artaxo, P.: A simplified description of the evolution of organic aerosol composition in the atmosphere, Geophys. Res. Lett., 37, L08803, https://doi.org/10.1029/2010gl042737, 2010.
Hu, D., Liu, D., Kong, S., Zhao, D., Wu, Y., Li, S., Ding, S., Zheng, S., Cheng, Y., Hu, K., Deng, Z., Wu, Y., Tian, P., Liu, Q., Huang, M., and Ding, D.: Direct Quantification of Droplet Activation of Ambient Black Carbon Under Water Supersaturation, J. Geophys. Res.-Atmos., 126, e2021JD034649, https://doi.org/10.1029/2021jd034649, 2021.
Jacobi, H. W., Lim, S., Ménégoz, M., Ginot, P., Laj, P., Bonasoni, P., Stocchi, P., Marinoni, A., and Arnaud, Y.: Black carbon in snow in the upper Himalayan Khumbu Valley, Nepal: observations and modeling of the impact on snow albedo, melting, and radiative forcing, The Cryosphere, 9, 1685–1699, https://doi.org/10.5194/tc-9-1685-2015, 2015.
Jang, H.-N., Seo, Y.-C., Lee, J.-H., Hwang, K.-W., Yoo, J.-I., Sok, C.-H., and Kim, S.-H.: Formation of fine particles enriched by V and Ni from heavy oil combustion: Anthropogenic sources and drop-tube furnace experiments, Atmos. Environ., 41, 1053–1063, https://doi.org/10.1016/j.atmosenv.2006.09.011, 2007.
Jayne, J. T., Leard, D. C., Zhang, X., Davidovits, P., Smith, K. A., Kolb, C. E., and Worsnop, D. R.: Development of an aerosol mass spectrometer for size and composition analysis of submicron particles, Aerosol Sci. Tech., 33, 49–70, https://doi.org/10.1080/027868200410840, 2000.
Kim, K.-H., Shon, Z.-H., Mauulida, P. T., and Song, S.-K.: Long-term monitoring of airborne nickel (Ni) pollution in association with some potential source processes in the urban environment, Chemosphere, 111, 312–319, https://doi.org/10.1016/j.chemosphere.2014.03.138, 2014.
Kroll, J. H., Donahue, N. M., Jimenez, J. L., Kessler, S. H., Canagaratna, M. R., Wilson, K. R., Altieri, K. E., Mazzoleni, L. R., Wozniak, A. S., Bluhm, H., Mysak, E. R., Smith, J. D., Kolb, C. E., and Worsnop, D. R.: Carbon oxidation state as a metric for describing the chemistry of atmospheric organic aerosol, Nat. Chem., 3, 133–139, https://doi.org/10.1038/nchem.948, 2011.
Lambe, A. T., Ahern, A. T., Wright, J. P., Croasdale, D. R., Davidovits, P., and Onasch, T. B.: Oxidative aging and cloud condensation nuclei activation of laboratory combustion soot, J. Aerosol. Sci., 79, 31–39, https://doi.org/10.1016/j.jaerosci.2014.10.001, 2015.
Laskin, A., Smith, J. S., and Laskin, J.: Molecular characterization of nitrogen-containing organic compounds in biomass burning aerosols using high-resolution mass spectrometry, Environ. Sci. Technol., 43, 3764–3771, https://doi.org/10.1021/es803456n, 2009.
Lee, A. K. Y., Willis, M. D., Healy, R. M., Onasch, T. B., and Abbatt, J. P. D.: Mixing state of carbonaceous aerosol in an urban environment: single particle characterization using the soot particle aerosol mass spectrometer (SP-AMS), Atmos. Chem. Phys., 15, 1823–1841, https://doi.org/10.5194/acp-15-1823-2015, 2015.
Lee, A. K. Y., Chen, C.-L., Liu, J., Price, D. J., Betha, R., Russell, L. M., Zhang, X., and Cappa, C. D.: Formation of secondary organic aerosol coating on black carbon particles near vehicular emissions, Atmos. Chem. Phys., 17, 15055–15067, https://doi.org/10.5194/acp-17-15055-2017, 2017.
Lee, A. K. Y., Rivellini, L. H., Chen, C. L., Liu, J., Price, D. J., Betha, R., Russell, L. M., Zhang, X., and Cappa, C. D.: Influences of primary emission and secondary coating formation on the particle diversity and mixing state of black carbon particles, Environ. Sci. Technol., 53, 9429–9438, https://doi.org/10.1021/acs.est.9b03064, 2019.
Li, W., Teng, X., Chen, X., Liu, L., Xu, L., Zhang, J., Wang, Y., Zhang, Y., and Shi, Z.: Organic coating reduces hygroscopic growth of phase-separated aerosol particles, Environ. Sci. Technol., 55, 16339–16346, https://doi.org/10.1021/acs.est.1c05901, 2021.
Liu, D., Allan, J., Whitehead, J., Young, D., Flynn, M., Coe, H., McFiggans, G., Fleming, Z. L., and Bandy, B.: Ambient black carbon particle hygroscopic properties controlled by mixing state and composition, Atmos. Chem. Phys., 13, 2015–2029, https://doi.org/10.5194/acp-13-2015-2013, 2013.
Liu, D., Whitehead, J., Alfarra, M. R., Reyes-Villegas, E., Spracklen, D. V., Reddington, C. L., Kong, S., Williams, P. I., Ting, Y.-C., Haslett, S., Taylor, J. W., Flynn, M. J., Morgan, W. T., McFiggans, G., Coe, H., and Allan, J. D.: Black-carbon absorption enhancement in the atmosphere determined by particle mixing state, Nat. Geosci., 10, 184–188, https://doi.org/10.1038/ngeo2901, 2017.
Liu, D., Joshi, R., Wang, J., Yu, C., Allan, J. D., Coe, H., Flynn, M. J., Xie, C., Lee, J., Squires, F., Kotthaus, S., Grimmond, S., Ge, X., Sun, Y., and Fu, P.: Contrasting physical properties of black carbon in urban Beijing between winter and summer, Atmos. Chem. Phys., 19, 6749–6769, https://doi.org/10.5194/acp-19-6749-2019, 2019.
Liu, S., Aiken, A. C., Gorkowski, K., Dubey, M. K., Cappa, C. D., Williams, L. R., Herndon, S. C., Massoli, P., Fortner, E. C., Chhabra, P. S., Brooks, W. A., Onasch, T. B., Jayne, J. T., Worsnop, D. R., China, S., Sharma, N., Mazzoleni, C., Xu, L., Ng, N. L., Liu, D., Allan, J. D., Lee, J. D., Fleming, Z. L., Mohr, C., Zotter, P., Szidat, S., and Prevot, A. S. H.: Enhanced light absorption by mixed source black and brown carbon particles in UK winter, Nat. Commun., 6, 8435, https://doi.org/10.1038/ncomms9435, 2015.
Liu, Z., Lu, X., Feng, J., Fan, Q., Zhang, Y., and Yang, X.: Influence of Ship Emissions on Urban Air Quality: A Comprehensive Study Using Highly Time-Resolved Online Measurements and Numerical Simulation in Shanghai, Environ. Sci. Technol., 51, 202–211, https://doi.org/10.1021/acs.est.6b03834, 2017.
Ma, Y., Huang, C., Jabbour, H., Zheng, Z., Wang, Y., Jiang, Y., Zhu, W., Ge, X., Collier, S., and Zheng, J.: Mixing state and light absorption enhancement of black carbon aerosols in summertime Nanjing, China, Atmos. Environ., 222, 117141, https://doi.org/10.1016/j.atmosenv.2019.117141, 2020.
Malmborg, V. B., Eriksson, A. C., Shen, M., Nilsson, P., Gallo, Y., Waldheim, B., Martinsson, J., Andersson, O., and Pagels, J.: Evolution of In-Cylinder Diesel Engine Soot and Emission Characteristics Investigated with Online Aerosol Mass Spectrometry, Environ. Sci. Technol., 51, 1876–1885, https://doi.org/10.1021/acs.est.6b03391, 2017.
Mar, V., Fulvio, A., Andrés, A., Xavier, Q., Teresa, M., Saúl García, D. S., María Dolores, H., and Rosalía, F. P.: Chemical tracers of particulate emissions from commercial shipping, Environ. Sci. Technol., 43, 7472–7477, https://doi.org/10.1021/es901558t, 2009.
Massoli, P., Fortner, E. C., Canagaratna, M. R., Williams, L. R., Zhang, Q., Sun, Y., Schwab, J. J., Trimborn, A., Onasch, T. B., Demerjian, K. L., Kolb, C. E., Worsnop, D. R., and Jayne, J. T.: Pollution Gradients and Chemical Characterization of Particulate Matter from Vehicular Traffic near Major Roadways: Results from the 2009 Queens College Air Quality Study in NYC, Aerosol Sci. Tech., 46, 1201-1218, https://doi.org/10.1080/02786826.2012.701784, 2012.
Massoli, P., Onasch, T. B., Cappa, C. D., Nuamaan, I., Hakala, J., Hayden, K., Li, S.-M., Sueper, D. T., Bates, T. S., Quinn, P. K., Jayne, J. T., and Worsnop, D. R.: Characterization of black carbon-containing particles from soot particle aerosol mass spectrometer measurements on the R/VAtlantisduring CalNex 2010, J. Geophys. Res.-Atmos., 120, 2575–2593, https://doi.org/10.1002/2014jd022834, 2015.
Mazzei, F., D'Alessandro, A., Lucarelli, F., Nava, S., Prati, P., Valli, G., and Vecchi, R.: Characterization of particulate matter sources in an urban environment, Sci. Total Environ., 401, 81–89, https://doi.org/10.1016/j.scitotenv.2008.03.008, 2008.
Mohr, C., Huffman, J. A., Cubison, M. J., Aiken, A. C., Docherty, K. S., Kimmel, J. R., Ulbrich, I. M., Hannigan, M., and Jimenez, J. L.: Characterization of Primary Organic Aerosol Emissions from Meat Cooking, Trash Burning, and Motor Vehicles with High-Resolution Aerosol Mass Spectrometry and Comparison with Ambient and Chamber Observations, Environ. Sci. Technol., 43, 2443–2449, https://doi.org/10.1021/es8011518, 2009.
Moldanová, J., Fridell, E., Popovicheva, O., Demirdjian, B., Tishkova, V., Faccinetto, A., and Focsa, C.: Characterisation of particulate matter and gaseous emissions from a large ship diesel engine, Atmos. Environ., 43, 2632–2641, https://doi.org/10.1016/j.atmosenv.2009.02.008, 2009.
Ng, N. L., Canagaratna, M. R., Jimenez, J. L., Chhabra, P. S., Seinfeld, J. H., and Worsnop, D. R.: Changes in organic aerosol composition with aging inferred from aerosol mass spectra, Atmos. Chem. Phys., 11, 6465–6474, https://doi.org/10.5194/acp-11-6465-2011, 2011.
Onasch, T. B., Trimborn, A., Fortner, E. C., Jayne, J. T., Kok, G. L., Williams, L. R., Davidovits, P., and Worsnop, D. R.: Soot Particle Aerosol Mass Spectrometer: Development, Validation, and Initial Application, Aerosol Sci. Tech., 46, 804–817, https://doi.org/10.1080/02786826.2012.663948, 2012.
Paatero, P. and Tapper, U.: Positive matrix factorization: A non-negative factor model with optimal utilization of error estimates of data values, Environmetrics, 5, 111–126, https://doi.org/10.1002/env.3170050203, 1994.
Pathak, R. K., Wang, T., and Wu, W. S.: Nighttime enhancement of PM2.5 nitrate in ammonia-poor atmospheric conditions in Beijing and Shanghai: Plausible contributions of heterogeneous hydrolysis of N2O5 and HNO3 partitioning, Atmos. Environ., 45, 1183–1191, https://doi.org/10.1016/j.atmosenv.2010.09.003, 2011.
Peng, J., Hu, M., Guo, S., Du, Z., Zheng, J., Shang, D., Levy, Z. M., Zeng, L., Shao, M., and Wu, Y. S.: Markedly enhanced absorption and direct radiative forcing of black carbon under polluted urban environments, P. Natl. Acad. Sci. USA, 113, 4266–4271, https://doi.org/10.1073/pnas.1602310113, 2016.
Petit, J. E., Favez, O., Albinet, A., and Canonaco, F.: A user-friendly tool for comprehensive evaluation of the geographical origins of atmospheric pollution: Wind and trajectory analyses, Environ. Model. Softw., 88, 183–187, https://doi.org/10.1016/j.envsoft.2016.11.022, 2017.
Petters, M. D. and Kreidenweis, S. M.: A single parameter representation of hygroscopic growth and cloud condensation nucleus activity, Atmos. Chem. Phys., 7, 1961–1971, https://doi.org/10.5194/acp-7-1961-2007, 2007.
Ramanathan, V. and Carmichael, G.: Global and regional climate changes due to black carbon, Nat. Geosci., 1, 221–227, https://doi.org/10.1038/ngeo156, 2008.
Rivellini, L.-H., Adam, M. G., Kasthuriarachchi, N., and Lee, A. K. Y.: Characterization of carbonaceous aerosols in Singapore: insight from black carbon fragments and trace metal ions detected by a soot particle aerosol mass spectrometer, Atmos. Chem. Phys., 20, 5977–5993, https://doi.org/10.5194/acp-20-5977-2020, 2020.
Saarikoski, S., Timonen, H., Carbone, S., Kuuluvainen, H., Niemi, J. V., Kousa, A., Rönkkö, T., Worsnop, D., Hillamo, R., and Pirjola, L.: Investigating the chemical species in submicron particles emitted by city buses, Aerosol Sci. Tech., 51, 317–329, https://doi.org/10.1080/02786826.2016.1261992, 2016.
Sueper, D.: ToF-AMS Software downloads, Univeristy of Colorado, https://cires1.colorado.edu/jimenez-group/ToFAMSResources/ToFSoftware/index.html, last access: 21 June 2022.
Sun, Y. L., Zhang, Q., Schwab, J. J., Demerjian, K. L., Chen, W. N., Bae, M. S., Hung, H. M., Hogrefe, O., Frank, B., Rattigan, O. V., and Lin, Y. C.: Characterization of the sources and processes of organic and inorganic aerosols in New York city with a high-resolution time-of-flight aerosol mass apectrometer, Atmos. Chem. Phys., 11, 1581–1602, https://doi.org/10.5194/acp-11-1581-2011, 2011.
Sun, Y. L., Zhang, Q., Schwab, J. J., Yang, T., Ng, N. L., and Demerjian, K. L.: Factor analysis of combined organic and inorganic aerosol mass spectra from high resolution aerosol mass spectrometer measurements, Atmos. Chem. Phys., 12, 8537–8551, https://doi.org/10.5194/acp-12-8537-2012, 2012.
Topping, D. O., McFiggans, G. B., and Coe, H.: A curved multi-component aerosol hygroscopicity model framework: Part 2 – Including organic compounds, Atmos. Chem. Phys., 5, 1223–1242, https://doi.org/10.5194/acp-5-1223-2005, 2005a.
Topping, D. O., McFiggans, G. B., and Coe, H.: A curved multi-component aerosol hygroscopicity model framework: Part 1 – Inorganic compounds, Atmos. Chem. Phys., 5, 1205–1222, https://doi.org/10.5194/acp-5-1205-2005, 2005b.
Ulbrich, I. M., Canagaratna, M. R., Zhang, Q., Worsnop, D. R., and Jimenez, J. L.: Interpretation of organic components from Positive Matrix Factorization of aerosol mass spectrometric data, Atmos. Chem. Phys., 9, 2891–2918, https://doi.org/10.5194/acp-9-2891-2009, 2009.
Ulbrich, I. M., Canagaratna, M. R., Cubison, M. J., Zhang, Q., Ng, N. L., Aiken, A. C., and Jimenez, J. L.: Three-dimensional factorization of size-resolved organic aerosol mass spectra from Mexico City, Atmos. Meas. Tech., 5, 195–224, https://doi.org/10.5194/amt-5-195-2012, 2012.
Wang, J., Ge, X., Chen, Y., Shen, Y., Zhang, Q., Sun, Y., Xu, J., Ge, S., Yu, H., and Chen, M.: Highly time-resolved urban aerosol characteristics during springtime in Yangtze River Delta, China: insights from soot particle aerosol mass spectrometry, Atmos. Chem. Phys., 16, 9109–9127, https://doi.org/10.5194/acp-16-9109-2016, 2016.
Wang, J., Zhang, Q., Chen, M., Collier, S., Zhou, S., Ge, X., Xu, J., Shi, J., Xie, C., Hu, J., Ge, S., Sun, Y., and Coe, H.: First Chemical Characterization of Refractory Black Carbon Aerosols and Associated Coatings over the Tibetan Plateau (473 m a.s.l), Environ. Sci. Technol., 51, 14072–14082, https://doi.org/10.1021/acs.est.7b03973, 2017.
Wang, J., Liu, D., Ge, X., Wu, Y., Shen, F., Chen, M., Zhao, J., Xie, C., Wang, Q., Xu, W., Zhang, J., Hu, J., Allan, J., Joshi, R., Fu, P., Coe, H., and Sun, Y.: Characterization of black carbon-containing fine particles in Beijing during wintertime, Atmos. Chem. Phys., 19, 447–458, https://doi.org/10.5194/acp-19-447-2019, 2019.
Wang, J., Ye, J., Liu, D., Wu, Y., Zhao, J., Xu, W., Xie, C., Shen, F., Zhang, J., Ohno, P. E., Qin, Y., Zhao, X., Martin, S. T., Lee, A. K. Y., Fu, P., Jacob, D. J., Zhang, Q., Sun, Y., Chen, M., and Ge, X.: Characterization of submicron organic particles in Beijing during summertime: comparison between SP-AMS and HR-AMS, Atmos. Chem. Phys., 20, 14091–14102, https://doi.org/10.5194/acp-20-14091-2020, 2020.
Wang, J., Ye, J., Zhang, Q., Zhao, J., Wu, Y., Li, J., Liu, D., Li, W., Zhang, Y., Wu, C., Xie, C., Qin, Y., Lei, Y., Huang, X., Guo, J., Liu, P., Fu, P., Li, Y., Lee, H. C., Choi, H., Zhang, J., Liao, H., Chen, M., Sun, Y., Ge, X., Martin, S. T., and Jacob, D. J.: Aqueous production of secondary organic aerosol from fossil-fuel emissions in winter Beijing haze, P. Natl. Acad. Sci. USA, 118, e2022179118, https://doi.org/10.1073/pnas.2022179118, 2021.
Wang, S., Newland, M. J., Deng, W., Rickard, A. R., Hamilton, J. F., Muñoz, A., Ródenas, M., Vázquez, M. M., Wang, L., and Wang, X.: Aromatic Photo-oxidation, A New Source of Atmospheric Acidity, Environ. Sci. Technol., 54, 7798–7806, https://doi.org/10.1021/acs.est.0c00526, 2020.
Willis, M. D., Healy, R. M., Riemer, N., West, M., Wang, J. M., Jeong, C.-H., Wenger, J. C., Evans, G. J., Abbatt, J. P. D., and Lee, A. K. Y.: Quantification of black carbon mixing state from traffic: implications for aerosol optical properties, Atmos. Chem. Phys., 16, 4693–4706, https://doi.org/10.5194/acp-16-4693-2016, 2016.
Wu, Y., Ge, X., Wang, J., Shen, Y., Ye, Z., Ge, S., Wu, Y., Yu, H., and Chen, M.: Responses of secondary aerosols to relative humidity and photochemical activities in an industrialized environment during late winter, Atmos. Environ., 193, 66–78, https://doi.org/10.1016/j.atmosenv.2018.09.008, 2018.
Wu, Y., Liu, D., Wang, J., Shen, F., Chen, Y., Cui, S., Ge, S., Wu, Y., Chen, M., and Ge, X.: Characterization of Size-Resolved Hygroscopicity of Black Carbon-Containing Particle in Urban Environment, Environ. Sci. Technol., 53, 14212–14221, https://doi.org/10.1021/acs.est.9b05546, 2019.
Wu, Y., Liu, D., Wang, X., Li, S., Zhang, J., Qiu, H., Ding, S., Hu, K., Li, W., Tian, P., Liu, Q., Zhao, D., Ma, E., Chen, M., Xu, H., Ouyang, B., Chen, Y., Kong, S., Ge, X., and Liu, H.: Ambient marine shipping emissions determined by vessel operation mode along the East China Sea, Sci. Total Environ., 769, 144713, https://doi.org/10.1016/j.scitotenv.2020.144713, 2021.
Wu, Z. J., Zheng, J., Shang, D. J., Du, Z. F., Wu, Y. S., Zeng, L. M., Wiedensohler, A., and Hu, M.: Particle hygroscopicity and its link to chemical composition in the urban atmosphere of Beijing, China, during summertime, Atmos. Chem. Phys., 16, 1123–1138, https://doi.org/10.5194/acp-16-1123-2016, 2016.
Xie, C., Xu, W., Wang, J., Liu, D., Ge, X., Zhang, Q., Wang, Q., Du, W., Zhao, J., Zhou, W., Li, J., Fu, P., Wang, Z., Worsnop, D., and Sun, Y.: Light absorption enhancement of black carbon in urban Beijing in summer, Atmos. Environ., 213, 499–504, https://doi.org/10.1016/j.atmosenv.2019.06.041, 2019.
Xu, J., Zhang, Q., Chen, M., Ge, X., Ren, J., and Qin, D.: Chemical composition, sources, and processes of urban aerosols during summertime in northwest China: insights from high-resolution aerosol mass spectrometry, Atmos. Chem. Phys., 14, 12593–12611, https://doi.org/10.5194/acp-14-12593-2014, 2014.
Xu, W., Han, T., Du, W., Wang, Q., Chen, C., Zhao, J., Zhang, Y., Li, J., Fu, P., Wang, Z., Worsnop, D. R., and Sun, Y.: Effects of Aqueous-Phase and Photochemical Processing on Secondary Organic Aerosol Formation and Evolution in Beijing, China, Environ. Sci. Technol., 51, 762–770, https://doi.org/10.1021/acs.est.6b04498, 2017.
Xu, W., Sun, Y., Wang, Q., Zhao, J., Wang, J., Ge, X., Xie, C., Zhou, W., Du, W., Li, J., Fu, P., Wang, Z., Worsnop, D. R., and Coe, H.: Changes in Aerosol Chemistry From 2014 to 2016 in Winter in Beijing: Insights From High-Resolution Aerosol Mass Spectrometry, J. Geophys. Res.-Atmos., 124, 1132–1147, https://doi.org/10.1029/2018jd029245, 2019.
Ye, Z., Liu, J., Gu, A., Feng, F., Liu, Y., Bi, C., Xu, J., Li, L., Chen, H., Chen, Y., Dai, L., Zhou, Q., and Ge, X.: Chemical characterization of fine particulate matter in Changzhou, China, and source apportionment with offline aerosol mass spectrometry, Atmos. Chem. Phys., 17, 2573–2592, https://doi.org/10.5194/acp-17-2573-2017, 2017.
Yu, G., Zhang, Y., Yang, F., He, B., Zhang, C., Zou, Z., Yang, X., Li, N., and Chen, J.: Dynamic Ratio in the Ship-Emitted Particles Driven by Multiphase Fuel Oil Regulations in Coastal China, Environ. Sci. Technol., 55, 15031–15039, https://doi.org/10.1021/acs.est.1c02612, 2021.
Yu, L., Smith, J., Laskin, A., Anastasio, C., Laskin, J., and Zhang, Q.: Chemical characterization of SOA formed from aqueous-phase reactions of phenols with the triplet excited state of carbonyl and hydroxyl radical, Atmos. Chem. Phys., 14, 13801–13816, https://doi.org/10.5194/acp-14-13801-2014, 2014.
Zhang, F., Wang, Y., Peng, J., Chen, L., Sun, Y., Duan, L., Ge, X., Li, Y., Zhao, J., Liu, C., Zhang, X., Zhang, G., Pan, Y., Wang, Y., Zhang Annie, L., Ji, Y., Wang, G., Hu, M., Molina Mario, J., and Zhang, R.: An unexpected catalyst dominates formation and radiative forcing of regional haze, P. Natl. Acad. Sci. USA, 117, 3960–3966, https://doi.org/10.1073/pnas.1919343117, 2020.
Zhang, G., Fu, Y., Peng, X., Sun, W., Shi, Z., Song, W., Hu, W., Chen, D., Lian, X., Li, L., Tang, M., Wang, X., and Bi, X.: Black Carbon Involved Photochemistry Enhances the Formation of Sulfate in the Ambient Atmosphere: Evidence From In Situ Individual Particle Investigation, J. Geophys. Res.-Atmos., 126, e2021JD035226, https://doi.org/10.1029/2021JD035226, 2021.
Zhang, Q., Canagaratna, M. R., Jayne, J. T., Worsnop, D. R., and Jimenez, J.-L.: Time- and size-resolved chemical composition of submicron particles in Pittsburgh: Implications for aerosol sources and processes, J. Geophys. Res., 110, D07S09, https://doi.org/10.1029/2004JD004649, 2005.
Zhang, Q., Jimenez, J. L., Canagaratna, M. R., Ulbrich, I. M., Ng, N. L., Worsnop, D. R., and Sun, Y.: Understanding atmospheric organic aerosols via factor analysis of aerosol mass spectrometry: a review, Anal. Bioanal. Chem., 401, 3045–3067, https://doi.org/10.1007/s00216-011-5355-y, 2011.
Zhao, J., Qiu, Y., Zhou, W., Xu, W., Wang, J., Zhang, Y., Li, L., Xie, C., Wang, Q., Du, W., Worsnop, D. R., Canagaratna, M. R., Zhou, L., Ge, X., Fu, P., Li, J., Wang, Z., Donahue, N. M., and Sun, Y.: Organic Aerosol Processing During Winter Severe Haze Episodes in Beijing, J. Geophys. Res.-Atmos., 124, 10248–10263, https://doi.org/10.1029/2019jd030832, 2019.
Zhao, M., Zhang, Y., Ma, W., Fu, Q., Yang, X., Li, C., Zhou, B., Yu, Q., and Chen, L.: Characteristics and ship traffic source identification of air pollutants in China's largest port, Atmos. Environ., 64, 277–286, https://doi.org/10.1016/j.atmosenv.2012.10.007, 2013.
Zhou, S., Collier, S., Xu, J., Mei, F., Wang, J., Lee, Y.-N., Sedlacek, A. J., Springston, S. R., Sun, Y., and Zhang, Q.: Influences of upwind emission sources and atmospheric processing on aerosol chemistry and properties at a rural location in the Northeastern U.S., J. Geophys. Res.-Atmos., 121, 6049–6065, https://doi.org/10.1002/2015jd024568, 2016.