the Creative Commons Attribution 4.0 License.
the Creative Commons Attribution 4.0 License.
 | 20 Jun 2022
Dust transport and advection measurement with spaceborne lidars ALADIN and CALIOP and model reanalysis data
Guangyao Dai
Kangwen Sun
Xiaoye Wang
Songhua Wu
Xiangying E
Qi Liu
Bingyi Liu
In this paper, a long-term large-scale Saharan dust transport event which occurred between 14 and 27 June 2020 is tracked with the spaceborne lidars ALADIN (Atmospheric Laser Doppler Instrument) and CALIOP (Cloud-Aerosol Lidar with Orthogonal Polarization) together with ECMWF (European Centre for Medium-Range Forecasts) and HYSPLIT (Hybrid Single-Particle Lagrangian Integrated Trajectory model) analysis. We evaluate the performance of ALADIN and CALIOP on the observations of dust optical properties and wind fields and explore the possibility of tracking the dust events and calculating the dust mass advection with the combination of satellite and model data. The dust plumes are identified with the AIRS/Aqua Dust Score Index and with the vertical feature mask product from CALIOP. The emission, dispersion, transport and deposition of the dust event are monitored using the data from AIRS/Aqua, CALIOP and HYSPLIT. With the quasi-synchronized observations by ALADIN and CALIOP, combined with the wind field and relative humidity, the dust advection values are calculated. From this study, it is found that the dust event generated on 14 and 15 June 2020 from the Sahara in North Africa dispersed and moved westward over the Atlantic Ocean, finally being deposited in the western Atlantic Ocean, the Americas and the Caribbean Sea. During the transport and deposition processes, the dust plumes are trapped in the northeasterly trade-wind zone between latitudes of 5∘ and 30∘ N and altitudes of 0 and 6 km. Aeolus provided the observations of the dynamics of this dust transport event in the Saharan Air Layer (SAL). From the measurement results on 19 June 2020, the dust plumes are captured quasi-simultaneously over the emission region (Western Sahara), the transport region (middle Atlantic) and the deposition region (western Atlantic) individually, which indicates that the dust plume area over the Atlantic on the morning of this day is quite enormous and that this dust transport event is massive and extensive. The quasi-synchronization observation results of 15, 16, 19, 24 and 27 June by ALADIN and CALIOP during the entire transport process show good agreement with the Dust Score Index data and the HYSPLIT trajectories, which indicates that the transport process of the same dust event is tracked by ALADIN and CALIOP, verifies that the dust transport spent around 2 weeks from the emission to the deposition and achieved the respective observations of this dust event's emission phase, development phase, transport phase, descent phase and deposition phase. Finally, the advection values for different dust parts and heights on 19 June and on the entire transport routine during transportation are computed. On 19 June, the mean dust advection values are about 1.91±1.21 mg m−2 s−1 over the emission region, 1.38±1.28 mg m−2 s−1 over the transport region and over the deposition region. In the whole lifetime of the dust event, the mean dust advection values were about on 15 June 2020, on 16 June 2020, on 19 June 2020, on 24 June 2020 and on 27 June 2020. During the dust development stage, the mean advection values gradually increased and reached their maximum on 16 June with the enhancement of the dust event. Then, the mean advection values decreased during the transport and the deposition of the dust over the Atlantic Ocean, the Americas and the Caribbean Sea.
- Article
(14608 KB) - Full-text XML
- BibTeX
- EndNote


Global aerosol distribution and wind profiles have significant impacts on the atmospheric circulation, marine–atmosphere circulation and aerosol activities. As the most abundant aerosol type in the global atmosphere, mineral dust influences the radiation budget, air quality, climate and weather via direct and various indirect radiative effects. Mineral dust is also considered a major source of nutrients for ocean and terrestrial ecosystems. By the prevailing wind systems, mineral dust deposited over the ocean and land surface can significantly affect the carbon cycle and perturb the ocean and land geochemistry (Velasco-Merino et al., 2018; Banerjee et al., 2019). The atmospheric mineral dust can be transported over tens of thousands of kilometers away from its source regions (Uno et al., 2009; Haarig et al., 2017; Hofer et al., 2017). For instance, the biggest dust source, Africa, produced over half the global total dust (Huneeus et al., 2011), and African dust is transported westward over the Atlantic Ocean to reach South America (Yu et al., 2015; Prospero et al., 2020), the Caribbean Sea (Prospero and Lamb, 2003) and the southern United States (Bozlaker et al., 2013). Hence, continuous observations of the dust long-range transport are crucial. As one of the best techniques for remotely studying the characteristics and properties of aerosols, lidar contributes much to measure the dust distribution. As introduced in previous papers, several comprehensive field campaigns including the Asian Pacific Aerosol Characterization Experiment (ACE-Asia; Huebert et al., 2003; Shimizu et al., 2004), the Puerto Rico Dust Experiment (PRIDE; Colarco et al., 2003; Reid et al., 2003), the Saharan Dust Experiment (SHADE; Tanré et al., 2003), the Saharan Mineral Dust Experiments (SAMUM-1; Heintzenberg, 2009) and (SAMUM-2; Ansmann et al., 2011), the Dust and Biomass-burning Experiment (DABEX; Haywood et al., 2008), the Dust Outflow and Deposition to the Ocean project (DODO; McConnell et al., 2008), the Pacific Dust Experiment (PACDEX; Huang et al., 2008), the China–US joint dust field experiment (Huang et al., 2010), the Saharan Aerosol Long-Range Transport and Aerosol–Cloud-Interaction Experiment (SALTRACE; Weinzierl et al., 2017), the study of Saharan Dust Over West Africa (SHADOW; Veselovskii et al., 2016) and the Central Asian Dust Experiment (CADEX; Hofer et al., 2017, 2020a, b) were conducted.
However, the measurement data from these campaigns are still not able to meet the requirements for the investigation of global dust impact on climate, ocean/land geochemistry and ecosystems. Therefore, spaceborne lidars that are capable of observing aerosol have become effective instruments and are widely used in terms of dust plume measurements. The satellite-based lidar CALIOP (Cloud-Aerosol Lidar with Orthogonal Polarization) carried by the platform of CALIPSO (Cloud-Aerosol Lidar and Infrared Pathfinder Satellite Observations) provides us the backscatter coefficient and extinction coefficient at the wavelengths of 532 and 1064 nm (Winker et al., 2009). Additionally, the CALIOP vertical feature mask product (VFM) presents the aerosol sub-type classification so that the global dust events could be marked. Moreover, large efforts are still needed to monitor the dust emission, transport, dispersion and deposition and to explore the dust's impact on the Earth's radiation, climate and ecosystems. Hence, the vertical profiling of the global wind field is necessary to calculate the dust advection. Thanks to the efforts of the European Space Agency (ESA), a first ever spaceborne direct detection wind lidar, Aeolus, which is capable of providing vertical wind fields globally with high temporal and spatial resolution has been developed under the framework of the Atmospheric Dynamics Mission (ADM) (Stoffelen et al., 2005; Reitebuch et al., 2012; Kanitz et al., 2019). The Atmospheric Laser Doppler Instrument (ALADIN) is a direct detection high-spectral-resolution wind lidar carried by Aeolus and provides the vertical profiles of the horizontal-line-of-sight (HLOS) wind speeds. Further, the wind vector data assimilated with the HLOS wind speed data and the particle optical property data (e.g., extinction coefficient and backscatter coefficient) at 355 nm are also provided in the products of Aeolus.
A long-term, large-scale Saharan dust transport event which occurred between 14 and 27 June 2020 is captured, tracked and analyzed. Because of this record-breaking trans-Atlantic African dust plume, the magnitude and duration of spaceborne-sensor-retrieved aerosol optical depth over the tropical North Atlantic Ocean were the greatest ever observed during summer over the past 18 years (Pu and Jin, 2021). This dust plume caused a historic, massive African dust intrusion into the Caribbean Basin and southern United States, which is nicknamed the “Godzilla” dust plume (Yu et al., 2021). In the simultaneous observations of the dust plume, the aerosol optical properties can be obtained by means of ALADIN and CALIOP. By further using the wind vector data from ALADIN, the wind field and relative humidity (RH) data from ECMWF (European Centre for Medium-Range Forecasts), and the trajectories from HYSPLIT (Hybrid Single-Particle Lagrangian Integrated Trajectory model), the dust transport route can be observed, and the dust advection can be calculated.
The paper is organized as follows: in Sect. 2 the satellite-based instruments, ECMWF and HYSPLIT models, are introduced. Section 3 presents details of the joint dust measurement strategy and methodology. In Sect. 4 we provide the process of the dust event identification and verification as well as the observation results and the dust advection calculations of the dust transport measurements on 19 June 2020 and during the whole lifetime of the dust event.
2.1 ALADIN/Aeolus
On 22 August 2018, Aeolus was successfully launched into its sun-synchronous orbit at a height of 320 km (Witschas et al., 2020; Lux et al., 2020). A quasi-global coverage is achieved daily (∼ 15 orbits per day), and the orbit repeat cycle is 7 d (111 orbits). The orbit is sun-synchronous with a local equatorial crossing time of ∼ 06:00 and 18:00. ALADIN, which is the unique payload of Aeolus, is a direct detection high-spectral-resolution wind lidar. It is a pulsed ultraviolet lidar working at the wavelength of 354.8 nm with a laser pulse energy around 65 mJ and with a repetition of 50.5 Hz. As the receiver, a 1.5 m diameter telescope collects the backscattered light. In order to retrieve the LOS wind speeds, the Doppler shifts of light caused by the motion of molecules and aerosol particles need to be identified. Aiming at this, a Fizeau interferometer is applied in the Mie channel to extract the frequency shift of the narrow-band particulate return signal by means of the fringe imaging technique (Mckay, 2002). In the Rayleigh channel, two coupled Fabry–Perot interferometers are used to analyze the frequency shift of the broad-band molecular return signal by the double edge technique (Chanin et al., 1989; Flesia and Korb, 1999). The two-channel high-spectral-resolution design of ALADIN allows for the simultaneous detection of the molecular (Rayleigh) and particle (Mie) backscattered signals, each sampling the wind in 24 vertical height bins with a vertical range resolution between 0.25 and 2.0 km. This makes it possible to deliver winds both in clear and (partly) cloudy conditions down to optically thick clouds at the same time. The horizontal resolution of the wind observations is about 90 km for the Rayleigh channel and about 10 km for the Mie channel. The detailed descriptions of the instrument design and a demonstration of the measurement concept are introduced in, e.g., Reitebuch et al. (2009); Reitebuch (2012), Straume et al. (2018), ESA (2008), Marksteiner et al. (2013), Kanitz et al. (2019), Witschas et al. (2020) and Lux et al. (2020).
The data products of Aeolus are processed at different levels, namely Level 0 (instrument housekeeping data), Level 1B (engineering-corrected HLOS winds), Level 2A (aerosol and cloud layer optical properties), Level 2B (meteorologically representative HLOS winds) and Level 2C (Aeolus-assisted wind vectors) (Flamant et al., 2008; Tan et al., 2008; Rennie et al., 2020). Within the Level 2B processor, the Rayleigh-clear and Mie-cloudy winds are classified, and the temperature and pressure corrections are applied for the Rayleigh wind retrieval (Witschas et al., 2020). In this study, the Level 2A (baseline 10 referring to the L2A processor v3.10) aerosol optical properties and Level 2C (baseline 10 referring to the L2A processor v3.10) wind vectors are used. For the calculation of particle volume concentration distribution and mass concentration, the extinction coefficients at the wavelength of 355 nm are used.
2.2 CALIOP/CALIPSO
Launched in 2006, CALIPSO provides aerosol and cloud optical property information, e.g., particle depolarization ratio, extinction coefficient, backscatter coefficient and vertical feature mask (VFM) (Winker et al., 2009). The VFM product describes the vertical and horizontal distribution of cloud and aerosol types along the observation tracks of CALIPSO. In this study, the backscatter coefficients at the wavelengths of 532 and 1064 nm from the CALIPSO L2 product are used for the calculation of the dust volume concentration distribution and mass concentration. The VFMs from CALIPSO are also applied to identify the subtypes of aerosol layers. The extinctions from the CALIPSO L2 product are not used in this study because the global average lidar ratio taken for the CALIPSO retrieval is lower than the lidar ratio for Western Saharan dust. The extinctions at 532 and 1064 nm used in this study are calculated by the CALIPSO-retrieved backscatters and the corrected lidar ratios: 58 sr at 532 nm (Amiridis et al., 2013) and 60 sr at 1064 nm (Matthias et al., 2009).
2.3 ECMWF climate reanalysis
Supported by the Copernicus Climate Change Service (C3S), ECMWF provides the atmospheric reanalysis ERA5, which presents a detailed record of the global atmosphere, land surface and ocean waves from 1950 onwards (Hersbach et al., 2020). The 4D-Var-assimilated ERA5 produces the hourly vertical profiles (at 37 pressure levels) of global wind fields with a grid resolution of 31 km. After the successful launch of the Aeolus, the ECMWF started to simulate the wind products of Aeolus from January of 2020. In this study, the wind field data from ECMWF are applied to fill in the missing data within the region between the tracks of Aeolus and CALIPSO and to illustrate the homogeneity of the wind field in this region.
2.4 HYSPLIT
The Hybrid Single-Particle Lagrangian Integrated Trajectory model (HYSPLIT) is a modeling system for determining the trajectories, transport and dispersion of air masses developed by the National Oceanic and Atmospheric Administration (NOAA) Air Resources Laboratory (ARL) (Draxler and Hess, 1998; Draxler and Rolph, 2012). Backward and forward trajectories are the most commonly used model applications to determine the origin of air masses (Stein et al., 2015). In this study, HYSPLIT is used to describe and check the routes of transport, dispersion and deposition of dust plumes.
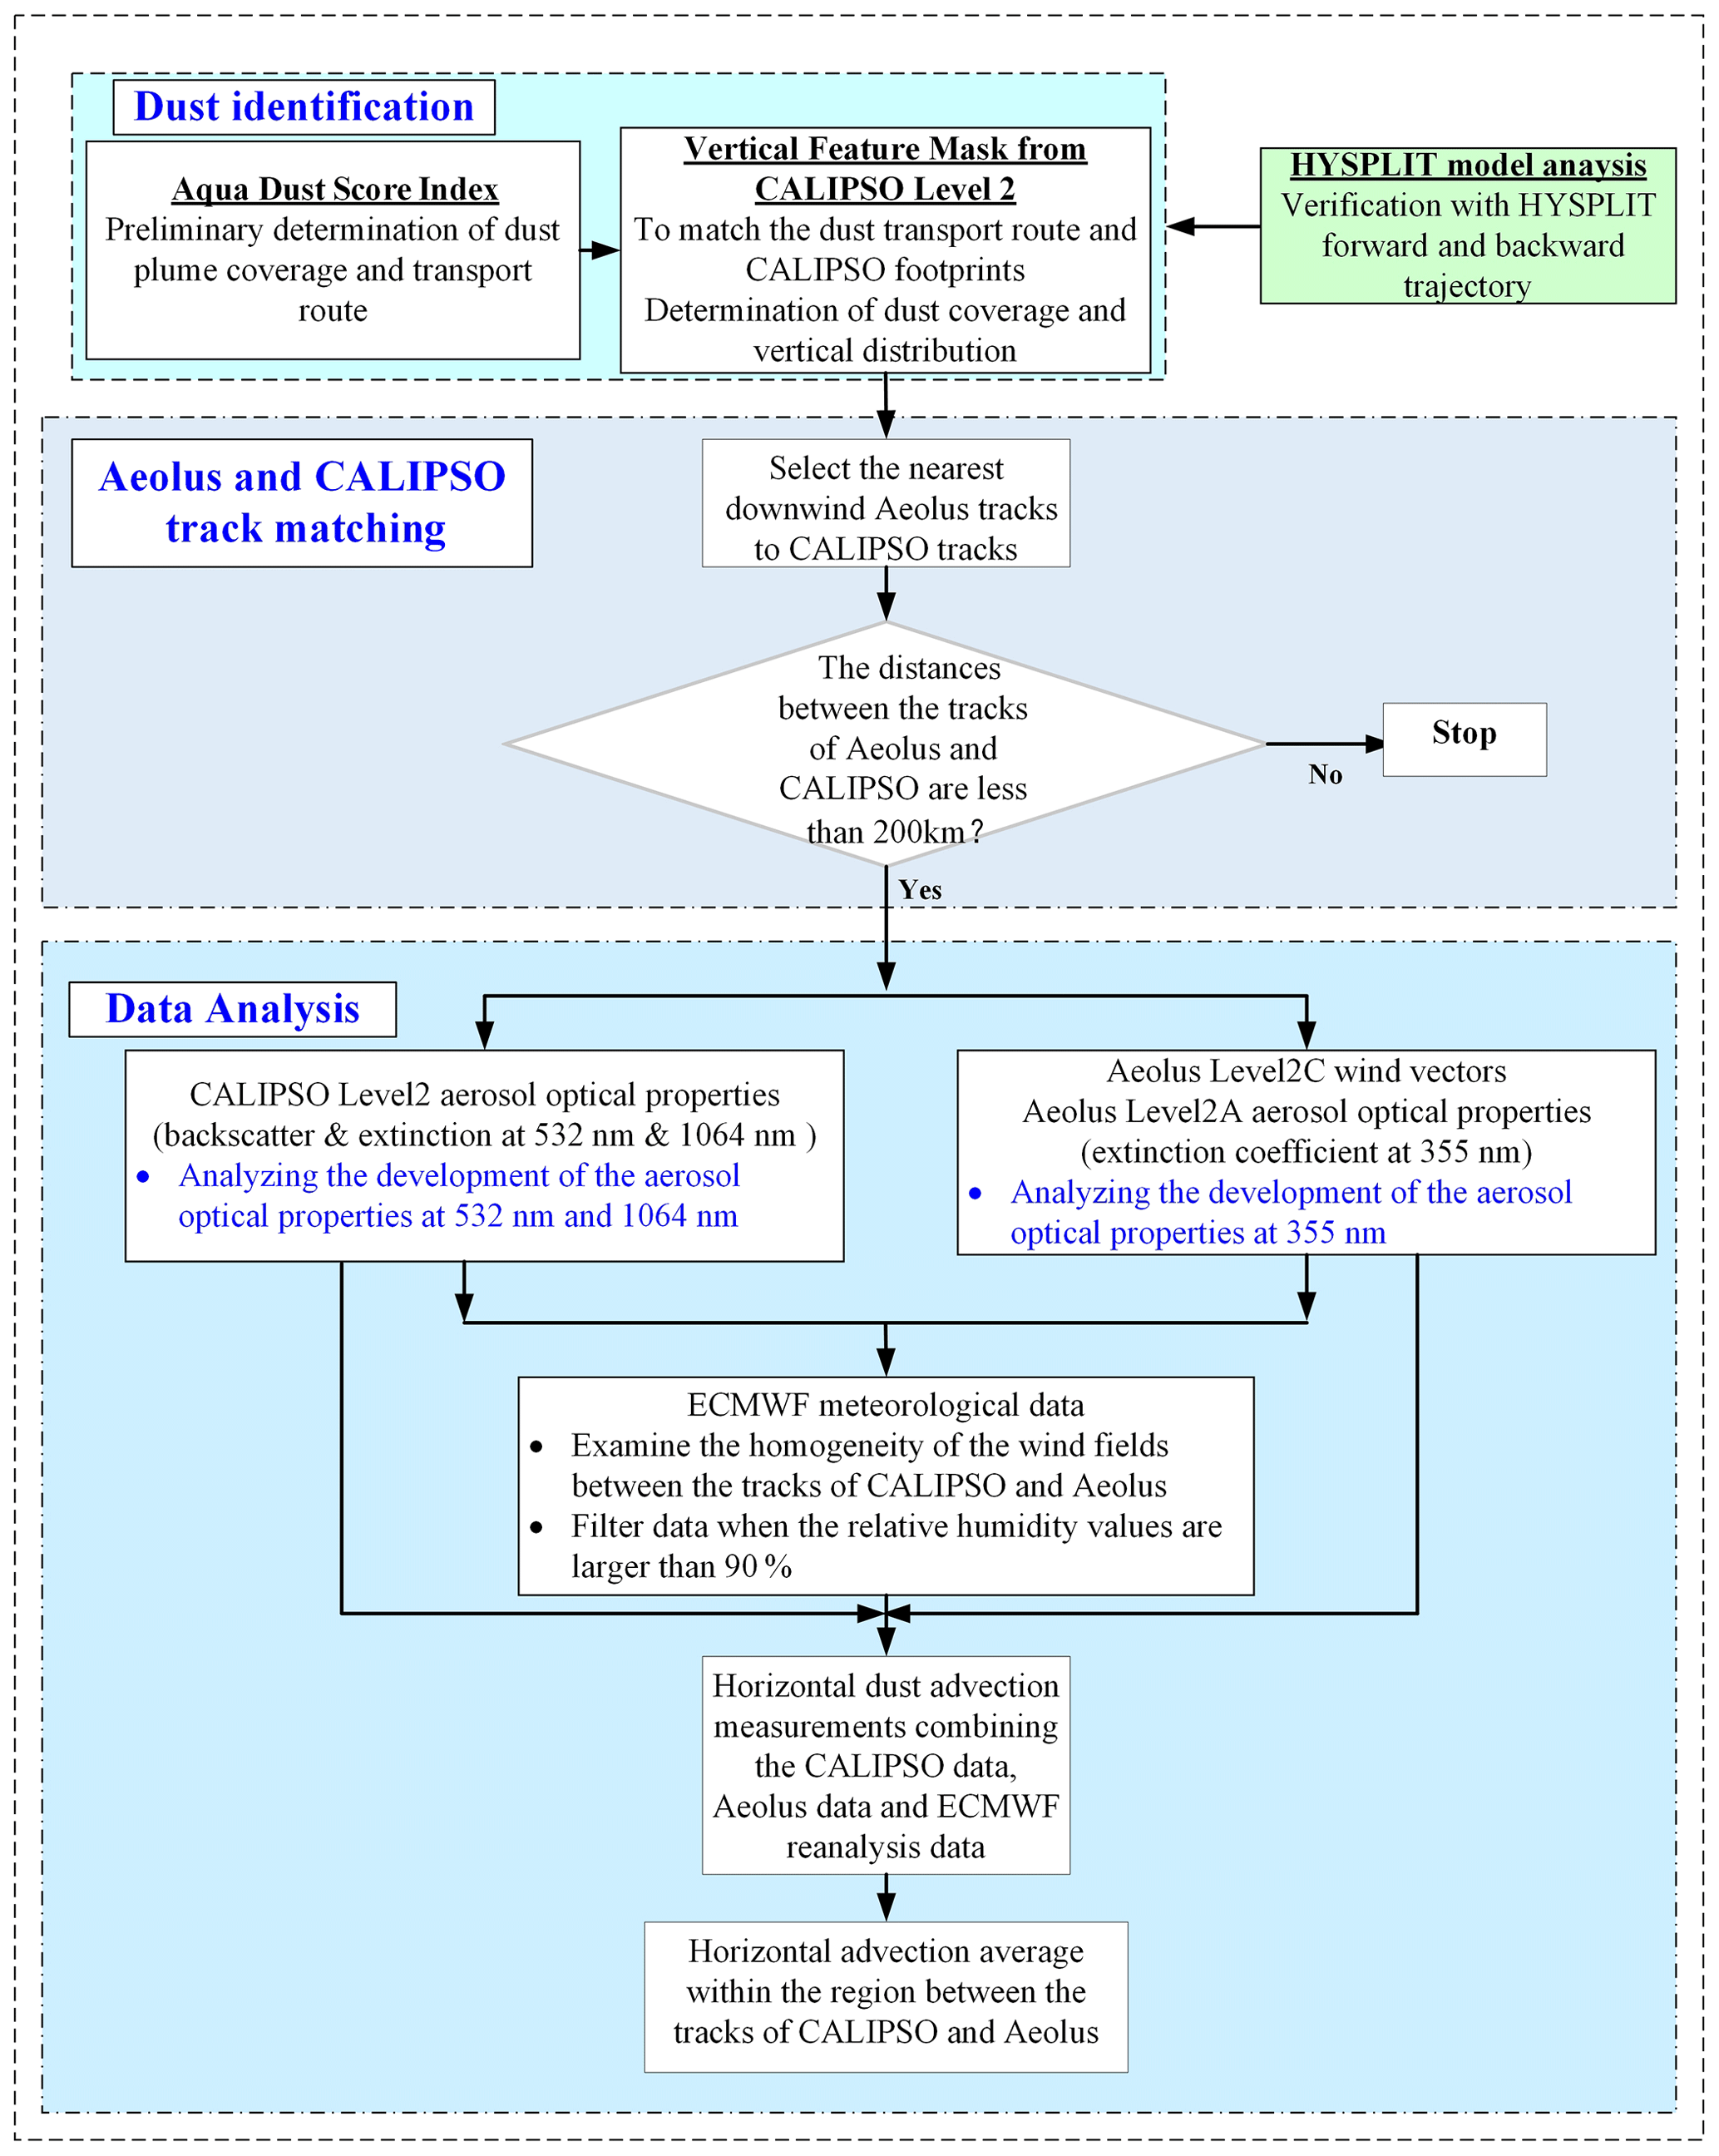
In the study of dust transport and advection, as shown in Fig. 1, the dust identification, Aeolus and CALIPSO track matching, data analysis and HYSPLIT model analysis are described in the schematic flowchart.
3.1 Method used to match CALIPSO and Aeolus data
To identify the dust events and to choose the quasi-synchronized observations with ALADIN and CALIOP, the Dust Score Index data provided by AIRS/Aqua are used to determine the dust plume coverage and transport route. With this information, the VFM products from the simultaneous observations with CALIOP are applied to cross-check the identification of dust events. Hence the vertical distributions of dust plumes are obtained. To find the original sources and to predict the transport routes of dust plumes, the backward trajectory and forward trajectory are used respectively. When the dust events are determined, the simultaneous observations with ALADIN and CALIOP have to be selected. Starting from the CALIOP observations, the nearest Aeolus footprints were found. Since the orbits of Aeolus and CALIPSO are different, they cannot meet each other at exactly the same time and same location. From our study, the closest CALIPSO scanning tracks to those of Aeolus are about 4 h ahead of Aeolus. Based on the transport directions of dust events modeled with HYSPLIT, the tracks of Aeolus should always be downwind of the tracks of CALIPSO. When the tracks of Aeolus and CALIPSO are selected, the distances between the tracks can be calculated. Assuming the wind speed between CALIPSO scanning tracks and Aeolus is in the range of 5 to 15 m s−1, the transport distances of the dust plumes are in the range of 72 to 216 km. During this short period, dust optical properties remain almost unchanged (Haarig et al., 2017). Consequently, if the distances between two satellite scanning tracks are less than 200 km and the tracks of Aeolus are downwind of the tracks of CALIPSO, it is reasonable to state that the dust plumes captured by CALIPSO are transported towards the Aeolus scanning regions in around 4 h; hence the following procedures could be continued. To conclude, a successful match meets at least two criteria, including the following: (1) the tracks of Aeolus are downwind of the tracks of CALIPSO, and (2) the distances between two satellites scanning tracks are less than 200 km.
3.2 Datasets and quality control
This study uses the extinction coefficient at 355 nm from ALADIN and the backscatter coefficients at 532 and 1064 nm from CALIOP. The extinction coefficient at 355 nm corresponds to the Aeolus Level 2A product retrieved by the SCA (standard correction algorithm). In this study, we choose the SCA instead of the ICA (iterative correction algorithm) because the extinction coefficients from the ICA are noisy, and the assumption of “one single particle layer filling the entire range bin” in the SCA is met in the situation of the heavy dust events. Additionally, we use the mid-bin product (sca_optical_properties_mid_bins) of the SCA instead of the normal product of the SCA because the mid-bin algorithm provides more robust results (Baars et al., 2021; Flament et al., 2021). The extinction coefficient, which is more sensitive to noise and is the significant input of the dust advection calculation, is better retrieved through this mid-bin averaged version of the algorithm. In terms of quality control, negative extinction coefficient values of L2A are excluded, while the “bin_1_clear” flag and the “processing_qc_flag” of L2A are used to eliminate invalid data. The backscatter coefficients at 532 and 1064 nm are the “Total_Backscatter_Coefficient_532” and “Backscatter_Coefficient_1064” from CALIPSO. Since the footprints of Aeolus and CALIPSO are not matched exactly, the missing wind data between their tracks have to be filled in using the ERA5 wind field data. There are two reasons for using the ERA5 wind field data between Aeolus and CALIPSO tracks. One is that the ERA5 wind speed and direction data provide the evidence of dust transport from CALIPSO tracks towards Aeolus tracks. Secondly, the ERA5 wind field data between the tracks of Aeolus and CALIPSO at all height surfaces are smoothly distributed, and the values are stable. However, the Aeolus L2C data can also be used at the location of the CALIPSO track.
3.3 Dust advection calculation
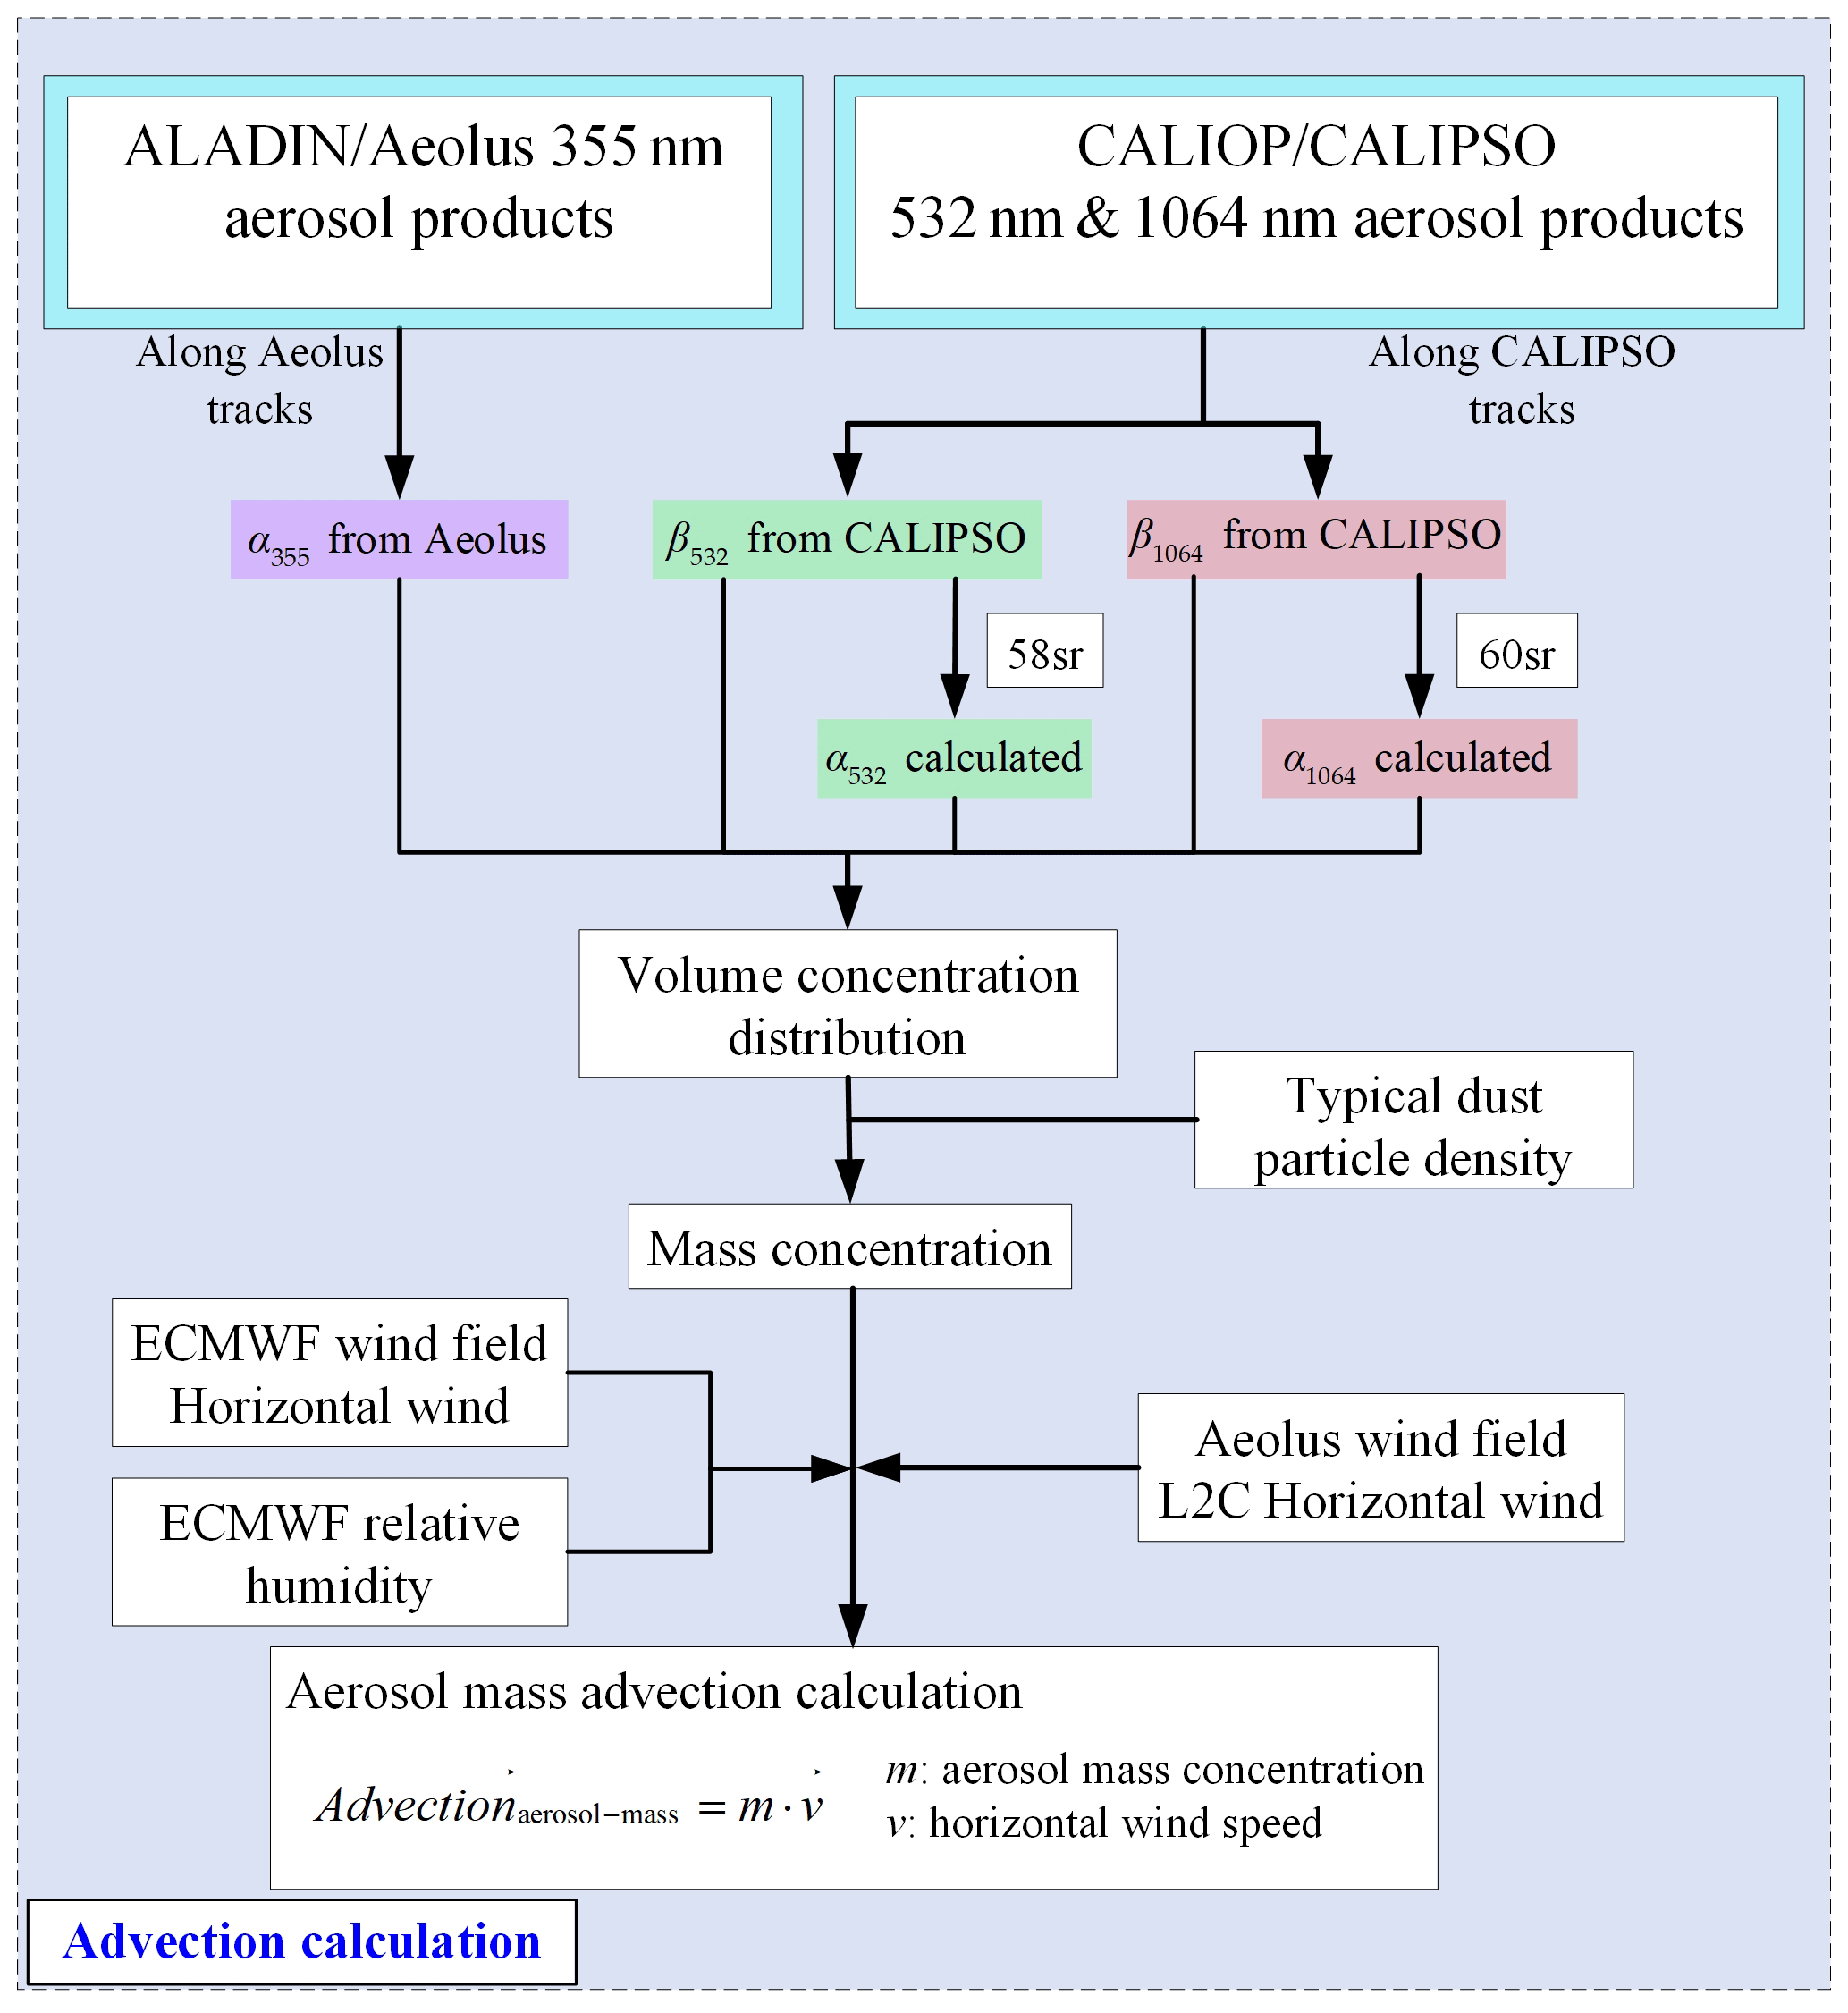
In Fig. 2, the flowchart of dust mass advection calculation procedure is provided. Based on the dataset consisting of the backscatter coefficients and extinction coefficients at the wavelengths of 1064 and 532 nm from CALIOP and the extinction coefficients at the wavelength of 355 nm from ALADIN, the aerosol volume concentration distribution can be estimated based on the regularization method, which was performed by generalized cross-validation (GCV) from Müller et al. (1999). The lidar ratio for Western Saharan dust is higher than the global average taken for the CALIPSO retrieval; thus the extinctions from the CALIPSO L2 product are not used in the calculation of the aerosol volume concentration. The extinctions at 532 and 1064 nm utilized for the regularization method are calculated from the CALIPSO backscatter and the corrected lidar ratios: 58 sr at 532 nm (Amiridis et al., 2013) and 60 sr at 1064 nm (Matthias et al., 2009).
The advantage of this method is that it does not require prior knowledge of the shape of the particle size distribution, and the estimated uncertainty of aerosol volume concentration is on the order of 50 % if the estimated errors of the inputs are on the order of 20 %. For the backscatter coefficient at 532 nm, during the daytime, the average difference between collocated CALIPSO and high-spectral-resolution lidar (HSRL) measurements is 1.0 % ± 3.5 % in V4 (Getzewich et al., 2018); for the backscatter coefficient at 1064 nm, the CALIOP V4 1064 nm calibration coefficients are accurate to within 3 % (Vaughan et al., 2019). Consequently, we consider the uncertainties of CALIPSO-retrieved extinction and backscatter coefficients to be of order 20 %. According to Flament et al. (2021), because of the lack of cross-polarized light, backscatter coefficients at 355 nm of Aeolus are underestimated, especially for dust aerosol. Nevertheless, the extinction is not affected. In this work, Aeolus-retrieved backscatter coefficients at 355 nm are not applied for the calculations of the dust volume concentration distribution and mass concentration. For the accuracy of the Aeolus-retrieved extinction coefficient, the simulation extinction coefficients mostly fit the inputs well, especially when the altitude is larger than 2 km (Flament et al., 2021). Hence, we consider that after rigorous quality control, the Aeolus L2A extinction coefficient could be the input parameter of the regularization method. In conclusion, the estimated errors of the five input parameters we used to calculate the aerosol volume concentration are on the order of 20 %. The estimate errors of dust advection are the combination of mass concentration estimate errors (∼ 50 %) and Aeolus L2C wind vector estimate errors.
It should be emphasized that due to the different vertical and horizontal resolution between Aeolus and CALIPSO data, a common pixel grid should be established before calculation. For vertical resolution, 23 data bins of Aeolus L2A mid-bin optical property products are interpolated to 399 data bins of CALIPSO according to the altitude information of two products. For horizontal resolution, both Aeolus and CALIPSO products are averaged along every integer latitude to acquire a common horizontal pixel grid. After integrating and multiplying an assuming typical dust particle density which is set as 2.65 g cm−3, referring to previous studies (e.g., Schepanski et al., 2009; Hofer et al., 2017; Mamouri and Ansmann, 2017), the particle mass concentration is estimated following the method of Engelmann et al. (2008). ECMWF wind field data and RH data between Aeolus and CALIPSO scanning tracks are averaged along longitude and averaged along every integer latitude, while, vertically, they are interpolated to CALIPSO data bins to match the common pixel grid. Since the observations with ALADIN and CALIOP are not exactly simultaneous, the ECMWF wind field data between the two spaceborne lidars' scanning tracks are utilized to illustrate the homogeneity of the wind field between two tracks, so that the Aeolus L2C wind vector data along the Aeolus tracks can represent the wind field of the whole area and can be employed in the calculation of the dust mass advection. In the transport regions of the dust plume (between 5∘ and 30∘ N), if both of the standard deviation percentages of wind speed and direction along each latitude line are less than 10 %, it is considered that the wind fields between the two spaceborne lidars' scanning tracks are homogeneous and stable. Additionally, when the RH is larger than 90 %, the dust aerosol will be influenced by the hygroscopicity effect, and its properties could change. Then the mass concentration calculation method does not make sense any more (Engelmann et al., 2008). Meanwhile, if the RH is larger than 94 %, then the probability that cloud is present is quite high (Flamant et al., 2020). Therefore, relative humidity data provided by ECMWF are used to filter unavailable data of which the RH is larger than 90 %. For the cloud screening and dust aerosol separation of the common data pixel grid, aside from the RH data, we use Level 2 5 km aerosol profile products from CALIPSO, which only provide aerosol optical properties so the cloud can be screened, while the VFM products from CALIPSO are used to identify dust aerosol. Only the data bins of the common pixel grid that are identified as “dust” are employed in the estimation of the dust mass concentration.
Ultimately, combining the particle mass concentration and the horizontal wind vector provided by the Aeolus L2C product, the dust mass advection is defined as Eq. (1), to represent the transportation of dust aerosol quantitatively.
where m is the aerosol mass concentration, and v is the horizontal wind vector.
4.1 Dust identification and verification by AIRS/Aqua, CALIOP and HYSPLIT
During 14 and 27 June 2020, a complete dust event process, including dust emission, transportation, dispersion and deposition, took place in the regions of Africa, Atlantic Ocean and the Americas. In Fig. 3, the Dust Score Index provided by AIRS/Aqua at different stages is presented. From this figure, it is shown that the long-term dust event generated on 14 and 15 June 2020 from the Sahara in North Africa dispersed and moved westward over the Atlantic Ocean, finally being deposited in the western part of the Atlantic Ocean, the Americas and the Caribbean Sea. It should be emphasized that since the dust scores are provided per day, the dust events are just preliminarily classified. From the spaceborne CALIOP observations, it is found that sometimes dust events are actually present but are misjudged by AIRS/Aqua, which may result from the interference of the high-altitude cloud layers. The daily dust score data over the Sahara–Atlantic–Americas region generally reveal the transportation of the dust plume horizontally.
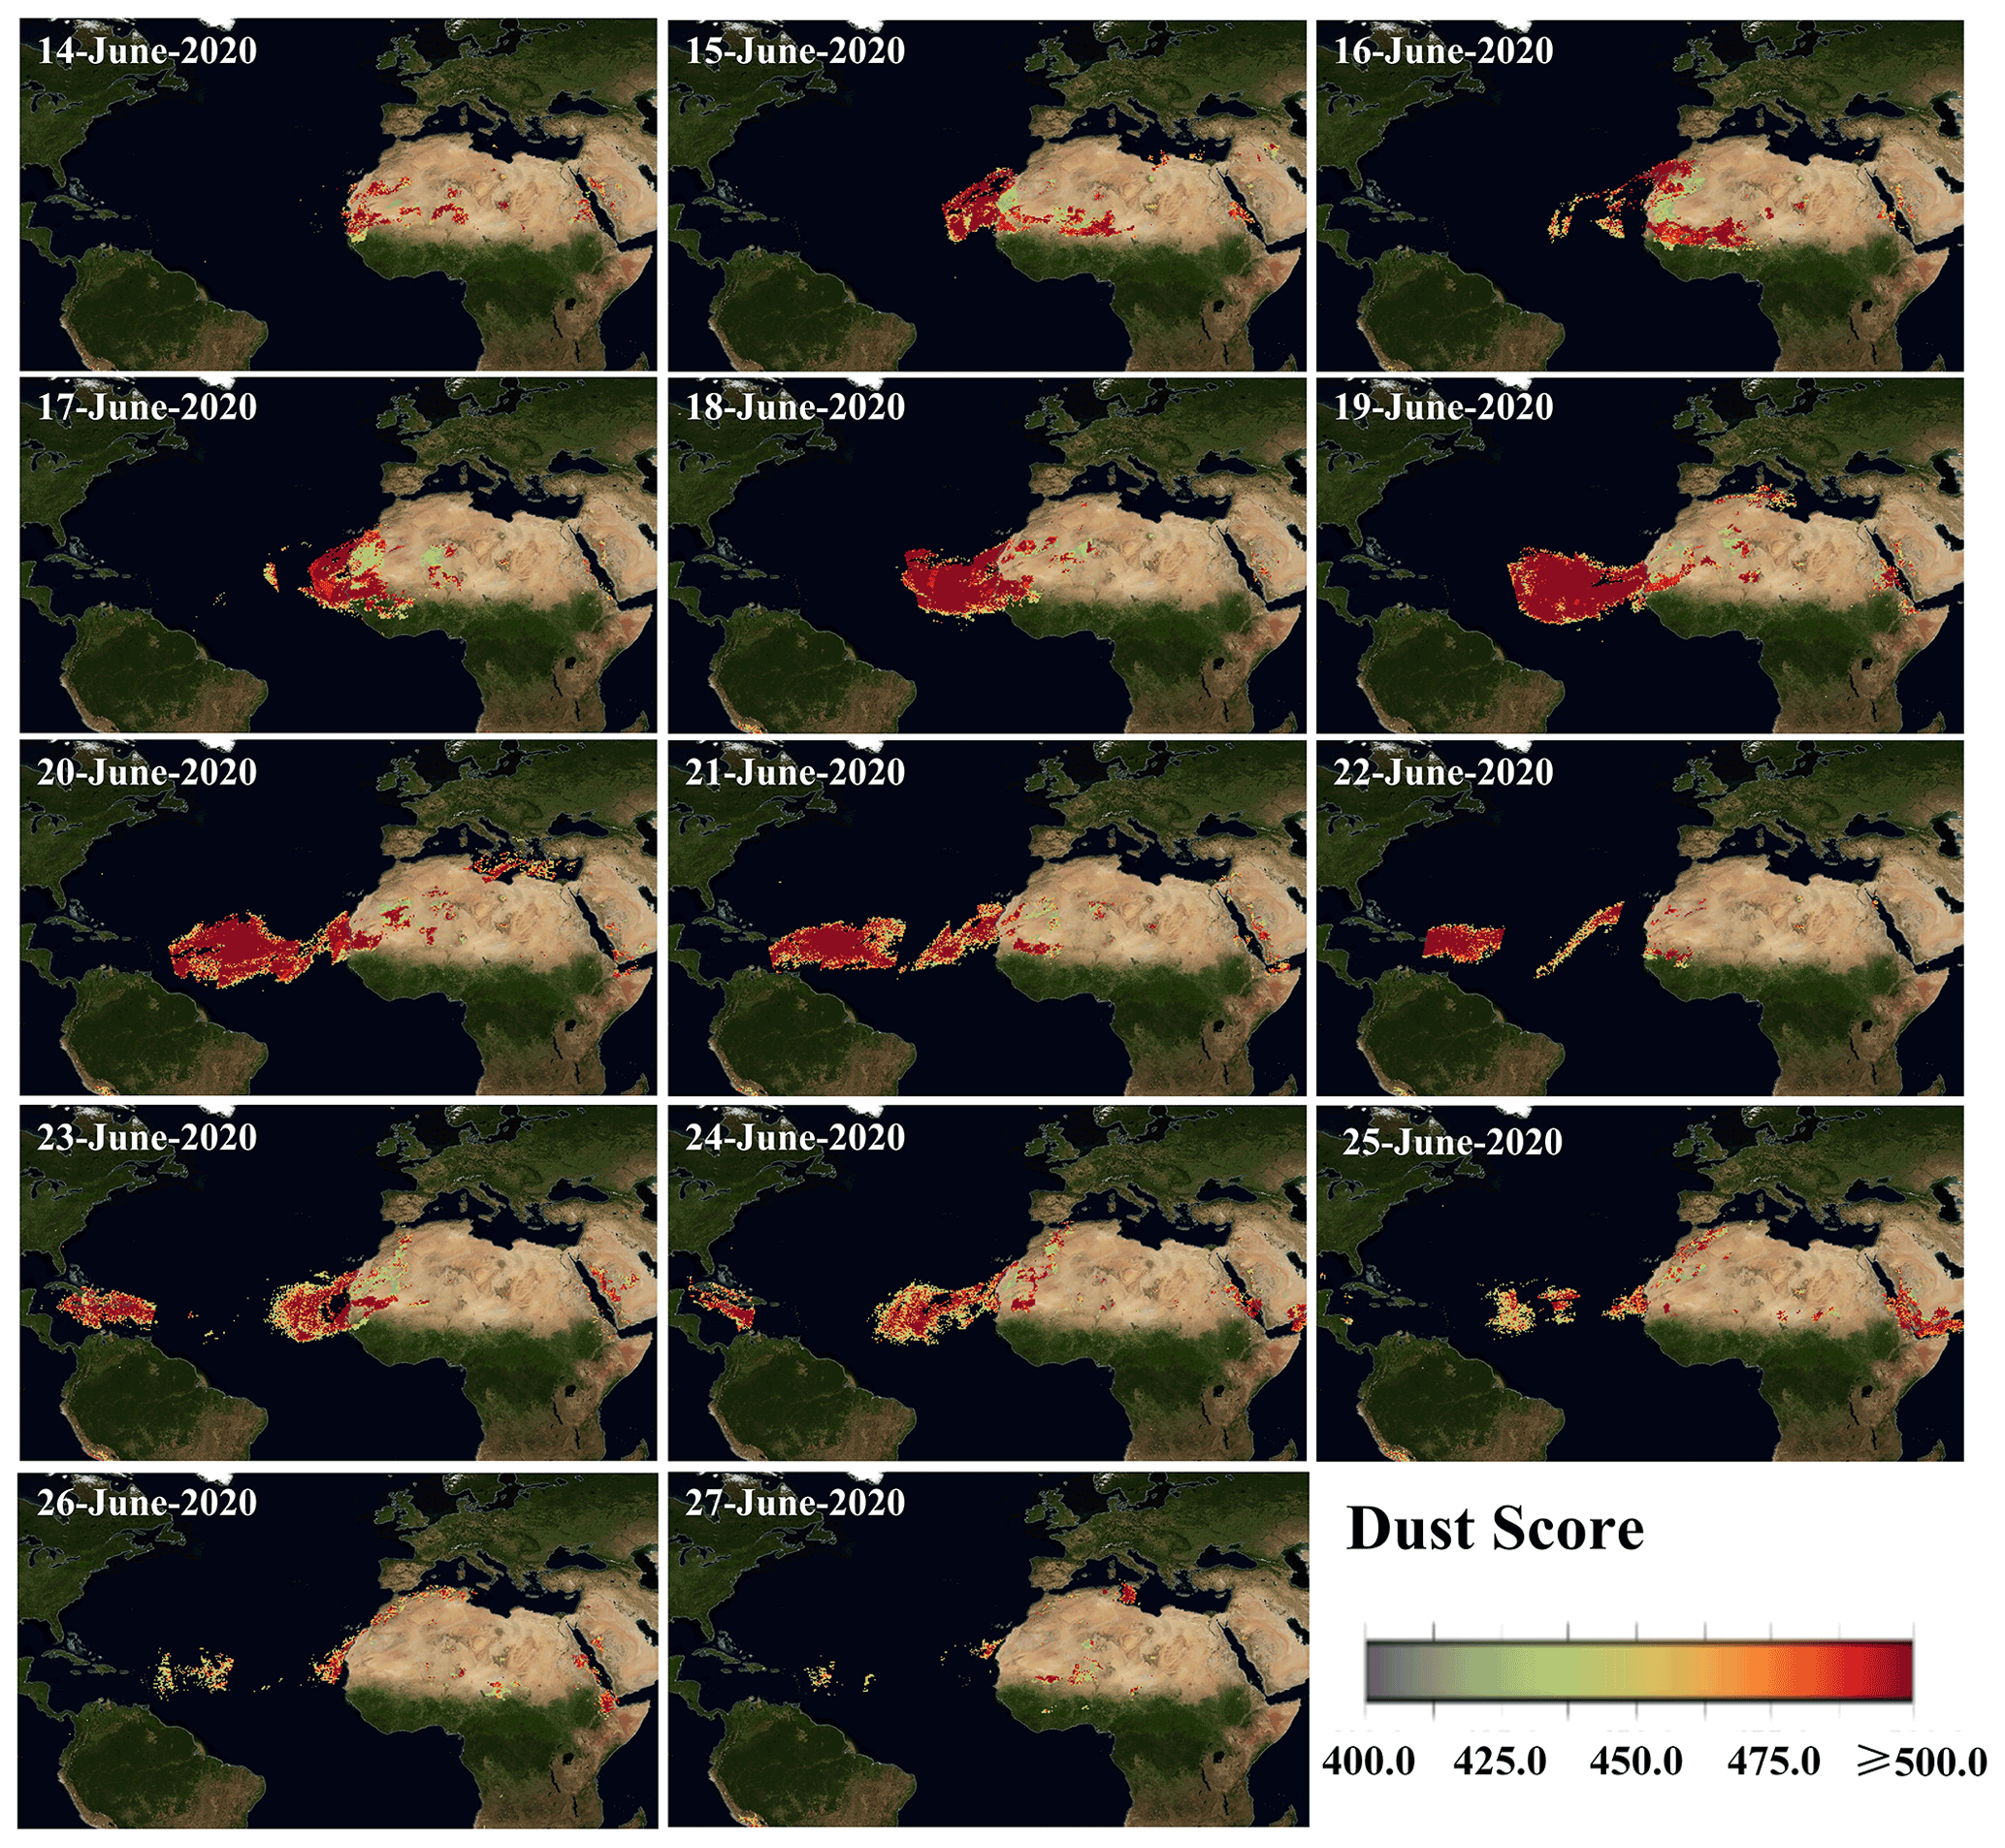
Figure 3The Dust Score Index provided by AIRS/Aqua at different stages, including emission, transportation, dispersion and deposition (https://airs.jpl.nasa.gov/map/, last access: 10 January 2022).
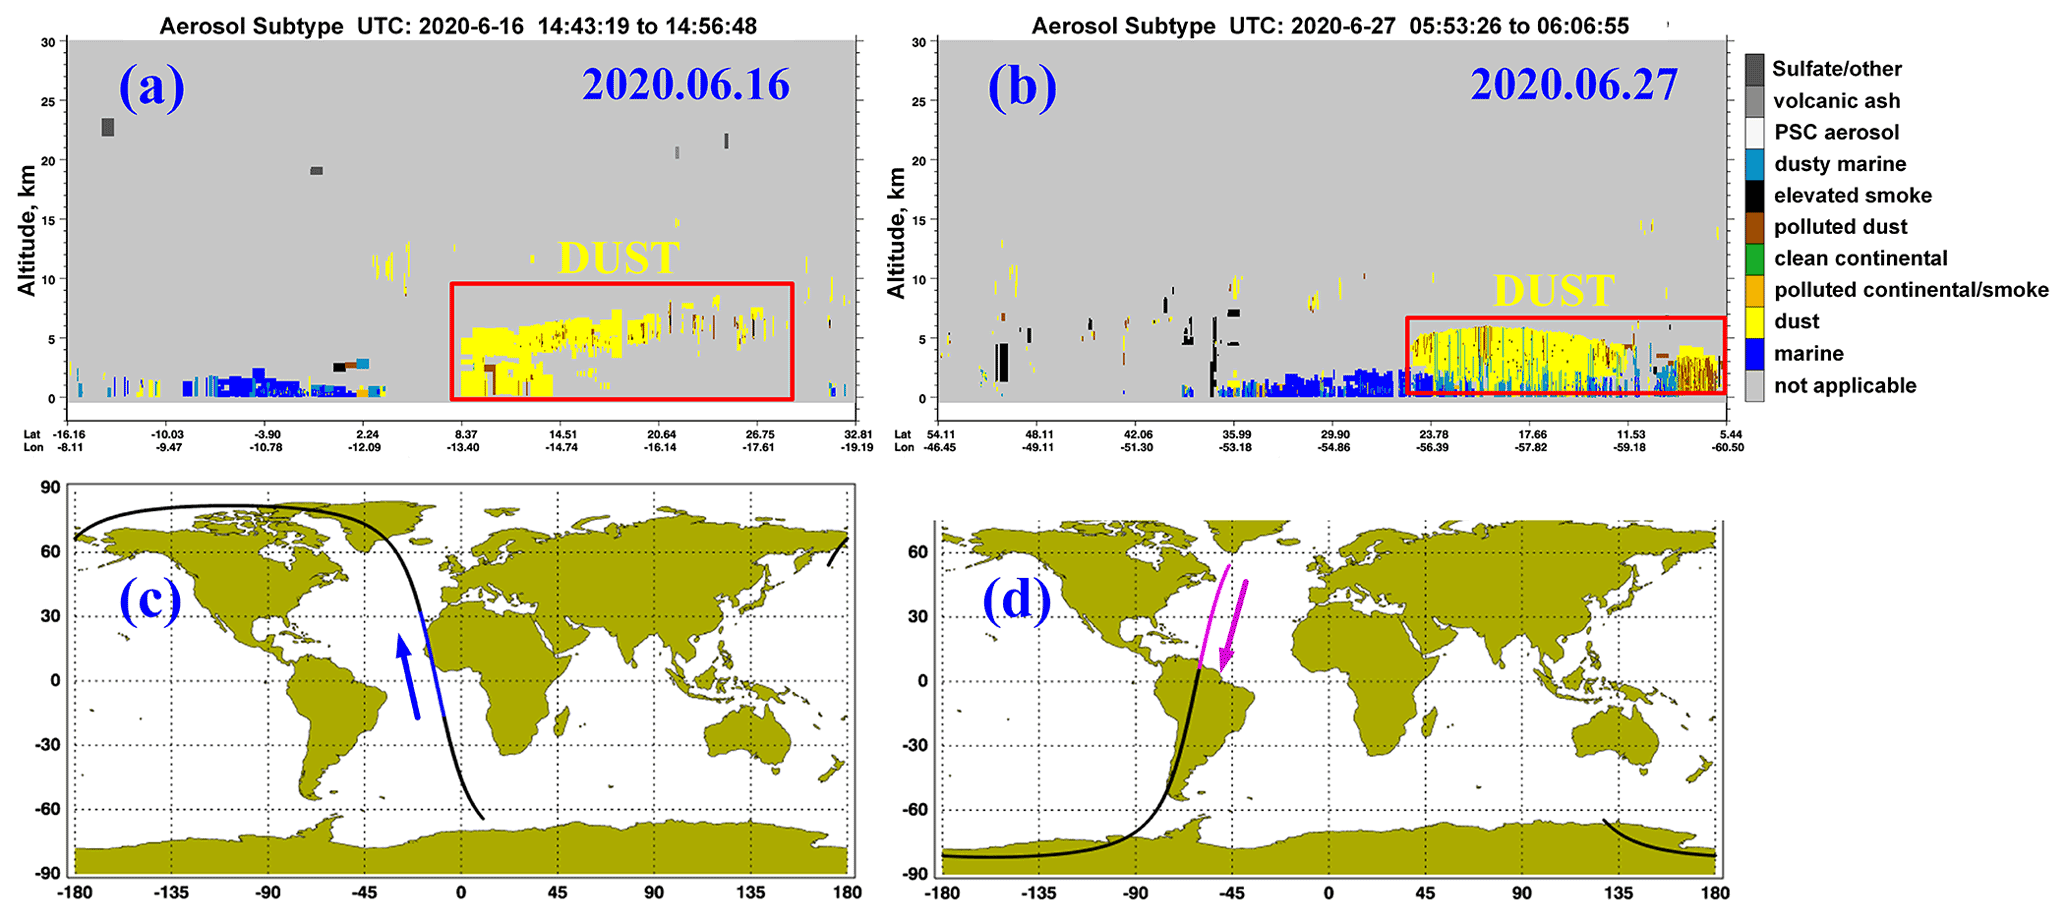
Figure 4Vertical feature mask from CALIPSO L2 product (a) on 16 June 2020 over the west coast of Africa and the eastern Atlantic and (b) on 27 June 2020 over the western Atlantic (around the east coast of America). Panels (c) and (d) show the corresponding CALIOP scanning tracks of (a) and (b) respectively, the arrows in which indicate the motion direction of CALIPSO (https://www-calipso.larc.nasa.gov/products/lidar/browse_images/production/, last access: 24 March 2022).
Figure 4 presents the vertical distribution of the dust plume during the development phase (16 June 2020) over the eastern Atlantic and during the deposition phase (27 June 2020) over the western Atlantic. From Fig. 4a, it can be seen that the dust plume has been lifted up to around 7 km. Figure 4b presents the descending dust plume, the bottom of which may mix with marine aerosol and become dusty marine aerosol. Therefore, the VFM data of CALIPSO capture the dust plume vertically over the eastern and the western Atlantic and verify the dust transportation process.
To cross-check the transport route of the dust events, three adjacent typical aerosol profiles capturing dust aerosol layers from one CALIPSO orbit and the corresponding backward and forward trajectories starting at 04:00 UTC 19 June 2020 of these three positions conducted with the NOAA HYSPLIT model are shown in Fig. 5. CALIPSO total backscatter coefficient profiles and particle depolarization ratio profiles of position A (22.72∘ N, 30.23∘ W), position B (14.44∘ N, 32.12∘ W) and position C (8.21∘ N, 33.49∘ W) are shown in Fig. 5a, c and e. It can be found that there are dust aerosol layers at these three positions in the altitude range of 3 km to 5 km. Hence, the starting altitude of the HYSPLIT trajectories of these three positions was set as 3, 4 and 5 km. In addition, the backward and forward trajectories' durations are 96 and 192 h, respectively. From Fig. 5b, d and f, i.e., the HYSPLIT trajectories, it is seen that the dust aerosol of position A and the dust aerosol at the altitude of 4 and 5 km of position C are mainly generated from the middle of the Sahara. The dust aerosol of position B and the dust aerosol at 3 km of position C are originated from the Western Sahara. The forward trajectories clearly indicate the descents of most dust plumes and the possible continued transport of part of the dust plumes. At the end of the forward trajectories at 4 and 5 km of position A and at the end of the forward trajectories of position B, the altitudes of the trajectories reduce to around 1 to 2 km, which indicates the descents of the dust plumes. However, the forward trajectories at 3 km of position A and position C show obvious ascents when approaching the end, indicating the possible continued transport of the dust plumes. Moreover, the trajectories of position C show a relatively smooth transport of the dust aerosol from the Sahara to the Gulf of Mexico and North America. The trajectories of position A and position B circle above the Atlantic, which presents slower transport of dust plumes than position C. It can be concluded that, from 15 to 27 June 2020, transported over the whole Atlantic Ocean, the dust plumes from the Sahara were transported to Central and South America, Caribbean Sea, the Gulf of Mexico and even North America. Most dust plumes descended and might deposit to ocean or land, while some of the dust plumes were possibly transported continuously. It can also be inferred that, because of the different atmosphere conditions along the transport routes of separate positions, the transport speed of the dust plumes turned out differently.
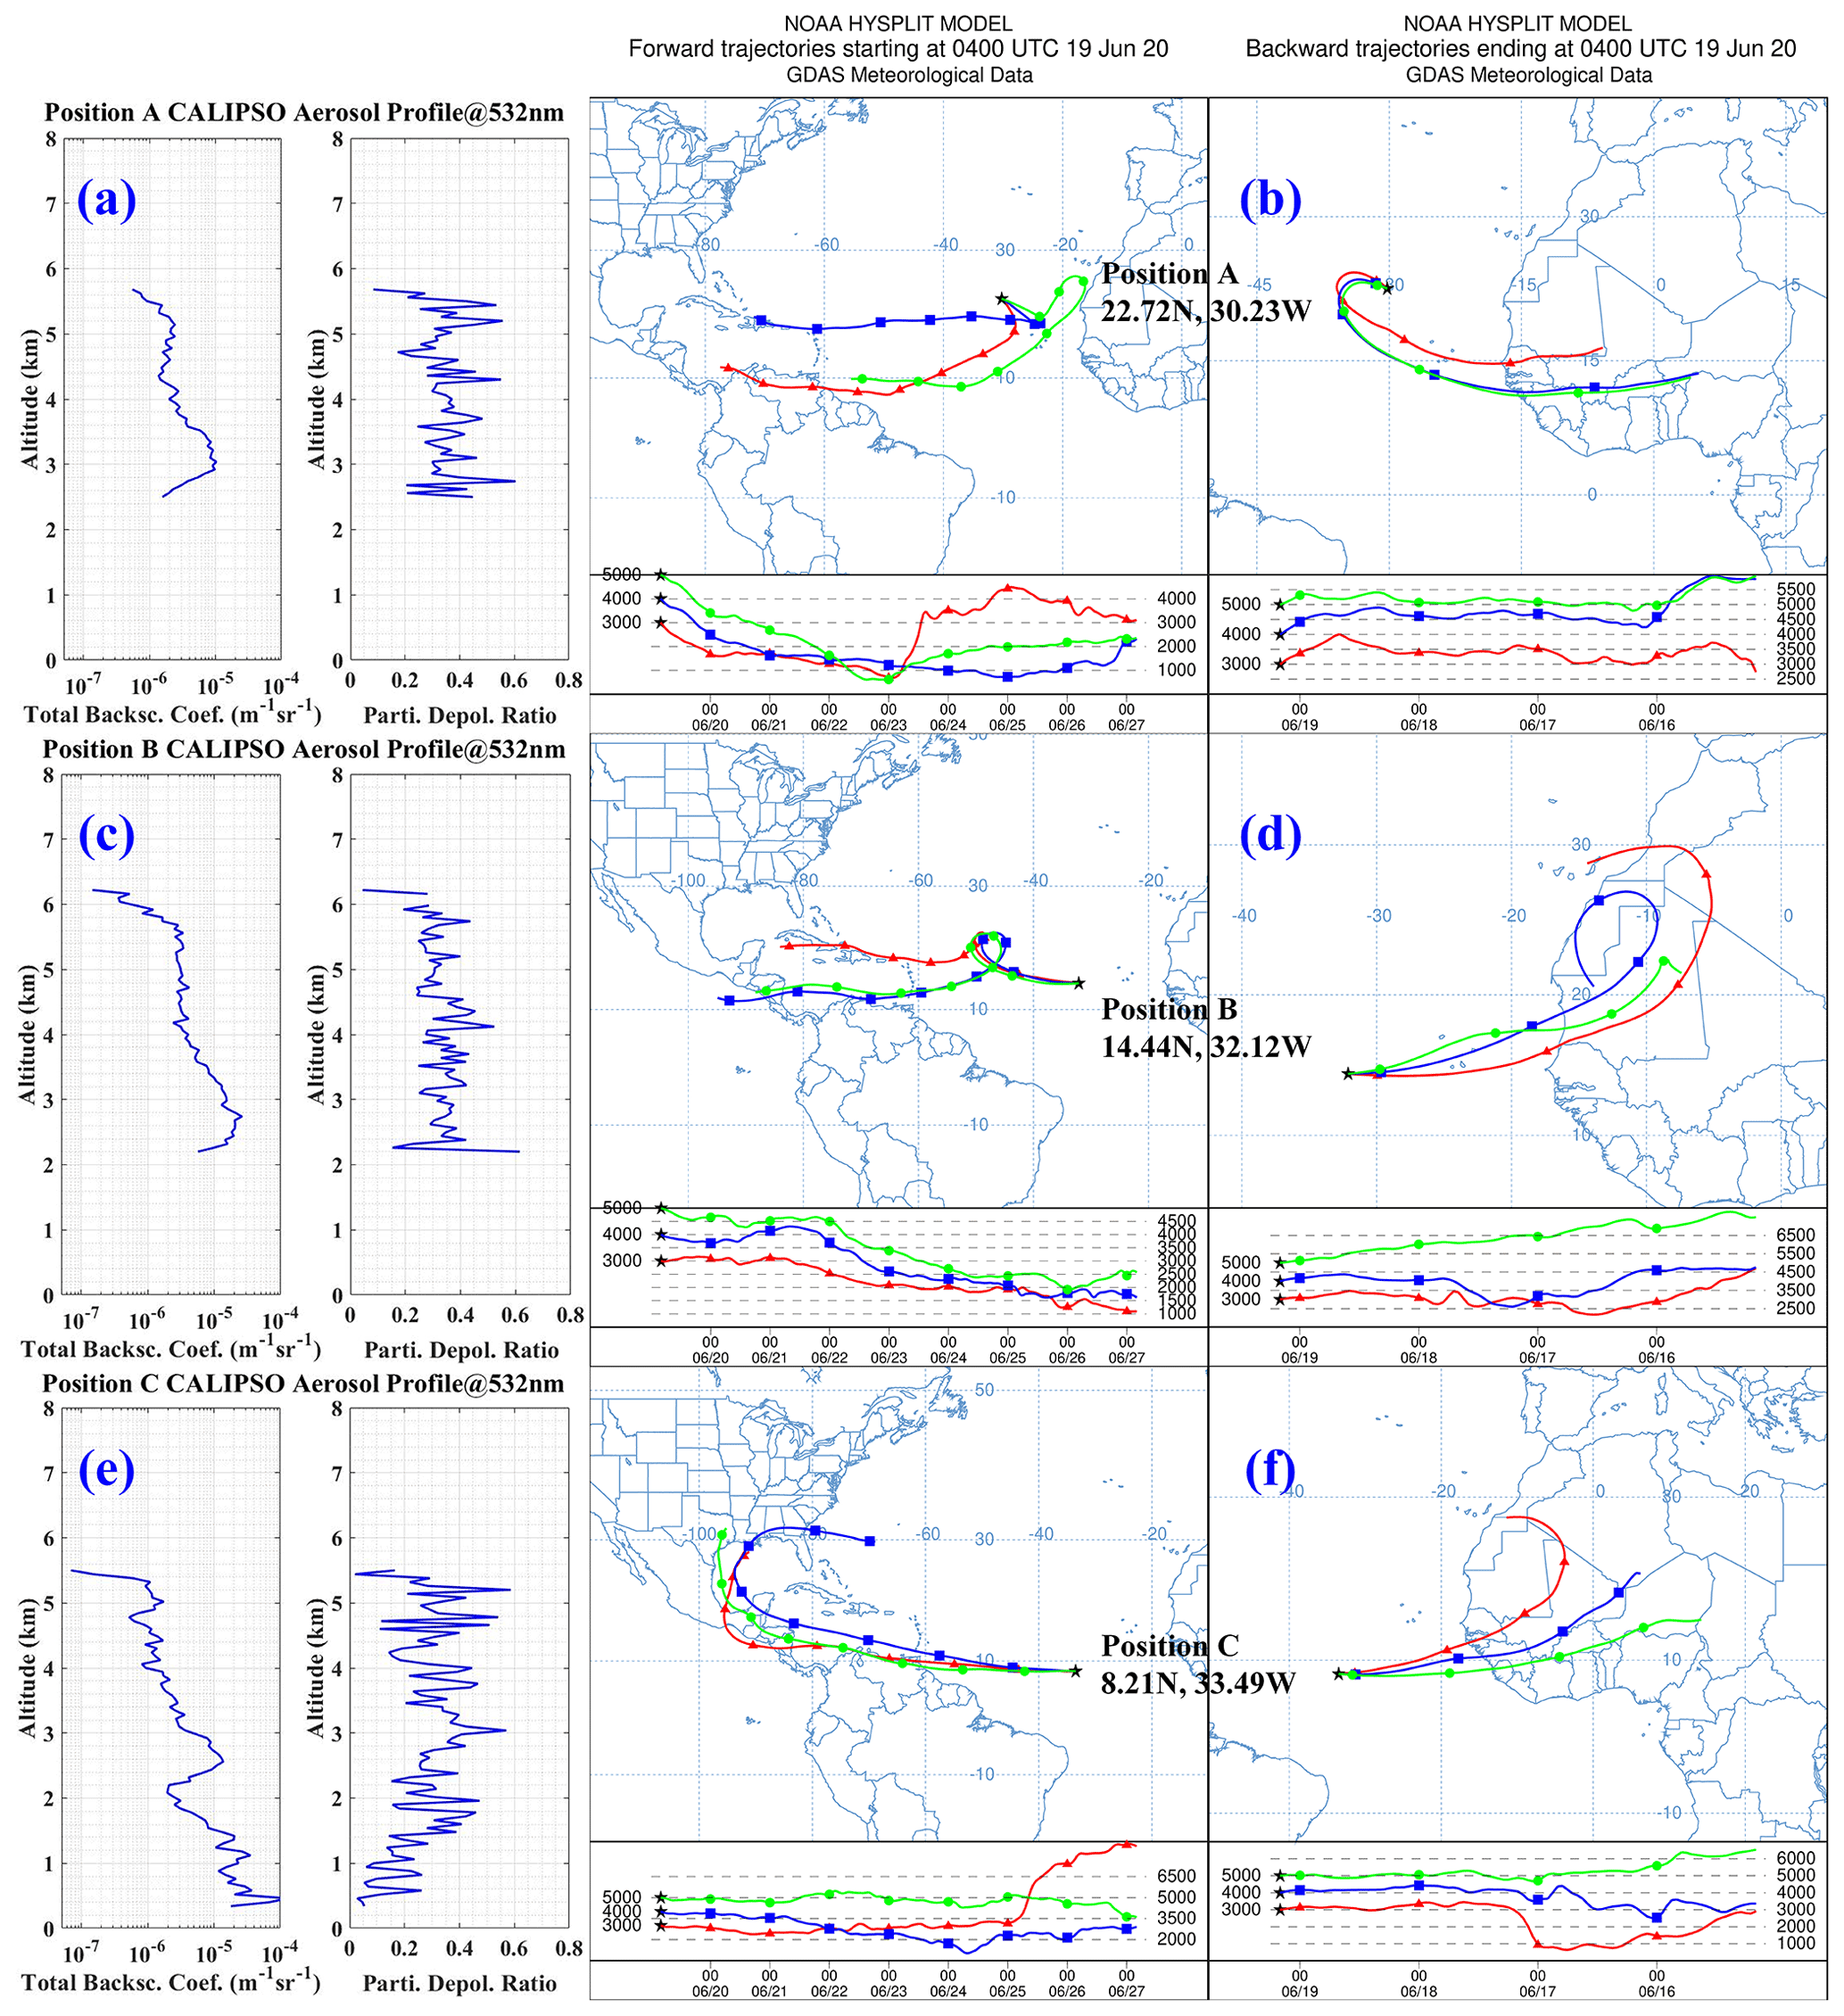
Figure 5(a, c, e) CALIPSO total backscatter coefficient profiles and particle depolarization ratio profiles capturing dust layers at around 04:00 UTC on 19 June 2020. (b, d, f) HYSPLIT backward trajectories and forward trajectories at different positions of corresponding CALIPSO profiles and different altitudes at 04:00 UTC on 19 June 2020. The backward and forward trajectories' durations are 96 and 192 h respectively (https://www.ready.noaa.gov/hypub-bin/trajtype.pl?runtype=archive, last access: 23 March 2022).
4.2 Observation snapshot of the dust plume and dust advection calculation on 19 June 2020
In this section, the dust event observation snapshot captured by ALADIN and CALIOP on 19 June 2020 is introduced in detail. The quasi-synchronized observations from ALADIN and CALIOP on 19 June 2020 are presented in Fig. 6, where the purple lines indicate the scanning tracks of ALADIN, and the green lines indicate the scanning tracks of CALIOP. It is found that the overpasses of each satellite are only around 3 h apart. Hence, we captured the dust layers on the morning of 19 June 2020 quasi-simultaneously over the Western Sahara, the middle Atlantic and the western Atlantic; i.e., we took a snapshot of the dust plumes. From the profiling of dust optical properties, discriminated by the CALIOP measurements, the dust geographical distribution over Atlantic Ocean on this day could be determined. The extinction coefficients and backscatter coefficients at the wavelengths of 355, 532 and 1064 nm within the dust mass are also determined. From the profiling, it was found that the mean backscatter coefficients at 532 nm were about m−1 sr−1 in cross-section 1, m−1 sr−1 in cross-section 2 and m−1 sr−1 in cross-section 3. On 19 June 2020, the dust layers existed over the Western Sahara, the middle Atlantic and the western Atlantic quasi-simultaneously, which indicates that the dust plume area over the Atlantic on the morning of this day is quite enormous and that this dust transport event is massive and extensive.
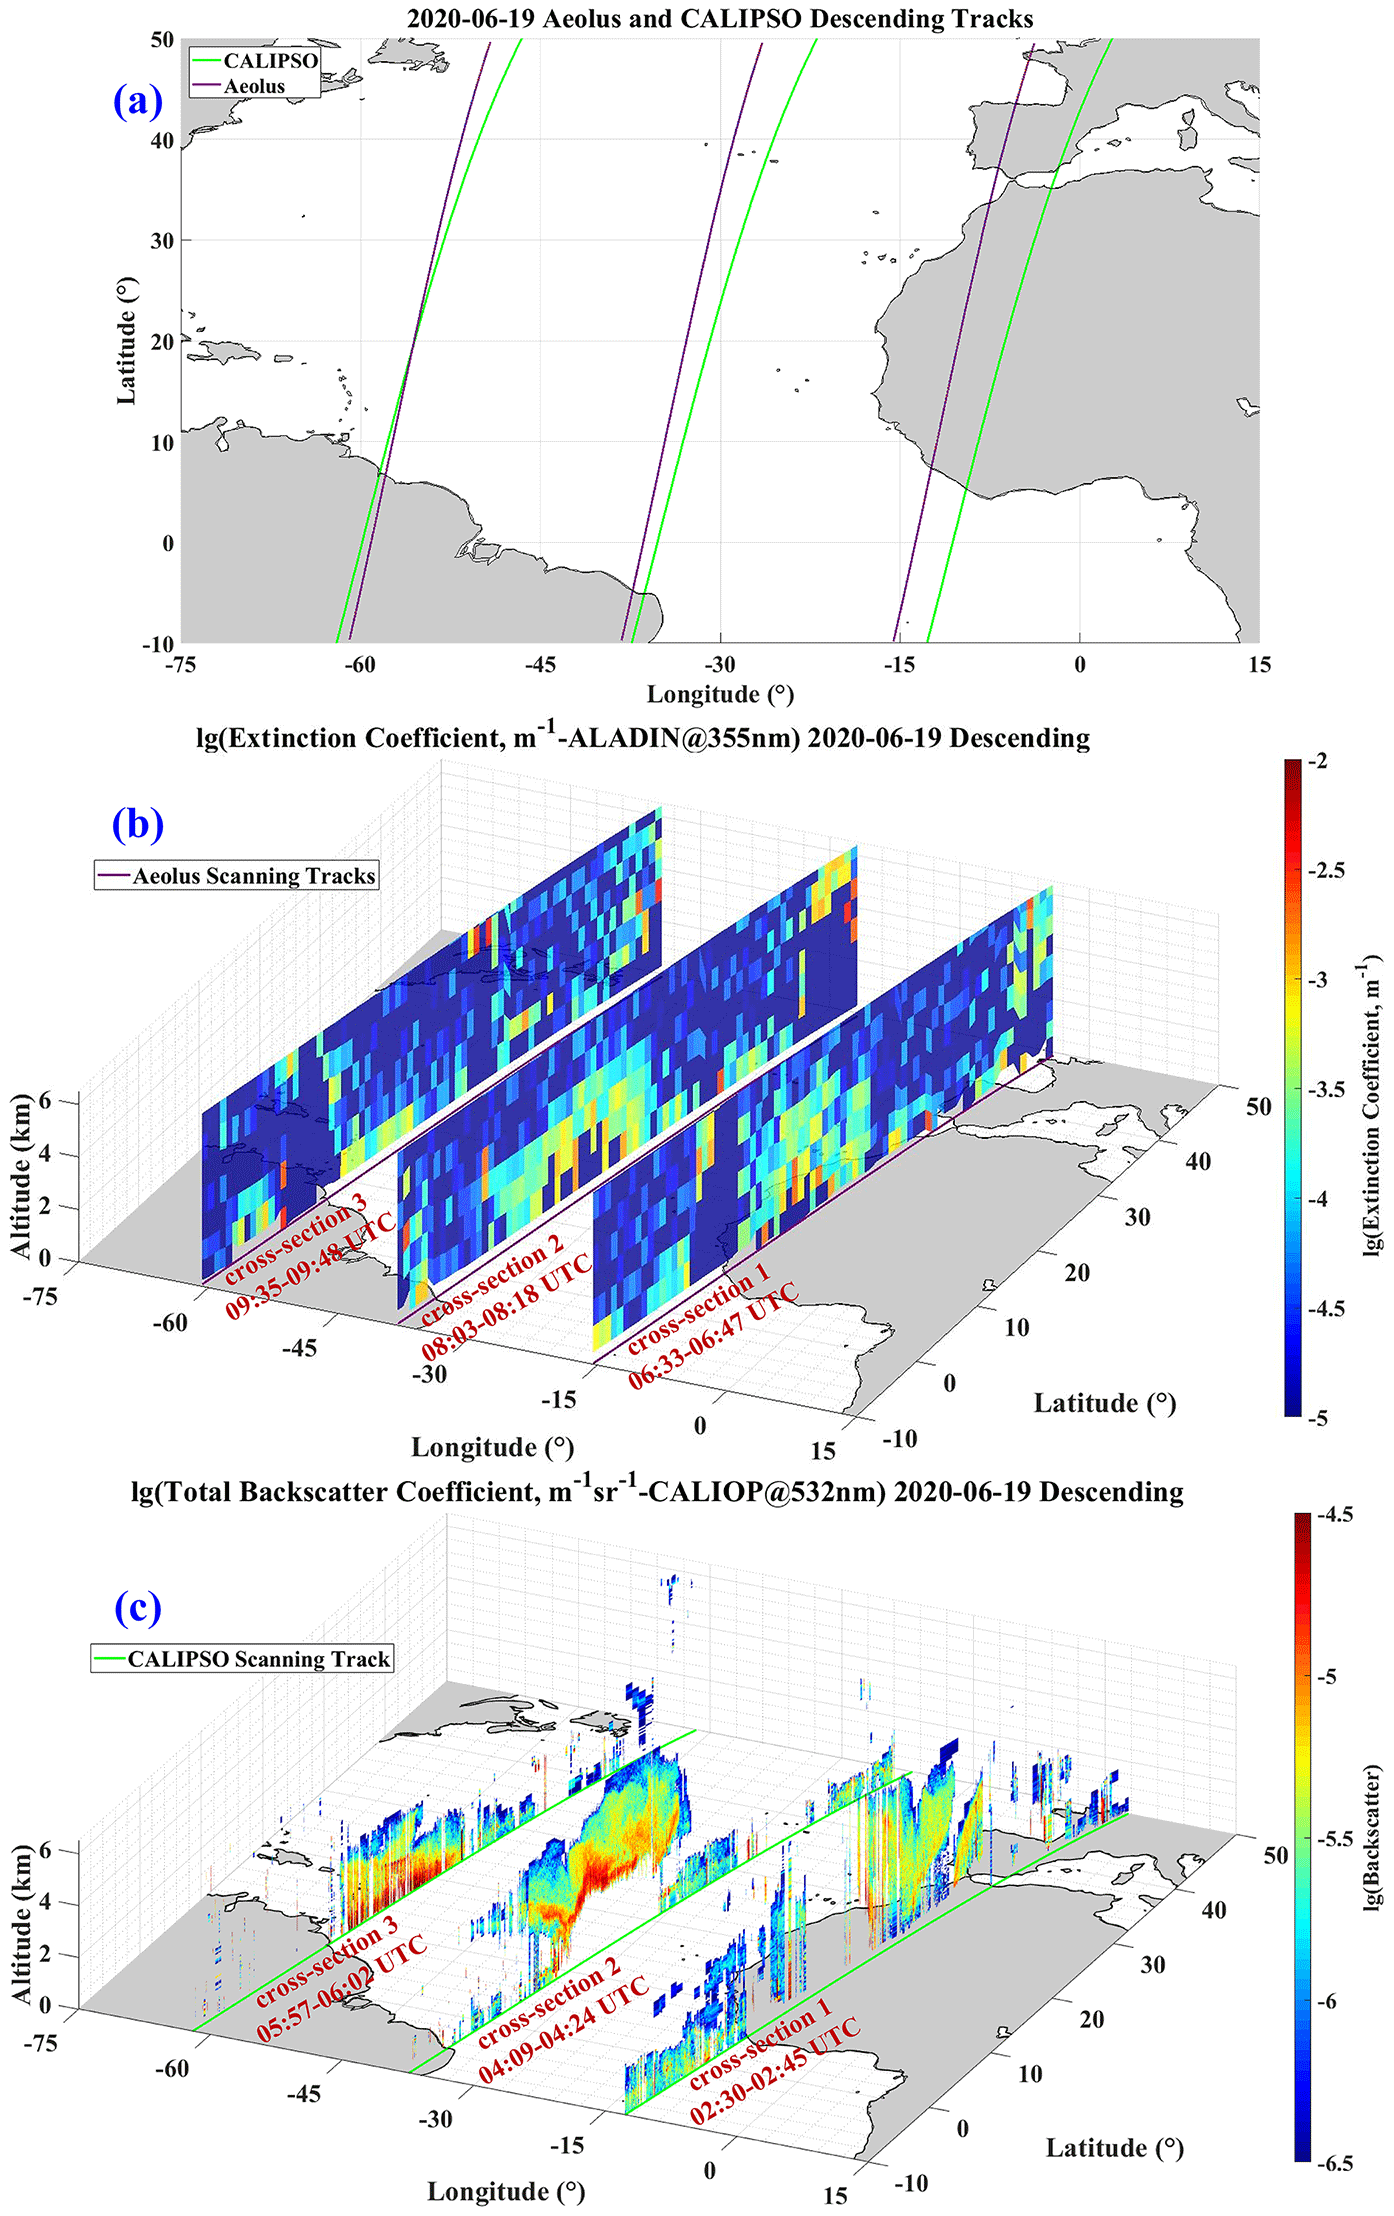
Figure 6Observation cross-sections of Aeolus and CALIPSO on 19 June 2020. The purple lines indicate the tracks of Aeolus, and the green lines indicate the tracks of CALIPSO. (a) Aeolus and CALIPSO scanning tracks, (b) extinction coefficient cross-sections measured with ALADIN and (c) total backscatter coefficient cross-sections measured with CALIOP.
Based on the extinction coefficient at 355 nm and the backscatter coefficients and extinction coefficients at 532 and 1064 nm, combined with the wind vector data from ALADIN, the dust advection can be calculated. The L2C wind product provided by Aeolus results from the background assimilation of the Aeolus HLOS winds in the ECMWF operational prediction model. The zonal wind velocity (u component of the wind vector, from west point to east), meridional wind velocity (v component of the wind vector, from south point to north) and supplementary geophysical parameters are contained in the L2C data product. From literature reports (e.g., Lux et al., 2020), the Aeolus L2B Rayleigh LOS winds and the ECMWF model LOS winds show good agreement, with a correlation coefficient of 0.92 and mean bias of 1.62 m s−1. As introduced in Sect. 3.3, the ECMWF wind field data between the two spaceborne lidar scanning tracks are utilized to illustrate the homogeneity of the wind field between two tracks. Hence, in this study, if the wind fields between tracks are stable, the “analysis_zonal_wind_velocity” and “analysis_meridional_wind_velocity” from the Aeolus L2C wind vector product could be applied for the calculation of the dust advection.
To calculate the dust advection during this event, wind field and relative humidity information is necessary. Since the observations with ALADIN and CALIOP are not exactly simultaneous, the stability of the wind field between their scanning tracks has to be estimated. Hence, the wind speed, wind direction and relative humidity between the tracks are analyzed with the data from ECMWF. From these data, the wind fields and the relative humidity values between the tracks of Aeolus and CALIPSO at the height surfaces of 1, 2, 3, 4, 5 and 6 km are smoothly distributed, and the values are stable. Thus, the wind vector data from Aeolus L2C could be applied in the calculation of dust advection. It should be emphasized that, during the calculations of the dust advection, the results with relative humidity higher than 90 % have to be removed.
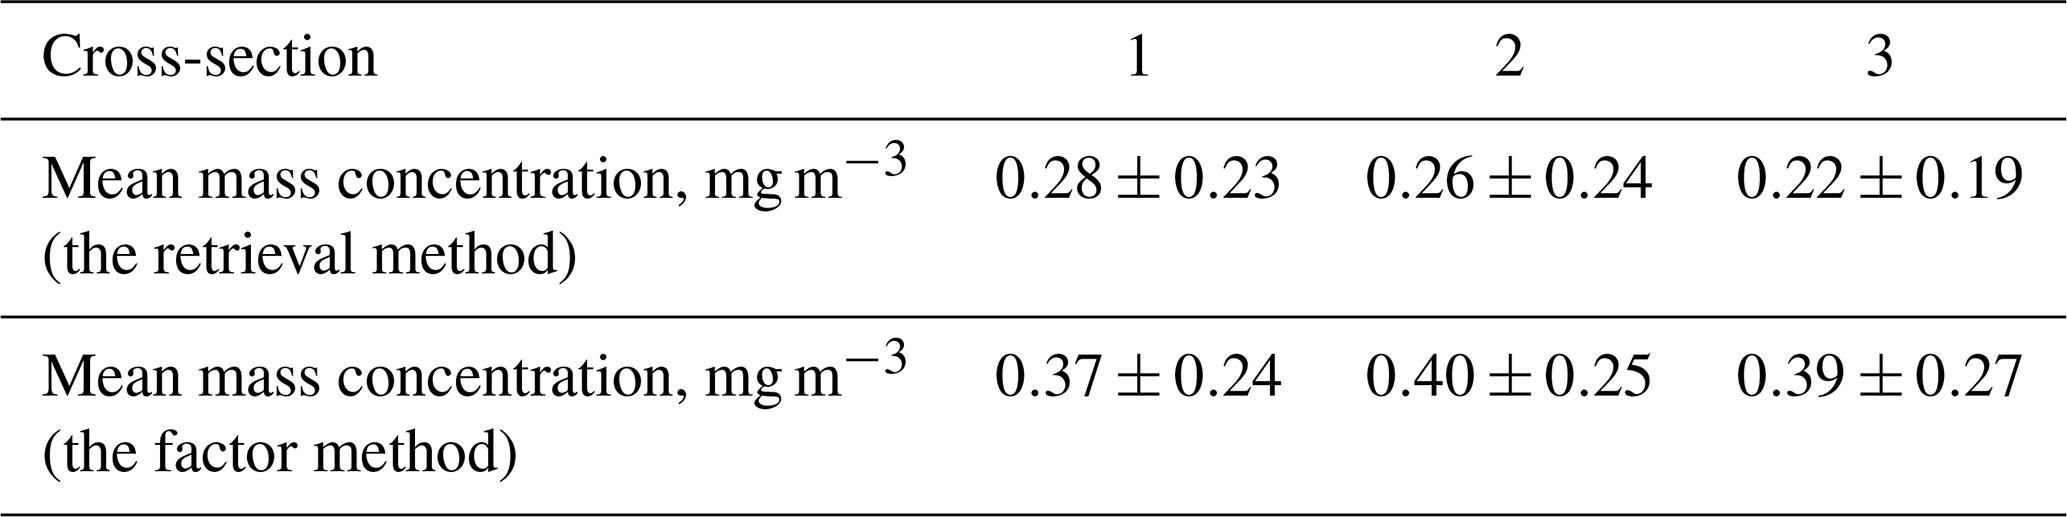
In order to verify the retrieval results of the regularization method, we compare the mass concentration retrieved by the regularization method (the retrieval method) with the results calculated directly using the mass-specific extinction coefficient (the factor method) (Ansmann et al., 2012). According to Ansmann et al. (2012), the aerosol mass concentration can also be calculated by the method that the extinction coefficient at 532 nm divides the mass-specific extinction coefficient. Hence, the reference mass concentration of every cross-section is calculated with the CALIPSO extinction coefficient at 532 nm along tracks and the Saharan dust mass-specific extinction coefficient (0.52 m2 g−1). Table 1 shows the mean mass concentration of every cross-section on 19 June 2020 calculated by the two methods. Referring to Ansmann et al. (2012, 2017) and Haarig et al. (2019), the mass concentrations of typical dust layers from Sahara vary from 0.05 to 0.5 mg m−3. Moreover, this dust event is a historic and massive Saharan dust intrusion into the Caribbean Basin and the southern United States, which is nicknamed the “Godzilla” by Yu et al. (2021). Thus, it should be introduced that in the process of average calculation, the mass concentration values smaller than 0.05 mg m−3, which are unreasonable, are excluded. From the comparison, it can be found that the results from the factor method are larger than the results from the retrieval method. However, considering the errors of these two methods, we consider that the mass concentration estimated by the regularization method is reasonable and acceptable.
Table 1Mean dust mass concentration of each cross-sections on 19 June 2020 calculated by two methods.
In Fig. 7, the dust advection values at different heights of the three snapshot cross-sections are presented. From the profiling, the mean dust advection value is about in cross-section 1 (over the emission region), in cross-section 2 (over the transport region) and in cross-section 3 (over the deposition region), respectively.
In conclusion, on 19 June 2020, the dust layers over the Western Sahara, the middle Atlantic and the western Atlantic are observed by ALADIN and CALIOP nearly simultaneously. And the dust advection of the three cross-sections indicates the quasi-simultaneous transport of the dust plumes over the emission region, the transport region and the deposition region on the same day.
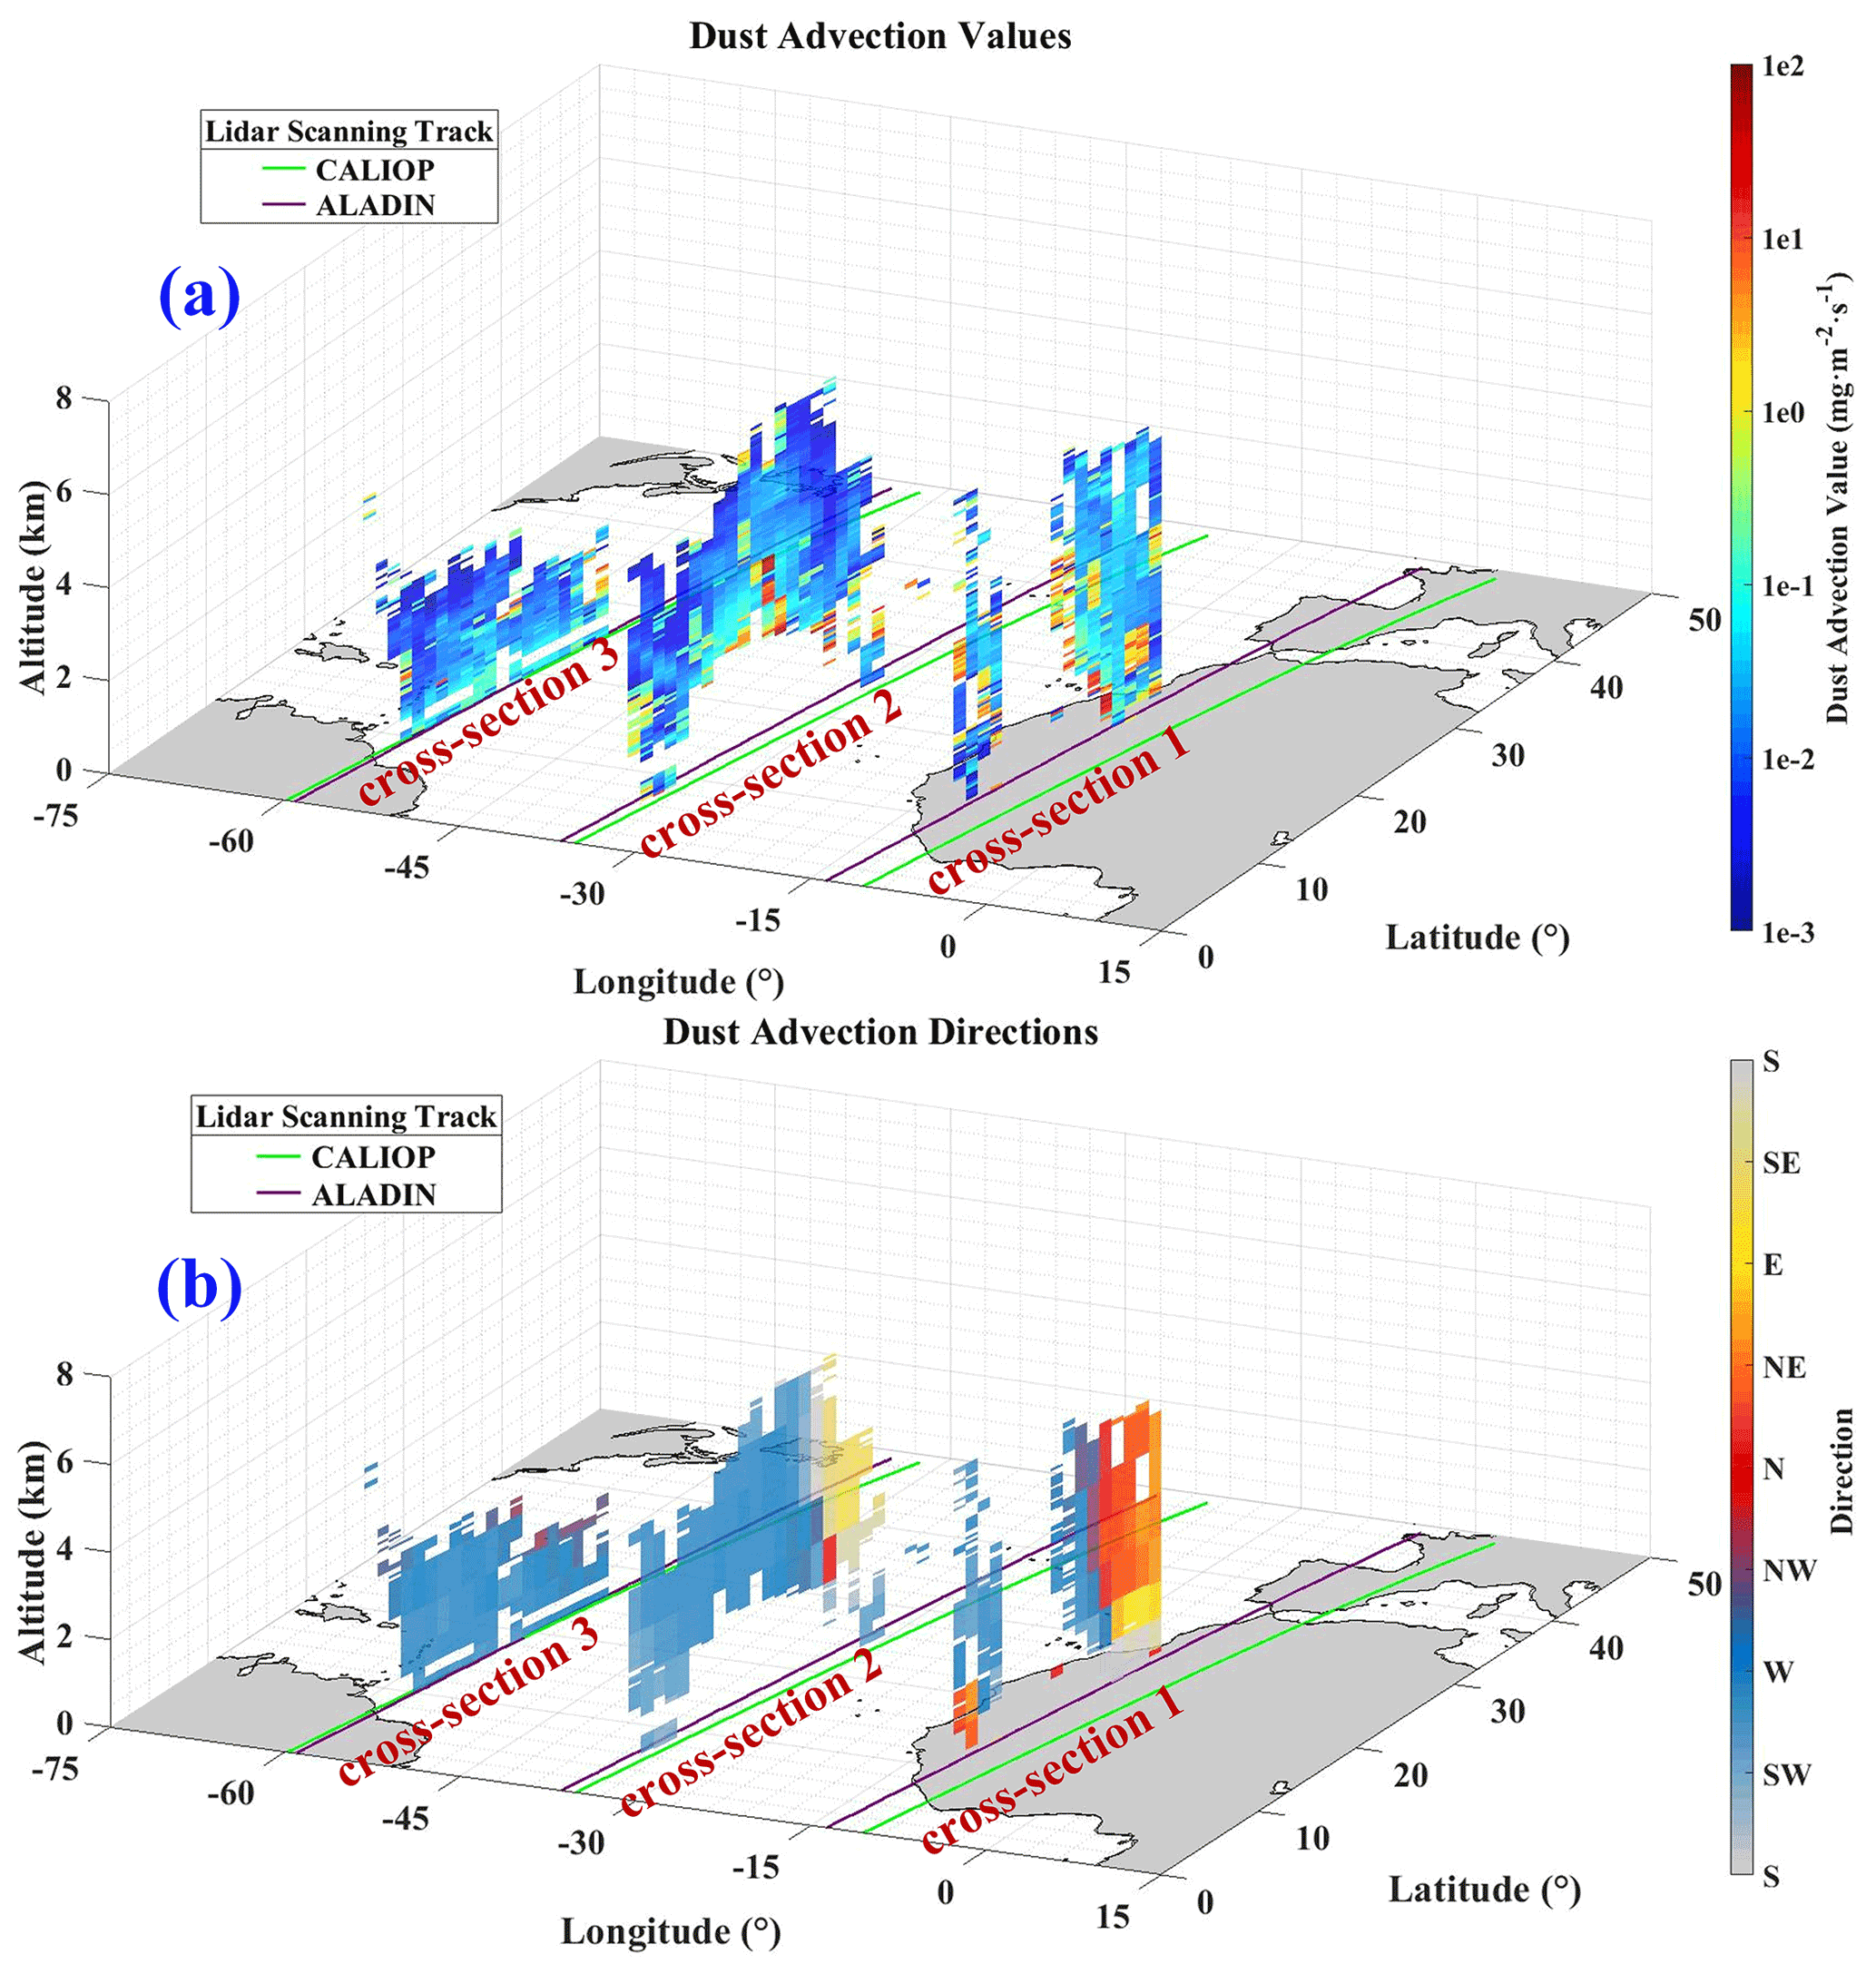
Figure 7The dust advection calculated with data from ALADIN, CALIOP and ECMWF. (a) The dust advection values at different cross-sections of dust plumes and (b) the dust advection directions at different cross-sections of dust plumes on 19 June 2020.
4.3 Dust advection during the lifetime of dust event during 14 and 27 June 2020
During this dust event, the quasi-synchronized observations with ALADIN and CALIOP were selected to follow the transport and dispersion of dust. The detailed information about the ALADIN and the CALIOP observations on 15, 16, 19, 24, 27 June 2020 along the transport route and the HYSPLIT modeling (which are also presented and analyzed in Sect. 4.1) are shown in Fig. 8. In Fig. 8a, the scanning tracks of ALADIN and CALIOP on those days are indicated by dark purple lines and green lines, respectively. The HYSPLIT trajectories modeled from the altitudes of 3, 4 and 5 km at position A, B and C (the aerosol profiles of which are presented and analyzed in Sect. 4.1) are shown respectively in Fig. 8a and d. The square symbols in Fig. 8a and d indicate the HYSPLIT trajectories positions corresponding to the five cross-sections in the time dimension. In Fig. 8b and c, five cross-sections of extinction coefficient at 355 nm measured at different times with Aeolus and five cross-sections of backscatter coefficient at 532 nm measured at different times with CALIOP are plotted, respectively. Additionally, the forward trajectories and backward trajectories and presented by dark red lines and light purple lines in Fig. 8b and c. From these figures, we can find that at different cross-sections of Aeolus and CALIPSO, the dust transport modeled with HYSPLIT matches spatially well with the enhanced backscatter and extinction coefficient values, indicating the presence of dust. In Fig. 8d, a side view of the HYSPLIT trajectories is shown. Consistent with the observations from ALADIN and CALIOP in Fig. 8b and c, there is an apparent descent along the transport route of the dust event. However, the cross-sections captured by ALADIN and CALIOP do not match perfectly with the HYSPLIT trajectories in the time dimension. The backward trajectories match well with the cross-sections on 15, 16 and 19 June, while the forward trajectories from position A match well with the cross-sections on 24 and 27 June. But the forward trajectories from position B and C are slightly mismatched with the cross-sections on 24 and 27 June. It is considered that there are two aspects of reasons of the mismatch in the time dimension. On the one hand, the modeled trajectories present complex transport routes of the dust plumes and meanwhile indicate various transport speeds of the dust plumes driven by separate air masses over the Atlantic. On the other hand, restricted by the strict track matching method implemented in this study, several observation cross-sections above the transport regions (e.g., Gulf of Mexico and North America) which also capture dust plumes are rejected. Nevertheless, combined with the Dust Score Index data and the HYSPLIT trajectories (analyzed in Sect. 4.1), it can still be concluded that the enhanced backscatter and extinction coefficient regions of the five cross-sections (1) track the same dust event and (2) represent the dust layers of this dust event's emission phase, development phase, transport phase, descent phase and deposition phase, respectively.
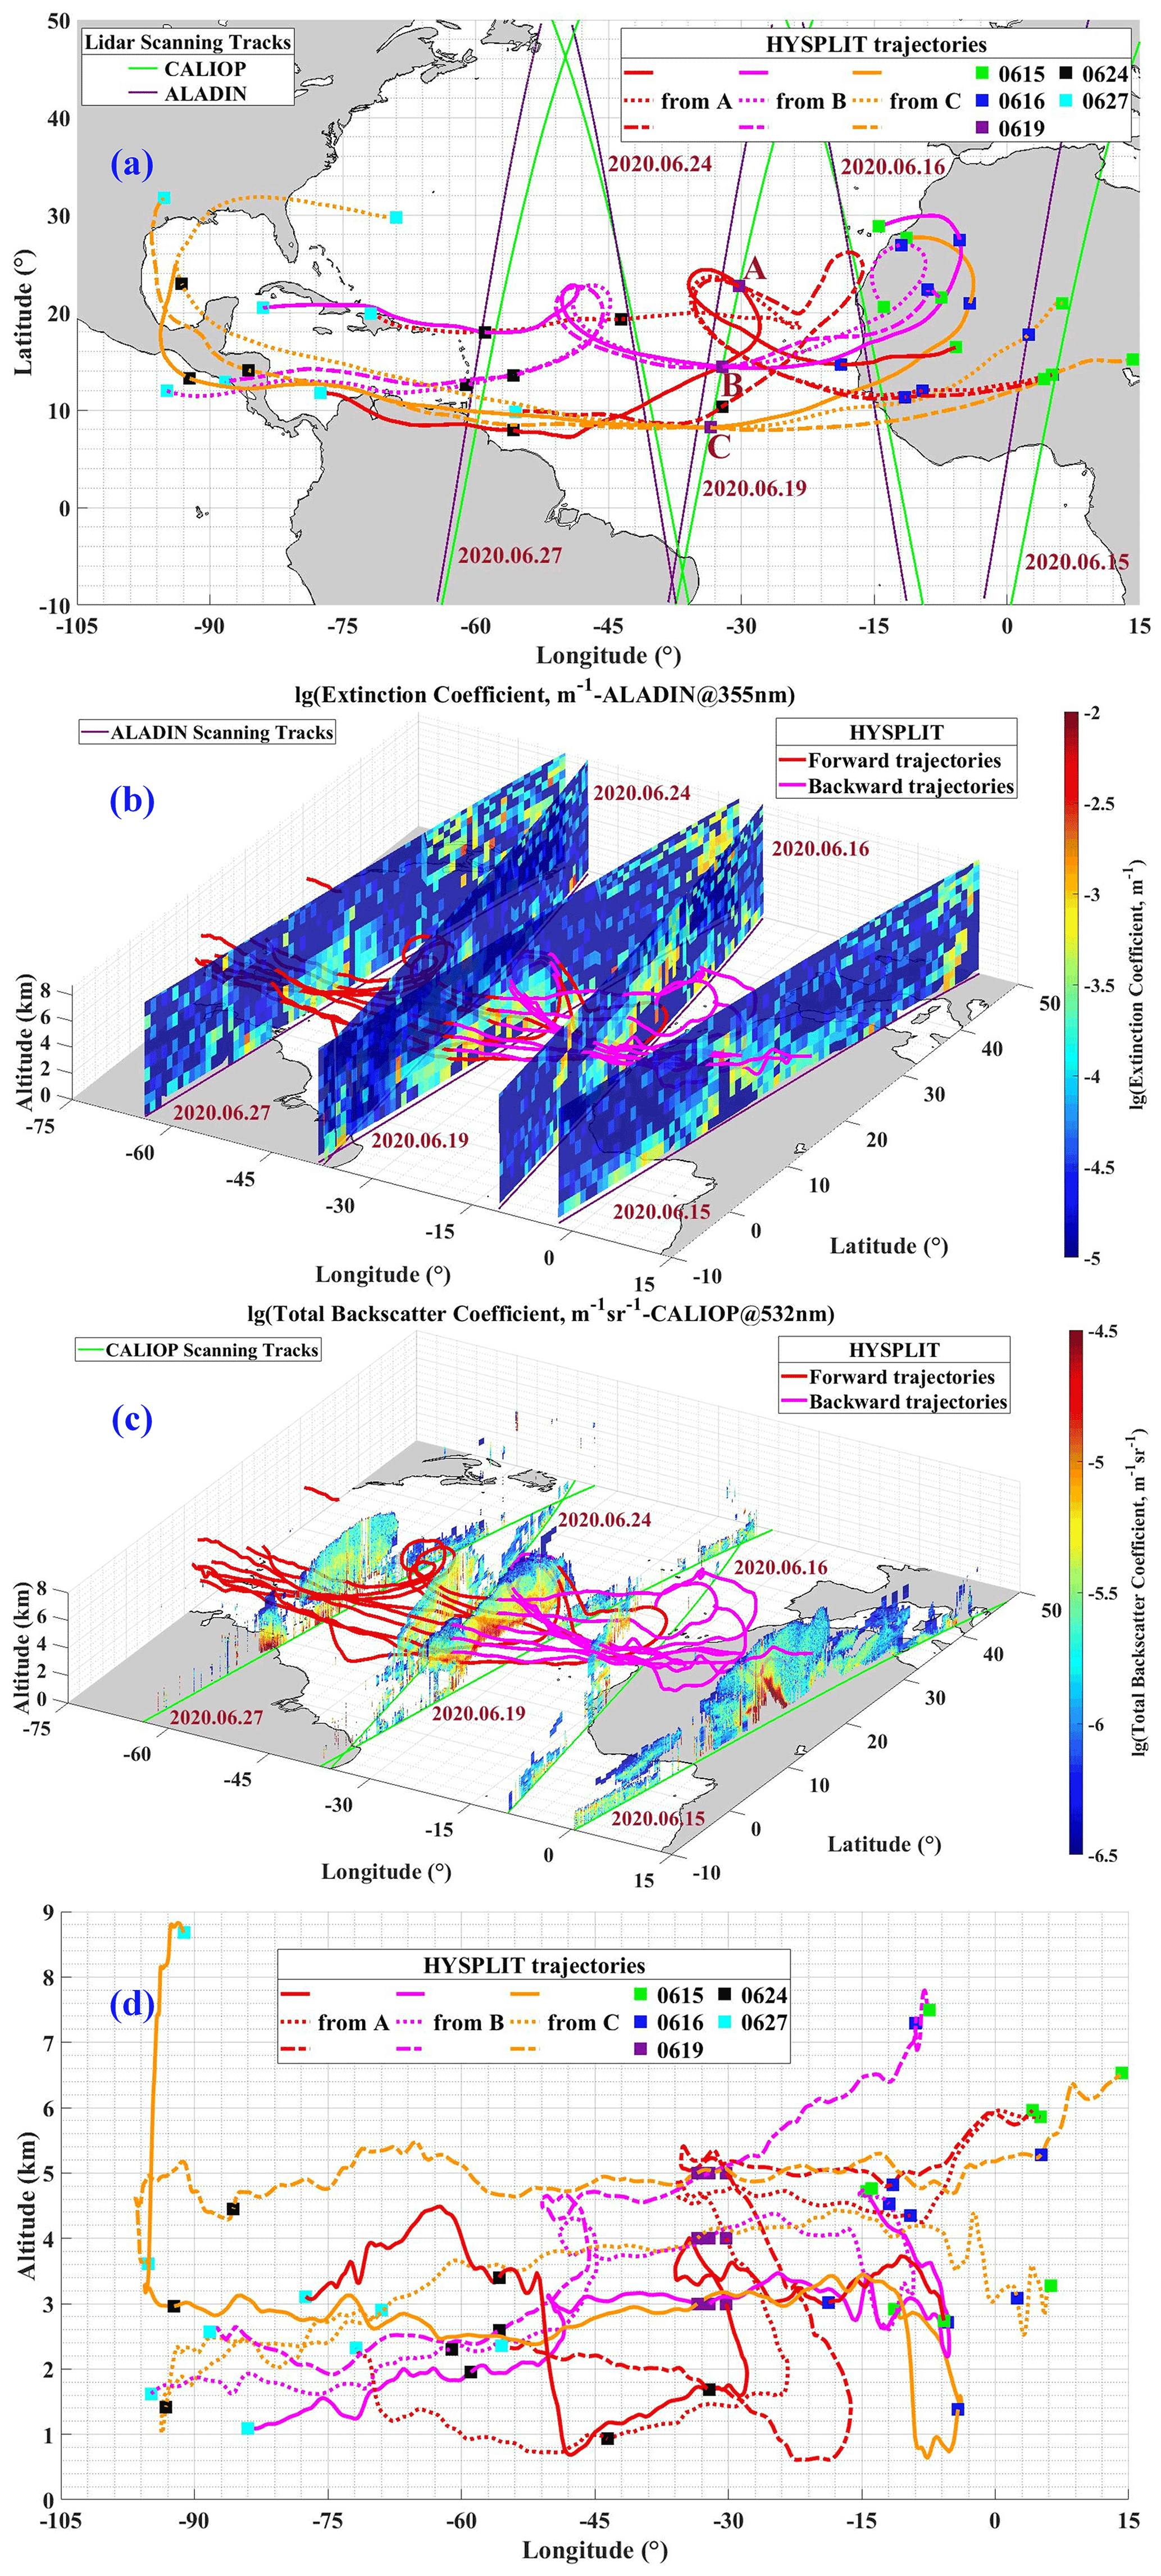
Figure 8Observation of dust event during 15 and 27 June 2020 with ALADIN and CALIOP and the corresponding HYSPLIT trajectories. (a) Vertical view of ALADIN and CALIOP scanning tracks and HYSPLIT trajectories. (b) Extinction coefficient cross-sections measured with ALADIN and HYSPLIT trajectories. (c) Total backscatter coefficient cross-sections measured with CALIOP and HYSPLIT trajectories. (d) Side view of HYSPLIT trajectories. In (a) and (d), the solid lines, the dotted lines and the dotted–dashed lines of the HYSPLIT trajectories represent the trajectories modeled from the altitudes of 3, 4 and 5 km.
Similarly, the wind speeds, directions and relative humidity values at certain height surfaces between the tracks of CALIPSO and Aeolus on different days are obtained from the ECMWF model. The values are smoothly distributed and stable. Consequently, the Aeolus L2C wind vector product can be employed in the calculation of the dust advection. The relative humidity is presented as well.
Table 2 presents the two sets of mean mass concentration of each cross-sections at different times during the dust transport calculated by the retrieval method and the factor method. Compared with the factor method calculation results, it is considered that the dust mass concentration from the retrieval method is reasonable and acceptable.
Table 2Mean dust mass concentration of each cross-sections at different times during the dust transport calculated by two methods.
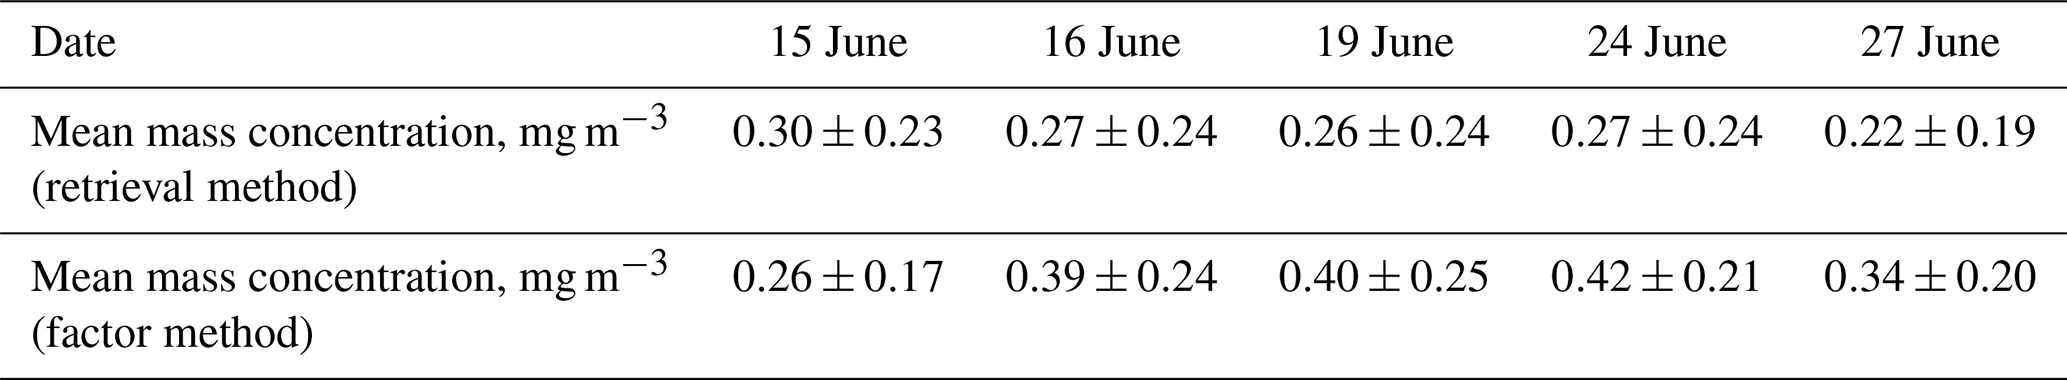
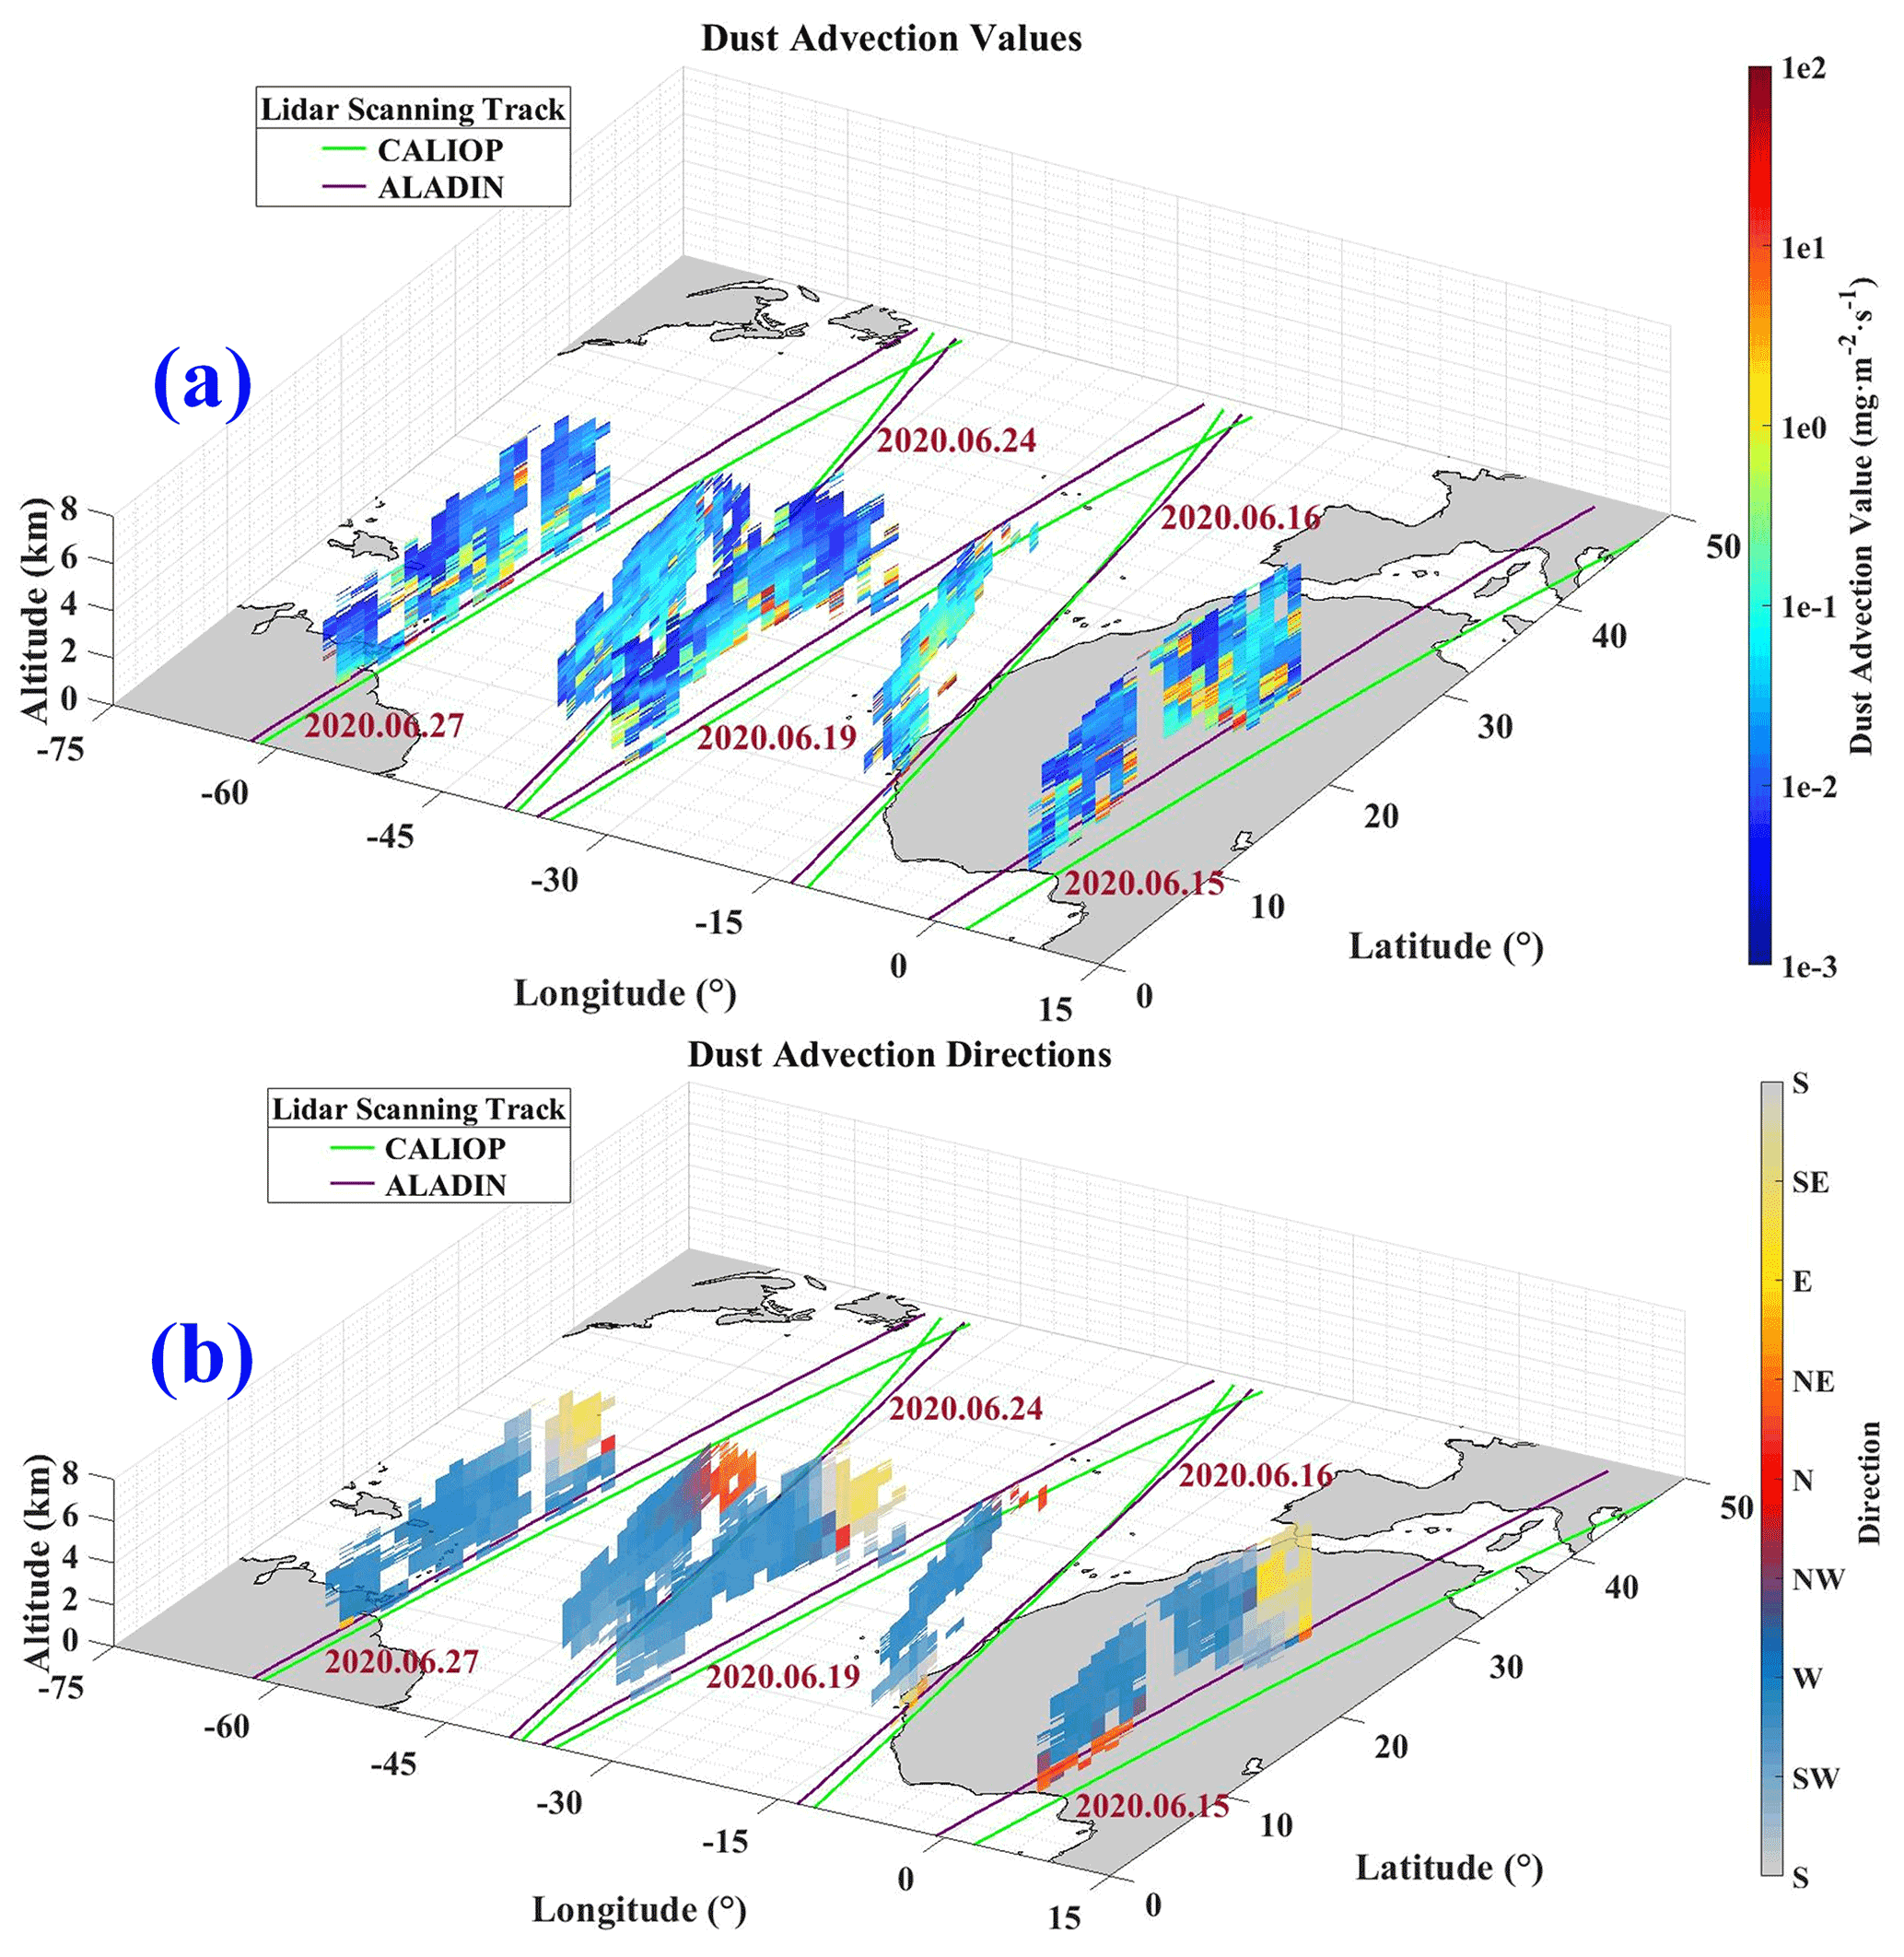
Figure 9The dust advection calculated with data from ALADIN, CALIOP and ECMWF. (a) Dust advection values at different cross-sections and at different times during the dust transport and (b) dust advection directions at different cross-sections and at different times during the dust transport.
In Fig. 9, the dust advection at different heights of all the cross-sections during the dust transport is presented. In Fig. 9a, the mean dust mass advection values are about on 15 June 2020, on 16 June 2020, on 19 June 2020, on 24 June 2020 and on 27 June 2020. From this trend, it appears that the mean advection value () on 15 June when the dust originated is lower than that () on 16 June. It has to be emphasized that, according to Fig. 8a, Aeolus and CALIPSO quasi-synchronically observed the dust plumes on 15 June only over part (not whole) of the emission regions. The emission part from West Africa is missed and thus leads to the lower mean dust advection value on 15 June than that on 16 June. With the development and enhancement of the dust event, the mean advection value gradually increases and reaches the peak value () on 16 June. Then, during the transport of the dust plume over the Atlantic Ocean, the mean advection decreased on 19 and 24 June. Ultimately, resulting from the dispersion and deposition of the dust plume to the west part of Atlantic Ocean, Central and South America, and the Caribbean Sea, the dust advection on 27 June becomes the lowest () of the whole dust transportation.

Figure 10The u and v components provided by Aeolus and the HYSPLIT model for the dust event.
From Fig. 10, the L2C wind vectors including u and v components from Aeolus at different times are plotted. In Fig. 10a, the dust plumes are trapped in the northeasterly trade-wind zone (indicated by the blue color at different cross-sections) between latitudes of 5∘ and 30∘ N and altitudes of 0 and 6 km. The u component values of the wind vectors in the trade-wind zone are high, reaching 20 m s−1. Dominated by the trade wind, the dust plumes are mainly transported to the west. Therefore, it can be considered that Aeolus provided the observations of the dynamics of this dust transport event in the Saharan Air Layer (SAL), which is a hot, dry, elevated layer originating from the Sahara and covering large parts of the tropical Atlantic (Carlson and Prospero, 1972; Prospero and Carlson, 1972). From Fig. 10b, the v component values of the wind vectors are presented as well. Affected by the small wind towards south, the dust plumes are slightly shifted to the south part of Atlantic Ocean in this case.
In this study, a long-term large-scale Saharan dust transport event that occurred between 14 and 27 June 2020 is tracked, and its mass advection is calculated with the remote measurement data from ALADIN and CALIOP and the reanalysis data from ECMWF and HYSPLIT. This allows us to (1) evaluate the performance of ALADIN and CALIOP on the observations of dust optical properties and wind fields and (2) explore the capability of tracking the dust events and in calculating the dust mass advection.
We identified the dust plumes with the AIRS/Aqua Dust Score Index and with the vertical feature mask product from CALIOP. The emission, dispersion, transport and deposition of the dust event are followed using the data from HYSPLIT, CALIOP and AIRS/Aqua. With the quasi-synchronized observations from ALADIN and CALIOP, combined with the wind field and relative humidity from ECMWF, the dust advection is calculated.
From this study, it is found that the dust event generated on 14 and 15 June 2020 from the Sahara in North Africa dispersed and moved westward over the Atlantic Ocean, finally being deposited in the west part of Atlantic Ocean, the Americas and the Caribbean Sea. During the transport and deposition processes, the dust plumes were trapped and transported in the northeasterly trade-wind zone between latitudes of 5∘ and 30∘ N and altitudes of 0 and 6 km. Aeolus provided the observations of the dynamics of this dust transport event in the SAL. From the measurement results on 19 June 2020, the dust plumes are captured quasi-simultaneously over the emission region (Western Sahara), the transport region (middle Atlantic) and the deposition region (western Atlantic) individually, which indicates that the dust plume area over the Atlantic on the morning of this day is quite enormous and that this dust transport event is massive and extensive. The quasi-synchronization observation results of 15, 16, 19, 24 and 27 June by ALADIN and CALIOP during the entire transport process show good agreement with the Dust Score Index data and the HYSPLIT trajectories, which indicates that the transport process of the same dust event is tracked by ALADIN and CALIOP, verifies that the dust transport spent around 2 weeks from the emission to the deposition and achieved the respective observations of this dust event's emission phase, development phase, transport phase, descent phase and deposition phase.
Finally, the advection at different dust parts and heights on 19 June and on the entire transport routine during transportation are computed, respectively. On 19 June, the mean dust advection values are about over the emission region, over the transport region and over the deposition region, from which we can infer the quasi-simultaneous transport of the dust plumes over the emission region, the transport region and the deposition region on this day. In the whole lifetime of the dust event, the mean dust advection values are about on 15 June 2020, on 16 June 2020, on 19 June 2020, on 24 June 2020 and on 27 June 2020. During the dust development stage, the mean advection values gradually increase and reach the maximum value on 16 June with the enhancement of the dust event. Then, the mean advection values decrease since most of the dust was deposited in the Atlantic Ocean, the Americas and the Caribbean Sea.
The Aeolus data can be downloaded via the website https://aeolus-ds.eo.esa.int/oads/access/collection (ESA, 2022). The Aeolus L2C data used in this paper are not available publicly. We were allowed to access the data through our participation as a Calibration and Validation team. The CALIOP data can be downloaded from the website https://eosweb.larc.nasa.gov/project/CALIPSO (NASA, 2022). The ECMWF reanalysis ERA5 wind data can be accessed from the website https://doi.org/10.24381/cds.bd0915c6 (Hersbach et al., 2018). The backward trajectory and forward trajectory of HYSPLIT can be run on the website https://www.ready.noaa.gov/HYSPLIT_traj.php (NOAA, 2019).
GD and SW conceived of the idea for the dust transport and mass advection measurement with spaceborne lidars ALADIN and CALIOP and model reanalysis data. GD and KS wrote the manuscript. KS, GD, SW, BL and QL conducted the data analyses. XW helped in programming, XE downloaded the ECMWF data, and all the co-authors discussed the results and reviewed the manuscript.
The contact author has declared that neither they nor their co-authors have any competing interests.
Publisher’s note: Copernicus Publications remains neutral with regard to jurisdictional claims in published maps and institutional affiliations.
This article is part of the special issue “Aeolus data and their application (AMT/ACP/WCD inter-journal SI)”. It is not associated with a conference.
We thank our colleagues including Xiaomin Chen, Qichao Wang and Xiangcheng Chen from Ocean University of China (OUC) for the discussion and the suggestions during the data analyses. This work was also supported by the Dragon 4 and Dragon 5 programs, which were conducted by the European Space Agency (ESA) and the National Remote Sensing Center of China (NRSCC) under grants 32296 and 59089.
This research has been supported by the National Key Research and Development Program of China (grant nos. 2019YFC1408001 and 2019YFC1408002), the National Natural Science Foundation of China (grant nos. 41905022 and 61975191), and the Key Technology Research and Development Program of Shandong (grant no. 2019GHZ023).
This paper was edited by Geraint Vaughan and reviewed by two anonymous referees.
Amiridis, V., Wandinger, U., Marinou, E., Giannakaki, E., Tsekeri, A., Basart, S., Kazadzis, S., Gkikas, A., Taylor, M., Baldasano, J., and Ansmann, A.: Optimizing CALIPSO Saharan dust retrievals, Atmos. Chem. Phys., 13, 12089–12106, https://doi.org/10.5194/acp-13-12089-2013, 2013.
Ansmann, A., Petzold, A., Kandler, K., Tegen, I., Wendisch, M., Mueller, D., Weinzierl, B., Mueller, T., and Heintzenberg, J.: Saharan Mineral Dust Experiments SAMUM-1 and SAMUM-2: what have we learned?, Tellus B, 63, 403–429, https://doi.org/10.1111/j.1600-0889.2011.00555.x, 2011.
Ansmann, A., Seifert, P., Tesche, M., and Wandinger, U.: Profiling of fine and coarse particle mass: case studies of Saharan dust and Eyjafjallajökull/Grimsvötn volcanic plumes, Atmos. Chem. Phys., 12, 9399–9415, https://doi.org/10.5194/acp-12-9399-2012, 2012.
Ansmann, A., Rittmeister, F., Engelmann, R., Basart, S., Jorba, O., Spyrou, C., Remy, S., Skupin, A., Baars, H., Seifert, P., Senf, F., and Kanitz, T.: Profiling of Saharan dust from the Caribbean to western Africa – Part 2: Shipborne lidar measurements versus forecasts, Atmos. Chem. Phys., 17, 14987–15006, https://doi.org/10.5194/acp-17-14987-2017, 2017.
Baars, H., Radenz, M., Floutsi, A. A., Engelmann, R., Althausen, D., Heese, B., Ansmann, A., Flament, T., Dabas, A., Trapon, D., Reitebuch, O., Bley, S., and Wandinger, U.: Californian wildfire smoke over Europe: A first example of the aerosol observing capabilities of Aeolus compared to ground-based lidar. Geophys. Res. Lett., 48, e2020GL092194, https://doi.org/10.1029/2020GL092194, 2021.
Banerjee, P., Satheesh, S., Moorthy, K. K., Nanjundiah, R. S., and Nair, V. S.: Long-range transport of mineral dust to the Northeast Indian Ocean: Regional versus remote sources and the implications, J. Climate, 32, 1525–1549, https://doi.org/10.1175/JCLI-D-18-0403.1, 2019.
Bozlaker, A., Prospero, J. M., Fraser, M. P., and Chellam, S.: Quantifying the Contribution of Long-Range Saharan Dust Transport on Particulate Matter Concentrations in Houston, Texas, Using Detailed Elemental Analysis, Environ. Sci. Technol., 47, 10179–10187, https://doi.org/10.1021/es4015663, 2013.
Carlson, T. N. and Prospero, J. M.: The Large-Scale Movement of Saharan Air Outbreaks over the Northern Equatorial Atlantic, J. Appl. Meteorol. Clim., 11, 283–297, https://doi.org/10.1175/1520-0450(1972)011<0283:TLSMOS>2.0.CO;2, 1972.
Chanin, M., Garnier, A., Hauchecorne, A., and Porteneuve, J.: A Doppler lidar for measuring winds in the middle atmosphere, Geophys. Res. Lett., 16, 1273–1276, https://doi.org/10.1029/GL016i011p01273, 1989.
Colarco, P., Toon, O., Reid, J., Livingston, J., Russell, P., Redemann, J., Schmid, B., Maring, H., Savoie, D., and Welton, E.: Saharan dust transport to the Caribbean during PRIDE: 2. Transport, vertical profiles, and deposition in simulations of in situ and remote sensing observations, J. Geophys. Res.-Atmos., 108, 8590, https://doi.org/10.1029/2002JD002659, 2003.
Draxler, R. R. and Hess, G.: An overview of the HYSPLIT_4 modelling system for trajectories, Aust. Meteorol. Mag., 47, 295–308, 1998.
Draxler, R. R. and Rolph, G. D.: Evaluation of the Transfer Coefficient Matrix (TCM) approach to model the atmospheric radionuclide air concentrations from Fukushima, J. Geophys. Res.-Atmos., 117, D05107, https://doi.org/10.1029/2011JD017205, 2012.
Engelmann, R., Wandinger, U., Ansmann, A., Müller, D., Žeromskis, E., Althausen, D., and Wehner, B.: Lidar observations of the vertical aerosol flux in the planetary boundary layer, J. Atmos. Ocean. Tech., 25, 1296–1306, https://doi.org/10.1175/2007JTECHA967.1, 2008.
ESA: ESA Aeolus Online Dissemination System, ESA [data set], https://aeolus-ds.eo.esa.int/oads/access/collection, last access: 10 January 2022.
ESA: ADM-Aeolus Science Report. ESA SP-1311, 121 pp., https://esamultimedia.esa.int/multimedia/publications/SP-1311/SP-1311.pdf (last access: 10 January 2022), 2008.
Flamant, P., Cuesta, J., Denneulin, M. L., Dabas, A., & Huber, D.: ADM-Aeolus retrieval algorithms for aerosol and cloud products, Tellus A, 60, 273–286, https://doi.org/10.1111/j.1600-0870.2007.00287.x, 2008.
Flamant, P., Dabas, A., Martinet, P., Lever, V., Flament, T., Trapon, D., Olivier, M., Cuesta, J., and Huber, D.: Aeolus L2A Algorithm Theoretical Baseline Document, Particle optical properties product, version 5.7, https://earth.esa.int/eogateway/documents/20142/37627/Aeolus-L2A-Algorithm-Theoretical-Baseline-Document (last access: 15 March 2022), 2020.
Flament, T., Trapon, D., Lacour, A., Dabas, A., Ehlers, F., and Huber, D.: Aeolus L2A aerosol optical properties product: standard correct algorithm and Mie correct algorithm, Atmos. Meas. Tech., 14, 7851–7871, https://doi.org/10.5194/amt-14-7851-2021, 2021.
Flesia, C. and Korb, C. L.: Theory of the double-edge molecular technique for Doppler lidar wind measurement, Appl. Opt., 38, 432–440, https://doi.org/10.1364/AO.38.000432, 1999.
Getzewich, B. J., Vaughan, M. A., Hunt, W. H., Avery, M. A., Powell, K. A., Tackett, J. L., Winker, D. M., Kar, J., Lee, K.-P., and Toth, T. D.: CALIPSO lidar calibration at 532 nm: version 4 daytime algorithm, Atmos. Meas. Tech., 11, 6309–6326, https://doi.org/10.5194/amt-11-6309-2018, 2018.
Haarig, M., Ansmann, A., Althausen, D., Klepel, A., Groß, S., Freudenthaler, V., Toledano, C., Mamouri, R.-E., Farrell, D. A., Prescod, D. A., Marinou, E., Burton, S. P., Gasteiger, J., Engelmann, R., and Baars, H.: Triple-wavelength depolarization-ratio profiling of Saharan dust over Barbados during SALTRACE in 2013 and 2014, Atmos. Chem. Phys., 17, 10767–10794, https://doi.org/10.5194/acp-17-10767-2017, 2017.
Haarig, M., Walser, A., Ansmann, A., Dollner, M., Althausen, D., Sauer, D., Farrell, D., and Weinzierl, B.: Profiles of cloud condensation nuclei, dust mass concentration, and ice-nucleating-particle-relevant aerosol properties in the Saharan Air Layer over Barbados from polarization lidar and airborne in situ measurements, Atmos. Chem. Phys., 19, 13773–13788, https://doi.org/10.5194/acp-19-13773-2019, 2019.
Haywood, J. M., Pelon, J., Formenti, P., Bharmal, N., Brooks, M., Capes, G., Chazette, P., Chou, C., Christopher, S., and Coe, H.: Overview of the dust and biomass-burning experiment and African monsoon multidisciplinary analysis special observing period-0, J. Geophys. Res.-Atmos., 113, D00C17, https://doi.org/10.1029/2008JD010077, 2008.
Heintzenberg, J.: The SAMUM-1 experiment over Southern Morocco: overview and introduction, Tellus B, 61, 2–11, https://doi.org/10.1111/j.1600-0889.2008.00403.x, 2009.
Hersbach, H., Bell, B., Berrisford, P., Biavati, G., Horányi, A., Muñoz Sabater, J., Nicolas, J., Peubey, C., Radu, R., Rozum, I., Schepers, D., Simmons, A., Soci, C., Dee, D., and Thépaut, J.-N.: ERA5 hourly data on pressure levels from 1979 to present, Copernicus Climate Change Service (C3S) Climate Data Store (CDS) [data set], https://doi.org/10.24381/cds.bd0915c6, 2018.
Hersbach, H., Bell, B., Berrisford, P., Hirahara, S., Horányi, A., Muñoz-Sabater, J., Nicolas, J., Peubey, C., Radu, R., and Schepers, D.: The ERA5 global reanalysis, Q. J. Roy. Meteor. Soc., 146, 1999–2049, https://doi.org/10.1002/qj.3803, 2020.
Hofer, J., Althausen, D., Abdullaev, S. F., Makhmudov, A. N., Nazarov, B. I., Schettler, G., Engelmann, R., Baars, H., Fomba, K. W., Müller, K., Heinold, B., Kandler, K., and Ansmann, A.: Long-term profiling of mineral dust and pollution aerosol with multiwavelength polarization Raman lidar at the Central Asian site of Dushanbe, Tajikistan: case studies, Atmos. Chem. Phys., 17, 14559–14577, https://doi.org/10.5194/acp-17-14559-2017, 2017.
Hofer, J., Ansmann, A., Althausen, D., Engelmann, R., Baars, H., Abdullaev, S. F., and Makhmudov, A. N.: Long-term profiling of aerosol light extinction, particle mass, cloud condensation nuclei, and ice-nucleating particle concentration over Dushanbe, Tajikistan, in Central Asia, Atmos. Chem. Phys., 20, 4695–4711, https://doi.org/10.5194/acp-20-4695-2020, 2020a.
Hofer, J., Ansmann, A., Althausen, D., Engelmann, R., Baars, H., Fomba, K. W., Wandinger, U., Abdullaev, S. F., and Makhmudov, A. N.: Optical properties of Central Asian aerosol relevant for spaceborne lidar applications and aerosol typing at 355 and 532 nm, Atmos. Chem. Phys., 20, 9265–9280, https://doi.org/10.5194/acp-20-9265-2020, 2020b.
Huang, J., Minnis, P., Chen, B., Huang, Z., Liu, Z., Zhao, Q., Yi, Y., and Ayers, J. K.: Long-range transport and vertical structure of Asian dust from CALIPSO and surface measurements during PACDEX, J. Geophys. Res.-Atmos., 113, D23212, https://doi.org/10.1029/2008JD010620, 2008.
Huang, Z., Huang, J., Bi, J., Wang, G., Wang, W., Fu, Q., Li, Z., Tsay, S.-C., and Shi, J.: Dust aerosol vertical structure measurements using three MPL lidars during 2008 China-U.S. joint dust field experiment, J. Geophys. Res.-Atmos., 115, D00K15, https://doi.org/10.1029/2009JD013273, 2010.
Huebert, B. J., Bates, T., Russell, P. B., Shi, G., Kim, Y. J., Kawamura, K., Carmichael, G., and Nakajima, T.: An overview of ACE-Asia: Strategies for quantifying the relationships between Asian aerosols and their climatic impacts, J. Geophys. Res.-Atmos., 108, 8633, https://doi.org/10.1029/2003JD003550, 2003.
Huneeus, N., Schulz, M., Balkanski, Y., Griesfeller, J., Prospero, J., Kinne, S., Bauer, S., Boucher, O., Chin, M., Dentener, F., Diehl, T., Easter, R., Fillmore, D., Ghan, S., Ginoux, P., Grini, A., Horowitz, L., Koch, D., Krol, M. C., Landing, W., Liu, X., Mahowald, N., Miller, R., Morcrette, J.-J., Myhre, G., Penner, J., Perlwitz, J., Stier, P., Takemura, T., and Zender, C. S.: Global dust model intercomparison in AeroCom phase I, Atmos. Chem. Phys., 11, 7781–7816, https://doi.org/10.5194/acp-11-7781-2011, 2011.
Kanitz, T., Lochard, J., Marshall, J., McGoldrick, P., Lecrenier, O., Bravetti, P., Reitebuch, O., Rennie, M., Wernham, D., and Elfving, A.: Aeolus first light: first glimpse, International Conference on Space Optics–ICSO 2018, 111801R, Chania, Greece, 9–12 October 2018, https://doi.org/10.1117/12.2535982, 2019.
Lux, O., Lemmerz, C., Weiler, F., Marksteiner, U., Witschas, B., Rahm, S., Geiß, A., and Reitebuch, O.: Intercomparison of wind observations from the European Space Agency's Aeolus satellite mission and the ALADIN Airborne Demonstrator, Atmos. Meas. Tech., 13, 2075–2097, https://doi.org/10.5194/amt-13-2075-2020, 2020.
Mamouri, R.-E. and Ansmann, A.: Potential of polarization/Raman lidar to separate fine dust, coarse dust, maritime, and anthropogenic aerosol profiles, Atmos. Meas. Tech., 10, 3403–3427, https://doi.org/10.5194/amt-10-3403-2017, 2017.
Marksteiner, U.: Airborne Lidar Observations for the validation of the ADM-Aeolus instrument, PhD Thesis, Technical University of Munich, http://mediatum.ub.tum.de/doc/1136781/1136781.pdf (last access: 10 January 2022), 2013.
Matthias, T., Albert, A., Detlef, M., Dietrich, A., Ina, M., Birgit, H., Volker, F., Matthias, W., Michael, E., Gianluca, P., and Peter, K.: Vertical profiling of Saharan dust with Raman lidars and airborne HSRL in southern Morocco during SAMUM, Tellus B, 61, 144-164, https://doi.org/10.1111/j.1600-0889.2008.00390.x, 2009.
McConnell, C., Highwood, E., Coe, H., Formenti, P., Anderson, B., Osborne, S., Nava, S., Desboeufs, K., Chen, G., and Harrison, M.: Seasonal variations of the physical and optical characteristics of Saharan dust: Results from the Dust Outflow and Deposition to the Ocean (DODO) experiment, J. Geophys. Res.-Atmos., 113, D14S05, https://doi.org/10.1029/2007JD009606, 2008.
McKay, J. A.: Assessment of a multibeam Fizeau wedge interferometer for Doppler wind lidar, Appl. Opt., 41, 1760–1767, https://doi.org/10.1364/AO.41.001760, 2002.
Müller, D., Wandinger, U., and Ansmann, A.: Microphysical particle parameters from extinction and backscatter lidar data by inversion with regularization: theory, Appl. Opt., 38, 2346–2357, https://doi.org/10.1364/AO.38.002346, 1999.
NASA: Atmospheric Science Data Center, NASA [data set], https://eosweb.larc.nasa.gov/project/CALIPSO, last access: 10 January 2022.
NOAA: Atmospheric Science Data Center, NOAA [code], https://www.ready.noaa.gov/HYSPLIT_traj.php (last access: 10 January 2022), 2019.
Prospero, J. M. and Carlson, T. N.: Vertical and areal distribution of Saharan dust over western equatorial north Atlantic Ocean, J. Geophys. Res., 77, 5255–5265, https://doi.org/10.1029/JC077i027p05255, 1972.
Prospero, J. M. and Lamb, P. J.: African Droughts and Dust Transport to the Caribbean: Climate Change Implications, Science, 302, 1024–1027, https://doi.org/10.1126/science.1089915, 2003.
Prospero, J. M., Barkley, A. E., Gaston, C. J., Gatineau, A., Campos y Sansano, A., and Panechou, K.: Characterizing and quantifying African dust transport and deposition to South America: implications for the phosphorus budget in the Amazon Basin, Global Biogeochem. Cy., 34, e2020GB006536, https://doi.org/10.1029/2020GB006536, 2020.
Pu, B., and Jin, Q.: A Record-Breaking Trans-Atlantic African Dust Plume Associated with Atmospheric Circulation Extremes in June 2020, B. Am. Meteorol. Soc., 102, E1340–E1356, https://doi.org/10.1175/BAMS-D-21-0014.1, 2021.
Reid, J. S., Kinney, J. E., Westphal, D. L., Holben, B. N., Welton, E. J., Tsay, S. C., Eleuterio, D. P., Campbell, J. R., Christopher, S. A., and Colarco, P.: Analysis of measurements of Saharan dust by airborne and ground-based remote sensing methods during the Puerto Rico Dust Experiment (PRIDE), J. Geophys. Res.-Atmos., 108, 8586, https://doi.org/10.1029/2002JD002493, 2003.
Reitebuch, O.: The spaceborne wind lidar mission ADM-Aeolus, in: Atmospheric Physics, edited by: Schumann, U., Springer, 815–827, ISBN 978-3-642-30182-7, https://doi.org/10.1007/978-3-642-30183-4_49, 2012.
Reitebuch, O., Lemmerz, C., Nagel, E., Paffrath, U., Durand, Y., Endemann, M., Fabre, F., and Chaloupy, M.: The airborne demonstrator for the direct-detection Doppler wind lidar ALADIN on ADM-Aeolus. Part I: Instrument design and comparison to satellite instrument, J. Atmos. Ocean. Tech., 26, 2501–2515, https://doi.org/10.1175/2009JTECHA1309.1, 2009.
Rennie, M., Tan, D., Andersson, E., Poli, P., Dabas, A., de Kloe, J., Marseille, G., and Stoffelen, A.: Aeolus Level-2B Algorithm Theoretical Basis Document, version 3.40, https://earth.esa.int/eogateway/documents/20142/37627/Aeolus-L2B-Algorithm-ATBD.pdf (last access: 15 March 2022), 2020.
Schepanski, K., Tegen, I., and Macke, A.: Saharan dust transport and deposition towards the tropical northern Atlantic, Atmos. Chem. Phys., 9, 1173–1189, https://doi.org/10.5194/acp-9-1173-2009, 2009.
Shimizu, A., Sugimoto, N., Matsui, I., Arao, K., Uno, I., Murayama, T., Kagawa, N., Aoki, K., Uchiyama, A., and Yamazaki, A.: Continuous observations of Asian dust and other aerosols by polarization lidars in China and Japan during ACE-Asia, J. Geophys. Res.-Atmos., 109, D19S17, https://doi.org/10.1029/2002JD003253, 2004.
Stein, A., Draxler, R. R., Rolph, G. D., Stunder, B. J., Cohen, M., and Ngan, F.: NOAA's HYSPLIT atmospheric transport and dispersion modeling system, B. Am. Meteorol. Soc., 96, 2059–2077, https://doi.org/10.1175/BAMS-D-14-00110.1, 2015.
Stoffelen, A., Pailleux, J., Källén, E., Vaughan, J. M., Isaksen, L., Flamant, P., Wergen, W., Andersson, E., Schyberg, H., and Culoma, A.: The atmospheric dynamics mission for global wind field measurement, B. Am. Meteorol. Soc., 86, 73–88, https://doi.org/10.1175/BAMS-86-1-73, 2005.
Straume, A. G., Elfving, A., Wernham, D., de Bruin, F., Kanitz, T., Schuettemeyer, D., von Bismarck, J., Buscaglione, F., Lecrenier, O., and McGoldrick, P.: ESA's spaceborne lidar mission ADM-Aeolus; project status and preparations for launch, EPJ Web Conf., 176, 04007, https://doi.org/10.1051/epjconf/201817604007, 2018.
Tan, D. G., Andersson, E., Kloe, J. D., Marseille, G.-J., Stoffelen, A., Poli, P., Denneulin, M.-L., Dabas, A., Huber, D., and Reitebuch, O.: The ADM-Aeolus wind retrieval algorithms, Tellus A, 60, 191–205, https://doi.org/10.1111/j.1600-0870.2007.00285.x, 2008.
Tanré, D., Haywood, J., Pelon, J., Léon, J., Chatenet, B., Formenti, P., Francis, P., Goloub, P., Highwood, E., and Myhre, G.: Measurement and modeling of the Saharan dust radiative impact: Overview of the Saharan Dust Experiment (SHADE), J. Geophys. Res.-Atmos., 108, 8574, https://doi.org/10.1029/2002JD003273, 2003.
Uno, I., Eguchi, K., Yumimoto, K., Takemura, T., Shimizu, A., Uematsu, M., Liu, Z., Wang, Z., Hara, Y., and Sugimoto, N.: Asian dust transported one full circuit around the globe, Nat. Geosci. 2, 557–560, https://doi.org/10.1038/ngeo583, 2009.
Vaughan, M., Garnier, A., Josset, D., Avery, M., Lee, K.-P., Liu, Z., Hunt, W., Pelon, J., Hu, Y., Burton, S., Hair, J., Tackett, J. L., Getzewich, B., Kar, J., and Rodier, S.: CALIPSO lidar calibration at 1064 nm: version 4 algorithm, Atmos. Meas. Tech., 12, 51–82, https://doi.org/10.5194/amt-12-51-2019, 2019.
Velasco-Merino, C., Mateos, D., Toledano, C., Prospero, J. M., Molinie, J., Euphrasie-Clotilde, L., González, R., Cachorro, V. E., Calle, A., and de Frutos, A. M.: Impact of long-range transport over the Atlantic Ocean on Saharan dust optical and microphysical properties based on AERONET data, Atmos. Chem. Phys., 18, 9411–9424, https://doi.org/10.5194/acp-18-9411-2018, 2018.
Veselovskii, I., Goloub, P., Podvin, T., Bovchaliuk, V., Derimian, Y., Augustin, P., Fourmentin, M., Tanre, D., Korenskiy, M., Whiteman, D. N., Diallo, A., Ndiaye, T., Kolgotin, A., and Dubovik, O.: Retrieval of optical and physical properties of African dust from multiwavelength Raman lidar measurements during the SHADOW campaign in Senegal, Atmos. Chem. Phys., 16, 7013–7028, https://doi.org/10.5194/acp-16-7013-2016, 2016.
Weinzierl, B., Ansmann, A., Prospero, J. M., Althausen, D., Benker, N., Chouza, F., Dollner, M., Farrell, D., Fomba, W., and Freudenthaler, V.: The saharan aerosol long-range transport and aerosol–cloud-interaction experiment: Overview and selected highlights, B. Am. Meteorol. Soc., 98, 1427–1451, https://doi.org/10.1175/BAMS-D-15-00142.1, 2017.
Winker, D. M., Vaughan, M. A., Omar, A., Hu, Y., Powell, K. A., Liu, Z., Hunt, W. H., and Young, S. A.: Overview of the CALIPSO mission and CALIOP data processing algorithms, J. Atmos. Ocean. Tech., 26, 2310–2323, https://doi.org/10.1175/2009JTECHA1281.1, 2009.
Witschas, B., Lemmerz, C., Geiß, A., Lux, O., Marksteiner, U., Rahm, S., Reitebuch, O., and Weiler, F.: First validation of Aeolus wind observations by airborne Doppler wind lidar measurements, Atmos. Meas. Tech., 13, 2381–2396, https://doi.org/10.5194/amt-13-2381-2020, 2020.
Yu, H., Chin, M., Yuan, T., Bian, H., Remer, L. A., Prospero, J. M., Omar, A., Winker, D., Yang, Y., Zhang, Y., Zhang, Z., and Zhao, C.: The fertilizing role of African dust in the Amazon rainforest: A first multiyear assessment based on data from Cloud-Aerosol Lidar and Infrared Pathfinder Satellite Observations, Geophys. Res. Lett., 42, 1984–1991, https://doi.org/10.1002/2015GL063040, 2015.
Yu, H., Tan, Q., Zhou, L., Zhou, Y., Bian, H., Chin, M., Ryder, C. L., Levy, R. C., Pradhan, Y., Shi, Y., Song, Q., Zhang, Z., Colarco, P. R., Kim, D., Remer, L. A., Yuan, T., Mayol-Bracero, O., and Holben, B. N.: Observation and modeling of the historic “Godzilla” African dust intrusion into the Caribbean Basin and the southern US in June 2020, Atmos. Chem. Phys., 21, 12359–12383, https://doi.org/10.5194/acp-21-12359-2021, 2021.