the Creative Commons Attribution 4.0 License.
the Creative Commons Attribution 4.0 License.
 | 17 Jun 2022
Suppressed migrating diurnal tides in the mesosphere and lower thermosphere region during El Niño in northern winter and its possible mechanism
Yetao Cen
James M. Russell III
Xiankang Dou
As observed by the Sounding of the Atmosphere using Broadband Emission Radiometry (SABER), the migrating diurnal tide (DW1) in the upper mesosphere and lower thermosphere (MLT) region decreased by ∼ 10 % during El Niño in the Northern Hemisphere (NH) winter (December–January–February) from 2002 to 2020. According to the multiple linear regression (MLR) analysis, the linear effects of El Niño on the tropical MLT DW1 are significantly negative in both SABER observations and SD-WACCM (the Specified-Dynamics version of the Whole Atmosphere Community Climate Model) simulations. The DW1 response to El Niño in NH winter is much stronger than its annual mean response. As suggested by SD-WACCM simulation, Hough mode (1, 1) dominates the DW1 tidal variation in the tropical MLT region. The consistency between the (1, 1) mode in the tropopause region and the MLT region and the downward phase progression from 15 to 100 km indicates the direct upward propagation of DW1 from the excitation source in the troposphere. The suppressed DW1 heating rates in the tropical troposphere (averaged over ∼ 0–16 km and 35∘ S–35∘ N) during El Niño winter contribute to the decreased DW1 tide. To evaluate the effect of the gravity waves (GWs) on the tide, the GW forcing is calculated as the GW drag weighted by the phase relation between DW1 GW drag and DW1 wind. The negative GW forcing in the tropical upper mesosphere would significantly suppress the MLT DW1 tide during El Niño winter. This tide–GW interaction could be a dominant mechanism for DW1 response in the MLT to El Niño. During El Niño winter, the increased ratio of the absolute and planetary vorticity (R) suppresses the waveguide and thus the DW1 amplitude in the subtropical mesosphere. However, the effect of the waveguide might play a secondary role due to its relatively weak response.
- Article
(1111 KB) - Full-text XML
-
Supplement
(1043 KB) - BibTeX
- EndNote


Atmospheric solar tides are global-scale variations in meteorological variables (e.g. density, wind, and temperature) with subharmonic periods of a solar day. The migrating diurnal tide is dominant in the tropical mesosphere and lower thermosphere (MLT) region and is characterized by westward-travelling zonal wavenumber 1, denoted as DW1 (Chapman and Lindzen, 1970). DW1 is primarily excited by the absorption of infrared (IR) radiation by water vapour in the troposphere (∼ 0–15 km) (Hagan and Forbes, 2002) and can propagate vertically and reach maximum amplitude in the MLT region (Walterscheid, 1981a; McLandress et al., 1996; Liu and Hagan, 1998; Lu et al., 2009; Liu et al., 2010; Yang et al., 2018). Diurnal migrating tides remain a significant focus of scientific research due to a lack of comprehensive understanding of their seasonal and interannual variabilities. The tidal variation in the MLT region depends on variations in the wave sources, such as the solar heating absorption in the lower atmosphere (Chapman and Lindzen, 1970) and the tidal wave propagation, which is affected by background wind variation, such as the quasi-biennial oscillation (QBO), which is a tropical, lower stratospheric, downward-propagating zonal wind variation (Forbes and Vincent, 1989; Hagan et al., 1999; McLandress, 2002a, b; Ramesh et al., 2020; Mayr and Mengel, 2005). In addition to tidal sources and propagation, tidal variability is also affected by the modulation of interactions with gravity waves (GWs) (Liu and Hagan, 1998; Li et al., 2009).
As the dominant interannual variation in the tropical troposphere (Yulaeva and Wallace, 1994), the El Niño–Southern Oscillation (ENSO), which is characterized by anomalous sea surface temperature in the eastern equatorial Pacific Ocean, can cause global-scale perturbations in atmospheric temperature, rainfall, and cloudiness and potentially modulate tidal heating sources in the troposphere (Lieberman et al., 2007). Previous studies have documented that ENSO can influence the troposphere (Yulaeva and Wallace, 1994; Calvo-Fernandez et al., 2004) and the stratosphere and mesosphere (Sassi et al., 2004; Randel et al., 2009; Li et al., 2013, 2016). ENSO events tend to reach their maximum in the Northern Hemisphere (NH) winter; they could significantly impact the MLT tide.
According to meridional wind observations from the meteor radar at Jakarta (6.4∘ S, 106.7∘ E) and medium-frequency (MF) radar at Tirunelveli (8.7∘ N, 77.8∘ E), the tropical diurnal amplitudes in the meridional winds were suppressed during the El Niño winters of 1994/1995 and 1997/1998 (Gurubaran et al., 2005). However, Lieberman et al. (2007) documented a dramatic enhancement of the subtropical diurnal tide in 1997 based on MF radar observations at Kauai, Hawaii (22∘ N, 154∘ W), which may be connected to more substantial solar heating absorbed by water vapour during the strong El Niño event of 1997–1998. Notably, the diurnal tidal amplitude was only slightly enhanced during the winter of 1997/1998, when El Niño reached its maximum. However, the diurnal tidal amplitudes were suppressed during the winters of another three El Niño events (1991/1992, 1994/1995, and 2002/2003). Based on the observations from ground-based radars and the Sounding of the Atmosphere using Broadband Emission Radiometry (SABER) on board the Thermosphere Ionosphere Mesosphere Energetics and Dynamics (TIMED) satellite, Vitharana et al. (2021) documented that the DW1 response to El Niño was negative from 2003 to 2016, considering all the months. However, the response of DW1 to ENSO is different or even opposite in different seasons, as suggested by previous studies (e.g. Lieberman et al., 2007; Zhou et al., 2018; Kogure et al., 2021). For instance, Lieberman et al. (2007) reported a dramatic enhancement of the subtropical diurnal tide during the 1997 autumn based on MF radar. From July to October of the strong El Niño of 2015, the equatorial DW1 in the MLT was also dramatically enhanced in SABER (Zhou et al., 2018; Kogure et al., 2021). Thus, calculating the regression by binning the data among different months together may underestimate the actual response of MLT DW1 tide in a particular season. Since ENSO reaches its peak in winter, more pronounced effects in the upper atmosphere are expected. Thus, we focus on the linear response of DW1 to ENSO during the winter in this study.
Utilizing the Whole Atmosphere Community Climate Model (WACCM) version 4, Pedatella and Liu (2012, 2013) suggested that El Niño could enhance the MLT DW1 tide during winters due to increased tropospheric radiative forcing. The QBO signal is prescribed in WACCM4, and the ENSO events are self-generated. Based on the WACCM version 6 simulations in which the QBO and ENSO are self-generated, Ramesh et al. (2020) investigated the linear response of latitude pressure variation in DW1-T to the seven predictors, including ENSO in four seasons, by adopting the multivariate linear regression. As suggested in Fig. 5 by Ramesh et al. (2020), the linear response of DW1 T amplitude to ENSO is significantly positive during the NH winter in the tropical MLT region. However, Liu et al. (2017) found that DW1 amplitudes are suppressed during the winters of El Niño events based on simulations of the ground-to-topside atmosphere–ionosphere for aeronomy (GAIA) model. Since GAIA is nudged with reanalysis data below 30 km, ENSO events and variations in the lower atmosphere are more realistic. The discrepancies among the model simulations and uncertainties in the observations require further investigation of the DW1 tide–ENSO connection.
The response of the MLT DW1 tide to ENSO during the winters is revisited in this study based on the DW1 variation extracted from a long-term temperature dataset observed by SABER on board the TIMED satellite (Mertens et al., 2001, 2004; Rezac et al., 2015). The “Specified-Dynamics” version of the WACCM simulation is used to study the possible mechanism. The data and methods are described in Sect. 2. Section 3 presents the observational and model results of the DW1 temperature response to ENSO. Section 4 examines the possible mechanism that modulates the MLT DW1 tide during ENSO events. Finally, a summary is presented in Sect. 5.
SABER began its observations in January 2002. Kinetic temperature profiles are retrieved from the CO2 limb emission profiles from the tropopause to the lower thermosphere using a full non-local thermodynamic equilibrium (non-LTE) inversion (Mertens et al., 2001, 2004; Rezac et al., 2015). The latitude range of SABER observations is from 53∘ in one hemisphere to 83∘ in the other, and the latitude coverage flips to the opposite hemisphere approximately every 60 d. Thus, SABER provides nearly continuous soundings within 53∘ S and 53∘ N. This study used version 2.0 temperature data from February 2002 through July 2021 to analyse the DW1 temperature tide in the MLT region. SABER can complete a nearly 24 h local time observation within a ∼ 60 d window, allowing us to extract the diurnal tide explicitly.
The method described by Xu et al. (2007b) is utilized to extract the DW1 tide from TIMED/SABER temperature data. Migrating tides can be expressed as
where T is temperature; tLT is local time; λ is longitude; overbar denotes zonal mean; the second term on the right side refers to migrating tides with corresponding to the diurnal, semidiurnal, terdiurnal, and 6 h periods; and are the amplitude and phase of the migrating tide; and ε is the remnant of the temperature variability which could not be represented by the first two terms. The daily data are first divided into two groups according to their local time corresponding to the ascending and descending phases to extract tidal components. Then, each group is interpolated into 12 longitude grids, each 30∘ wide, by fitting with a cubic spline. The next step is to calculate the zonal mean for each day to eliminate the nonmigrating tides and the stationary planetary waves. The migrating tides' bimonthly amplitudes and phase information can be calculated by nonlinear least-squares fitting techniques using data within a 60 d sliding window every month (Xu et al., 2007a, b; Smith, 2012; Gan et al., 2014).
The WACCM is a fully coupled chemistry–climate model, the high-top atmosphere component of the Community Earth System Model (CESM) (Garcia et al., 2007). In this study, the simulation of the Specified-Dynamics (SD) version of WACCM (SD-WACCM), version 4, is adopted to investigate the ENSO–DW1 tide relationship. The vertical range of SD-WACCM extends from the surface up to ∼ 140 km. The simulated diurnal tide in WACCM4 compares favourably with observations (Lu et al., 2011; Davis et al., 2013). SD-WACCM is nudged to meteorological fields from Modern-Era Retrospective Analysis for Research and Applications (MERRA) reanalysis data in the troposphere and stratosphere (from the surface up to 1 hPa) and then is freely run in the MLT (above 0.3 hPa) (Kunz et al., 2011). Smith et al. (2017) discussed the dynamic constraints in SD-WACCM and their impact on the simulation of the mesosphere in detail. The ENSO-related characteristics in the troposphere and stratosphere in SD-WACCM follow those in the reanalysis meteorological fields with relaxation. In this study, the SD-WACCM output includes complete diurnal tidal information for temperature, zonal and meridional wind, and heating processes from 1979 to 2014. The simulation also outputs the diurnal components of parameterized GW drag. We note here that the WACCM version 6 simulation was not used in this study due to its opposite response of MLT DW1 to ENSO compared to SABER observations.
The Niño3.4 index (N3.4), which is the sea surface temperature (SST) anomaly, averaged over 120–170∘ W and 5∘ S–5∘ N (available at https://psl.noaa.gov/gcos_wgsp/Timeseries/Data/nino34.long.anom.data, last access: 1 June 2022), is used to identify El Niño and La Niña events.
The monthly DW1 can be specified through its amplitude and phase. To evaluate the variations in both the amplitude and phase of the DW1 tide, the monthly DW1 amplitudes are weighted by projecting the monthly mean vectors onto the climatological mean DW1 vector with the phase difference cos (Δφ) (the phase difference is as follows:
where ω () is the frequency of the DW1 tide. ϕ and ϕclim are the DW1 phase of each month and the climatological mean, respectively. In the remainder of this study, the weighted DW1 amplitude (and its anomaly) refers to the DW1 amplitude (anomaly) for conciseness. The mean tidal amplitude and phase during NH winter are derived from each year's averaged tidal vectors for December, January, and February (DJF).
To derive the winter interannual variability that may be related to ENSO, we first calculate the DW1 anomalies by removing the climatological mean seasonal cycle. Then, the winter (DJF) mean of the DW1 anomalies is calculated. Natural forcing, such as the solar cycle (represented by F107), QBO, ENSO, and long-term trends, jointly affect the DW1 tidal amplitude (e.g. Dhadly et al., 2018; Gurubaran et al., 2005; Gurubaran and Rajaram, 1999; Hagan et al., 1999; Lieberman et al., 2007; Liu et al., 2017; Pedatella and Liu, 2012; Sridharan, 2019, 2020; Sridharan et al., 2010; Vincent et al., 1998; Xu et al., 2009). To isolate the linear forcing of ENSO from the interference of other factors, a multivariate linear regression (MLR) analysis is applied to the anomalous time series at each latitude and altitude, the same as that used in Li et al. (2013).
where T is the DW1-T anomaly, t is time, C1–C5 are regression coefficients, and ε is the residual; QBO10 and QBO30 are two orthogonal QBO time series derived from the zonal wind (m s−1) averaged over 5∘ N to 5∘ S at 10 and 30 hPa (Wallace et al., 1993), respectively. The Niño3.4 index (Niño3.4) is the 3-month running mean of SST averaged over 5∘ N to 5∘ S, 120–170∘ W; F107 is the solar radio flux at 10.7 cm, which is a proxy for solar activity; and TREND is the long-term linear trend. The linear contribution of each factor during winter is determined by applying MLR to DJF anomalies each year. The analysis is carried out from 2002 to 2020 at each latitude and pressure grid point. The F test (Kissell et al., 2017) was used to evaluate the statistical significance of the regression coefficients.
The Hough function in classic tidal theory (Chapman and Lindzen, 1970), which represents the solution of the Laplace tide equation in the isothermal atmosphere, can set a consistent latitude variation in the amplitude and phase of the tidal perturbation field. The Hough functions of daily variation frequency form a completely orthogonal set and extend from 90∘ S to 90∘ N. This estimating amplitude and phase method is based on fitting the Hough mode to the zonal structure representation and the simple harmonic function (sine and cosine) to the local time-varying representation. The Hough mode is represented as Θs,n(θ) or (s,n), where s indicates the zonal wavenumber and index n is positive for gravitational modes (propagating modes) and negative for rotational modes (trapped modes). The normalized functions satisfy the following relation.
As presented in Fig. 1a, the NH winter (December–January–February, DJF) mean amplitude of DW1 in temperature extracted from TIMED/SABER observation is the largest (∼ 12 K) in the equatorial mesopause region from 2002 to 2013. Although the amplitude is smaller, the distribution of the DW1 T amplitude in SD-WACCM simulation (Fig. 1b) is similar to that derived from SABER observation, with the maximum at 90–100 km above the Equator. There are some differences between SABER and SD-WACCM: SABER has a weaker peak above the Equator at 70–80 km, but this peak cannot be seen in SD-WACCM.
Figure 1(a) The average DW1 temperature amplitude of SABER observation during the 2002–2013 winter (DJF, Dec–Jan–Feb). (b) The same as (a), but for SD-WACCM.
Figure 2(a) The residual DW1 temperature amplitude of SABER observations averaged over 10∘ S–10∘ N at 100 km from 2002 to 2021. (b) Same as in (a) but for SD-WACCM. (c) Niño3.4 index. Dashed lines represent ENSO events. The red solid and hollow blue arrows denote the El Niño and La Niña events.
Figure 2a and b show the monthly mean DW1 temperature amplitude anomalies (removing the climatological mean seasonal cycle) averaged over 10∘ S–10∘ N at 100 km derived from SABER observations and SD-WACCM simulations between 2002 and 2020, respectively. Among the analysed period, there were four El Niño events in 2002, 2006, 2009, and 2015, which are indicated with red arrows and defined by the Niño3.4 index in Fig. 2c; the three La Niña events in 2007, 2010, and 2020 are marked with blue arrows. The anomalous DW1 amplitudes are negative during four El Niño winters and positive during all three La Niña events. The DW1 anomalies reach a positive maximum from July to October during the 2015/2016 strong El Niño event, which agrees with Zhou et al. (2018); however, they become negative in winter. When SD-WACCM and SABER overlap (2002–2014), the simulated DW1 amplitude anomalies in SD-WACCM are negative during all three El Niño winters (2002, 2006, and 2009) and positive during two La Niña events. The negative response of the MLT DW1 tide to El Niño in the SD-WACCM simulation agrees well with that in the SABER observation.
In the 35-year SD-WACCM simulations (1979–2014), the anomalous DW1 amplitudes averaged over 10∘ S–10∘ N at 100 km are negative during seven of eight El Niño winters (1982, 1986, 1991, 1997, 2002, 2006, and 2009), as shown in Table 1. The MLR coefficients of DW1 to normalized Niño3.4 are significantly negative in both the SABER observation and SD-WACCM simulation, as shown in Fig. 3. The amplitude of DW1 in the equatorial region is reduced considerably. However, the phase anomaly does not vary much (less than 1 h) during El Niño winter (Figs. S1, S2 in the Supplement).

Figure 3The linear regression coefficient of normalized Niño3.4 in SABER (a) and SD-WACCM (b) winter DW1-T. The contour interval is 0.2 K for SABER and 0.1 K for SD-WACCM. Solid lines and red shadings denote the positive responses, while dashed lines and blue shadings denote the negative responses; the grey regions indicate where the response is insignificant at the 95 % level according to the F test.
Table 1The list of ENSO years with corresponding Niño3.4 indices and anomaly DW1 temperature amplitudes of the SD-WACCM simulations averaged over 10∘ S–10∘ N at 100 km.
The MLT DW1 response to El Niño in winter is 5 times stronger than the average response in SABER observations derived by Vitharana et al. (2021). This is because the DW1 enhancement in El Niño autumn (e.g. Lieberman et al., 2007; Zhou et al., 2018; Kogure et al., 2021) may weaken the negative response to ENSO. In the simulations of Ramesh et al. (2020), different seasons also exhibit different responses of DW1 to ENSO. The MLR coefficients of tropical DW1 to Niño3.4 in the SABER observation (with a minimum of ∼ −1 K per index) are twice as strong as those (with a minimum of ∼ -0.5 K per index) in the SD-WACCM simulation since the magnitude of the DW1 tide is underestimated in the WACCM4 simulation (Liu et al., 2010; Lu et al., 2012). The negative response of the MLT DW1-T amplitude to El Niño is consistent with early MF radar/meteor radar observations and GAIA model simulations with a nudging process (Gurubaran, 2005; Liu et al., 2017) but opposite to free-run WACCM simulations (Pedatella and Liu, 2012 and 2013).
The MLR coefficients of the DW1 response to normalized QBO10 and QBO30 in the equatorial mesopause region are significantly positive, with a minimum of ∼ 1 K m−1 s near 100 km (Fig. S3), consistent with previous studies (Ramesh et al., 2020). The linear effects of the QBO on the MLT DW1 tides are comparable to those of ENSO (the variances in the DW1 tide explained by ENSO, QBO10, and QBO30 are 23 %, 20 %, and 17 %, respectively). The interaction between the QBO and ENSO may potentially modulate the ENSO–DW1 tide relationship (Gray, 1984). In this study, we focused on the linear effect of ENSO on the MLT DW1 tidal variability and the associated mechanism. In SD-WACCM, the linear regression coefficients of DW1 are a negative response to Niño3.4 and a positive response to QBO10 and QBO30, which is consistent with the SABER observation. However, the absolute value of the coefficients decreases more than that of SABER. The variance percentages of F107 are negligible compared with these three variables. In the remainder of this study, only the linear effect of ENSO on the MLT DW1 tide is discussed.
4.1 Tidal forcing and propagation
A specific tidal component, such as DW1, can be decomposed into a series of gravity-wave-like modes and Rossby-wave-like modes based on the Hough functions (Fig. S4) (Auclair-Desrotour et al., 2017; Chapman and Lindzen, 1970; Forbes, 1995). In a qualitative sense, the tidal response can be considered a combination of GWs restored by stable stratification and inertial Rossby waves due to Coriolis acceleration. The Hough modes of the DW1 tide in the SD-WACCM simulation are analysed to examine the mechanism of tropical DW1 tidal variation. As shown in Fig. 4a, the anomalies of the DW1 temperature amplitude averaged over 10∘ S–10∘ N at 100 km are consistent with its Hough (1,1) component (the correlation coefficient between MLT DW1-T anomalies and its Hough (1,1) component is 0.99) during the NH winter from 1979 to 2013. The DW1-T amplitude anomalies and their Hough (1,1) component during El Niño years decrease by 15 % compared to the climatological mean amplitude. During winters (DJF) from 1979 to 2013, the average phase of DW1-T over 10∘ S–10∘ N shows general downward phase progression with the height from the MLT region to the tropopause region (approximately 15 km), implying an upward group velocity for the vertically propagating gravity wave model. By tracking the downward phase progressive line, the altitude of the excitation source is estimated to be below 15 km. The DW1-T phase during El Niño winters corresponds with the climatological mean phase structure, implying that ENSO-induced tidal perturbation in the troposphere could directly propagate vertically into the MLT region. The anomalous Hough (1,1) mode of the DW1 temperature amplitude at MLT (100 km) is significantly correlated (the correlation coefficient is 0.81) with that at the tropopause region (15 km), indicating the effective propagation of the perturbation in the tropospheric Hough (1,1) into the MLT region. During seven of eight El Niño events (1982, 1986, 1991, 1997, 2002, 2006, and 2009), the Hough (1,1) mode in the tropopause decreased by approximately 15 % compared to the climatological mean amplitude, which agrees well with the anomalous Hough (1,1) in the MLT.
Figure 4(a) The solid red line indicates the anomalous DW1 temperature amplitude of SD-WACCM simulations averaged over 10∘ S–10∘ N at 100 km during the 1979–2013 winter (DJF). The blue dotted line indicates the Hough (1,1) mode of the DW1 temperature amplitude residual at 100 km during the 1979–2013 winter (DJF). (b) The thin black dotted line indicates the Hough (1,1) DW1-T phase of SD-WACCM simulations at 0–100 km during the 1979–2013 winter (DJF). The thick black horizontal line indicates the standard deviation of the DW1-T phase. The solid red line is the same but for El Niño winter. (c) The solid blue line is the same as in (a), and the black dotted line is the same but for 15 km.

Figure 5The linear regression coefficient of normalized Niño3.4 in SD-WACCM heating amplitude (mW m−3 per index) during 1979–2013 winters (DJF). Solid lines and red shadings denote the positive responses, while dashed lines and blue shadings denote the negative responses; the grey regions indicate where the response is insignificant at the 95 % level according to the F test.
As noted earlier, the DW1 tide is primarily excited by the absorption of solar radiation by tropospheric water vapour (Lieberman et al., 2003; Zhang et al., 2010). According to the tidal theory (Volland, 1988), the heating rate of radiation absorbed by water vapour in the entire troposphere is responsible for the excitation of diurnal migrating tides. Next, we examine the perturbation of the DW1 solar heating source in the SD-WACCM simulation, which potentially contributes to the negative Hough (1,1) tidal anomalies in the tropopause region during El Niño winters. As presented in Fig. 5, the anomalous amplitudes of the DW1 heating rate (HR) regressed on the normalized Niño3.4 index are significantly positive (with a maximum of ∼ 0.4 mW m−3 per index) in the upper tropical troposphere (5∘ S–5∘ N, 3–12 km) but are significantly negative below 3 km (with a minimum of ∼ −4 mW m3 per index). The ENSO-induced changes in the tropospheric DW1 heating forcing may be due to the redistribution of tropospheric convection during El Niño and La Niña winters. During El Niño winters, increased moisture in the upper troposphere due to enhanced tropical precipitation in the central Pacific Ocean (e.g. Hoerling et al., 1997) leads to stronger solar heating absorption by water vapour in the middle and upper equatorial troposphere (5–12 km, 10∘ S–10∘ N).
On the other hand, heating in the lower troposphere significantly decreased due to less solar radiation below the convective cloud. The DW1 HR regressed on Niño3.4 in the NH (5–35∘ N) is characterized by a very negative coefficient of 3–8 km (with a maximum of ∼ −0.3 mW m3 per index) associated with significantly positive coefficients below 2 km (with a maximum of ∼ 3 mW m−3 per index). In the Southern Hemisphere (SH), the distribution of DW1 HR coefficients consists of negative and positive values at different altitudes and latitudes.
Pedatella et al. (2013) adopted the HR in the upper tropical troposphere (5–10 km within ±20∘) to estimate the ENSO-induced variation in the DW1 tidal source. To examine the excitation of the DW1 tide in the lower atmosphere, the HR averaged over several different areas has been selected in previous studies (e.g. altitude range between 900–200 hPa, 1–12 km in Lieberman et al., 2003, and 1000–100 hPa, 0–16 km in Zhang et al., 2010). As suggested in Table 2, the mass-weighted HR averaged over the entire tropical troposphere (0–16 km, 35∘ N–35∘ S), which negatively responds to ENSO, is significantly correlated (the correlation coefficient is 0.45) with the DW1 tide in the tropical tropopause region. Although the linear regression coefficient in HR is positive at 5–10 km over the Equator (5∘ N–5∘ S), the coefficients at 5–30∘ N (S) are negative (Fig. 5), which is opposite of the Equator (5∘ N–5∘ S). The HR averaged over 5–10 km, 20∘ N–20∘ S (the same as in Pedatella et al., 2013) regressed on Niño3.4 is also negative, although it is not significantly correlated with the DW1 tidal variation in the tropopause. The decreased DW1 heating source in the troposphere during El Niño is a primary cause of the suppressed DW1 tide in the tropopause region during winters, which propagates vertically and affects the DW1 tidal variation in the MLT region.
Table 2The correlation coefficient between the DW1-T amplitude at 15 km and the mass-weighted HR in different areas during the winters of 1979–2014. The bold numbers indicate that the correlation coefficients are significant at 95 %. The MLR coefficient on the normalized Niño3.4 index (10−3mw m−3 per index) is also exhibited.

4.2 Effect of background wind
The zonal wind in the middle atmosphere can modulate tide propagation from the troposphere to the MLT (Forbes and Vincent, 1989). As McLandress (2002b) described, the perturbation of latitudinal shear in the zonal mean zonal wind (zonal mean vorticity) can affect DW1 propagation into the MLT region by causing departures from classical tidal dynamics. The following equation gives the zonal mean vorticity ζ and Coriolis parameter f:
where a, , and θ correspond to the Earth radius, zonal mean zonal wind, and latitude, respectively, and Ω is the Earth's rotation rate.
The absolute and planetary vorticity R ratio is equivalent to changing the planet's rotation rate. In classical theory, the vertically propagating DW1 is restricted near the Equator due to the planet's rapid rotation. Therefore, a faster rotation rate (positive R anomalies) will suppress the latitudinal band (i.e. waveguide) where DW1 can propagate vertically. On the other hand, the slower rotation rate (negative R anomalies) favours the vertical propagation and is thus able to enhance the amplitude of DW1 at low latitudes (McLandress, 2002b). When the ratio of the absolute and planetary vorticity R value at a certain height becomes larger, the upward propagation of tide is suppressed, which leads to weaker tides above there.
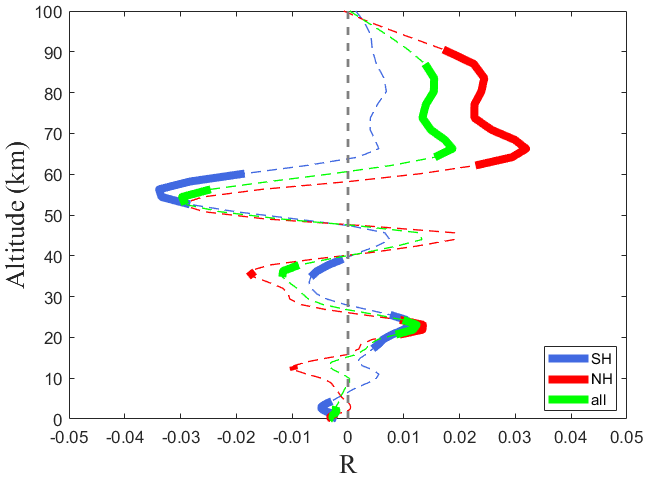
Figure 6The linear regression coefficient of normalized Niño3.4 in δR (the anomaly of the ratio of the absolute to planetary vorticity). The thin dashed red, blue, and green lines denote the averages of the Northern Hemisphere (from 15 to 30∘ N), Southern Hemisphere (from 15 to 30∘ S), and the whole (15–30∘ N and 15–30∘ S), respectively. The thick, solid lines denote confidence levels higher than 95 % for the F test.
The MLR coefficient of R on Niño3.4 is illustrated in Fig. 6. Below 60 km, the ratio R exhibits negative and positive responses to ENSO depending on different altitudes in the northern and southern subtropics. The R response to ENSO is positive at 60–100 km in the northern subtropics and 65–100 km in the southern subtropics. The thick green solid line represents the mean value of the equatorial R (15–30∘ N and 15–30∘ S), and it can be seen that the mean R value response to ENSO is significantly positive at 60–90 km. The increased ratio R in the mesosphere results in the suppressed latitudinal band, which prevents the upward propagation of the DW1 tide during El Niño winters. The correlation coefficient between the R-value and DW1 during the winter of 1979–2014 is ∼ −0.33 in the SH and ∼ −0.37 in the NH, implying that the R plays a role in modulating the upward propagation of DW1 when no ENSO event occurs. The variation in R and DW1 should not be attributed to the impacts of ENSO separately.
4.3 Effect of gravity wave forcing
In addition to tidal sources and propagation, MLT tidal variability is also affected by interactions with GWs (Liu and Hagan, 1998; Li et al., 2009). GWs are the main driving force of MLT dynamic activity, which influences tidal amplitude and phase (Walterscheid, 1981b; Lu et al., 2012; Liu et al., 2013). The effect of the GW forcing on tides is not fully understood due to the limited observation and lack of high-resolution model simulations that can fully resolve both tides and GWs. In WACCM, the GWs are parameterized, and their tropical sources are interactive and mainly triggered by convection in the tropics (Beres et al., 2015). The GW in the tropics is primarily induced by convection, while the GW in the middle to high latitudes is mainly generated by the frontal systems (Figs. S5, S6). Due to this interaction source, the GW drag will likely be modulated by ENSO as the location and size of the ENSO-related convection change. The GW drag far away from the tropospheric source strongly responds to the wind. As mentioned above, we can determine the variation in the resistance of the convection-generated GW in the WACCM. We mainly focus on the latitudinal component of parameterized resistance because it is usually much larger than the meridional component (Yang et al., 2018).
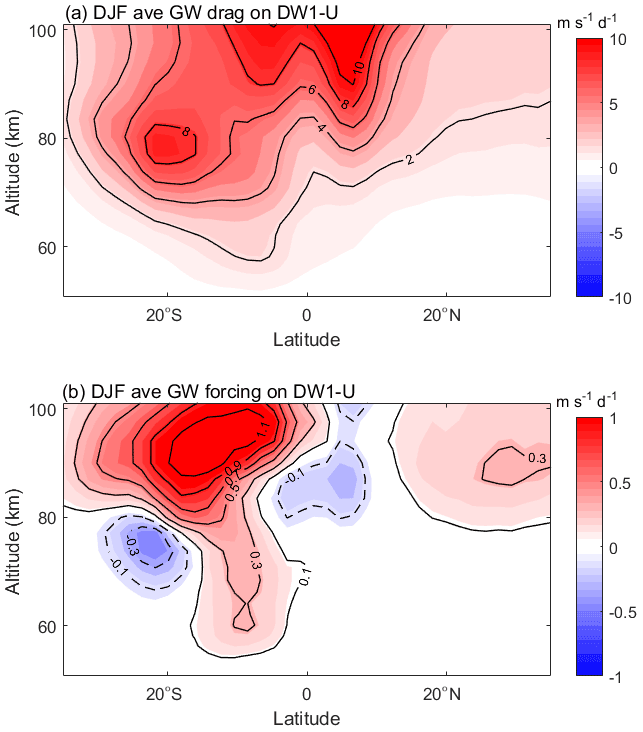
Figure 7(a) Gravity wave (GW) drag due to convection on the amplitude of DW1 tidal U during the winter (DJF). (b) The same as (a), but for GW forcing.
In the NH winter, the DW1 GW drag caused by convection has apparent hemispheric asymmetry: the magnitude is much smaller in the NH than in the SH (Fig. 7a). The zonal wind DW1 tide can be written as , where A and ϕ are the amplitude and phase of DW1 tide, is DW1 frequency, λ is longitude, and is the zonal wavenumber of DW1. The time tendency of the zonal wind can be written as
The DW1 tide time tendency phase leads the tide itself by 6 h. To evaluate the effect of GW forcing on the DW1 tide during DJF, the GW forcing can be calculated as
where GWdrag is GW drag, and ϕGW and ϕU are the phase of DW1-GW and DW1-U.
The convection-generated GW forcing on the DW1 tide is positive in the southern subtropical upper mesosphere and negative below this tide (60–80 km) during the NH winter (Fig. 7b). In the NH mesopause region, the GW forcing on the DW1 tide is positive in the subtropics (15–35∘ N) and negative in the tropics (0–10∘ N). This indicates that convection-generated GW forcing will dampen the tides in the tropical MLT and enhance the tides in the NH and SH subtropical regions (Fig. 7b). As shown in Fig. 8a, the correlation between DW1 U and GW drag from 1979 to 2014 winter (DJF) is only significant in the mesopause region of the southern subtropics and the Equator. The correlation between DW1 U and GW forcing from 1979 to 2014 winter (DJF) is more significant than 0.7 in the tropical and subtropical MLT (Fig. 8b). According to the F test, the red areas indicate statistical significance above 95 %, meaning GW forcing clearly modulates the tide, especially in the southern subtropics. The linear regression coefficient of Niño3.4 in the GW forcing is significantly negative in the tropical MLT region (Fig. 9, 80–100 km), suggesting that the decreased GW forcing would lead to a weaker DW1 U amplitude during El Niño winters.
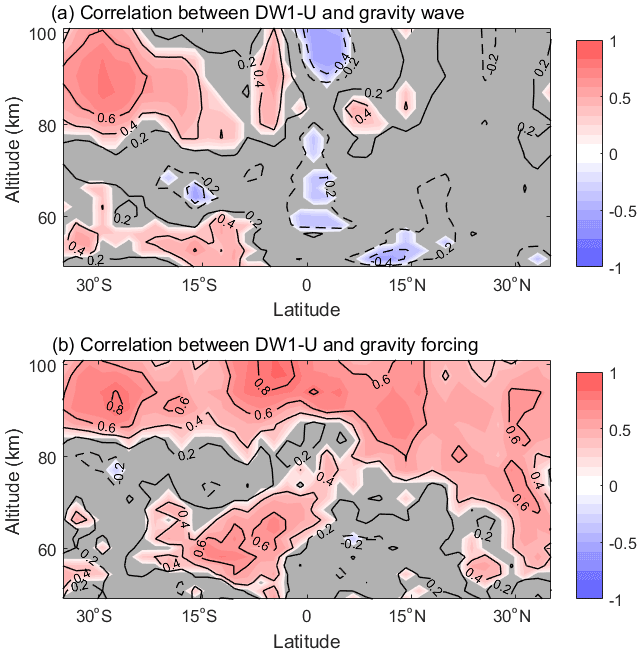
Figure 8Correlation (a) between DW1-U and GW drag, (b) between DW1 U and GW forcing from 1979 to 2014 winter (DJF). Solid lines and red shadings denote the positive responses, while dashed lines and blue shadings denote the negative responses; the grey regions indicate where the response is insignificant at the 95 % level according to the F test.
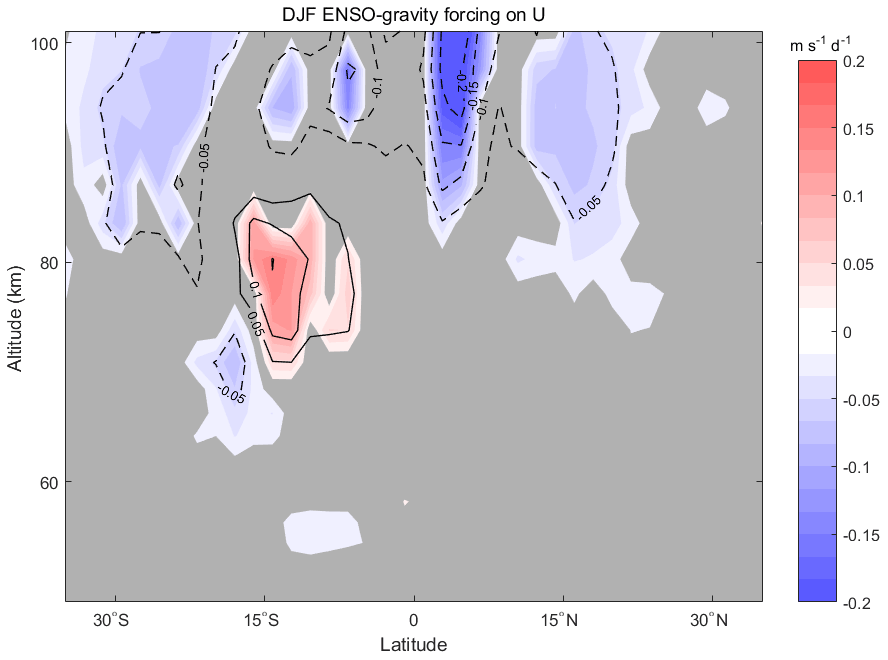
Figure 9The linear regression coefficient of normalized Niño3.4 in the GW forcing on the amplitude of DW1-U during the 1979–2013 winters (DJF). Solid lines and red shadings denote the positive responses, while dashed lines and blue shadings denote the negative responses; the grey regions indicate where the response is insignificant at the 95 % level according to the F test.
Although parameterized GWs are excited by convection (in the tropics), it is difficult to find a direct cause-and-effect relationship between ENSO-related tropospheric changes and the GW-induced tidal forcing in the mesosphere. The GW forcing in the MLT not only depends on the generation of waves in the troposphere but also on zonal wind filtering when they propagate upward from the troposphere to the upper mesosphere. However, our study suggests that the ENSO modulation of tidal amplitude can come from the disturbance in tropospheric tidal sources, tidal propagation modulated by zonal wind, and the disturbance of the GW–tide interaction in the upper mesosphere.
The response of the MLT DW1 tide to ENSO is investigated during the northern winter when ENSO reaches its peak by using satellite observations of temperature profiles and the SD-WACCM simulation. The DW1 temperature amplitude observed by SABER tends to decrease during the NH winter of four El Niño events between 2002 and 2020 when El Niño reaches its peak and increases during three La Niña events. In SD-WACCM simulations, the DW1 amplitude is suppressed during seven of eight El Niño winter (DJF) events from 1979 to 2014.
Possible mechanisms have been proposed to explain the DW1 response to ENSO: (1) the source of tidal excitation in the lower atmosphere and its upward propagation, (2) the impact of background wind variation on the tidal propagation, and (3) interaction between gravity waves and tides. As the Hough (1,1) mode dominates the diurnal migrating tidal temperature in the MLT region, its negative response to ENSO corresponds well with the counterpart at the tropopause. By tracking the downward phase progressive line, the altitude of the excitation source is estimated to be below 15 km. The decreased heating rate in the tropical troposphere (35∘ S–35∘ N, 0–16 km) during El Niño contributes to the suppressed DW1 tidal amplitude in the tropical tropopause.
As the background variation could modulate the upward propagation of the tide (Forbes and Vincent, 1989; McLandress, 2002a, 2002b), the ratio of the absolute and planetary vorticity R response to ENSO is investigated. The R response to ENSO is significantly positive at 60–90 km, leading to the narrower waveguide and resulting in weaker DW1 amplitude above. However, the regression coefficient of R on the ENSO index is relatively small compared to the mean value of R, which implies that the impact of R on tidal propagation may play a secondary role in the ENSO–DW1 connection.
In addition to tidal sources and propagation, MLT tidal variability is also dramatically affected by interactions with GWs (Liu and Hagan, 1998; Li et al., 2009). GW forcing considering both the DW1 tidal GWs' drag and the phase difference with the DW1 tide is calculated to evaluate the effect of the GW variation on the tide during ENSO winters. The GW forcing response to Niño3.4 is significantly negative in the tropical upper mesosphere, which suggests the GW response to ENSO tends to dampen the MLT DW1 tide during El Niño winter. This tide–GW interaction could significantly modulate the tidal amplitude, as revealed by early lidar observations (Li et al., 2009; Baumgarten et al., 2018). This could be the most important mechanism of DW1 response in the MLT region to ENSO. However, quantitative evaluation of this interaction is out of the scope of this paper and needs a far more sophisticated model with extremely high resolution to self-generate convective GWs.
The weak negative DW1 response to ENSO over the Equator may be related to the dissipation or damping of the tide near 95 km. The shorter vertical wavelength would increase the Rayleigh friction coefficient (Forbes et al., 1989), enhancing the tide dissipation. As presented in Table S1, the vertical wavelength of DW1 near 95 km is increased (but decreased at around 90 and 100 km), which would suppress the Rayleigh friction coefficient and lead to less tidal dissipation. Therefore, less tidal dissipation in this area could result in a relatively weak negative or even positive response to ENSO near 95 km. The interaction of gravity waves and tides may also play a role in modulating the tidal amplitude at different altitudes. However, the SD-WACCM simulation failed to perform a similar tidal response near 95 km as SABER observations. Further investigation is needed with more detailed GW observations or the improved GW parameterization scheme and higher vertical resolution in the model simulation.
SABER datasets are available from GATS Inc. at http://saber.gats-inc.com (last access: 1 June 2022, GATS Inc., 2021), and SD-WACCM datasets used here are obtained at https://doi.org/10.6084/m9.figshare.19777918 (Cen, 2022).
The supplement related to this article is available online at: https://doi.org/10.5194/acp-22-7861-2022-supplement.
YC and CY designed the study, performed data analysis, prepared the figures, and wrote the manuscript. TL initiated the research and contributed to supervision and interpretation. JMR contributed to editing the manuscript. XD contributed to the interpretation. All authors contributed to the discussion and interpretation.
The contact author has declared that neither they nor their co-authors have any competing interests.
Publisher’s note: Copernicus Publications remains neutral with regard to jurisdictional claims in published maps and institutional affiliations.
This work was supported by the National Natural Science Foundation of China grants (42130203, 41874180, 41974175, 41831071); the B-type Strategic Priority Program of the Chinese Academy of Sciences, grant no. XDB41000000; the pre-research project on Civil Aerospace Technologies no. D020105 funded by China's National Space Administration; and the Open Research Project of Large Research Infrastructures of CAS – “Study on the interaction between low/mid‐latitude atmosphere and ionosphere based on the Chinese Meridian Project”. James M. Russell III's work is supported by the National Science Foundation grant AGS-1901126. We thank Jia Yue for helpful discussions.
This research has been supported by the National Natural Science Foundation of China (grant nos. 42130203, 41874180, 41974175, and 41831071), Chinese Academy of Sciences (grant no. XDB41000000), China's National Space Administration (grant no. D020105), and the National Science Foundation (grant no. AGS-1901126).
This paper was edited by William Ward and reviewed by three anonymous referees.
Auclair-Desrotour, P., Laskar, J., and Mathis, S.: Atmospheric tides and their consequences on the rotational dynamics of terrestrial planets, EAS Publications, 82, 81–90, https://doi.org/10.1051/eas/1982008, 2017.
Baumgarten, K., Gerding, M., Baumgarten, G., and Lübken, F.-J.: Temporal variability of tidal and gravity waves during a record long 10-day continuous lidar sounding, Atmos. Chem. Phys., 18, 371–384, https://doi.org/10.5194/acp-18-371-2018, 2018.
Beres, J. H., Garcia, R. R., Boville, B. A., and Sassi, F.: Implementation of a gravity wave source spectrum parameterization dependent on the properties of convection in the Whole Atmosphere Community Climate Model (WACCM), J. Geophys. Res., 110, D10108, https://doi.org/10.1029/2004JD005504, 2015.
Calvo-Fernández, N., Herrera, R. G., Puyol, D. G. , Martín, E. H., García, R. R., Presa, L. G., and Rodriguez, P. R.: Analysis of the enso signal in tropospheric and stratospheric temperatures observed by MSU, 1979–2000, J. Climate, 17, 3934–3946, https://doi.org/10.1175/1520-0442(2004)017<3934:aotesi>2.0.co;2, 2004.
Cen, Y.: 1979–2014 SDWACCM data, figshare [data set], https://doi.org/10.6084/m9.figshare.19777918, 2022.
Chapman, S. and Lindzen, R.: Atmospheric tides – thermal and gravitational, p. 200, ix, D. Reidel Publishing Company, Dordrecht, the Netherlands, 1970.
Davis, R. N., Du, J., Smith, A. K., Ward, W. E., and Mitchell, N. J.: The diurnal and semidiurnal tides over Ascension Island (∘ S, 14∘ W) and their interaction with the stratospheric quasi-biennial oscillation: studies with meteor radar, eCMAM and WACCM, Atmos. Chem. Phys., 13, 9543–9564, https://doi.org/10.5194/acp-13-9543-2013, 2013.
Dhadly, M. S., Emmert, J. T., Drob, D. P., McCormack, J. P., and Niciejewski, R.: Short-term and interannual variations of migrating diurnal and semidiurnal tides in the mesosphere and lower thermosphere, J. Geophys. Res.-Space Physics, 123, 7106–7123, https://doi.org/10.1029/2018JA025748, 2018.
Forbes, J. M.: Tidal and planetary waves, Geoph. Monog. Series, 87, 67–87, https://doi.org/10.1029/GM087p0067, 1995.
Forbes, J. M. and Vincent, R. A.: Effects of mean winds and dissipation on the diurnal propagating tide: an analytic approach, Planet. Space Sci., 37, 197–209, https://doi.org/10.1016/0032-0633(89)90007-X, 1989.
Gan, Q., Du, J., Ward, W. E., Beagley, S. R., Fomichev, V. I., and Zhang, S.: Climatology of the diurnal tides from eCMAM30 (1979 to 2010) and its comparisons with SABER, Earth Planets Space, 66, 103, https://doi.org/10.1186/1880-5981-66-103, 2014.
Garcia, R. R., Marsh, D. R., Kinnison, D. E., Boville, B. A., and Sassi, F.: Simulation of secular trends in the middle atmosphere, 1950–2003, J. Geophys. Res., 112, D09301, https://doi.org/10.1029/2006JD007485, 2007.
GATS Inc.: SABER Level 2A data (version 2), GATS Inc. [data set], Newport News, VA, USA, http://saber.gats-inc.com, last access: 1 June 2022.
Gray, W. M.: Atlantic seasonal hurricane frequency: Part I: El Niño and 30 mb quasi-biennial oscillation influences, Mon. Wea. Rev., 112, 1649–1668, https://doi.org/10.1175/1520-0493(1984)112<1649:ASHFPI>2.0.CO;2, 1984.
Gurubaran, S. and Rajaram, R.: Long-term variability in the mesospheric tidal winds observed by MF radar over Tirunelveli (8.7∘ N, 77.8∘ E). Geophys. Res. Lett., 26, 1113–1116, https://doi.org/10.1029/1999GL900171, 1999.
Gurubaran, S., Rajaram, R., Nakamura, T., and Tsuda, T.: Interannual variability of diurnal tide in the tropical mesopause region: a signature of the El Niño-Southern Oscillation (ENSO), Geophys. Res. Lett., 32, L13805, https://doi.org/10.1029/2005gl022928, 2005.
Hagan, M. E. and Forbes, J. M.: Migrating and nonmigrating diurnal tides in the middle and upper atmosphere excited by tropospheric latent heat release, J. Geophys. Res., 107, 4754, https://doi.org/10.1029/2001JD001236, 2002.
Hagan, M. E., Burrage, M. D., Forbes, J. M., Hackney, J., Randel, W. J., and Zhang, X.: QBO effects on the diurnal tide in the upper atmosphere, Earth Planet Space, 51, 571–578, https://doi.org/10.1186/BF03353216, 1999.
Hoerling, M. P., Kumar, A., and Zhong, M.: El Niño, La Niña, and the nonlinearity of their teleconnections, J. Climate, 10, 1769–1786, https://doi.org/10.1175/1520-0442(1997)010<1769:ENOLNA>2.0.CO;2, 1997.
Kissell, R. and Poserina, J.: Optimal Sports Math, Statistics, and Fantasy, Academic Press, 352 p., https://doi.org/10.1016/B978-0-12-805163-4.00002-5, 2017.
Kogure, M. and Liu, H.: DW1 tidal enhancements in the equatorial MLT during 2015 El Niño: The relative role of tidal heating and propagation, J. Geophys. Res.-Space Physics, 126, e2021JA029342, https://doi.org/10.1029/2021JA029342, 2021.
Kunz, A., Pan, L., Konopka, P., Kinnison, D., and Tilmes, S.: Chemical and dynamical discontinuity at the extratropical tropopause based on START08 and WACCM analyses, J. Geophys. Res., 116, D24302, https://doi.org/10.1029/2011JD016686, 2011.
Li, T., She, C. Y., Liu, H., Yue, J., Nakamura, T., and Krueger, D. A.: Observation of local tidal variability and instability, along with dissipation of diurnal tidal harmonics in the mesopause region over Fort Collins, Colorado (41∘ N, 105∘ W) (1984–2012), J. Geophys. Res.-Atmos., 114, D06106, https://doi.org/10.1029/2008jd011089, 2009.
Li, T., Calvo, N., Yue, J., Dou, X., Russell III, J. M., Mlynczak, M. G., She, C. Y., and Xue, X.: Influence of El Niño-Southern Oscillation in the mesosphere, Geophys. Res. Lett., 40, 3292–3296, https://doi.org/10.1002/grl.50598, 2013.
Li, T., Calvo, N., Yue, J., Russell III, J. M., Smith, A. K., Mlynczak, M. G., Chandran, A., Dou, X., and Liu, A. Z.: Southern Hemisphere summer mesopause responses to El Niño-Southern Oscillation, J. Climate, 29, 6319–6328, https://doi.org/10.1175/JCLI-D-15-0816.1, 2016.
Lieberman, R. S., Ortland, D. A., and Yarosh, E. S.: Climatology and interannual variability of diurnal water vapor heating, J. Geophys. Res.-Atmos., 108, https://doi.org/10.1029/2002jd002308, 2003.
Lieberman, R. S., Riggin, D. M., Ortland, D. A., Nesbitt, S. W., and Vincent, R. A.: Variability of mesospheric diurnal tides and tropospheric diurnal heating during 1997–1998, J. Geophys. Res.-Atmos., 112, https://doi.org/10.1029/2007jd008578, 2007.
Liu, A. Z., Lu, X., and Franke, S. J.: Diurnal variation of gravity wave momentum flux and its forcing on the diurnal tide, J. Geophys. Res.-Atmos., 118, 1668–1678, https://doi.org/10.1029/2012JD018653, 2013.
Liu, H., Sun, Y. Y., Miyoshi, Y., and Jin, H.: ENSO effects on MLT diurnal tides: A 21 year reanalysis data-driven GAIA model simulation, J. Geophys. Res.-Space Phys., 122, 5539–5549, https://doi.org/10.1002/2017JA024011, 2017.
Liu, H. L. and Hagan, M. E.: Local heating/cooling of the mesosphere due to gravity wave and tidal coupling, Geophys. Res. Lett., 25, 2941–2944, https://doi.org/10.1029/98GL02153, 1998.
Liu, H. L., Wang, W., Richmond, A. D., and Roble, R. G.: Ionospheric variability due to planetary waves and tides for solar minimum conditions, J. Geophys. Res.-Space Phys., 115, A00G01, https://doi.org/10.1029/2009JA015188, 2010.
Lu, X., Liu, A. Z., Swenson, G. R., Li, T., Leblanc, T., and McDermid, I. S.: Gravity wave propagation and dissipation from the stratosphere to the lower thermosphere, J. Geophys. Res.-Atmos., 114, D11101, https://doi.org/10.1029/2008JD010112, 2009.
Lu, X., Liu, A. Z., Oberheide, J., Wu, Q., Li, T., Li, Z., Swenson, G. R., and Franke, S. J.: Seasonal variability of the diurnal tide in the mesosphere and lower thermosphere over Maui, Hawaii (20.7∘ N, 156.3∘ W), J. Geophys. Res., 116, D17103, https://doi.org/10.1029/2011JD015599, 2011.
Lu, X., Liu, H. L., Liu, A. Z., Yue, J., McInerney, J. M., and Li, Z.: Momentum budget of the migrating diurnal tide in the Whole Atmosphere Community Climate Model at vernal equinox, J. Geophys. Res., 117, D07112, https://doi.org/10.1029/2011JD017089, 2012.
Mayr, H. G. and Mengel, J. G.: Interannual variations of the diurnal tide in the mesosphere generated by the quasi-biennial oscillation, J. Geophys. Res., 110, D10111, https://doi.org/10.1029/2004JD005055, 2005.
McLandress, C.: Interannual variations of the diurnal tide in the mesosphere induced by a zonal- mean wind oscillation in the tropics, Geophys. Res. Lett., 29, 1305, https://doi.org/10.1029/2001GL014551, 2002a.
McLandress, C.: The seasonal variation of the propagating diurnal tide in the mesosphere and lower thermosphere. Part II: The role of tidal heating and zonal mean winds, J. Atmos. Sci., 59, 907–922, https://doi.org/10.1175/1520-0469(2002)059<0907:Tsvotp>2.0.Co;2, 2002b.
McLandress, C., Shepherd, G. G., and Solheim, B. H.: Satellite observations of thermospheric tides: Results from the wind imaging interferometer on UARS, J. Geophys. Res.-Atmos., 101, 4093–4114, https://doi.org/10.1029/95jd03359, 1996.
Mertens, C. J., Mlynczak, M. G., Lopez-Puertas, M., Wintersteiner, P. P., Picard, R. H., Winick, J. R., and Gordley, L. L.: Retrieval of mesospheric and lower thermos pheric kinetic temperature form measurements of CO2 15 µm Earth limb emission under non-LTE conditions, Geophys. Res. Lett., 28, 1391–1394, https://doi.org/10.1029/2000GL012189, 2001.
Mertens, C. J., Schmidlin, F. J., Goldberg, R. A., Remsberg, E. E., Pesnell, W. D., Russell, J. M., Mlynczak, M. G., Lopez-Puertas, M., Wintersteiner, P. P., Picard, R. H., Winick, J. R., and Gordley, L. L.: SABER observations of mesospheric temperatures and comparisons with falling sphere measurements taken during the 2002 summer MaCWAVE campaign, Geophys. Res. Lett., 31, L03105, https://doi.org/10.1029/2003gl018605, 2004.
Pedatella, N. M. and Liu, H. L.: Tidal variability in the mesosphere and lower thermosphere due to the El Niño-Southern Oscillation, Geophys. Res. Lett., 39, L19802, https://doi.org/10.1029/2012gl053383, 2012.
Pedatella, N. M. and Liu, H. L.: Influence of the El Niño Southern Oscillation on the middle and upper atmosphere, J. Geophys. Res.-Atmos., 118, 2744–2755, https://doi.org/10.1002/Jgra.50286, 2013.
Ramesh, K., Smith, A. K., Garcia, R. R., Marsh, D. R., Sridharan, S., and Kishore Kumar, K.: Long-term variability and tendencies in migrating diurnal tide from WACCM6 simulations during 1850–2014, J. Geophys. Res.-Atmos., 125, e2020JD033644, https://doi.org/10.1029/2020JD033644, 2020.
Randel, W. J., Shine, K. P., Austin, J., Barnett, J., Claud, C., and Gillett, N. P.: An update of observed stratospheric temperature trends, J. Geophys. Res.-Atmos., 114, D02107, https://doi.org/10.1029/2008JD010421, 2009.
Rezac, L., Jian, Y., Yue, J., Russell III, M. J., Kutepov, A., Garcia, R., Walker, K., and Bernath, P.: Validation of the global distribution of CO2 volume mixing ratio in the mesosphere and lower thermosphere from SABER, J. Geophys. Res.-Atmos., 120, 12067–12081, https://doi.org/10.1002/2015JD023955, 2015.
Sassi, F., Kinnison, D., Boville, B., Garcia, R., and Roble, R.: Effect of el niño–southern oscillation on the dynamical, thermal, and chemical structure of the middle atmosphere, J. Geophys. Res., 109, D17108, https://doi.org/10.1029/2003jd004434, 2004.
Smith, A. K.: Global Dynamics of the MLT, Surv. Geophys., 33, 1177–1230, https://doi.org/10.1007/s10712-012-9196-9, 2012.
Smith, A. K., Pedatella, N. M., Marsh, D. R., and Matsuo, T.: On the Dynamical Control of the Mesosphere – Lower Thermosphere by the Lower and Middle Atmosphere, J. Atmos. Sci., 74, 933–947, https://doi.org/10.1175/JAS-D-16-0226.1, 2017.
Sridharan, S.: Seasonal variations of low-latitude migrating and nonmigrating diurnal and semidiurnal tides in TIMED-SABER temperature and their relationship with source variations, J. Geophys. Res.-Space Phys., 124, 3558–3572, https://doi.org/10.1029/2018JA026190, 2019.
Sridharan, S.: Equatorial upper mesospheric mean winds and tidal response to strong El Niño and La Niña, J. Atmos. Sol.-Terr. Phy., 202, 105270, https://doi.org/10.1016/j.jastp.2020.105270, 2020.
Sridharan, S., Tsuda, T., and Gurubaran, S.: Long-term tendencies in the mesosphere/lower thermosphere mean winds and tides as observed by medium-frequency radar at Tirunelveli (8.7∘ N, 77.8∘ E), J. Geophys. Res.-Atmos., 115, D08109, https://doi.org/10.1029/2008JD011609, 2010.
Vincent, R. A., Kovalam, S., Fritts, D. C., and Isler, J. R.: Long-term MF radar observations of solar tides in the low-latitude mesosphere: Interannual variability and comparisons with GSWM, J. Geophys. Res., 103, 8667–8683, https://doi.org/10.1029/98JD00482, 1998.
Vitharana, A., Du, J., Zhu, X., Oberheide, J., and Ward, W. E.: Numerical prediction of the migrating diurnal tide total variability in the mesosphere and lower thermosphere, J. Geophys. Res.-Space Phys., 126, e2021JA029588, https://doi.org/10.1029/2021JA029588, 2021.
Volland, H.: Atmospheric Tidal and Planetary Waves[M], Springer Netherlands, https://doi.org/10.1007/978-94-009-2861-9, 1988.
Wallace, J. M., Panetta. R. L., and Estberg J.: Representation of the equatorial quasi-biennial oscillation in EOF phase space, J. Atmos. Sci., 50, 1751–1762, https://doi.org/10.1175/1520-0469(1993)050<1751:ROTESQ>2.0.CO;2, 1993.
Walterscheid, R. L.: Inertia-gravity wave induced accelerations of mean flow having an imposed periodic component: Implications for tidal observations in the meteor region, J. Geophys. Res.-Atmos., 86, 9698–9706, https://doi.org/10.1029/JC086iC10p09698, 1981a.
Walterscheid, R. L.: Dynamical cooling induced by dissipating internal gravity waves, Geophys. Res. Lett., 8, 1235–1238, https://doi.org/10.1029/GL008i012p01235, 1981b.
Xu, J., Smith, A. K., Liu, H.-L., Yuan, W., Wu, Q., Jiang, G., Mlynczak, G. M., Russell III, J. M., and Franke, S. J.: Seasonal and quasi-biennial variations in the migrating diurnal tide observed by Thermosphere, Ionosphere, Mesosphere, Energetics and Dynamics (TIMED), J. Geophys. Res., 114, D13107, https://doi.org/10.1029/2008JD011298, 2009.
Xu, J. Y., Liu, H. L., Yuan, W., Smith, A. K., Roble, R. G., Mertens, C. J., Russell, J. M., and Mlynczak, M. G.: Mesopause structure from thermosphere, ionosphere, mesosphere, energetics, and dynamics (TIMED)/sounding of the atmosphere using broadband emission radiometry (SABER) observations, J. Geophys. Res.-Atmos. 112, D09102, https://doi.org/10.1029/2006jd007711, 2007a.
Xu, J. Y., Smith, A. K., Yuan, W., Liu, H. L., Wu, Q., Mlynczak, M. G., and Russell, J. M.: Global structure and long-term variations of zonal mean temperature observed by TIMED/SABER, J. Geophys. Res.-Atmos., 112, D24106, https://doi.org/10.1029/2007jd008546, 2007b.
Yang, C., Smith, A. K., Li, T., and Dou, X.: The effect of the Madden-Julian oscillation on the mesospheric migrating diurnal tide: A study using SD-WACCM, Geophys. Res. Lett., 45, 5105–5114, https://doi.org/10.1029/2018GL077956, 2018.
Yulaeva, E. and Wallace, J. M.: The signature of ENSO in global temperature and precipitation fields derived from the microwave sounding unit, J. Climate, 7, 1719–1736, https://doi.org/10.1175/1520-0442(1994)007<1719:TSOEIG>2.0.CO;2, 1994.
Zhang, X., Forbes, J. M., and Hagan, M. E.: Longitudinal variation of tides in the MLT region: 1. Tides driven by tropospheric net radiative heating, J. Geophys. Res.-Space Phys., 115, A06316, https://doi.org/10.1029/2009JA014897, 2010.
Zhou, X., Wan, W., Yu, Y., Ning, B., Hu, L., and Yue, X.: New approach to estimate tidal climatology from ground-and space-based observations, J. Geophys. Res.-Space Phys., 123, 5087–5101, https://doi.org/10.1029/2017JA024967, 2018.