the Creative Commons Attribution 4.0 License.
the Creative Commons Attribution 4.0 License.
 | 17 Jun 2022
Reduced surface fine dust under droughts over the southeastern United States during summertime: observations and CMIP6 model simulations
Drought is an extreme hydroclimate event that has been shown to cause an increase in surface fine dust near source regions, yet the drought–dust relationship in regions predominantly influenced by long-range-transported dust such as the southeastern USA (SEUS) has received less attention. Using long-term surface fine-dust observations, the weekly US Drought Monitor (USDM), and the monthly standardized precipitation–evapotranspiration index (SPEI), this study unmasks spatial disparity in drought–dust relationships in the contiguous USA (CONUS) where the SEUS shows a decrease in surface dust concentrations during drought in contrast to the expected increase in dust found in other CONUS regions. Surface fine dust was found to decrease by ∼ 0.23 µg m−3 with a unit decrease in SPEI in the SEUS, as opposed to an increase of ∼ 0.12 µg m−3 in the west. The anomalies of dust elemental ratios, satellite aerosol optical depth (AOD), and dust extinction coefficients suggest that both the emissions and trans-Atlantic transport of African dust are weakened when the SEUS is under droughts. Through the teleconnection patterns of the negative North Atlantic Oscillation (NAO), a lower-than-normal and more northeastward displacement of the Bermuda High (BH) is present during SEUS droughts, which results in less dust being transported into the SEUS. At the same time, enhanced precipitation in the Sahel associated with the northward shift of the Intertropical Convergence Zone (ITCZ) leads to lower dust emissions therein. Of the 10 selected models participating in the sixth phase of the Coupled Model Intercomparison Project (CMIP6), GISS-E2-1-G was found to perform the best in capturing the drought–dust sensitivity in the SEUS. This study reveals the mechanism of how droughts influence aerosol abundance through changing long-range transport of dust.
- Article
(16244 KB) - Full-text XML
-
Supplement
(1928 KB) - BibTeX
- EndNote


Mineral dust plays an important role in the climate system by modifying the Earth's energy budget through direct aerosol–radiation forcing and indirect aerosol–cloud interactions (Tegen et al., 1996; Sassen, 2002; Carslaw et al., 2010). Fine-mode mineral dust with an aerodynamic diameter of less than 2.5 µm can be transported over long distances and has wide-ranging socioeconomic effects such as degeneration of air quality, disruption of public transport by poor visibility, and reduction in soil productivity (Middleton, 2017). Dust events can also be linked with a higher risk of valley fever and other respiratory and cardiovascular diseases (Karanasiou et al., 2012; Tong et al., 2017) and higher non-accidental mortality (Crooks et al., 2016). Lifted by strong winds from arid and bare land, dust particles in the atmosphere are significantly modulated by hydroclimate variables, such as precipitation, temperature, relative humidity, and soil moisture (Achakulwisut et al., 2017; Brey et al., 2020; Pu and Ginoux, 2018). Thus, drought, as a recurring hydroclimate extreme, can impose large changes on the abundance of dust particles in the atmosphere. As the contiguous United States (CONUS) is prone to droughts and projected to be warmer and drier in the future (Cook et al., 2015), it is essential to quantify the drought–dust relations and evaluate the ability of climate models to capture such relations to better understand the climate–dust feedbacks.
Most of the previous studies of drought–dust sensitivity in the USA have focused on the southwest (Aarons et al., 2019; Achakulwisut et al., 2018, 2019; Arcusa et al., 2020; Borlina and Rennó, 2017; Kim et al., 2021) where the major dust emission sources are located (e.g., the Chihuahuan, Mojave, and Sonoran deserts). For example, Achakulwisut et al. (2018) quantified an increase in fine dust by 0.22–0.43 µg m−3 with a unit decrease in the 2-month standardized precipitation–evapotranspiration index (SPEI) over the southwestern USA across the seasons. Both observations (Aarons et al., 2019) and simulations (Kim et al., 2021) have shown that dust enhancement under droughts can be attributed to the simultaneous increase in local dust emissions and long-range transport of dust from Asia. The observed drought–dust relationship can be used as a process-level metric to evaluate dust simulation in coupled chemistry–climate models and Earth system models. For example, a recent evaluation of dust emissions in 19 models participating in the sixth phase of the Coupled Model Intercomparison Project (CMIP6) found that interannual variations in dust emissions simulated by these models are strongly correlated with drought over major dust source regions (Aryal and Evans, 2021).
While the abovementioned studies have improved our understanding of dust–drought relationships in dust source areas, regions predominantly influenced by long-range-transported dust such as the southeastern USA (SEUS) have received less attention. The dusty Saharan air from western Africa can reach the SEUS during boreal summer through long-range transport across the tropical Atlantic Ocean and Caribbean Basin (e.g., Perry et al., 1997; Prospero et al., 2010). Fine dust is estimated to contribute to 20 %–30 % of the total particulate matter smaller than 2.5 µm (PM2.5) in aerodynamic diameter at the surface in the southeast during summertime (Hand et al., 2017). Extreme “Godzilla” dust events have occurred in recent years, leading to considerably worse air quality in the southeast region (Yu et al., 2021). In our previous study, Wang et al. (2017), we estimated that growing-season (March–October) droughts during 1990–2014 caused an average fine-dust increase of 27 % in the west and 16 % in the Great Plains, with a much lower effect on fine dust in the southeastern and northeastern USA. That study used a coarse timescale (i.e., averaging of the 8-month growing season) which may not fully capture the episodic nature of dust emissions or dust transport.
Here we improve upon previous studies by using drought and dust datasets of better spatial coverage and finer temporal scales (Sect. 2). In Sect. 3.1, we first examine how the spatial distributions of surface fine-dust change with weekly and monthly drought indices over the CONUS. The finer-scale analysis unmasks spatial disparity in drought–dust relationships where the SEUS stands out from the rest of the CONUS in that it shows a decrease in surface dust concentrations during drought in contrast to the expected increase in dust found in other regions. We then focus on the southeast, an area largely overlooked by prior studies of dust response to drought, and investigate in Sect. 3.2 how drought conditions in the SEUS affect the trans-Atlantic transport of African dust.
Among the surface dust measurement datasets examined in this study, the Barbados site located in the eastmost part of the Caribbean Windward Islands is the only long-term site on the main outflow pathway of African dust to the SEUS and is suitable to evaluate dust–drought relationships simulated by coupled climate–chemistry models. The surface dust mass concentration has been continuously measured at the Barbados site since August 1965. This rare and unique dataset has been widely used to improve our understanding of the variations in African dust transport and model evaluations (Chiapello et al., 2005; Prospero and Nees, 1986; Zuidema et al., 2019). Given the correct sensitivity of dust emissions to drought in CMIP6 models (Aryal and Evans, 2021), in Sect. 3.3 we use the dust–drought relationship at the Barbados site to evaluate the performance of 10 CMIP6 models in capturing the drought–dust sensitivity in the SEUS.
The datasets and related variables used in this study are summarized in Tables S1–S2 with details given below.
2.1 Drought indicator
The US Drought Monitor (USDM) index was selected as the primary drought indicator because it incorporates not only objective indicators but also inputs from regional and local experts around the country (Svoboda et al., 2002). USDM maps have been released every week from 2000 to the present on its website (https://droughtmonitor.unl.edu/, last access: 13 June 2022). There are five dryness categories on the map, labeled Abnormally Dry (D0), Moderate Drought (D1), Severe Drought (D2), Extreme Drought (D3), and Exceptional Drought (D4). We converted these maps into 0.5∘ × 0.5∘ gridded data and combined D2–D4 levels as “severe drought” due to limited data availability caused by their low spatial coverage if treated individually (Li et al., 2022). Non-drought (wet and normal) conditions, denoted as N0, are defined when a grid is not under any of the five dryness categories. There are 262 weeks in total during our study period from 2000 to 2019 summers (June, July, August; JJA). To compensate for the categorical nature of the USDM data, 1-month gridded SPEI data from the global SPEI database (http://sac.csic.es/spei/, last access: 13 June 2022) with a spatial resolution of 0.5∘ × 0.5∘ and a temporal range of 1973–2018 were also used to conduct statistical analysis (e.g., correlation and regression). The criteria of SPEI <−1.3 and SPEI >−0.5 were applied to denote severe-drought and non-drought conditions, respectively, as suggested by Wang et al. (2017).
2.2 Surface dust and satellite products
To expand the spatial coverage, we created a gridded daily fine-dust dataset (0.5∘ × 0.5∘) that aggregates site-based observations from the Interagency Monitoring of Protected Visual Environments (IMPROVE) network using the modified inverse distance weighting method as done by Schnell et al. (2014). Fine-dust data from the IMPROVE sites have been widely used by previous studies to investigate surface fine-dust variations (Achakulwisut et al., 2017; Hand et al., 2017; Kim et al., 2021). The US Environmental Protection Agency Chemical Speciation Network (EPA CSN) also provides long-term dust data, but the CSN sites are located primarily in suburban and urban areas, hence including extreme values from urban environments which may confound the drought signals. In addition, CSN uses different sampling practices and analytical methods from IMPROVE, which can lead to systematic differences in dust measurements (Hand et al., 2012; Gorham et al., 2021). Thus, we only used the IMPROVE dataset in this study. To reduce the artifact caused by different data completeness (e.g., old sites retired and new sites started), we selected the sites with data records longer than 5 years during the study period for interpolation (Fig. S1). We used the latest version of total surface dust data at the Barbados site (Fig. 5a) created and published by Zuidema et al. (2019). The Barbados JJA monthly data were averaged from at least 20 daily samples in each month between 1973 and 2014.
We combined Level-3 daily aerosol optical depth (AOD; 550 nm) retrieved from the Moderate Resolution Imaging Spectroradiometer (MODIS) aboard Aqua (MYD07_D3 v6.1) and Terra (MOD08_D3 v6.1) with a resolution of 1∘ × 1∘ from 2003 to 2019 (Payra et al., 2021; Pu and Jin, 2021) to examine the westward transport of African dust. Level-3 monthly cloud-free dust extinction coefficients at 532 nm between 2006 and 2019 from the Cloud-Aerosol Lidar and Infrared Pathfinder Satellite Observation (CALIPSO) satellite were also used to analyze the vertical profiles of trans-Atlantic dust plumes. The CALIPSO data were obtained from https://asdc.larc.nasa.gov/project/CALIPSO (last access: 14 June 2022) with a 2∘ × 5∘ horizontal grid and a vertical resolution of 60 m up to 12 km from the ground.
2.3 Meteorological data
To analyze the emission and transport of African dust, several meteorological variables were applied. Daily precipitation was taken from the Global Precipitation Climatology Project version 1.3 (GPCP v1.3). The data comprise a satellite-based global product from 1996 to the present with a 1∘ × 1∘ spatial resolution. Other variables, including zonal (U) and meridional (V) winds and geopotential height at different pressure levels, were from the European Centre for Medium Range Weather Forecasts (ECMWF) reanalysis version-5 (ERA5) dataset. Weekly data were averaged from hourly data with a resolution of 0.25∘ × 0.25∘. Monthly North Atlantic Oscillation (NAO) data were obtained from the Climate Research Unit (CRU) calculated as the difference in normalized sea-level pressure between the Azores and Iceland (Jones et al., 1997).
2.4 CMIP6 AerChemMIP models
The following 10 models from the CMIP6 Aerosol Chemistry Model Intercomparison Project (AerChemMIP) were selected: BCC-ESM1, CESM2-WACCM, CNRM-ESM2-1, EC-Earth3-AerChem, GFDL-ESM4, GISS-E2-1-G, MIROC6, MRI-ESM2-0, NorESM2-LM, and UKESM1-0-LL. They are the only models that were found by the time of writing with dust mass ratio outputs from historical simulations with prescribed sea surface temperature in the AerChemMIP project. NorESM2-LM is the only model containing ensembles (two members), and the ensemble mean was used here. All the model outputs cover the period from 1850 to 2014. Dust emissions are interactively calculated based on factors such as surface wind speed, soil type, and aridity. Dust particles are resolved to different size bins ranging from 0.01 to 63 µm in diameter. More information and references (Dunne et al., 2020; Kelley et al., 2020; Séférian et al., 2019; Yukimoto et al., 2019; Wu et al., 2020; Danabasoglu et al., 2020; van Noije et al., 2021; Tatebe et al., 2019; Seland et al., 2020; Senior et al., 2020) for each model are listed in Table S2.
3.1 Reduced dust in the southeast under droughts
Figure 1a shows the mean summertime (JJA 2000–2019) surface fine-dust concentrations under non-drought conditions (N0) and their changes under severe droughts (D2–D4) relative to non-drought. Higher concentrations (∼ 2 µg m−3) can be found in the southwest and southeast regions under non-drought conditions, reflecting the average spatial distributions of summertime dust. Under severe droughts, most of the grids/sites display an enhanced dust level, with the highest enhancement (∼ 1.5 µg m−3) occurring near the source regions in the southwest (e.g., Arizona and New Mexico). This indicates higher local dust emissions under droughts, which can be attributable to regional precipitation, bareness, wind speed, and soil moisture anomalies (Achakulwisut et al., 2017; Kim et al., 2021; Pu and Ginoux, 2018). By contrast, reduced fine dust is shown in the southeastern grids/sites under severe drought, especially for the ones near the coast. Density plots in Fig. 1b illustrate that the overall gridded dust distributions under severe droughts across the CONUS move towards the high end compared with non-drought conditions, with an increase in the mode and mean value by ∼ 0.14 µg m−3 (26 %) and ∼ 0.21 µg m−3 (27 %), respectively. Conversely, dust distributions over the southeast (25–33∘ N, 100–75∘ W; black box in Fig. 1a) move to the low end with a respective decrease in the mode and mean value by ∼ 0.26 µg m−3 (18 %) and ∼ 0.16 µg m−3 (11 %). Here the southeast region is delimitated to cover most of the grids/sites with negative changes in dust during drought. Expanding the region's boundary northwards will dampen the reduced dust signal or even change it to an increase (Fig. S2) due to the weakened impact of African dust on the northern USA (Aldhaif et al., 2020). To test whether the spatial interpolation process could potentially cause biases due to the low site numbers over the southeast region, Fig. 1b also plots the density distribution using on-site IMPROVE data. Similar distributions can be seen between the gridded and on-site data, except that the latter show a “fatter” (more variable) distribution. This indicates that the interpolation did not significantly affect the results. We also reproduced the above analysis using SPEI-based monthly drought criteria, and similar results were found (Fig. S3), except for a smaller magnitude of dust reduction in the SEUS. This indicates the weekly data can better capture the reduced dust signal than monthly data because of the episodical nature of the African dust transport, which typically takes about 10 d to reach the SEUS (Chen et al., 2018; Pu and Jin, 2021).
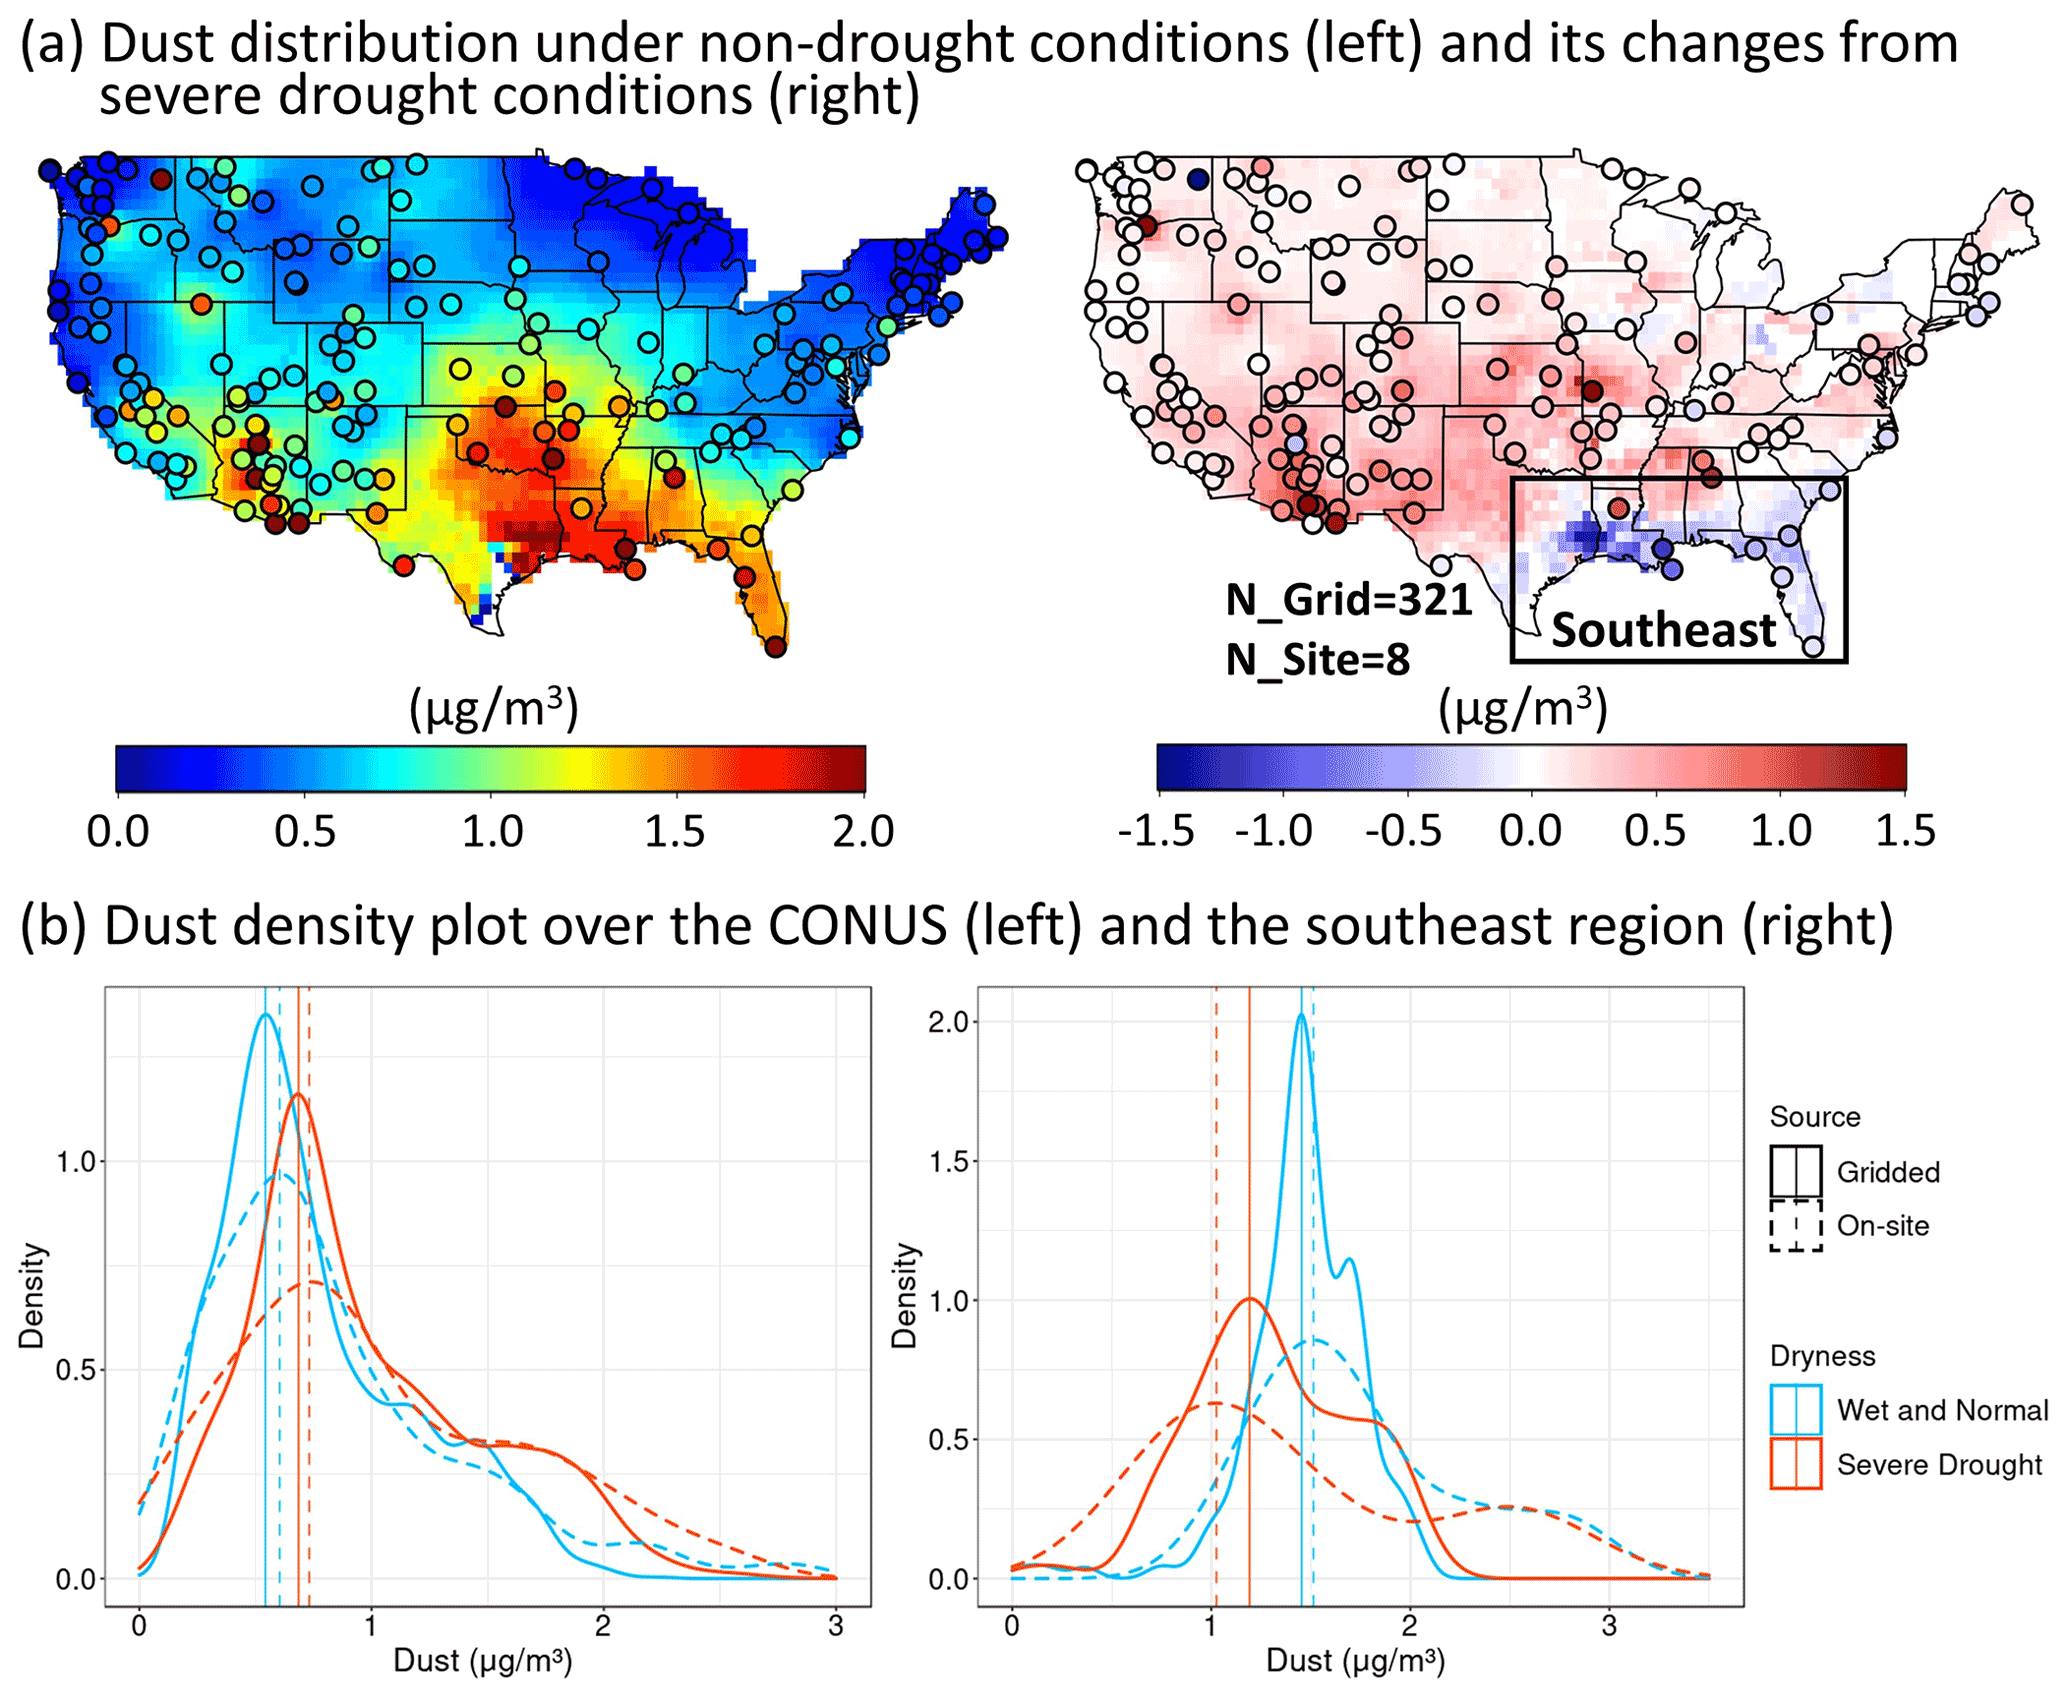
Figure 1(a) Maps of the mean gridded and in situ (dots) fine dust under USDM-based non-drought (wet and normal) conditions (left) from 2000 to 2019 in JJA and its changes from severe-drought conditions (right). The number of grids and sites within the southeast region is denoted by N_Grid and N_Site, respectively. (b) Comparisons of density distributions of gridded (solid lines) and in situ (dashed lines) fine-dust concentrations during 2000–2019 JJA under drought (red lines) and non-drought (blue lines) conditions over the CONUS (left) and southeast region (right). Vertical dashed and solid lines indicate the modes.
To further quantify the drought–dust relationship, we conducted a linear regression between SPEI and dust concentrations, taking advantage of the non-categorical nature of SPEI. The slopes of the regression at each grid are shown in Fig. 2a. Almost all the grids in the western CONUS have significant negative slopes at a 95 % confidence level. As negative SPEI values indicate drought, these negative slopes reveal an increasing level of dust with drier conditions. The highest value of about 0.6 µg m−3 per unit decrease in SPEI occurs in Arizona, which is also indicative of higher dust emissions under drought and consistent with the composite analysis in Fig. 1. However, not all the grids in the southeast exhibit significant positive slopes as expected from Fig. 1. This may imply a nonlinear relationship that cannot be identified via composite analysis. To better explain this, we compared the changes in regional-mean dust concentrations with SPEI bins between the southeast (as defined in Fig. 1) and west (100∘ W westwards) in Fig. 2b. We first calculated the average dust concentration by grid for each SPEI bin and then averaged the grid-mean dust per SPEI bin to obtain the regional-mean dust concentration. The SPEI bins were selected so that the number of grids at each SPEI bin is greater than 160 (∼ 50 % out of 321 grids) over the SEUS to ensure good regional coverage. As shown in Fig. 2b, the regional-mean approach reveals a clear nonlinear pattern for the southeast with dust decreasing as the absolute value of SPEI increases in both wet (SPEI > 0.5) and dry (SPEI > 0) portions. By contrast, the west exhibits a linear relationship throughout the SPEI range. While both regions are consistent under non-drought conditions (SPEI > 0) where dust concentrations decrease with increasing wetness due to increased washout, they diverge under drought conditions (SPEI < 0). In the western USA, dust concentrations follow the expected pattern of being higher with increasing dryness because of the dominance of local dust emissions, which are linearly related to aridity (Duniway et al., 2019). To capture the nonlinear relationship in the SEUS, we conducted the linear regression using only the six lowest SPEI bins under dry conditions (SPEI < 0.5). The resulting regression slope is 0.23 µg m−3 per unit of SPEI for the southeast and −0.12 µg m−3 per unit of SPEI for the west, respectively. In light of the regional-mean analysis, we recalculate the slopes at each grid under drought conditions only (SPEI < 0) in Fig. 2c. Compared to Fig. 2a, more grids in the SEUS show a positive slope between surface dust and SPEI while the negative slope still dominates in the rest of the CONUS. Most grids with statistically significant positive slopes are found near the coast (e.g., southern Texas and Louisiana). As SPEI is more negative with increasing dryness, the positive slope in the southeast means a decrease in dust with increasing dryness, which is consistent with the result from Fig. 1 based on USDM. Hereafter we focus on the southeast region and investigate why surface fine dust in this region shows an opposite response to droughts compared with other CONUS regions.
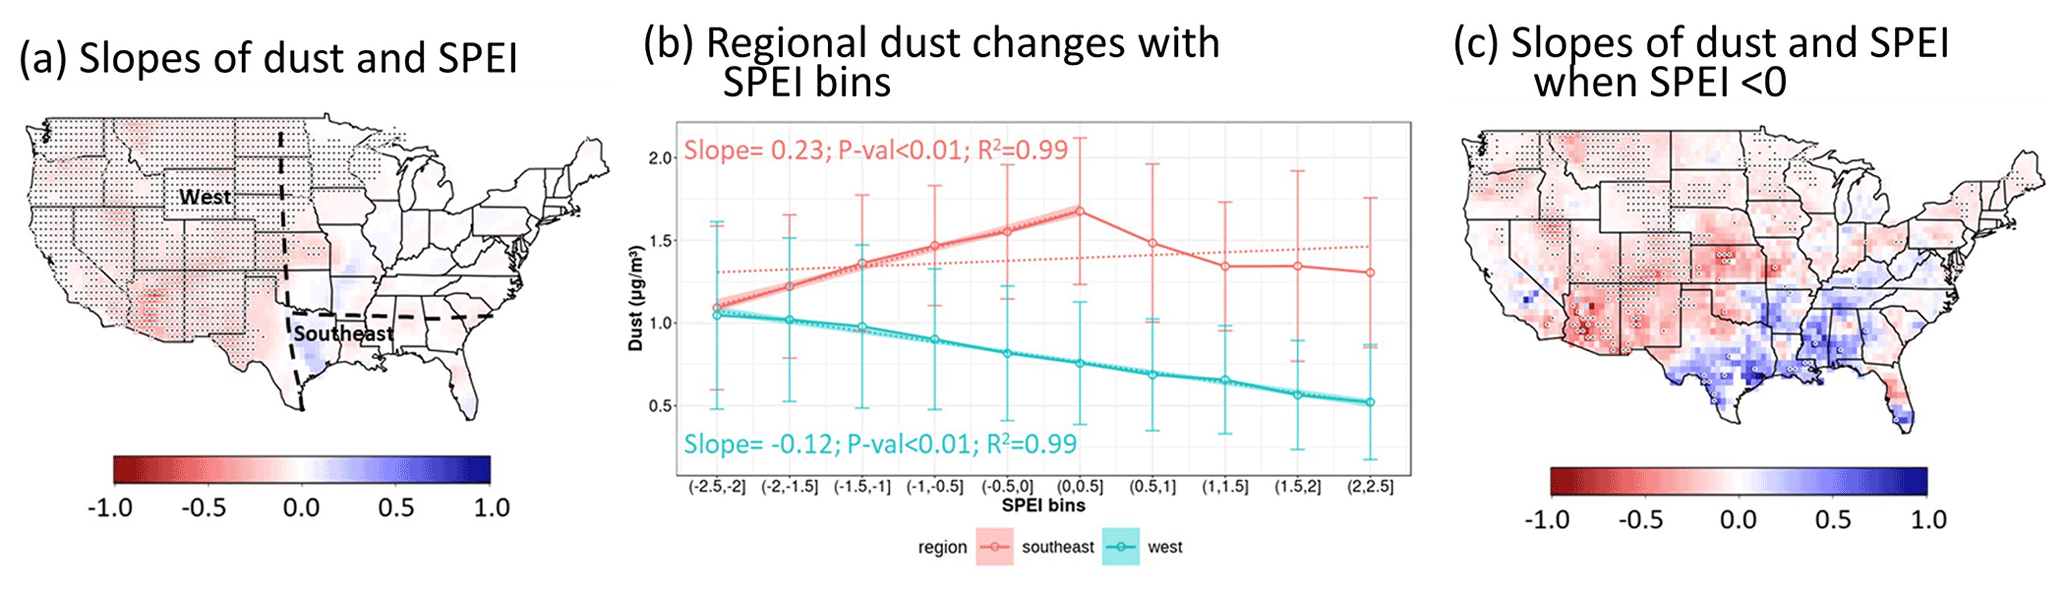
Figure 2(a) Maps of the linear regression slopes between fine-dust concentrations and SPEI during 2000–2018 in JJA. Black dots denote the grids with regression significance at a 95 % confidence level. Dashed lines mark the boundaries of the west and southeast regions. (b) Regional average dust changes with SPEI bins over the west and southeast with error bars indicating 1 standard deviation. Dashed lines display linear regression results with shading showing the 95 % confidence level. The numbers indicate the slopes, P values (P-val), and determination coefficient (R2) of the regression using all the SPEI bins in the west and only the first six bins in the southeast. (c) The same as (a) but using data under drought conditions (SPEI < 0) only.
Dust elemental ratios contain important information signifying the dust particle origins (e.g., local or transport). African dust, relative to Asian and local dust, normally has higher Fe:Ca (>1.50) and Al:Ca (>2.60) ratios and lower K:Fe (<1.10) and Si:Al (<2.90) ratios (Aldhaif et al., 2020; Gonzalez et al., 2021; VanCuren and Cahill, 2002). Based on these reported thresholds, we analyzed dust elemental observations at eight sites within the southeast region (Fig. 1a) and compared how the elemental ratios changed under severe drought based on the USDM drought indicator. The results are displayed in Fig. 3, with more statistical descriptions listed in Table S3. Under non-drought conditions (wet and normal), the ratios are generally within the typical ranges mentioned above, indicating the dominance of African dust over Asian dust and locally emitted dust as reported by other studies (Aldhaif et al., 2020; VanCuren and Cahill, 2002). Under severe drought, Fe:Ca and Al:Ca become lower and K:Fe and Si:Al become higher. All these changes are in the direction of reducing the characteristic elemental ratios of African dust. Most of the Fe:Ca, Al:Ca, and K:Fe ratios under severe drought have their medians falling below the reported thresholds of African dust. This indicates a significantly reduced dust source from Africa. As dust deposition is unlikely to increase under drought conditions, the lower signature of African dust in surface dust under severe drought is most likely attributable to the reduced import of African dust to the SEUS, which is discussed below.
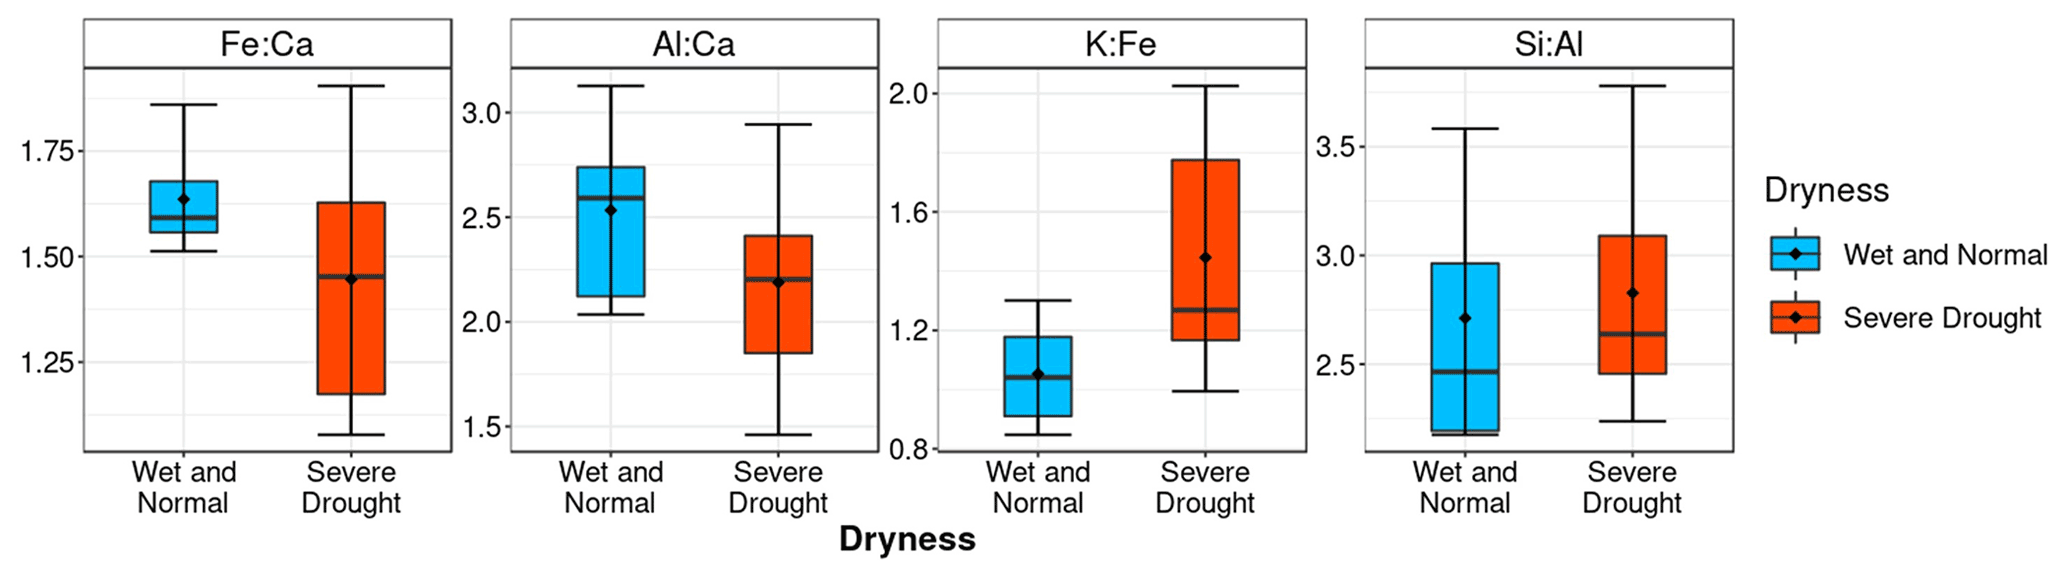
Figure 3Boxplots of four dust elemental ratios under non-drought (wet and normal) and severe-drought conditions. Observations are from eight IMPROVE sites in the southeast region shown in Fig. 1a. The upper and lower whiskers of the boxplots represent the 9th and 1st quantile, respectively. Black dots indicate the mean values. Detailed values of this figure can be found in Table S3.
3.2 Weakened trans-Atlantic dust transport under droughts
In this section, we examine how the trans-Atlantic transport of African dust changes with droughts in the southeast. To do so, we first selected regional-scale drought events to better depict the aridness across the southeast and then associated these events with the long-range transport of African dust and compared them with regional-scale non-drought events. On a weekly scale (USDM-based), we first examined the percentage of grids covered by D2–D4 droughts over the SEUS in an increasing order (Fig. S4a). There appears to be a “turning point” at around 30 %, after which the percentage increases much faster, suggesting a regional expansion of severe drought. Therefore, we selected regional severe-drought events based on the threshold of more than 30 % of the southeastern grids under D2–D4 droughts. Figure S4a also shows that the percentages of grids under N0 or D0–D1 fall between 30 % and 60 % in most of the weeks and they can be quite close (e.g., 50 % under N0 and 47 % under D0–D1) in some weeks. To exclude such weeks from non-drought conditions and reduce the impact of mild drought (D0–D1), we set the threshold of regional non-drought events as more than 70 % of the southeastern grids under N0. To select regional severe-drought events on a monthly scale (SPEI-based), we used the threshold of the lowest 20 % quantile of regional-mean SPEI since the criterion of 30 % of the grids under D2–D4 is nearly at the top 20 % quantile of all the weeks. Months with regional-mean SPEI greater than the top 20 % quantile are considered non-drought events. We tested other thresholds for selecting severe droughts and non-droughts events and found consistent results in the difference in dust under severe drought relative to non-drought events (Fig. S4b–c), which indicates our conclusions are not sensitive to the selection of these thresholds. The time series in Fig. 4 show that the regional severe-drought events mainly occurred in 2000, 2006, 2007, and 2011 in JJA.
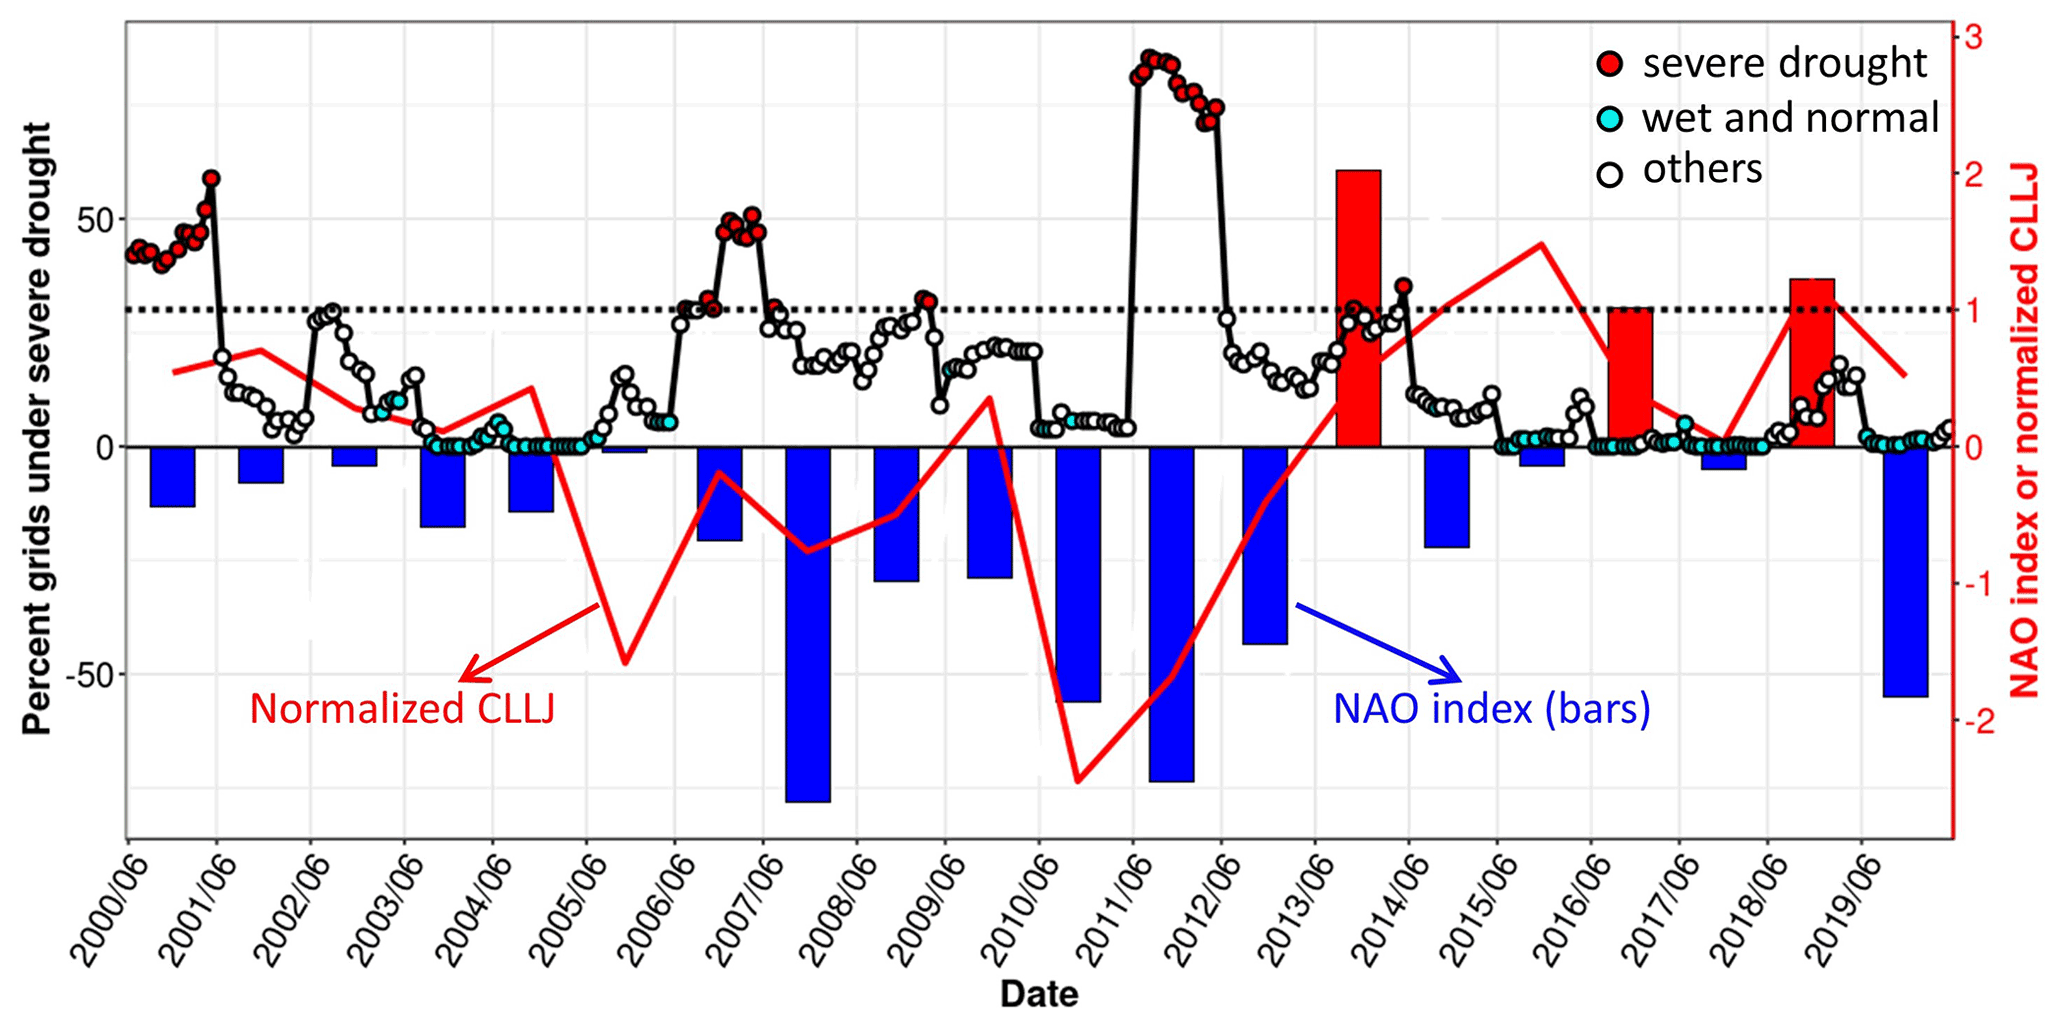
Figure 4Time series of weekly regional dryness levels indicated by the percentage of grids under severe drought (D2–D4) in the southeast area (filled dots; left axis), the JJA-mean North Atlantic Oscillation (NAO) index (bars; right axis), and the normalized Caribbean low-level jet (CLLJ; red line; right axis). The dashed black line indicates the position of 30 %.
Based on the selected regional-drought and non-drought periods in the SEUS, we compiled the composite AOD from MODIS for drought and non-drought conditions. Figure 5a displays the maps of non-drought mean AOD and the changes in AOD during severe droughts. Horizontally, the major transport pathway of the dusty African air is within 10–20∘ N and 100–0∘ W (red box), as indicated by the higher AOD values there than in its surroundings. The dust flow, emitted from northern Africa (e.g., the Sahara and Sahel), travels through the tropical Atlantic, the Caribbean Sea, and the Gulf of Mexico before reaching the SEUS. Under droughts, almost all the AOD values along that pathway show negative differences, which indicates both the transport and the emissions of African dust (mainly from the Sahel) are depressed when the SEUS is under droughts. In addition, the difference map presents an enhanced dust band to the north of the major transport pathway (20–30∘ N), which is indicative of the northward shift of the pathway. To further explore this, we compare in Fig. 5b three meridional cross sections of AOD between 0 and 30∘ N averaged over different longitudinal portions of the transport pathway: near the source region (section 1; 20–30∘ W), in the middle of the pathway (section 2; 50–60∘ W), and over the Gulf of Mexico (section 3; 85–95∘ W). Sections 1 and 2 show that the peak AOD values are lower under severe droughts with their corresponding latitudes moving 2 and 1∘ northwards, respectively. However, almost all the AOD values in section 3 are lower under severe drought than non-drought conditions with no such northward movement observed. This indicates the enhanced dust band between 20–30∘ N does not enter the Gulf of Mexico and reach the SEUS, hence not offsetting the reduced dust in the SEUS under severe drought.
To better demonstrate the dust changes along the major transport pathway, we also examined the vertical profiles of the dust extinction coefficient from CALIPSO along the pathway (Fig. 5c). Since the CALIPSO data are monthly, we used the SPEI-based drought events defined above. The dust particles can be injected at up to ∼ 4 km altitude from the source region through strong desert surface heating (Alamirew et al., 2018; Flamant et al., 2007), low-level wind convergence (Bou Karam et al., 2008), synoptic-scale disturbance (Knippertz and Todd, 2010), and other processes (Francis et al., 2020) and then descend to lower levels as they travel westwards. Such vertical structures have been discerned by previous studies (Prospero and Mayol-Bracero, 2013; Ridley et al., 2012). Similarly to Fig. 5a, a decreased dust extinction coefficient is found along the vertical transport pathway, which verifies the conclusion that both the transport and the emissions of African dust are weakened when the SEUS is under droughts.

Figure 5(a) Maps of AOD (550 nm) under non-drought (wet and normal) conditions (left column) and its changes during severe droughts (right column). The severe-drought and non-drought periods were chosen based on the weekly time series shown in Fig. 4. The white star denotes the location of the Barbados site (13∘6′ N, 59∘37′ W). Black and red rectangles denote the locations of the cross sections in (b) and (c), respectively. (b) Meridional cross sections between 0–30∘ N averaged near the source region (section 1; 20–30∘ W), in the middle of the transport pathway (section 2; 50–60∘ W), and over the Gulf of Mexico (section 3; 85–95∘ W) under non-drought (blue) and severe-drought (red) conditions. The dashed lines and associated numbers indicate the latitudes with the maximum values of AOD. These three sections correspond to the black rectangles labeled in the right panel of 5a to show their locations. (c) Mean vertical profiles of the dust extinction coefficient during non-drought (left) and severe-drought (right) periods across the major transport pathway (red rectangle in a). The severe-drought and non-drought periods were chosen based on monthly SPEI between 2006 and 2018. Black or orange dots in (a) and (c) (right column) indicate the significant difference at a 95 % confidence level relative to non-drought conditions.
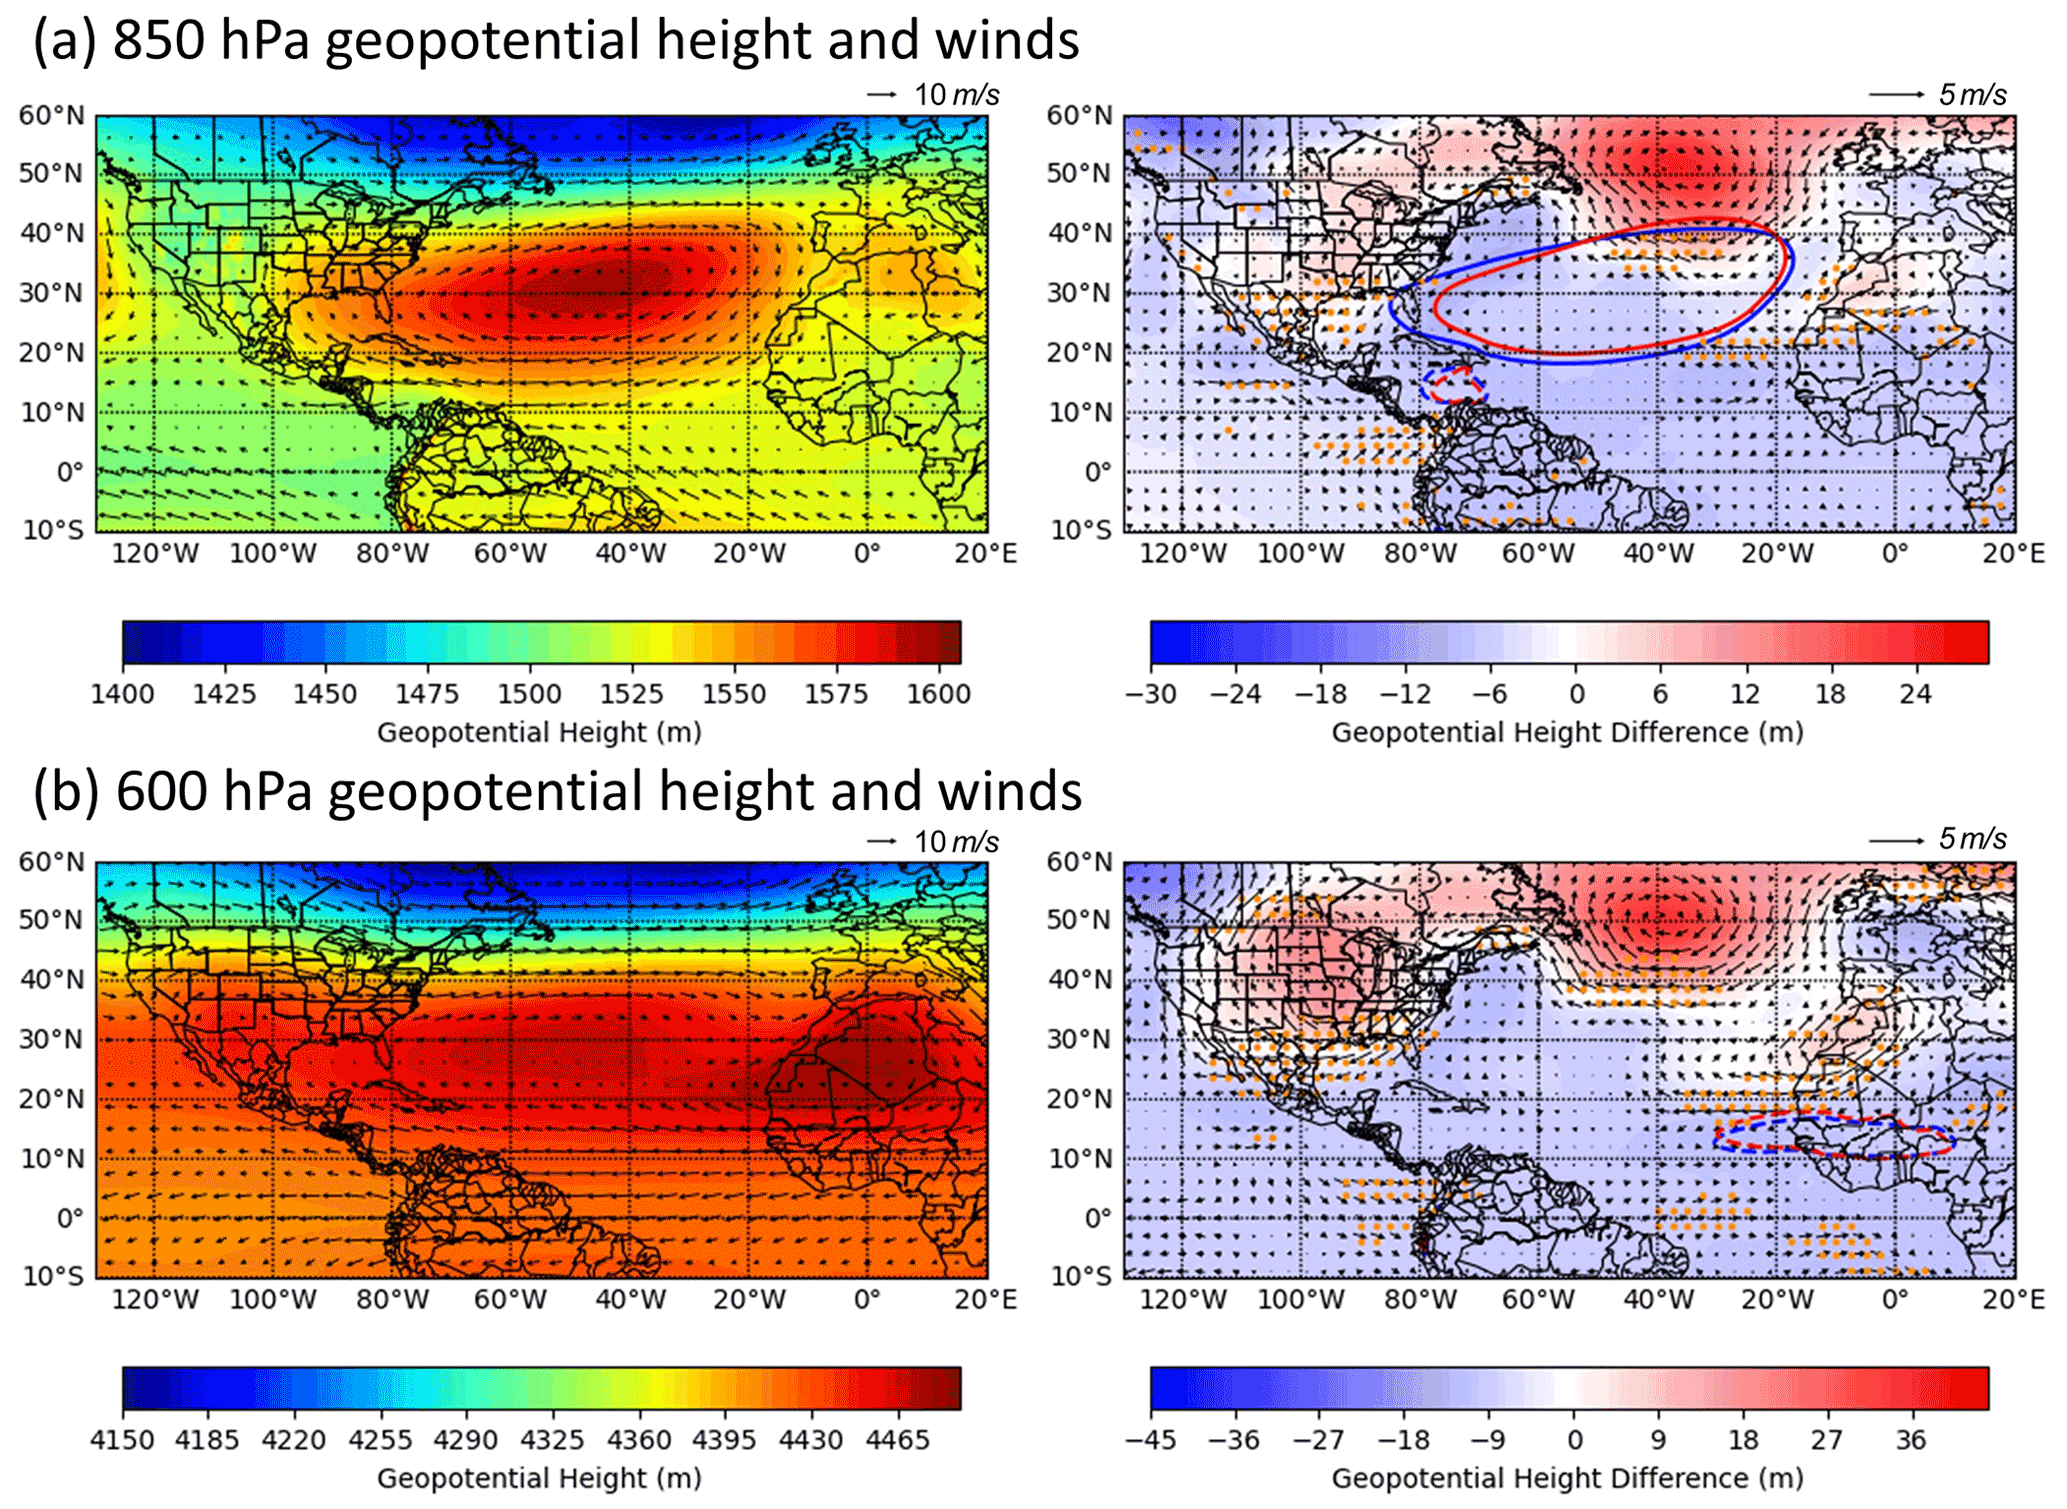
Figure 6Maps of geopotential height (shading) and wind vectors (arrows) at 850 hPa (a) and 600 hPa (b) under the USDM-based SEUS regional non-drought (wet and normal) conditions (left column) and their changes during severe-drought periods (right column) from 2000 to 2019 in JJA. Solid lines in (a) indicate the edge of the Bermuda High under non-drought (blue) and severe droughts (red). Dashed lines show the edge of Caribbean low-level jet (a) and African easterly jet (b) under non-drought (blue) and severe droughts (red). Orange dots (right column) indicate the grids with significant differences in zonal winds at a 95 % confidence level.
The teleconnections between the SEUS droughts and the transport and emissions of African dust are displayed in Fig. 6. At low levels near the central North Atlantic, a semipermanent high-pressure system called the North Atlantic Subtropical High (NASH) or Bermuda High (BH) favors the dust transport with its southwestward extensions towards the Caribbean and the Gulf of Mexico, steering dust into the CONUS (Doherty et al., 2008; Kelly and Mapes, 2011). This can be clearly seen from the anticyclonic wind circulations in Fig. 6a. Using the 1560 m contour (solid lines in Fig. 6a) as the edge of the BH following Li et al. (2011), a retreat of the BH towards the northeast can be recognized under droughts, causing northerly wind anomalies over the Caribbean and the Gulf of Mexico. As the normal winds are southerly, the northerly wind anomalies result in a weakened dust transport into the SEUS. Such wind anomalies can also prevent the enhanced dust band (Fig. 5a) from entering the SEUS. Accompanied by the southwestward extension of the BH, the Caribbean low-level jet (CLLJ), defined as the mean zonal wind speed at 925 hPa over 11–17∘ N and 70–80∘ W, is also used to assess the westward transport of dust over the Caribbean Sea (Wang, 2007). The edge of the CLLJ is denoted by the 12 m s−1 zonal wind speed contour (dashed lines in Fig. 6a). The shrinkage of the CLLJ under droughts further verifies the weakened dust transport at low levels.
The geopotential height pattern associated with these circulation and jet changes is a higher-than-normal subpolar low and lower-than-normal BH, which is consistent with the negative phase of the North Atlantic Oscillation (NAO) (Barnston and Livezey, 1987). A negative phase of the NAO has been proven to be teleconnected with dry weather over the SEUS and northern Europe and with wet weather over southern Europe and the Mediterranean due to fewer and weaker storms caused by the reduced pressure gradient between the subtropical high and low (Hurrell, 1995; Visbeck et al., 2001). The time series in Fig. 4 show severe-drought events (e.g., 2011) are associated with a strong negative NAO and abnormally low CLLJ. Similarly, we found both the NAO and the CLLJ are positively correlated with SPEI over the SEUS (Fig. 7a, c) with their corresponding mean magnitude reduced by 0.80 and 1.27 m s−1, respectively, compared with non-drought conditions (Fig. 7b, d). This further confirms the weakened low-level dust transport into the southeast region. It is also noted in Fig. 4 that in some years (e.g., 2000 and 2006) the severe drought is not closely associated with a strong negative NAO. The reason is that other processes, such as El Niño and the Southern Oscillation (ENSO) and the Pacific Decadal Oscillation (PDO), can also trigger drought conditions over the SEUS (Piechota and Dracup, 1996; Cook et al., 2007; Pu et al., 2016). For example, the cold phase of ENSO, known as La Niña, is linked with the fast-developing droughts over the SEUS in 2000 and 2006 by Chen et al. (2019) despite the NAO index not being too strong in those years. Although many factors contribute to the SEUS droughts, the abnormal circulation patterns related to the negative phase of the NAO impose more influence on the African dust transport, and thus we focus on the NAO in this study.
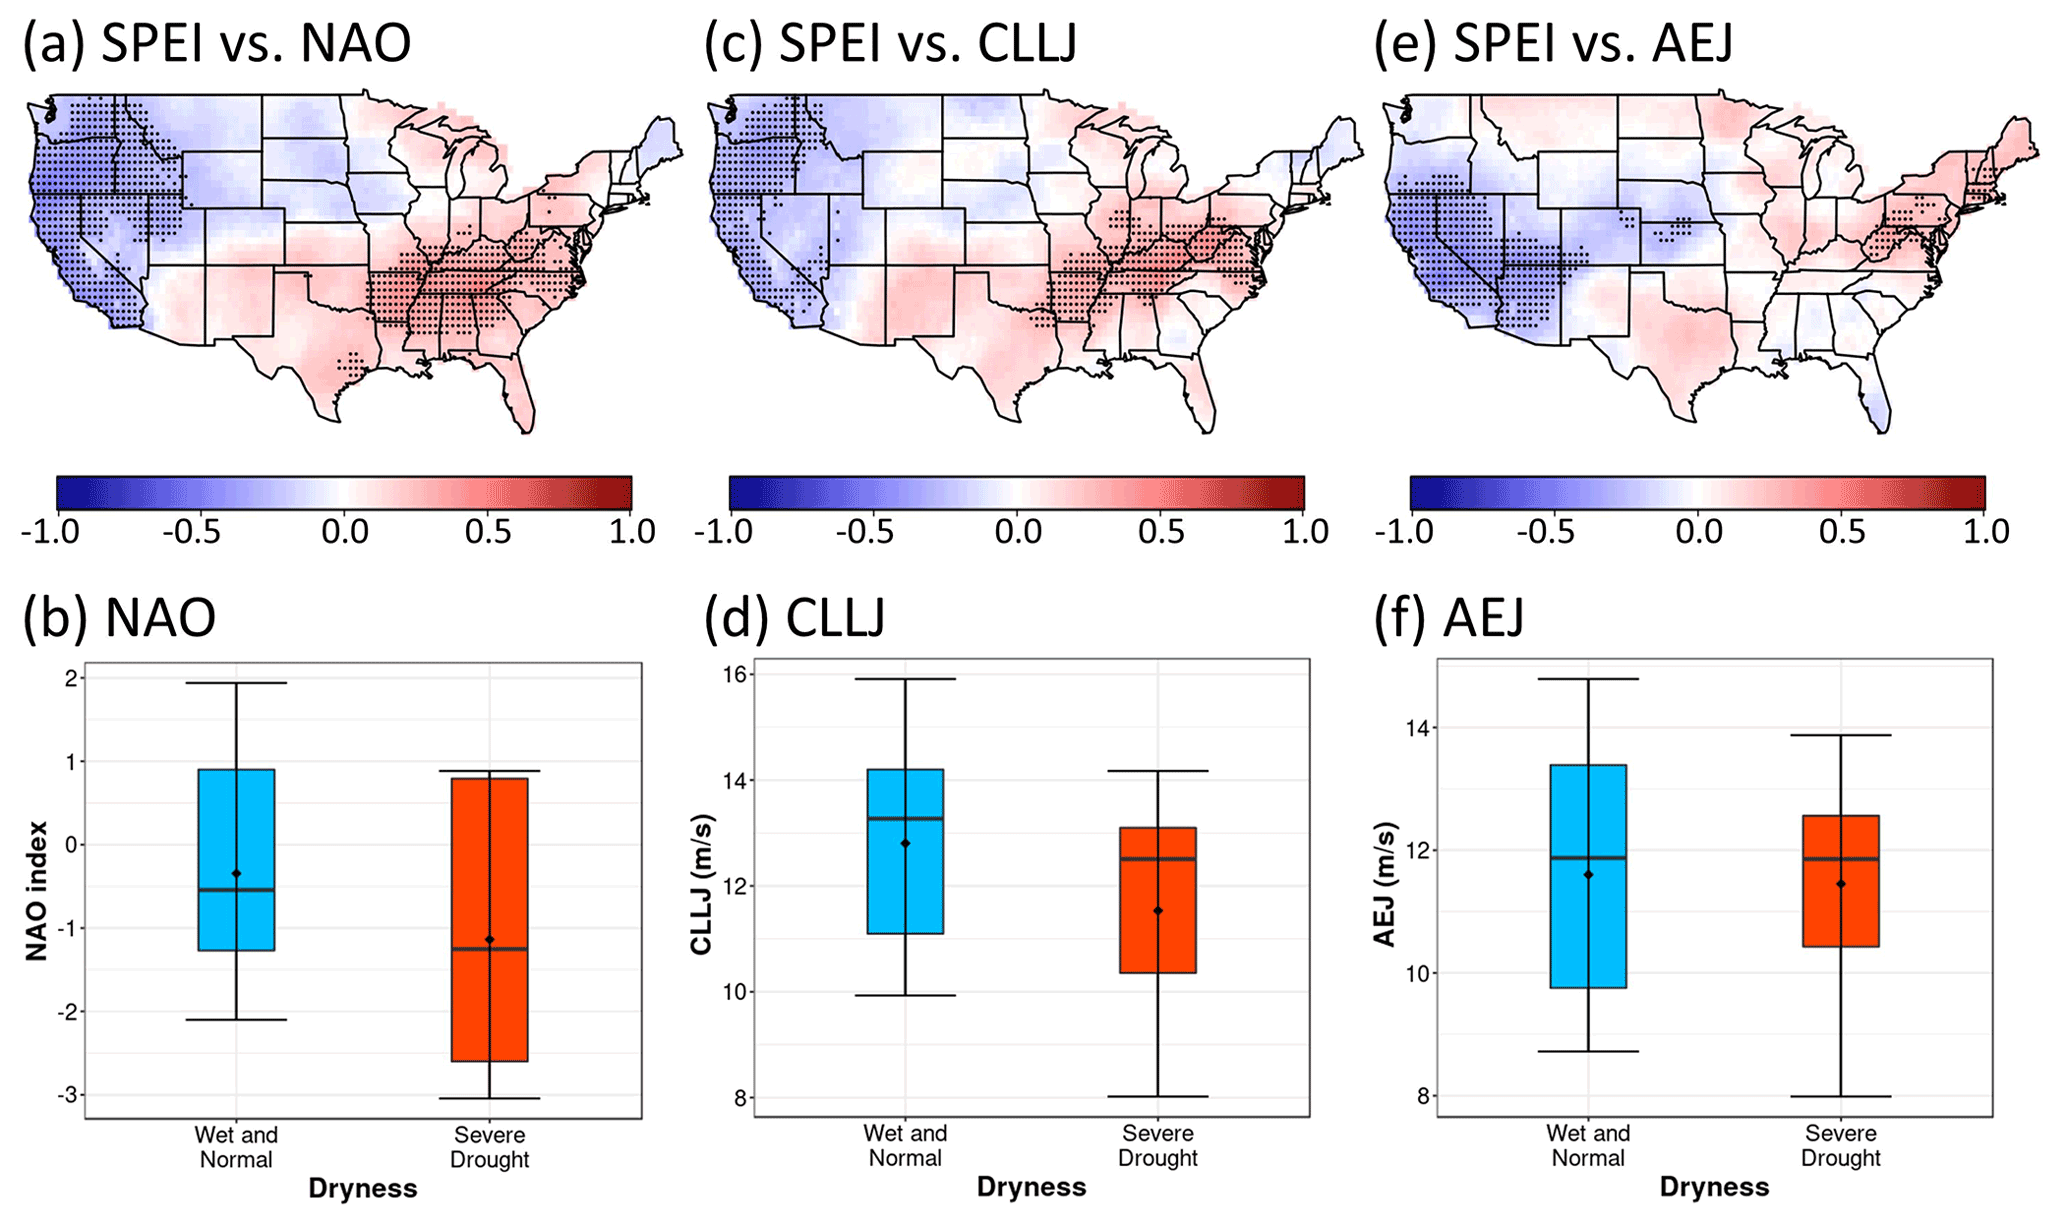
Figure 7Map of the correlation coefficient between SPEI and the NAO (a), CLLJ (c), and AEJ (e) during 2000–2018 in JJA with black dots denoting the significant correlation at a 95 % confidence level. The boxplots of the NAO (b), CLLJ (d), and AEJ (f) distributions under non-drought (wet and normal) and severe-drought conditions.
The westward dust propagation at high levels (e.g., at ∼ 3 km altitude) mainly occurs near the source region after being injected from the surface (Fig. 5c). The African easterly jet (AEJ), defined as the average zonal wind speed at 600 hPa over the area of 10–15∘ N and 30∘ W–10∘ E (Cook, 1999), has been widely linked with the transport of the African dust towards the tropical Atlantic (e.g., Jones et al., 2003; Pu and Jin, 2021). Another strengthened high pressure over North Africa (Saharan anticyclone) at 600 hPa (also seen at 850 hPa) leads to stronger winds to the northern rim of the AEJ (Fig. 6b). However, the core jet area seems to be less affected as shown by the comparable magnitude of the AEJ between non-drought and drought conditions in Fig. 7f. The edge of the AEJ, denoted by the 11 m s−1 zonal wind contour (dashed lines in Fig. 6b), only slightly moves northwards and does not show noticeable expansion or shrinkage. There are no significant correlations between SPEI and the AEJ over the SEUS either (Fig. 7e), which indicates weak teleconnection between droughts in the SEUS and the dust transport strength at a high level. The abnormally high Saharan anticyclone at both 850 and 600 hPa (Fig. 6a–b) is likely to increase both emissions and transport of dust from the Sahara, thus causing the enhanced dust band (20–30∘ N) in Fig. 5a.
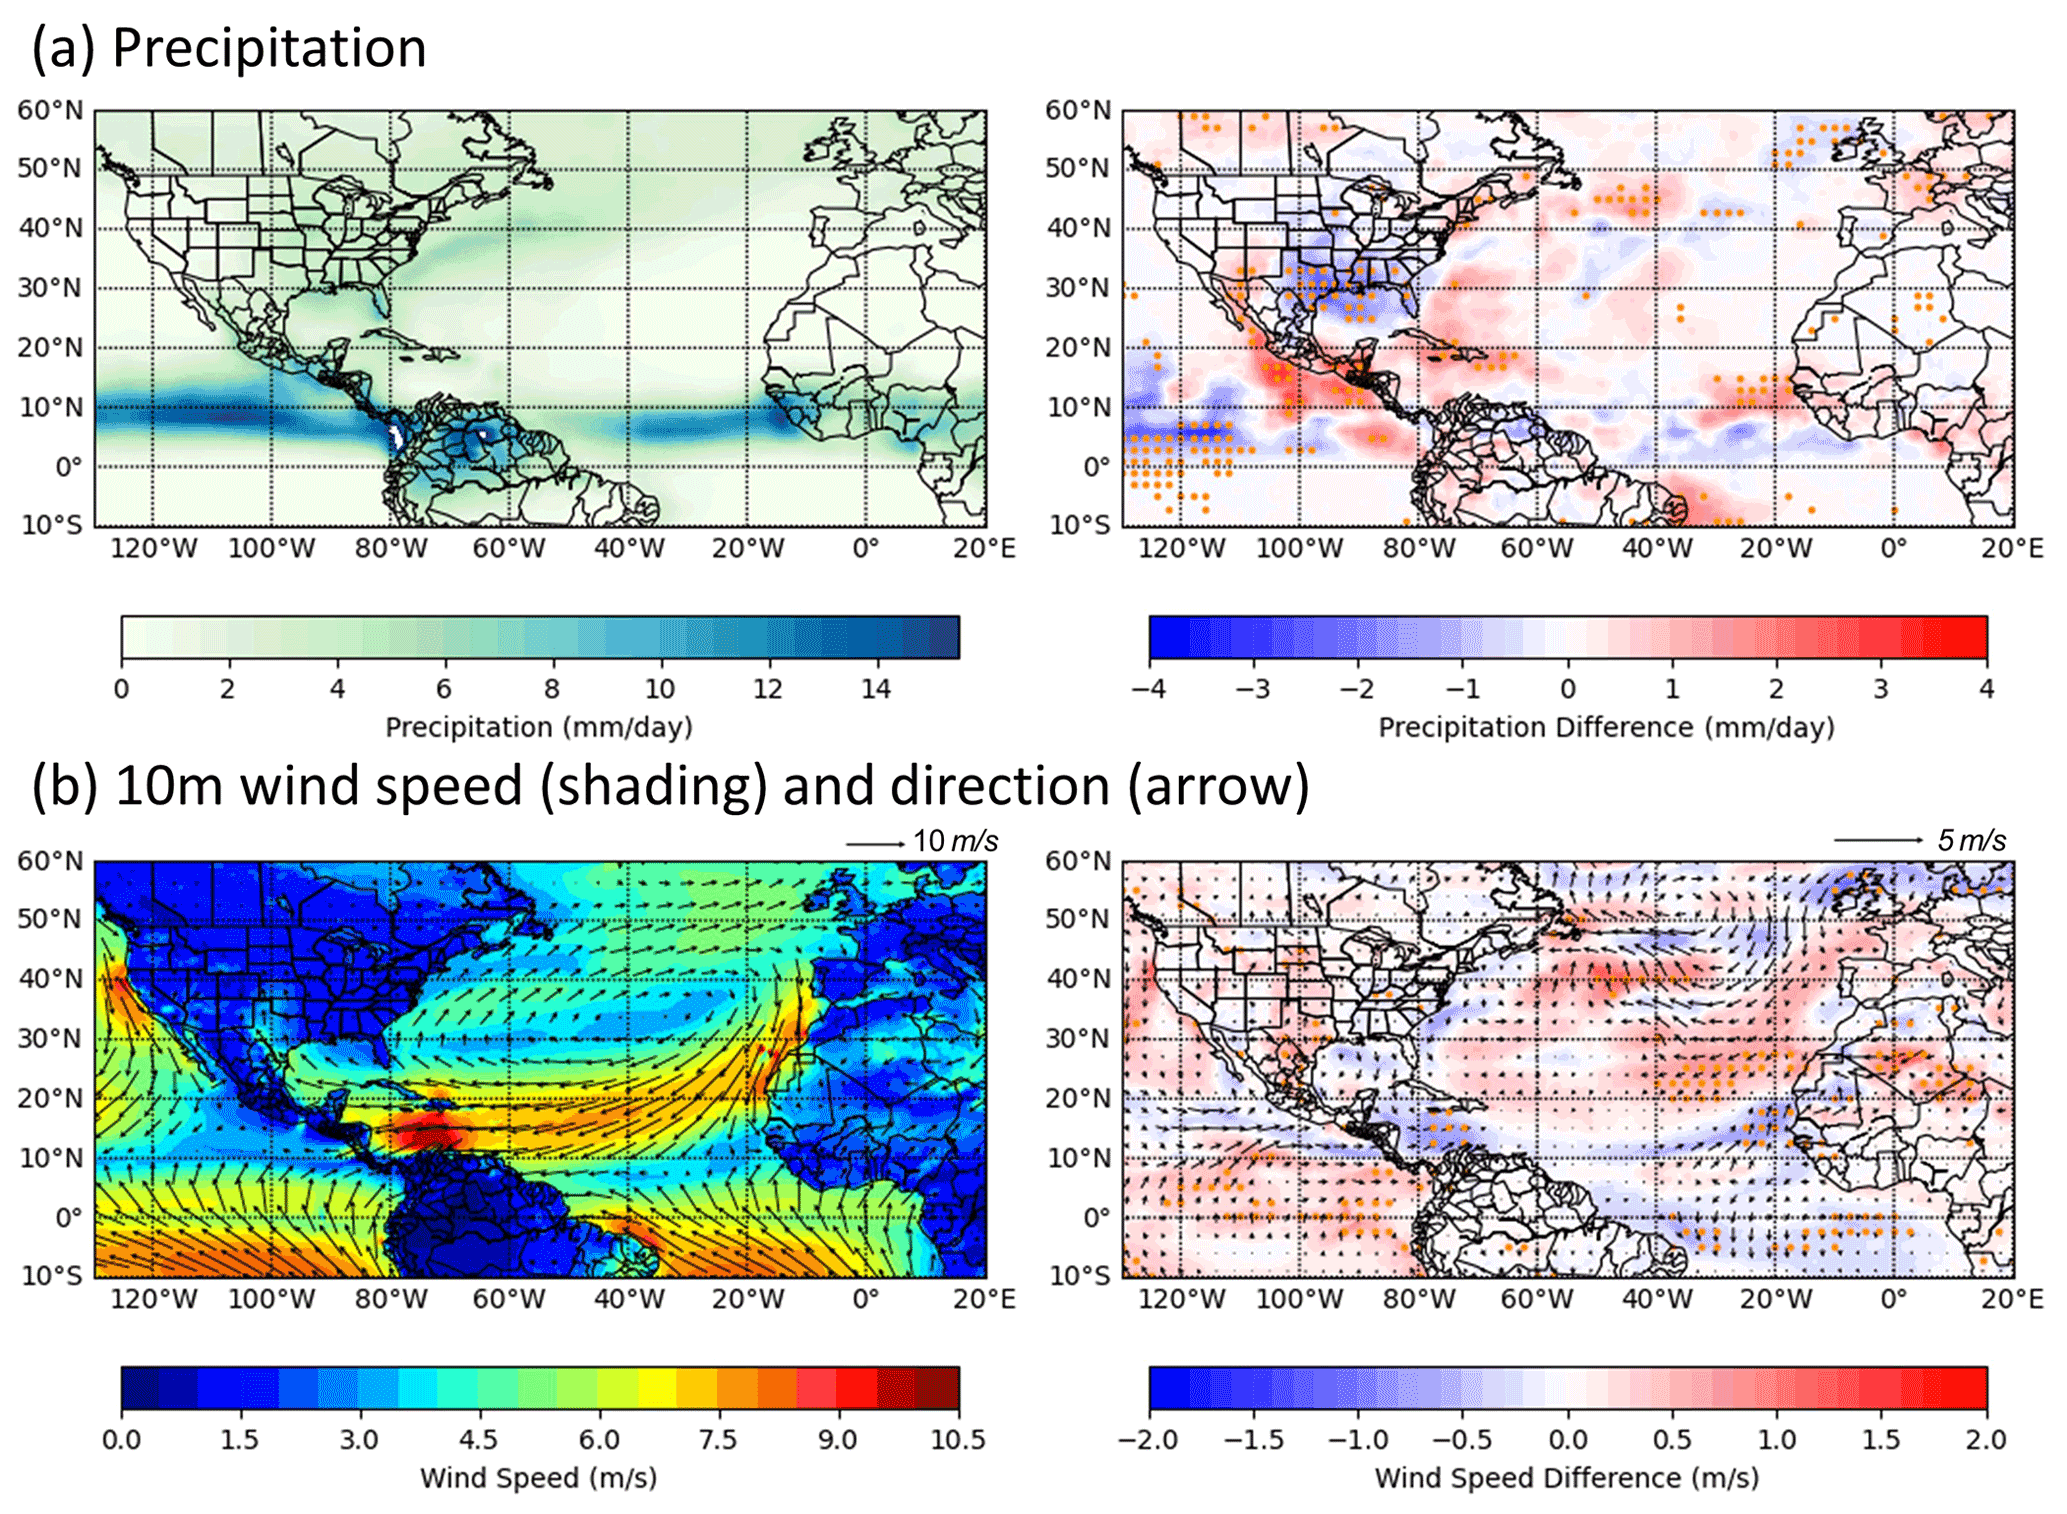
Figure 8Maps of precipitation (a) and 10 m wind speed (shading in b) and directions (arrows in b) under the USDM-based SEUS regional non-drought (wet and normal) conditions (left column) and their changes during severe-drought periods (right column) from 2000 to 2019 in JJA. Orange dots (right column) indicate the grids with significant differences in precipitation (a) and wind speed (b) at a 95 % confidence level.
Precipitation is one of the dominant factors influencing African dust emissions (Moulin and Chiapello, 2004). A maximum precipitation zonal belt near 5–10∘ N can be seen under non-drought conditions in Fig. 8a, which represents the location of the Intertropical Convergence Zone (ITCZ). We found enhanced precipitation in southern West Africa (10–20∘ N, 30–0∘ W) and the Caribbean Sea, which will reduce dust emissions from the major source region of the Sahel (e.g., southern Mauritania and Mali) and enhance the wet scavenging of dust to the Caribbean Sea. A significant anticorrelation between summertime Sahel precipitation and the NAO has been reported by previous studies on a multidecadal scale (Folland et al., 2009; Linderholm et al., 2009), which is caused by the northward displacement of the ITCZ shifting the “rain belt” into the Sahel region in response to a warmer North Atlantic (Sheen et al., 2017; Yuan et al., 2018). By locating the maximum rainfall within 0–20∘ N and 30–0∘ W following Liu et al. (2020), we found an average of ∼ 0.6∘ northward movement of the ITCZ during the SEUS droughts. This can also be seen from the southwesterly 10 m wind anomalies over the same region, which are contrary to the northeasterly winds under non-drought conditions (Fig. 8b). Surface wind speed is another important factor associated with dust emissions in this region (Evan et al., 2016). However, Fig. 8b does not show clear negative anomalies over the Sahel region under droughts, which implies that surface wind speed is not a significant factor in causing the weakened dust emissions in the Sahel. Instead, stronger winds are found over part of the Sahara (20–30∘ N, 5∘ W–10∘ E), which would increase the dust emissions therein and contribute to the enhanced dust band displayed in Fig. 5a.
In summary, the reduction in surface fine dust in the SEUS under severe drought results from the weakened African dust transport and emissions from the Sahel through the teleconnection patterns of a negative NAO. The weaker and less southwestward extension of the BH reduces the wind speed over the Caribbean and the Gulf of Mexico, making it less favorable for African dust to enter the SEUS at low levels. Intensified precipitation over the Sahel related to the northward shift of the ITCZ is the main factor causing lower Sahelian dust emissions during the SEUS droughts, and this factor dominates over surface wind speed changes.
3.3 CMIP6 model evaluation
In this section, we evaluated the surface dust concentrations from 10 CMIP6 models regarding their capability of capturing the drought–dust relationships in the SEUS in comparison with the monthly observations (1973–2014, JJA) at the Barbados site. Dust values were extracted from the lowest model layer at a grid point nearest to the observation site. Out of the 120-month study period, 24 severe-drought months were identified based on the same SPEI-based regional-drought criteria as described in the last section.
Figure 9a displays the scatterplots between model simulations and observations with more statistics listed in Table 1. CNRM-ESM2-1, EC-Earth3-AerChem, MIROC6, and NorESM2-LM considerably underestimate the dust concentrations by more than 16 µg m−3 (70 %) regardless of the drought conditions. GFDL-ESM4, MRI-ESM2-0, and UKESM-0-LL simulations have a lower underestimation of ∼ 7 µg m−3 (28 %), ∼ 5 µg m−3 (18 %), and ∼ 3 µg m−3 (13 %), respectively, with the latter being the minimum bias among all the 10 models, but they do not reproduce the observed variability as indicated by the negative correlation coefficient (r) and slope. Under droughts, the underestimations of both GFDL-ESM4 and MRI-ESM2-0 are reduced by ∼ 38 % with r and slope values turning to positive or becoming closer to zero, which indicates these two models have better performance under droughts. By contrast, the UKESM-0-LL model performs slightly worse if using drought months only, as indicated by the ∼ 3 % higher underestimation and the more negative r and slope values. An overall overestimation of ∼ 7 µg m−3 (29 %), ∼ 9 µg m−3 (36 %), and ∼ 5 µg m−3 (21 %) was found in the simulations of BCC-ESM1, CESM2-WACCM, and GISS-E2-1-G, respectively. The negative or low r and slope values (less than 0.25) of these three models also show that they can barely capture the dust variability. If only the drought months are considered, all three models have a better capability in predicting the dust variability with r increasing to 0.18 (BCC-ESM1), 0.25 (CESM-WACCM), and 0.37 (GISS-E2-1-G).
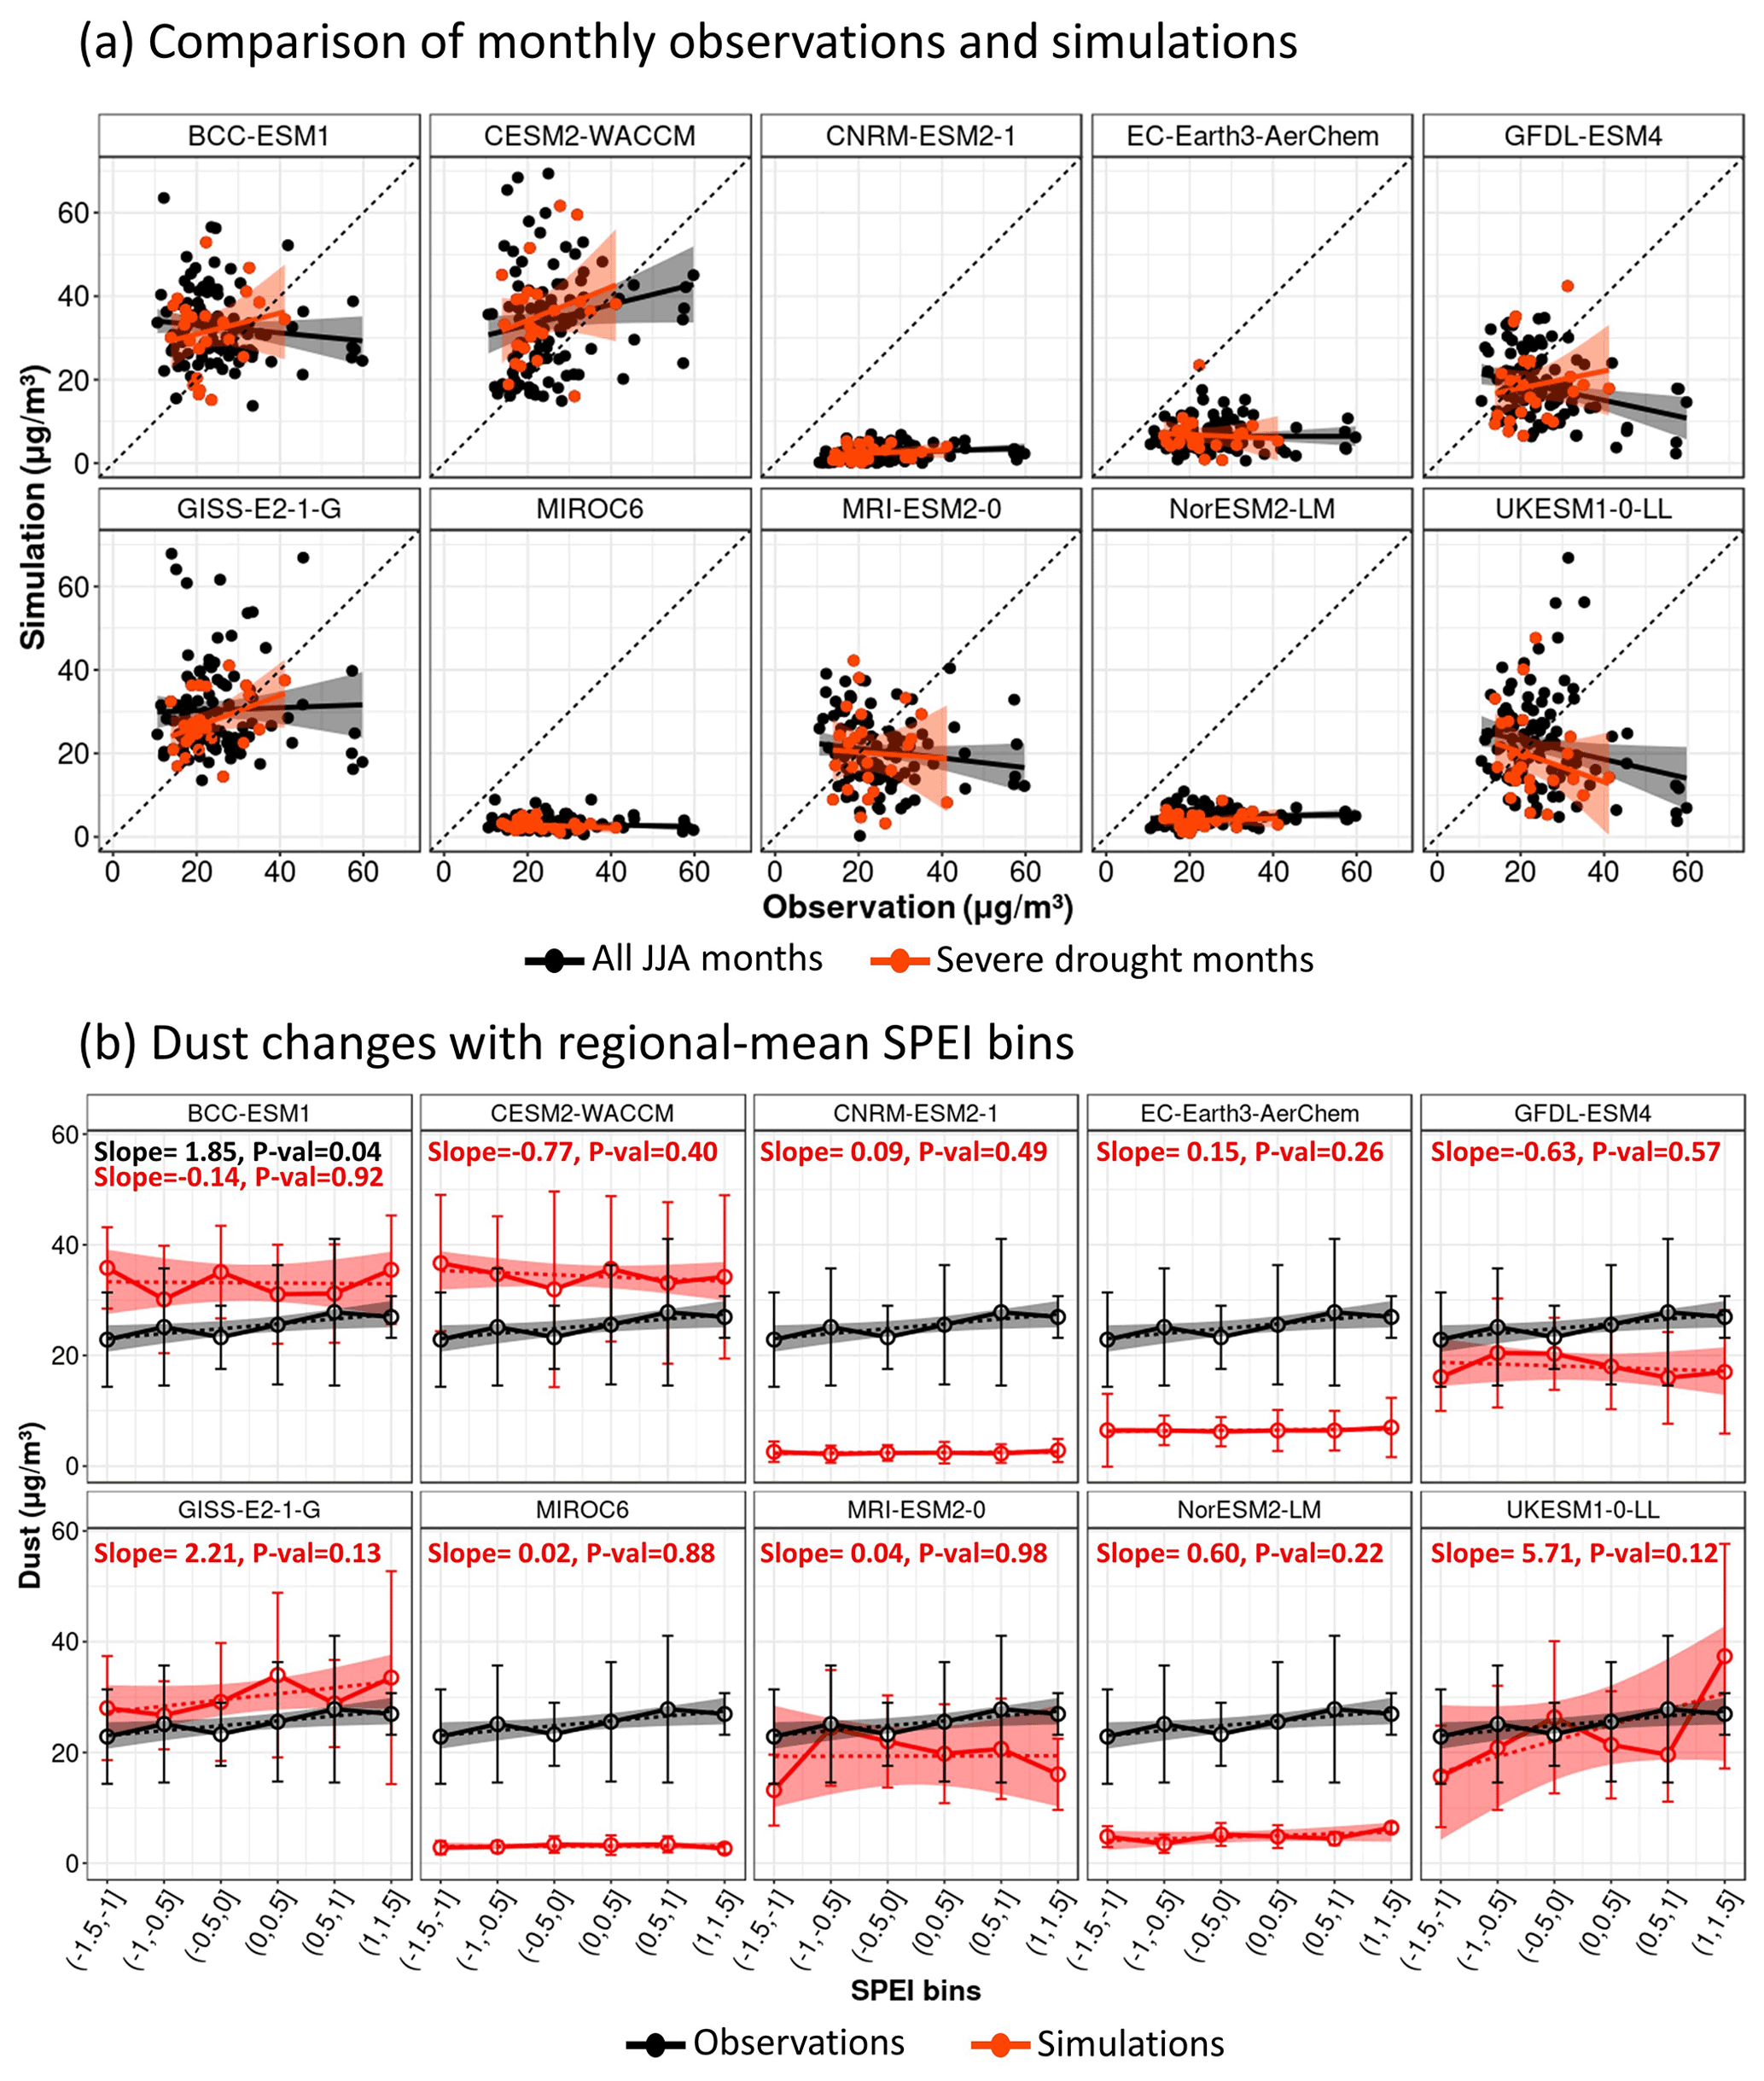
Figure 9(a) Scatterplots between dust observations and 10 CMPI6 models during 1973–2014 in JJA. Black dots and lines represent dust in all the JJA months and their linear regression fits, respectively. Red dots and lines indicate the same analysis but using the SPEI-based severe-drought months only. The shading indicates a 95 % confidence level of the linear regressions. The dashed lines correspond to the 1:1 correlation. (b) Observed and simulated dust means (dots) and standard deviations (error bars) varying with the SEUS regional-mean SPEI. Dashed lines represent the linear regressions of the average dust concentrations with their slopes (Slope) and P values (P-val) listed at the top of each panel.
The sensitivity of surface dust in response to the SEUS regional drought was also evaluated by comparing the simulated and observed slopes of dust changes with regional-mean SPEI. The results are displayed in Fig. 9b. Similarly to the fine-dust responses to drought in the southeast, total dust at Barbados also shows a decreasing tendency with lower SPEI. On average, dust at the Barbados site reduces by 1.85 µg m−3 with a unit decrease in SPEI over the southeast region. This consolidates the conclusion that the weakened across-Atlantic transport of African dust is the reason for the reduced fine dust in the SEUS as the Barbados site sits in the major transport pathway. The UKESM-0-LL model shows a much higher sensitivity of 5.71 µg m−3 (P value = 0.12), probably driven by the high dust value under the wettest conditions (SPEI >1). GISS-E2-1-G simulations have a comparable sensitivity of 2.21 µg m−3 (P value = 0.13) despite its general overestimation, which makes it outperform the other nine models with a much lower and less statistically significant sensitivity in response to SPEI changes.
Table 1Evaluation metrics of 10 CMIP6 models in comparison with observations at the Barbados site during 1973–2014 in JJA. Metrics include the correlation coefficient (r), mean bias (MB), normalized mean bias (NMB), root mean square error (RMSE), and slope.
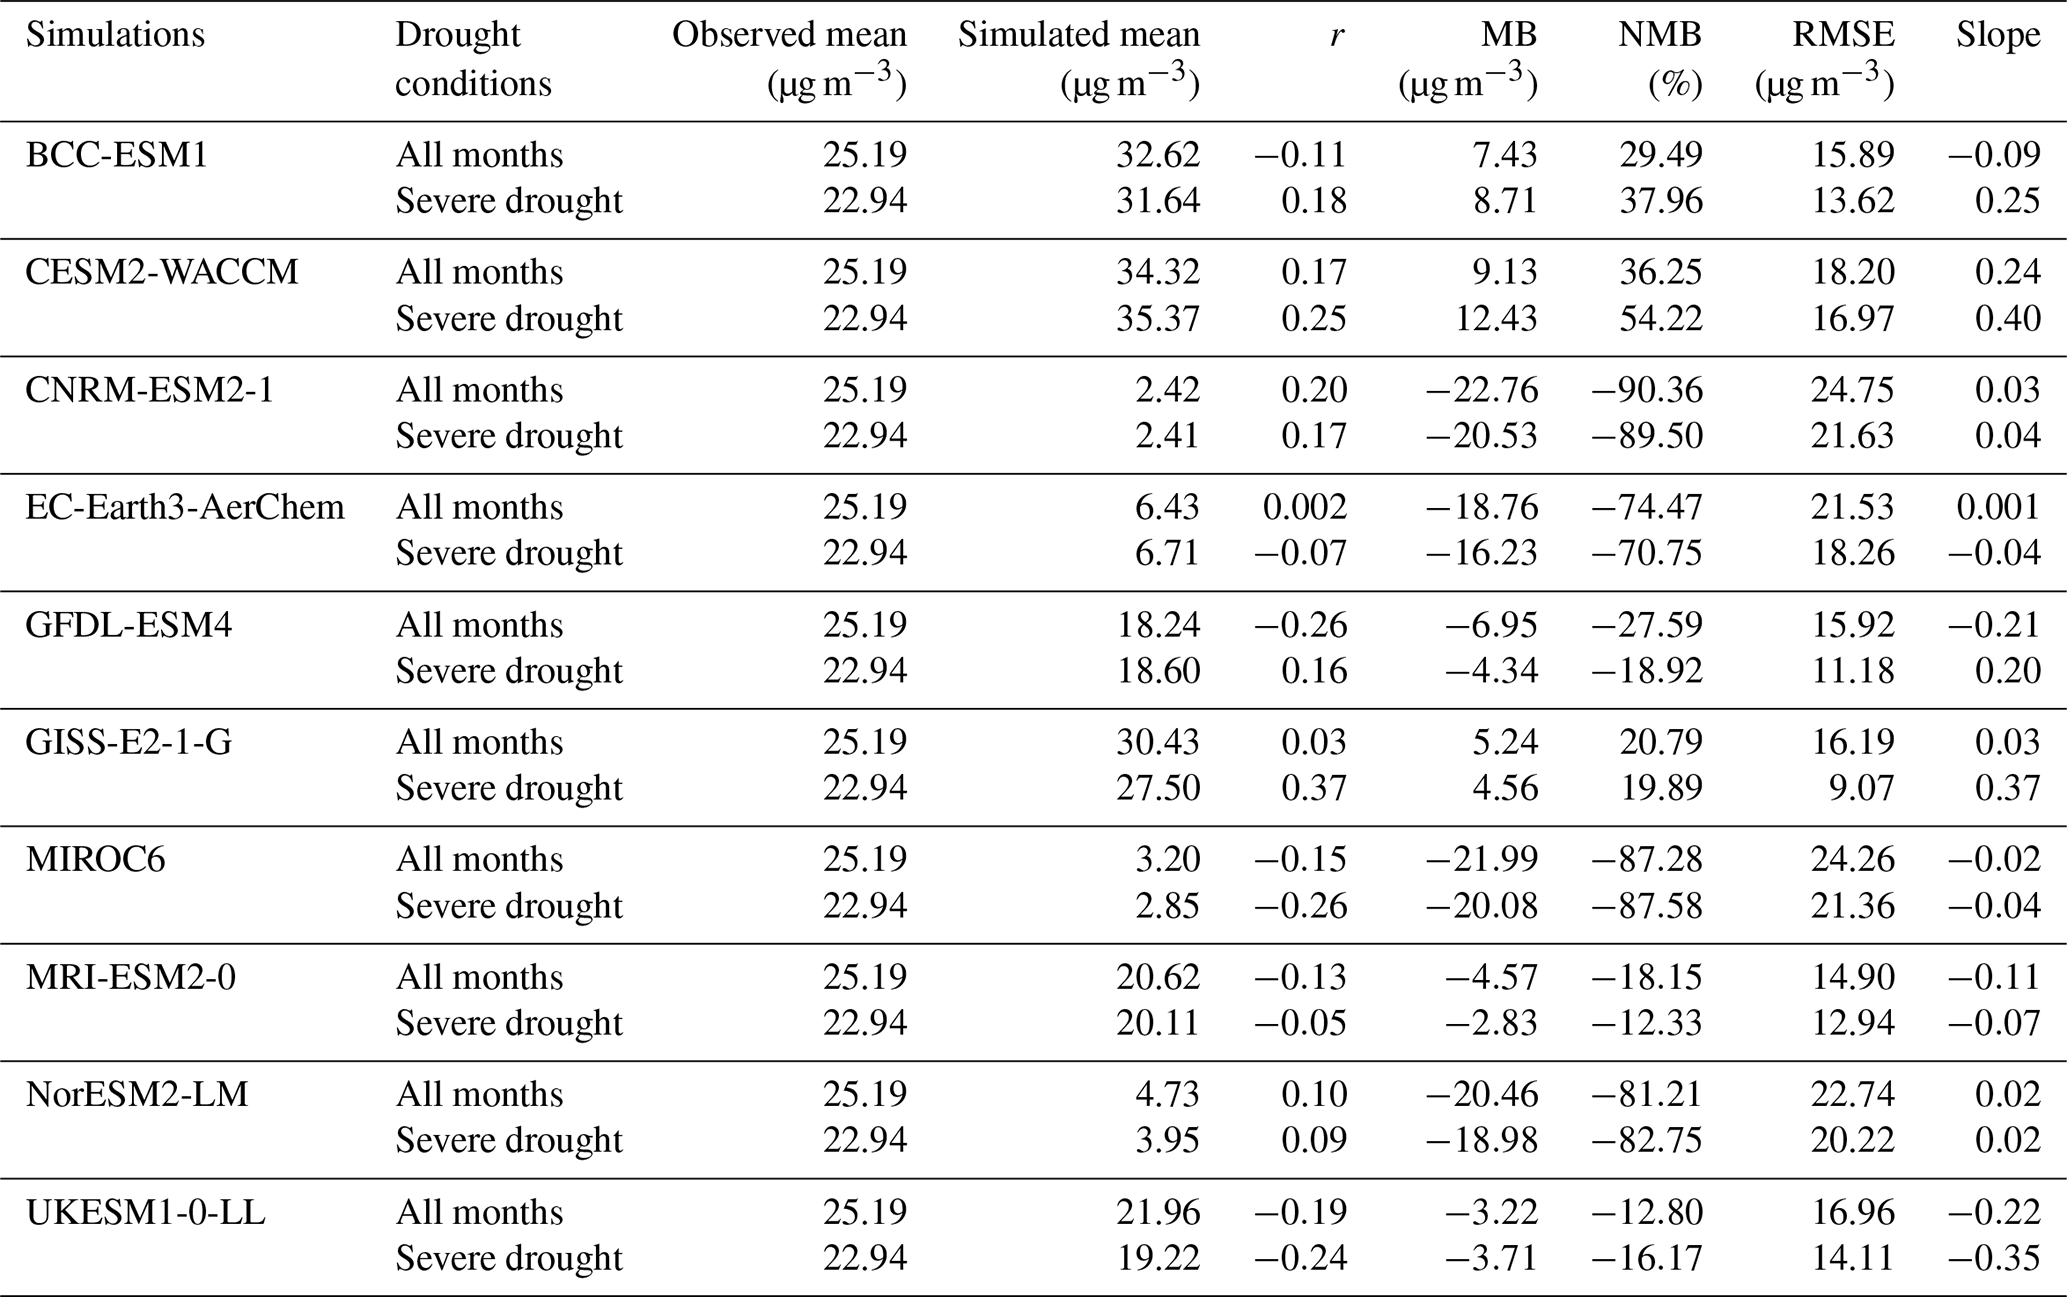
In conclusion, BCC-ESM1, CESM2-WACCM, and GISS-E2-1-G generally show an overestimation of surface dust, while the other seven models exhibit an underestimation with the highest underestimation found in the CNRM-ESM2-1, EC-Earth3-AerChem, MIROC6, and NorESM2-LM simulations. None of the 10 models is capable of capturing the dust variability using all the months. If using the drought months only, BCC-ESM1, CESM2-WACCM, GFDL-ESM4, GISS-E2-1-G, and MRI-ESM2-0 perform better. GISS-E2-1-G can reproduce the dust-SPEI sensitivity much better than the other nine models. It is noted that systematic bias should arise when comparing single-site observations with grid-mean predictions, which could presumably cause the between-model diversity as they have different spatial resolutions (Table S2). However, the dust-sensitivity evaluation should be less affected as its calculation depends more on relative changes than on absolute values.
We found an opposite response of surface fine dust to severe droughts between the western and southeastern CONUS, with an increase of ∼ 0.12 µg m−3 and a decrease of ∼ 0.23 µg m−3 per unit decrease in SPEI, respectively. Similar results were reached by the USDM-based drought conditions, with an average decrease of 0.16 µg m−3 under D2–D4 droughts over the SEUS relative to non-drought conditions. The dust and drought relationship over the west and southwest region has been investigated before due to the region's vicinity to the major dust source regions, and the increase in dust with drought is expected. As the southeast region is strongly influenced by long-range transport of African dust in the summer, we investigated how drought conditions in the SEUS can be linked with the trans-Atlantic transport of African dust.
The elemental ratios are indicative of the dominance of African dust in the southeast region. The tendency of these ratios to move out of the normal range under severe droughts implies a reduced African dust input. The anomalies of satellite AOD and dust extinction coefficients suggest that both the transport and the emissions of African dust are weaker during the southeast drought periods than during non-drought periods. The composite analysis reveals that the weaker across-Atlantic dust transport is through the teleconnection patterns of the negative NAO. During the drought periods, a lower-than-normal and more northeastward displacement of the Bermuda High results in less dust being brought into the SEUS at low levels from the Caribbean and the Gulf of Mexico by its southwestward extensions. This can also be seen from a weaker and more shrinking CLLJ. Enhanced precipitation in the Sahel associated with the northward shift of the ITCZ leads to lower dust emissions therein.
Finally, we evaluated 10 CMIP6 models with surface dust outputs. CNRM-ESM2-1, EC-Earth3-AerChem, MIROC6, and NorESM2-LM generally perform the worst with an up to 70 % underestimation of the dust concentrations. GFDL-ESM4, MRI-ESM2-0, and UKESM-0-LL underpredict the dust level by 28 %, 18 %, and 13 %, respectively. BCC-ESM1, CESM2-WACCM, and GISS-E2-1-G show an overestimation of 29 %, 36 %, and 21 %, respectively. All 10 models fail to reproduce the dust variability using data from all the months, with the BCC-ESM1, CESM2-WACCM, GFDL-ESM4, GISS-E2-1-G, and MRI-ESM2-0 models significantly improving their performance if only the drought months are used. GISS-E2-1-G outperforms other models in capturing the dust-SPEI sensitivity.
This study establishes how the local- or regional-scale drought conditions in the SEUS are linked with the long-range transport and emission changes in African dust through teleconnections. It also reveals the mechanism of how droughts influence aerosol abundance through changing long-range transport of dust. Thus, in order to better predict how the local dust air quality will change in response to an increasing drought frequency in a warming climate (Cook et al., 2015), climate and Earth system models not only need to represent various physical processes associated with the entire dust cycle but also should capture the abnormal atmospheric processes (e.g., circulation and precipitation) related to droughts. Evaluation of these models should use observations of dust–drought relationships not only in dust source regions but also in dust transport regions.
CALIPSO dust extinction coefficient data are available at https://doi.org/10.5067/CALIOP/CALIPSO/CAL_LID_L3_Tropospheric_APro_CloudFree-Standard-V4-20 (NASA, 2019). The ERA5 reanalysis data were downloaded from https://doi.org/10.24381/cds.bd0915c6 (Hersbach et al., 2018). Other data can be found at https://doi.org/10.7910/DVN/XCLAOT (Li, 2022).
The supplement related to this article is available online at: https://doi.org/10.5194/acp-22-7843-2022-supplement.
YW conceived the research idea. WL conducted the analysis. Both authors contributed to the preparation of the manuscript.
The contact author has declared that neither they nor their co-author has any competing interests.
Publisher’s note: Copernicus Publications remains neutral with regard to jurisdictional claims in published maps and institutional affiliations.
This article is part of the special issue “Dust aerosol measurements, modeling and multidisciplinary effects (AMT/ACP inter-journal SI)”. It is not associated with a conference.
The authors acknowledge NASA for providing the MODIS AOD and CALIPSO data and EPA and IMPROVE for making the dust observations. We thank individuals and groups from the National Drought Mitigation Center for providing the USDM maps and from the Climatology and Climate Services Laboratory for creating the SPEI dataset. The authors also thank the modeling groups participating in the CMIP6 AerChemMIP project for making the surface dust outputs available.
This research has been supported by the National Oceanic and Atmospheric Administration through the Atmospheric Chemistry, Carbon Cycle and Climate (AC4) Program (grant no. NA19OAR4310177).
This paper was edited by Roya Bahreini and reviewed by two anonymous referees.
Aarons, S. M., Arvin, L. J., Aciego, S. M., Riebe, C. S., Johnson, K. R., Blakowski, M. A., Koornneef, J. M., Hart, S. C., Barnes, M. E., Dove, N., Botthoff, J. K., Maltz, M., and Aronson, E. L.: Competing droughts affect dust delivery to Sierra Nevada, Aeolian Res., 41, 100545, https://doi.org/10.1016/j.aeolia.2019.100545, 2019.
Achakulwisut, P., Shen, L., and Mickley, L. J.: What Controls Springtime Fine Dust Variability in the Western United States? Investigating the 2002–2015 Increase in Fine Dust in the U.S. Southwest, J. Geophys. Res.-Atmos., 122, 12449–12467, https://doi.org/10.1002/2017JD027208, 2017.
Achakulwisut, P., Mickley, L. J., and Anenberg, S. C.: Drought-sensitivity of fine dust in the US Southwest: Implications for air quality and public health under future climate change, Environ. Res. Lett., 13, 054025, https://doi.org/10.1088/1748-9326/aabf20, 2018.
Achakulwisut, P., Anenberg, S. C., Neumann, J. E., Penn, S. L., Weiss, N., Crimmins, A., Fann, N., Martinich, J., Roman, H., and Mickley, L. J.: Effects of Increasing Aridity on Ambient Dust and Public Health in the U.S. Southwest Under Climate Change, GeoHealth, 3, 127–144, https://doi.org/10.1029/2019GH000187, 2019.
Alamirew, N. K., Todd, M. C., Ryder, C. L., Marsham, J. H., and Wang, Y.: The early summertime Saharan heat low: sensitivity of the radiation budget and atmospheric heating to water vapour and dust aerosol, Atmos. Chem. Phys., 18, 1241–1262, https://doi.org/10.5194/acp-18-1241-2018, 2018.
Aldhaif, A. M., Lopez, D. H., Dadashazar, H., and Sorooshian, A.: Sources, frequency, and chemical nature of dust events impacting the United States East Coast, Atmos. Environ., 231, 117456, https://doi.org/10.1016/j.atmosenv.2020.117456, 2020.
Arcusa, S. H., McKay, N. P., Routson, C. C., and Munoz, S. E.: Dust-drought interactions over the last 15,000 years: A network of lake sediment records from the San Juan Mountains, Colorado, The Holocene, 30, 559–574, https://doi.org/10.1177/0959683619875192, 2020.
Aryal, Y. N. and Evans, S.: Global Dust Variability Explained by Drought Sensitivity in CMIP6 Models, J. Geophys. Res.-Earth Surf., 126, e2021JF006073, https://doi.org/10.1029/2021JF006073, 2021.
Barnston, A. G. and Livezey, R. E.: Classification, Seasonality and Persistence of Low-Frequency Atmospheric Circulation Patterns, Mon. Weather Rev., 115, 1083–1126, https://doi.org/10.1175/1520-0493(1987)115<1083:CSAPOL>2.0.CO;2, 1987.
Borlina, C. S. and Rennó, N. O.: The Impact of a Severe Drought on Dust Lifting in California's Owens Lake Area, Sci. Rep., 7, 1784, https://doi.org/10.1038/s41598-017-01829-7, 2017.
Bou Karam, D., Flamant, C., Knippertz, P., Reitebuch, O., Pelon, J., Chong, M., and Dabas, A.: Dust emissions over the Sahel associated with the West African monsoon intertropical discontinuity region: A representative case-study, Q. J. Roy. Meteorol. Soc., 134, 621–634, https://doi.org/10.1002/qj.244, 2008.
Brey, S., Pierce, J., Barnes, E., and Fischer, E.: Estimating the Spread in Future Fine Dust Concentrations in the Southwest United States, J. Geophys. Res.-Atmos., 125, e2019JD031735, https://doi.org/10.1029/2019JD031735, 2020.
Carslaw, K. S., Boucher, O., Spracklen, D. V., Mann, G. W., Rae, J. G. L., Woodward, S., and Kulmala, M.: A review of natural aerosol interactions and feedbacks within the Earth system, Atmos. Chem. Phys., 10, 1701–1737, https://doi.org/10.5194/acp-10-1701-2010, 2010.
Chen, L. G., Gottschalck, J., Hartman, A., Miskus, D., Tinker, R., and Artusa, A.: Flash Drought Characteristics Based on U.S. Drought Monitor, Atmosphere, 10, 498, https://doi.org/10.3390/atmos10090498, 2019.
Chen, S.-P., Lu, C.-H., McQueen, J., and Lee, P.: Application of satellite observations in conjunction with aerosol reanalysis to characterize long-range transport of African and Asian dust on air quality in the contiguous U.S., Atmos. Environ., 187, 174–195, https://doi.org/10.1016/j.atmosenv.2018.05.038, 2018.
Chiapello, I., Moulin, C., and Prospero, J. M.: Understanding the long-term variability of African dust transport across the Atlantic as recorded in both Barbados surface concentrations and large-scale Total Ozone Mapping Spectrometer (TOMS) optical thickness, J. Geophys. Res.-Atmos., 110, D18S10, https://doi.org/10.1029/2004JD005132, 2005.
Cook, B. I., Ault, T. R., and Smerdon, J. E.: Unprecedented 21st century drought risk in the American Southwest and Central Plains, Sci. Adv., 1, e1400082, https://doi.org/10.1126/sciadv.1400082, 2015.
Cook, E. R., Seager, R., Cane, M. A., and Stahle, D. W.: North American drought: Reconstructions, causes, and consequences, Earth-Sci. Rev., 81, 93–134, https://doi.org/10.1016/j.earscirev.2006.12.002, 2007.
Cook, K. H.: Generation of the African Easterly Jet and Its Role in Determining West African Precipitation, J. Clim., 12, 1165–1184, https://doi.org/10.1175/1520-0442(1999)012<1165:GOTAEJ>2.0.CO;2, 1999.
Crooks, J. L., Cascio, W. E., Percy, M. S., Reyes, J., Neas, L. M., and Hilborn, E. D.: The Association between Dust Storms and Daily Non-Accidental Mortality in the United States, 1993–2005, Environ. Health Perspect., 124, 1735–1743, https://doi.org/10.1289/EHP216, 2016.
Danabasoglu, G., Lamarque, J.-F., Bacmeister, J., Bailey, D. A., DuVivier, A. K., Edwards, J., Emmons, L. K., Fasullo, J., Garcia, R., Gettelman, A., Hannay, C., Holland, M. M., Large, W. G., Lauritzen, P. H., Lawrence, D. M., Lenaerts, J. T. M., Lindsay, K., Lipscomb, W. H., Mills, M. J., Neale, R., Oleson, K. W., Otto-Bliesner, B., Phillips, A. S., Sacks, W., Tilmes, S., van Kampenhout, L., Vertenstein, M., Bertini, A., Dennis, J., Deser, C., Fischer, C., Fox-Kemper, B., Kay, J. E., Kinnison, D., Kushner, P. J., Larson, V. E., Long, M. C., Mickelson, S., Moore, J. K., Nienhouse, E., Polvani, L., Rasch, P. J., and Strand, W. G.: The Community Earth System Model Version 2 (CESM2), J. Adv. Model. Earth Syst., 12, e2019MS001916, https://doi.org/10.1029/2019MS001916, 2020.
Doherty, O. M., Riemer, N., and Hameed, S.: Saharan mineral dust transport into the Caribbean: Observed atmospheric controls and trends, J. Geophys. Res.-Atmos., 113, D07211, https://doi.org/10.1029/2007JD009171, 2008.
Duniway, M. C., Pfennigwerth, A. A., Fick, S. E., Nauman, T. W., Belnap, J., and Barger, N. N.: Wind erosion and dust from US drylands: a review of causes, consequences, and solutions in a changing world, Ecosphere, 10, e02650, https://doi.org/10.1002/ecs2.2650, 2019.
Dunne, J. P., Horowitz, L. W., Adcroft, A. J., Ginoux, P., Held, I. M., John, J. G., Krasting, J. P., Malyshev, S., Naik, V., Paulot, F., Shevliakova, E., Stock, C. A., Zadeh, N., Balaji, V., Blanton, C., Dunne, K. A., Dupuis, C., Durachta, J., Dussin, R., Gauthier, P. P. G., Griffies, S. M., Guo, H., Hallberg, R. W., Harrison, M., He, J., Hurlin, W., McHugh, C., Menzel, R., Milly, P. C. D., Nikonov, S., Paynter, D. J., Ploshay, J., Radhakrishnan, A., Rand, K., Reichl, B. G., Robinson, T., Schwarzkopf, D. M., Sentman, L. T., Underwood, S., Vahlenkamp, H., Winton, M., Wittenberg, A. T., Wyman, B., Zeng, Y., and Zhao, M.: The GFDL Earth System Model Version 4.1 (GFDL-ESM 4.1): Overall Coupled Model Description and Simulation Characteristics, J. Adv. Model. Earth Syst., 12, e2019MS002015, https://doi.org/10.1029/2019MS002015, 2020.
Evan, A. T., Flamant, C., Gaetani, M., and Guichard, F.: The past, present and future of African dust, Nature, 531, 493–495, https://doi.org/10.1038/nature17149, 2016.
Flamant, C., Chaboureau, J.-P., Parker, D. J., Taylor, C. M., Cammas, J.-P., Bock, O., Timouk, F., and Pelon, J.: Airborne observations of the impact of a convective system on the planetary boundary layer thermodynamics and aerosol distribution in the inter-tropical discontinuity region of the West African Monsoon, Q. J. Roy. Meteorol. Soc., 133, 1175–1189, https://doi.org/10.1002/qj.97, 2007.
Folland, C. K., Knight, J., Linderholm, H. W., Fereday, D., Ineson, S., and Hurrell, J. W.: The Summer North Atlantic Oscillation: Past, Present, and Future, J. Clim., 22, 1082–1103, https://doi.org/10.1175/2008JCLI2459.1, 2009.
Francis, D., Fonseca, R., Nelli, N., Cuesta, J., Weston, M., Evan, A., and Temimi, M.: The Atmospheric Drivers of the Major Saharan Dust Storm in June 2020, Geophys. Res. Lett., 47, e2020GL090102, https://doi.org/10.1029/2020GL090102, 2020.
Gonzalez, M. E., Garfield, J. G., Corral, A. F., Edwards, E.-L., Zeider, K., and Sorooshian, A.: Extreme Aerosol Events at Mesa Verde, Colorado: Implications for Air Quality Management, Atmosphere, 12, 1140, https://doi.org/10.3390/atmos12091140, 2021.
Gorham, K. A., Raffuse, S. M., Hyslop, N. P., and White, W. H.: Comparison of recent speciated PM2.5 data from collocated CSN and IMPROVE measurements, Atmos. Environ., 244, 117977, https://doi.org/10.1016/j.atmosenv.2020.117977, 2021.
Hand, J. L., Schichtel, B. A., Pitchford, M., Malm, W. C., and Frank, N. H.: Seasonal composition of remote and urban fine particulate matter in the United States, J. Geophys. Res.-Atmos., 117, D05209, https://doi.org/10.1029/2011JD017122, 2012.
Hand, J. L., Gill, T. E., and Schichtel, B. A.: Spatial and seasonal variability in fine mineral dust and coarse aerosol mass at remote sites across the United States, J. Geophys. Res.-Atmos., 122, 3080–3097, https://doi.org/10.1002/2016JD026290, 2017.
Hersbach, H., Bell, B., Berrisford, P., Biavati, G., Horányi, A., Muñoz Sabater, J., Nicolas, J., Peubey, C., Radu, R., Rozum, I., Schepers, D., Simmons, A., Soci, C., Dee, D., and Thépaut, J.-N.: ERA5 hourly data on pressure levels from 1979 to present, Copernicus Climate Change Service (C3S) Climate Data Store (CDS) [data set], https://doi.org/10.24381/cds.bd0915c6, 2018.
Hurrell, J. W.: Decadal Trends in the North Atlantic Oscillation: Regional Temperatures and Precipitation, Science, 269, 676–679, 1995.
Jones, C., Mahowald, N., and Luo, C.: The Role of Easterly Waves on African Desert Dust Transport, J. Clim., 16, 3617–3628, https://doi.org/10.1175/1520-0442(2003)016<3617:TROEWO>2.0.CO;2, 2003.
Jones, P. D., Jonsson, T., and Wheeler, D.: Extension to the North Atlantic oscillation using early instrumental pressure observations from Gibraltar and south-west Iceland, Int. J. Climatol., 17, 1433–1450, https://doi.org/10.1002/(SICI)1097-0088(19971115)17:13<1433::AID-JOC203>3.0.CO;2-P, 1997.
Karanasiou, A., Moreno, N., Moreno, T., Viana, M., de Leeuw, F., and Querol, X.: Health effects from Sahara dust episodes in Europe: Literature review and research gaps, Environ. Int., 47, 107–114, https://doi.org/10.1016/j.envint.2012.06.012, 2012.
Kelley, M., Schmidt, G. A., Nazarenko, L. S., Bauer, S. E., Ruedy, R., Russell, G. L., Ackerman, A. S., Aleinov, I., Bauer, M., Bleck, R., Canuto, V., Cesana, G., Cheng, Y., Clune, T. L., Cook, B. I., Cruz, C. A., Del Genio, A. D., Elsaesser, G. S., Faluvegi, G., Kiang, N. Y., Kim, D., Lacis, A. A., Leboissetier, A., LeGrande, A. N., Lo, K. K., Marshall, J., Matthews, E. E., McDermid, S., Mezuman, K., Miller, R. L., Murray, L. T., Oinas, V., Orbe, C., García-Pando, C. P., Perlwitz, J. P., Puma, M. J., Rind, D., Romanou, A., Shindell, D. T., Sun, S., Tausnev, N., Tsigaridis, K., Tselioudis, G., Weng, E., Wu, J., and Yao, M.-S.: GISS-E2.1: Configurations and Climatology, J. Adv. Model. Earth Syst., 12, e2019MS002025, https://doi.org/10.1029/2019MS002025, 2020.
Kelly, P. and Mapes, B.: Zonal mean wind, the Indian monsoon, and July drying in the western Atlantic subtropics, J. Geophys. Res.-Atmos., 116, D00Q07, https://doi.org/10.1029/2010JD015405, 2011.
Kim, D., Chin, M., Cruz, C. A., Tong, D., and Yu, H.: Spring Dust in Western North America and Its Interannual Variability – Understanding the Role of Local and Transported Dust, J. Geophys. Res.-Atmos., 126, e2021JD035383, https://doi.org/10.1029/2021JD035383, 2021.
Knippertz, P. and Todd, M. C.: The central west Saharan dust hot spot and its relation to African easterly waves and extratropical disturbances, J. Geophys. Res.-Atmos., 115, D12117, https://doi.org/10.1029/2009JD012819, 2010.
Li, W.: Observed and simulated dust data, Harvard Dataverse [data set], https://doi.org/10.7910/DVN/XCLAOT, 2022.
Li, W., Li, L., Fu, R., Deng, Y., and Wang, H.: Changes to the North Atlantic Subtropical High and Its Role in the Intensification of Summer Rainfall Variability in the Southeastern United States, J. Clim., 24, 1499–1506, https://doi.org/10.1175/2010JCLI3829.1, 2011.
Li, W., Wang, Y., Flynn, J., Griffin, R. J., Guo, F., and Schnell, J. L.: Spatial Variation of Surface O3 Responses to Drought Over the Contiguous United States During Summertime: Role of Precursor Emissions and Ozone Chemistry, J. Geophys. Res.-Atmos., 127, e2021JD035607, https://doi.org/10.1029/2021JD035607, 2022.
Linderholm, H. W., Folland, C. K., and Walther, A.: A multicentury perspective on the summer North Atlantic Oscillation (SNAO) and drought in the eastern Atlantic Region, J. Quat. Sci., 24, 415–425, https://doi.org/10.1002/jqs.1261, 2009.
Liu, C., Liao, X., Qiu, J., Yang, Y., Feng, X., Allan, R. P., Cao, N., Long, J., and Xu, J.: Observed variability of intertropical convergence zone over 1998–2018, Environ. Res. Lett., 15, 104011, https://doi.org/10.1088/1748-9326/aba033, 2020.
Middleton, N. J.: Desert dust hazards: A global review, Aeolian Res., 24, 53–63, https://doi.org/10.1016/j.aeolia.2016.12.001, 2017.
Moulin, C. and Chiapello, I.: Evidence of the control of summer atmospheric transport of African dust over the Atlantic by Sahel sources from TOMS satellites (1979–2000), Geophys. Res. Lett., 31, L02107, https://doi.org/10.1029/2003GL018931, 2004.
NASA: CALIPSO Lidar Level 3 Tropospheric Aerosol Profiles, Cloud Free Data, Standard V4-20, NASA Langley Atmospheric Science Data Center DAAC [data set], https://doi.org/10.5067/CALIOP/CALIPSO/CAL_LID_L3_Tropospheric_APro_CloudFree-Standard-V4-20, 2019.
Payra, S., Gupta, P., Bhatla, R., El Amraoui, L., and Verma, S.: Temporal and spatial variability in aerosol optical depth (550 nm) over four major cities of India using data from MODIS onboard the Terra and Aqua satellites, Arab. J. Geosci., 14, 1256, https://doi.org/10.1007/s12517-021-07455-y, 2021.
Perry, K. D., Cahill, T. A., Eldred, R. A., Dutcher, D. D., and Gill, T. E.: Long-range transport of North African dust to the eastern United States, J. Geophys. Res.-Atmos., 102, 11225–11238, https://doi.org/10.1029/97JD00260, 1997.
Piechota, T. C. and Dracup, J. A.: Drought and Regional Hydrologic Variation in the United States: Associations with the El Niño-Southern Oscillation, Water Resour. Res., 32, 1359–1373, https://doi.org/10.1029/96WR00353, 1996.
Prospero, J. M. and Mayol-Bracero, O. L.: Understanding the Transport and Impact of African Dust on the Caribbean Basin, Bull. Am. Meteorol. Soc., 94, 1329–1337, https://doi.org/10.1175/BAMS-D-12-00142.1, 2013.
Prospero, J. M. and Nees, R. T.: Impact of the North African drought and El Niño on mineral dust in the Barbados trade winds, Nature, 320, 735–738, https://doi.org/10.1038/320735a0, 1986.
Prospero, J. M., Landing, W. M., and Schulz, M.: African dust deposition to Florida: Temporal and spatial variability and comparisons to models, J. Geophys. Res.-Atmos., 115, D13304, https://doi.org/10.1029/2009JD012773, 2010.
Pu, B. and Ginoux, P.: Climatic factors contributing to long-term variations in surface fine dust concentration in the United States, Atmos. Chem. Phys., 18, 4201–4215, https://doi.org/10.5194/acp-18-4201-2018, 2018.
Pu, B. and Jin, Q.: A Record-Breaking Trans-Atlantic African Dust Plume Associated with Atmospheric Circulation Extremes in June 2020, Bull. Am. Meteorol. Soc., 102, E1340–E1356, https://doi.org/10.1175/BAMS-D-21-0014.1, 2021.
Pu, B., Fu, R., Dickinson, R. E., and Fernando, D. N.: Why do summer droughts in the Southern Great Plains occur in some La Niña years but not others?, J. Geophys. Res. Atmos., 121, 1120–1137, https://doi.org/10.1002/2015JD023508, 2016.
Ridley, D. A., Heald, C. L., and Ford, B.: North African dust export and deposition: A satellite and model perspective, J. Geophys. Res.-Atmos., 117, D02202, https://doi.org/10.1029/2011JD016794, 2012.
Sassen, K.: Indirect climate forcing over the western US from Asian dust storms, Geophys. Res. Lett., 29, 103-1–103–4, https://doi.org/10.1029/2001GL014051, 2002.
Schnell, J. L., Holmes, C. D., Jangam, A., and Prather, M. J.: Skill in forecasting extreme ozone pollution episodes with a global atmospheric chemistry model, Atmos. Chem. Phys., 14, 7721–7739, https://doi.org/10.5194/acp-14-7721-2014, 2014.
Séférian, R., Nabat, P., Michou, M., Saint-Martin, D., Voldoire, A., Colin, J., Decharme, B., Delire, C., Berthet, S., Chevallier, M., Sénési, S., Franchisteguy, L., Vial, J., Mallet, M., Joetzjer, E., Geoffroy, O., Guérémy, J.-F., Moine, M.-P., Msadek, R., Ribes, A., Rocher, M., Roehrig, R., Salas-y-Mélia, D., Sanchez, E., Terray, L., Valcke, S., Waldman, R., Aumont, O., Bopp, L., Deshayes, J., Éthé, C., and Madec, G.: Evaluation of CNRM Earth System Model, CNRM-ESM2-1: Role of Earth System Processes in Present-Day and Future Climate, J. Adv. Model. Earth Syst., 11, 4182–4227, https://doi.org/10.1029/2019MS001791, 2019.
Seland, Ø., Bentsen, M., Olivié, D., Toniazzo, T., Gjermundsen, A., Graff, L. S., Debernard, J. B., Gupta, A. K., He, Y.-C., Kirkevåg, A., Schwinger, J., Tjiputra, J., Aas, K. S., Bethke, I., Fan, Y., Griesfeller, J., Grini, A., Guo, C., Ilicak, M., Karset, I. H. H., Landgren, O., Liakka, J., Moseid, K. O., Nummelin, A., Spensberger, C., Tang, H., Zhang, Z., Heinze, C., Iversen, T., and Schulz, M.: Overview of the Norwegian Earth System Model (NorESM2) and key climate response of CMIP6 DECK, historical, and scenario simulations, Geosci. Model Dev., 13, 6165–6200, https://doi.org/10.5194/gmd-13-6165-2020, 2020.
Senior, C. A., Jones, C. G., Wood, R. A., Sellar, A., Belcher, S., Klein-Tank, A., Sutton, R., Walton, J., Lawrence, B., Andrews, T., and Mulcahy, J. P.: U.K. Community Earth System Modeling for CMIP6, J. Adv. Model. Earth Syst., 12, e2019MS002004, https://doi.org/10.1029/2019MS002004, 2020.
Sheen, K. L., Smith, D. M., Dunstone, N. J., Eade, R., Rowell, D. P., and Vellinga, M.: Skilful prediction of Sahel summer rainfall on inter-annual and multi-year timescales, Nat. Commun., 8, 14966, https://doi.org/10.1038/ncomms14966, 2017.
Svoboda, M., LeComte, D., Hayes, M., Heim, R., Gleason, K., Angel, J., Rippey, B., Tinker, R., Palecki, M., Stooksbury, D., Miskus, D., and Stephens, S.: The drought monitor, Bull. Am. Meteorol. Soc., 83, 1181–1190, https://doi.org/10.1175/1520-0477-83.8.1181, 2002.
Tatebe, H., Ogura, T., Nitta, T., Komuro, Y., Ogochi, K., Takemura, T., Sudo, K., Sekiguchi, M., Abe, M., Saito, F., Chikira, M., Watanabe, S., Mori, M., Hirota, N., Kawatani, Y., Mochizuki, T., Yoshimura, K., Takata, K., O'ishi, R., Yamazaki, D., Suzuki, T., Kurogi, M., Kataoka, T., Watanabe, M., and Kimoto, M.: Description and basic evaluation of simulated mean state, internal variability, and climate sensitivity in MIROC6, Geosci. Model Dev., 12, 2727–2765, https://doi.org/10.5194/gmd-12-2727-2019, 2019.
Tegen, I., Lacis, A. A., and Fung, I.: The influence on climate forcing of mineral aerosols from disturbed soils, Nature, 380, 419–422, https://doi.org/10.1038/380419a0, 1996.
Tong, D. Q., Wang, J. X. L., Gill, T. E., Lei, H., and Wang, B.: Intensified dust storm activity and Valley fever infection in the southwestern United States, Geophys. Res. Lett., 44, 4304–4312, https://doi.org/10.1002/2017GL073524, 2017.
VanCuren, R. A. and Cahill, T. A.: Asian aerosols in North America: Frequency and concentration of fine dust, J. Geophys. Res.-Atmos., 107, AAC 19-1–AAC 19-16, https://doi.org/10.1029/2002JD002204, 2002.
van Noije, T., Bergman, T., Le Sager, P., O'Donnell, D., Makkonen, R., Gonçalves-Ageitos, M., Döscher, R., Fladrich, U., von Hardenberg, J., Keskinen, J.-P., Korhonen, H., Laakso, A., Myriokefalitakis, S., Ollinaho, P., Pérez García-Pando, C., Reerink, T., Schrödner, R., Wyser, K., and Yang, S.: EC-Earth3-AerChem: a global climate model with interactive aerosols and atmospheric chemistry participating in CMIP6, Geosci. Model Dev., 14, 5637–5668, https://doi.org/10.5194/gmd-14-5637-2021, 2021.
Visbeck, M. H., Hurrell, J. W., Polvani, L., and Cullen, H. M.: The North Atlantic Oscillation: Past, present, and future, P. Natl. Acad. Sci., 98, 12876–12877, https://doi.org/10.1073/pnas.231391598, 2001.
Wang, C.: Variability of the Caribbean Low-Level Jet and its relations to climate, Clim. Dyn., 29, 411–422, https://doi.org/10.1007/s00382-007-0243-z, 2007.
Wang, Y., Xie, Y., Dong, W., Ming, Y., Wang, J., and Shen, L.: Adverse effects of increasing drought on air quality via natural processes, Atmos. Chem. Phys., 17, 12827–12843, https://doi.org/10.5194/acp-17-12827-2017, 2017.
Wu, T., Zhang, F., Zhang, J., Jie, W., Zhang, Y., Wu, F., Li, L., Yan, J., Liu, X., Lu, X., Tan, H., Zhang, L., Wang, J., and Hu, A.: Beijing Climate Center Earth System Model version 1 (BCC-ESM1): model description and evaluation of aerosol simulations, Geosci. Model Dev., 13, 977–1005, https://doi.org/10.5194/gmd-13-977-2020, 2020.
Yu, H., Tan, Q., Zhou, L., Zhou, Y., Bian, H., Chin, M., Ryder, C. L., Levy, R. C., Pradhan, Y., Shi, Y., Song, Q., Zhang, Z., Colarco, P. R., Kim, D., Remer, L. A., Yuan, T., Mayol-Bracero, O., and Holben, B. N.: Observation and modeling of the historic “Godzilla” African dust intrusion into the Caribbean Basin and the southern US in June 2020, Atmos. Chem. Phys., 21, 12359–12383, https://doi.org/10.5194/acp-21-12359-2021, 2021.
Yuan, T., Yu, H., Chin, M., and Remer, L.: Future Decline of African Dust: Insights from the Recent Past and Paleo-records, ArXiv [preprint], arXiv:1804.07188, 2018.
Yukimoto, S., Kawai, H., Koshiro, T., Oshima, N., Yoshida, K., Urakawa, S., Tsujino, H., Deushi, M., Tanaka, T., Hosaka, M., Yabu, S., Yoshimura, H., Shindo, E., Mizuta, R., Obata, A., Adachi, Y., and Ishii, M.: The Meteorological Research Institute Earth System Model Version 2.0, MRI-ESM2.0: Description and Basic Evaluation of the Physical Component, J. Meteorol. Soc. Jpn. Ser II, 97, 931–965, https://doi.org/10.2151/jmsj.2019-051, 2019.
Zuidema, P., Alvarez, C., Kramer, S. J., Custals, L., Izaguirre, M., Sealy, P., Prospero, J. M., and Blades, E.: Is Summer African Dust Arriving Earlier to Barbados? The Updated Long-Term In Situ Dust Mass Concentration Time Series from Ragged Point, Barbados, and Miami, Florida, Bull. Am. Meteorol. Soc., 100, 1981–1986, https://doi.org/10.1175/BAMS-D-18-0083.1, 2019.