the Creative Commons Attribution 4.0 License.
the Creative Commons Attribution 4.0 License.
 | 18 Jan 2022
Reassessment of the radiocesium resuspension flux from contaminated ground surfaces in eastern Japan
Akira Watanabe
Masahide Ishizuka
Kazuyuki Kita
Yuji Zaizen
Takeshi Kinase
Rikuya Hirai
Kakeru Konnai
Akane Saya
Kazuki Iwaoka
Yoshitaka Shiroma
Hidenao Hasegawa
Naofumi Akata
Masahiro Hosoda
Shinji Tokonami
Yasuhito Igarashi
Resuspension of 137Cs from the contaminated ground surface to the atmosphere is essential for understanding the environmental behaviors of 137Cs and estimating external and inhalation exposure of residents. Kajino et al. (2016) assessed the 137Cs resuspension flux from bare soil and forest ecosystems in eastern Japan in 2013 using a numerical simulation constrained by surface air concentration measurements. However, the simulation was found to underestimate the observed deposition amounts by 2 orders of magnitude. The reason for this underestimation is that the simulation assumed that resuspended 137Cs is carried by submicron aerosols, which have low deposition rates. Based on the observational indications that soil dust and bioaerosols are the major carriers of resuspended 137Cs, a new simulation is performed with higher deposition rates constrained by both surface concentrations and deposition amounts. In the new estimation, the total areal annual resuspension of 137Cs in 2013 is 25.7 TBq, which is equivalent to 0.96 % of the initial deposition (2.68 PBq). Due to the rapid deposition rates, the annual redeposition amount is also large at 10.6 TBq, approximately 40 % of the resuspended 137Cs. The resuspension rate through the atmosphere (0.96 % yr−1) seems slow, but it (2.6 × 10⁻⁵ d−1) may not be negligibly small compared to the actual decreasing trend of the ambient gamma dose rate obtained in Fukushima Prefecture after the radioactive decay of 137Cs plus 134Cs in 2013 is subtracted (1.0–7.9 × 10⁻⁴ d−1): resuspension can account for 1 %–10 % of the decreasing rate due to decontamination and natural decay through land surface processes. The current simulation underestimated the 137Cs deposition in Fukushima city in winter by more than an order of magnitude, indicating the presence of additional resuspension sources. The site of Fukushima city is surrounded by major roads. Heavy traffic on wet and muddy roads after snow removal operations could generate superlarge (approximately 100 µm in diameter) road dust or road salt particles, which are not included in the model but might contribute to the observed 137Cs at the site.
- Article
(6610 KB) - Full-text XML
-
Supplement
(1409 KB) - BibTeX
- EndNote


More than 10 years have passed since the Fukushima Daiichi Nuclear Power Plant (F1NPP) accident. Extensive studies have been performed thus far using field observations, laboratory experiments, and numerical simulations aiming at a full understanding of atmospheric dispersion and deposition of directly emitted radionuclides associated with the accident, which occurred in March 2011 (i.e., primary emission). It is difficult to cite all relevant papers here, so one can refer to review papers such as Mathieu et al. (2018), but a few remarkable studies are introduced here with some updates. Aircraft monitoring studies (NRA, 2012; Torii et al., 2012, 2013; Sanada et al., 2014) have provided the spatial distributions of radio-Cs and radio-I that were deposited to the ground surface in March 2011 over all of Japan. Tsuruta et al. (2014) and Oura et al. (2015) measured the hourly surface air activity concentrations of 137Cs at 99 stations in eastern Japan. These two powerful spatiotemporal measurement datasets together with comprehensive emission scenarios provided by the Japan Atomic Energy Agency (e.g., Katata et al., 2015; Terada et al., 2020) enable us to identify transport and deposition events over the land surface in Japan (e.g., Tsuruta et al., 2014; Nakajima et al., 2017; Sekiyama and Iwasaki, 2018). These data were also useful to validate the numerical simulation results provided by various regional-scale atmospheric models (Draxler et al., 2015; Leadbetter et al., 2015; Kitayama et al., 2018; Sato et al., 2018, 2020; Kajino et al., 2019; Goto et al., 2020) and were applied for other advanced numerical techniques, such as inverse modeling (Yumimoto et al., 2016; Li et al., 2019), ensemble forecasting (Sekiyama et al., 2021), and data assimilation (Sekiyama and Kajino, 2020).
In addition to spatiotemporal observations, detailed measurements have been helpful to investigate the mechanisms of atmospheric deposition and emissions from reactors. Kaneyasu et al. (2012) used size distribution measurements of multiple chemical components obtained in April and May 2011 to indicate that submicron sulfate aerosols can be a major carrier of radio-Cs, and in fact, numerical simulations assuming hydrophilic submicron carrier aerosols have been successful (all models mentioned above made this assumption). On the other hand, Adachi et al. (2013) isolated hydrophobic supermicron Cs-bearing particles (referred to as Cs-bearing microparticles; CsMPs) from aerosol filters collected in March 2011; the atmospheric behaviors of these CsMPs could be quite different from those of hydrophilic submicron particles. Detailed analyses of CsMPs are helpful for understanding emission events and mechanisms (Igarashi et al., 2019a; Kajino et al., 2021) and deposition processes (Dépée et al., 2019). Altitude-dependent measurements obtained on mountains (Hososhima and Kaneyasu, 2014; Sanada et al., 2018) have revealed the importance of cloud deposition over mountainous forests in eastern Japan. Even though the cloud deposition process is not included in almost all models, its importance has been inferred from some numerical simulations (Katata et al., 2015; Kajino et al., 2019).
A great number of numerical studies have been conducted for primary emissions, but only one numerical study (Kajino et al., 2016, hereinafter K16) has been performed on the atmospheric dispersion and deposition of radionuclides that have been resuspended from contaminated ground surfaces (secondary emissions). For primary emissions, the emission point is known, and many emission events can be identified, whereas for secondary emissions, the emission mechanisms are unknown, and the ground surfaces (as emission sources) are highly heterogeneous. It is impossible to measure radio-Cs resuspension fluxes from every ground surface, but knowledge has been accumulated from long-term atmospheric measurements recorded at several locations. Ochiai et al. (2016) showed that the surface concentrations of 137Cs were high in summer and low in winter in the contaminated forest area in the Abukuma Highlands. Ochiai et al. (2016) also showed that the temporal variations in fine-mode (<1.1 µm in diameter) and coarse-mode (>1.1 µm) 137Cs behaved differently by season, indicating that the major emission sources could be different between winter and summer. Nakagawa et al. (2018) conducted size-resolved n-alkane and 137Cs measurements in similar forest areas and concluded that among biogenic emission sources, epicuticular wax is less likely and bioaerosols such as pollen and fungal spores are more likely. Based on long-term measurements taken in the same forest area, Kinase et al. (2018) indicated the association of mineral dust in late spring and bioaerosols in summer and autumn. Kinase et al. (2018) also found that the contribution of the forest fires that occurred in March 2013 to the surface 137Cs concentrations was negligibly small. Kinase et al. (2018) reported that the surface concentration of 137Cs was positively correlated with the surface wind speed in winter but not in summer. Igarashi et al. (2019b) further investigated the possible sources of 137Cs-rich bioaerosols in summer and suggested the substantial involvement of fungal spores. Atmospheric humidity plays a key role in the discharge of fungal spores, which is consistent with the findings of Kita et al. (2020), who stated that the surface concentration of 137Cs in mountainous forests became higher in the presence of precipitation in summer. Cedar pollen particles could contain a considerable amount of 137Cs in the forest areas of Abukuma Highlands, but they are emitted from late February to early May and not during summer (Igarashi et al., 2019b). In fact, the number of pollen particles was of the number of bacteria (including spores) or less in summer (Kinase et al., 2018; Igarashi, 2021).
The numerical simulations conducted by K16 were consistent with the findings described above: the surface concentrations in the mountainous forest area are low in winter and high in summer, the contributions of mineral dust are high in winter, and those of bioaerosols are high in summer. However, Watanabe et al. (2021) found that the simulations of K16 underestimated the observed deposition amounts by approximately 2 orders of magnitude. The major reason for this large discrepancy in deposition is the incorrect assumption of the physical properties of resuspended 137Cs by K16. K16 constrained the deposition efficiency of 137Cs in their simulations to be consistent with the primary emission period (March 2011), which involved submicron carriers; however, based on the above-described measurements, the major carriers of resuspended 137Cs should be much larger. In the current study, the deposition efficiency of 137Cs in the simulation is constrained to be consistent with the measured concentration and deposition amounts in the resuspension period (i.e., 2013). The regional budgets of 137Cs are thoroughly reassessed using more realistic model configurations, and the differences between the old and current estimates are clearly compared in this study.
2.1 Observation data
To constrain the deposition rates and resuspension fluxes used in the simulations, activity measurement data containing surface concentrations and deposition amounts at three observation sites, one in a contaminated forest (Namie, Tsushima), one in an urban/rural area near the contaminated forest (Fukushima), and one in a downwind location (Tsukuba), are used (Fig. 1).
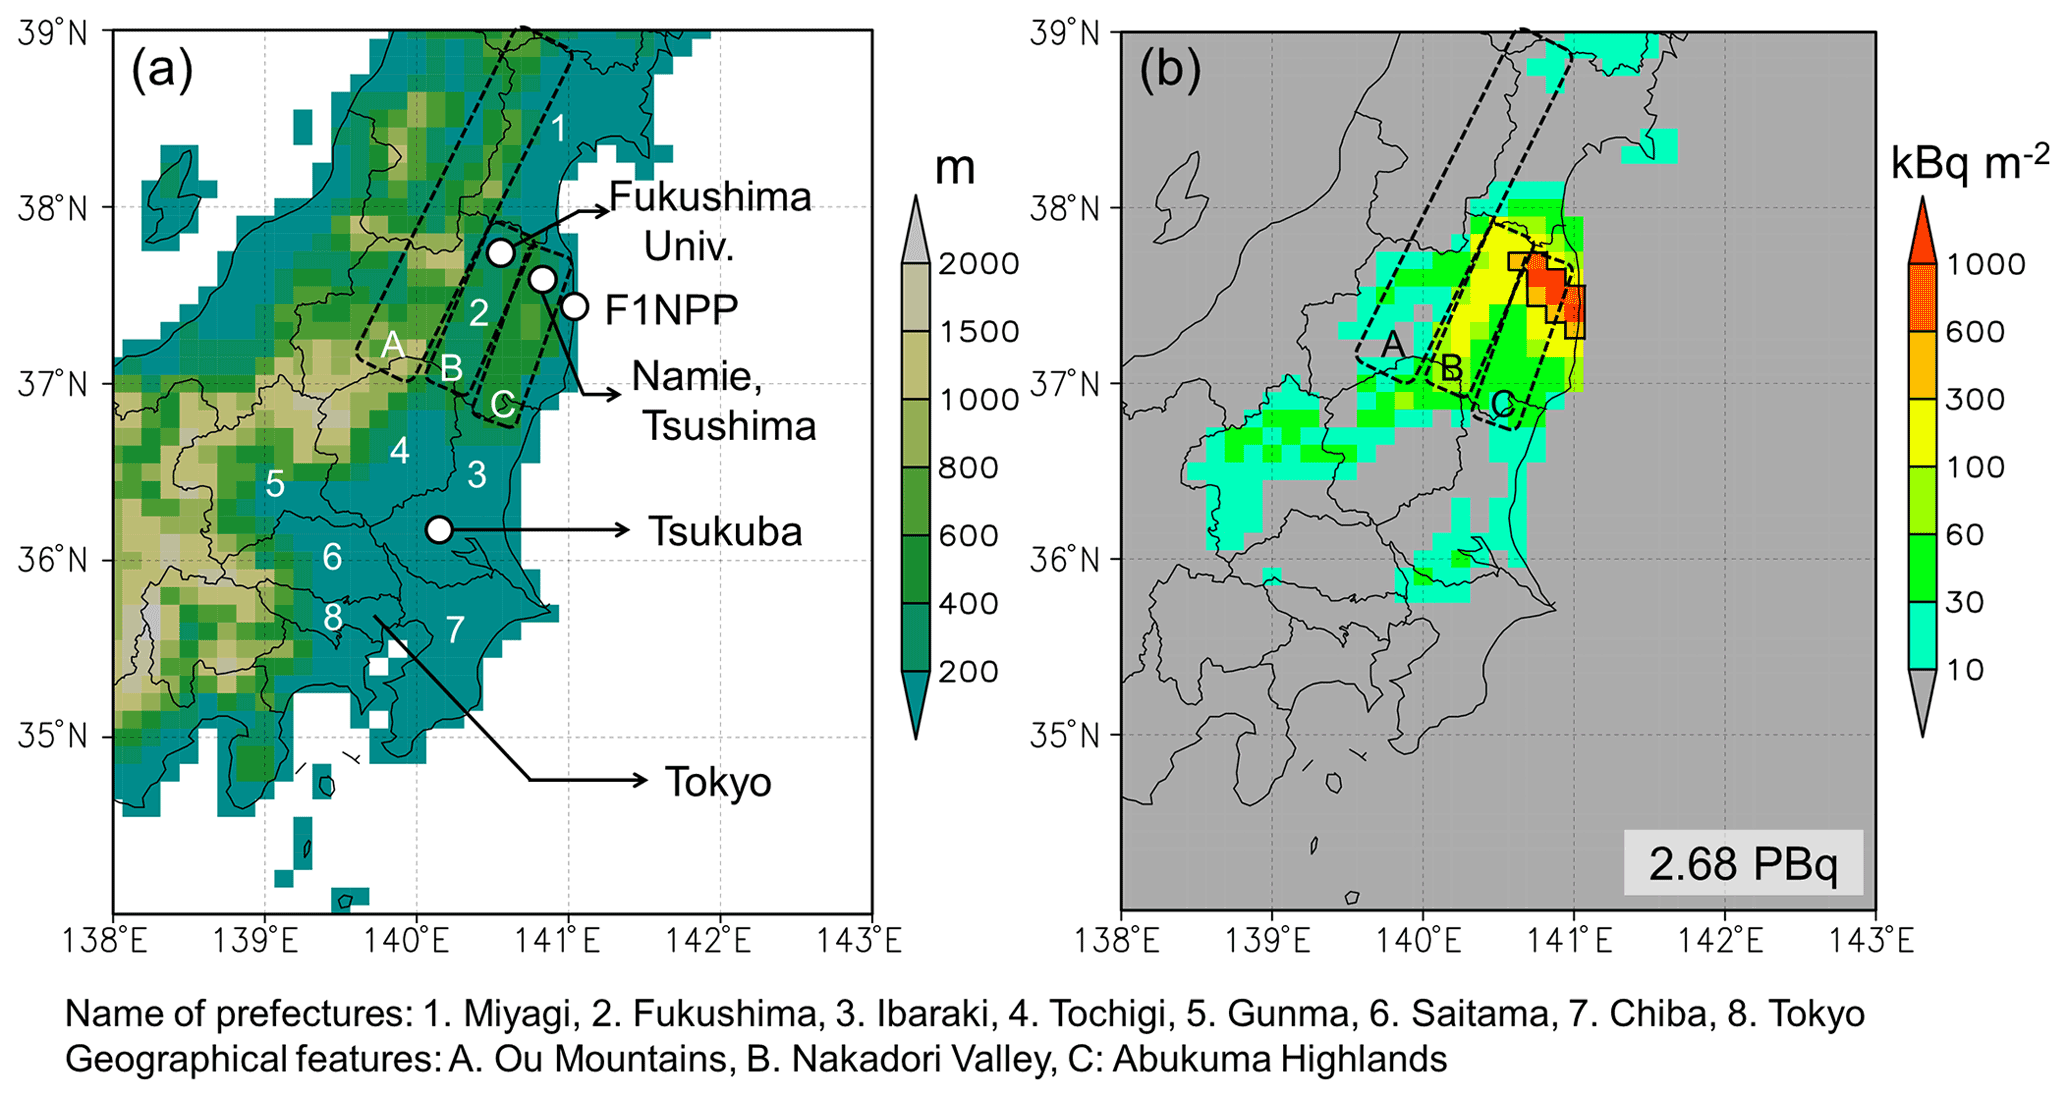
Figure 1(a) Model domain (Δ longitude = 0.125∘ and Δ latitude = 0.1∘), terrestrial elevations, major locations, and names of prefectures and geographical features. (b) Initial deposition amounts of 137Cs measured by aircraft (NRA, 2012) and used as boundary conditions for the simulation. The decay correction for the observation was made for March–May 2012, depending on the regions. The area surrounded by the black solid line is defined as the resuspension source area (>300 kBq m−2) in the source–receptor analysis presented in Sect. 3.2. The total areal amount is embedded at the bottom right of the panel.
The Namie (Tsushima) site is approximately 30 km northwest of the F1NPP, located in the difficult-to-return zone (DRZ; >50 mSv yr−1), and is surrounded by forests in the Abukuma Highlands. The center of Namie town is located near the coast of the Pacific Ocean, but the observation site is surrounded by mountainous forests. Thus, to avoid confusion, the site is denoted as Namie (Tsushima) throughout the paper. The initial deposition amount indicated by the airborne measurements was 2300 kBq m−2 (Fig. 1b), and decontamination work was not conducted in 2013. The locations at which the surface concentration measurements and deposition measurements are taken are different but are very close to each other (the direct distance is approximately 400 m). The concentration measurements were conducted in the schoolyard of a high school (37.562∘ N, 140.768∘ E) (Ishizuka et al., 2017; Kinase et al., 2018), and the deposition measurements were made by Fukushima Prefecture at the Tsushima Screening Site (37.561∘ N, 140.765∘ E) (data available at https://www.pref.fukushima.lg.jp/site/portal/genan225.html, last access: 30 June 2021). Aerosols are collected by high-volume air samplers at a height of 1.2 m from ground level, and deposition samples are collected by a plastic tray. The gamma rays from the samples are measured by high-purity germanium detectors. The sampling intervals of the concentration and deposition measurements at this site are 1–2 d and 1 month, respectively.
The Fukushima site is in Fukushima city, located approximately 60 km northwest of the F1NPP. The Fukushima site is located in the Fukushima Basin in the Nakadori Valley, surrounded by the Ōu Mountains (the peaks of which are 1000–2000 m in elevation) to the west and the Abukuma Highlands (the peaks of which are mostly lower than 1000 m in elevation) to the east (Fig. 1). The concentration and deposition measurements are conducted at Fukushima University (37.68∘ N, 140.45∘ E) (Watanabe et al., 2021). Fukushima University is located on a small hill at the southern edge of the Fukushima Basin and is surrounded by major roads. The distances from Route 4 and national highway E4 to the university are shorter than 1 km. The land use type of the site is characterized as urban/rural. The initial deposition amount indicated by the airborne measurement was 190 kBq m−2 (Fig. 1b), which is 1 order of magnitude smaller than that at the Namie (Tsushima) site. Decontamination was conducted in 2013 in Fukushima city, and almost 90 % of decontamination was completed for agricultural fields and public facilities by March 2014 (Watanabe et al., 2021). The achievement ratios of decontamination for other land use types are 50 %, 9 %, and 5 % for residential areas, roads, and forests (only removal of shrub and litter layers in areas within 20 m from the forest edges), respectively (Watanabe et al., 2021). Aerosols are collected by high-volume air samplers, and deposition samples are collected by a precipitation sampler, placed on the roof of a building at Fukushima University at a height of 25 m from ground level. The gamma rays from the samples are measured by high-purity germanium detectors. The sampling intervals of the concentration and deposition measurements at this site are 3 d and 1 month, respectively (Watanabe et al., 2021).
The Tsukuba site is located in Tsukuba city, Ibaraki Prefecture, approximately 170 km southwest of the F1NPP. It is located in the eastern part of the Kantō Plain, the most populated area in Japan. The concentrations and deposition amounts were measured at the Meteorological Research Institute (MRI) (36.06∘ N, 140.13∘ E) (Igarashi et al., 2015). The initial deposition amount was 21 kBq m−2 (Fig. 1b), which is 1 order of magnitude smaller than that at the Fukushima site and 2 orders of magnitude smaller than that at the Namie (Tsushima) site. Decontamination was not conducted in most of the areas around this site due to the low ambient gamma dose rates. Aerosols are collected by high-volume air samplers at a height of 1.2 m from ground level, and deposition samples are collected by a plastic tray placed on the roof of a six-story building at MRI. The gamma rays from the samples are measured by high-purity germanium detectors. The sampling intervals of the concentration and deposition measurements at this site are 1 week and 1 month, respectively (Igarashi et al., 2015).
Note that the heights of the concentration measurements are different: 1.2 m for Namie (Tsushima) and Tsukuba and 25 m for Fukushima. The heights of deposition measurements are also different: near the ground surface for Namie (Tsushima) but the roofs of buildings for Tsukuba and Fukushima. Concentration and deposition values can vary depending on the height of the observation. It is difficult to quantify vertical differences due to the lack of vertical measurements. However, this difference should be considered to explain the data discrepancy between different sampling locations.
The locations, geographical features, and airborne-measured initial deposition amounts of these sites are visualized using Google Earth in the Supplement Sect. S1.
2.2 Numerical simulations
The Lagrangian model (LM) developed by K16 was used in this study. Thus far, a cumulus convection parameterization of Emanuel and Živković-Rothman (1999) has been implemented in the model. The model description and simulation setup used in this study are identical to those of K16, except the cumulus convection parameterization, but are briefly repeated in this section. The differences of simulations with and without the cumulus convection are presented later in Fig. 10 in Sect. 3.4. The deviations between the original 1-D Eulerian convection model and the 1-D Lagrangian convection model developed in the current study are summarized in Supplement Sect. S2 for evaluation of the convection scheme implemented in 3-D LM. The LM considers the advection, turbulent diffusion, gravitational settling, dry deposition, and wet deposition of atmospheric constituents. In the case of radionuclides, radioactive decay is also considered. The simulation setup is summarized in Table 1. As shown in Fig. 1a, the model domain covers the eastern part of Japan, from 34–39∘ N and from 138–143∘ E, with the same horizontal resolutions (Δx is approximately 11 km; Δ longitude = 0.125∘ and Δ latitude = 0.1∘) as the meteorological analysis data, the grid point value mesoscale model (GPV-MSM) of the Japan Meteorological Agency (JMA) (https://www.jma.go.jp/jma/en/Activities/nwp.html, last access: 11 November 2021). The GPV-MSM provides data for meteorological variables with 3-hourly resolution on the surface and at 16 vertical layers from 1000 to 100 hPa. No meteorological models are applied to simulate finer-scale phenomena or to obtain detailed meteorological variables such as turbulent diffusivities or mixing ratios of hydrometeors. The fundamental variables such as the wind field, temperature, humidity, geopotential height, and surface precipitation rate obtained from the meteorological analysis data are interpolated spatiotemporally and applied to simulate the locations and masses (or activity) carried by Lagrangian particles. The output resolutions can be set independently of the meteorological input data. The model top level is set as 500 hPa, but the grid box mean activity concentrations are obtained at heights above ground level up to 3000 m. The full simulation period is from 1 December 2012 to 1 January 2014, including a spin-up period of 1 month: the analysis period is the full year of 2013, from 1 January 2013 to 1 January 2014.
2.2.1 Deposition schemes
The key parameters used in this study are introduced below using equations. The LM does not include comprehensive deposition schemes; deposition processes are simply parameterized. The wet scavenging rate Λwet (s−1) is expressed as a function of the surface precipitation rate P (mm s−1) as follows:
where Ec is the collection efficiency of aerosols by the hydrometeor and am and rm are the mean radii of the hydrometeor and aerosols, respectively. Empirically, am is characterized by P as am=0.35 P0.25. Ec is a function of am and rm, but, practically, a single constant value is used for each simulation. Equation (1) is applied for all types of wet deposition. The differences among rain, snow, and graupel precipitation and the differences between in-cloud and below-cloud scavenging are not considered.
The dry scavenging rate Λwet (s−1) is expressed as follows:
where z is the height of Lagrangian particles, zsrf is the surface layer height set as 100 m in this study, and vd is the dry deposition velocity. vd depends on aerosol sizes and surface conditions such as wind speed, roughness, and land use types, but a single constant value is applied in this study. We only consider the difference in vd over the land and the ocean; vd over the ocean is 0.1 times smaller than that over the land (K16).
Fog or cloud deposition plays a key role in the deposition of 137Cs over the mountains in eastern Japan (Hososhima and Kaneyasu, 2015; Katata et al., 2015; Sanada et al., 2018; Kajino et al., 2019; Imamura et al., 2020) but is not considered in the study because the GPV-MSM product does not provide fog data (or cloud water in the bottom layers of the model grid boxes).
In K16, we determined an Ec value of 0.04 and a vd over-land (simply referred to as vd hereinafter) value of 0.1 cm s−1, so the initial deposition amount of 137Cs over land (2.53 PBq) simulated using the emission scenario of Katata et al. (2015) was closest to that observed (2.68 PBq; see Fig. 1b) among the various sensitivity simulations. However, the major carriers of 137Cs during primary emissions (i.e., the direct emissions associated with the nuclear accident) are submicron particles (several 100 nm in diameter, e.g., Kaneyasu et al., 2012); thus, the optimized deposition parameters are valid for these submicron particles. However, the major carriers of 137Cs resuspended from the ground surface could be supermicron particles such as soil dust and bioaerosols (from 1 to several tens of micrometers in diameter, e.g., Ishizuka et al., 2017; Kinase et al., 2018); thus, the deposition parameters should be much larger. In this study, Ec and vd are substantially improved compared to those used in K16, as is extensively described later in Sect. 2.3.
2.2.2 Resuspension schemes
K16 considered three emission sources during the analysis period of 2013: resuspension from bare soil, resuspension from forest ecosystems, and additional emissions from the reactor buildings of the F1NPP. K16 simulated the contributions from these additional emissions, and resulting activity concentrations were 2 to 3 orders of magnitude smaller than the observed surface activity concentrations; these contributions were thus neglected in this study. The emission flux of 137Cs carried by dust aerosols from a bare soil surface, Fdust (Bq m−2 s−1), is formulated by Ishizuka et al. (2017) as follows:
where p20 µm is the surface area fraction of dust particles smaller than 20 µm in diameter against soil containing a maximum particle size of 2 mm and varies depending on the soil texture (1.3 × 10⁻⁸ for sand, 0.19 for loamy sand, 0.45 for sandy loam, and 0.80 for silt loam), FM is the total dust mass flux (kg m−2 s−1) as a function of the friction velocity , Loosemore and Hunt, 2002), fforest is the forest areal fraction, and B5 mm(t) is the specific radioactivity of the surface soil (from the surface to a depth of 5 mm; Bq kg−1) as a function of time considering radioactive decay. Changes in the vertical profiles of 137Cs due to land surface processes or decontamination are not considered in the study. The fforest value is obtained from the Weather Research and Forecasting Model version 3 database (WRFV3; Skamarock et al., 2008). Equation (3) was developed based on measurements taken in a schoolyard, so it may not be applicable for every soil surface type. For simplicity, we introduce the constant correction factor Cconst to adjust the simulated 137Cs in dust aerosols to the observed value. Cconst was set to five in K16. This adjustment factor differs in this study because a larger adjustment factor is required to sustain the observed surface concentration levels for faster deposition rates, as shown later in Sect. 2.3.
The resuspension flux of 137Cs from forest ecosystems (regarded as forest aerosols), Fforest (Bq m−2 s−1), is formulated by K16 as follows:
where fgreen is the monthly mean green area fraction, rconst is the constant resuspension coefficient (s−1), Bobs is the observed initial deposition amount (Bq m−2, Fig. 1b), and Rdecay(t) is the radioactive decay. fgreen is obtained from the WRFV3 database and was originally derived from Advanced Very High Resolution Radiometer (AVHRR) normalized difference vegetation index (NDVI) data (https://www.usgs.gov/core-science-systems/eros/phenology/science/ndvi-avhrr, last access: 11 November 2021). rconst is the adjustment parameter and was set as 10−7 h−1 in K16 for adjustment to the observed surface concentrations in the forests in summer. Similar to the dust aerosol case, a larger adjustment factor is required due to the faster deposition rates to sustain the simulated surface concentrations close to the observed values, as is shown later in Sect. 2.3. Similar to the dust aerosol case, no 137Cs migration within the local forest ecosystems due to land surface processes is considered in the formulation.
For both the dust and forest aerosol cases, only emissions from the grid boxes in which the mean initial deposition amounts exceed 10 kBq m−2, the detection limit of the airborne measurements, are considered (NRA, 2012). However, horizontal interpolation from the original grid boxes to the LM grid boxes can convert values slightly above the detection limit to less than 10 kBq m−2. Thus, a sensitivity test is performed to additionally consider areas with deposition amounts of 1–10 kBq m−2 as emission sources, as is presented in Sect. 3.4.
Other sources, such as the unexpected releases associated with the debris removal operations at the F1NPP site that occurred in August 2013 (NRA, 2014; Steinhauser et al., 2015; K16), forest fires, and resuspension due to decontamination work, are not considered in the study. The debris removal operations caused a sporadic peak in the surface concentrations (60.4 mBq m−3 from 13:00 LT on 14 August to 13:00 LT on 15 August at Namie (Tsushima), Fig. 4a and b), but these elevated values may not affect the background (or steady state) concentrations for the full year, which are the target of this study. Forest fires may not be a major source of 137Cs resuspension in Fukushima because the temporal variations in levoglucosan concentrations were not found to be associated with those of 137Cs (Kinase et al., 2018). Resuspension due to decontamination work should be considered, but it was hard to estimate because the emission factor and the precise location and time of decontamination are unknown. It should be noted here that, as described in Sect. 2.1, decontamination was not performed around the Namie (Tsushima) or Tsukuba sites, but decontamination might have been performed around the Fukushima site in 2013.
2.3 Constrained deposition parameters and emission flux adjustments based on field observation data
2.3.1 Constraint of modeled deposition parameters
Since K16 was published, several emission sources of resuspended 137Cs have been indicated, such as soil dust (Ishizuka et al., 2017; Kinase et al., 2018) and bioaerosols (Kinase et al., 2018; Nakagawa et al., 2018; Igarashi et al., 2019b; Kita et al., 2020; Minami et al., 2020; Igarashi, 2021), but the relative contributions of these sources, the spatiotemporal variations in the associated emission fluxes, and their size distributions are still not well understood. Kita et al. (2020) indicated the associations of rain with fungal spore emissions, and Minami et al. (2020) estimated the emission flux of 137Cs associated with bioaerosols; however, the emission flux has not yet been formulated as a function of meteorological or land surface variables. Therefore, the same formulations as those applied in K16 (Eqs. 3 and 4) are used in this study. It is also noted here that the same deposition rates are applied for both dust and forest aerosols, even though the size distributions of these two aerosol types should be different.
K16 had two major drawbacks: (1) K16 constrained the deposition parameters (i.e., Ec and vd) by using the primary 137Cs emission and initial 137Cs deposition amounts measured in March 2011, and (2) K16 did not compare their simulation results against the deposition amounts. Recently, Watanabe et al. (2021) evaluated the performance of the K16 model using concentrations and deposition amounts measured at the Fukushima site and found that the seasonal variations in simulated concentrations were opposite to those observed and that the simulated deposition amounts were underestimated by 1 to 2 orders of magnitude. The reason for this underestimation of the deposition amounts is obvious; the typical deposition rates of major carrier aerosols (submicron aerosols) of K16 are much smaller than those of soil dust and bioaerosols (supermicron aerosols). For example, the dry deposition velocities of aerosols with diameters of approximately 10 µm are 2 to 3 orders of magnitude larger than those of aerosols with diameters of approximately 0.1–1 µm (e.g., Petroff and Zhang, 2010). The difference between these two size ranges for below-cloud scavenging due to rain is also 2 to 3 orders of magnitude (e.g., Wang et al., 2010). To constrain the deposition parameters suitable for 137Cs resuspension, we performed a climatological deposition velocity analysis similar to that conducted by Watanabe et al. (2021).
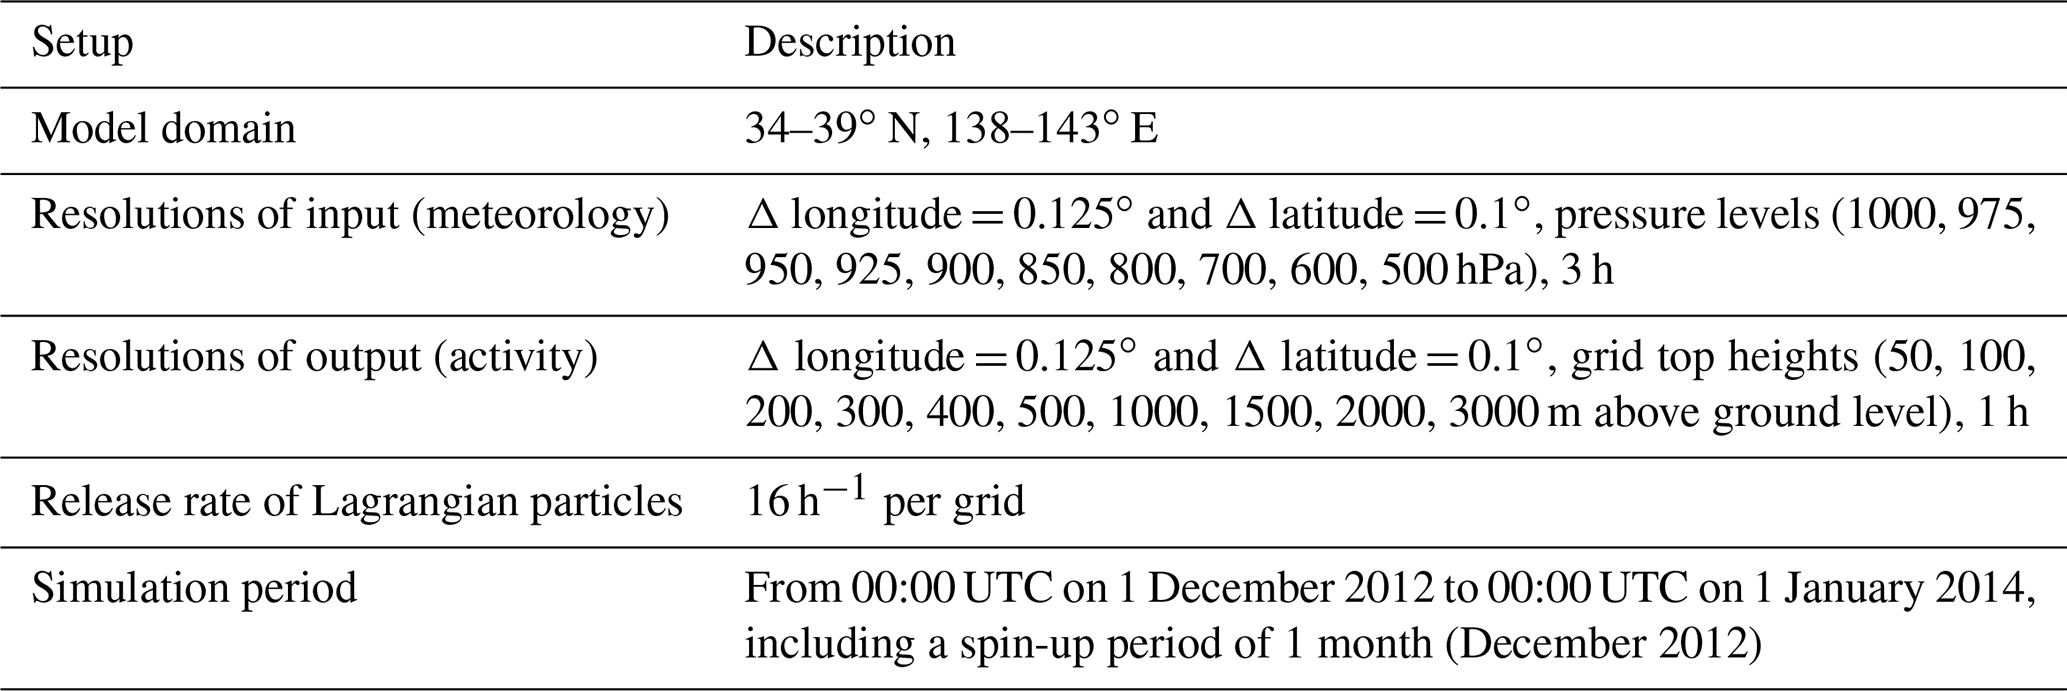
Suppose there is a simple nonlinear relationship between the periodic mean deposition flux (D) (Bq m−2 s−1, for example) and periodic mean surface concentration (C) (Bq m−3):
where a represents the removal rate and b represents nonlinear features such as spatial and temporal variabilities. If b=1, the unit of a is meters per second (m s−1), which is of the dimension of the deposition velocity. If long-term averaging is conducted, Eq. (5) may hold. Equation (5) is reformulated as follows:
A log–log scatter plot between the monthly mean surface concentrations and monthly cumulative depositions is shown in Fig. 2. The purple, orange, and green symbols indicate the observations, simulations by K16 (Ec=0.04 and vd=0.1 cm s−1), and simulations conducted in this study (Ec=0.4 and vd=10 cm s−1). The intercept of the y axis indicates the deposition velocity. Among the several sensitivity tests with the combinations of Ec=0.04 and 0.4 and vd=0.1, 1, and 10 cm s−1, the y-axis intercept of the simulation with Ec=0.4 and vd=10 cm s−1 matched best with that of the observations.
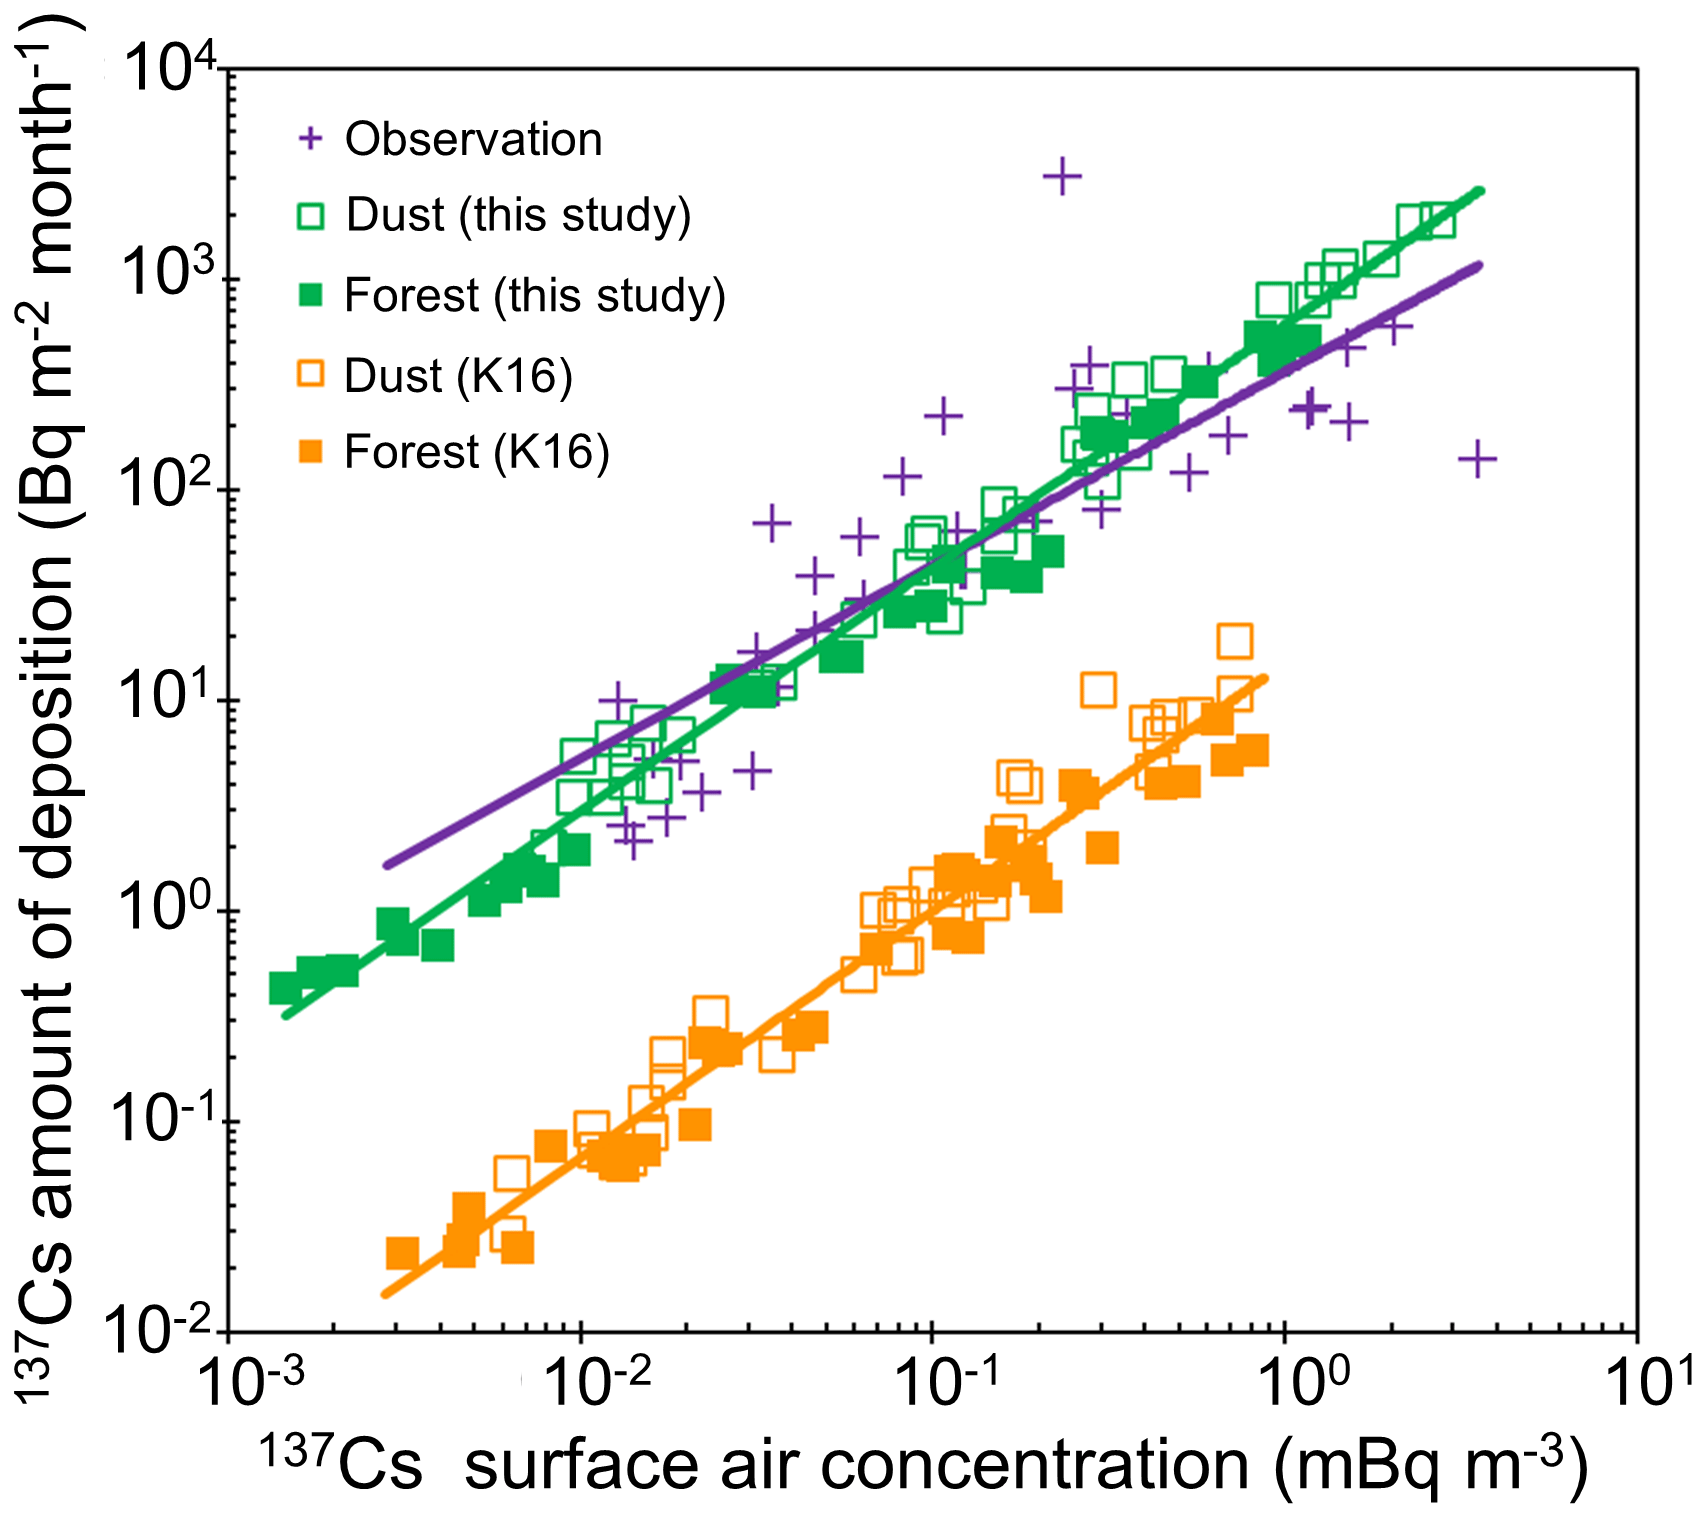
Figure 2Scatter diagram of the depositions of 137Cs over the monthly mean (purple crosses) observed surface concentrations at Namie (Tsushima), Fukushima, and Tsukuba in 2013 and those simulated by Kajino et al. (2016) (K16) (Ec and vd are 0.04 and 0.1 cm s−1, respectively) considering different emission sources: the open orange squares represent mineral dust particles from bare soil (dust aerosols), and the closed orange squares denote bioaerosols emitted from forest ecosystems (forest aerosols). The green open and closed squares are the same as the orange squares but are simulated by this study (Ec and vd are 0.4 and 10 cm s−1, respectively). The purple, orange, and green lines indicate the regression lines of the purple crosses, orange squares (open plus closed), and green squares (open plus closed), respectively.
This analysis is novel because emission flux adjustments do not change the slope of the regressions, so the deposition parameters can be adjusted independently from the emission flux adjustment. In this study, we need to constrain both emission and deposition parameters. If emission and deposition parameters both affect the slope, the adjustment should be tough. However, in this analysis we constrain the deposition parameters first to fix the slope (or the intercept of y axis) with whatever emission parameters and then constrain the emission parameters using observed concentration and deposition values as presented in the next subsection (Sect. 2.3.2).
The slope of the observed regression line, b, is 0.92, so the relationship between the concentrations and depositions of resuspended 137Cs in eastern Japan is almost linear, but the relationship itself is not very solid (coefficient of determination (R2)=0.018). However, by excluding two exceptional data points, the observations obtained in January at Fukushima (maximum deposition) and August at Namie (Tsushima) (maximum concentration), the R2 increases to 0.65, and b becomes 0.98 (not shown in the figure). In January at Fukushima, the measured deposition is extremely high compared to the surface concentration. Watanabe et al. (2021) hypothesized the existence of superlarge particles (∼100 µm in diameter) whose gravitational deposition velocities are too fast (as fast as drizzle) to enter the high-volume air samplers used for the concentration measurements but are efficiently collected deposition samplers. The traveling distance of such superlarge particles is estimated as approximately 1 km (e.g., Kajino et al., 2012, 2021). January is the month with the highest snow cover in Fukushima city and the highest snow removal operations (using snow blowers and deicing agents), and heavy traffic on the major roads within 1 km of the Fukushima site produces substantial amounts of superlarge particles from wet and muddy road surfaces. The August data at Namie (Tsushima) are also exceptional because the surface concentrations are biased due to the sporadic peak associated with the debris removal operation in the F1NPP (K16). Because the aerosols associated with the debris removal operation traveled a sufficiently long distance (i.e., 30 km), the deposition velocity was not substantially large and did not affect the monthly mean deposition, although it did affect the monthly mean concentration. Therefore, the data obtained in August at Namie (Tsushima) are exceptional when compared to the trends shown by other datasets. The slopes of the simulated regression lines are b=1.17 for K16 (orange line) and b=1.16 for this study (green line). R2 values of 0.71 and 0.97 were obtained by K16 and this study, respectively. The difference in the magnitude of R2 can be explained by the differences in the deposition rates. Because the deposition rates obtained in this study are much higher than those applied by K16, the deposition amounts are more strongly associated with the concentrations in this study. In other words, this climatological deposition velocity analysis was successful (by excluding the two exceptional data points) because the sizes of the major carrier aerosols of resuspended 137Cs in reality are sufficiently large (the observed deposition amounts are sufficiently associated with the observed concentrations). The regression slopes of the simulations (b∼1.2) are somewhat different from those observed (b∼0.9 or 1.0). Nevertheless, the regression line of this study crosses that of the observations at the middle points of the concentration and deposition ranges (approximately 0.1 mBq m−3 and 50 Bq m−2, respectively). This indicates that the constrained deposition rates may be consistent with the average features of the environmental behaviors of resuspended 137Cs in eastern Japan.
This analysis is conventional but has been found to be quite successful in constraining the deposition rates of resuspended 137Cs in eastern Japan.
2.3.2 Adjustment of emission fluxes
In K16, the emission fluxes of 137Cs associated with dust and forest aerosols were adjusted to match the surface concentrations at Namie (Tsushima). In K16, first, Cconst in Eq. (3) was set to five so that the simulated dust 137Cs concentrations matched the observations in winter, when the temporal variation in the observed 137Cs concentration at Namie (Tsushima) correlated well with that of the wind speed (Kinase et al., 2018) and when the vegetation activity was supposed to be low. The adjusted dust 137Cs concentrations could not reproduce the enhanced concentrations measured at Namie (Tsushima) in summer (Fig. 4a). Thus, rconst in Eq. (4) was set to 10−7 h−1 so that the simulated forest 137Cs concentrations matched the observations in summer. The temporal variation of 137Cs was not correlated with that of the wind speed in summer (Kinase et al., 2018).
Because the deposition rates are substantially increased in this study, we require much larger emission fluxes to sustain the simulated surface concentrations at the observed levels. The same adjustment procedure as that used in K16 could be applied to the simulations in this study; however, for example, adjusting the values at Namie causes the values to be underestimated at Tsukuba, so it is hard to find a combination of Cconst and rconst that is best for all aspects (i.e., concentrations and depositions of the three sites). Thus, we simply multiplied both fluxes used in K16 by 20 so that number fractions of data within a factor of 5 exceeded 0.5 for both concentrations and depositions at the three sites: Cconst was 100 and rconst was 2 × 10⁻⁶ h−1. The discrepancies between the simulated and observed concentrations and depositions at the three sites are summarized later in Sect. 3.1.
3.1 Seasonality and quantity of surface air concentrations and depositions
Figure 3 shows the observed and simulated (dust and forest) activity deposition amounts of 137Cs at Namie (Tsushima), Fukushima, and Tsukuba for the submicron (K16) and supermicron (this study) cases. Statistical measures such as the correlation coefficient (R), simulation-to-observation median ratio (Sim Obs), number fraction of data within a factor of 2 (FA2), and number fraction of data within a factor of 5 (FA5) are embedded in the panels. Note that the simulated temporal variation lines show the dust and forest amounts separately, but the statistical measures are derived using the summation of the two aerosol sources. As discussed in the previous sections and presented in Fig. 2, the underestimation of simulations assuming submicron particles is remarkable, with simulated values approximately 2 orders of magnitude lower than the observations at all sites. On the other hand, the simulations assuming supermicron particles are remarkably improved. Positive correlations are found at Namie (Tsushima) and Tsukuba (R ∼ 0.6–0.7), and the same order of median ratios are found at Fukushima and Tsukuba (Sim Obs = 1.2–1.3, FA5 = 0.9–1.0). In terms of the seasonal variations, the monthly trend (high in winter and spring and low in summer) at Tsukuba is explained well by the simulated dust aerosols. Due to the land use types around the site (of the plain), the 137Cs of dust aerosols is larger than that of forest aerosols throughout the year. In summer, the contributions of forest aerosols are larger than those of dust aerosols at Namie (Tsushima) and Fukushima, which are surrounded by mountainous forest and close to the forest area, respectively. Despite the overestimation at Namie (Tsushima) (Sim Obs = 4.9), the monthly trend is reproduced well by the model: both the observations and simulations show double peaks in winter and summer. Most likely, the same emission factors of mineral dust should not be applied to the whole area. Nevertheless, we regard a uniform application as acceptable in the current study, as this study aims to grasp a rough outline of the atmospheric behaviors of resuspended 137Cs. The monthly variations output by the simulations do not match those of the observations at Fukushima due to the exceptionally high deposition amounts observed in January. This is possibly due to the existence of superlarge particles, as described in Sect. 2.3.1. The snow coverage in Fukushima city is highest in January, but there are certain periods of snow coverage in December and February as well. However, the R value of deposition at Fukushima is not greatly improved if the winter datasets are excluded.
The initial 137Cs depositions at the three sites are 2300, 190, and 21 kBq m−2, and the differences are approximately on 1 order of magnitude. The orders of the monthly depositions in 2013 at the three sites are 0.1 % of the initial deposition, at 102–103, approximately 102, and approximately 101 Bq m−2, which are similar to the order differences obtained for the initial depositions. A value of 0.1 % per month is 1 % per year. K16 reported an annual resuspension ratio of 0.048 % yr−1, but this simple order estimation readily shows that this value is excessively underestimated. As shown later in Fig. 8, the improved annual resuspension ratio is 0.96 %, which is consistent with the deposition measurements at the three sites. From this estimation, one can assume that the observed deposition amounts at Fukushima in January (3100 Bq m−2) are exceptionally high.

Figure 3Monthly deposition amounts of (black) observed 137Cs and simulated 137Cs associated with (red) dust aerosols and (lime) forest aerosols at Namie (Tsushima), Fukushima, and Tsukuba (Bq m−2). The simulation results assuming submicron particles (K16; Ec and vd are 0.04 and 0.1 cm s−1, respectively) and those assuming supermicron particles (this study; Ec and vd are 0.4 and 10 cm s−1, respectively) are shown on the left and right, respectively. The statistical measures, such as the correlation coefficient (R), simulation-to-observation median ratio (Sim Obs), numerical fraction of data within a factor of 2 (FA2), and numerical fraction of data within a factor of 5 (FA5), between the observations and the simulations (dust plus forest) for each simulation result are embedded in each panel.
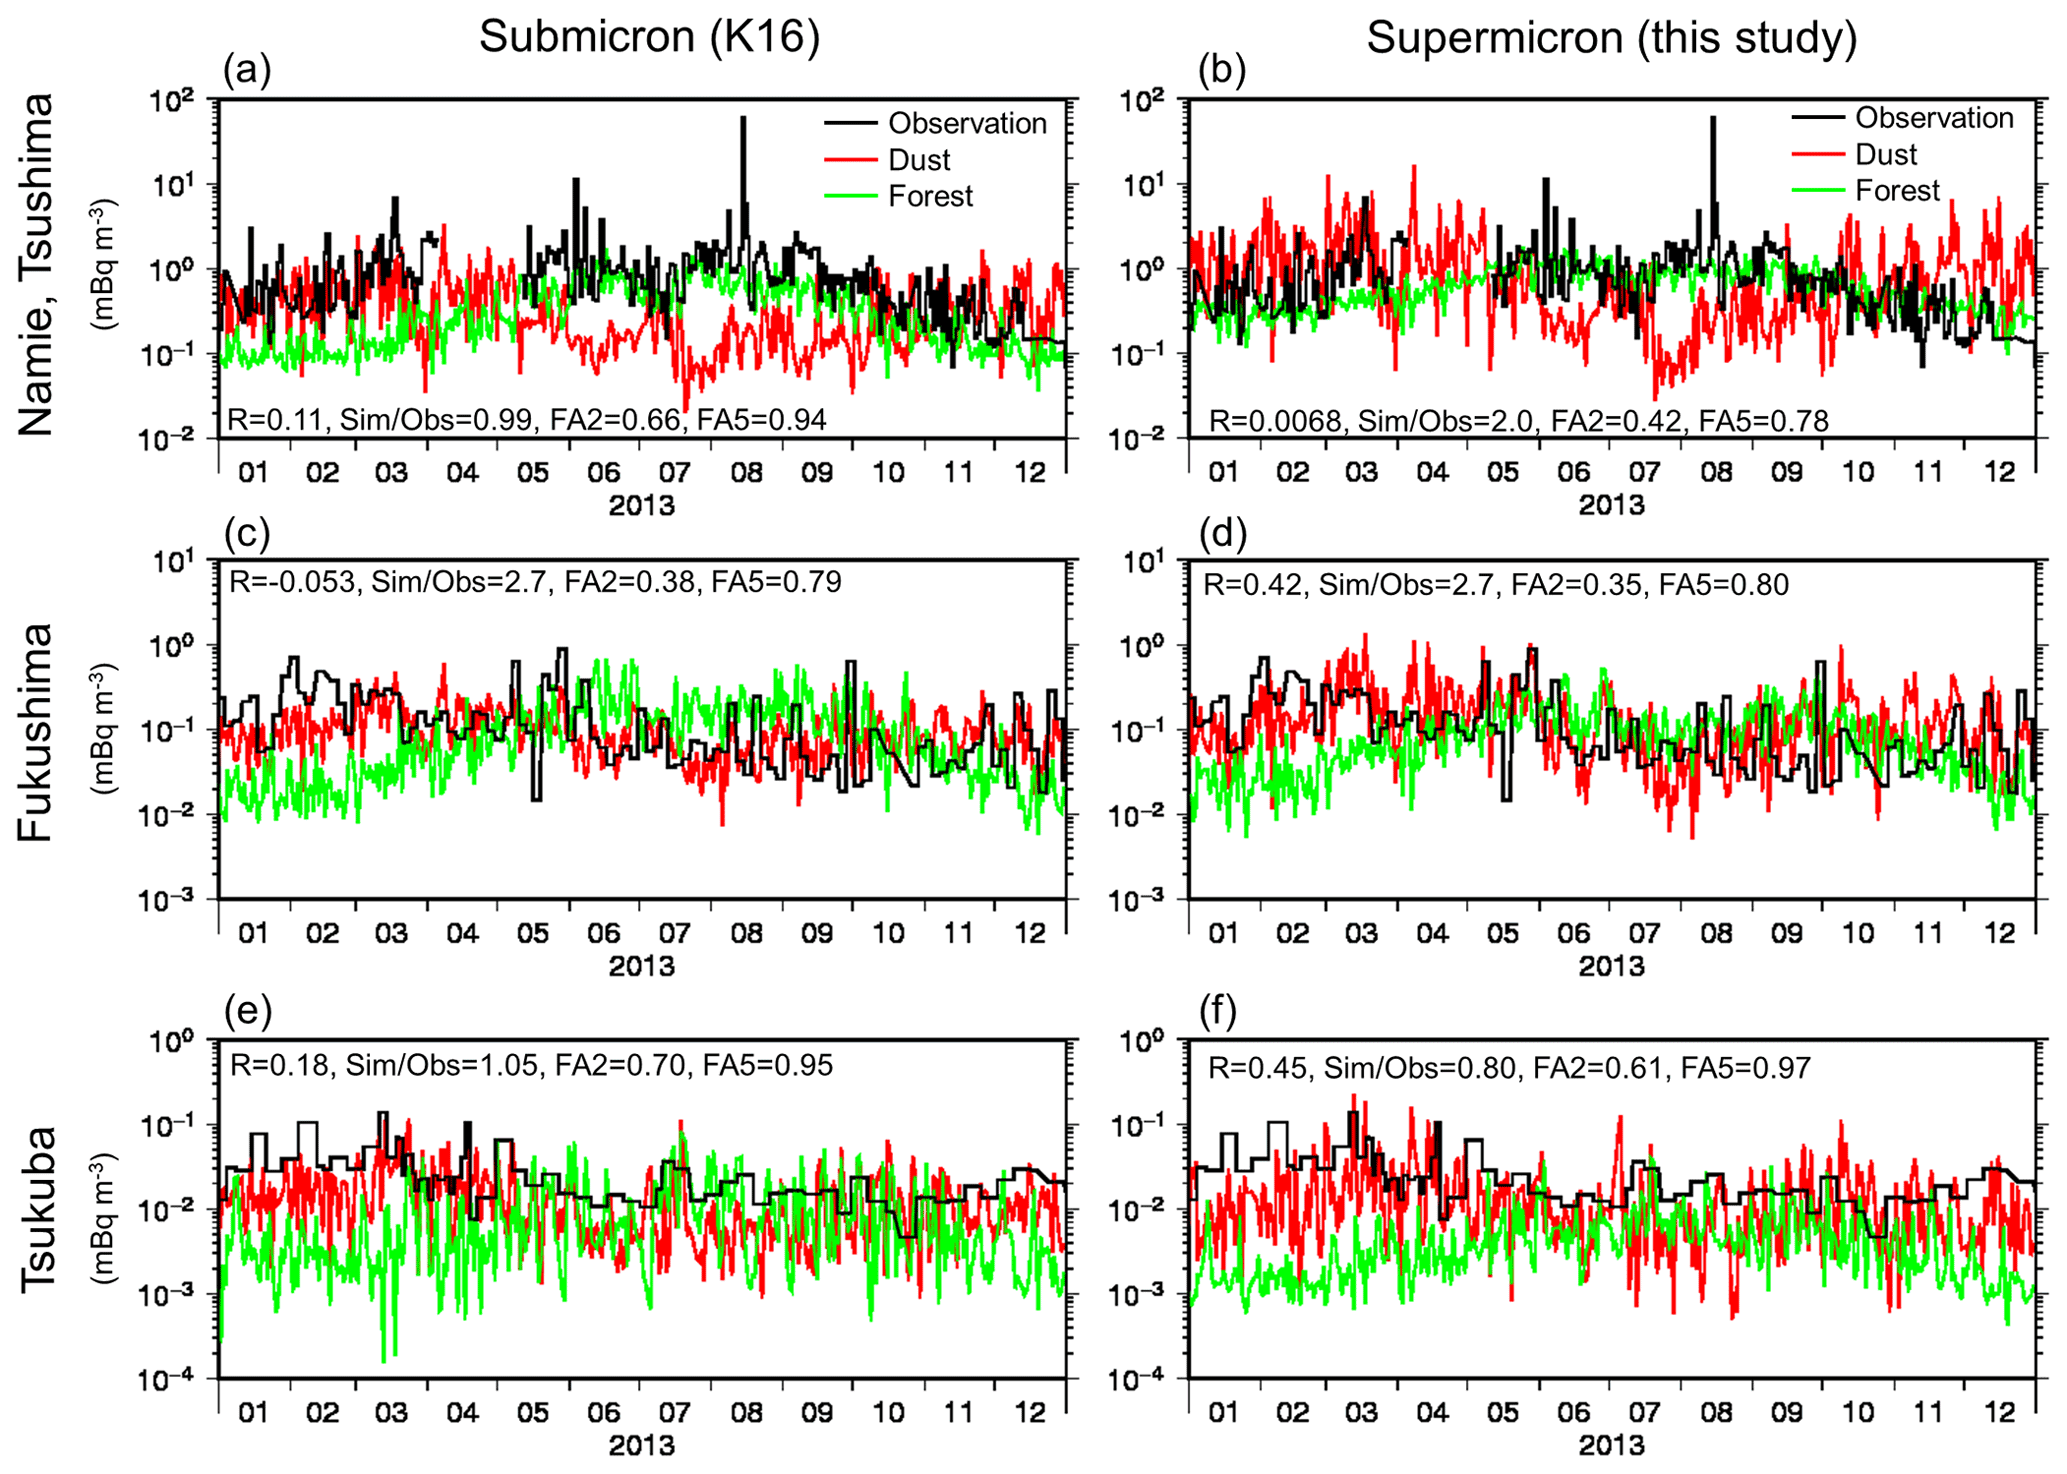
Figure 4Same as Fig. 3 but for the surface activity concentrations of 137Cs (mBq m−3). The sampling intervals are used for the observations, but daily mean values are depicted for the simulations.
Figure 4 shows the observed and simulated (dust and forest) surface air activity concentrations of 137Cs at the three sites for the submicron (K16) and supermicron (this study) cases. The statistical measures R, Sim Obs, FA2, and FA5 between the observations and simulations (dust plus forest) are also embedded in the panels. The lines are depicted using different temporal resolutions (sampling intervals for the observations and daily for the simulations), but the temporal resolutions are unified to the sampling intervals to obtain the statistical measures. The measurements of the three sites are not directly comparable because their temporal resolutions are different (1 d for Namie (Tsushima), 2–3 d for Fukushima, and 1 week for Tsukuba), but those of the two aerosol cases (submicron and supermicron) are comparable. Although R is low for the submicron case at Namie (Tsushima), good consistency Sim Obs (0.99) and FA5 (0.94) values are obtained because the emission factors Cconst and rconst are adjusted to this case. However, the unrealistic assumption of aerosol sizes results in the opposite simulated seasonal trend at Fukushima: the simulations are too high in summer due to forest aerosols for the submicron case. The Fukushima site is located downwind of the contaminated forest in the Abukuma Highlands in summer (Fig. S1), so the transport of 137Cs from the forest area is dominant. However, as the particle sizes are larger and the traveling distances are shorter, the summer enhancement due to forest aerosols is less dominant for the supermicron case (Fig. 4d). The observed surface concentrations are high at Fukushima in winter, and the observed short-term peaks correspond to the simulated dust aerosols, indicating that the emission of resuspended 137Cs at Fukushima in winter is driven by wind. The simulated forest aerosols are approximately 1 order of magnitude smaller than the dust aerosols in winter. The simulated dust peaks also correspond to the observed peaks in later spring and early summer. The simulated contribution of forest aerosols is as great as dust aerosols, but there may also be an association of wind-induced dust aerosols during the season. The Sim Obs, FA2, and FA5 values of submicrons and supermicrons at Fukushima are similar, but R is substantially improved. At Tsukuba, like the Fukushima site, the contribution of forest aerosols is less in the supermicron case than in the submicron case due to less transport from the forest area. The contribution of dust particles is dominant in winter, but the simulated dust aerosols are underestimated compared to the observations in winter in both cases. The R value obtained for supermicrons is improved from the submicron case (from 0.18 to 0.45).
The orders of the surface concentrations at the three sites are 1, 10−1, and 10−2–10−1 mBq m−3. These order differences are similar to those of the initial depositions. One can assume that the resuspension and redeposition of 137Cs occurs within a limited areal scale (e.g., several tens of kilometers) and that long-range transport (i.e., hundreds to a thousand kilometers) from the emission source is not very dominant.
In the following subsections (Sect. 3.2 and 3.3), the source–receptor relationship and annual resuspension ratios are discussed, although the simulation is associated with the discrepancies presented in this section. Nevertheless, we can safely conclude here that the supermicron simulations are more (or maybe much more) consistent with the observations than the submicron simulations are.
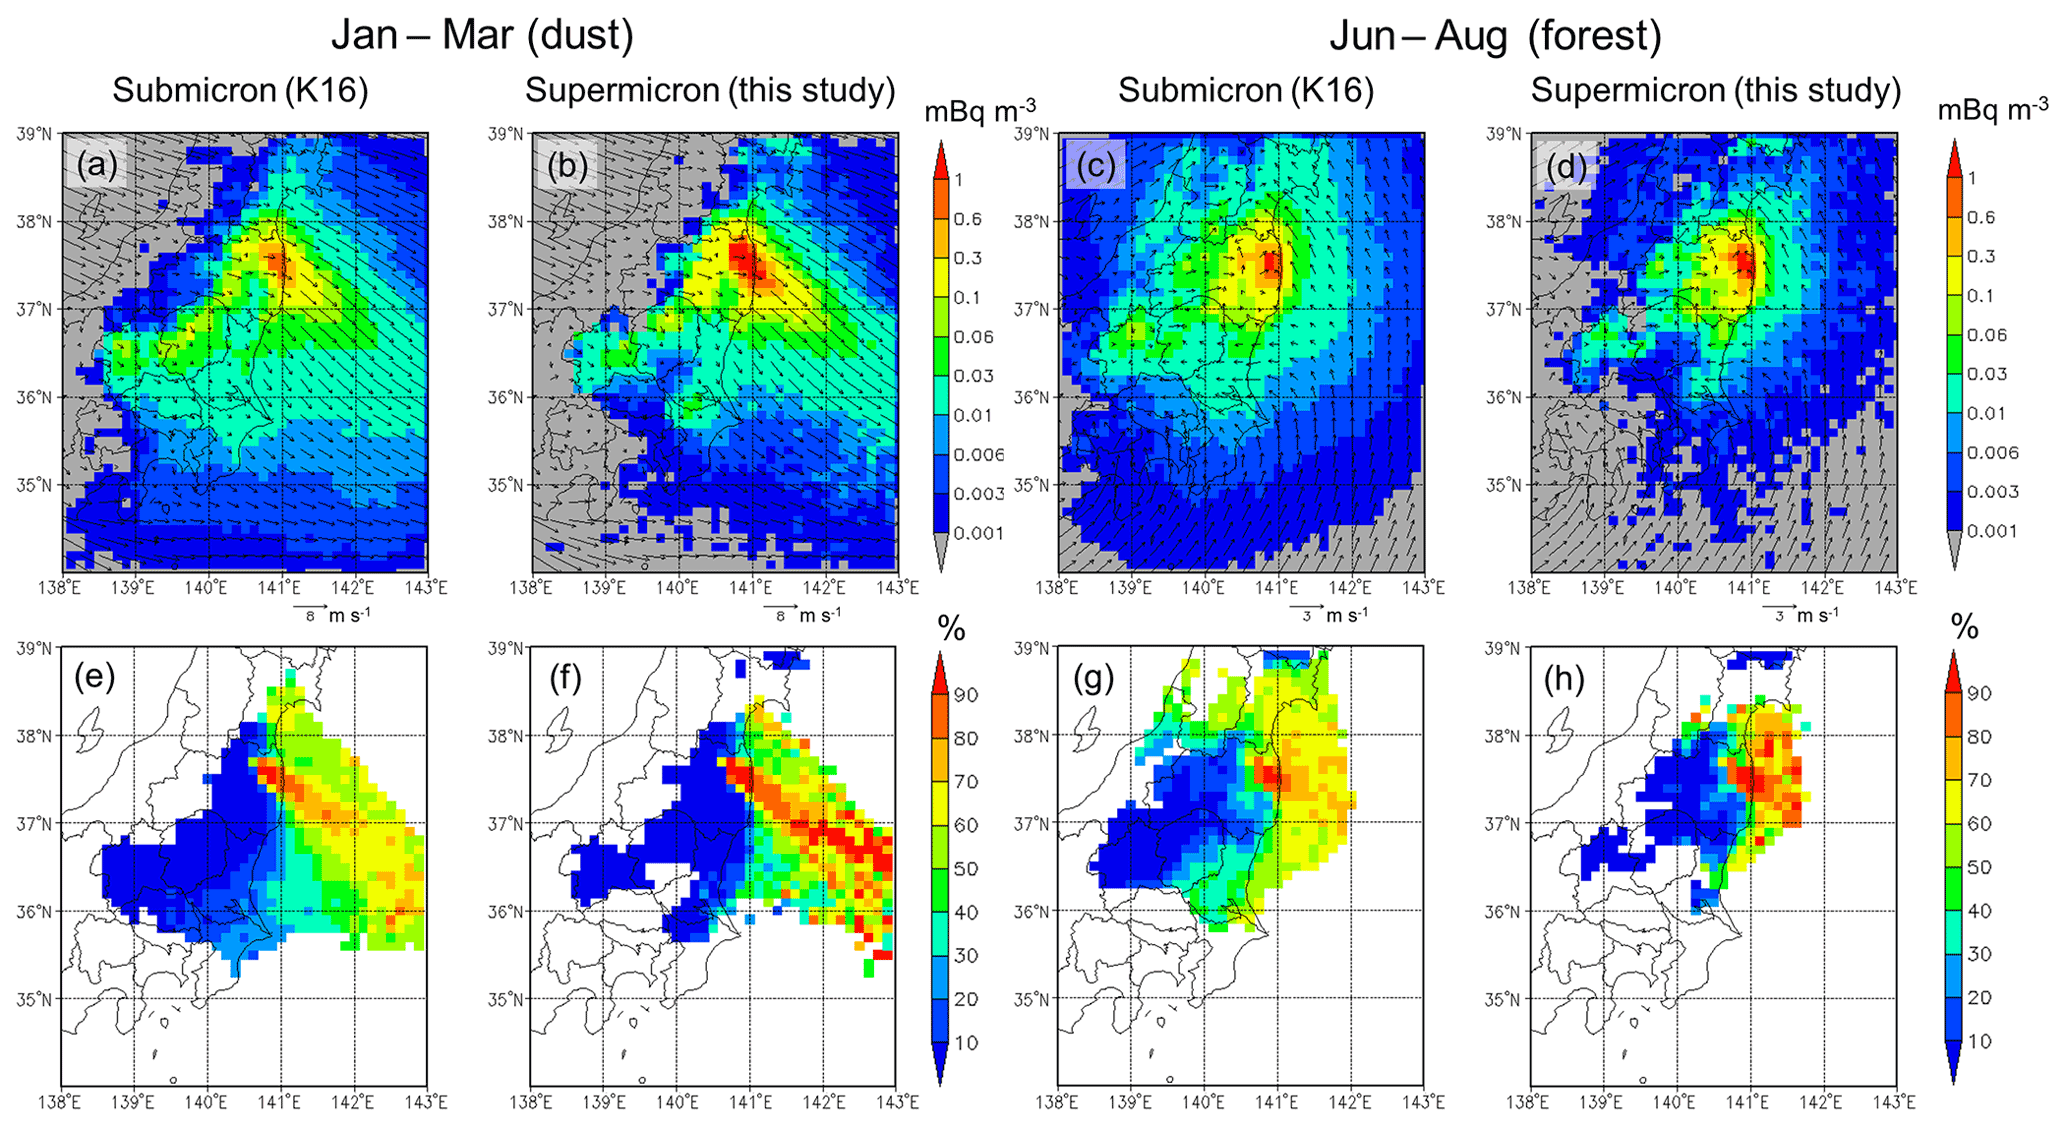
Figure 5(Top panels) Seasonal mean surface concentrations of (a, c) submicron (K16; Ec and vd are 0.04 and 0.1 cm s−1, respectively) and (b, d) supermicron (this study; Ec and vd are 0.4 and 10 cm s−1, respectively) 137Cs associated with (a, b) dust aerosols in winter to early spring (January, February, and March) and (c, d) forest aerosols in summer (June, July, and August) (mBq m−3). The seasonal mean surface wind vectors are also depicted in the panels. (Bottom panels) Same as top panels but for the fractional contributions from the resuspension source area (defined as the initial depositions of 137Cs exceeding 300 kBq m−2; see Fig. 1b) to the surface concentrations (%).
3.2 Source–receptor relationship and its seasonality
Figure 5 shows the simulated seasonal mean concentrations and the horizontal distributions of the source–receptor relationship. The resuspension source area is defined as the domain in which the grid box mean initial deposition exceeds 300 kBq m−2 (Fig. 1b). Thus, Namie (Tsushima) (2300 kBq m−2) is located within the source area, but Fukushima (190 kBq m−2) and Tsukuba (21 kBq m−2) are outside the source area (or are regarded as being in the downwind area). The source–receptor relationship maps (or source contribution maps) (Fig. 5e–h) are derived using the seasonal mean activity concentrations resulting from 300 kBq m−2 areas divided by those from the overall areas (i.e., >10 kBq m−2). Because of the shorter atmospheric lifetime of supermicron 137Cs-bearing particles, the concentration maps of the supermicron cases are patchy due to insufficient amounts of Lagrangian particles (Fig. 5b and d) compared to the submicron cases (Fig. 5a and c), especially in areas where the seasonal mean surface concentrations are below 0.01 mBq m−3. There are substantial numerical errors in these areas, so the source contribution shades (Fig. 5e–h) depict only areas in which the seasonal mean concentrations exceed 0.01 mBq m−3 (Fig. 5a–d). We select two 3-monthly means, covering January, February, and March for winter to early spring (or simply winter hereinafter) when the simulated dust aerosols are dominant and June, July, and August for summer when the simulated forest aerosols are dominant.
In winter, northwesterly monsoon winds prevail over Fukushima Prefecture (Fig. 5a and b). In particular, fall and gap winds from the Ōu Mountains caused strong winds in the Nakadori Valley, which in turn cause high dust aerosol surface concentrations in these areas in winter. Even though the surface concentrations of supermicron particles (Fig. 5b) over Fukushima Prefecture are larger than those of submicron particles (Fig. 5a), the supermicron concentrations over the downwind regions are smaller (e.g., concentrations >0.01 mBq m−3 over Saitama (no. 6 in Fig. 1) for the submicron case but of <0.01 mBq m−3 for the supermicron case) due to the shorter lifetime of supermicron particles. This feature is also evident for the source contribution maps (Fig. 5e and f). Due to the northwesterlies, most of the resuspended 137Cs is transported toward the southeast over the ocean, the values are 40 %–90 %, and the source contributions of the downwind regions over the land are lower than 10 %, except the coastal regions in Ibaraki (no. 3 in Fig. 1) and Chiba (no. 7 in Fig. 1) prefectures for the submicron case (20 %–30 %) due to the longer lifetimes of these particles in air (Fig. 5e).
In summer, southerly winds prevail over eastern Japan due to the marginal flows of the Pacific High. The wind speeds are generally lower in summer than in winter (please see that the lengths of the arrows are different in Fig. 5a–b and c–d). The seasonal mean wind patterns are complex over land (Fig. 5c–d), but the seasonal mean source contribution maps reflect the seasonal mean transport patterns from the source areas (Fig. 5g–h). The seasonal mean wind fields over the ocean close to land are directed toward the land, indicating that ocean-to-land wind blows are more frequent (and/or stronger) than land-to-ocean wind blows. Thus, less frequent and/or weaker land-to-ocean wind transported substantial proportions of 137Cs in forest aerosols toward the ocean in summer (the source contributions are >60 % for submicron and >70 % for supermicron cases). Then, the 137Cs transported toward the ocean is transported toward the land again to Ibaraki and Miyagi (no. 1 in Fig. 1) prefectures. The source contributions over Ibaraki and Miyagi are substantial for the submicron case (30 %–70 %). For the supermicron case, the source contributions over Ibaraki and Miyagi exceed 30 % at a limited number of grid boxes, but the mean concentrations are much lower (Fig. 5d) than those in the submicron case (Fig. 5c) over these prefectures. Due to the lower wind speeds in summer and the short lifetime of the supermicron particles, the horizontal spread of the mean concentrations (e.g., areas > 0.01 mBq m−3) of supermicron forest aerosols in summer (Fig. 5d) is obviously smaller than that of any other case (Fig. 5a–c).

Figure 6Monthly mean fractional contributions from the resuspension source area (defined as initial depositions of 137Cs exceeding 300 kBq m−2) to the (a, b) surface concentrations and (c, d) deposition amounts assuming (a, c) submicron (K16; Ec and vd are 0.04 and 0.1 cm s−1, respectively) and (b, d) supermicron (this study; Ec and vd are 0.4 and 10 cm s−1, respectively) sizes of 137Cs-bearing particles at Namie (Tsushima), Fukushima, and Tsukuba.
Figure 6 shows the simulated monthly mean source contributions for the concentrations and depositions at the three sites and compares these contributions between the submicron and supermicron cases. At Namie (Tsushima), more than 90 % of the surface concentrations originate from the source area. The annual mean values are 90 % for the submicron case (Fig. 6a) and 94 % for the supermicron case (Fig. 6b). It is natural that the source contributions are larger in the source area (Namie, Tsushima) for the supermicron case, as the lifetime of these particles is shorter than that of submicron particles. As previously discussed, the submicron source contributions at Fukushima are larger in summer and autumn (approximately 40 % in June, September, and October and 20 % in July and August) (Fig. 6a). The source contributions of supermicrons in summer and autumn are approximately 50 % smaller than those of submicrons in July and August (10 %) and are slightly smaller in June, September, and October (20 %–30 %) (Fig. 6b). The annual mean concentration values at Fukushima are 16 % for submicrons (Fig. 6a) and 9 % for supermicrons (Fig. 6b). As observed in Figs. 4e–f and 5e–h, the source contributions of submicrons and supermicrons at Tsukuba are remarkably different. The source contributions of submicrons are larger in summer and autumn at approximately 30 %, with an annual mean value of 21 % (Fig. 6a). On the other hand, those of supermicrons are smaller than 20 % for all months, and the annual mean value is 5 % (Fig. 6b).
In terms of deposition, the source contributions of submicrons (Fig. 6c) are similar to those for the concentrations (Fig. 6a), but the source contributions of supermicrons (Fig. 6d) are remarkably different from those for the concentrations (Fig. 6b). Removal rates of submicron particles are small so that they do not affect surface concentrations (D=aC, recall Eq. 5), and thus Fig. 6a and c are similar. However, the large removal rates of supermicron particles can substantially alter the surface concentrations (D=aC(D)). For the supermicron case, both emissions and depositions are substantially enhanced compared to the submicron case. The enhanced depositions (by almost 2 orders of magnitude; see Fig. 3) directly alter the source contributions for depositions (Fig. 6d). However, changes in concentration due to enhanced emissions (set as 20 times) are compensated for by enhanced depositions, and thus the source contributions for concentrations of supermicrons (Fig. 6b) are slightly but not drastically different from the submicron cases (Fig. 6a). Consequently, as shown in Fig. 6c, the annual mean source contributions are 95 %, 13 %, and 19 % for Namie (Tsushima), Fukushima, and Tsukuba, respectively, which are equivalent to those of the concentrations (90 %, 16 %, and 21 % in Fig. 6a), whereas in Fig. 6d, the annual mean source contributions of supermicron depositions are shown to be 99.5 %, 2.2 %, and 1.0 % for Namie (Tsushima), Fukushima, and Tsukuba, respectively.
3.3 Annual total resuspension amounts
Figure 7 presents the simulated annual resuspension and redeposition amounts for the submicron and supermicron cases. The areal summation values are embedded in the panels. Figure 8 shows the annual resuspension ratio, which is the annual total resuspension amount divided by the initial deposition (Fig. 1b), and the annual redistribution amount, which is the deviation between the annual total redeposition amount and the resuspension amount. Negative redistribution values indicate a decrease in deposition due to resuspension, and positive values indicate an increase in deposition due to resuspension. The annual total amounts embedded in Fig. 8b and d (−1.06 and −15.1 TBq) indicate the amount of 137Cs transported outside the model domain.
As previously discussed, due to the faster deposition rates and thus larger emission fluxes necessary to sustain the surface concentrations at the observed levels, the annual resuspension and redeposition amounts are both larger for the supermicron case than for the submicron case (Fig. 7a–d). In K16, the total areal resuspension amount was 1.28 TBq (Fig. 7a), equivalent to only 0.048 % of the initial deposition (2.68 PBq), and the redeposition amount (0.22 TBq) (Fig. 7b) was approximately 20 % of the resuspension amount. On the other hand, based on the new estimations, the annual resuspension amount (25.7 TBq) (Fig. 7c) is approximately 20 times the previous estimate, and the redeposition amount is even larger (10.6 TBq) (Fig. 7d), at 50 times the previous estimate (0.22 TBq).
The areal mean annual resuspension ratio obtained by K16 (Fig. 8a) was 0.048 %, with high values above 0.1 % in Nakadori Valley and the mountainous areas of Tochigi (no. 4 in Fig. 1) and Gunma (no. 5 in Fig. 1) prefectures. The new estimate of the annual mean areal resuspension ratio is 0.96 %, with high-value areas showing values of 1 %–3 % (Fig. 8c). Iwagami et al. (2017) evaluated that the annual discharge rate from the local environment through rivers was 0.02 % yr−1–0.3 % yr−1. The new estimate of the resuspension rate through air (0.96 % yr−1) is much larger than the discharge rate through rivers but is still not very large (i.e., only 1 % per year of surface contamination). We can conclude here that the ground surface 137Cs stays or circulates within the local terrestrial ecosystems and is hardly discharged through the air or rivers.
However, when these values are compared with the actual decreasing trends in the ambient gamma dose rate in Fukushima Prefecture, we can reach a different conclusion. The first-order decrease rate of the dose rate in Fukushima Prefecture ranged from 1.0 to 7.9 × 10⁻⁴ d−1 in 2013 after the radioactive decay of 137Cs plus 134Cs (3.0–4.2 × 10⁻⁴ d−1 in 2013) (K16) was subtracted. The previous and current resuspension rate estimates, 0.048 % yr−1 and 0.96 % yr−1, are equivalent to 1.3 × 10⁻⁶ and 2.6 × 10⁻⁵ d−1, respectively. K16 concluded that the impact of resuspension to the atmosphere was negligibly (2 to 3 orders of magnitude) small in the gross decreasing rate of ground surface contamination, such as by land surface processes or decontamination. However, the difference between the current estimate (2.6 × 10⁻⁵ d−1) and the decreasing trend without radioactive decay (1.0–7.9 × 10⁻⁴ d−1) is only 1 to 2 orders of magnitude. The annual resuspension ratio in 2013 was only 0.96 % of the initial deposition amount, but the amount of 137Cs discharged due to resuspension through the air could contribute approximately 1 %–10 % of the gross decreasing rate, which may not be negligibly small.
For the submicron case (Fig. 8b), the positive redistribution area (area with enhanced deposition due to resuspension) is limited, and the amounts are up to 10 Bq m−2 per year. On the other hand, for the supermicron case (Fig. 8d), even though the transport distance is shorter than that for submicrons, the positive redistribution area for 1–10 Bq m−2 is much larger, and the maximum values are up to 100 Bq m−2 for the downwind regions close to the emission sources, especially over the ocean close to the land of Fukushima Prefecture. Nevertheless, these values are much smaller than those obtained for the initial deposition amounts (the lowest limit value is 10 kBq m−2, which is 2 to 3 orders of magnitude larger than the annual enhanced deposition amounts of 10–100 Bq m−2).
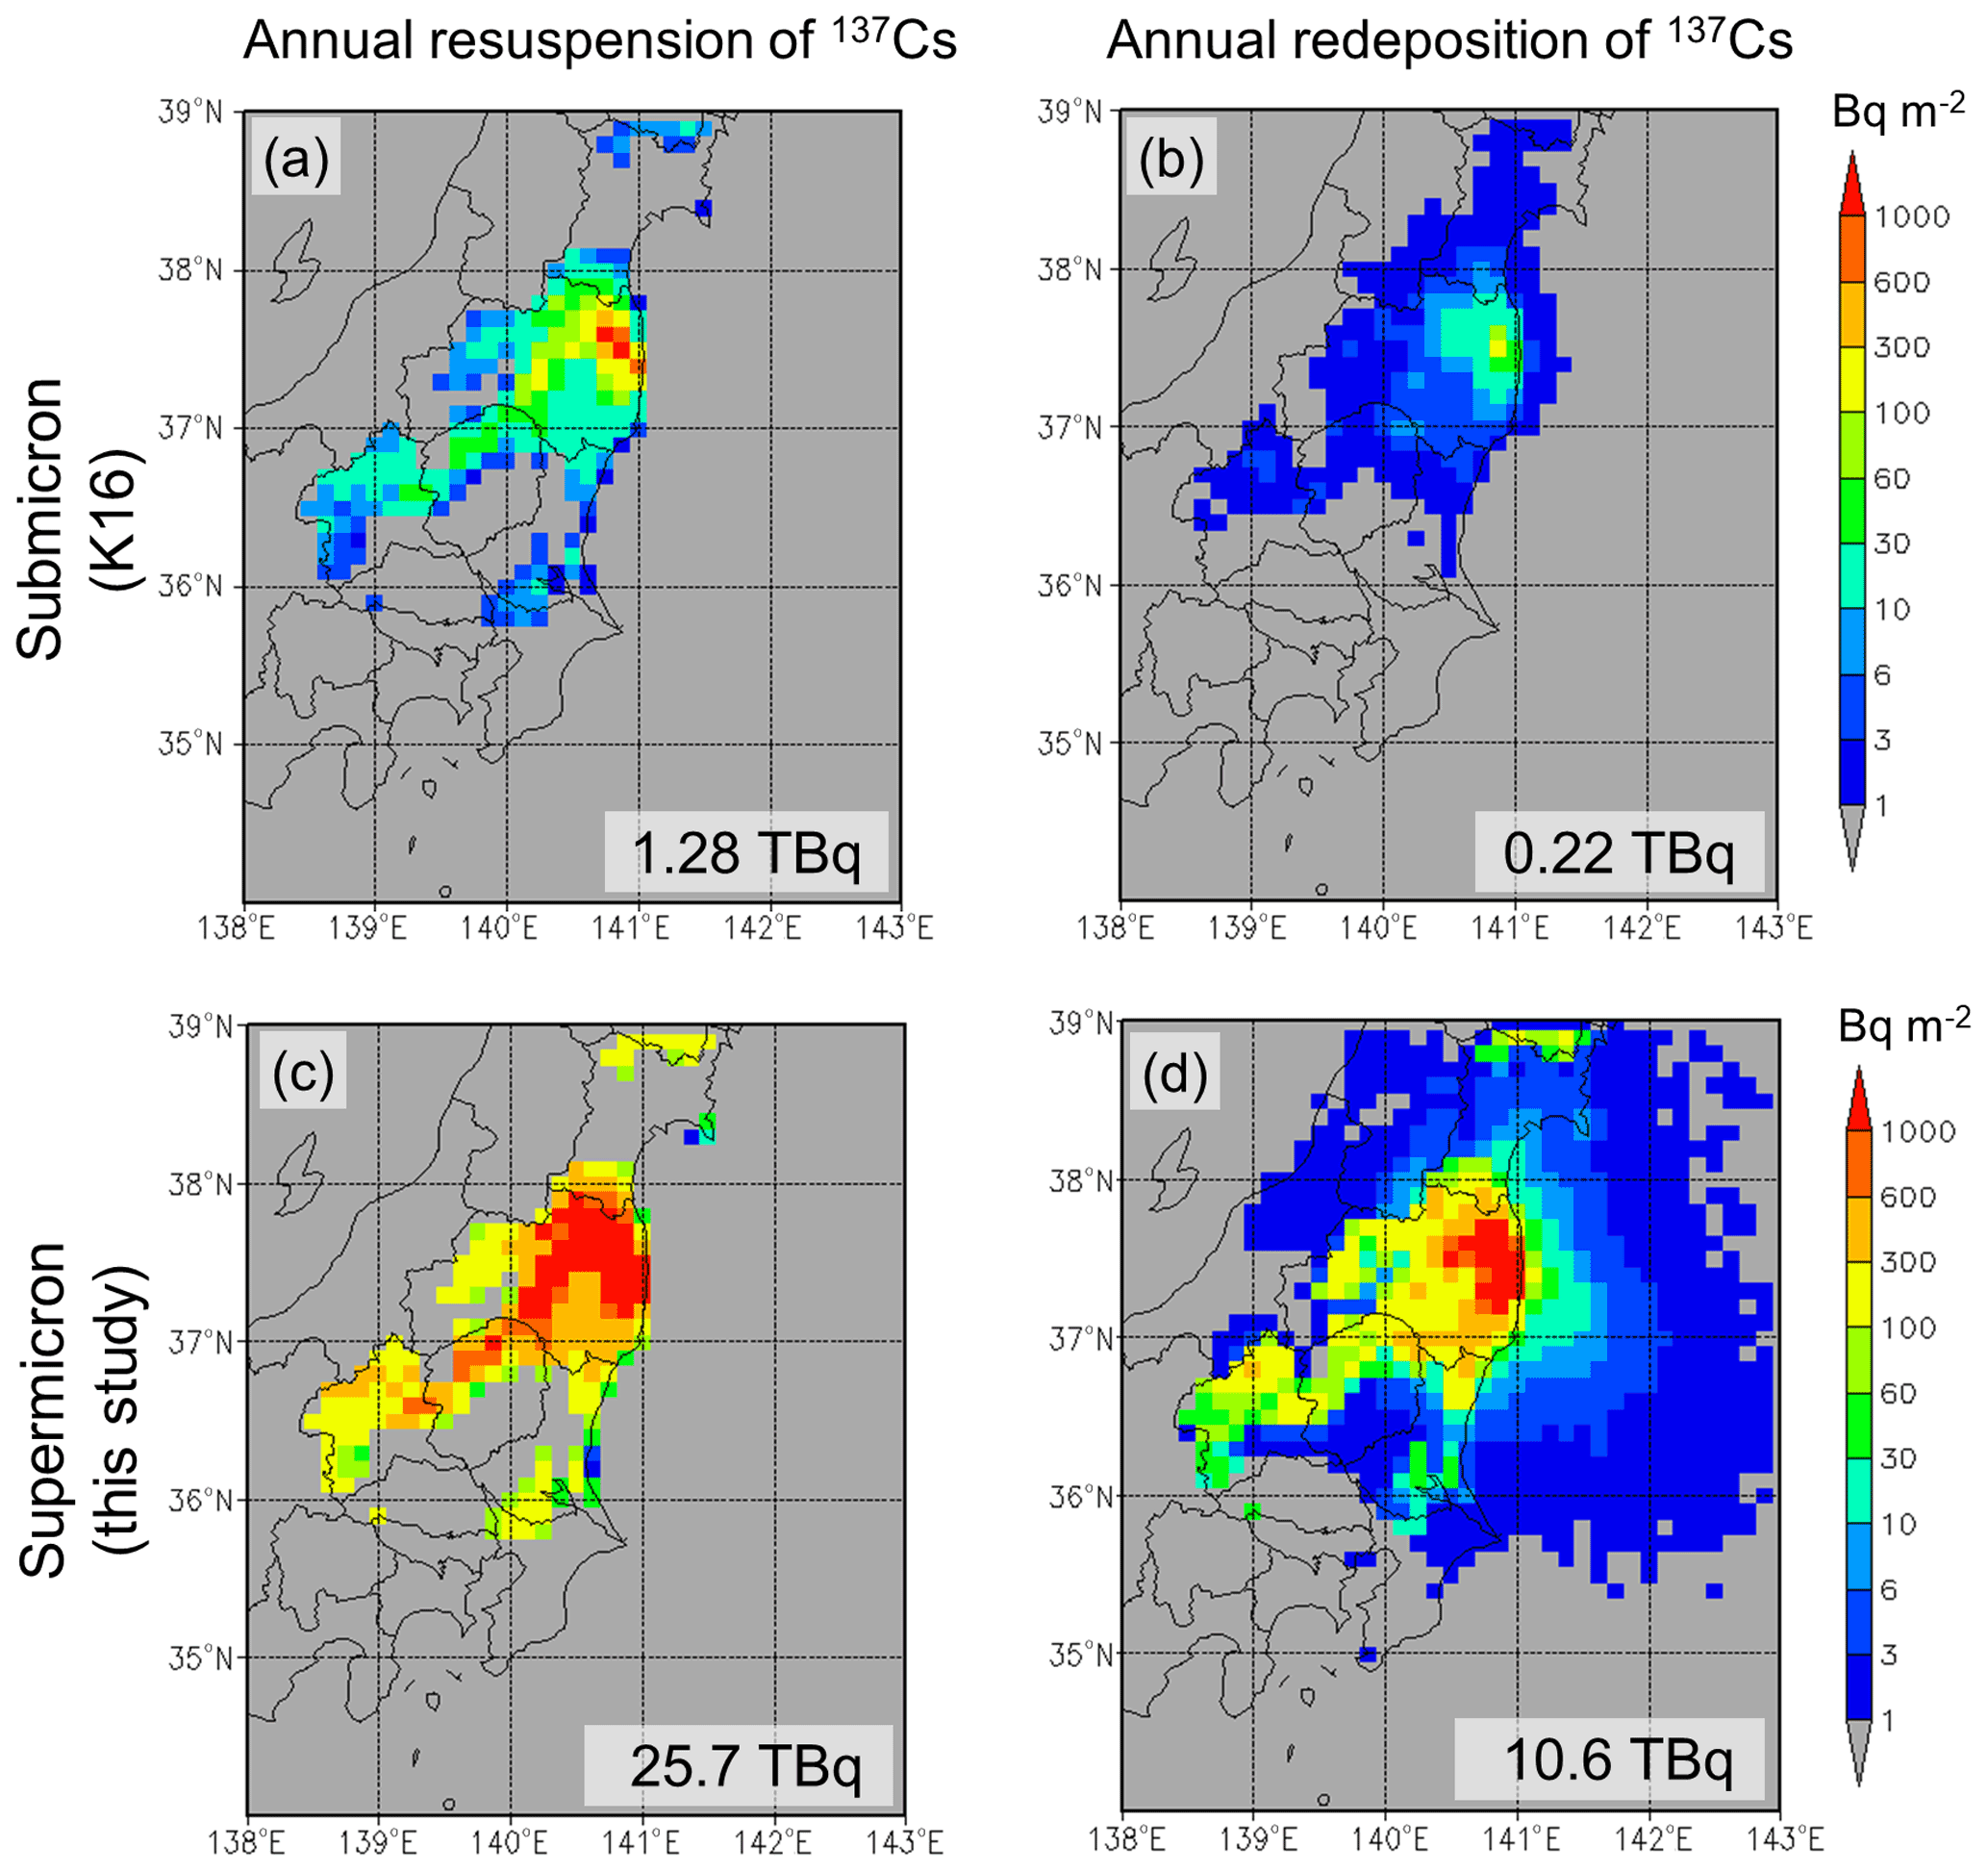
Figure 7Horizontal distributions of (a, c) the annual total amounts of resuspended 137Cs (Bq m−2) and (b, d) redeposited amounts of resuspended 137Cs (Bq m−2) obtained from the simulations assuming (a, b) submicron (K16; Ec and vd are 0.04 and 0.1 cm s−1, respectively) and (c, d) supermicron (this study; Ec and vd are 0.4 and 10 cm s−1, respectively) sizes of 137Cs-bearing particles. The total areal amounts are embedded at the bottom right of each panel.
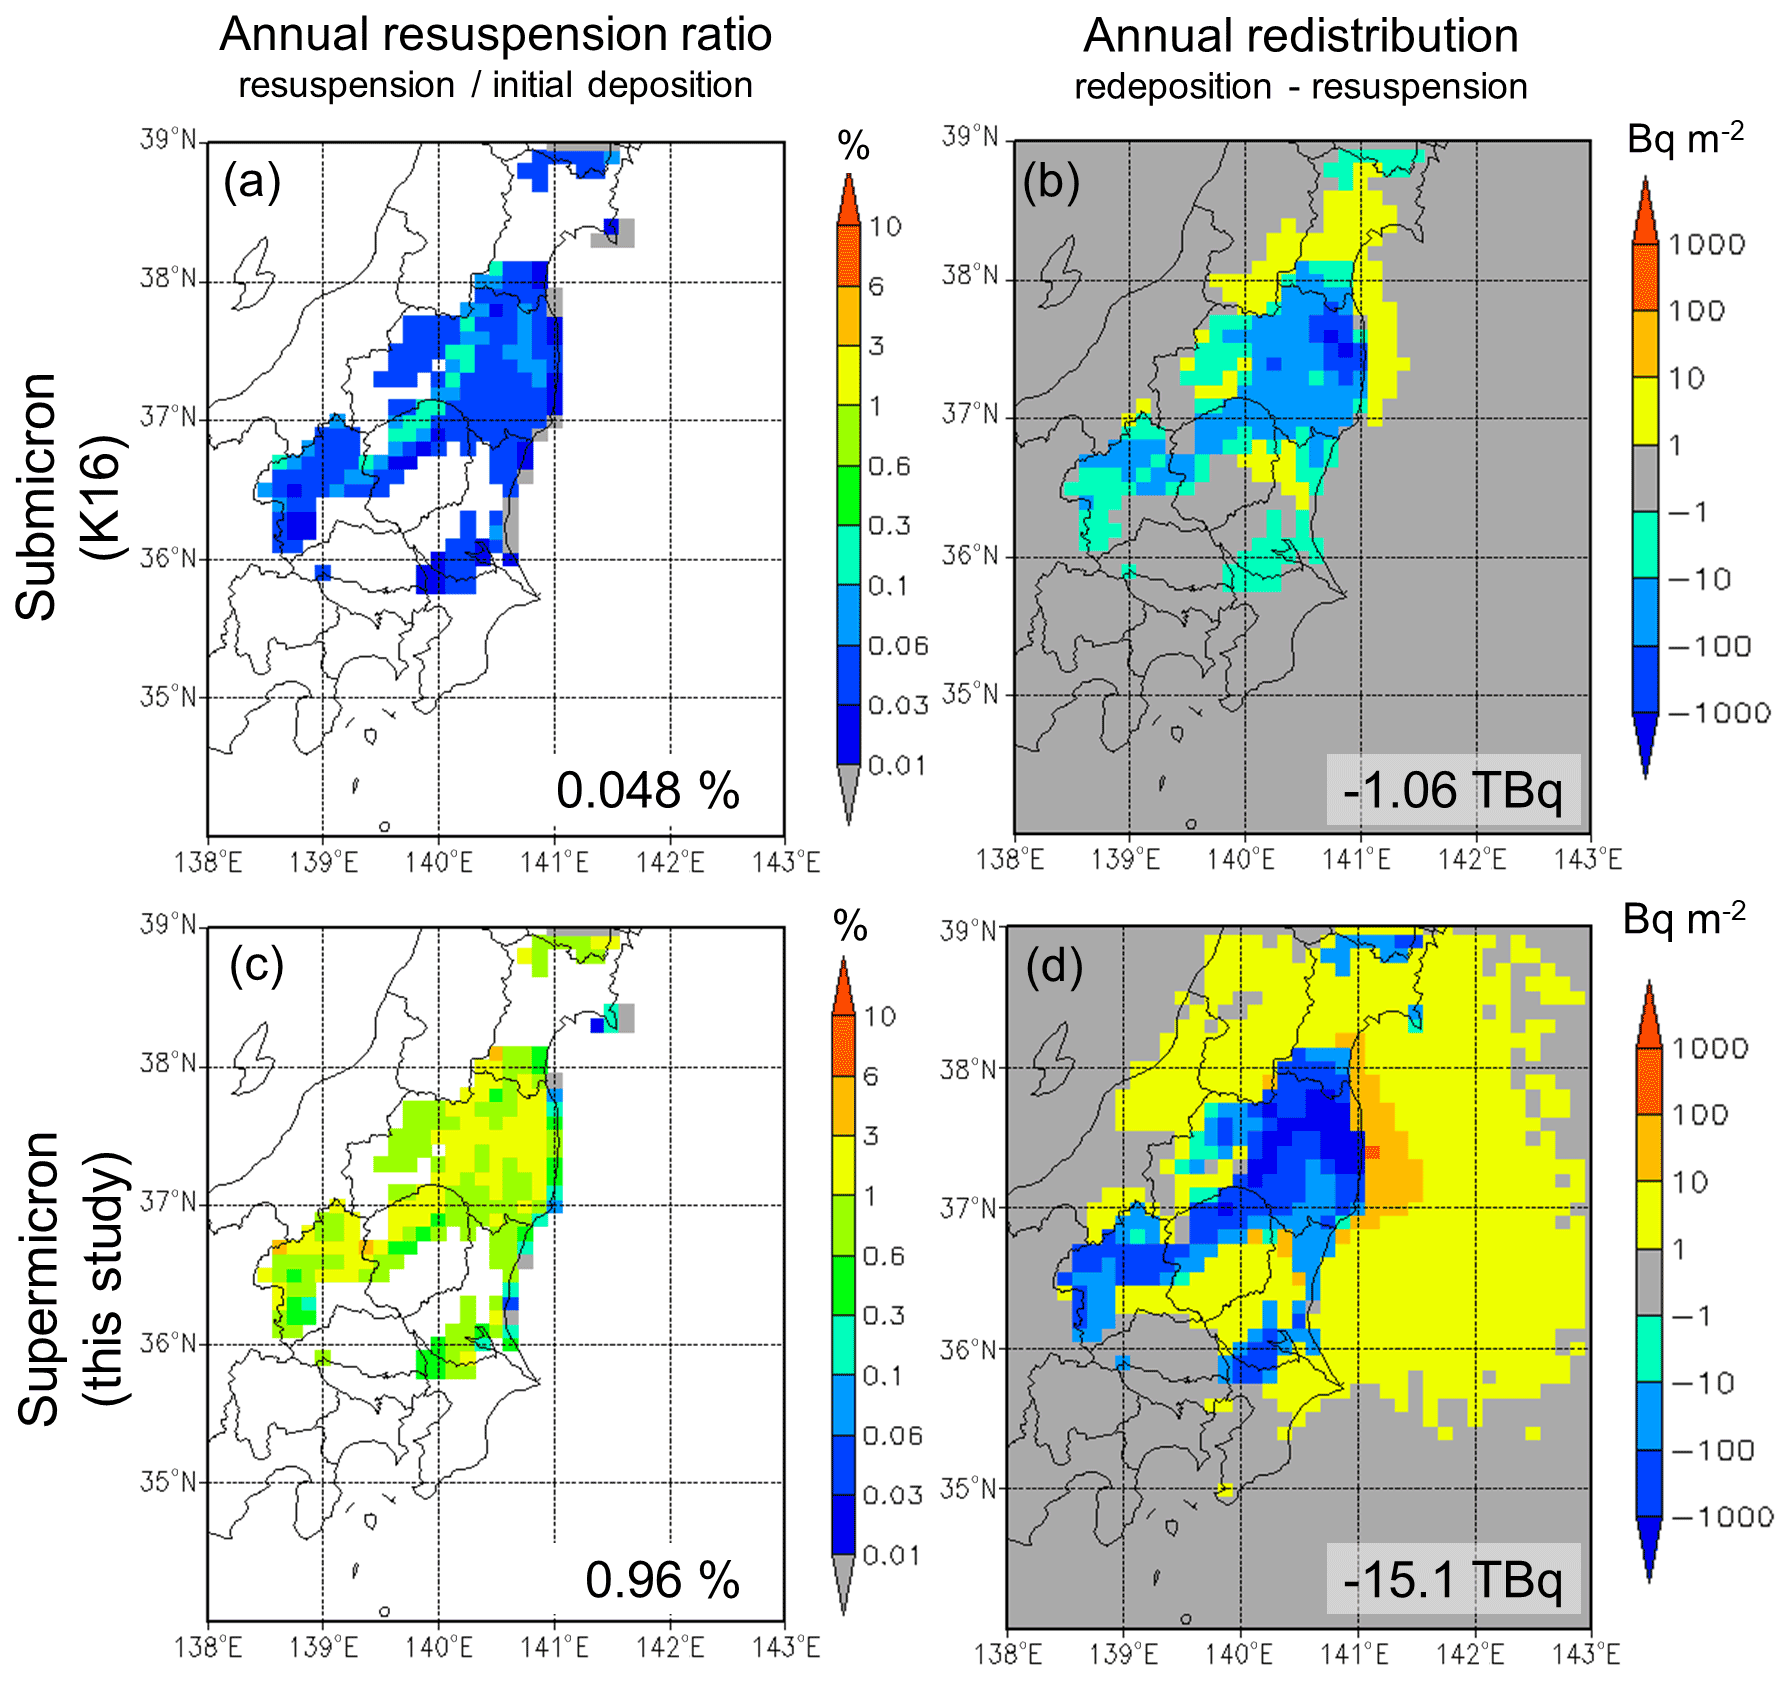
Figure 8Horizontal distributions of (a, c) the annual total resuspension ratio (ratio of resuspension amounts to initial deposition amounts) of 137Cs (%) and (b, d) the annual redistribution (redeposited minus resuspended amounts) of 137Cs (Bq m−2) obtained from simulations assuming (a, b) submicron (K16; Ec and vd are 0.04 and 0.1 cm s−1, respectively) and (c, d) supermicron (this study; Ec and vd are 0.4 and 10 cm s−1, respectively) sizes of 137Cs-bearing particles. The total areal amount ratios (a, c) and the total areal amounts (b, d) are embedded at the bottom right of the panels.
3.4 Sensitivities
Several sensitivity tests are performed, as shown in the current section. Since the cumulus convection parameterization scheme is installed, a comparison is made between the simulations performed with (in the current study) and without (in K16) this scheme. The current study assumes that resuspension occurred from the grid boxes in which the grid box mean initial deposition amount exceeded 10 kBq m−2, the reliable limit of the aircraft measurement. On the other hand, horizontal interpolation from the measurement grid boxes to the LM grid boxes can convert values slightly above the detection limit to less than 10 kBq m−2, so additional sensitivity tests include resuspension from grid boxes with 1–10 kBq m−2. As was discussed in part in the previous sections, the snow cover effect is also tested. In summary, for each aerosol size case, we conduct four sensitivity tests: (1) no cumulus parameterization, denoted as [No. cuml.]; (2) with cumulus parameterization, denoted as [Cuml.]; (3) [Cuml.] plus the inclusion of resuspension from 1–10 kBq m−2 grid boxes, denoted as [1–10 kBq m−2]; and (4) [Cuml.] plus [1–10 kBq m−2] plus the snow cover effect, denoted as [Snow cover]. Thus, the submicron case with [No cuml.] was used in the study of K16, and the supermicron case with [Cuml.] is used as the reference simulation in this study. Note that the submicron simulations shown in the current study are also with [Cuml.].
Figure 9 presents monthly mean snow cover data interpolated to the model grid boxes. The original data are the Moderate Resolution Imaging Spectroradiometer (MODIS) snow cover collection 6 level-3 data (MOD10CM, global, monthly, 0.05∘ resolution) (Riggs et al., 2016). In the presence of snow cover, the simulated dust emission is suppressed by the snow cover fraction (Eq. 3 is multiplied by 1 minus snow cover). No impact of snow cover on forest emissions is assumed in the simulation. December, January, and February are the months with the widest snow coverage in eastern Japan. In November, only small snow cover fractions are observed in the high-mountain areas (i.e., >1000 m in Fig. 1a). In March, the snow cover in the low-elevation areas (i.e., <1000 m in Fig. 1a ) is mostly melted. The snow cover in the Nakadori Valley, including the Fukushima site, is highest in January. Some areas over the Kantō Plain are also covered with snow in January. Extensive snow cover is in addition observed in the Abukuma Highlands, including Namie (Tsushima), in February.
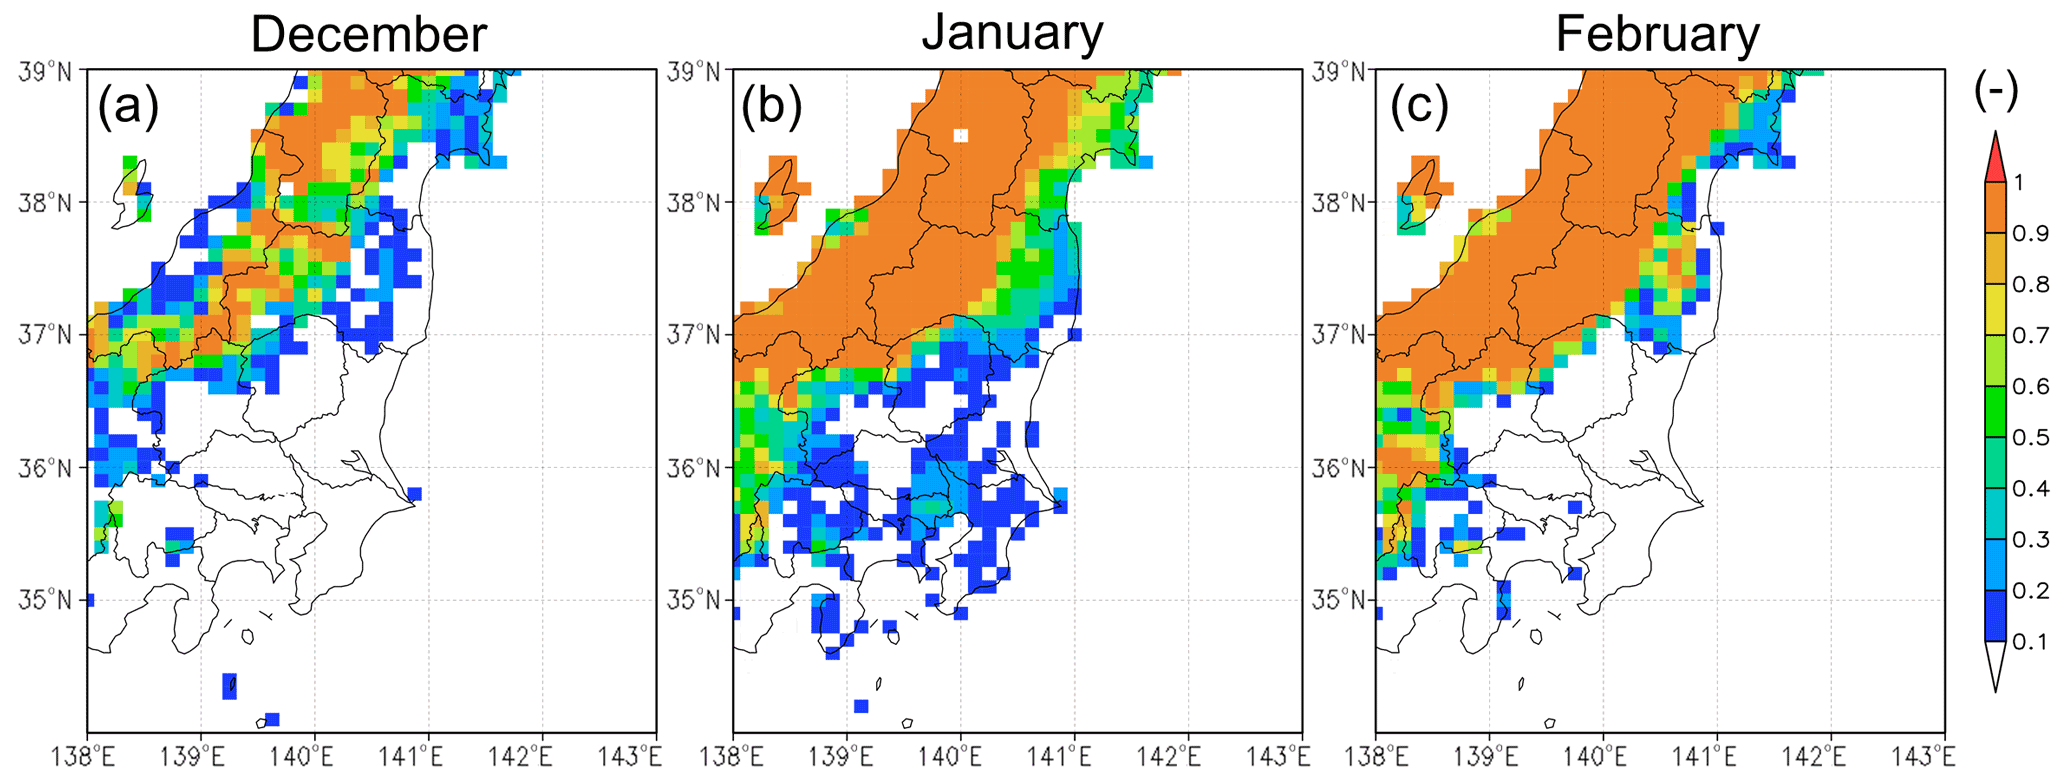
Figure 9Monthly mean MODIS snow cover fractions interpolated to the model grid boxes.
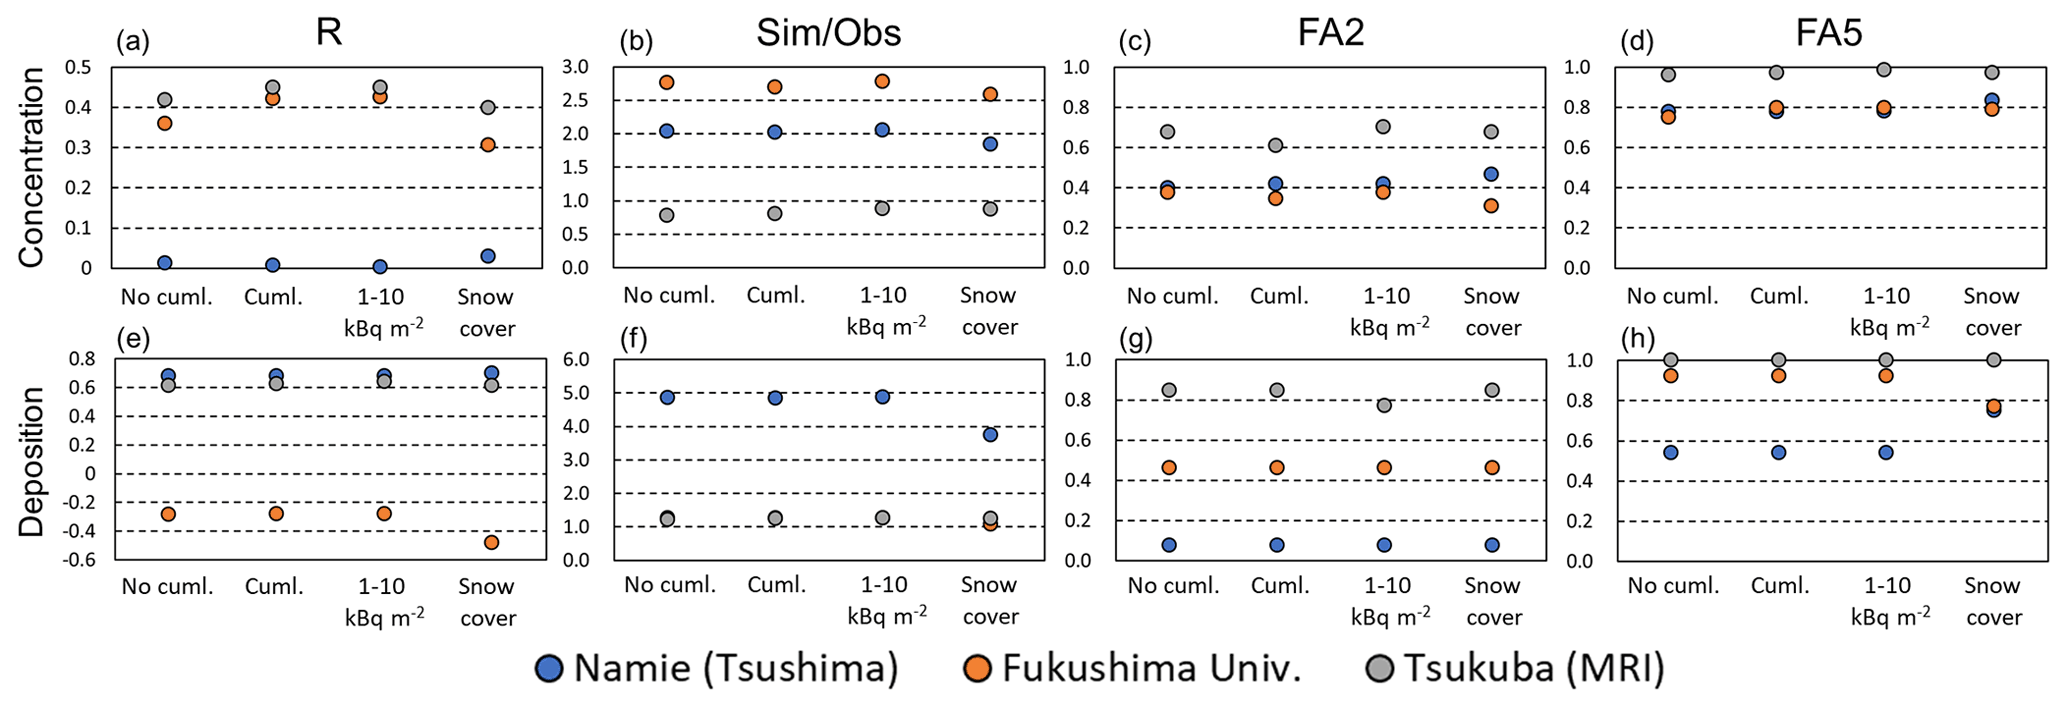
Figure 10Summary of statistical measures between the observations and the simulations (dust plus forest) for various sensitivity tests, such as (from left to right) the correlation coefficient (R), simulation-to-observation median ratio (Sim Obs), numerical fraction of data within a factor of 2 (FA2), and numerical fraction of data within a factor of 5 (FA5) for (top) the surface concentrations and (bottom) depositions at (blue) Namie (Tsushima), (orange) Fukushima, and (gray) Tsukuba. The four sensitivity tests are conducted for the supermicron case and consider no cumulus convection parameterization ([No cuml.]), the addition of the cumulus convection parameterization ([Cuml.]), cumulus convection plus emissions from grid boxes where the initial deposition amounts are 1–10 kBq m−2 ([1–10 kBq m−2]), and cumulus convection plus emissions from the 1–10 kBq m−2 areas plus suppressed emissions in the presence of snow coverage ([Snow cover]).
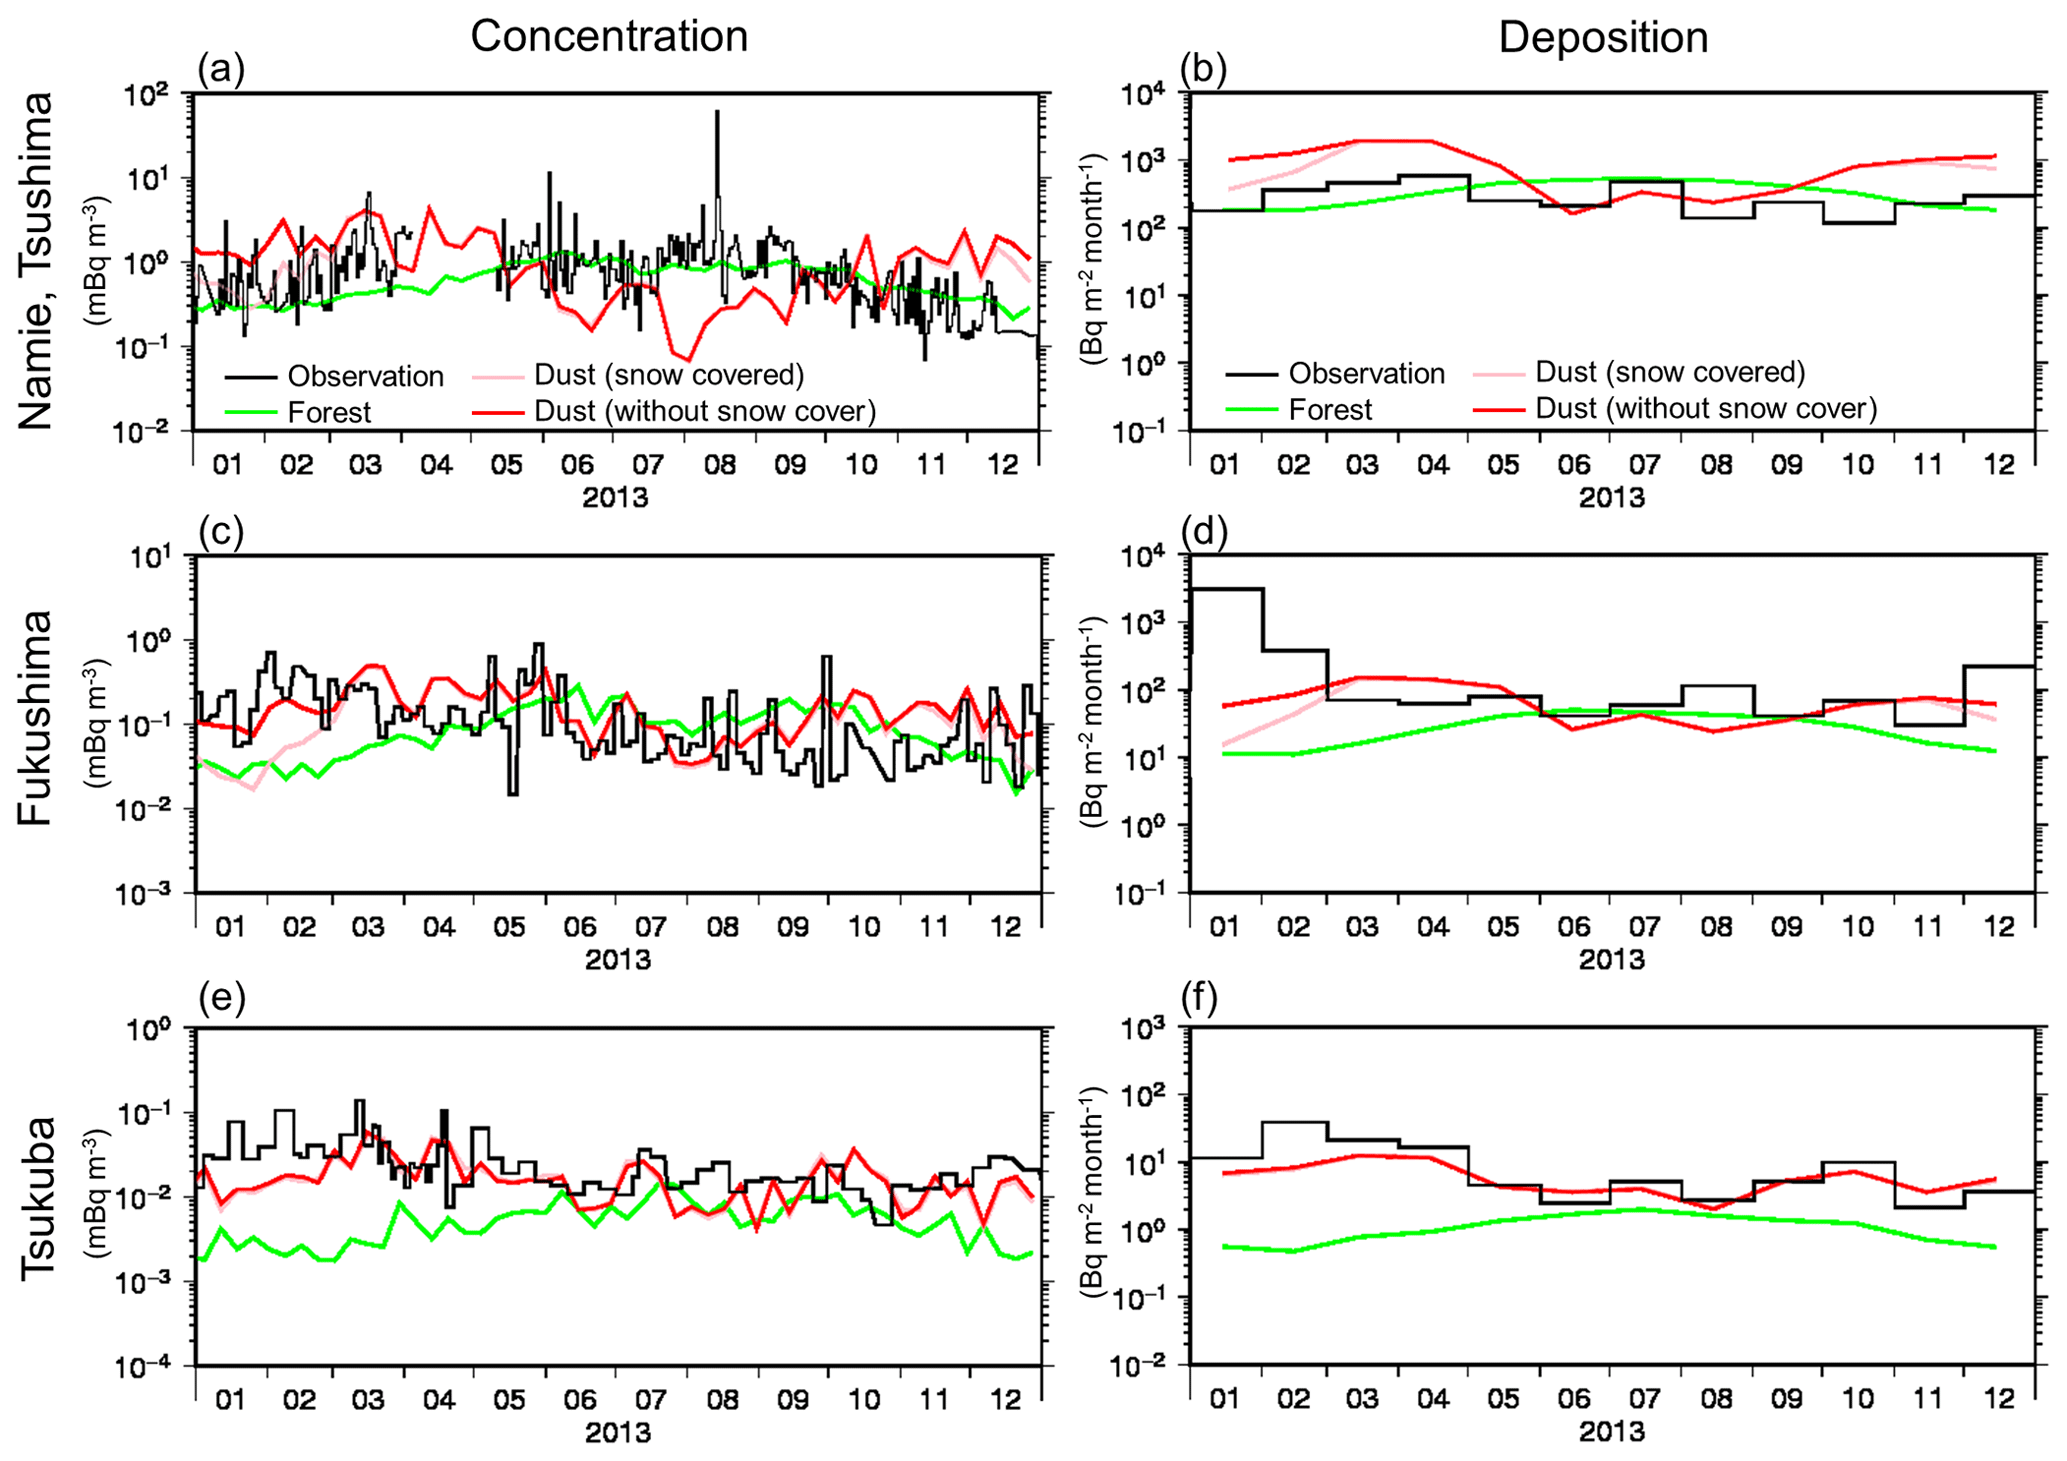
Figure 11(a, c, e) Temporal variations in the surface concentrations of (black) observed 137Cs and simulated 137Cs associated with (red) dust aerosols (denoted as “1–10 kBq m−2” in Fig. 10), (pink) dust aerosols with emissions suppressed by surface snow coverage (denoted as “Snow cover” in Fig. 10), and (lime) forest aerosols (denoted as “1–10 kBq m−2” in Fig. 10), assuming supermicron sizes of 137Cs-bearing particles at (top to bottom) Namie (Tsushima), Fukushima, and Tsukuba (mBq m−3). The sampling intervals are used for the observations, but weekly mean values are depicted for the simulations. (b, d, f) Same as the left panels but for the monthly cumulative deposition amounts (Bq m−2).
Figure 10 compares the statistical metrics R, Sim Obs, FA2, and FA5 of the concentrations (daily to weekly depending on the site) and monthly depositions for the four sensitivity tests for the supermicron case. The statistical metrics for the submicron case are not shown here, as the major points are already described in Sect. 3.1. Among the sensitivity tests, implementation of the cumulus convection parameterization ([Cuml.]) and the inclusion of less-contaminated areas ([1–10 kBq m−2]) do not cause any substantial changes in the performances of simulating the concentrations and depositions, but the difference induced by including the snow cover effect ([Snow cover]) is evident. The supermicron simulations indicate that including snow cover improves the performance at Namie (Tsushima) (indicated by the Sim Obs and FA5 values of the deposition) but deteriorates the performance at Fukushima (as indicated by the R value of the concentrations and the FA5 value of the deposition). Figure 11 compares the simulated dust between these two settings, [1–10 kBq m−2] and [Snow cover], to analyze the concentrations and depositions of the supermicron case at the three sites. Apparently, [Snow cover] improves both the concentration and deposition simulations at Namie (Tsushima) in January, February, and December but deteriorates both the concentration and deposition simulations at Fukushima. This result is consistent with the fact that no decontamination work occurred in the DRZ around Namie (Tsushima) in 2013, so snow cover suppressed resuspension from the bare soil. On the other hand, people live in Fukushima city and the surrounding municipalities, so snow removal operations (deicing agents and snow blowers) are applied after each snowfall. In fact, substantial amounts of road salts are observed in roadside PM10 measurements in Nordic countries in winter (Denby et al., 2016), indicating the presence of road dust emissions after snow removal operations. In Fukushima city in 2013, most public facilities and agricultural fields were already decontaminated, but the achievement ratios of decontamination on roads and forests were lower than 10 % (Watanabe et al., 2021). Thus, snowfall did not suppress the dust emissions around Fukushima city, which may be the reason why [Snow cover] deteriorates the model performance at the Fukushima site.
The regional budget of resuspended 137Cs originating from the Fukushima nuclear accident assessed by Kajino et al. (2016) (K16) for 2013 is reassessed in this study. K16 assumed resuspension aerosol sizes similar to those of primary emissions (the direct emissions from the F1NPP associated with the accident), which are submicron-sized. However, Watanabe et al. (2021) determined that the deposition amounts simulated by K16 were substantially underestimated. Based on recent cumulative knowledge, major resuspension aerosols could be supermicron-sized, such as soil dust (Ishizuka et al., 2017; Kinase et al., 2018) and bioaerosols (Kinase et al., 2018; Igarashi et al., 2019b; Kita et al., 2020; Minami et al., 2020; Igarashi, 2021). Lower possibilities of submicron particle involvement, such as that resulting from forest fires (Kinase et al., 2018) and epicuticular wax (Nakagawa et al., 2018), have been reported. Thus, the regional budget considering supermicron aerosols is remarkably different from that considering submicron aerosols: faster supermicron deposition rates necessitate higher emission fluxes to sustain the simulated surface concentrations at the observed levels.
To evaluate the simulations, measured concentration and deposition data obtained at three stations, Namie (Tsushima), Fukushima, and Tsukuba, are used. In this study, the resuspension source area is defined as the area where the initial deposition amounts exceed 300 kBq m−2. The Namie (Tsushima) site (2300 kBq m−2) is in the resuspension source area and is surrounded by mountainous forests in the Abukuma Highlands. The Fukushima site (190 kBq m−2) is characterized as an urban/rural region located outside but nearby the source area. The Tsukuba site (21 kBq m−2) is characterized as a downwind region. A source–receptor relationship analysis is performed, and resuspension ratios and redistribution amounts are derived. The effects of snow cover on resuspension and the contributions of resuspension to the actual decreasing trends in the ambient gamma dose rates are discussed.
The major findings in the context of contrasting the two different particle sizes are summarized as follows.
-
Regarding the submicron particles, the surface concentrations of 137Cs at Namie (Tsushima) in winter are quantitatively explained by multiplying the dust emission scheme of Ishizuka et al. (2017) by five, but these values are substantially underestimated in the summer. Additional forest emissions with applying a constant factor of 10−7 h−1 explain the enhancement of the observed 137Cs surface concentrations in summer at Namie (Tsushima). However, this effect causes opposite seasonal variations at the Fukushima site: the simulated concentrations are high in summer, but the observations are low in summer. In addition, this factor causes deposition underestimations by 2 orders of magnitude at all sites, Namie (Tsushima), Fukushima, and Tsukuba. The annual mean source contributions of the resuspension source area for the concentrations are 90 %, 16 %, and 21 %, and those for the depositions are 95 %, 13 %, and 20 % for Namie (Tsushima), Fukushima, and Tsukuba, respectively. The total areal annual resuspension of 137Cs is 1.28 TBq, which is equivalent to only 0.048 % of the initial deposition in March 2011, i.e., 2.68 TBq. The decreasing trend of the observed gamma dose rate in Fukushima Prefecture was 1.0–7.9 × 10⁻⁴ d−1 in 2013 after the radioactive decay of 134Cs and 137Cs was excluded. The decreasing trend is due to decontamination and natural decay, such as that occurring due to land surface processes. The resuspension rate through the atmosphere is 0.048 % yr−1 (1.3 × 10⁻⁶ d−1), which is negligibly small compared to the decreasing trend. Together with the discharge rate through rivers estimated as 0.02 % yr−1–0.3 % yr−1 (Iwagami et al., 2017), K16 concluded that ground surface 137Cs stays or circulates within local terrestrial ecosystems and is hardly discharged through the atmosphere or rivers.
-
Regarding the supermicron particles, by using the climatological deposition velocity analysis proposed by Watanabe et al. (2021), the dry and wet deposition parameters are successfully constrained by the concentrations and depositions measured at the three sites. The constrained dry and wet scavenging rates of supermicrons are 100 times and 10 times those of submicrons, respectively, resulting in the emission fluxes of both dust and forest aerosols being enhanced 20-fold. Compared to the submicron case, the source contributions of supermicrons are higher in the source areas and lower in the receptor regions. The annual mean source contributions of the resuspension source area for the concentrations are 94.0 %, 9.1 %, and 5.4 %, and those for the depositions are 99.5 %, 2.2 %, and 1.0 % at Namie (Tsushima), Fukushima, and Tsukuba, respectively. The total areal annual resuspension of 137Cs is 25.7 TBq, which is equivalent to 0.96 % of the initial deposition. Due to the rapid deposition rates, the annual redeposition amount is also large, at 10.6 TBq; thus, approximately 40 % of emissions are redistributed over eastern Japan. However, the traveling distance should not be large because the source contributions of the depositions at Fukushima and Tsukuba are only 2.2 % and 1.0 %, respectively. The resuspension rate through the atmosphere is 0.96 % yr−1 (2.6 × 10⁻⁵ d−1), which may not be negligibly small, as it can account for 1–10 % of the decreasing rate due to decontamination and natural decay except radioactive decay (1.0–7.9 × 10⁻⁴ d−1). The areas with positive redistribution amounts (enhanced deposition due to resuspension) of 1–10 Bq m−2 are much larger for the supermicron case than those for the submicron case, and the maximum values are up to 100 Bq m−2 for the submicron case, especially over the ocean close to the coast of Fukushima Prefecture.
From the current analysis, it is likely that snow cover in winter (January, February, and December) suppressed the dust emissions in the source areas around the Namie (Tsushima) site but did not suppress emissions around the Fukushima site. This is because Namie (Tsushima) is located in the DRZ and human activities in this region were very limited in 2013, whereas snow removal operations involving deicing agents and snow blowers were performed in Fukushima city and the surrounding municipalities at this time. In addition, heavy traffic on the major roads close to the Fukushima site (<1 km) may produce substantial numbers of superlarge road dust (or road salt) particles (∼ 100 µm, which can travel only 1 km) from wet and muddy surfaces, which may in turn cause exceptionally large deposition amounts in Fukushima in January. The completion of decontamination in 2013 was lower than 10 % for roads and forests in Fukushima city.
More than 10 years have passed since the accident, but the issues to be resolved in the future are still the same as those listed in K16. The current study represents an order estimation of the regional budget for only 1 year using a simple model and schemes. In addition to the utilized model and schemes, the current horizontal grid resolution is too coarse to reflect the heterogeneous distributions of various land use types. Soil dust and road dust emissions are relatively well formulated, but bioaerosols are not. Substantial efforts have been made to understand the emission mechanisms and quantifications of bioaerosol emission fluxes (Igarashi et al., 2019b; Kita et al., 2020; Minami et al., 2020), but it is still difficult to establish a set of formulas that is applicable for various vegetation surfaces. Our hypothesis of the existence of superlarge particles is not proven yet. The decreasing trends in atmospheric 137Cs differ between the periods before and after approximately 2015 (Watanabe et al., 2021), but the reason for this distinction is not clear. A long-term (i.e., 10-year) assessment using long-term measurements and numerical simulations is required. The quantification and formulation of size-resolved 137Cs emission fluxes from various sources should directly connect to the comprehensive understanding of the regional budget of resuspended 137Cs.
The observation and simulation data used for the figures and source codes of the LM are available at https://mri-2.mri-jma.go.jp/owncloud/s/Cr6nS3iJXPTZLf7 (Kajino, 2021).
The supplement related to this article is available online at: https://doi.org/10.5194/acp-22-783-2022-supplement.
MK developed the numerical model with RH and performed the numerical simulations with MI and KI. AW conducted the measurements at Fukushima University, and KK and TK conducted the concentration measurements at Namie (Tsushima). YS, HH, NA, MH, and ST supported the Namie (Tsushima) measurements and data analysis of the deposition measurements. YZ, YI, and TK conducted the measurements at Tsukuba. KK and AS supported the data analysis and figure generation. MK designed the paper structure and completed the draft together with all authors.
The contact author has declared that neither they nor their co-authors have any competing interests.
Publisher’s note: Copernicus Publications remains neutral with regard to jurisdictional claims in published maps and institutional affiliations.
This research has been supported by the Japan Society for the Promotion of Science, Grants-in-Aid for Scientific Research (KAKENHI) (grant nos. JP19H01155 and JP16KK0018), the Nuclear Regulation Authority of Japan (Japanese Radioactivity Survey), the Environmental Restoration and Conservation Agency (grant no. JPMEERF20215003), and the Ministry of Education, Culture, Sports, Science and Technology (grant no. JPMXD1420318865).
This paper was edited by Jerome Brioude and reviewed by two anonymous referees.
Adachi, K., Kajino, M., Zaizen, Y., and Igarashi, Y.: Emission of spherical cesium-bearing particles from an early stage of the Fukushima nuclear accident, Sci. Rep., 3, 12–15, https://doi.org/10.1038/srep02554, 2013.
Denby, B. R., Ketzel, M., Ellermann, T., Stojiljkovic, A., Kupiainen, K., Niemi, J. V., Norman, M., Johansson, C., Gustafsson, M., Blomqvist, G., Janhäll, S., and Sundvor, I.: Road salt emissions: A comparison of measurements and modelling using the NORTRIP road dust emission model, Atmos. Environ., 141, 508–522, https://doi.org/10.1016/j.atmosenv.2016.07.027, 2016.
Dépée, A., Lemaitre, P., Gelain, T., Mathieu, A., Monier, M., and Flossmann, A.: Theoretical study of aerosol particle electroscavenging by clouds, J. Aerosol Sci., 135, 1–20, https://doi.org/10.1016/j.jaerosci.2019.04.001, 2019.
Draxler, R., Arnold, D., Chino, M., Galmarini, S., Hort, M., Jones, A., Leadbetter, S., Malo, A., Maurer, C., Rolph, G., Saito, K., Servranckx, R., Shimbori, T., Solazzo, E., and Wotawa, G.: World Meteorological Organization's model simulations of the radionuclide dispersion and deposition from the Fukushima Daiichi nuclear power plant accident, J. Environ. Radioact., 139, 172–184, https://doi.org/10.1016/j.jenvrad.2013.09.014, 2015.
Emanuel, K. A. and Živković-Rothman, M.: Development and evaluation of a convection scheme for use in climate models, J. Atmos. Sci., 56, 1766–1782, https://doi.org/10.1175/1520-0469(1999)056< 1766:DAEOAC>2.0.CO;2, 1999.
Goto, D., Morino, Y., Ohara, T., Sekiyama, T. T., Uchida, J., and Nakajima, T.: Application of linear minimum variance estimation to the multi-model ensemble of atmospheric radioactive Cs-137 with observations, Atmos. Chem. Phys., 20, 3589–3607, https://doi.org/10.5194/acp-20-3589-2020, 2020.
Hososhima, M. and Kaneyasu, N.: Altitude-dependent distribution of ambient gamma dose rates in a mountainous area of japan caused by the fukushima nuclear accident, Environ. Sci. Technol., 49, 3341–3348, https://doi.org/10.1021/es504838w, 2015.
Igarashi, Y.: Bioaerosols emission from forest ecosystem – Close look at fungal spore, Earozoru Kenkyu, 36, 5–18, https://doi.org/10.11203/jar.36.5, 2021.
Igarashi, Y., Kajino, M., Zaizen, Y., Adachi, K., and Mikami, M.: Atmospheric radioactivity over Tsukuba, Japan: a summary of three years of observations after the FDNPP accident, Prog. Earth Planet. Sci., 2, 44, https://doi.org/10.1186/s40645-015-0066-1, 2015.
Igarashi, Y., Kogure, T., Kurihara, Y., Miura, H., Okumura, T., Satou, Y., Takahashi, Y., and Yamaguchi, N.: A review of Cs-bearing microparticles in the environment emitted by the Fukushima Dai-ichi Nuclear Power Plant accident, J. Environ. Radioact., 205–206, 101–118, https://doi.org/10.1016/j.jenvrad.2019.04.011, 2019a.
Igarashi, Y., Kita, K., Maki, T., Kinase, T., Hayashi, N., Hosaka, K., Adachi, K., Kajino, M., Ishizuka, M., Sekiyama, T. T., Zaizen, Y., Takenaka, C., Ninomiya, K., Okochi, H., and Sorimachi, A.: Fungal spore involvement in the resuspension of radiocaesium in summer, Sci. Rep., 9, 1954, https://doi.org/10.1038/s41598-018-37698-x, 2019b.
Imamura, N., Katata, G., Kajino, M., Kobayashi, M., Itoh, Y., and Akama, A.: Fogwater deposition of radiocesium in the forested mountains of East Japan during the Fukushima Daiichi Nuclear Power Plant accident: A key process in regional radioactive contamination, Atmos. Environ., 224, 117339, https://doi.org/10.1016/j.atmosenv.2020.117339, 2020.
Ishizuka, M., Mikami, M., Tanaka, T. Y., Igarashi, Y., Kita, K., Yamada, Y., Yoshida, N., Toyoda, S., Satou, Y., Kinase, T., Ninomiya, K., and Shinohara, A.: Use of a size-resolved 1-D resuspension scheme to evaluate resuspended radioactive material associated with mineral dust particles from the ground surface, J. Environ. Radioact., 166, 436–448, https://doi.org/10.1016/j.jenvrad.2015.12.023, 2017.
Iwagami, S., Onda, Y., Tsujimura, M., and Abe, Y.: Contribution of radioactive 137Cs discharge by suspended sediment, coarse organic matter, and dissolved fraction from a headwater catchment in Fukushima after the Fukushima Dai-ichi Nuclear Power Plant accident, J. Environ. Radioact., 166, 466–474, https://doi.org/10.1016/j.jenvrad.2016.07.025, 2017.
Kajino, M.: ACP_resus2_pubdata, Meteorological Research Institute [data set and code], available at: https://mri-2.mri-jma.go.jp/owncloud/s/Cr6nS3iJXPTZLf7, last access: 20 August 2021.
Kajino, M., Deushi, M., Maki, T., Oshima, N., Inomata, Y., Sato, K., Ohizumi, T., and Ueda, H.: Modeling wet deposition and concentration of inorganics over Northeast Asia with MRI-PM/c, Geosci. Model Dev., 5, 1363–1375, https://doi.org/10.5194/gmd-5-1363-2012, 2012.
Kajino, M., Ishizuka, M., Igarashi, Y., Kita, K., Yoshikawa, C., and Inatsu, M.: Long-term assessment of airborne radiocesium after the Fukushima nuclear accident: re-suspension from bare soil and forest ecosystems, Atmos. Chem. Phys., 16, 13149–13172, https://doi.org/10.5194/acp-16-13149-2016, 2016.
Kajino, M., Sekiyama, T. T., Igarashi, Y., Katata, G., Sawada, M., Adachi, K., Zaizen, Y., Tsuruta, H., and Nakajima, T.: Deposition and Dispersion of Radio-Cesium Released Due to the Fukushima Nuclear Accident: Sensitivity to Meteorological Models and Physical Modules, J. Geophys. Res.-Atmos., 124, 1823–1845, https://doi.org/10.1029/2018JD028998, 2019.
Kajino, M., Adachi, K., Igarashi, Y., Satou, Y., Sawada, M., Thomas Sekiyama, T., Zaizen, Y., Saya, A., Tsuruta, H., and Moriguchi, Y.: Deposition and Dispersion of Radio-Cesium Released due to the Fukushima Nuclear Accident: 2. Sensitivity to Aerosol Microphysical Properties of Cs-Bearing Microparticles (CsMPs), J. Geophys. Res.-Atmos., 126, e2020JD033460, https://doi.org/10.1029/2020JD033460, 2021.
Kaneyasu, N., Ohashi, H., Suzuki, F., Okuda, T., and Ikemori, F.: Sulfate aerosol as a potential transport medium of radiocesium from the fukushima nuclear accident, Environ. Sci. Technol., 46, 5720–5726, https://doi.org/10.1021/es204667h, 2012.
Katata, G., Chino, M., Kobayashi, T., Terada, H., Ota, M., Nagai, H., Kajino, M., Draxler, R., Hort, M. C., Malo, A., Torii, T., and Sanada, Y.: Detailed source term estimation of the atmospheric release for the Fukushima Daiichi Nuclear Power Station accident by coupling simulations of an atmospheric dispersion model with an improved deposition scheme and oceanic dispersion model, Atmos. Chem. Phys., 15, 1029–1070, https://doi.org/10.5194/acp-15-1029-2015, 2015.
Kinase, T., Kita, K., Igarashi, Y., Adachi, K., Ninomiya, K., Shinohara, A., Okochi, H., Ogata, H., Ishizuka, M., Toyoda, S., Yamada, K., Yoshida, N., Zaizen, Y., Mikami, M., Demizu, H., and Onda, Y.: The seasonal variations of atmospheric 134,137Cs activity and possible host particles for their resuspension in the contaminated areas of Tsushima and Yamakiya, Fukushima, Japan, Prog. Earth Planet. Sci., 5, 12, https://doi.org/10.1186/s40645-018-0171-z, 2018.
Kita, K., Igarashi, Y., Kinase, T., Hayashi, N., Ishizuka, M., Adachi, K., Koitabashi, M., Sekiyama, T. T., and Onda, Y.: Rain-induced bioecological resuspension of radiocaesium in a polluted forest in Japan, Sci. Rep., 10, 1–15, https://doi.org/10.1038/s41598-020-72029-z, 2020.
Kitayama, K., Morino, Y., Takigawa, M., Nakajima, T., Hayami, H., Nagai, H., Terada, H., Saito, K., Shimbori, T., Kajino, M., Sekiyama, T. T., Didier, D., Mathieu, A., Quélo, D., Ohara, T., Tsuruta, H., Oura, Y., Ebihara, M., Moriguchi, Y., and Shibata, T.: Atmospheric Modeling of 137Cs Plumes From the Fukushima Daiichi Nuclear Power Plant—Evaluation of the Model Intercomparison Data of the Science Council of Japan, J. Geophys. Res.-Atmos., 123, 7754–7770, https://doi.org/10.1029/2017JD028230, 2018.
Leadbetter, S. J., Hort, M. C., Jones, A. R., Webster, H. N., and Draxler, R. R.: Sensitivity of the modelled deposition of Caesium-137 from the Fukushima Dai-ichi nuclear power plant to the wet deposition parameterisation in NAME, J. Environ. Radioact., 139, 200–211, https://doi.org/10.1016/j.jenvrad.2014.03.018, 2015.
Li, X., Sun, S., Hu, X., Huang, H., Li, H., Morino, Y., Wang, S., Yang, X., Shi, J., and Fang. S.: Source inversion of both long- and short-lived radionuclide releases from the Fukushima Daiichi nuclear accident using on-site gamma dose rates, J. Hazard. Mater., 379, 120770, https://doi.org/10.1016/j.jhazmat.2019.120770, 2019.
Loosemore, G. A. and Hunt, J. R.: Dust resuspension without saltation, J. Geophys. Res., 105, 20663–20671, https://doi.org/10.1029/2000JD900271, 2002.
Mathieu, A., Kajino, M., Korsakissok, I., Périllat, R., Quélo, D., Quérel, A., Saunier, O., Sekiyama, T. T., Igarashi, Y., and Didier, D.: Fukushima Daiichi–derived radionuclides in the atmosphere, transport and deposition in Japan: A review, Appl. Geochem., 91, 122–139, https://doi.org/10.1016/j.apgeochem.2018.01.002, 2018.
Minami, K., Katata, G., Kita, K., Sorimachi, A., Hosaka, K., and Igarashi, Y.: Numerical Analyses of Transport Processes of Bioaerosol Released from a Temperate Deciduous Broad-Leaved Forest, Earozoru Kenkyu, 35, 208–218, https://doi.org/10.11203/jar.35.208, 2020.
Nakagawa, M., Yamada, K., Toyoda, S., Kita, K., Igarashi, Y., Komatsu, S., Yamada, K., and Yoshida, N.: Characterization of hydrocarbons in aerosols and investigation of biogenic sources as a carrier of radiocesium isotopes, Geochem. J., 52, 163–172, https://doi.org/10.2343/geochemj.2.0512, 2018.
Nakajima, T., Misawa, S., Morino, Y., Tsuruta, H., Goto, D., Uchida, J., Takemura, T., Ohara, T., Oura, Y., Ebihara, M., and Satoh, M.: Model depiction of the atmospheric flows of radioactive cesium emitted from the Fukushima Daiichi nuclear power station accident, Prog. Earth Planet. Sci., 4, 2, https://doi.org/10.1186/s40645-017-0117-x, 2017.
NRA (Nuclear Regulation Authority): Airborne Monitoring Results in each prefecture, available at: http://radioactivity.nsr.go.jp/en/list/203/list-1.html (last access: 31 July 2021), 2012.
NRA: Assessment of radionuclide emission involved in the debris removal operations for reactor 3; Handout for the 28th meeting on the supervision of a specific nuclear facility, available at: http://www.nsr.go.jp/data/000051154.pdf (last access: 11 November 2021), 2014 (in Japanese).
Ochiai, S., Hasegawa, H., Kakiuchi, H., Akata, N., Ueda, S., Tokonami, S., and Hisamatsu, S.: Temporal variation of post-accident atmospheric 137Cs in an evacuated area of Fukushima Prefecture: Size-dependent behaviors of 137Cs-bearing particles, J. Environ. Radioact., 165, 131–139, https://doi.org/10.1016/j.jenvrad.2016.09.014, 2016.
Oura, Y., Ebihara, M., Tsuruta, H., Nakajima, T., Ohara, T., Ishimoto, M., Sawahata, H., Katsumura, Y., and Nitta, W.: A Database of Hourly Atmospheric Concentrations of Radiocesium (134Cs and 137Cs) in Suspended Particulate Matter Collected in March 2011 at 99 Air Pollution Monitoring Stations in Eastern Japan, J. Nucl. Radiochem. Sci., 15, 2_1–2_12, https://doi.org/10.14494/jnrs.15.2_1, 2015.
Petroff, A. and Zhang, L.: Development and validation of a size-resolved particle dry deposition scheme for application in aerosol transport models, Geosci. Model Dev., 3, 753–769, https://doi.org/10.5194/gmd-3-753-2010, 2010.
Riggs, G. A., Hall, D., and Román, M. O.: MODIS Snow Products Collection 6 User Guide, Earth Sci., 6 (August), 1–80, available at: https://modis-snow-ice.gsfc.nasa.gov/uploads/C6_MODIS_Snow_User_Guide.pdf (last access: 31 July 2021), 2016.
Sanada, Y., Kondo, A., Sugita, T., Nishizawa, Y., Yuuki, Y., Ikeda, K., Shoji, Y., and Torii, T.: Radiation monitoring using an unmanned helicopter in the evacuation zone around the Fukushima Daiichi nuclear power plant, Explor. Geophys., 45, 3–7, https://doi.org/10.1071/EG13004, 2014.
Sanada, Y., Katata, G., Kaneyasu, N., Nakanishi, C., Urabe, Y., and Nishizawa, Y.: Altitudinal characteristics of atmospheric deposition of aerosols in mountainous regions: Lessons from the Fukushima Daiichi Nuclear Power Station accident, Sci. Total Environ., 618, 881–890, https://doi.org/10.1016/j.scitotenv.2017.08.246, 2018.
Sato, Y., Takigawa, M., Sekiyama, T. T., Kajino, M., Terada, H., Nagai, H., Kondo, H., Uchida, J., Goto, D., Quélo, D., Mathieu, A., Quérel, A., Fang, S., Morino, Y., von Schoenberg, P., Grahn, H., Brännström, N., Hirao, S., Tsuruta, H., Yamazawa, H., and Nakajima, T.: Model Intercomparison of Atmospheric 137Cs From the Fukushima Daiichi Nuclear Power Plant Accident: Simulations Based on Identical Input Data, J. Geophys. Res.-Atmos., 123, 11748–11765, https://doi.org/10.1029/2018JD029144, 2018.
Sato, Y., Sekiyama, T. T., Fang, S., Kajino, M., Quérel, A., Quélo, D., Kondo, H., Terada, H., Kadowaki, M., Takigawa, M., Morino, Y., Uchida, J., Goto, D., and Yamazawa, H.: A model intercomparison of atmospheric 137Cs concentrations from the Fukushima Daiichi Nuclear Power Plant accident, phase III: Simulation with an identical source term and meteorological field at 1-km resolution, Atmos. Environ., 7, 100086, https://doi.org/10.1016/j.aeaoa.2020.100086, 2020.
Sekiyama, T. T. and Iwasaki, T.: Mass flux analysis of 137Cs plumes emitted from the Fukushima Daiichi nuclear power plant, Tellus B, 70, 1–11, https://doi.org/10.1080/16000889.2018.1507390, 2018.
Sekiyama, T. T. and Kajino, M.: Reproducibility of surface wind and tracer transport simulations over complex terrain using 5-, 3-, and 1-km-grid models, J. Appl. Meteorol. Clim., 59, 937–952, https://doi.org/10.1175/JAMC-D-19-0241.1, 2020.
Sekiyama, T. T., Kajino, M., and Kunii, M.: Ensemble dispersion simulation of a point-source radioactive aerosol using perturbed meteorological fields over eastern Japan, Atmosphere, 12, 662, https://doi.org/10.3390/atmos12060662, 2021.
Skamarock, W. C., Klemp, J. B., Dudhia, J. B., Gill, D. O., Barker, D. M., Duda, M. G., Huang, X.-Y., Wang, W., and Powers, J. G.: A description of the Advanced Research WRF Version 3, NCAR Technical Note TN-475+STR, Tech. Rep., 113, 2008.
Steinhauser, G., Niisoe, T., Harada, K. H., Shozugawa, K., Schneider, S., Synal, H. A., Walther, C., Christl, M., Nanba, K., Ishikawa, H., and Koizumi, A.: Post-Accident Sporadic Releases of Airborne Radionuclides from the Fukushima Daiichi Nuclear Power Plant Site, Environ. Sci. Technol., 49, 14028–14035, https://doi.org/10.1021/acs.est.5b03155, 2015.
Terada, H., Nagai, H., Tsuduki, K., Furuno, A., Kadowaki, M., and Kakefuda, T.: Refinement of source term and atmospheric dispersion simulations of radionuclides during the Fukushima Daiichi Nuclear Power Station accident, J. Environ. Radioact., 213, 106104, https://doi.org/10.1016/j.jenvrad.2019.106104, 2020.
Torii, T., Sanada, Y., Shikaze, Y., Takahashi, M., Ishida, M., Nishizawa, Y., Urabe, Y., Sugita, T., and Kondo, A.: Investigation of radionuclide distribution using aircraft for surrounding environmental survey from Fukushima Dai-ichi Nuclear Power Plant, 182, available at: https://inis.iaea.org/search/search.aspx?orig_q=RN:44087099 (last access: 2 August 2021), 2012.
Torii, T., Sugita, T., Okada, C. E., Reed, M. S., and Blumenthal, D. J.: Enhanced analysis methods to derive the spatial distribution of 131I deposition on the ground by airborne surveys at an early stage after the fukushima daiichi nuclear power plant accident, Health Phys., 105, 192–200, https://doi.org/10.1097/HP.0b013e318294444e, 2013.
Tsuruta, H., Oura, Y., Ebihara, M., Ohara, T., and Nakajima, T.: First retrieval of hourly atmospheric radionuclides just after the Fukushima accident by analyzing filter-tapes of operational air pollution monitoring stations, Sci. Rep., 4, 1–32, https://doi.org/10.1038/srep06717, 2014.
Wang, X., Zhang, L., and Moran, M. D.: Uncertainty assessment of current size-resolved parameterizations for below-cloud particle scavenging by rain, Atmos. Chem. Phys., 10, 5685–5705, https://doi.org/10.5194/acp-10-5685-2010, 2010.
Watanabe, A., Kajino, M., Ninomiya, K., Nagahashi, Y., and Shinohara, A.: Eight-year variations in atmospheric radiocesium in Fukushima city, Atmos. Chem. Phys., 22, 675–692, https://doi.org/10.5194/acp-22-675-2022, 2022.
Yumimoto, K., Morino, Y., Ohara, T., Oura, Y., Ebihara, M., Tsuruta, H., and Nakajima, T.: Inverse modeling of the 137Cs source term of the Fukushima Dai-ichi Nuclear Power Plant accident constrained by a deposition map monitored by aircraft, J. Environ. Radioact., 164, 1–12, https://doi.org/10.1016/j.jenvrad.2016.06.018, 2016.