the Creative Commons Attribution 4.0 License.
the Creative Commons Attribution 4.0 License.
Impact of stratospheric aerosol intervention geoengineering on surface air temperature in China: a surface energy budget perspective
Zhaochen Liu
Xianmei Lang
Stratospheric aerosol intervention (SAI) geoengineering is a proposed scheme to counteract anthropogenic global warming, but the climate response to SAI, with great regional disparities, remains uncertain. In this study, we use Geoengineering Model Intercomparison Project G4 experiment simulations from six models that counteract anthropogenic forcing under medium–low emissions (Representative Concentration Pathway 4.5 – RCP4.5) by injecting a certain amount of SO2 into the stratosphere every year to investigate the surface air temperature response to SAI geoengineering over China. We have found that SAI has led to surface cooling over China during the last 40 years of injection simulation (2030–2069), which varies among models, regions, and seasons. Decreased tropospheric temperature and water vapor and increased stratospheric aerosols induce robust decreases in downward clear-sky longwave and shortwave radiation fluxes at the surface, respectively, dominating the temperature change over China. Changes in cloud effective forcing and surface albedo feedback also relate to the temperature response but with large spatial and seasonal variations. We find that the increased summer cloud cover and winter surface albedo lead to strong cooling, while the decreased summer cloud cover and winter surface albedo lead to weak cooling or even insignificant warming for the certain subregions and models. Our results suggest that cloud and land surface processes in models dominate the spatial pattern of SAI-induced surface air temperature change over China.
- Article
(7830 KB) - Full-text XML
-
Supplement
(712 KB) - BibTeX
- EndNote
The increasing anthropogenic greenhouse gas (GHG) concentrations since the industrial revolution have led to global warming. Although the international community has realized the risk of global warming and attempted to reduce GHG emissions, global GHG emissions still show a continuous increase (United Nations Environment Programme, 2020). The 2 ∘C global temperature target in the Paris Agreement will be unachievable if the current increasing emission trend persists (e.g., Robiou du Pont and Meinshausen, 2018). Solar radiation modification (SRM), which refers to a range of measures adjusting the Earth's radiative balance, is considered as an option to counteract anthropogenic global warming. Various specific techniques have been proposed to perform SRM geoengineering, such as injecting sulfate aerosols into the stratosphere (Budyko, 1977), placing shields or deflectors in space (Seifritz, 1989), brightening marine clouds (Latham, 1990), and thinning cirrus clouds (Mitchell and Finnegan, 2009). The method of injecting sulfate aerosols or their precursors into the stratosphere, also known as stratospheric aerosol intervention (SAI) geoengineering, is designed to cool the surface by using these aerosols to reflect and scatter solar radiation (Crutzen, 2006; Wigley, 2006). As a proposed scheme, SAI has attracted great attention recently due to its assumed technological feasibility (e.g., Irvine et al., 2016).
SRM geoengineering has not been implemented in reality because of its potential risks and immature technology. The primary means of recognizing the climate response to geoengineering is simulating via general circulation models (GCMs). However, the results from early simulations could not be proved robust due to the differences in experimental schemes. The Geoengineering Model Intercomparison Project (GeoMIP) has been proposed to address that issue (Kravitz et al., 2011, 2015). To date, the GeoMIP has designed 12 experiments, including solar dimming, stratospheric aerosol intervention, marine cloud brightening, and cirrus thinning geoengineering in the Coupled Model Intercomparison Project phases 5 and 6 (CMIP5 and CMIP6). The GeoMIP provides detailed guidelines for each model and experiment and calls for all the modeling groups worldwide to become involved and share their simulations. A total of 19 GCMs have participated in the GeoMIP to date. More detailed information is accessible at the GeoMIP website (http://climate.envsci.rutgers.edu/GeoMIP/, last access: 25 May 2022).
Previous studies have indicated that SRM geoengineering could counteract or even reverse anthropogenic global warming and reduce sea ice melting and thermosteric sea level rise, as well as decrease the frequency and intensity of extreme temperature and precipitation events (Rasch et al., 2008; Robock, 2015; Irvine et al., 2016; Ji et al., 2018; Jones et al., 2018). It might also come with risks. For instance, SRM geoengineering would reduce the global mean precipitation and monsoon precipitation and slow the hydrological cycle if it is used to offset the GHG-induced global warming (Bala et al., 2008; Tilmes et al., 2013; Sun et al., 2020). SRM would not mitigate the continued ocean acidification caused by CO2 emissions (Caldeira et al., 2013). The sudden termination of geoengineering would lead to a more rapid increase in temperature than the non-geoengineered case (Matthews and Caldeira, 2007; Jones et al., 2013). The severity of the termination effect depends on the magnitude of geoengineering deployment. Moreover, the SAI-induced heterogeneous chemistry and stratospheric circulation changes might cause stratospheric ozone depletion and thus increase ultraviolet radiation (UV) at the surface (Tilmes et al., 2008, 2022; Visioni et al., 2021).
An appropriate SRM geoengineering strategy might lead to global cooling and benefit most regions (Irvine et al., 2019). However, it was still a concern that some regions might face greater climatic impacts or risks under SRM forcing (Ricke et al., 2013; Kravitz et al., 2014). For example, Robock et al. (2008) indicated that the weakening of the Asian and African summer monsoons caused by the injected stratospheric aerosols over the Arctic would decrease cloudiness and in turn warm the surface over northern Africa and India. In addition to the effect of cloudiness, changes in atmospheric moisture and surface conditions caused by SAI also impact surface air temperature (Kashimura et al., 2017). As the largest developing country in the world, China plays an important role in combating climate change. China's attitude to SAI is crucial to the international geoengineering research community. Considering the combined effect of the Tibetan Plateau and the East Asian Monsoon, the climate over China would be strongly influenced by SAI. Large volcanic eruptions, which inject massive volcanic aerosols into the stratosphere, are considered a natural analog to SAI geoengineering (Trenberth and Dai, 2007). The 1815 Mount Tambora eruption led to the so-called year without a summer over China (e.g., Raible et al., 2016). But the volcanic eruption is not a perfect analog. This is because the sulfate aerosols from massive volcanic eruptions only last for 2–3 years, while the SAI-induced aerosols are continuously replenished for decades or centuries (Duan et al., 2019). So far, few studies have studied the temperature response to SAI geoengineering over China explicitly (Cao et al., 2015).
In this study, we investigate the impact of the SAI geoengineering on the surface air temperature over China and the underlying physical processes from a surface energy perspective. Section 2 provides a brief introduction to the experiments, model data, and decomposition method of surface air temperature change. Section 3 evaluates the ability of models to reproduce the climatological temperature over China in summer and winter. Section 4 presents the summer and winter temperature changes and associated reasons over China in response to SAI geoengineering, and we also analyze the physical processes responsible for the SAI-induced temperature changes over China. Conclusions and discussion are presented in Sect. 5.
2.1 Experiments
We use the G4 experiment from the first phase of the GeoMIP (Kravitz et al., 2011). As a SAI-based geoengineering experiment, G4 is designed to inject SO2 into the low-level equatorial stratosphere at a consistent rate of 5 Tg yr−1 under the background scenario of Representative Concentration Pathway 4.5 (RCP4.5; Taylor et al., 2012). This injection rate is equivalent to a case in which the 1991 Mount Pinatubo eruption occurred every 4 years (Bluth et al., 1992). The injection period is from 2020 to 2069, and then the experiment continues to run until 2089 to examine the termination effect (Jones et al., 2013). The RCP4.5 simulation for the same period is used as a baseline (non-geoengineered) state. In addition, the historical simulation for 1986–2005 is applied to evaluate the ability of the selected models to reproduce the climatology of surface air temperature over China.
2.2 Data
A total of 12 GCMs participated in the G4 experiment (Kravitz et al., 2013a). However, some models should not be considered in this study due to their known issues. For instance, CSIRO-Mk3L-1-2 runs G4 by directly reducing solar irradiance rather than injecting stratospheric aerosols, GISS-E2-R shows an inconsistency between G4/RCP4.5 and historical experiments, IPSL-CM5A-LR and NorESM1-M have errors in the longwave treatment of the sulfate aerosol, and GEOSCCM and ULAQ use prescribed sea surface temperatures. Simulations from the other six models are applied for analyses. Monthly datasets are used and calculated as the averages in summer (June–July–August, JJA) and winter (December–January–February, DJF). The CN05.1 observation dataset (Wu and Gao, 2013) is used to evaluate the ability of models to reproduce the climatology of temperature over China. All the observations and model outputs are interpolated to a common grid with a mid-range horizontal resolution (2.5∘ longitude by 2∘ latitude).
A brief description of the selected models is illustrated in Table 1. In addition to differences in the physical and chemical modules related to sulfate aerosol particles, the models have different SO2 injection treatments. For HadGEM2-ES, the CLASSIC aerosol module (Bellouin et al., 2011) used in the stratosphere makes it possible to handle the injections of SO2, allowing HadGEM2-ES to perform a complete simulation, including the generation and transportation of stratospheric sulfate aerosols. The injection point is located on the Equator (0∘ longitude), and the injection altitude ranges from 16 to 25 km. For CanESM2, the stratospheric aerosol optical depth (SAOD) caused by SAI is prescribed as a consistent value. For other models (BNU-ESM, CNRM-ESM1, MIROC-ESM, and MIROC-ESM-CHEM), the prescribed distribution of SAOD, according to Sato (2006), is used to drive the G4 experiment. Besides, MIROC-ESM-CHEM calculates the surface density of sulfate aerosols by using the CHASER atmospheric chemistry module (Sudo et al., 2002; Kravitz et al., 2013a).
2.3 Decomposition method for SAI-induced surface air temperature change
Surface air temperature is a widely used variable in climate studies. The change in surface air temperature is associated with the following three components: surface vertical energy fluxes (including radiative and heat fluxes), horizontal temperature advection, and adiabatic warming or cooling (Gong et al., 2017). In this study, the SAI-induced changes in surface temperature and surface air temperature are strongly coupled in China during 2030–2069 (the correlation coefficients are higher than 0.98 and 0.99 in summer and winter, respectively; Fig. 1). Thus, the surface vertical energy fluxes are considered to be the main factor affecting temperature change under SAI forcing.
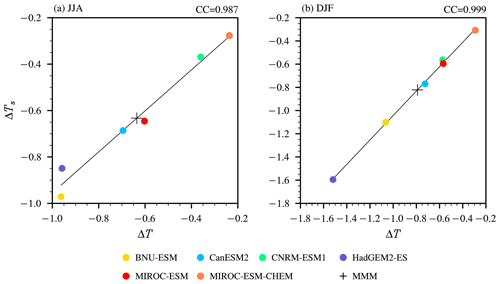
Figure 1Scatterplots of the relationship between changes in surface air temperature (T) and surface temperature (Ts) over China due to SAI forcing during the period of 2030–2069 in (a) summer (JJA) and (b) winter (DJF), and CC is their correlation coefficient. Scattered dots and crosses represent individual models and their mean, respectively.
According to the decomposition method, based on the surface energy budget proposed by Lu and Cai (2009), the surface air temperature change caused by SAI can be written as follows:
where Δ represents the difference between G4 and RCP4.5, the overbar represents the climatological value of RCP4.5, R↓ is the downward net radiation at the surface, SH and LH are surface sensible and latent heat fluxes, respectively, Q is surface heat storage, Ts is surface temperature, and σ is the Stefan–Boltzmann constant. Res represents the difference between changes in surface air temperature and surface temperature. In order to quantitatively separate the radiative effects of clouds and surface albedo, the ΔR↓ can be decomposed as follows:
In Eqs. (2)–(4), SWas↓ represents downward surface shortwave radiation in all-sky conditions, SWcs↓ and LWcs↓ represent downward surface shortwave and longwave radiations in clear-sky conditions, respectively, SWcl↓ and LWcl↓ represent downward shortwave and longwave radiative effects of clouds (all-sky radiations minus clear-sky radiations), respectively, and α represents surface albedo (the ratio of solar radiation reflected to the atmosphere at the surface). SAF is surface albedo feedback, and CRF is cloud radiative forcing. Under SAI forcing, both the changes in atmospheric reflection and atmospheric absorption affect the SWcs↓. We assume that the clear-sky atmospheric reflection change is only affected by atmospheric water vapor amount, and the clear-sky atmospheric absorption change is only affected by the aerosol scattering effect. As detailed by Kashimura et al. (2017), the change in SWcs↓ can be further decomposed as follows:
where F is the fraction of solar radiation reflected by the atmosphere, and A is the fraction of absorption during solar radiation passing through the atmosphere. SWSRM and SWWV represent the effects of solar radiation scattering and atmospheric water vapor amount, respectively. Although the SWcs↓ change is not precisely equal to the sum of changes in SWSRM and SWWV due to the assumption of a single-layer model (Donohoe and Battisti, 2011), this method is effective when analyzing the surface shortwave radiation change in response to SAI (Kashimura et al., 2017).
The ability of the models to reproduce the surface air temperature over China is evaluated first. As shown in Fig. 2, the spatial correlation coefficient (SCC), standard deviation (SD), and centered root mean square error (CRMSE) between the observation and the historical simulation for climatological temperature over China during 1986–2005 are calculated and illustrated in a Taylor diagram (Taylor, 2001). The SCCs of the models range from 0.85 to 0.95 (0.94 in multi-model mean) in summer and from 0.91 to 0.96 (0.96 in multi-model mean) in winter. All the SCCs are statistically significant at the 99 % level, meaning that the simulated temperature is in good agreement with the observed temperature. The normalized SDs range from 0.81 to 1.33 in summer (0.99 in a multi-model mean) and from 1.03 to 1.23 (1.08 in a multi-model mean) in winter. This result indicates that all selected models overestimate the spatial variability in the winter temperature in China. The CRMSEs are 0.34–0.53 (0.35 in a multi-model mean) for summer and 0.32–0.46 (0.31 in a multi-model mean) for winter. Taken together, the simulations of summer and winter temperatures by selected models are reliable over China. The multi-model mean results outperform most individual models for the temperature climatology over China, both in summer and winter, which is consistent with previous findings (e.g., Jiang et al., 2016).
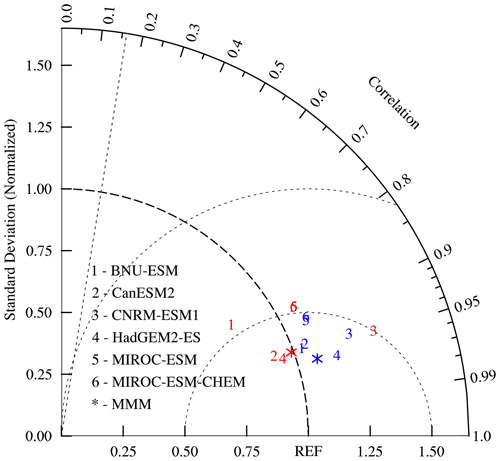
Figure 2Taylor diagram of climatological summer and winter temperatures over China between the historical simulations in selected models and observation during the period of 1986–2005. Numbers represent individual models, and asterisks represent the multi-model mean. Red and blue represent summer and winter, respectively. The dotted straight line shows the 99 % confidence level determined from the two-tailed Student's t test.
The observed spatial patterns of summer and winter temperature climatology over China show a general decrease from south to north, and the lowest values mainly occur in the Tibetan Plateau (Fig. 3a, d). These features can be well reproduced by all models and their mean (Fig. 3b, e). Compared to the observation, the simulated temperature is generally overestimated in summer but underestimated in winter over China according to the regionally averaged values. In summer, warm biases occur in most of eastern China, especially in northeastern China (Fig. 3c). In winter, however, the underestimation of temperature exists at a national scale, with a regionally averaged cold bias of 1.79 ∘C in the multi-model mean (Fig. 3f). Substantial cold biases occur over the Tarim Basin and the Tibetan Plateau, which are associated with regional topography. Most of the above biases are consistent among individual models, with the averaged model consistency of 76 % over China in both summer and winter.
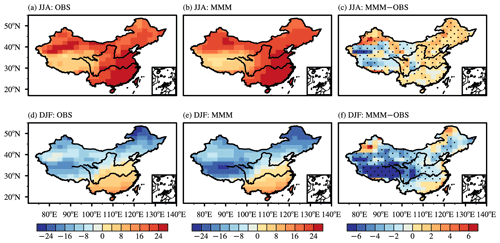
Figure 3Spatial patterns of surface air temperature climatology (units in ∘C) over China as obtained from observation (a, d; OBS), the multi-model mean (b, e; MMM), and the difference between multi-model mean and observation (c, f; MMM–OBS) during the period of 1986–2005 in summer (JJA) and winter (DJF). The dots in the far right column indicate areas where at least two-thirds of the models share the same sign of the bias.
4.1 Changes in surface air temperature over China
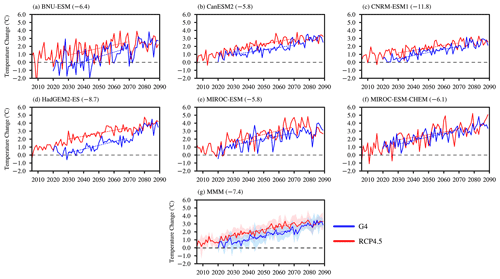
Figures 4 and 5 show the temporal evolution of surface air temperature changes in the G4 experiment and RCP4.5 scenario relative to the present climatology (1986–2005) over China. Both the summer and winter temperatures in G4 increase over time, although they are colder than those in RCP4.5. Positive values occur throughout the whole G4 simulation period, excluding several years in winter. This indicates that although the injection of 5 Tg SO2 yr−1 leads to a surface cooling over China, the climatological temperature in G4 is still higher than the present level. Considering that the feedback response timescale of diffusive ocean heat uptake in climate models is approximately 10 years (Jarvis, 2011), the simulation representing the last 40 years of injection (2030–2069) is used to examine the temperature response to SAI over China, as done by Kravitz et al. (2013b) and Tilmes et al. (2013). During this period, the warming trends over all of China in G4 among models are 0.21–0.43 ∘C per decade in summer and 0.30–0.59 ∘C per decade in winter. It can be seen that the warming trend difference between G4 and RCP4.5 is small, and this is expected because of the similar trend of radiative forcing variation in the two experiments during 2030–2069. The regionally averaged temperature over China is decreased by 0.24–0.96 ∘C (0.64 ∘C in the multi-model mean) in summer and 0.30–1.52 ∘C (0.80 ∘C in the multi-model mean) in winter due to SAI forcing. Although the magnitude of SAI-induced temperature change varies across models and seasons, the cooling response is consistent among models over China. The winter cooling is stronger than the summer level in all models. Additionally, the result shows the strongest SAI-induced cooling occurs in HadGEM2-ES in both summer and winter.
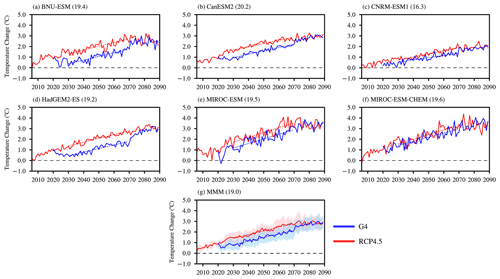
Figure 4Time series of regionally averaged surface air temperature (units in ∘C) over China in the G4 experiment (solid blue lines) and RCP4.5 scenario (solid red lines) in summer. The values are obtained by subtracting the present climatology (mean of 1986–2005; represented in parentheses) in the historical experiment. Blue and red dashed lines represent the linear trends of G4 and RCP4.5 simulations during the period of 2030–2069, respectively. The multi-model mean (MMM) is represented at the bottom, with the shading indicating 1 inter-model standard deviation.
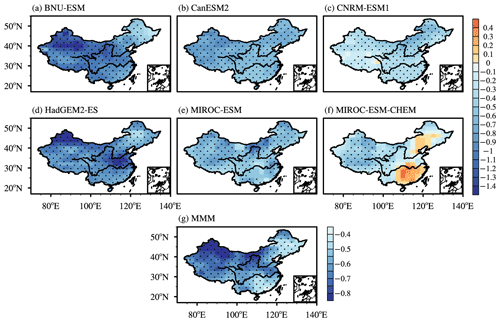
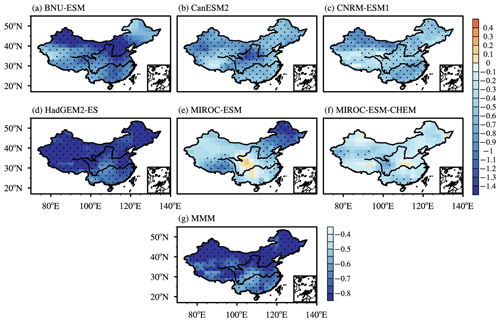
Figure 6Spatial patterns of surface air temperature differences (units in ∘C) between G4 and RCP4.5 over China during the period of 2030–2069 in summer for (a–f) individual models and (g) the multi-model mean. The dots in panels (a)–(f) indicate areas which are statistically significant at the 90 % confidence level. The dots in panel (g) indicate areas where at least two-thirds of the models share the same sign with the multi-model mean.
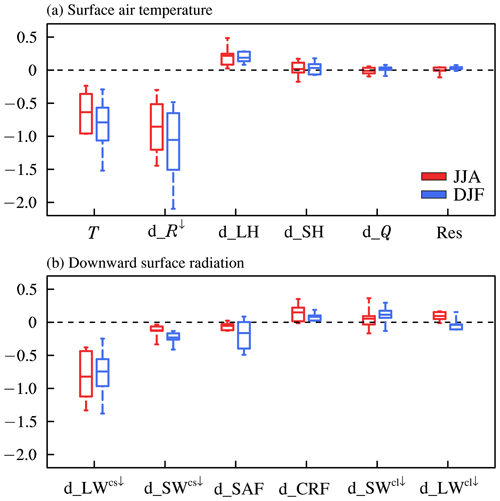
Figure 8Regionally averaged SAI-induced changes in surface air temperature (T) and relevant terms over China during the period of 2030–2069 (units in ∘C). The terms include surface air temperature changes due to (a) downward net surface radiation change (d_R↓), surface latent (d_LH) and sensible (d_SH) heat flux changes, heat storage change (d_Q), residual-term change (Res), (b) downward clear-sky surface longwave (d_LWcs↓) and shortwave (d_SWcs↓) radiation changes, surface albedo feedback change (d_SAF), and surface cloud radiative forcing change (d_CRF; including shortwave (d_SWcl↓) and longwave (d_LWcl↓) forcing changes). The error bars represent minimum and maximum values, and the boxes represent interquartile ranges among models. The middle lines present multi-model means. The red and blue box and whisker plots represent values in summer and winter, respectively.
The spatial pattern of the temperature difference between G4 and RCP4.5 over China is illustrated in Figs. 6 and 7. The multi-model results show a robust and coherent cooling in both summer and winter. Strong cooling with magnitudes greater than 0.8 ∘C mainly occurs over high-latitude regions, including northwestern and central China. For the individual models, the SAI-induced temperature changes are negative and significant almost everywhere over China, except in MIROC-ESM and MIROC-ESM-CHEM. SAI leads to the temperature increases over the upper reaches of the Yellow River and the middle and upper reaches of the Yangtze River in MIROC-ESM in winter and over northeastern and southeastern China in MIROC-ESM-CHEM in summer, respectively (Figs. 6f and 7e). These increases are weak and insignificant. The physical processes responsible for SAI-induced cooling or warming will be discussed in the subsequent sections.
4.2 Decomposition of SAI-induced temperature change
We decompose the SAI-induced change in surface air temperature over China by utilizing Eqs. (1)–(4). The regionally averaged value of each term is illustrated in Fig. 8. It can be seen that SAI decreases downward net surface radiation fluxes, leading to a surface cooling of 0.30–1.45 ∘C in summer and 0.48–2.10 ∘C in winter over China. These decreases are partly compensated by decreased nonradiative fluxes, especially the decreased LH. The contributions of SH, Q, and Res are relatively small (Fig. 8a). The decomposition of downward surface radiation shows the decreases in SWcs↓ and LWcs↓ in all models. The reduced LWcs↓ dominates the deficient downward net surface radiation and decreases the temperature with magnitudes of 0.38–1.33 ∘C in summer and 0.25–1.38 ∘C in winter. The reduced SWcs↓ also contributes to the surface cooling, with magnitudes of 0.04–0.33 ∘C in summer and 0.13–0.41 ∘C in winter. The winter decrease in SWcs↓ is stronger than the summer one in most models. Besides, the inter-model differences in CRF and SAF changes are relatively substantial. The area-averaged results illustrate that the changes in CRF and SAF have negative and positive contributions to the SAI-induced cooling over China in most models, respectively (Fig. 8b).
The spatial patterns of SAI-induced changes in key energy-related variables over China are illustrated in Fig. 9. Under SAI forcing, changes in atmospheric temperature and water vapor lead to a general decrease in the LWcs↓. The SWcs↓, primarily related to the solar radiation scattering effect by stratospheric sulfate aerosol particles, also exhibits a coherent reduction over China. The spatial pattern of the temperature change over China is primarily determined by SWcl↓ and surface albedo changes. In summer, most models exhibit increases in cloud amount, especially over northwestern and central China. The resultant decreased SWcl↓ leads to strong cooling over these regions. Conversely, northeastern and southeastern China show increased SWcl↓ and relatively weak cooling (Fig. 9d). In MIROC-ESM-CHEM, the excessive SWcl↓ (up to 8 W m−2) offsets the clear-sky radiative effects and causes abnormal warming over most regions of eastern China (Fig. S1a in the Supplement). In summer, the surface albedo change due to SAI over China is relatively small. The increased surface albedo mainly occurs in the Tibetan Plateau, which contributes to local surface cooling (Fig. 9f). This may help to explain why the cloud effect is not a primary factor of temperature change over the Tibetan Plateau in summer.
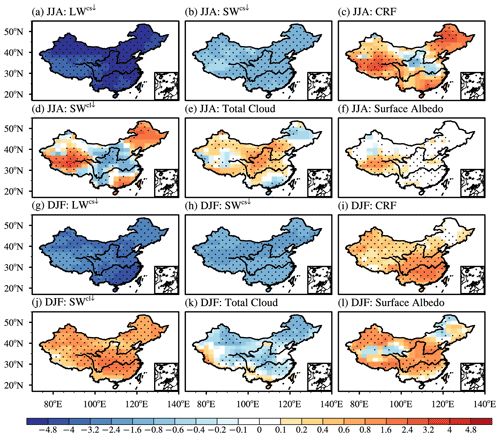
Figure 9Spatial patterns of differences between G4 and RCP4.5 over China for the multi-model mean in summer (JJA) and winter (DJF) during the period of 2030–2069. (a, g) Downward clear-sky surface longwave radiation (LWcs↓). (b, h) Downward clear-sky surface shortwave radiation (SWcs↓). (c, i) Surface cloud radiative forcing. (d, j) Downward shortwave radiative effect of clouds (SWcl↓). (e, k) Total cloud cover (units in %). (f, l) Surface albedo (units in %). Flux is in watts per square meter (W m−2). The dots indicate areas where at least two-thirds of the models share the same sign with the multi-model mean.
In winter, a robust and coherent SAI-induced reduction in cloud cover is found over China (Fig. 9k). This reduction leads to a general increase in SWcl↓, causing the weak cooling south of the Yangtze River valley. In other areas of China, however, the change in surface albedo is the primary factor affecting the spatial pattern of temperature response under SAI forcing. The increased surface albedo leads to strong cooling, especially over northwestern and central China. However, the decreased surface albedo is found over the upper reaches of the Yellow River and the middle and upper reaches of the Yangtze River in MIROC-ESM, with magnitudes greater than 3 %, which results in the abnormal winter warming mentioned above (Fig. S1d). Taken together, the increased summer cloud cover and winter surface albedo lead to strong cooling, while the decreased summer cloud cover and winter surface albedo result in weak cooling or even warming for the certain subregions and models, for instance, eastern China in MIROC-ESM-CHEM and the upper reaches of the Yellow River and the middle and upper reaches of the Yangtze River in MIROC-ESM.
4.3 Physical processes responsible for SAI-induced temperature changes
Previous studies have illustrated that the SAI reduces the tropospheric temperature and atmospheric water vapor amount on a global scale (Kashimura et al., 2017; Visioni et al., 2018). In China, these reductions cause the decrease in LWcs↓, contributing to the surface cooling primarily. We further address the potential reasons for the SWcs↓ change by using the aforementioned decomposition method. The atmospheric reflection of solar radiation increases after sulfate aerosols injection. In our study, the effect of aerosols scattering on shortwave radiation is represented as SWSRM, which can be measured by the change in SAOD. As shown in Fig. 10, the latitudinal distributions of the calculated (used in HadGEM2-ES) and prescribed (used in BNU-ESM, CNRM-ESM1, and the MIROC-based models) SAOD changes caused by SAI in G4 display a coherent increase over China. The distribution in CanESM2 is not shown because it is a constant field according to the experimental design. The SAOD change in HadGEM2-ES is unavailable. Total aerosol optical depth is therefore considered as a reasonable alternative variable for SAOD (e.g., Bellouin et al., 2011). The national-scale increased SAOD results in a robust decrease in SWSRM (Fig. 11a, d), contributing to the surface cooling with magnitudes of 0.21–0.54 ∘C in summer and 0.26–0.69 ∘C in winter. Besides, the deficit in column-integrated water vapor reduces the atmospheric absorption of solar radiation. The resultant increased SW (SWWV) counterbalance 37 %–81 % and 11 %–48 % of the reductions in SWSRM over China in summer and winter, respectively (Fig. 11b, e). This is the main reason why the SAI-induced winter cooling is more severe than the summer level.
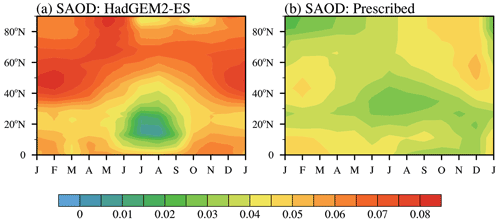
Figure 10Latitudinal distributions of the calculated (a; for HadGEM2-ES) and prescribed (b; for BNU-ESM, CNRM-ESM1, and the MIROC-based models) changes in SAOD at 550 nm caused by SAI in G4 experiment over the Northern Hemisphere during the period of 2030–2069.
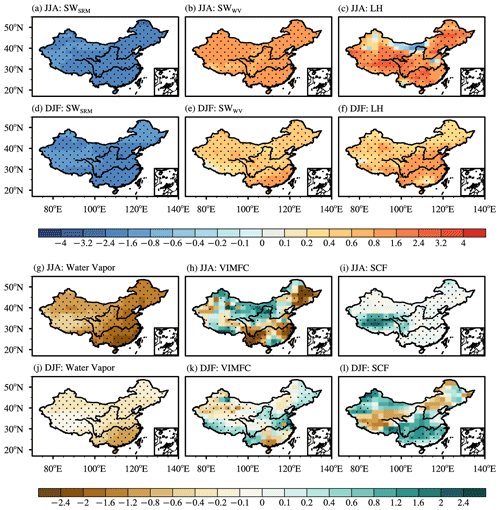
Figure 11Same as Fig. 9 but for the shortwave radiative effects of (a, d) solar radiation scattering change (SWSRM) and (b, e) atmospheric water vapor amount change (SWWV), (c, f) latent heat flux (LH), (g, j) column-integrated water vapor (units in kg m−2), (h, k) vertically integrated moisture flux convergence (VIMFC; units in 0.1 mm d−1), and (i, l) snow cover fraction (SCF; units in %). Flux is in watts per square meter (W m−2) and defined as positive in the downward direction.
As discussed in Sect. 4.2, the spatial patterns of summer and winter temperature changes over China are mainly determined by the SWcl↓ and surface albedo, respectively. Generally, the SAI-induced decrease in LH flux reduces the low cloud cover, resulting in the positive change in SWcl↓ (Fig. 11c, f). Through this process, the significantly decreased LH over northeastern and southeastern China causes the abnormal summer warming in MIROC-ESM-CHEM (Fig. S1c). However, in summer, the effect of LH is partly offset by the SAI-induced moisture convergence at the troposphere in most models. The resultant increased cloud cover enhances the surface cooling over northwestern and central China (Fig. 11h). The change in surface albedo is closely related to land surface conditions. The SAI-induced cooling can be amplified by increased snow cover or sea ice (e.g., Schmidt et al., 2012). Considering that surface albedo can be reasonably described as a linear function of snow cover fraction (Qu and Hall, 2007; Li et al., 2016), we further investigate the spatial pattern of changes in snow cover fraction and find that it matches with surface albedo over China (Fig. 11i, l; note that model data are not available for HadGEM2-ES). Under SAI forcing, the increased snow cover mainly occurs over the Tibetan Plateau in summer and over northwestern and central China in winter. The enlarged snow cover fraction gives rise to the SW decrease at the surface, which in turn has a positive feedback on surface cooling. Furthermore, the SAI-induced abnormal winter warming in MIROC-ESM is also associated with the decreased snow cover over the upper reaches of the Yellow River and the middle and upper reaches of the Yangtze River (Fig. S1e).
We analyze the surface air temperature response to SAI forcing over China based on the simulations of the G4 experiment and RCP4.5 scenario by using six GCMs (BNU-ESM, CanESM2, CNRM-ESM1, HadGEM2-ES, MIROC-ESM, and MIROC-ESM-CHEM). We also discuss the physical processes involved in the temperature response from a surface energy budget perspective. The main conclusions are summarized as follows.
-
All selected models can reproduce the present climatological surface air temperature over China in both summer and winter well. Although the SAI in the G4 experiment leads to a surface cooling over China, the climatological temperature in G4 is still higher than the present level. During the simulation period of 2030–2069, SAI leads to a national-scale cooling over China in all models. Regionally, the multi-model mean cooling is 0.64 ∘C in summer and 0.80 ∘C in winter, respectively. The SAI-induced temperature change varies among models, regions, and seasons.
-
The decomposition of temperature change based on the surface energy budget indicates that the SAI-induced surface cooling over China is dominated by the robust decrease in downward clear-sky radiation fluxes (particularly in downward clear-sky longwave radiation flux) and associated with the changes in cloud effective forcing and surface albedo feedback. The shortwave radiative effect of clouds and the surface albedo feedback determine the spatial pattern of temperature change, which are somewhat model dependent and display a level of regional and seasonal discrepancies.
-
Under SAI forcing, the decreased downward clear-sky longwave radiation is mainly due to the decreased tropospheric temperature and water vapor amount, and the decreased downward clear-sky shortwave radiation is mainly contributed by the aerosol scattering effect over China. The decreased latent heat flux generally reduces the cloud cover over China, but the change in summer cloud cover is closely associated with the anomalous tropospheric moisture flux convergence. The negative surface albedo feedback related to increased snow cover fraction also amplifies the surface cooling, especially over the Tibetan Plateau in summer and over northwestern and central China in winter. The results above are summarized schematically in Fig. 12.
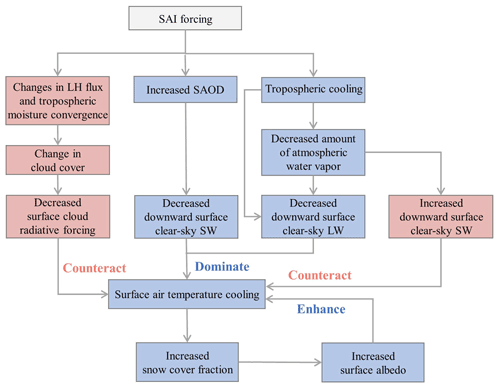
Figure 12Schematic diagram illustrating how the relevant physical processes impact the downward surface radiation changes over China in response to the SAI forcing in the G4 experiment.
Finally, equatorial stratospheric SO2 injection has been proposed as a convenient and efficient strategy of SAI geoengineering because the large-scale atmospheric circulation can transport sulfate aerosols around the globe automatically. But it leads to regional inequities in the temperature response due to the strong confinement of the Brewer–Dobson circulation (Kravitz et al., 2016). This means that some areas will face more severe climatic disasters if this kind of geoengineering is implemented. To solve this issue, certain SAI experiments based on the injection at multiple locations have been proposed, such as the Stratospheric Aerosol Geoengineering Large Ensemble Project (GLENS) using CESM1 (WACCM – Whole Atmosphere Community Climate Model; Tilmes et al., 2018; Kravitz et al., 2019). In addition, the uncertainty of the regional climate response to SAI is closely related to the reliability of the models (Irvine et al., 2016). It has been indicated that the CMIP6 GCMs perform better in simulating the temperature over China than their CMIP5 counterparts (Jiang et al., 2020). Therefore, the climate response to SAI geoengineering over China, based on state-of-the-art GCM experiments, merits further study.
The CMIP5 results used in this study are available from the Earth System Grid Federation (WCRP, 2022).
The supplement related to this article is available online at: https://doi.org/10.5194/acp-22-7667-2022-supplement.
DJ and ZL designed and performed the research. ZL and XL analyzed the data. ZL and DJ wrote the paper. All authors contributed to this study.
The contact author has declared that neither they nor their co-authors have any competing interests.
Publisher’s note: Copernicus Publications remains neutral with regard to jurisdictional claims in published maps and institutional affiliations.
We sincerely thank Daniele Visioni and the four anonymous referees, for their insightful comments and suggestions that improved this work. We acknowledge the Geoengineering Model Intercomparison Project Steering Committee and the World Climate Research Programme's Working Group on Coupled Modelling. We also thank the climate modeling groups, for producing their model outputs. We thank Helene Muri, Duoying Ji, John Moore, and Toshihiro Nemoto, for their help in downloading the GeoMIP outputs.
This research has been supported by the National Natural Science Foundation of China (grant nos. 42175031 and 41991284).
This paper was edited by Rolf Müller and reviewed by Daniele Visioni and four anonymous referees.
Arora, V. K., Scinocca, J. F., Boer, G. J., Christian, J. R., Denman, K. L., Flato, G. M., Kharin, V. V., Lee, W. G., and Merryfield, W. J.: Carbon emission limits required to satisfy future representative concentration pathways of greenhouse gases, Geophys. Res. Lett., 38, L05805, https://doi.org/10.1029/2010GL046270, 2011.
Bala, G., Duffy, P. B., and Taylor, K. E.: Impact of geoengineering schemes on the global hydrological cycle, Proc. Natl. Acad. Sci. USA, 105, 7664–7669, https://doi.org/10.1073/pnas.0711648105, 2008.
Bellouin, N., Rae, J., Jones, A., Johnson, C., Haywood, J., and Boucher, O.: Aerosol forcing in the Climate Model Intercomparison Project (CMIP5) simulations by HadGEM2-ES and the role of ammonium nitrate, J. Geophys. Res., 116, D20206, https://doi.org/10.1029/2011JD016074, 2011.
Bluth, G. J., Doiron, S. D., Schnetzler, C. C., Krueger, A. J., and Walter, L. S.: Global tracking of the SO2 clouds from the June, 1991 Mount Pinatubo eruptions, Geophy. Res. Lett., 19, 151–154, https://doi.org/10.1029/91GL02792, 1992.
Budyko, M. I.: Climatic Changes, American Geophysical Union, Washington, DC, 244 pp., https://doi.org/10.1029/SP010, 1977.
Caldeira, K., Bala, G., and Cao, L.: The science of geoengineering. Annu. Rev. Earth Planet. Sci., 41, 231–256, https://doi.org/10.1146/annurev-earth-042711-105548, 2013.
Cao, L., Gao, C. C., and Zhao, L. Y.: Geoengineering: Basic science and ongoing research efforts in China, Adv. Clim. Chang. Res., 6, 188–196, https://doi.org/10.1016/j.accre.2015.11.002, 2015.
Collins, W. J., Bellouin, N., Doutriaux-Boucher, M., Gedney, N., Halloran, P., Hinton, T., Hughes, J., Jones, C. D., Joshi, M., Liddicoat, S., Martin, G., O'Connor, F., Rae, J., Senior, C., Sitch, S., Totterdell, I., Wiltshire, A., and Woodward, S.: Development and evaluation of an Earth-System model – HadGEM2, Geosci. Model Dev., 4, 1051–1075, https://doi.org/10.5194/gmd-4-1051-2011, 2011.
Crutzen, P. J.: Albedo enhancement by stratospheric sulfur injections: A contribution to resolve a policy dilemma? Clim. Change, 77, 211–220, https://doi.org/10.1007/s10584-006-9101-y, 2006.
Donohoe, A. and Battisti, D. S.: Atmospheric and surface contributions to planetary albedo, J. Clim., 24, 4402–4418, https://doi.org/10.1175/2011JCLI3946.1, 2011.
Duan, L., Cao, L., Bala, G., and Caldeira, K.: Climate response to pulse versus sustained stratospheric aerosol forcing, Geophys. Res. Lett., 46, 8976–8984, https://doi.org/10.1029/2019GL083701, 2019.
Gong, T., Feldstein, S., and Lee, S.: The role of downward infrared radiation in the recent Arctic winter warming trend, J. Clim., 30, 4937–4949, https://doi.org/10.1175/JCLI-D-16-0180.1, 2017.
Irvine, P. J., Kravitz, B., Lawrence, M. G., and Muri, H.: An overview of the Earth system science of solar geoengineering, Wiley Interdiscip. Rev.-Clim. Chang., 7, 815–833, https://doi.org/10.1002/wcc.423, 2016.
Irvine, P. J., Emanuel, K., He, J., Horowitz, L. W., Vecchi, G., and Keith, D.: Halving warming with idealized solar geoengineering moderates key climate hazards, Nat. Clim. Change, 9, 295–299, 2019.
Jarvis, A.: The magnitudes and timescales of global mean surface temperature feedbacks in climate models, Earth Syst. Dynam., 2, 213–221, https://doi.org/10.5194/esd-2-213-2011, 2011.
Ji, D., Wang, L., Feng, J., Wu, Q., Cheng, H., Zhang, Q., Yang, J., Dong, W., Dai, Y., Gong, D., Zhang, R.-H., Wang, X., Liu, J., Moore, J. C., Chen, D., and Zhou, M.: Description and basic evaluation of Beijing Normal University Earth System Model (BNU-ESM) version 1, Geosci. Model Dev., 7, 2039–2064, https://doi.org/10.5194/gmd-7-2039-2014, 2014.
Ji, D., Fang, S., Curry, C. L., Kashimura, H., Watanabe, S., Cole, J. N. S., Lenton, A., Muri, H., Kravitz, B., and Moore, J. C.: Extreme temperature and precipitation response to solar dimming and stratospheric aerosol geoengineering, Atmos. Chem. Phys., 18, 10133–10156, https://doi.org/10.5194/acp-18-10133-2018, 2018.
Jiang, D., Tian, Z., and Lang, X.: Reliability of climate models for China through the IPCC third to fifth assessment reports, Int. J. Climatol., 36, 1114–1133, https://doi.org/10.1002/joc.4406, 2016.
Jiang, D., Hu, D., Tian, Z., and Lang, X.: Differences between CMIP6 and CMIP5 models in simulating climate over China and the East Asian monsoon, Adv. Atmos. Sci., 37, 1102–1118, https://doi.org/10.1007/s00376-020-2034-y, 2020.
Jones, A., Haywood, J. M., Alterskjær, K., Boucher, O., Cole, J. N., Curry, S., Charles, L., Irvine, P. J., Ji, D., Kravitz, B., Egill-Kristjánsson, J., Moore, J. C., Niemeier, U., Robock, A., Schmidt, H., Singh, B., Tilmes, S., Watanabe, S., and Yoon, J.-H.: The impact of abrupt suspension of solar radiation management (termination effect) in experiment G2 of the Geoengineering Model Intercomparison Project (GeoMIP), J. Geophys. Res.-Atmos., 118, 9743–9752, https://doi.org/10.1002/jgrd.50762, 2013.
Jones, A. C., Hawcroft, M. K., Haywood, J. M., Jones, A., Guo, X., and Moore, J. C.: Regional climate impacts of stabilizing global warming at 1.5 K using solar geoengineering, Earths Future, 6, 230–251, https://doi.org/10.1002/2017EF000720, 2018.
Kashimura, H., Abe, M., Watanabe, S., Sekiya, T., Ji, D., Moore, J. C., Cole, J. N. S., and Kravitz, B.: Shortwave radiative forcing, rapid adjustment, and feedback to the surface by sulfate geoengineering: analysis of the Geoengineering Model Intercomparison Project G4 scenario, Atmos. Chem. Phys., 17, 3339–3356, https://doi.org/10.5194/acp-17-3339-2017, 2017.
Kravitz, B., Robock, A., Boucher, O., Schmidt, H., Taylor, K. E., Stenchikov, G., and Schulz, M.: The Geoengineering Model Intercomparison Project (GeoMIP), Atmos. Sci. Lett., 12, 162–167, https://doi.org/10.1002/asl.316, 2011.
Kravitz, B., Robock, A., Forster, P. M., Haywood, J. M., Lawrence, M. G., and Schmidt, H.: An overview of the Geoengineering Model Intercomparison Project (GeoMIP), J. Geophys. Res.-Atmos., 118, 13103–13107, https://doi.org/10.1002/2013JD020569, 2013a.
Kravitz, B., Rasch, P. J., Forster, P. M., Andrews, T., Cole, J. N., Irvine, P. J., Ji, D., Kristjánsson, J., Moore, J. C., Muri, H., Niemeier, U., Robock, A., Singh, B., Tilmes, S., Watanabe, S., and Yoon, J.-H.: An energetic perspective on hydrological cycle changes in the Geoengineering Model Intercomparison Project, J. Geophys. Res.-Atmos., 118, 13087–13102, https://doi.org/10.1002/2013JD020502, 2013b.
Kravitz, B., MacMartin, D. G., Robock, A., Rasch, P. J., Ricke, K. L., Cole, J. N., Curry, C. L., Irvine, P. J., Ji, D., Keith, D. W., Kristjánsson, J. E., Moore, J. C., Muri, H., Singh, B., Tilmes, S., Watanabe, S., Yang, S., and Yoon, J. H.: A multi-model assessment of regional climate disparities caused by solar geoengineering, Environ. Res. Lett., 9, 074013, https://doi.org/10.1088/1748-9326/9/7/074013, 2014.
Kravitz, B., Robock, A., Tilmes, S., Boucher, O., English, J. M., Irvine, P. J., Jones, A., Lawrence, M. G., MacCracken, M., Muri, H., Moore, J. C., Niemeier, U., Phipps, S. J., Sillmann, J., Storelvmo, T., Wang, H., and Watanabe, S.: The Geoengineering Model Intercomparison Project Phase 6 (GeoMIP6): simulation design and preliminary results, Geosci. Model Dev., 8, 3379–3392, https://doi.org/10.5194/gmd-8-3379-2015, 2015.
Kravitz, B., MacMartin, D. G., Wang, H., and Rasch, P. J.: Geoengineering as a design problem, Earth Syst. Dynam., 7, 469–497, https://doi.org/10.5194/esd-7-469-2016, 2016.
Kravitz, B., MacMartin, D. G., Tilmes, S., Richter, J. H., Mills, M. J., Cheng, W., Dagon, K., Glanville, A. S., Lamarque, J.-F., Simpson, I. R., Tribbia, J., and Vitt, F.: Comparing surface and stratospheric impacts of geoengineering with different SO2 injection strategies, J. Geophys. Res.-Atmos., 124, 7900–7918, https://doi.org/10.1029/2019JD030329, 2019.
Latham, J.: Control of global warming?, Nature, 347, 339–340, https://doi.org/10.1038/347339b0, 1990.
Li, Y., Wang, T., Zeng, Z., Peng, S., Lian, X., and Piao, S.: Evaluating biases in simulated land surface albedo from CMIP5 global climate models, J. Geophys. Res.-Atmos., 121, 6178–6190, https://doi.org/10.1002/2016JD024774, 2016.
Lu, J. and Cai, M.: Seasonality of polar surface warming amplification in climate simulations, Geophys. Res. Lett., 36, L16704, https://doi.org/10.1029/2009GL040133, 2009.
Matthews, H. D. and Caldeira, K.: Transient climate – carbon simulations of planetary geoengineering, Proc. Natl. Acad. Sci. USA., 104, 9949–9954, https://doi.org/10.1073/pnas.0700419104, 2007.
Mitchell, D. L. and Finnegan, W.: Modification of cirrus clouds to reduce global warming, Environ. Res. Lett., 4, 045102, https://doi.org/10.1088/1748-9326/4/4/045102, 2009.
Qu, X. and Hall, A.: What controls the strength of snow-albedo feedback?, J. Clim., 20, 3971–3981, https://doi.org/10.1175/JCLI4186.1, 2007.
Raible, C. C., Brönnimann, S., Auchmann, R., Brohan, P., Frölicher, T. L., Graf, H. F., Jones, P., Luterbacher, J., Muthers, S., Neukom, R., Robock, A., Self, S., Sudrajat, A., Timmreck, C., and Wegmann, M.: Tambora 1815 as a test case for high impact volcanic eruptions: Earth system effects, Wiley Interdiscip. Rev.-Clim. Chang., 7, 569–589, https://doi.org/10.1002/wcc.407, 2016.
Rasch, P. J., Crutzen, P. J., and Coleman, D. B.: Exploring the geoengineering of climate using stratospheric sulfate aerosols: The role of particle size, Geophys. Res. Lett., 35, L02809, https://doi.org/10.1029/2007GL032179, 2008.
Ricke, K. L., Moreno-Cruz, J. B., and Caldeira, K.: Strategic incentives for climate geoengineering coalitions to exclude broad participation, Environ. Res. Lett., 8, 014021, https://doi.org/10.1088/1748-9326/8/1/014021, 2013.
Robiou du Pont, Y. and Meinshausen, M.: Warming assessment of the bottom-up Paris Agreement emissions pledges, Nat. Commun., 9, 4810, https://doi.org/10.1038/s41467-018-07223-9, 2018.
Robock, A., Oman, L., and Stenchikov, G. L.: Regional climate responses to geoengineering with tropical and Arctic SO2 injections, J. Geophys. Res., 113, D16, https://doi.org/10.1029/2008JD010050, 2008.
Robock, A.: Stratospheric aerosol geoengineering, in: AIP Conference Proceedings, Berkeley, CA, USA, 8–9 March 2014, 1652, 183–197, https://doi.org/10.1063/1.4916181, 2015.
Sato, M.: Forcings in GISS climate model: Stratospheric aerosol optical thickness, https://data.giss.nasa.gov/modelforce/strataer/ (last access: April 2021), 2006.
Schmidt, H., Alterskjær, K., Bou Karam, D., Boucher, O., Jones, A., Kristjánsson, J. E., Niemeier, U., Schulz, M., Aaheim, A., Benduhn, F., Lawrence, M., and Timmreck, C.: Solar irradiance reduction to counteract radiative forcing from a quadrupling of CO2: climate responses simulated by four earth system models, Earth Syst. Dynam., 3, 63–78, https://doi.org/10.5194/esd-3-63-2012, 2012.
Séférian, R., Delire, C., Decharme, B., Voldoire, A., Salas y Melia, D., Chevallier, M., Saint-Martin, D., Aumont, O., Calvet, J.-C., Carrer, D., Douville, H., Franchistéguy, L., Joetzjer, E., and Sénési, S.: Development and evaluation of CNRM Earth system model – CNRM-ESM1, Geosci. Model Dev., 9, 1423–1453, https://doi.org/10.5194/gmd-9-1423-2016, 2016.
Seifritz, W.: Mirrors to halt global warming, Nature, 340, 603, https://doi.org/10.1038/340603a0, 1989.
Sudo, K., Takahashi, M., Kurokawa, J., and Akimoto, H.: CHASER: A global chemical model of the troposphere: 1. Model description, J. Geophys. Res., 107, 4339, https://doi.org/10.1029/2001JD001113, 2002.
Sun, W., Wang, B., Chen, D., Gao, C., Lu, G., and Liu, J.: Global monsoon response to tropical and Arctic stratospheric aerosol injection, Clim. Dyn., 55, 2107–2121, https://doi.org/10.1007/s00382-020-05371-7, 2020.
Taylor, K. E.: Summarizing multiple aspects of model performance in a single diagram, J. Geophys. Res.-Atmos., 106, 7183–7192, https://doi.org/10.1029/2000JD900719, 2001.
Taylor, K. E., Stouffer, R. J., and Meehl, G. A.: An overview of CMIP5 and the experiment design, B. Am. Meteorol. Soc., 93, 485–498, https://doi.org/10.1175/BAMS-D-11-00094.1, 2012.
Tilmes, S., Müller, R., and Salawitch, R.: The sensitivity of polar ozone depletion to proposed geoengineering schemes, Science, 320, 1201–1204, https://doi.org/10.1126/science.1153966, 2008.
Tilmes, S., Fasullo, J., Lamarque, J. F., Marsh, D. R., Mills, M., Alterskjær, K., Muri, H., Kristjánsson, J. E., Boucher, O., Schulz, M., Cole, J. N. S., Curry, C. L., Jones, A., Haywood, J., Irvine, P. J., Ji, D., Moore, J. C., Karam, D. B., Kravitz, B., Rasch, P. J., Singh, B., Yoon, J.-H., Niemeier, U., Schmidt, H., Robock, A., Yang, S., and Watanabe, S.: The hydrological impact of geoengineering in the Geoengineering Model Intercomparison Project (GeoMIP), J. Geophys. Res.-Atmos., 118, 11036–11058, https://doi.org/10.1002/jgrd.50868, 2013.
Tilmes, S., Richter, J. H., Kravitz, B., MacMartin, D. G., Mills, M. J., Simpson, I. R., Glanville, A. S., Fasullo, J. T., Phillips, A. S., Lamarque, J.-F., Tribbia, J., Edwards, J., Mickelson, S., and Ghosh, S.: CESM1 (WACCM) stratospheric aerosol geoengineering large ensemble project, B. Am. Meteorol. Soc., 99, 2361–2371, https://doi.org/10.1175/BAMS-D-17-0267.1, 2018.
Tilmes, S., Visioni, D., Jones, A., Haywood, J., Séférian, R., Nabat, P., Boucher, O., Bednarz, E. M., and Niemeier, U.: Stratospheric ozone response to sulfate aerosol and solar dimming climate interventions based on the G6 Geoengineering Model Intercomparison Project (GeoMIP) simulations, Atmos. Chem. Phys., 22, 4557–4579, https://doi.org/10.5194/acp-22-4557-2022, 2022.
Trenberth, K. E. and Dai, A.: Effects of Mount Pinatubo volcanic eruption on the hydrological cycle as an analog of geoengineering, Geophys. Res. Lett., 34, 1438–1442, https://doi.org/10.1029/2007GL030524, 2007.
United Nations Environment Programme: Emissions Gap Report 2020, UNEP, Nairobi, https://www.unep.org/emissions-gap-report-2020 (last access: 25 May 2022), 2020.
Visioni, D., Pitari, G., di Genova, G., Tilmes, S., and Cionni, I.: Upper tropospheric ice sensitivity to sulfate geoengineering, Atmos. Chem. Phys., 18, 14867–14887, https://doi.org/10.5194/acp-18-14867-2018, 2018.
Visioni, D., MacMartin, D. G., and Kravitz, B.: Is turning down the sun a good proxy for stratospheric sulfate geoengineering?, J. Geophys. Res.-Atmos., 126, e2020JD033952, https://doi.org/10.1029/2020JD033952, 2021.
Watanabe, S., Hajima, T., Sudo, K., Nagashima, T., Takemura, T., Okajima, H., Nozawa, T., Kawase, H., Abe, M., Yokohata, T., Ise, T., Sato, H., Kato, E., Takata, K., Emori, S., and Kawamiya, M.: MIROC-ESM 2010: model description and basic results of CMIP5-20c3m experiments, Geosci. Model Dev., 4, 845–872, https://doi.org/10.5194/gmd-4-845-2011, 2011.
WCRP: CMIP5 project data, World Climate Research Programme [data set], https://esgf-node.llnl.gov/search/cmip5/, last access: 25 May 2022.
Wigley, T. M. L.: A combined mitigation/geoengineering approach to climate stabilization, Science, 314, 452–454, https://doi.org/10.1126/science.1131728, 2006.
Wu, J. and Gao, X.: A gridded daily observation dataset over China region and comparison with the other datasets, Chinese J. Geophy., 56, 1102–1111, http://geophy.cn/article/doi/10.6038/cjg20130406 (last access: 25 May 2022), 2013 (in Chinese).


