the Creative Commons Attribution 4.0 License.
the Creative Commons Attribution 4.0 License.
 | 10 Jun 2022
The diurnal and seasonal variability of ice-nucleating particles at the High Altitude Station Jungfraujoch (3580 m a.s.l.), Switzerland
Cyril Brunner
Benjamin T. Brem
Martine Collaud Coen
Franz Conen
Martin Steinbacher
Martin Gysel-Beer
Cloud radiative properties, cloud lifetime, and precipitation initiation are strongly influenced by the cloud phase. Between ∼ 235 and 273 K, ice-nucleating particles (INPs) are responsible for the initial phase transition from the liquid to the ice phase in cloud hydrometeors. This study analyzes immersion-mode INP concentrations measured at 243 K at the High Altitude Research Station Jungfraujoch (3580 m a.s.l.) between February 2020 and January 2021, thereby presenting the longest continuous, high-resolution (20 min) data set of online INP measurements to date. The high time resolution and continuity allow us to study the seasonal and the diurnal variability of INPs. After exclusion of special events, like Saharan dust events (SDEs), we found a seasonal cycle of INPs, highest in April (median in spring 3.1 INP std L−1) followed by summer (median: 1.6 INP std L−1) and lowest in fall and winter (median: 0.5 and 0.7 INP std L−1, respectively). Pollen or subpollen particles were deemed unlikely to be responsible for elevated INP concentrations in spring and summer, as periods with high pollen loads from nearby measurement stations do not coincide with the periods of high INP concentrations. Furthermore, for days when the site was purely in the free troposphere (FT), no diurnal cycle in INP concentrations was observed, while days with boundary layer intrusions (BLIs) showed a diurnal cycle. The seasonal and diurnal variability of INPs during periods excluding SDEs is within a factor of 7 and 3.3, respectively, significantly lower than the overall variability observed in INP concentration including SDEs of more than 3 orders of magnitude, when peak values result from SDEs. The median INP concentration over the analyzed 12 months was 1.2 INP std L−1 for FT periods excluding SDEs and 1.4 INP std L−1 for both FT and BLI, and including SDEs, reflecting that despite SDEs showing strong but comparatively brief INP signals, they have a minor impact on the observed annual median INP concentration.
- Article
(5176 KB) - Full-text XML
- BibTeX
- EndNote


The ratio of ice crystals to liquid droplets in a cloud strongly determines its radiative properties, lifetime, and precipitation initiation (e.g., Lau and Wu, 2003; Lohmann and Feichter, 2005; Hoose and Möhler, 2012; Murray et al., 2012; Mülmenstädt et al., 2015; Heymsfield et al., 2020). For cloud hydrometers with a temperature between ∼ 235 and 273 K, the phase transition from the metastable liquid phase to the ice phase is initially supported by ice-nucleating particles (INPs, Pruppacher and Klett, 1997; Vali et al., 2015). However, ice nucleation on INPs remains insufficiently understood and quantified (Murray et al., 2021). Knowledge about a diurnal and seasonal variability can help to better understand the sources and sinks of atmospheric INPs but has only been addressed in a handful of studies. Conen et al. (2015) analyzed the seasonal INP fluctuation at the High Altitude Research Station Jungfraujoch (JFJ) over a year (June 2012–June 2013) with 24 h filter samples and their subsequent analysis with immersion freezing assays. They evaluated INPs active at 265 K and observed the highest INP concentrations during June, July, and August (10−3 to 10−4 L−1) and the lowest between January and the beginning of April with 10−5 to 10−4 L−1, which correlated with ambient temperature. Wex et al. (2019) analyzed the seasonality in INP number concentrations at four different locations in the Arctic using filter samples, where each filter was collecting ambient particles over 4 d to 2 weeks. They found a seasonal trend, with INP concentrations lowest in winter and highest in spring. At 260 to 266 K, the seasonal cycle in INP number concentrations spread up to 3 orders of magnitude (∼ 10−5 to 10−2 L−1). Schneider et al. (2021) studied the seasonal cycle of INPs in the boreal forest in Finland between March 2018 and May 2019, where the INPs were collected on a filter, which got replaced after 24 to 144 h, and analyzed offline on a cold stage. At 252 K, they observed a minimum INP concentration in wintertime, on the order of 1 INP std L−1, and maxima in early and late summer of ∼ 4 INP std L−1. The trend was more pronounced at warmer temperatures but visible across the entire investigated temperature spectrum (265–252 K). Tobo et al. (2020) studied seasonal INP concentrations with 72 h filter samples taken on a building 458 m above ground in Tokyo between August 2016 and July 2017, followed by testing the particles collected on the filters for their ice nucleation activity on a cold stage. They found a weak seasonal cycle for INPs active below 253 K, with spikes during Asian dust events. For INPs active at warmer temperatures, specifically between 258 and 263 K, higher concentrations were recorded in the warm–wet season and lower concentrations in the cold–dry seasons. They attributed the seasonal trend to Asian dust events and seasonal variations in certain particles of biological origin linked to local meteorology. Schrod et al. (2020) analyzed the INP concentrations at four locations across the globe (the Amazon, Caribbean, central Europe, and the Arctic) for almost 2 years (May 2015–January 2017). Electrostatic aerosol samplers were used to collect ambient particles onto silicon wafers once every 2 d at noon for 50 min. The wafers were later exposed to a saturation ratio with respect to water of 0.95 ≤ Sw ≤ 1.01 at 253, 248, and 243 K, and the number of formed ice crystals was used to deduce the mean INP concentration. They found average concentrations between sites to differ by less than a factor of 5. Short-term fluctuations dominated most of the total variability across all stations. To summarize, a seasonal dependence in INP concentrations was apparent in all these studies, where the highest INP concentrations were observed in spring and summer. All these studies were performed using offline sampling techniques, where changes to the ice nucleation ability of particles cannot be excluded between sampling and the analysis. Besides, they typically provide INP number concentrations at temperatures ≥ 250 K, while online INP counters often struggle at temperatures ≥ 250 K with the low abundance of atmospheric INPs because of their instruments' limit of detection (Cziczo et al., 2017). As the INP concentrations increase with decreasing temperature (e.g., see DeMott et al., 2010), an online INP counter can measure statistically robust data from ≈ 250 K down to 220 K and lower. Korolev et al. (2003) and Field et al. (2004) showed, using in situ measurements, that, depending on the measurement location, approximately only half of the clouds at 253 and 258 K contain the ice phase, while warmer clouds are often completely free of the ice phase. This suggests that in these clouds only INPs active at temperatures below 258 K are numerous enough to impact the cloud phase. Therefore, we aim to expand our knowledge about the seasonality in INPs to INPs active at a temperature of 243 K. In addition, our measurement location at the JFJ allows us to draw conclusions about INPs in both free tropospheric and boundary layer intruded air masses. In addition, offline techniques often require long sampling times resulting in too poor temporal resolution to capture diurnal variation within INP concentrations. Online measurement techniques provide the needed temporal resolution, yet until 2019 they required an operator to be present at the site for the duration of the experiment to perform regular maintenance of the INP counters (Bi et al., 2019; Brunner and Kanji, 2021; Möhler et al., 2021). Therefore, there are only a few studies investigating the diurnal variability of INP concentrations (e.g., Isono et al., 1971; Rosinski et al., 1995), which, however, are based on measurements of less than 10 d. Only more recently did Wieder et al. (2022) study the diurnal cycle of INPs on a mountain top (2693 m a.s.l.) in Switzerland and simultaneously in a nearby valley over a period of 2 months in early spring. They found a diurnal cycle of INPs at the mountain top, lowest in the morning and highest at the beginning of the night. The cycle was attributed to orographic lifting from low elevation upstream of the measurement site. There was no diurnal cycle apparent at the valley measurement site.
Here, we used the automated horizontal ice nucleation continuous chamber (HINC-Auto, Brunner and Kanji, 2021) to measure the INP concentration at a center lamina temperature of T = 243.15 K and Sw = 1.04 at the JFJ between 7 February 2020 and 31 January 2021. The long duration, together with a sampling interval of 20 min, allowed us to study the seasonal and the diurnal variability of INP concentrations at the sampling site.
The Sphinx observatory is located on Jungfraujoch (JFJ, 46.330∘ N, 7.590∘ E), a saddle between Mt. Mönch and Mt. Jungfrau in the Swiss Alps. JFJ has a long track record of experimental field studies on atmospheric aerosols and their interaction with clouds (Bukowiecki et al., 2016). With an altitude of 3580 m a.s.l., it is often located in the free troposphere (FT). Occasionally, air masses from the planetary boundary layer (PBL) are lifted to or mixed in the ambient air present at JFJ. These boundary layer intrusions (BLIs) are most frequently observed in summer and during daytime (Collaud Coen et al., 2011). The method used to estimate the air mass type present at the site during measurements is discussed later in Sect. 2.2. Furthermore, the remote location allows the study of background concentrations of atmospheric aerosol, like INPs. However, in 2020 and 2021 frequent construction work at Jungfraujoch caused intermittent episodes of local pollution (Bukowiecki et al., 2021), which made a subsequent filtering of the data for polluted episodes necessary (see Sect. 2.1). The JFJ site is part of the Global Atmospheric Watch (GAW) program, the pan-European Aerosol, Clouds and Trace Gases Research Infrastructure (ACTRIS), the Swiss National Air Pollution Monitoring Network (NABEL), and the Swiss meteorological network (SwissMetNet). As such, a number of atmospheric measurements are continuously run at JFJ, amongst others, the total particle number concentration (condensation particle counter (CPC), TSI 3772, lower cut-off size: 14 nm) and size distribution (scanning mobility particle sizer (SMPS), mobility diameter scanning range: 17–594 nm; optical particle sizer (OPS), TSI 3300, size range: 0.3–10.0 µm; fine dust monitoring device, Fidas® 200), aerosol light absorption properties (Aethalometer, MAGEE scientific AE33), and aerosol light scattering and backscattering properties (nephelometer, AirPhoton IN101), as well as meteorological standard parameters (e.g., ambient temperature, relative humidity, atmospheric pressure, and wind speed and direction). Meteorological standard parameters for JFJ, precipitation rates, and pollen concentrations for other stations were obtained from the IDAWEB interface of MeteoSwiss (https://gate.meteoswiss.ch/idaweb, last access: 27 April 2021).
2.1 INP measurements
INP concentrations are measured using an automated continuous-flow diffusion chamber, the automated Horizontal Ice Nucleation Chamber (HINC-Auto, Brunner and Kanji, 2021). HINC-Auto sampled ambient air and measured the INP concentration at a center lamina temperature of T = 243.15 K and at a supersaturated saturation ratio with respect to water of Sw = 1.04 between 7 February 2020 and 31 January 2021, in units of INP std L−1 (per standard liter, normalized to T = 273.15 K and an atmospheric pressure of p = 1013.25 hPa). Ambient air was sampled via a heated (T = 293.15 K) total aerosol inlet (Weingartner et al., 1999), which also feeds the other aerosol measurements at JFJ. Before entering HINC-Auto, the sampled air is dried using a diffusion dryer (Sw ≤ 0.008 at 20 ∘C, filled with 4 Å molecular sieve). The sampling volume rate was set to 0.283 std L min−1. The sampling interval was 20 min and consisted of sampling ambient air (15 min) and particle-free ambient air (5 min) between each measurement. In HINC-Auto, false-positive counts can arise due to frost breaking off the chamber walls. They are present during the measurement of ambient as well as particle-free air. During the 5 min before and after an ambient air measurement, the number of false-positive frost particles are counted and time-proportionally subtracted from the ambient air measurement to yield the background-corrected ambient INP concentrations. Because of Poisson statistics it is likely that during the time-normalized particle-free measurements more or fewer false-positive counts arise than during the time-normalized ambient air measurement. This leads to a variable systematic bias of the background-corrected ambient INP concentrations for each sampling interval even if the true atmospheric INP concentration was to remain constant. The standard deviation of the resulting probability density function corresponds to the stated counting uncertainty of ±1σ, provided after each stated INP concentration in this work, and has a median ±1.37 INP std L−1. The bias in background correction can lead to negative reported values of background-corrected ambient INP concentrations whenever the true INP concentration is close to or below the chamber background. These negative readings are retained in the data set. In addition, applying a moving average over three measurements greatly reduces the number of reported negative INP concentrations. For HINC-Auto, the counting uncertainty is identical to the limit of detection (LOD). See Brunner and Kanji (2021) for a more detailed description of HINC-Auto and the derivation of the INP concentrations.
The measured INP concentrations are here statistically described by the median and 25th to 75th percentiles (Q25 %–Q75 %). We assume atmospheric INP concentrations away from sources to be log-normally distributed, as proposed generally for atmospheric pollutants by Ott (1990) and supported by other studies (e.g., Welti et al., 2018; Schrod et al., 2020). Therefore, an adequate statistical description would be the log-mean and log-standard-deviation. However, measurements reporting a negative INP concentration do not allow inclusion of all data when calculating the logarithm. For log-normally distributed data without any skewness, the log-mean is identical to the median. Hence, we chose to report the median.
Frequent construction work at JFJ during the observation period caused intermittent interference from local pollution (Bukowiecki et al., 2021). Therefore, the INP measurements had to be filtered (75.5 % remain after filtering). High-frequency fluctuations in the total particle concentrations were observed during periods with pollution from the construction site. These fluctuations in the CPC and the ≥ 0.3 µm optical particle counter channel of HINC-Auto were used to obtain unpolluted INP measurements (N = 15 843). A more detailed description of the data filtering process can be found in Brunner et al. (2021).
2.2 Classification of air masses
2.2.1 Free tropospheric air masses and boundary layer intrusions
The distinction between undisturbed FT air masses and FT affected by boundary layer intrusions, hereafter simply referred to as BLI conditions, is made according to Brunner et al. (2021). It is based on a combined criterion considering both the 222-radon concentration (222Rn, Griffiths et al., 2014, first factor in Eq. 1) and the total number concentration of particles with diameters larger than d ≥ 90 nm (N90, Herrmann et al., 2015, second factor in Eq. 1). Subsequently, the probability (PFT) of the sampled air to represent undisturbed FT air mass is obtained using
where PDFFT and PDFBLI are the probability density functions with FT or BLI log-normal fit parameters, respectively; k is the slope factor to capture the seasonality as discussed later, here k = 0.1; and N90,TH is the N90 threshold midpoint, here N90,TH = 120 cm−3. PDFFT and PDFBLI are inferred from long-term radon measurements at JFJ between 1 January 2009 and 31 December 2020, where the frequency distribution of the logarithm of the 222Rn concentrations has a bimodal shape with two discernible but overlapping modes. The two normal distributions were fitted to this frequency distribution, where the modes at lower and higher concentrations are assumed to represent undisturbed FT and BLI conditions, respectively. The resulting probability density functions for 222Rn concentrations of FT and BLI air masses are according to
where the log-normal fit parameters are μFT = −0.139 Bq std m−3, σFT = 0.239 Bq std m−3 for PDFFT and μBLI = 0.403 Bq std m−3, σBLI = 0.238 Bq std m−3 for PDFBLI. Herrmann et al. (2015) showed, depending on the seasons at JFJ, values of N90 ≥ 100–150 cm−3 to be only present during BLI conditions. N90 values below this threshold do not exclude BLI conditions. Therefore, the second factor of Eq. (1) forces PFT to low probabilities whenever N90 exceeds the defined threshold, while below the threshold PFT becomes identical to using the first factor of Eq. (1) (222Rn term) only. A more detailed description can be found in Brunner et al. (2021). 222Rn is measured at JFJ according to Griffiths et al. (2014) and N90 retrieved from SMPS measurements. The temporal resolution of the 222Rn measurements is one every 30 min and one every 6 min for the N90 measurements.
2.2.2 Saharan dust events and background conditions
JFJ is frequently influenced by Saharan dust events (SDEs; Collaud Coen et al., 2004). Between 2001 and 2017, 10–50 SDEs were reported each year with an annual total duration of 200–700 h (Bader et al., 2021). To detect SDE periods the method of Brunner et al. (2021) is applied. It uses four tracers as indicators for SDEs: the single-scattering albedo Ångström exponent, measured and retrieved from nephelometer and Aethalometer measurements at JFJ (Collaud Coen et al., 2004); the attenuated backscatter of the Lufft CHM15k NIMBUS ceilometer, operated by MeteoSwiss at Kleine Scheidegg (KSE, 46.547∘ N, 7.985∘ E, 2061 m a.s.l., Hervo et al., 2016), 4.4 km north of JFJ and 1500 m lower in altitude; particle surface residence times over the Saharan desert of air parcels arriving at JFJ, modeled using the Lagrangian particle dispersion model FLEXPART (Version 9.1_EMPA, Stohl et al., 2005); and the satellite-retrieved dust mass concentrations from the Copernicus Atmosphere Monitoring Service (CAMS). If at least one tracer indicates a SDE, the period is labeled as SDE. This conservative approach aims at providing a clean subset of data set for non-SDE cases, whereas the subset with the SDE label may include some non-SDE periods. SDEs can occur in FT or BLI conditions, denoted as FTSDE and BLISDE, respectively. In the total period analyzed, 31 SDEs were recorded with a total duration of 55 d and 20 h. Periods without a SDE signal are labeled as background periods (BG = total − SDE). BG periods are further divided into FT and BLI periods (FTBG and BLIBG, correspondingly). The conditions for a positive SDE signal and further information can be found in Brunner et al. (2021).
The observed seasonal and diurnal variability of INP concentrations are discussed in the following sections. First, the total investigated period is brought (see Fig. A3a for individual INP measurement annual time series overview) into context with previous seasons with regard to standard meteorological parameters and the type of air mass present at the site throughout the year (Fig. A3b and c). Then, the seasonal signature of different air masses is analyzed. Finally, the observed diurnal variability is presented for different air masses.
3.1 The seasonal INP variability at JFJ
During February 2020–January 2021, the mean temperature at JFJ was −5.9 ∘C, representing the warmest period on record since 1933 and 2.0 ∘C warmer than February 1933–January 1971. On 10 February, the storm “Sabine” led to wind speeds of up to 54 m s−1, which corresponds to the 99.6th percentile of all daily maximum wind measurements at JFJ. Yet, this is still well below the record wind velocity of 74 m s−1, measured on 6 January 1998. The site was 40 % less in clouds (where a relative humidity (RH) greater than 96 % is considered in-cloud) compared to previous years (2020–2021: 16.1 % vs. 1970–2019: 26.6 %). Note that the prevalence of in-cloud conditions based on RH is underestimating the true prevalence of in-cloud conditions, but relative changes are well captured (e.g., see Herrmann et al., 2015). There were two exceptionally dry periods in the end of March and the beginning of April (23 March and 4 April: RH = 2.2 % in both cases at ambient temperatures of −10.3 and −8.5 ∘C, respectively, resulting in dew points of −47.2 and −48.8 ∘C, respectively). Ozone concentrations implied no intrusion of stratospheric air masses (23 March and 4 April: ozone = 50.8 and 61.0 ppb, respectively; stratospheric intrusions often go along with ozone concentrations > 70 ppb; Stohl et al., 2000). During the late March–early April period, air masses were largely advected from high northern latitudes. With 38 %, JFJ experienced 5 % more FT periods in relative terms than in the 2008–2019 period (36 %). Figure 1 shows a more detailed representation of the air masses present during the analyzed period compared to historic observations. The fractions of days purely in FT, of days with a mix of FT and BLI, and of days only in BLI air masses for February 2020–January 2021 were overall representative for the fractions observed during previous years, as they rarely exceed the climatological Q25 %–Q75 % range. May and August 2020 had more days purely in the FT at the expense of days only with BLI for May. February and November 2020 showed a significantly higher fraction of mixed air masses while there were fewer days purely with BLI.
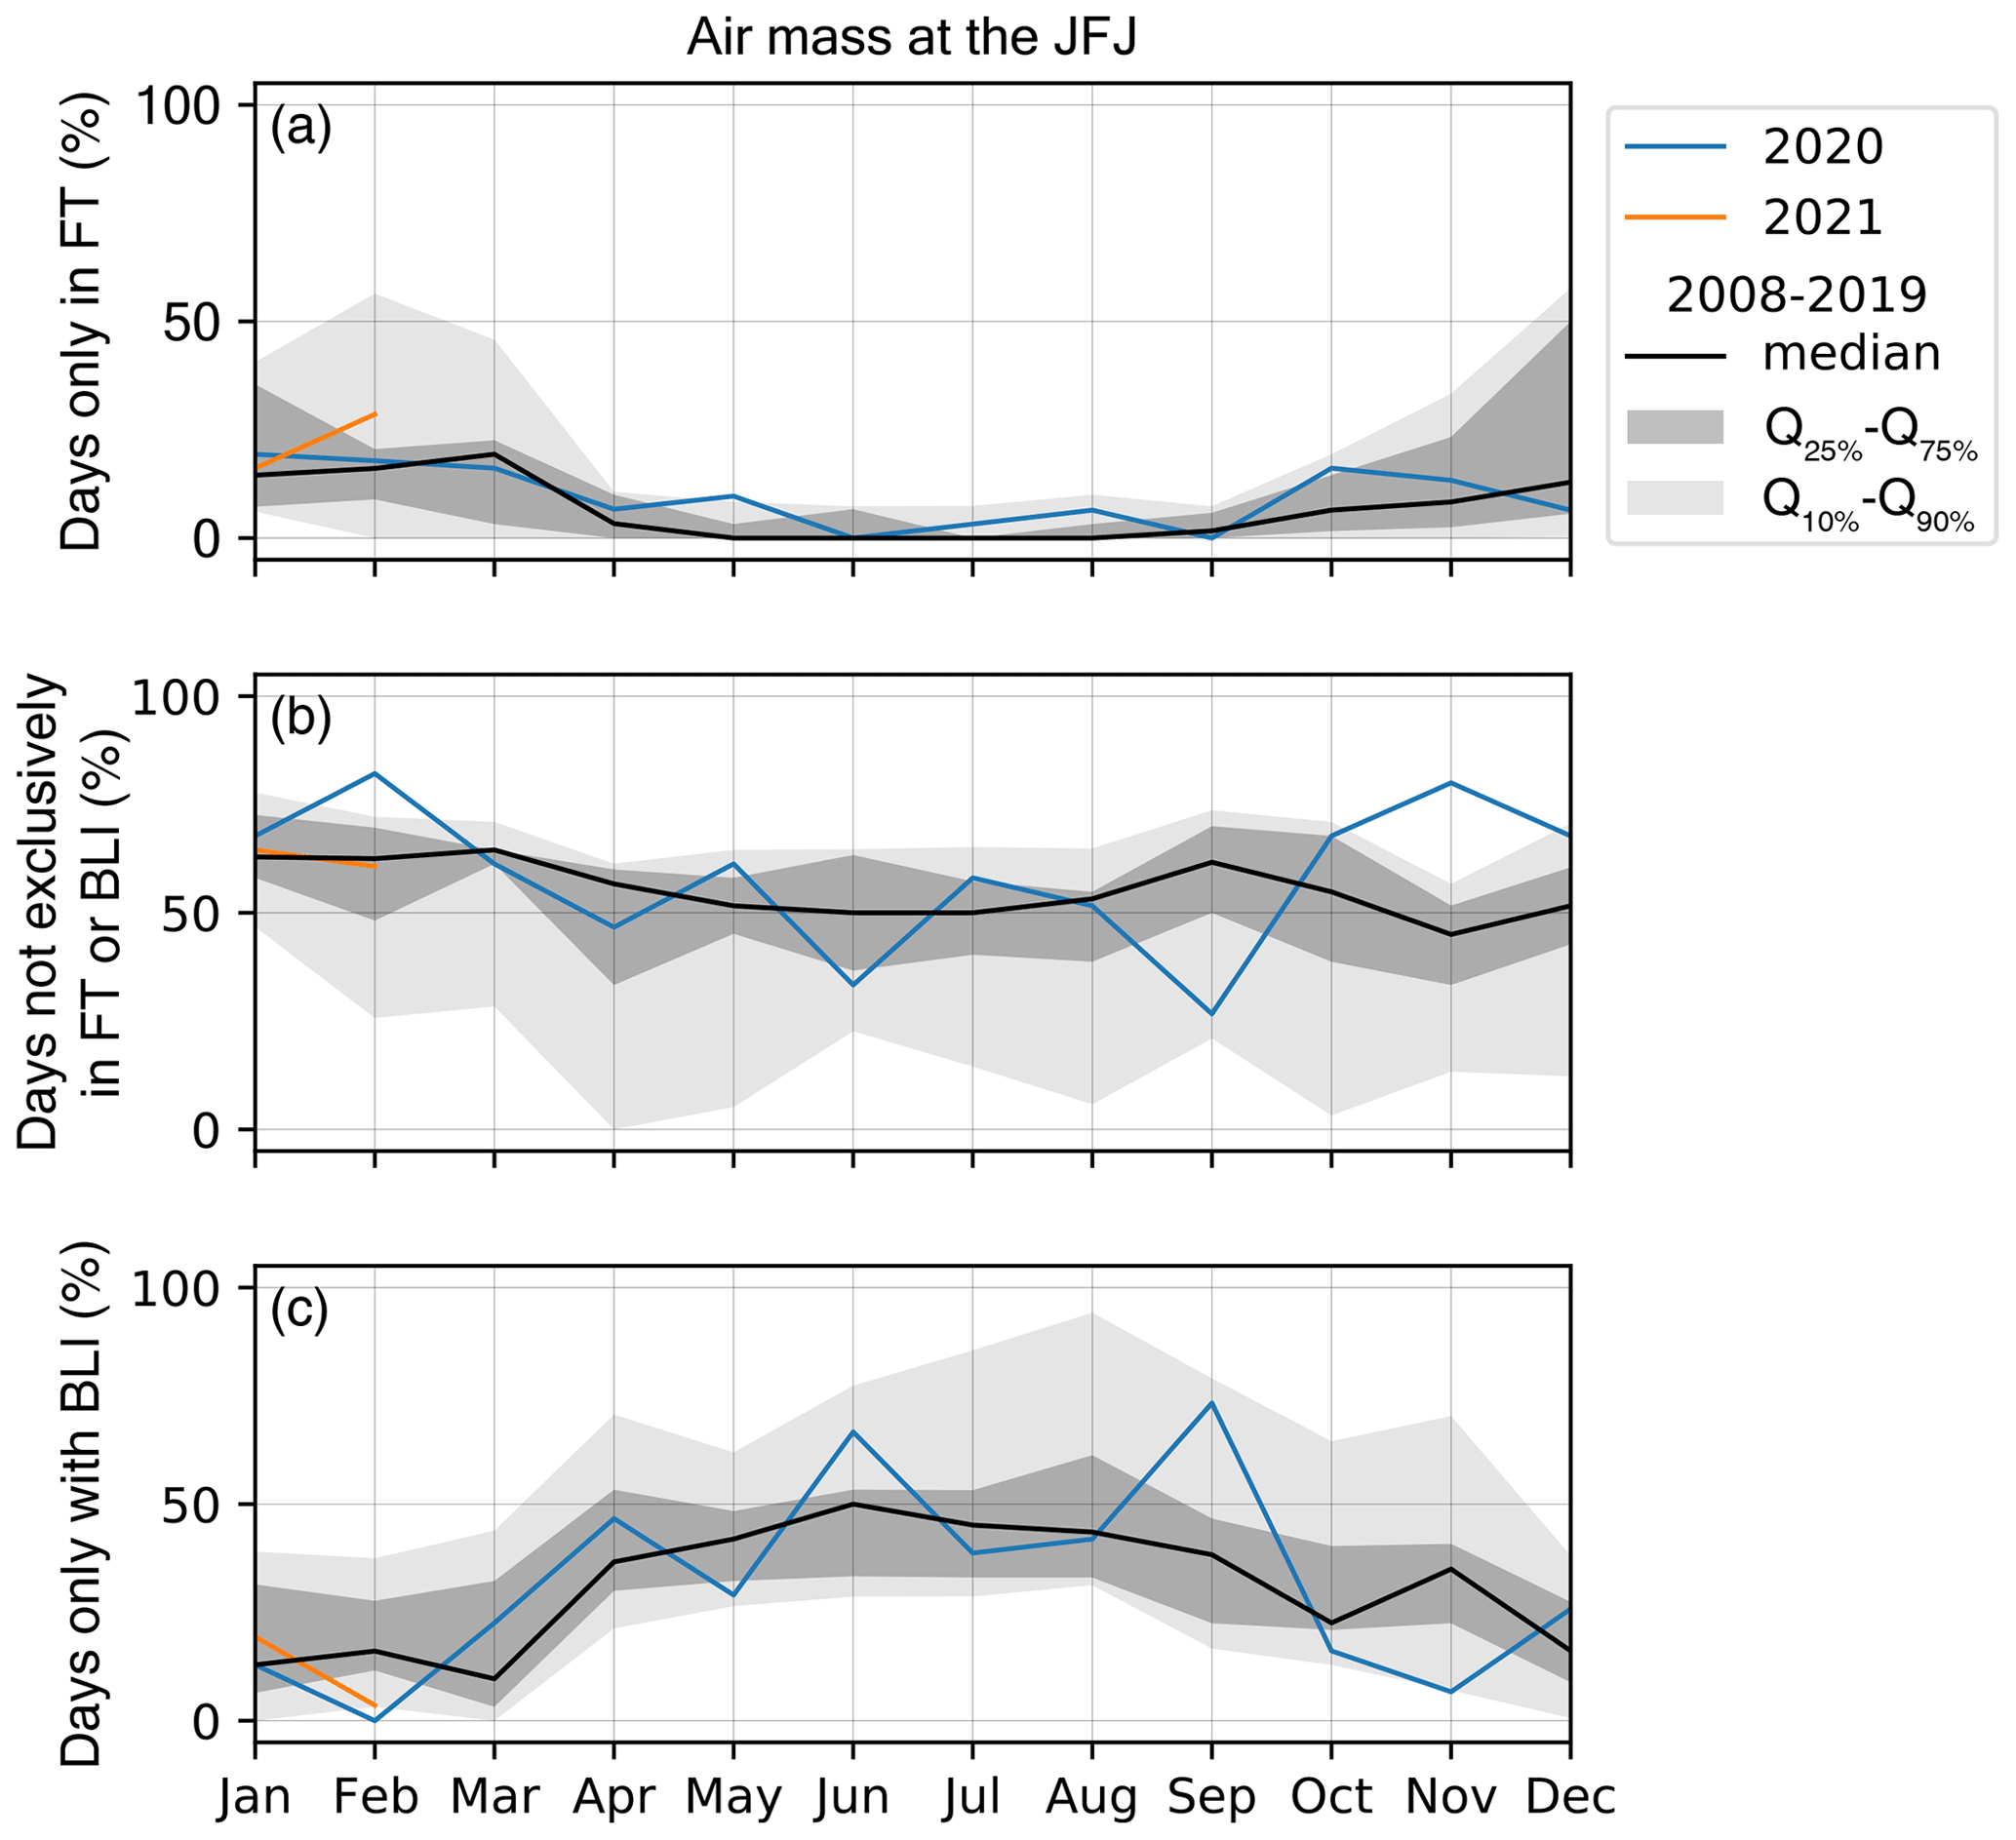
Figure 1Fraction of days (a) entirely in FT air masses, (b) in both FT and BLI air masses, and (c) only in BLI air masses for 2020 (blue), January–February 2021 (orange), and 2008–2019 (gray). Q10 %, Q25 %, Q75 %, and Q90 % correspond to the historic 10th, 25th, 75th, and 90th percentiles between 2008 and 2019.
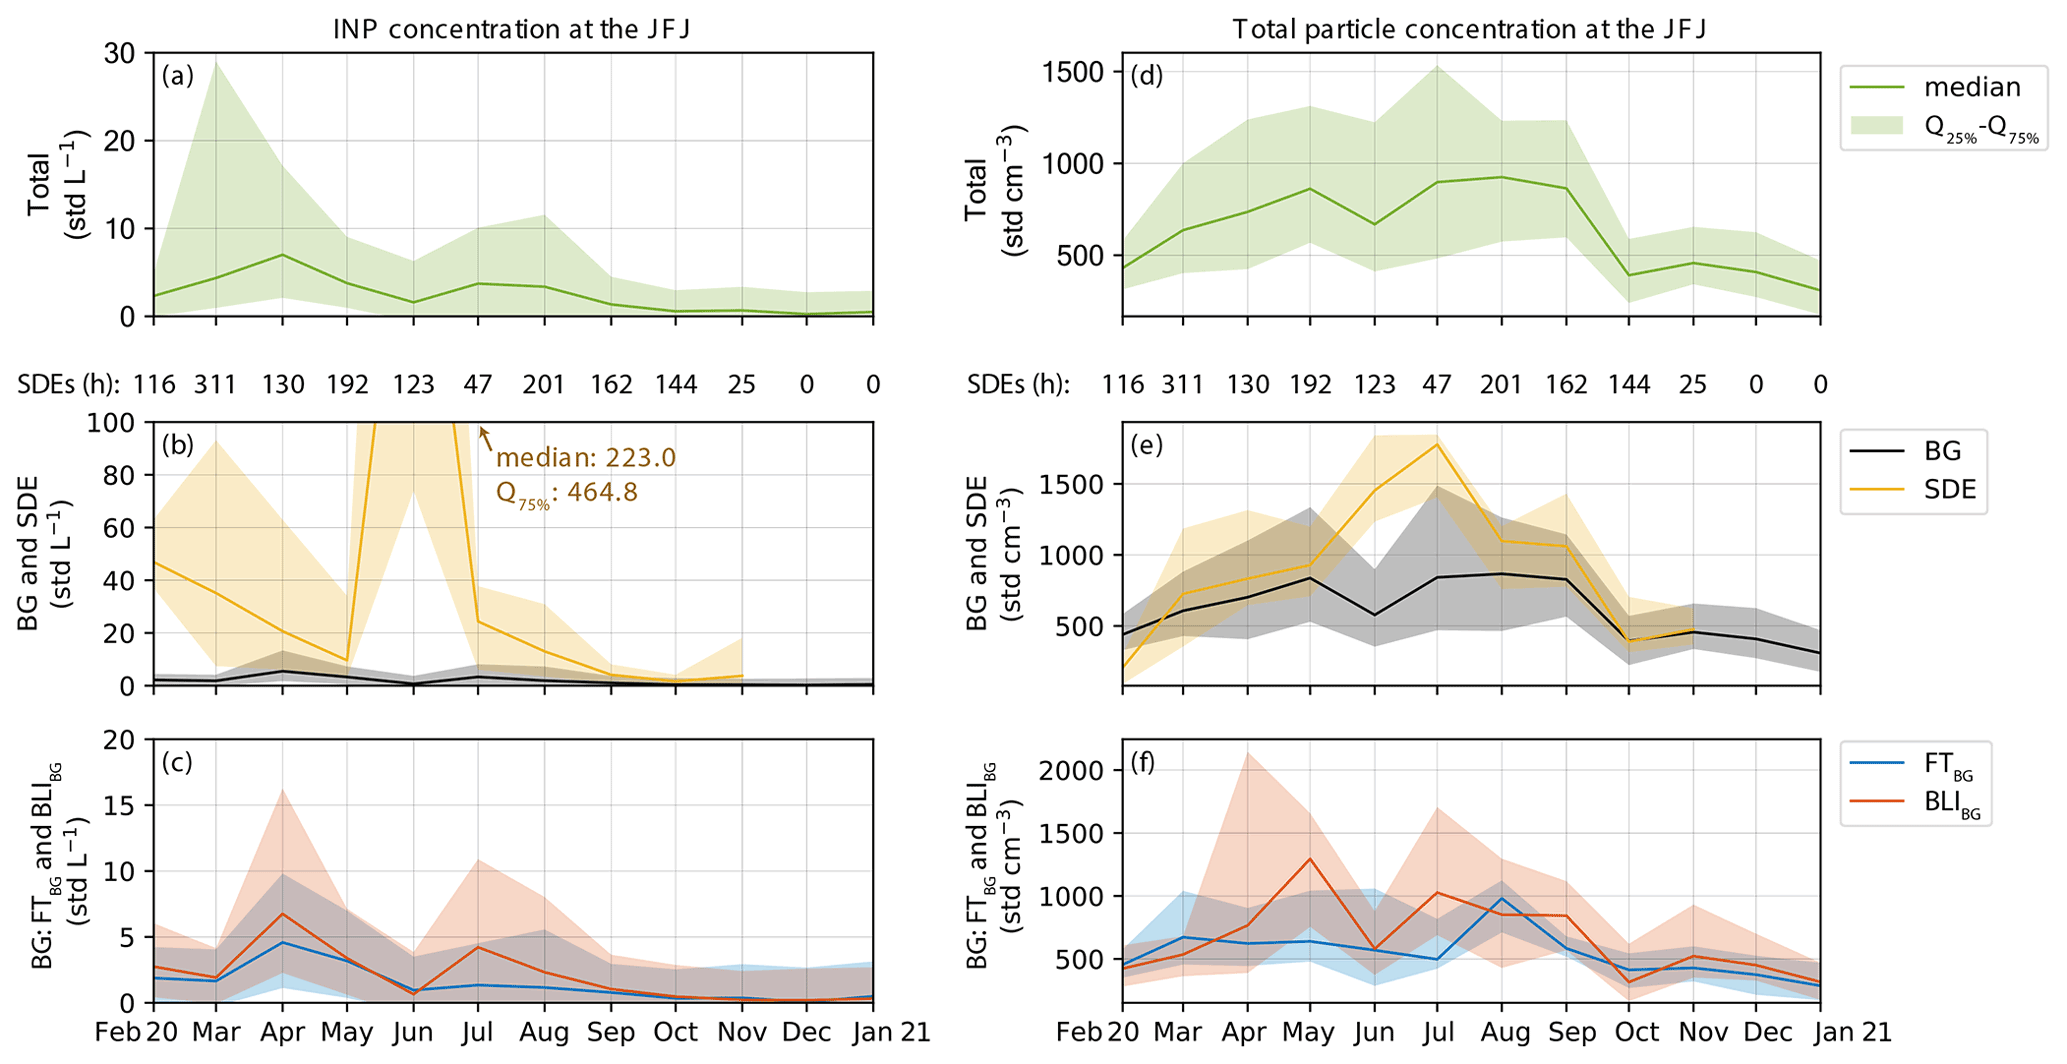
Figure 2Monthly median and 25th to 75th percentiles (Q25 %–Q75 %) of total INP concentrations (a), periods with Saharan dust events (SDE) or background (BG) conditions (b), and INP concentrations measured in free tropospheric background (FTBG) or boundary layer intruded background (BLIBG) air masses (c), and analogous for the total particle concentrations (d, e, f) at JFJ between February 2020 and January 2021. The numbers above (b) and (e) indicate the total hours of SDEs during each month. There were no SDEs in December 2020 and January 2021.
Figure 2a–c show the monthly variation in the INP concentrations at JFJ. The median INP concentrations are highest in April and July–August and lowest in December. Decomposing the data into periods with SDEs and BG conditions reveals the high Q75 % concentrations in March to be a result of SDEs, as four SDEs cumulatively made up 42 % of the available time in March. Overall, the monthly median INP concentration during SDEs always exceeded the Q75 % of the BG concentrations. June had the most active SDE of the investigated period with a duration of 123 h and a Q95 % of 881.1 INP std L−1. Together with two more brief and less active SDEs, June had the highest monthly INP concentrations during SDEs (median = 223.0 INP std L−1, Q75 % = 464.8 INP std L−1), 2 orders of magnitude higher than the corresponding BG concentrations, consistent with results from Chou et al. (2011). After June, February 2020 showed the median highest INP concentrations during SDEs, followed by March (median = 46.9 and 35.1 INP std L−1, respectively). There were no recorded SDEs in December 2020 and January 2021. Overall Saharan dust contributed to 74.7 ± 0.2 % of the total INPs observed at the sampling conditions at JFJ (see Brunner et al., 2021). BG concentrations in June were lower compared to spring and July–August. Dividing BG periods into FTBG and BLIBG shows similar distributions in both cases for most of the investigated period (see Fig. 2c). Median and Q75 % concentrations in April, July, and – to a lesser extent – August were higher during BLIBG than in FTBG air masses. Independent of the air mass, April showed the highest BG INP concentrations. In contrast to observations of INPs active at warmer temperatures (Conen et al., 2015; Schneider et al., 2021), no correlation between the ambient temperature and the INP concentrations is evident in our data (Spearman's rank correlation coefficient = 0.149, R2 = 0.012). We hypothesize that because the investigated ice-activation temperature in our study (24 K) is distinctively colder than the ambient temperature (median: 267 K) in contrast to Conen et al. (2015, INP concentration at 265 K, median ambient temperature = 266.5 K), in the latter case a substantial fraction of the INPs can be removed from the air layers around the site when the INPs activate and the formed ice crystals sediment. However, the observations by Schneider et al. (2021) do not support this hypothesis (INP conc. at 257 K, median ambient temperature = 278 K). Comparing the observed seasonal pattern in total particle number concentrations (see Fig. 2d–f) with the observed seasonality in INP concentrations, both concentrations are highest in spring and summer and lowest in winter. However, while BG INP concentrations peaked in April for both FTBG and BLIBG, only a peak in the 75th percentile is apparent in April for the total particle concentration (see Fig. 2f). While the drop in BG INP concentrations after the summer occurred continuously in August and September, total particle number concentrations remained at summer levels also in September (see Fig. 2d). The seasonal median BG total particle concentrations varied by a factor of ∼ 3, while the corresponding INP concentrations varied by a factor of 22. On a more detailed level, April was the month with the fifth highest total particle concentrations, with August and May being the months with the highest loading. During the exceptionally dry period (23 March–4 April), INP concentrations were 4 times higher than before this period but remained at the same level or increased further afterwards, suggesting that the high INP concentrations in April are not connected to the mentioned dry period. In the absence of Saharan dust, the peak INP concentrations observed in the spring and summer at JFJ were influenced by convectively and/or orographically transported aerosol. This observation is similar to that of Lacher et al. (2018) based on nine field campaigns that observed relatively constant INP concentrations at 242 K during free tropospheric conditions (absence of BLI) at JFJ. A study by Conen et al. (2015) at the same site but at 265 K also reported a seasonal cycle with higher concentrations in the summer, also in agreement with our study. In general, a seasonal cycle demonstrating high INP concentrations in the spring–early summer and the lowest INP concentrations in the winter across a wide temperature range (260–251 K) has also been observed at other locations such as the arctic (Wex et al., 2019) and boreal forest (Schneider et al., 2021) owing to increased aerosol transport during the spring season. However, the seasonal cycle can be caused by different types of transport (long range vs. convective uplift) or different sources (dust vs. regional and locally produced biogenic aerosol).
Multiple species of pollen and subpollen particles were found to be ice-active in previous laboratory studies, specifically birch, juniper, pine, orchard grass, and redtop grass (e.g., Gute and Abbatt, 2020, and references in Table 1). Note that juniper belongs to the cypress family. Given their seasonality, could pollen or subpollen particles be responsible for the distinctively higher INP concentrations in April? Figure 3 (and Fig. A1 in more detail) shows the pollen concentration for the two stations closest to JFJ, Bern (60 km northeast, 540 m a.s.l.) and Visp (29 km south-southeast, 658 m a.s.l.). However, both of them are ground sites within the PBL. Pollen were sampled by MeteoSwiss on traps for 1 week on a rotating drum providing a daily data resolution (see Galán et al., 2014, for more information). We assess Bern to be representative for the pollen load in the Swiss plateau, which is directly north of JFJ, while Visp is located in the Rhône Valley south of JFJ. To compare, Fig. 3b illustrates the INP concentrations in BG air masses (without SDEs) and the Q10 % of PFT of a given day. We chose the Q10 % as proxy, as brief BLIs are ignored while longer periods of BLIs are accounted for. BLIs need to prevail cumulatively for 2.5 h a day to show a BLI signal in Q10 %. In the following, we discuss the median freezing temperature of the pollen wash water, containing the subpollen particles of each species, where D01 denotes Diehl et al. (2001), vB05 denotes von Blohn et al. (2005), P12 denotes Pummer et al. (2012), D17 denotes Dreischmeier et al. (2017), and G20 denotes Gute and Abbatt (2020).
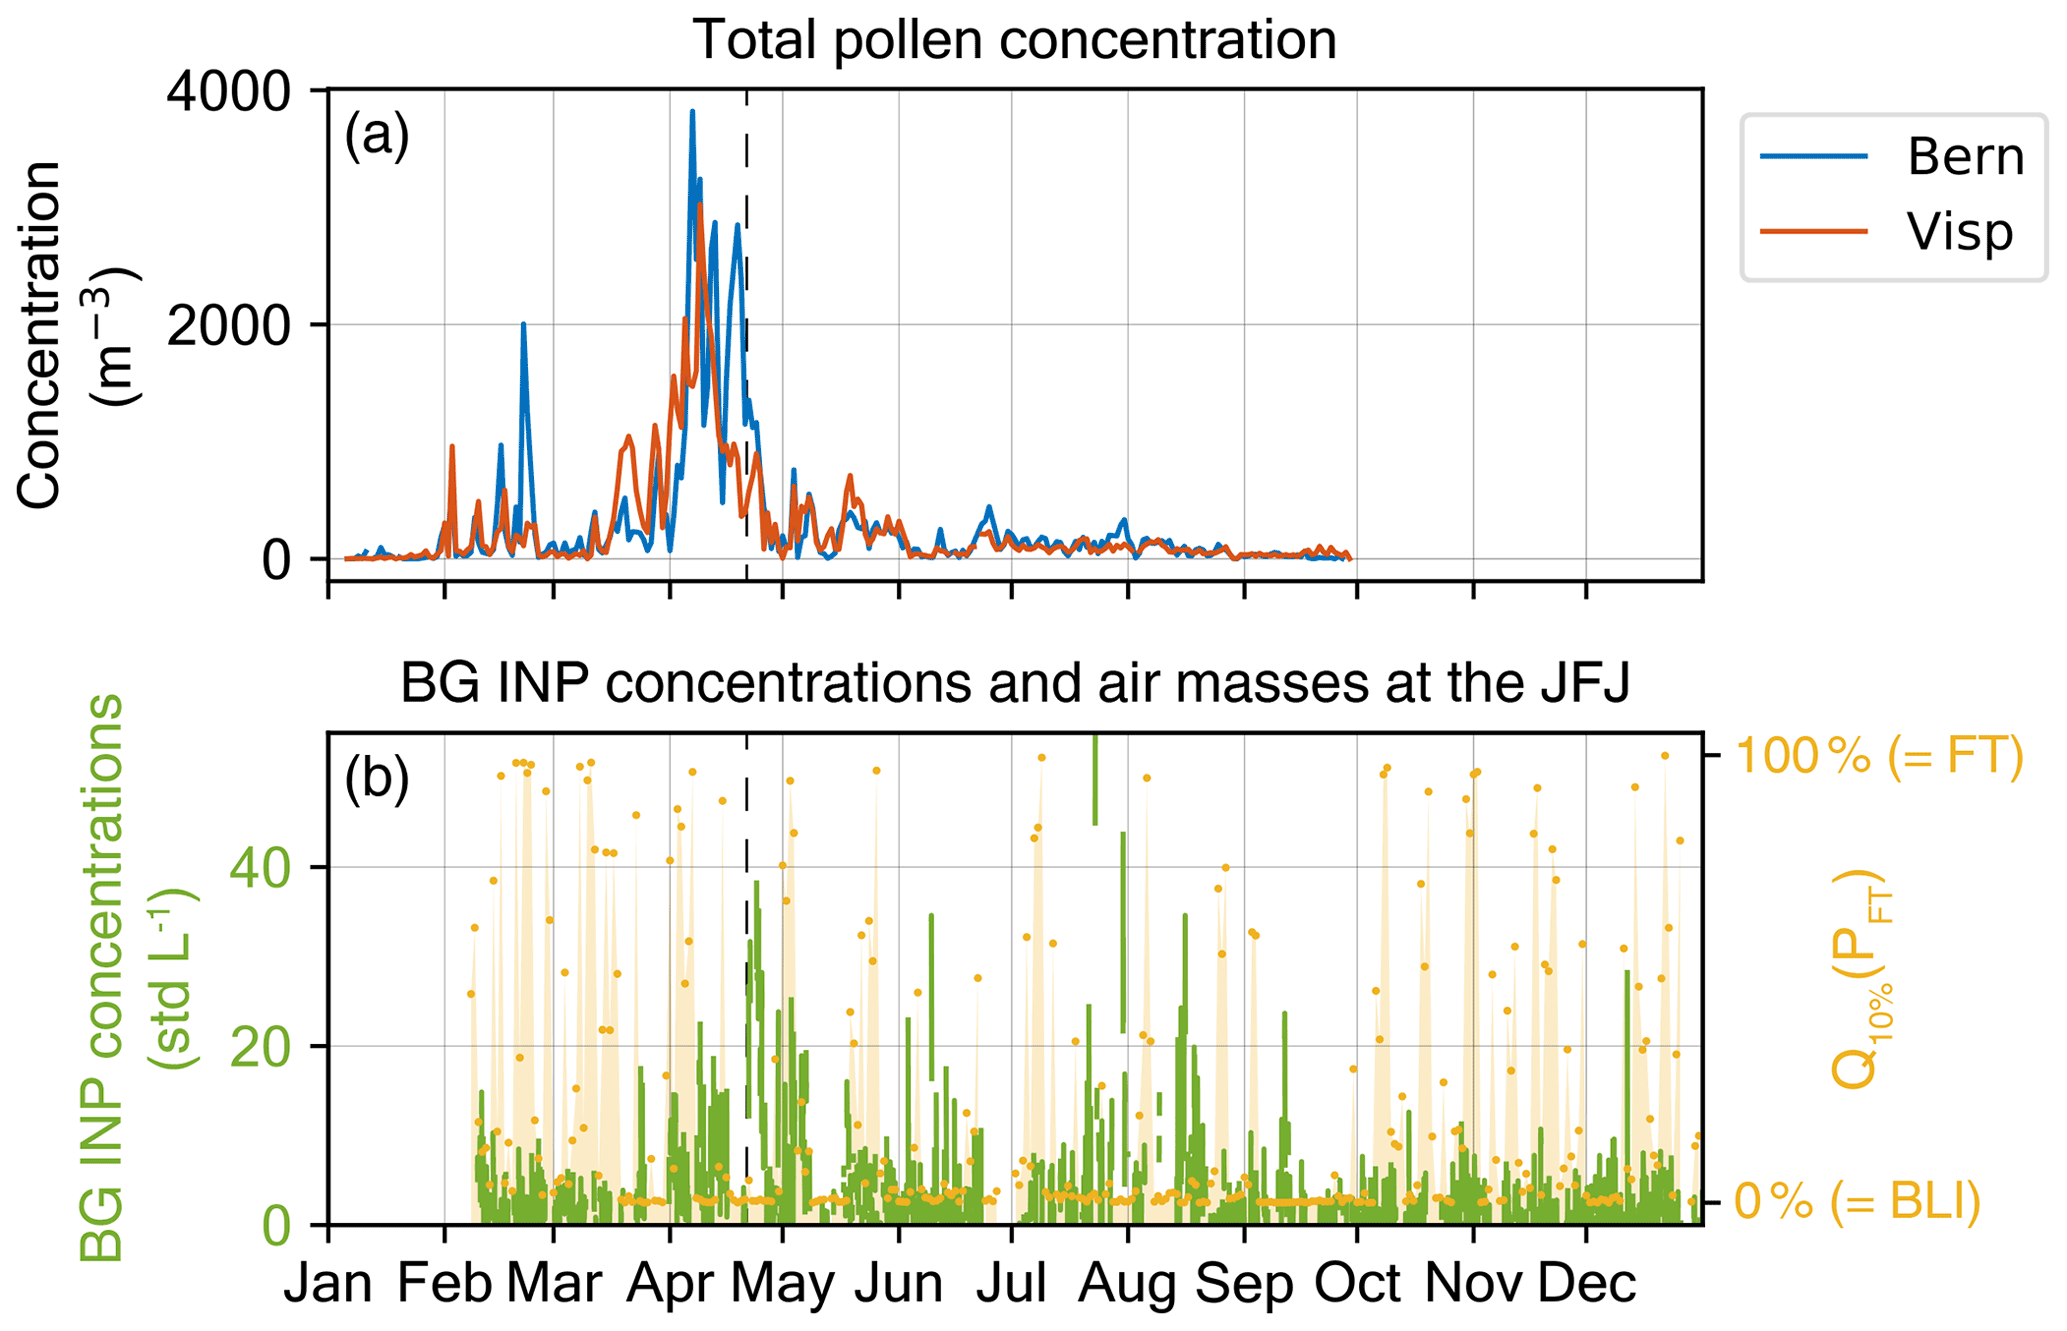
Figure 3Timeline of the total pollen concentration at Bern and Visp (a) and the corresponding BG (excluding SDE) INP concentration (high-resolution) at JFJ with the Q10 % of PFT of a given day (b) between February 2020 and the end of December 2021. The dashed black line indicates the peak in INP concentrations in April. Pollen data are only available between early January and the end of September. Pollen data courtesy of MeteoSwiss.
Pollen in the ambient air were detected between 7 January and the end of the sampling period on 29 September, with a first maximum at the end of February, where yew (vB05: 250 K) dominated in Bern but was almost nonexistent at Visp. The remaining major fraction stemmed from alder (D17: 256 K, G20: 264.75 K) and hazel (P12: 249 K). A second maximum, resembling the absolute climax in pollen concentration, was between April 5 and 10. Between the end of March and mid-April, the overall pollen load in Visp was 12 % higher than in Bern. It was dominated by birch (D01: 258 K, P12: 254 K, G20: 259 K) by 58 % and 49 % for Bern and Visp, respectively, followed by ash (Bern: 17 %, Visp: 24 %), poplar, and cypress (P12: 253 K, G20: 255 K). In Bern, beech, oak (D01: 256 K, G20: 259 K), spruce, and sycamore (G20: 266 K) were mainly detected between mid-April and the end of April, while in Visp the overall pollen concentration was much lower, and oak was the major constituent. Birch pollen were only found in small concentrations after 20 April in Visp and 22 April in Bern. Between June and September the dominating species were nettle (P12: 248 K) and hemp plants. All pollen, for which the ice nucleation activity was available in the literature, are active at the sampling temperature used in this study (243 K). Therefore, their subpollen particles should be detected by HINC-Auto if transported to JFJ. Intact pollen grains themselves are above the upper size cut-off of d>2.5 µm of HINC-Auto (see Brunner et al., 2021, for a detailed description about the size-dependent particle transmission efficiency). Median BG INP concentrations during the first pollen maximum on 20–25 February were 1.4 ± 1.2 INP std L−1, statistically indifferent with regard to INP concentrations 10 d before and after this period. However, JFJ was mostly in the FT, rendering the transport of pollen or subpollen particles to the site unlikely. During the second maximum on 4–11 April, when birch pollen were dominating, median BG INP concentrations were 3.1 ± 1.3 INP std L−1 and decreased to 2.4 ± 1.2 INP std L−1 on 15–20 April. JFJ was exposed to BLI for most of this period. Between 21–25 April, when pollen concentrations already mostly declined, the highest median INP concentrations were measured (20 ± 1.4 INP std L−1; see also Fig. A1). Based on these observations and back trajectories (not shown here) arriving at JFJ on 20 and 22 April, it is unlikely that fragmented pollen or subpollen particles from Bern or Visp are responsible for the observed high BG INP concentrations in April; however, because no pollen measurements were available for JFJ, this needs to be verified in future work. We note that subpollen particles could have been transported to JFJ from other parts of Switzerland and Europe, like from Italy to the south of JFJ or regions northeast of JFJ within Switzerland, and as such their contributions can similarly not be ruled out, in particular because the timing of the bloom depends on the altitude and can also be mixed into the air masses from nearby hills and valleys as has been observed for INP transport to mountaintop sites (Wieder et al., 2022). The background-corrected maximum contribution of fragmented pollen or subpollen particles to the overall INP population at T = 243.15 K and Sw = 1.04 during peak periods (8–14 April) is 19.9 INP std L−1, with a median contribution of 5.8 INP std L−1 during these peak periods (see also Fig. A1). If every pollen grain were ice-active at 243 K, and the same pollen concentration were present at JFJ as measured in Bern, i.e., the PBL was perfectly mixed and JFJ was within the PBL, pollen would only contribute up to 3.6 INP std L−1 (4 INP L−1), 5 times less than the Q95 % INP concentration for BLIBG conditions during the same time period. This indicates that if the peaks of up to 19.9 INP std L−1 result from pollen particles from other regions (excluding Bern and Visp), a fragmentation process needs to be involved, like the swelling of pollen, burst, and subsequent release of a great number of subpollen particles from every pollen grain, as predicted by laboratory experiments (Gute and Abbatt, 2020).
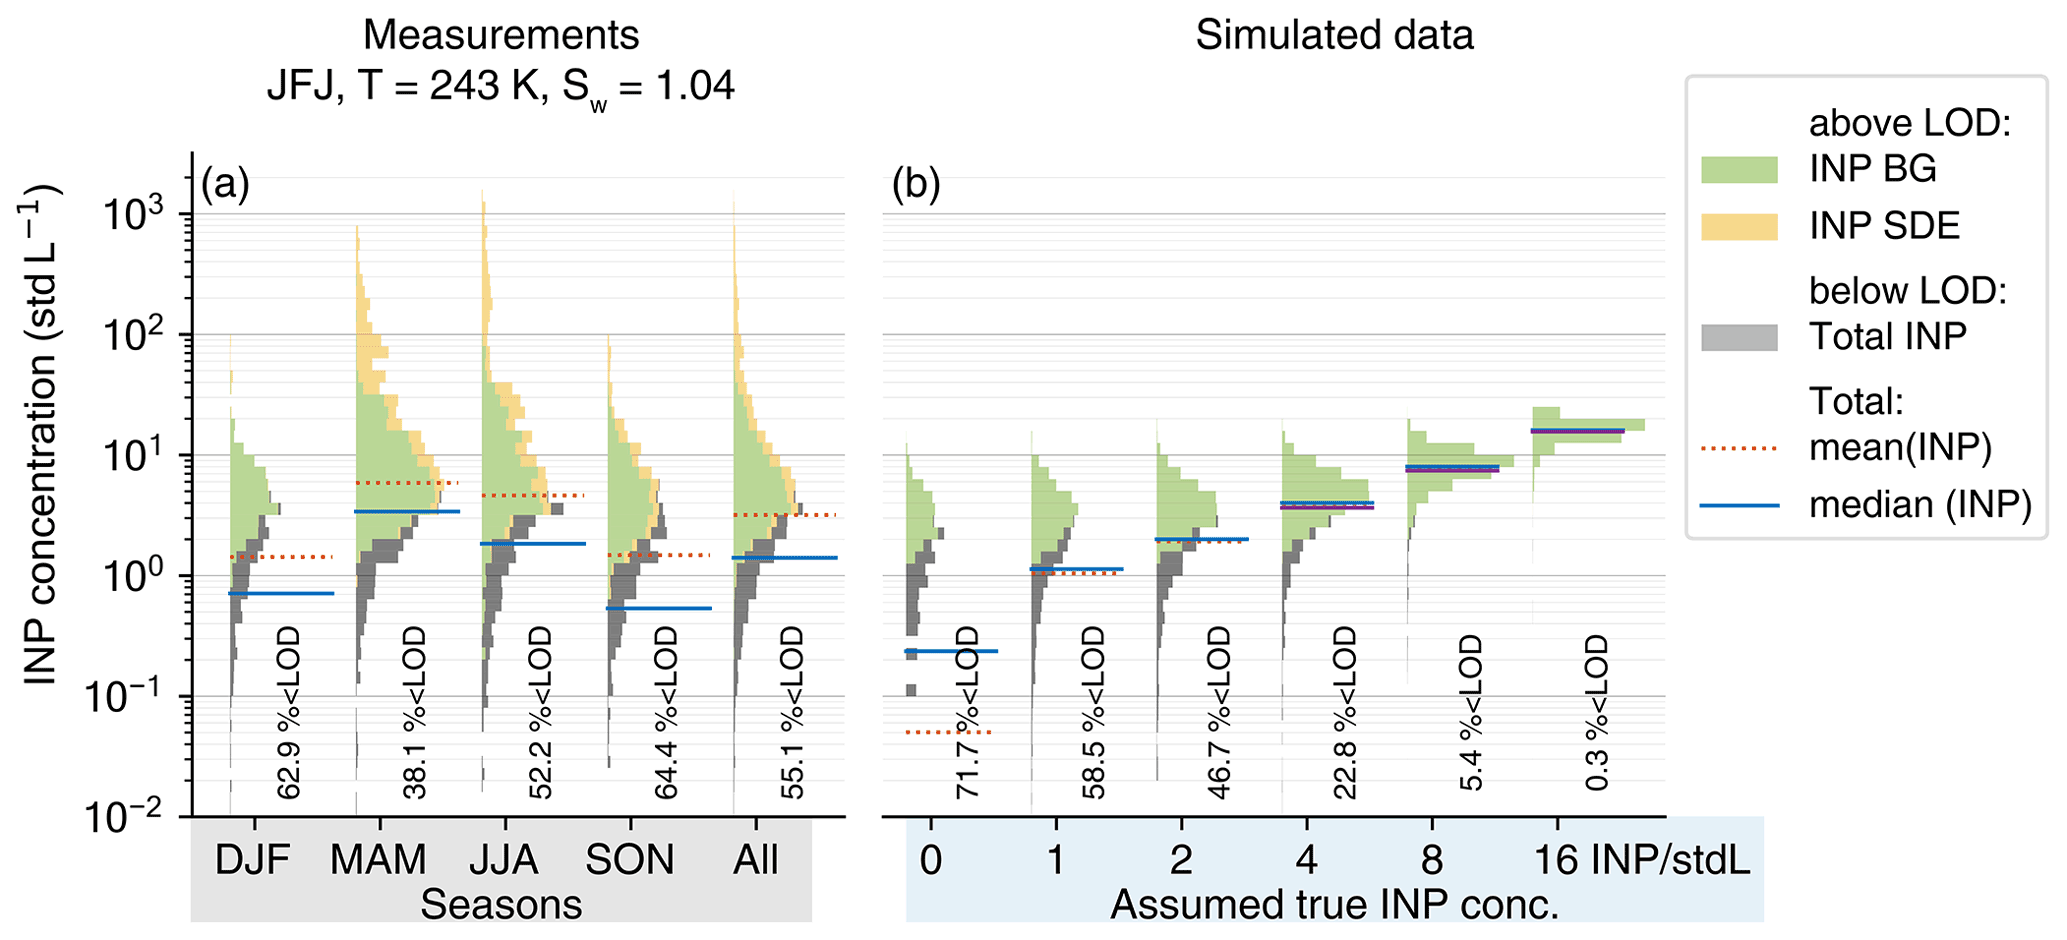
Figure 4(a) Frequency distributions of INP concentrations measured in winter (December 2020, January 2021, February 2020), spring (March–May 2020), summer (June–August 2020), fall (September–November 2020), and during the entire investigated period (February 2020–January 2021); (b) frequency distributions of simulated artificial INP concentrations with a prescribed INP concentration of 0, 1, 2, 4, 8, and 16 std L−1. Green indicates INP concentrations above the limit of detection (LOD) during BG conditions, yellow during SDE periods, gray INP concentrations below the LOD (independently of the air mass), red dashed lines the overall mean INP concentration, and the blue line the overall median INP concentration. Because of the log-scale, only positive concentrations are shown. The stated percentages indicate the fraction of measurements below the LOD.
As with every instrument, HINC-Auto introduces artifacts based on the methodology used which reflect back in the data it provides. Because the measured INP concentrations are often close to or within the counting uncertainty, a simple model of the sampling method used in HINC-Auto was developed to assess the overall and seasonal BG INP concentration. In the model, all particle-free air measurements between 7 February 2020 and 31 January 2021 (N = 21 614, 5 min each) were concatenated to a single vector. Using random 5 min samples from this vector (with replacement), 10 000 artificial measurements were simulated with a prescribed constant INP concentration. The frequency distributions of these synthetic measurements for prescribed constant INP concentrations of 0, 1, 2, 4, 8, and 16 std L−1 are shown in Fig. 4 and compared to the seasonal and overall INP concentrations. For a prescribed concentration of 0 INP std L−1, the model estimates that HINC-Auto would record values of up to 10 INP std L−1, with a median and average close to 0 INP std L−1. The difference between the median and the average concentration corresponds to statistical noise and converges to 0 INP std L−1 for an increasing number of artificial measurements. A total of 71.7 % of all artificial measurements are below the LOD, which deviates from 84.1 %, the fraction expected for values following a symmetric Gaussian distribution without a kurtosis. For a prescribed concentration of 1 INP std L−1, the shown distribution using a log-scale only changes insignificantly compared to a prescribed concentration of 0 INP std L−1. The median and mean converge close to 1 INP std L−1, while the fraction below the LOD decreases. Also, for artificial measurements with higher prescribed INP concentrations, the median and mean agree well with the set prescribed INP concentration; however, the shape of the distribution follows a normal and not a log-normal distribution. The seasonal and overall frequency distributions, in contrast, show a log-normal distribution, as expected by theory (Ott, 1990) and discussed more in Brunner et al. (2021). Comparing the artificial signals with the measurements, the total (SDE+BG) true median INP concentration in winter was likely between 0 and 1 INP std L−1. This is supported by the median observed in the INP measurements (0.7 INP std L−1), the fraction below the LOD, and the shape of the distribution. The INP concentration in spring increased (median: 3.1 INP std L−1), with and without consideration of measurements during SDEs, and decreased in summer (median: 1.6 INP std L−1) and decreased further in fall (median: 0.5 INP std L−1). The total (including SDE and BG periods) median INP concentration between February 2020 and January 2021 is 1.4 INP std L−1. The analysis with a model mimicking the instrument's methodology nicely shows how an instrument with given counting uncertainty can alter the frequency distribution of INP concentrations, whereas the median remains robust. Thus, comparing the observed seasonal and total frequency distributions with the model output with known INP concentrations, e.g., with respect to the fraction of INP concentrations below the LOD and the relative location of the median to the frequency bins above 0.01 INP std L−1, the model supports the reported median INP concentrations. Yet, it questions which fraction of the observed frequency distribution arises only because of the instrument bias and subsequently does not correspond to the true INP concentration within the atmosphere. This mainly concerns reported individual INP concentrations below 10 INP std L−1, whereas for higher INP concentrations, the reported frequency distributions are robust, as the model shows less spread the higher the prescribed INP concentration.
Disentangling the total observed INP concentration for the entire period in more detail, the median BG INP concentration remains at 1.4 INP std L−1, hinting to the small contribution of SDE periods to the median INP concentration, given the comparatively short total duration of all SDE periods (55 d 20 h) within the entire period analyzed (359 d). A further division of all BG INP concentrations into periods with FT or BLI air masses reveals the median INP concentrations to be 20 % lower in the FT (FTBG = 1.2 INP std L−1) and 7 % higher during BLI (BLIBG = 1.5 INP std L−1).
Table 1Seasonal statistics of INP concentrations measured at JFJ at T = 243.15 K and Sw = 1.04 between 7 February, 7 February 2020, and 31 January 2021.

Table 1 provides a more detailed overview of the seasons, including the 25th, 75th, and 95th percentiles. In general, the concentrations found in the present work are lower compared to earlier work at JFJ (Lacher et al., 2018), but consistent with studies at different locations (e.g., Schrod et al., 2020). Comparing the frequency distribution of the measurements from this work to Lacher et al. (2018) emphasizes the difference in observed concentrations (see Fig. A2) and proves that the nine single field campaigns in the mentioned earlier work, all aimed to sample SDEs between mid-January and the beginning of March and between May and August in the years 2014–2017, were successful in probing an over-proportional fraction of SDEs. This is further supported by the INP frequency distributions, which for Lacher et al. (2018) are not log-normal as expected compared to those of the present work. Overall, the seasonality has a minor impact on the observed INP concentrations, which is consistent with other work (e.g., Tobo et al., 2020; Schrod et al., 2020) and holds true for FT conditions, and within the PBL. The seasonal INP number concentrations vary by a factor of up to 7 for identical statistical metrics, e.g., when comparing the median concentrations, thus well below the variation observed within all measurements or compared to SDEs.
Table 2Diurnal statistics of BG INP concentrations at T = 243.15 K and Sw = 1.04 and BG total particle number concentrations (≤ 14 nm), for the median of the phase-averaged concentrations measured at JFJ between 7 February, 7 February 2020, and 31 January 2021.
3.2 The diurnal INP variability at JFJ
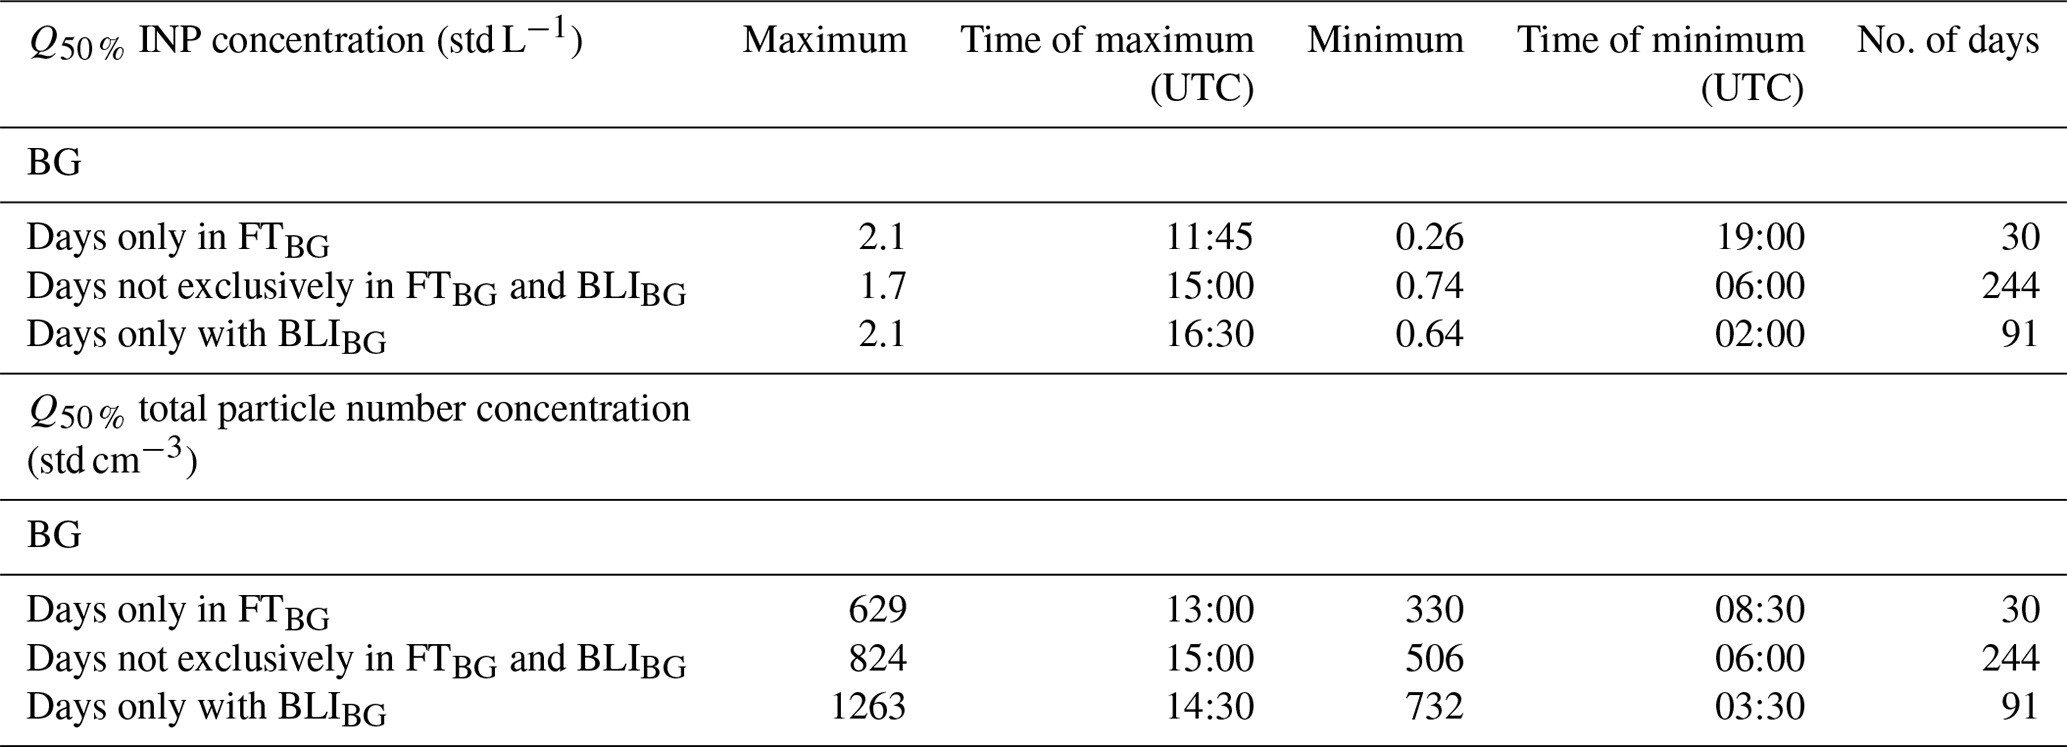
To study the diurnal variability of INPs at JFJ, phase statistics of the BG INP concentrations with a cycle period of 24 h were calculated for the total investigated period, starting at midnight of each day (see Fig. 5). These phase statistics were divided into periods when the full day was in FT air masses (30 d), days not exclusively in FT or BLI (244 d), or days only with BLI (91 d), as shown in Fig. 5a–c, respectively, with statistics in Table 2. Phase statistics of the total particle number concentrations during BG periods are superimposed (total particle concentrations from CPC measurements without SDE periods). For days only in the FT, there is no clear diurnal cycle in INP number concentrations evident (Fig. 5a, green trace), while the median BG particle concentration shows a weak diurnal cycle, with a maximum of 629 std cm−3 at 13:00 UTC and a minimum of 330 std cm−3 at 08:30 UTC (Fig. 5a, black trace). For days with a mix of FT and BLI air masses, the median BG INP and BG particle number concentrations follow a similar diurnal cycle, with a maximum of 1.7 std L−1 and 824 std cm−3 (Fig. 5b green and black trace, respectively) at 15:00 UTC and a minimum of 0.74 std L−1 and 506 std cm−3, respectively, at 06:00 UTC. The variation is less pronounced in BG particle concentrations (max and min vs. cycle median = +39 % and −14 %) compared to the observed variation in BG INP concentrations (max and min vs. cycle median = +70 % and −26 %; Fig. 5b black and green shaded regions, respectively). Also, for days entirely with BLI a diurnal variability in BG INP concentrations is apparent (Fig. 5c, green trace). The mean BG particle concentrations increase by 58 % compared to mixed days and double compared to days entirely in the FT, while median BG INP concentrations increase by 33 % and 32 % for pure BLI days compared to mixed and FT days, respectively. The maximum BG INP and BG particle number concentration is at 16:30 UTC (2.1 std L−1) and 14:30 UTC (1263 std cm−3), while the minimum was at 02:00 UTC (0.64 std L−1) and 03:30 UTC (732 std cm−3; Fig. 5c). As for days with FT and BLI, the relative variation for BG INP concentrations is more pronounced. The results suggest that the diurnal cycle of INPs is driven by convection and the expansion of the planetary boundary layer throughout the day, as discussed below.
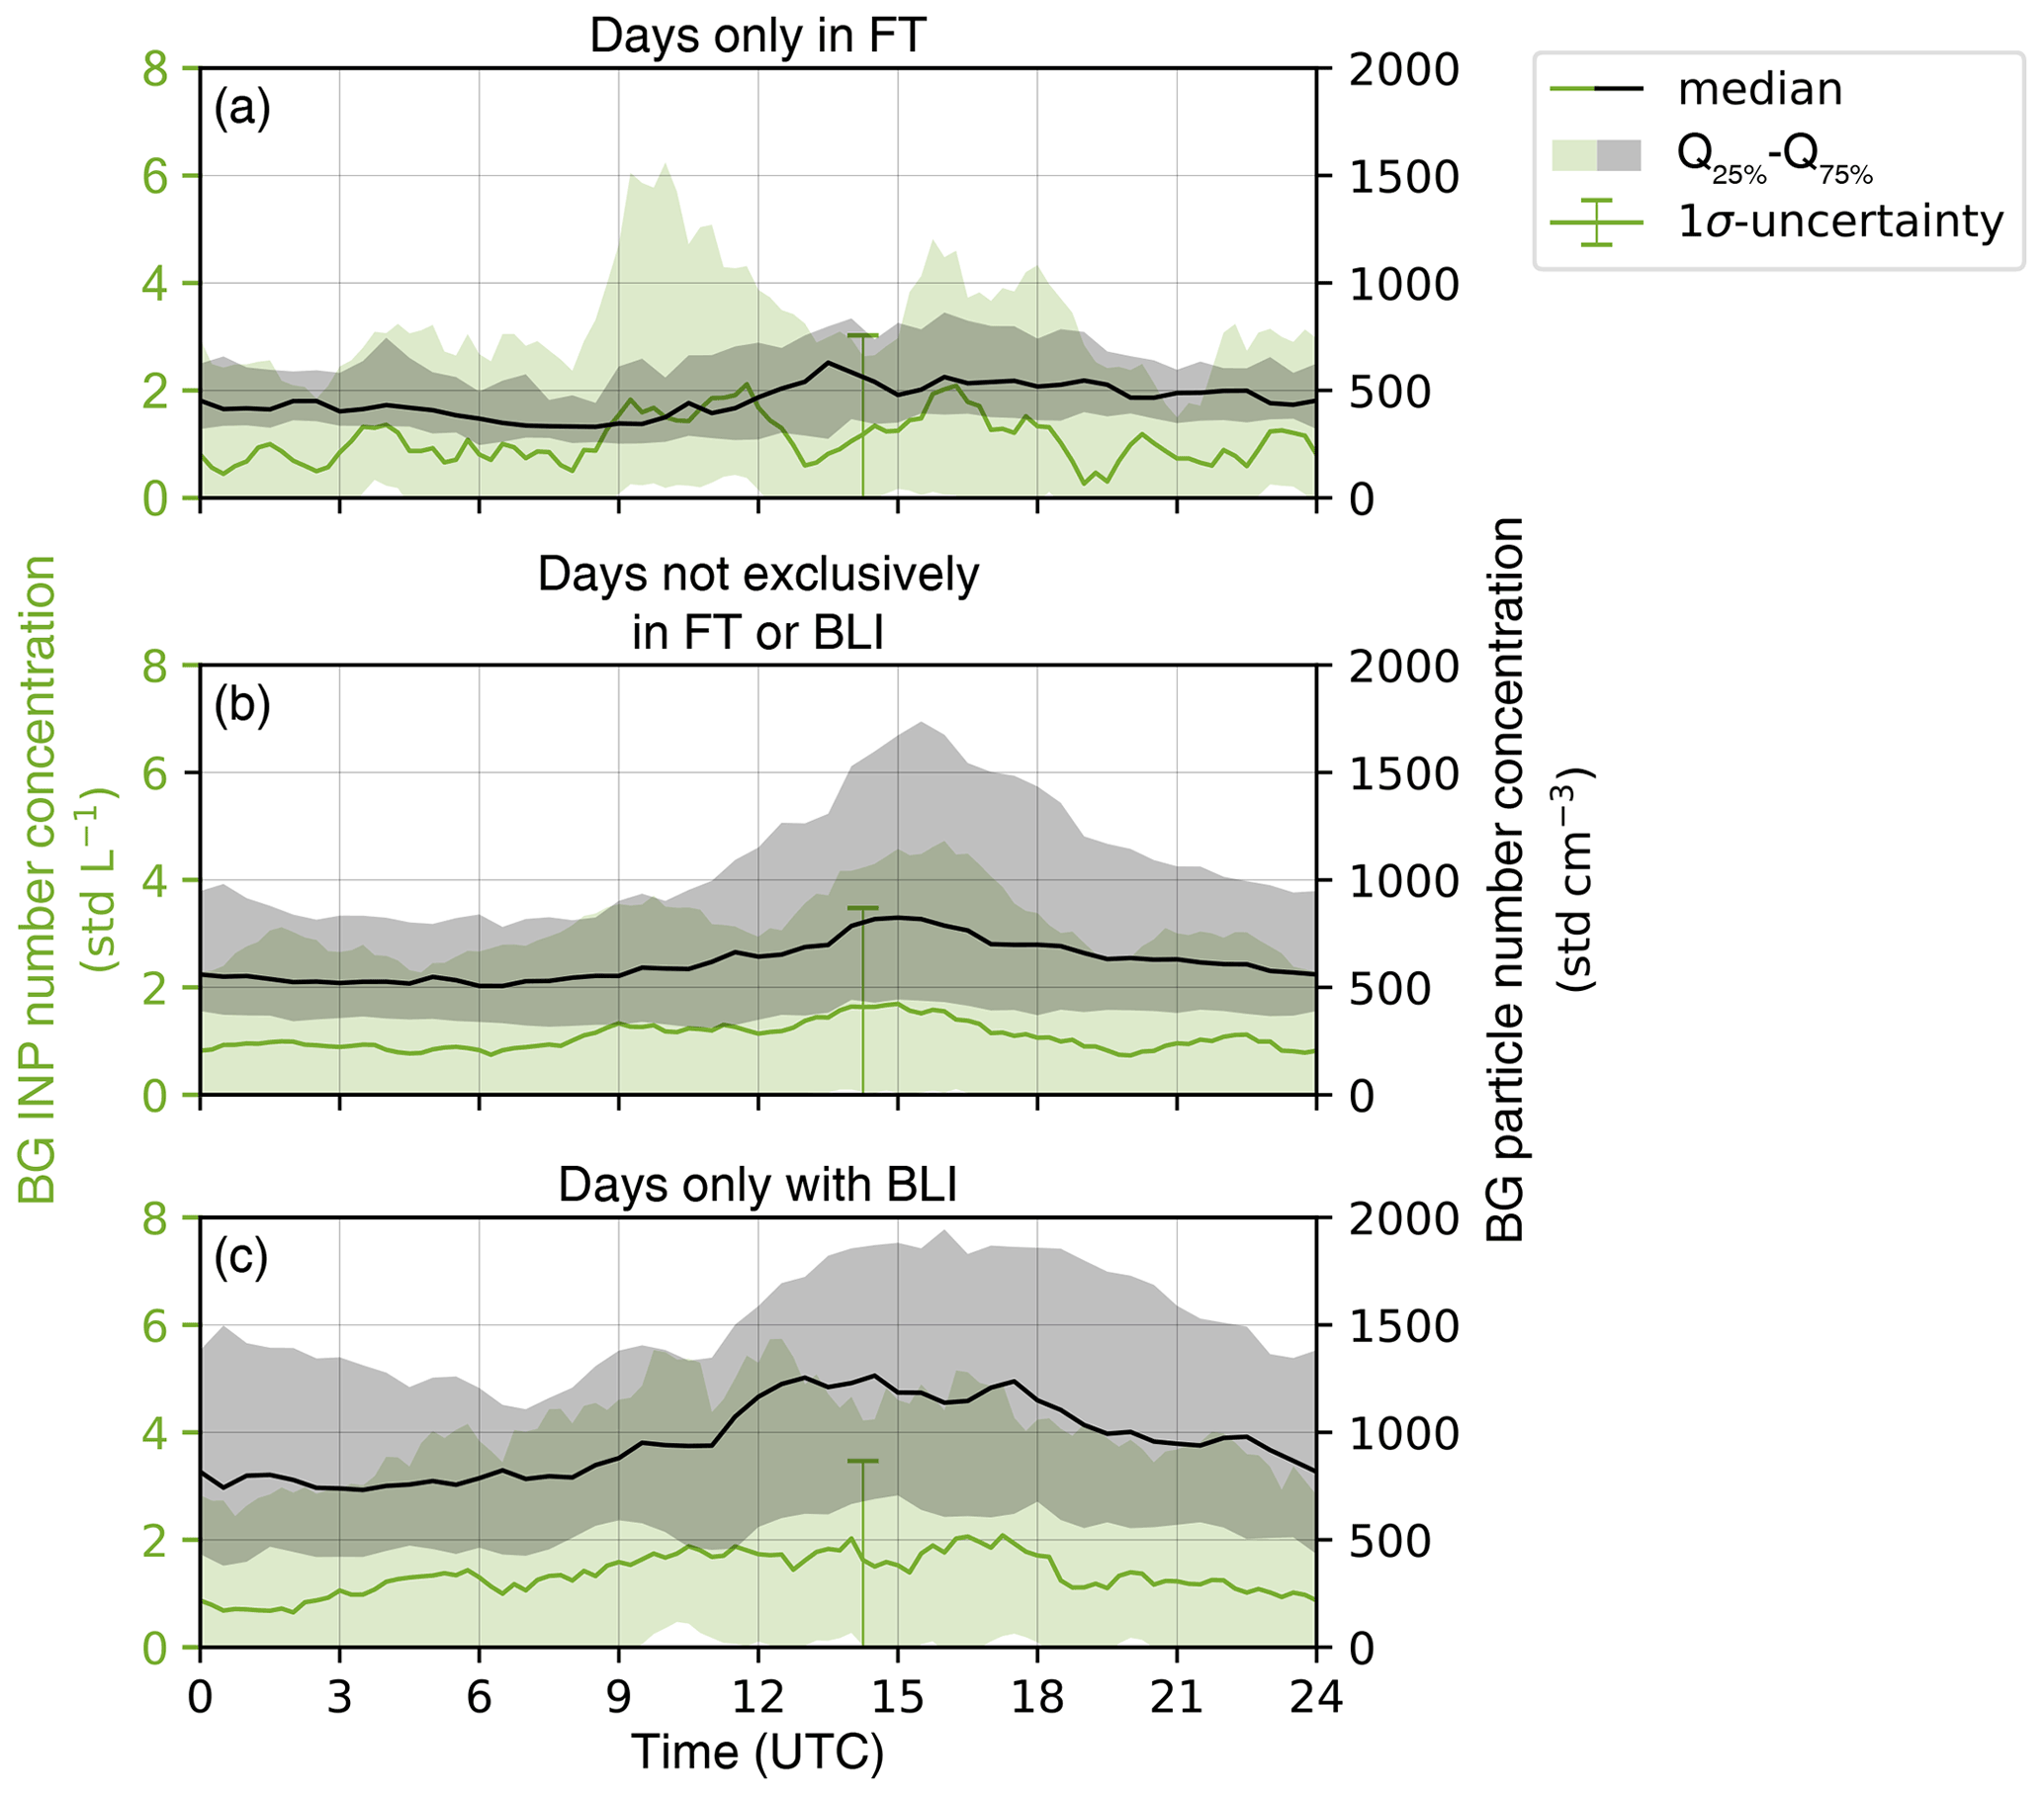
Figure 5Median and quartiles of the BG INP concentrations (green) and BG particle number concentrations (gray), phase-averaged with a cycle period of 24 h, starting at 00:00 UTC of each day between February 2020 and January 2021, for measurements from days only within the FT (a), for days not exclusively in FT or BLI (b), and for days only with BLI (c). Error bars show a σ counting uncertainty of the INP measurements.
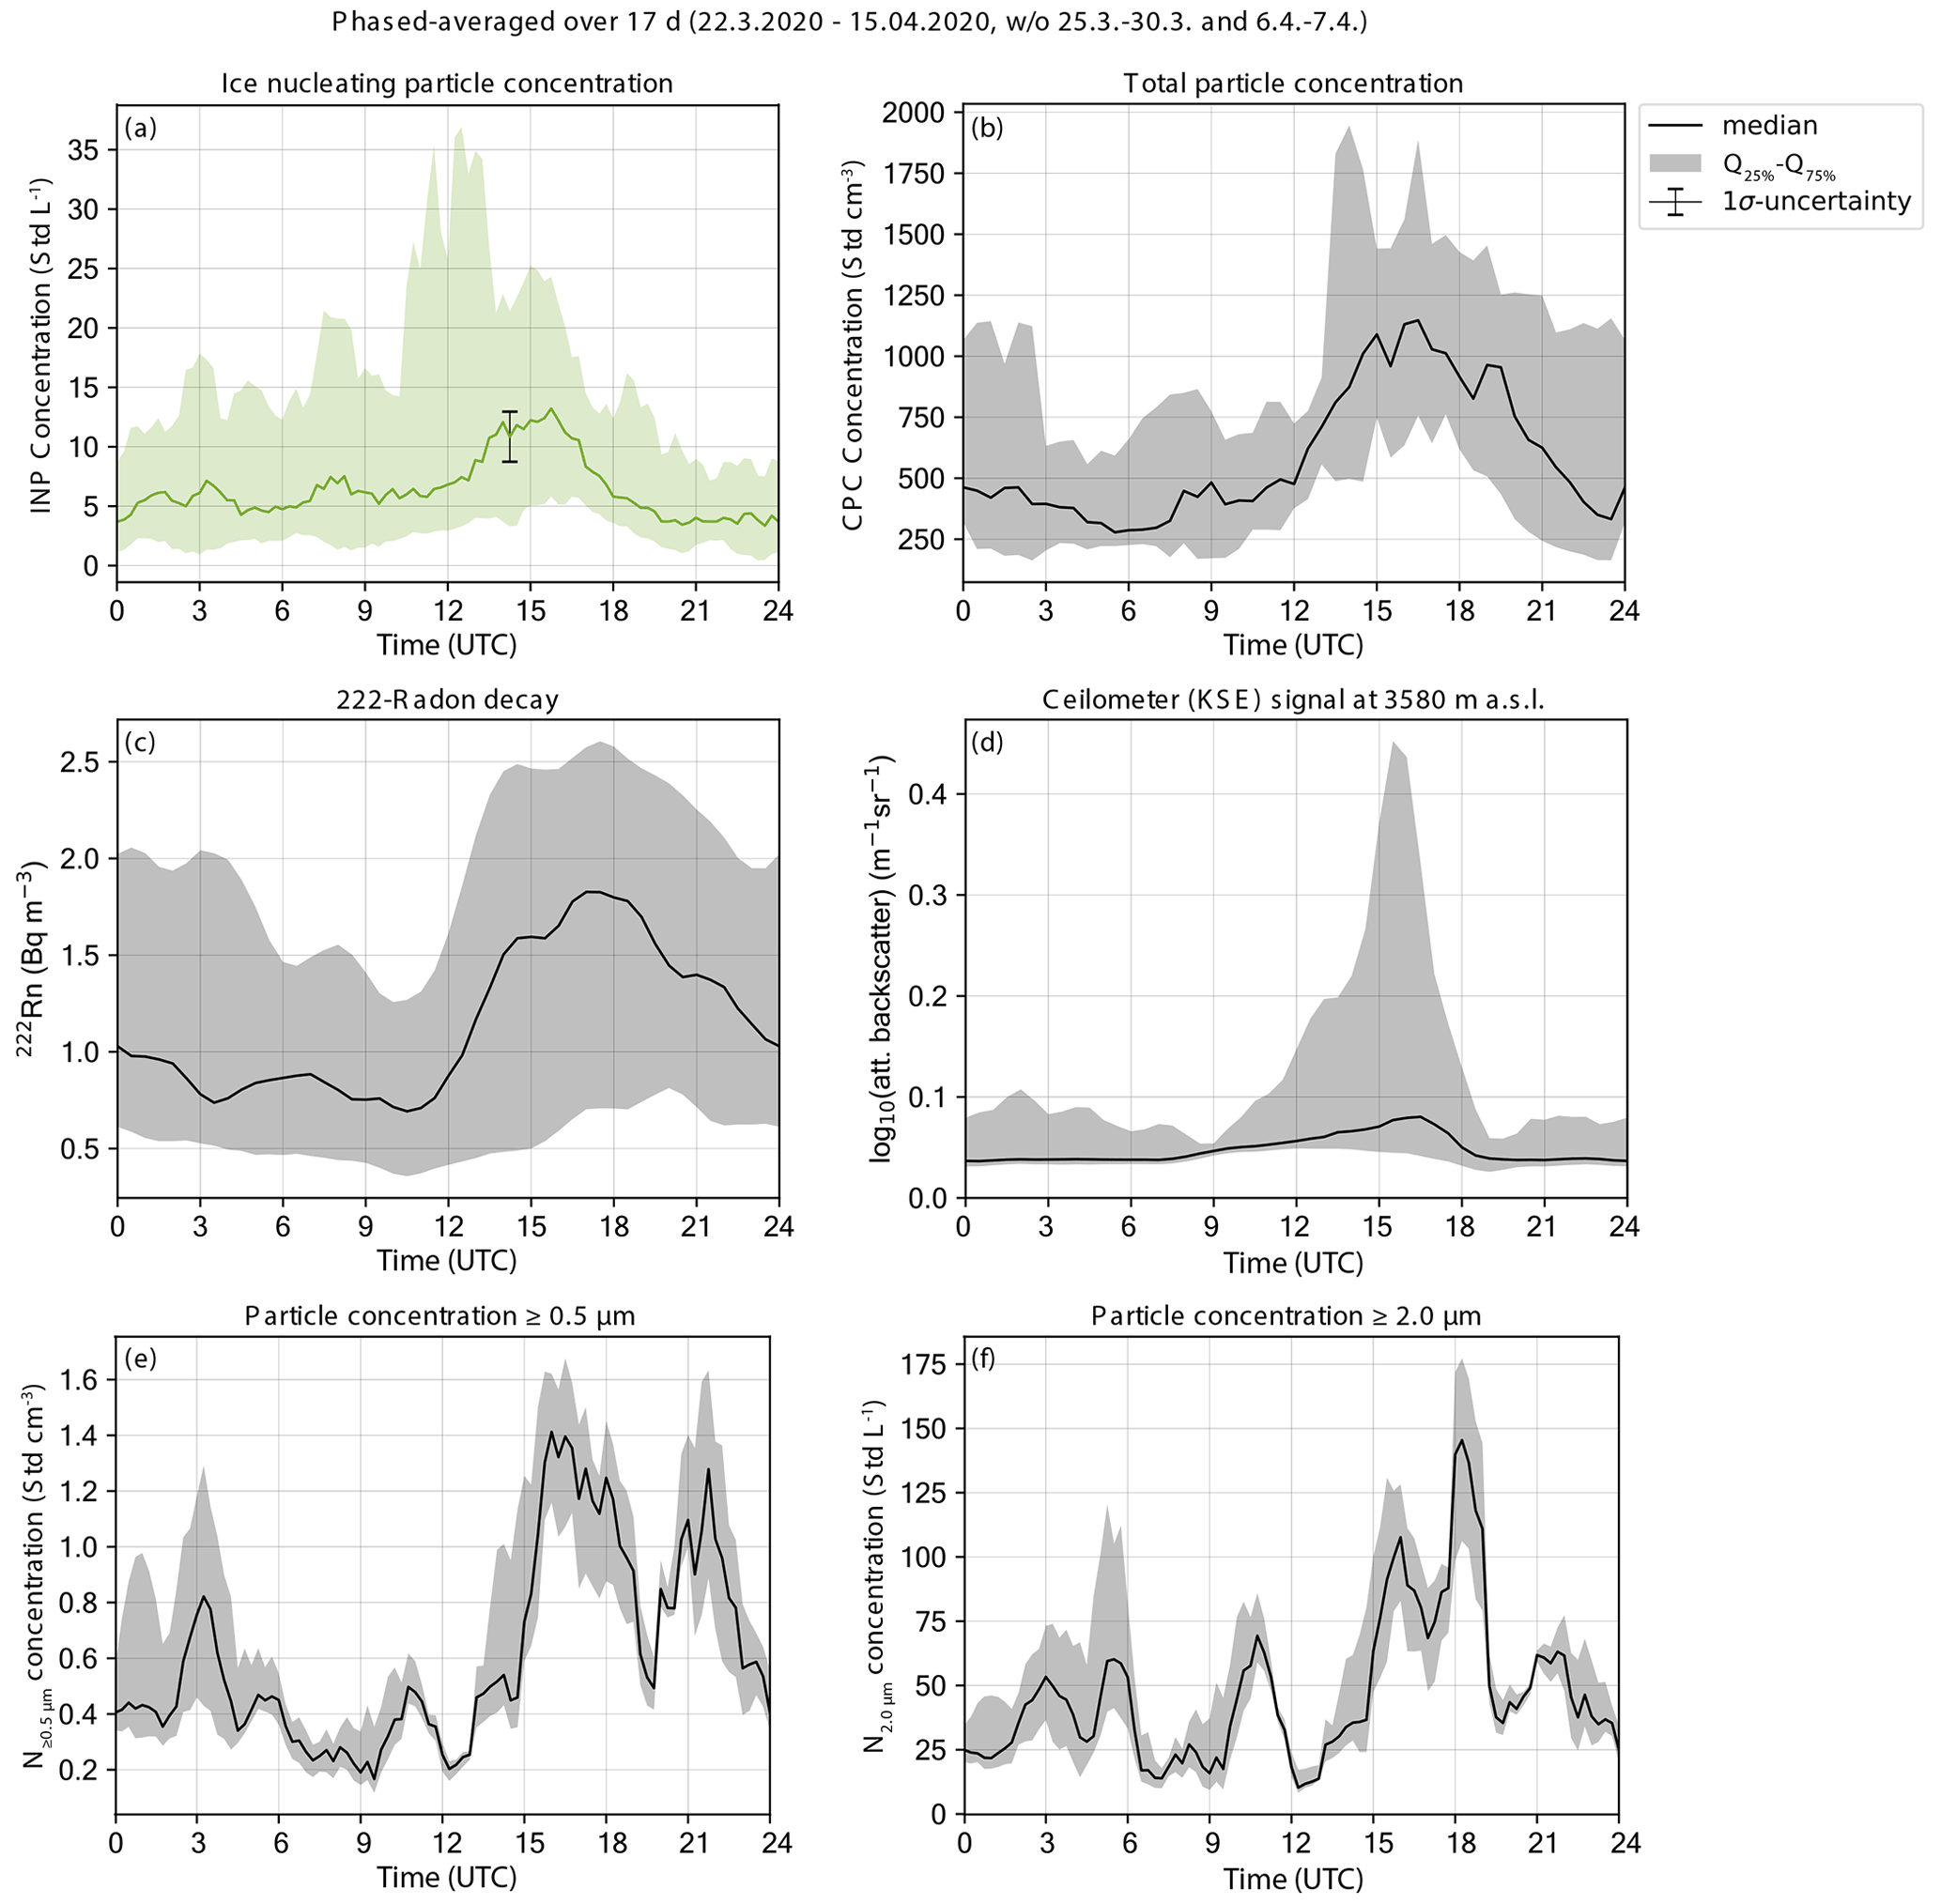
Figure 6Median and quartiles of the INP concentrations (a), total particle concentration (b), 222Rn decay rates (c), attenuated backscatter signal at 3580 m a.s.l. of the ceilometer at the Kleine Scheidegg (KSE, d), particle concentration with a diameter larger than 0.5 µm (e), and particle concentration with a diameter larger than 2.0 µm (f). All data are phase-averaged with a cycle period of 24 h, starting at 00:00 UTC of each day between 22 March and 15 April, without the two SDEs (25–30 March and 6–7 April). All measurements except for the ceilometer are performed at JFJ.
Figure 6 illustrates a case study of the diurnal cycle during a convective period between 22 March–15 April, excluding SDE periods. On 22 March, an anticyclone with its center over Sweden extended its influence to central Europe with prolonged fair weather. Between 25 and 30 March, a SDE was recorded at JFJ. On March 30, an occluded front passed the Alps from the northwest within 24 h, followed by an increase in surface pressure. An anticyclone moved across Europe and shielded the Alps until 16 April from further frontal passages; however, on 6 and 7 April, a second weak SDE was recorded at JFJ. For the period between 22 March–15 April, the INP concentration shows a diurnal cycle (Fig. 6a), with a median INP concentration between 4 and 5 std L−1 throughout the night and peaking at 16:00 UTC up to 14 std L−1. The Q75 % concentrations peak earlier in the day, at noon with 35 std L−1 (Fig. 6a, black shaded region). Compared to the total particle concentration (Fig. 6b), the median diurnal INP cycle is again less pronounced and declines sooner after peaking. 222Rn concentrations (Fig. 6c), a tracer for boundary layer intrusions, resemble the diurnal cycle in total particle concentrations well and decline later after peaking compared to the median INP concentrations. In addition, both total particle concentrations and 222Rn concentrations decline steadily until the morning, while the INP concentrations remain fairly constant throughout the night. The ceilometer at Kleine Scheidegg reports an increased attenuated backscatter signal (Fig. 6d) in the afternoon for the same altitude as JFJ (3580 m a.s.l.), indicating the rise of the PBL height and the formation of isolated convective clouds (see Fig. 6d). The signal drops quickly after peaking at 16:00 UTC. Thus, it more resembles the trend seen in the INP concentrations than the one of the total particle concentrations or 222Rn concentrations. Concentrations of particles with a diameter larger than 0.5 and 2.0 µm (N0.5 µm and N2.0 µm; Fig. 6e and f, respectively) are often used as a predictor of INP concentrations, yet they show a different diurnal cycle than the INP concentrations. N0.5 µm shows a drop of more than 50 % after a first peak at 16:00 UTC, followed by a second peak at 22:00 UTC. Also N2.0 µm shows two peaks, one at 16:00 UTC with 106 std L−1 and a second higher peak at 18:30 UTC. The large particle concentrations continue to decrease between 21:00–24:00 UTC, which does not correspond to the nighttime trend seen in the INP concentrations. The large fluctuations in N0.5 µm and N2.0 µm are unexpected, but the quartiles indicate the signals to be robust, and data are available without any gaps for the full period investigated. Overall, this strengthens the suggestion that BG INP concentrations follow the convective diurnal cycle at JFJ, hence implying BLI to be a relevant source of INPs at JFJ during non-SDE periods. The influence of convectively lifted INPs to a mountaintop site has also been reported for the Swiss Alps Davos region where the authors show INPs transported along the course of the day evolved to increase to the INP concentrations measured at a nearby high valley site (Wieder et al., 2022). The observations suggest that the high valley site could act as a source of INPs for the mountaintop site during favorable meteorological conditions, similar to our observations in this work, where favorable BLI led to a diurnal cycle.
Continuous, sub-hourly measurements of the ambient INP concentration enable the statistical study of the behavior of INPs during repeating meteorological events. Such long-term measurements were absent so far. In this work, continuous online INP measurements at T = 243.15 K and Sw = 1.04 at JFJ between 7 February 2020 and 31 January 2021 were analyzed with regard to their seasonality and diurnal cycle. We found a seasonal cycle, highest in spring with a median of 3.1 INP std L−1, followed by summer (median: 1.6 INP std L−1), and lowest in fall and winter (median: 0.5 std L−1 and 0.7 INP std L−1, respectively), all in absence of SDEs. This is consistent with the seasonality observed in other studies at the same site (Conen et al., 2015; Lacher et al., 2018) and at different sites (Wex et al., 2019; Tobo et al., 2020; Schneider et al., 2021). Here, INP concentrations show a larger seasonal dependency than the total particle concentrations. We hypothesize this to be an effect of the different seasonality of the partitioning types of particles, e.g., mineral dust for INPs at 243 K vs. biological and anthropogenic particles for the total aerosol concentration. The seasonality in INP concentrations is therefore not surprising because potent INPs such as mineral dust are seasonally transported to JFJ. In addition, the INP concentrations did not always follow the changes observed in aerosol concentrations, suggesting in some cases, particularly in remote environments, aerosol-size-dependent number concentrations may not serve as effective variables for predicting INP concentrations (e.g., Li et al., 2022, in review). A positive correlation between ambient temperature and the INP concentrations was nonexistent, in contrast to earlier studies for INPs active at warmer temperatures. Based on our observations, it is unlikely that pollen grains are directly responsible for the observed high background INP concentrations in April, although during peak periods the contribution of subpollen particles and pollen fragments from other regions in Europe or Switzerland (such as nearby hills or valleys) cannot be ruled out up to 19.9 INP std L−1 to the overall INP population at T = 243.15 K and Sw = 1.04. In addition, we note that other sources of INPs at JFJ have been identified by chemical composition analysis of single aerosol particles including black-carbon-associated aerosol, marine, and dust (Lacher et al., 2021), with dust being by far the major contributor to INPs observed at 243 K at JFJ (Brunner et al., 2021). The seasonal quartile concentrations vary by a factor of up to 7 for identical statistical metrics, which is much smaller than the observed variation due to special events, e.g., SDEs, which can cover 3 orders of magnitudes. No diurnal INP cycle was found for days purely in the FT, indicating that sinks and sources of INPs in the FT are either far away from JFJ or do not follow a diurnal pattern. Atmospheric aging, for example, which potentially makes atmospheric particles ice-active, is either a slow (ultraviolet-) light-dependent process or happens only on a local scale. For days with a mix of FT and BLI or for days entirely with BLI, a diurnal cycle similar to the diurnal cycle in total particle concentration was found, yet was more pronounced in the case of the diurnal INP variability. This is in agreement with Wieder et al. (2022), who also found a diurnal cycle in INP concentrations at a Swiss Alpine mountaintop site, Weissfluhjoch, but not at a nearby high valley, Wolfgangpass. Limitations were faced concerning the counting uncertainty of the instrument in combination with the low ambient INP concentrations, hindering the study of INP concentrations at warmer temperatures. By using an aerosol concentrator, future measurements can be extended to warmer sampling temperatures, e.g., for INPs active at 248 K. While this study covered almost a full year, future studies over multiple years to decades can help to fill knowledge gaps in spatiotemporal variability of INPs. The investigation of the interannual variability and trends could, for example, provide some insight into whether the observed seasonality is linked to other parameters or how the anthropogenic land-use change and desertification (Ginoux et al., 2012) affect the INP number concentrations in the atmosphere.
Figure A1Timeline of the total pollen concentration at Bern and Visp (a), of the dominant species (b) and the corresponding high-resolution INP concentration at JFJ and the Q10 % of PFT of a given day (c) between 15 February and 1 May 2020. Pollen data courtesy of MeteoSwiss.
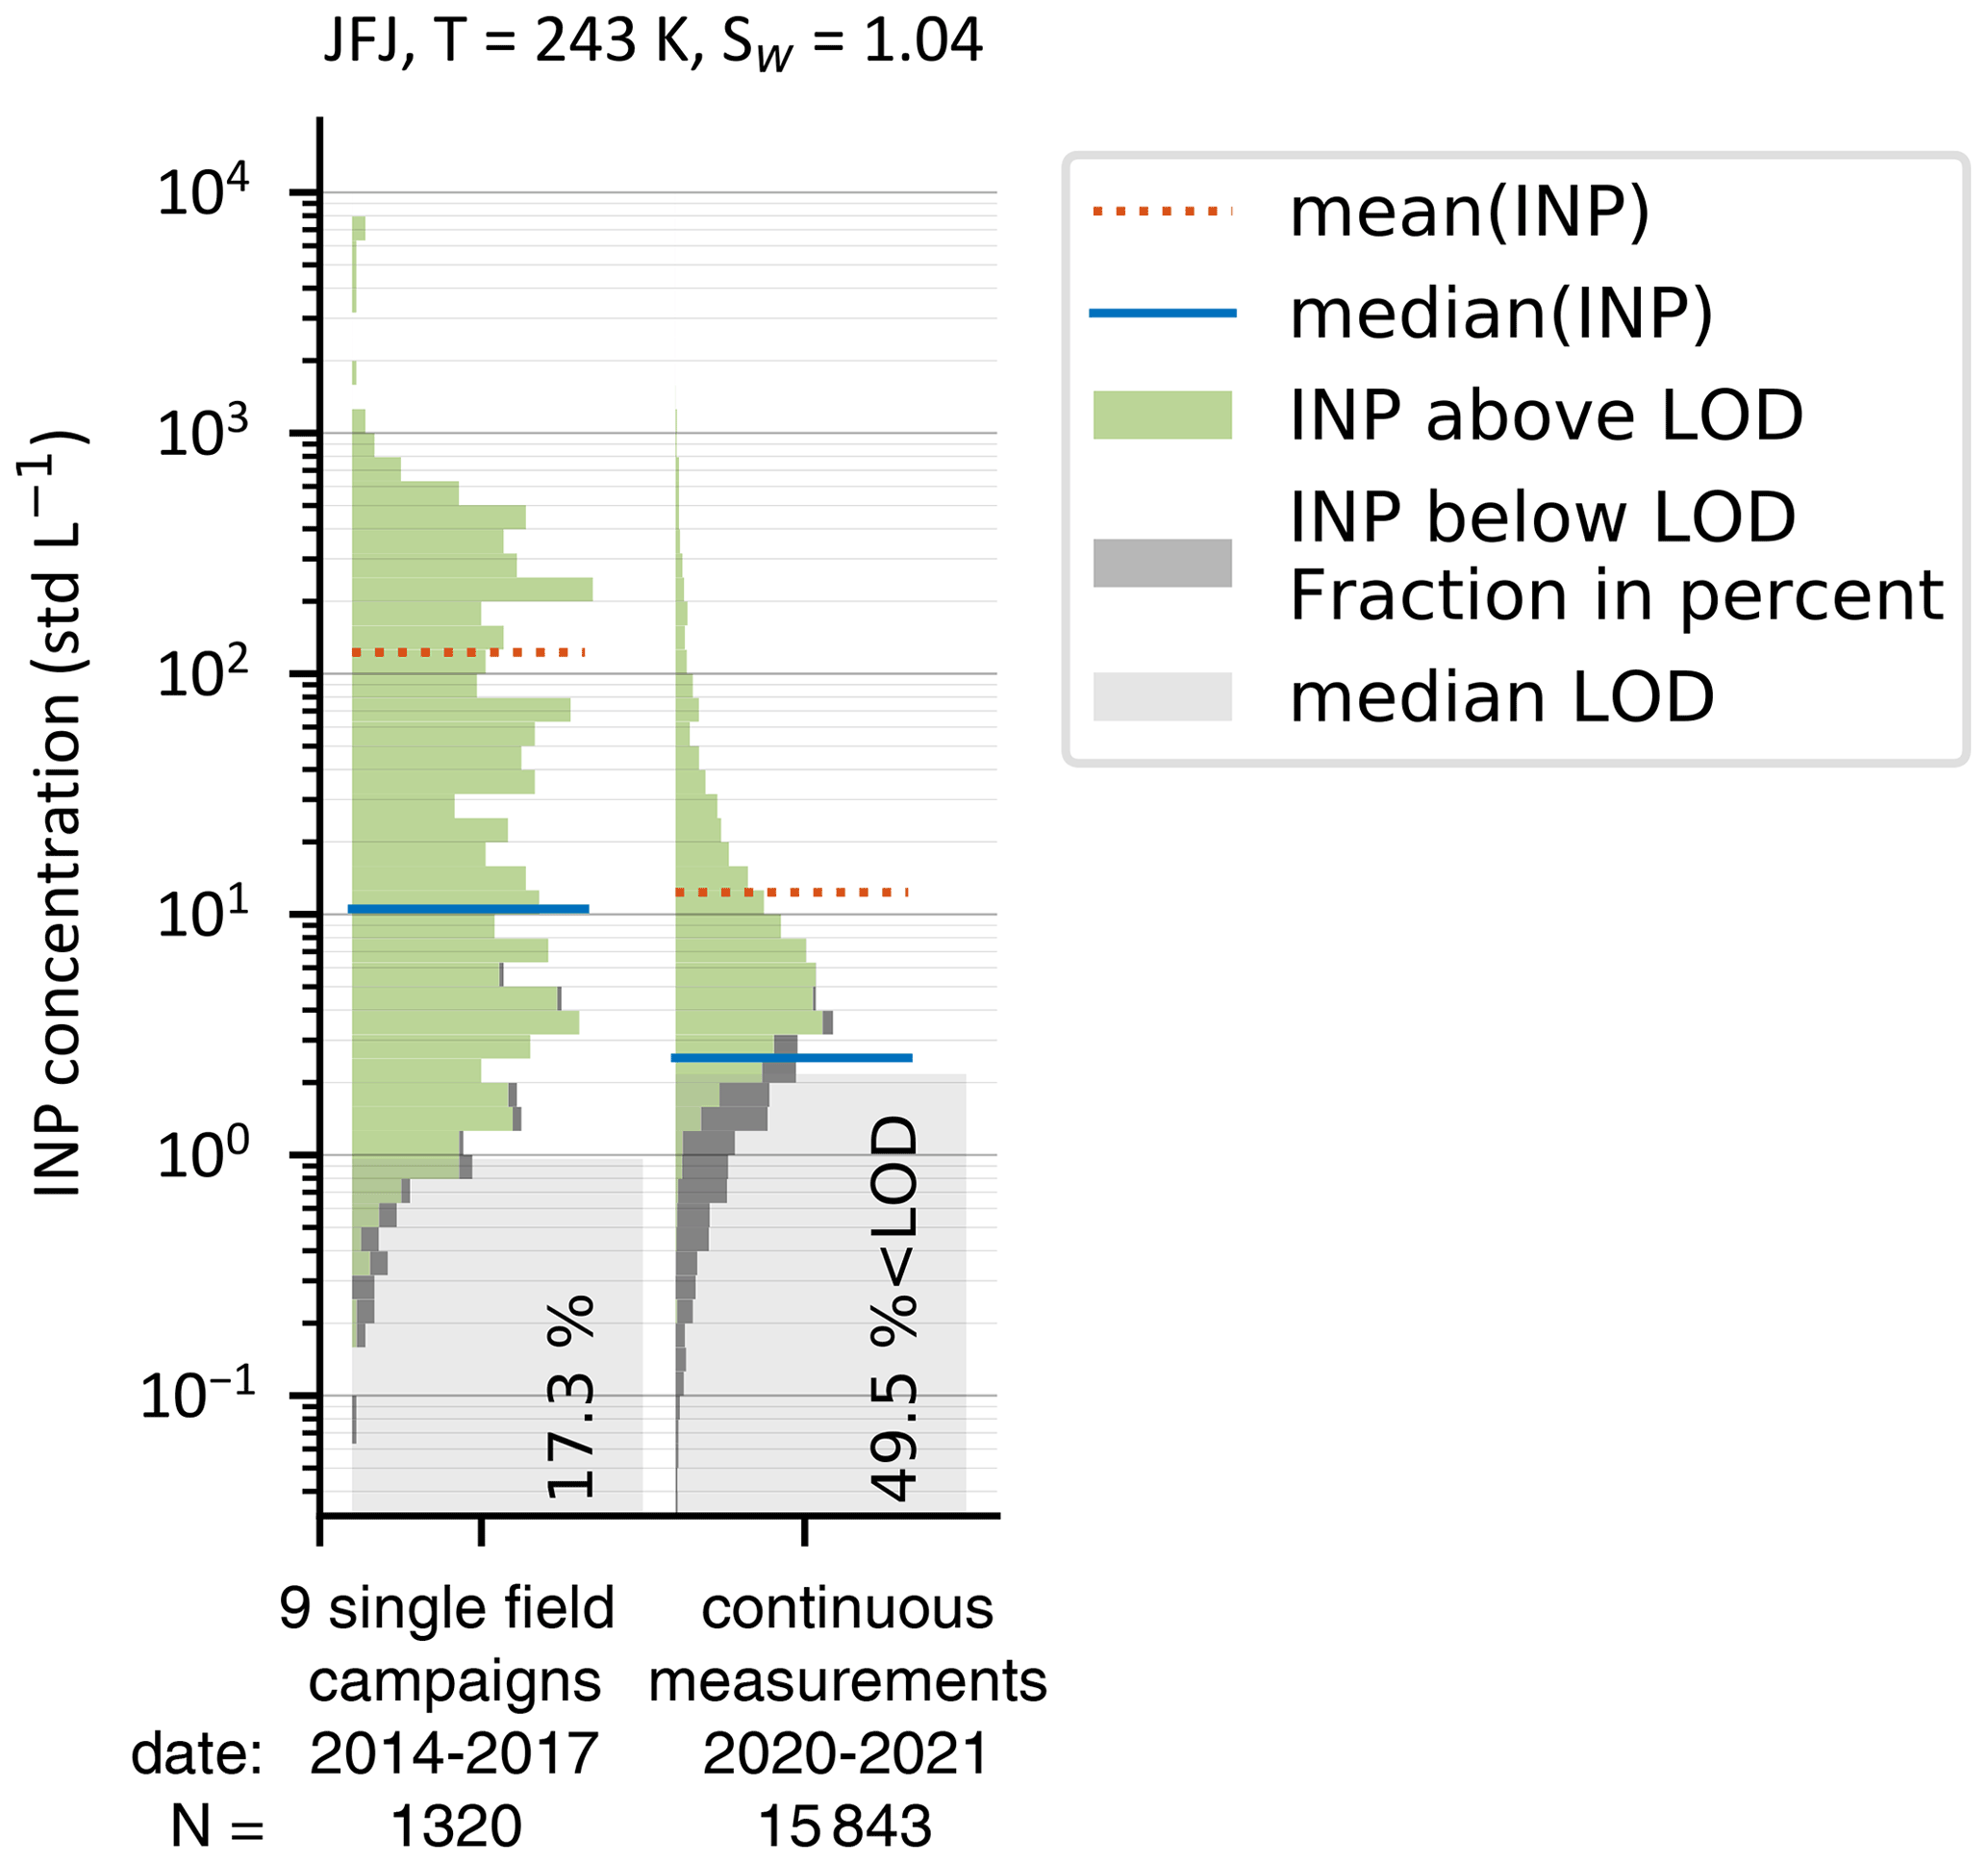
Figure A2Total INP frequency distributions from nine single field campaigns between 2014 and 2017 by Boose et al. (2016) and Lacher et al. (2018) and continuous measurements from the current work between February 2020 and January 2021, both sampled at JFJ including SDE and BG periods.
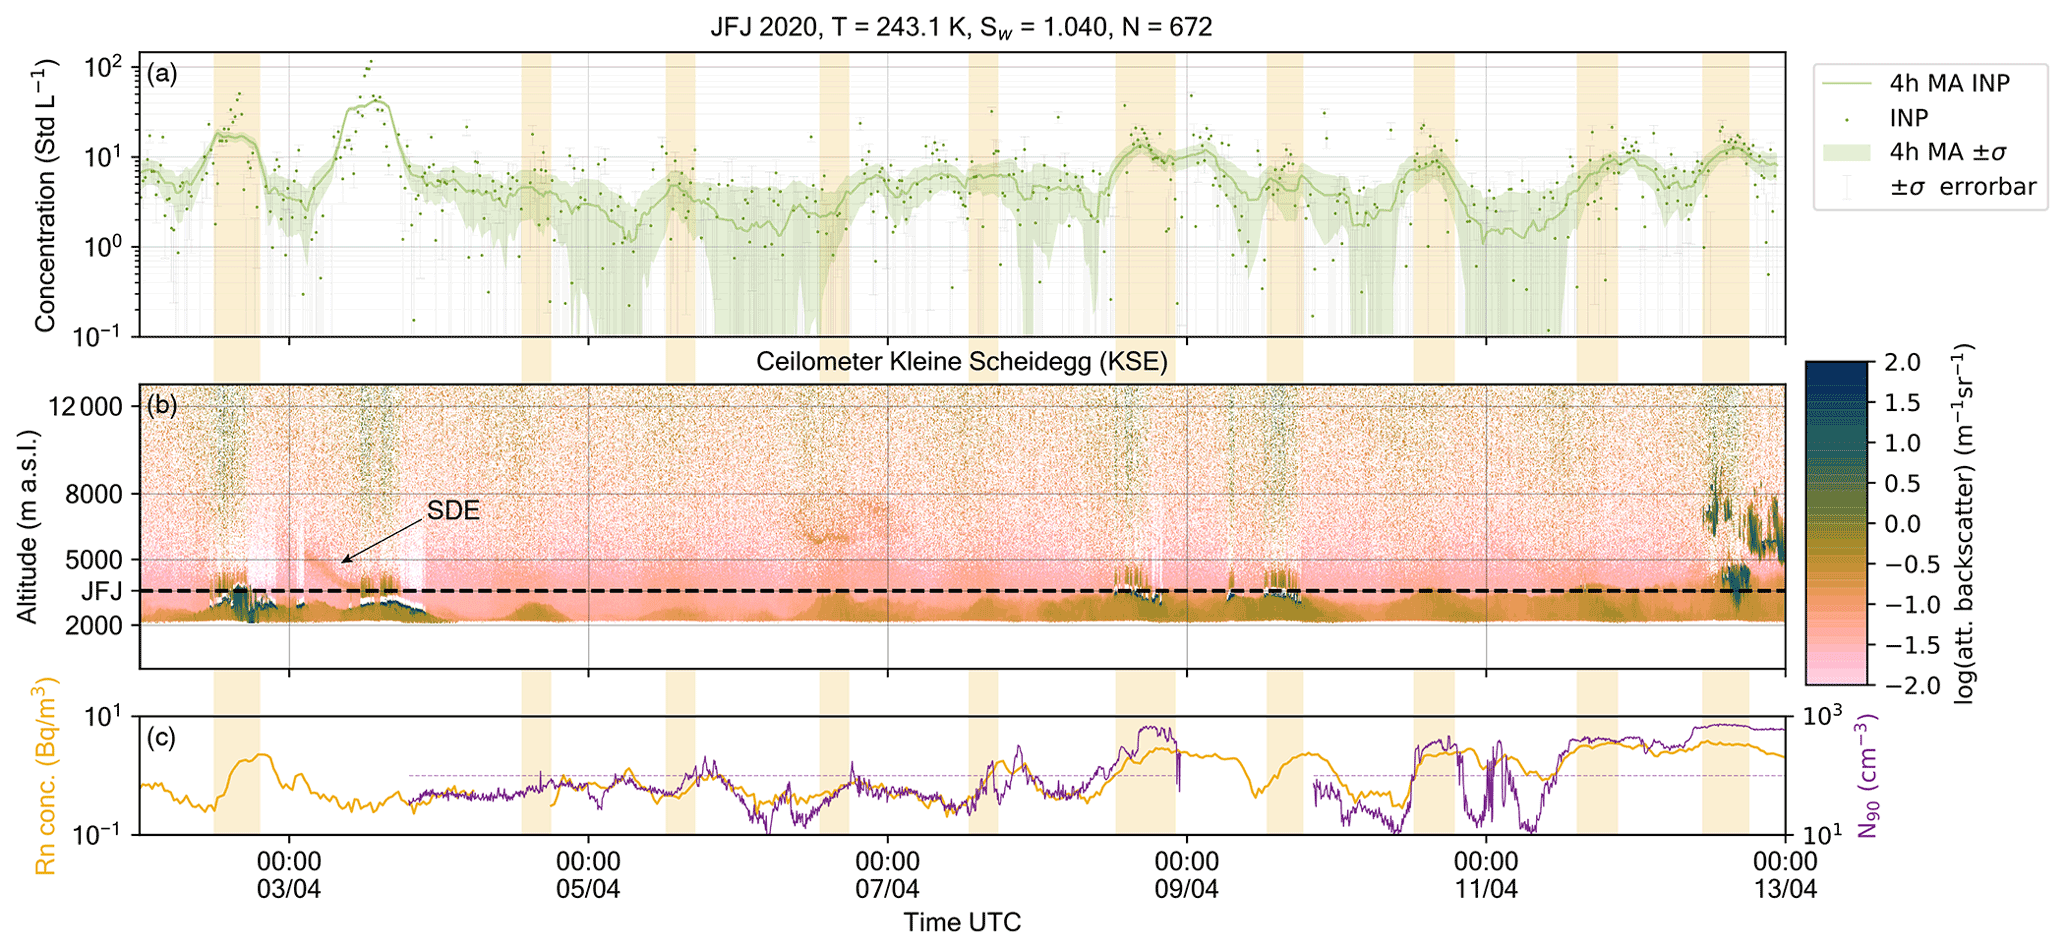
Figure A3INP concentrations at JFJ, including a 4 h moving average (MA) and a 1σ counting uncertainty (a), attenuated backscatter from the ceilometer at Kleine Scheidegg (b), and radon and N90 concentrations (c) during a convective period between 2 and 13 April 2020. Note the peaks in INP concentrations coincide with the diurnal swelling of boundary layer air masses past the altitude of JFJ, highlighted by the orange shading and indicated by the increase in backscatter from ≤ 10−0.8 to ≥ 10−0.5 m−1 sr−1.
The data presented in this publication are available at the following DOI: https://doi.org/10.3929/ethz-b-000548529 (Brunner et al., 2022).
CB wrote the manuscript with input from BTB, FC, MCC, MS, MGB, and ZAK. ZAK conceived the field study. CB conducted all INP measurements and analyzed all INP, CAMS, and ceilometer data. CB and ZAK interpreted the INP data and prepared the figures. BTB and MGB contributed data aerosol particle concentrations, N90, and absorption and scattering coefficients. MCC contributed data on the single-scattering albedo. FC contributed data on the radon concentration and developed the air mass classification (FT or BLI). MS contributed data on trace gases and PM. ZAK supervised the project and obtained funding.
The contact author has declared that neither they nor their co-authors have any competing interests.
It is important to note that neither the European Commission nor ECMWF is responsible for any use that may be made of the Copernicus information or data it contains.
Publisher’s note: Copernicus Publications remains neutral with regard to jurisdictional claims in published maps and institutional affiliations.
The authors gratefully acknowledge the Centre for Environmental Data Analysis (CEDA) for providing the ceilometer data, more specifically Maxime Hervo from MeteoSwiss, the Deutscher Wetterdienst, and Olivier Trollé from MétéoFrance. We also acknowledge MeteoSwiss for the pollen data, the Swiss contribution to ICOS (https://www.icos-ri.eu, last access: 7 June 2022) for supporting the operation of the radon detector, and the Alastair Williams group at ANSTO for the supply and support of the radon detection system, and the operation of the ceilometer at Kleine Scheidegg. Copernicus Atmosphere Monitoring Service is acknowledged for providing the CAMS data. In this work CAMS dust mass data are generated using Copernicus Atmosphere Monitoring Service information (2021). We also thank Stephan Henne from the Swiss Federal Laboratories for Materials Science and Technology (Empa) for providing FLEXPART simulated particle surface residence times. We acknowledge the International Foundation High Altitude Research Stations Jungfraujoch and Gornergrat (HFSJG), 3012 Bern, Switzerland, which made it possible for us to carry out our experiment(s) at the High Altitude Research Station at Jungfraujoch, with a special thanks to Claudine Frieden, Markus Leuenberger, and the custodians Joan and Martin Fischer, Christine and Ruedi Käser, and Daniela Bissig and Erich Furrer. We thank Ulrike Lohmann for her support and enthusiasm. We acknowledge Heike Wex, Jörg Wieder, Zane Dedekind, Larissa Lacher, Fabian Mahrt, Julie Pasquier, and Carolin Rösch for useful discussions. For technical support and fabrication, we would like to thank Michael Rösch and Marco Vecellio, whose expertise greatly helped to improve the instrumentation.
This research has been supported by the Global Atmospheric Watch, Switzerland (MeteoSwiss GAW-CH+ 2018–2021). The radon observations at Jungfraujoch and the Ceilometer observations at Kleine Scheidegg are suppoted by the Swiss National Science Foundation (SNSF) as a contribution to the pan-European Integrated Carbon Observation System (ICOS) Research Infrastructure. The continuous aerosol measurements at the Jungfraujoch site are supported by MeteoSwiss in the framework of the Swiss contributions (GAW‐CH) to the Global Atmosphere Watch program of the World Meteorological Organization (WMO) and the ACTRIS research infrastructure funded by the Swiss State Secretariat for Education, Research and Innovation (SERI) and by the European Commission under the Horizon 2020 – Research and Innovation Framework Programme, H2020-INFRADEV-2019-2, grant agreement number 871115 (ACTRIS IMP).
This paper was edited by Barbara Ervens and reviewed by two anonymous referees.
Bader, S., Collaud Coen, M., Duguay-Tetzlaff, A., Frei, C., Fukutome, S., Gehrig, R., Maillard Barras, E., Martucci, G., Romanens, G., Scherrer, S., Schlegel, T., Spirig, C., Stübi, R., Vuilleumier, L., and Zubler, E.: MeteoSchweiz 2021: Klimareport 2020, Bundesamt für Meteorologie und Klimatologie MeteoSchweiz, Zürich, 96 pp., ISSN 2296-1488, 2021. a
Bi, K., McMeeking, G. R., Ding, D. P., Levin, E. J., DeMott, P. J., Zhao, D. L., Wang, F., Liu, Q., Tian, P., Ma, X. C., Chen, Y. B., Huang, M. Y., Zhang, H. L., Gordon, T. D., and Chen, P.: Measurements of Ice Nucleating Particles in Beijing, China, J. Geophys. Res.-Atmos., 124, 8065–8075, https://doi.org/10.1029/2019JD030609, 2019. a
Boose, Y., Kanji, Z. A., Kohn, M., Sierau, B., Zipori, A., Crawford, I., Lloyd, G., Bukowiecki, N., Herrmann, E., Kupiszewski, P., Steinbacher, M., and Lohmann, U.: Ice Nucleating Particle Measurements at 241 K during Winter Months at 3580 m MSL in the Swiss Alps, J. Atmos. Sci., 73, 2203–2228, https://doi.org/10.1175/JAS-D-15-0236.1, 2016. a
Brunner, C. and Kanji, Z. A.: Continuous online monitoring of ice-nucleating particles: development of the automated Horizontal Ice Nucleation Chamber (HINC-Auto), Atmos. Meas. Tech., 14, 269–293, https://doi.org/10.5194/amt-14-269-2021, 2021. a, b, c, d
Brunner, C., Brem, B. T., Collaud Coen, M., Conen, F., Hervo, M., Henne, S., Steinbacher, M., Gysel-Beer, M., and Kanji, Z. A.: The contribution of Saharan dust to the ice-nucleating particle concentrations at the High Altitude Station Jungfraujoch (3580 m a.s.l.), Switzerland, Atmos. Chem. Phys., 21, 18029–18053, https://doi.org/10.5194/acp-21-18029-2021, 2021. a, b, c, d, e, f, g, h, i
Brunner, C., Brem, B. T., Collaud Coen, M., Conen, F., Steinbacher, M., Gysel-Beer, M., and Kanji, Z. A.: The diurnal and seasonal variability of ice nucleating particles at the High Altitude Station Jungfraujoch (3580 m a.s.l.), Switzerland, ETH Zurich [data set], https://doi.org/10.3929/ethz-b-000548529, 2022. a
Bukowiecki, N., Weingartner, E., Gysel-Beer, M., Coen, M. C., Zieger, P., Herrmann, E., Steinbacher, M., Gäggeler, H. W., and Baltensperger, U.: A review of more than 20 years of aerosol observation at the high altitude research station Jungfraujoch, Switzerland (3580 m asl), 16, 764–788, https://doi.org/10.4209/aaqr.2015.05.0305, 2016. a
Bukowiecki, N., Brem, B., Wehrle, G., Močnik, G., Affolter, S., Leuenberger, M., Collaud Coen, M., Hervo, M., Baltensperger, U., and Gysel-Beer, M.: Elucidating local pollution and site representativeness at the Jungfraujoch, Switzerland through parallel aerosol measurements at an adjacent mountain ridge, Environ. Res. Commun., 3, 021001, https://doi.org/10.1088/2515-7620/abe987, 2021. a, b
Chou, C., Stetzer, O., Weingartner, E., Jurányi, Z., Kanji, Z. A., and Lohmann, U.: Ice nuclei properties within a Saharan dust event at the Jungfraujoch in the Swiss Alps, Atmos. Chem. Phys., 11, 4725–4738, https://doi.org/10.5194/acp-11-4725-2011, 2011. a
Collaud Coen, M., Weingartner, E., Schaub, D., Hueglin, C., Corrigan, C., Henning, S., Schwikowski, M., and Baltensperger, U.: Saharan dust events at the Jungfraujoch: detection by wavelength dependence of the single scattering albedo and first climatology analysis, Atmos. Chem. Phys., 4, 2465–2480, https://doi.org/10.5194/acp-4-2465-2004, 2004. a, b
Collaud Coen, M., Weingartner, E., Furger, M., Nyeki, S., Prévôt, A. S. H., Steinbacher, M., and Baltensperger, U.: Aerosol climatology and planetary boundary influence at the Jungfraujoch analyzed by synoptic weather types, Atmos. Chem. Phys., 11, 5931–5944, https://doi.org/10.5194/acp-11-5931-2011, 2011. a
Conen, F., Rodríguez, S., Hüglin, C., Henne, S., Herrmann, E., Bukowiecki, N., and Alewell, C.: Atmospheric ice nuclei at the high-altitude observatory Jungfraujoch, Switzerland, Tellus B, 67, 25014, https://doi.org/10.3402/tellusb.v67.25014, 2015. a, b, c, d, e
Cziczo, D. J., Ladino, L. A., Boose, Y., Kanji, Z. A., Kupiszewski, P., Lance, S., Mertes, S., and Wex, H.: Measurements of Ice Nucleating Particles and Ice Residuals, Meteor. Mon., 58, 8.1–8.13, https://doi.org/10.1175/AMSMONOGRAPHS-D-16-0008.1, 2017. a
DeMott, P. J., Prenni, A. J., Liu, X., Kreidenweis, S. M., Petters, M. D., Twohy, C. H., Richardson, M. S., Eidhammer, T., and Rogers, D. C.: Predicting global atmospheric ice nuclei distributions and their impacts on climate, P. Natl. Acade. Sci. USA, 107, 11217–11222, https://doi.org/10.1073/pnas.0910818107, 2010. a
Diehl, K., Quick, C., Matthias-Maser, S., Mitra, S. K., and Jaenicke, R.: The ice nucleating ability of pollen Part I: Laboratory studies in deposition and condensation freezing modes, Atmos. Res., 58, 75–87, https://doi.org/10.1016/S0169-8095(01)00091-6, 2001. a
Dreischmeier, K., Budke, C., Wiehemeier, L., Kottke, T., and Koop, T.: Boreal pollen contain ice-nucleating as well as ice-binding “antifreeze” polysaccharides, Sci. Rep., 7, 41890, https://doi.org/10.1038/srep41890, 2017. a
Field, P. R., Hogan, R. J., Brown, P. R., Illingworth, A. J., Choularton, T. W., Kaye, P. H., Hirst, E., and Greenaway, R.: Simultaneous radar and aircraft observations of mixed-phase cloud at the 100 m scale, Q. J. Roy. Meteor. Soc., 130, 1877–1904, https://doi.org/10.1256/qj.03.102, 2004. a
Galán, C., Smith, M., Thibaudon, M., Frenguelli, G., Oteros, J., Gehrig, R., Berger, U., Clot, B., Brandao, R., and EAS QC Working Group: Pollen monitoring: minimum requirements and reproducibility of analysis, Aerobiologia, 30, 385–395, https://doi.org/10.1007/s10453-014-9335-5, 2014. a
Ginoux, P., Prospero, J. M., Gill, T. E., Hsu, N. C., and Zhao, M.: Global-scale attribution of anthropogenic and natural dust sources and their emission rates based on MODIS Deep Blue aerosol products, Rev. Geophys., 50, RG3005, https://doi.org/10.1029/2012RG000388, 2012. a
Griffiths, A. D., Conen, F., Weingartner, E., Zimmermann, L., Chambers, S. D., Williams, A. G., and Steinbacher, M.: Surface-to-mountaintop transport characterised by radon observations at the Jungfraujoch, Atmos. Chem. Phys., 14, 12763–12779, https://doi.org/10.5194/acp-14-12763-2014, 2014. a, b
Gute, E. and Abbatt, J. P.: Ice nucleating behavior of different tree pollen in the immersion mode, Atmos. Environ., 231, 117488, https://doi.org/10.1016/j.atmosenv.2020.117488, 2020. a, b, c
Herrmann, E., Weingartner, E., Henne, S., Vuilleumier, L., Bukowiecki, N., Steinbacher, M., Conen, F., Coen, M. C., Hammer, E., Jurányi, Z., Baltensperger, U., and Gysel-Beer, M.: Analysis of long-term aerosol size distribution data from Jungfraujoch with emphasis on free tropospheric conditions, cloud influence, and air mass transport, J. Geophys. Res., 120, 9459–9480, https://doi.org/10.1002/2015JD023660, 2015. a, b, c
Hervo, M., Poltera, Y., and Haefele, A.: An empirical method to correct for temperature-dependent variations in the overlap function of CHM15k ceilometers, Atmos. Meas. Tech., 9, 2947–2959, https://doi.org/10.5194/amt-9-2947-2016, 2016. a
Heymsfield, A. J., Schmitt, C., Chen, C. C. J., Bansemer, A., Gettelman, A., Field, P. R., and Liu, C.: Contributions of the Liquid and Ice Phases to Global Surface Precipitation: Observations and Global Climate Modeling, J. Atmos. Sci., 77, 2629–2648, https://doi.org/10.1175/JAS-D-19-0352.1, 2020. a
Hoose, C. and Möhler, O.: Heterogeneous ice nucleation on atmospheric aerosols: a review of results from laboratory experiments, Atmos. Chem. Phys., 12, 9817–9854, https://doi.org/10.5194/acp-12-9817-2012, 2012. a
Isono, K., Komabayasi, M., Takeda, T., Tanaka, T., Iwai, K., and Fujiwara, M.: Concentration and nature of ice nuclei in rim of the North Pacific Ocean, Tellus, 23, 40–59, https://doi.org/10.3402/tellusa.v23i1.10292, 1971. a
Korolev, A., Isaac, G. A., Cober, S. G., Strapp, J. W., and Hallett, J.: Microphysical characterization of mixed-phase clouds, Q. J. Roy. Meteor. Soc., 129, 39–65, https://doi.org/10.1256/qj.01.204, 2003. a
Lacher, L., DeMott, P. J., Levin, E. J. T., Suski, K. J., Boose, Y., Zipori, A., Herrmann, E., Bukowiecki, N., Steinbacher, M., Gute, E., Abbatt, J. P., Lohmann, U., and Kanji, Z. A.: Background free-tropospheric ice nucleating particle concentrations at mixed-phase cloud conditions, J. Geophys. Res.-Atmos., 123, 10506–10525, https://doi.org/10.1029/2018JD028338, 2018. a, b, c, d, e, f
Lacher, L., Clemen, H.-C., Shen, X., Mertes, S., Gysel-Beer, M., Moallemi, A., Steinbacher, M., Henne, S., Saathoff, H., Möhler, O., Höhler, K., Schiebel, T., Weber, D., Schrod, J., Schneider, J., and Kanji, Z. A.: Sources and nature of ice-nucleating particles in the free troposphere at Jungfraujoch in winter 2017, Atmos. Chem. Phys., 21, 16925–16953, https://doi.org/10.5194/acp-21-16925-2021, 2021. a
Lau, K. M. and Wu, H. T.: Warm rain processes over tropical oceans and climate implications, Geophys. Res. Lett., 30, 2290, https://doi.org/10.1029/2003GL018567, 2003. a
Li, G., Wieder, J., Pasquier, J. T., Henneberger, J., and Kanji, Z. A.: Predicting atmospheric background number concentration of ice nucleating particles in the Arctic, Atmos. Chem. Phys. Discuss. [preprint], https://doi.org/10.5194/acp-2022-21, in review, 2022. a
Lohmann, U. and Feichter, J.: Global indirect aerosol effects: a review, Atmos. Chem. Phys., 5, 715–737, https://doi.org/10.5194/acp-5-715-2005, 2005. a
Möhler, O., Adams, M., Lacher, L., Vogel, F., Nadolny, J., Ullrich, R., Boffo, C., Pfeuffer, T., Hobl, A., Weiß, M., Vepuri, H. S. K., Hiranuma, N., and Murray, B. J.: The Portable Ice Nucleation Experiment (PINE): a new online instrument for laboratory studies and automated long-term field observations of ice-nucleating particles, Atmos. Meas. Tech., 14, 1143–1166, https://doi.org/10.5194/amt-14-1143-2021, 2021. a
Mülmenstädt, J., Sourdeval, O., Delanoë, J., and Quaas, J.: Frequency of occurrence of rain from liquid-, mixed-, and ice-phase clouds derived from A-Train satellite retrievals, Geophys. Res. Lett., 42, 6502–6509, https://doi.org/10.1002/2015GL064604, 2015. a
Murray, B. J., O'Sullivan, D., Atkinson, J. D., and Webb, M. E.: Ice nucleation by particles immersed in supercooled cloud droplets, Chem. Soc. Rev., 41, 6519–6554, https://doi.org/10.1039/C2CS35200A, 2012. a
Murray, B. J., Carslaw, K. S., and Field, P. R.: Opinion: Cloud-phase climate feedback and the importance of ice-nucleating particles, Atmos. Chem. Phys., 21, 665–679, https://doi.org/10.5194/acp-21-665-2021, 2021. a
Ott, W. R.: A physical explanation of the lognormality of pollutant concentrations, J. Air Waste Manage., 40, 1378–1383, https://doi.org/10.1080/10473289.1990.10466789, 1990. a, b
Pruppacher, H. R. and Klett, J. D.: Microphysics of Clouds and Precipitation, 2nd edn., Springer Netherlands, https://doi.org/10.1007/978-0-306-48100-0, 1997. a
Pummer, B. G., Bauer, H., Bernardi, J., Bleicher, S., and Grothe, H.: Suspendable macromolecules are responsible for ice nucleation activity of birch and conifer pollen, Atmos. Chem. Phys., 12, 2541–2550, https://doi.org/10.5194/acp-12-2541-2012, 2012. a
Rosinski, J., Nagamoto, C. T., and Zhou, M. Y.: Ice-forming nuclei over the East China Sea, Atmos. Res., 36, 95–105, https://doi.org/10.1016/0169-8095(94)00029-D, 1995. a
Schneider, J., Höhler, K., Heikkilä, P., Keskinen, J., Bertozzi, B., Bogert, P., Schorr, T., Umo, N. S., Vogel, F., Brasseur, Z., Wu, Y., Hakala, S., Duplissy, J., Moisseev, D., Kulmala, M., Adams, M. P., Murray, B. J., Korhonen, K., Hao, L., Thomson, E. S., Castarède, D., Leisner, T., Petäjä, T., and Möhler, O.: The seasonal cycle of ice-nucleating particles linked to the abundance of biogenic aerosol in boreal forests, Atmos. Chem. Phys., 21, 3899–3918, https://doi.org/10.5194/acp-21-3899-2021, 2021. a, b, c, d, e
Schrod, J., Thomson, E. S., Weber, D., Kossmann, J., Pöhlker, C., Saturno, J., Ditas, F., Artaxo, P., Clouard, V., Saurel, J.-M., Ebert, M., Curtius, J., and Bingemer, H. G.: Long-term deposition and condensation ice-nucleating particle measurements from four stations across the globe, Atmos. Chem. Phys., 20, 15983–16006, https://doi.org/10.5194/acp-20-15983-2020, 2020. a, b, c, d
Stohl, A., Spichtinger-Rakowsky, N., Bonasoni, P., Feldmann, H., Memmesheimer, M., Scheel, H. E., Trickl, T., Hübener, S., Ringer, W., and Mandl, M.: The influence of stratospheric intrusions on alpine ozone concentrations, Atmos. Environ., 34, 1323–1354, https://doi.org/10.1016/S1352-2310(99)00320-9, 2000. a
Stohl, A., Forster, C., Frank, A., Seibert, P., and Wotawa, G.: Technical note: The Lagrangian particle dispersion model FLEXPART version 6.2, Atmos. Chem. Phys., 5, 2461–2474, https://doi.org/10.5194/acp-5-2461-2005, 2005. a
Tobo, Y., Uetake, J., Matsui, H., Moteki, N., Uji, Y., Iwamoto, Y., Miura, K., and Misumi, R.: Seasonal Trends of Atmospheric Ice Nucleating Particles Over Tokyo, J. Geophys. Res.-Atmos., 125, e2020JD033658, https://doi.org/10.1029/2020JD033658, 2020. a, b, c
Vali, G., DeMott, P. J., Möhler, O., and Whale, T. F.: Technical Note: A proposal for ice nucleation terminology, Atmos. Chem. Phys., 15, 10263–10270, https://doi.org/10.5194/acp-15-10263-2015, 2015. a
von Blohn, N., Mitra, S. K., Diehl, K., and Borrmann, S.: The ice nucleating ability of pollen: Part III: New laboratory studies in immersion and contact freezing modes including more pollen types, Atmos. Res., 78, 182–189, https://doi.org/10.1016/j.atmosres.2005.03.008, 2005. a
Weingartner, E., Nyeki, S., and Baltensperger, U.: Seasonal and diurnal variation of aerosol size distributions (10 < D < 750 nm) at a high-alpine site (Jungfraujoch 3580 m asl), J. Geophys. Res.-Atmos., 104, 26809–26820, https://doi.org/10.1029/1999JD900170, 1999. a
Welti, A., Müller, K., Fleming, Z. L., and Stratmann, F.: Concentration and variability of ice nuclei in the subtropical maritime boundary layer, Atmos. Chem. Phys., 18, 5307–5320, https://doi.org/10.5194/acp-18-5307-2018, 2018. a
Wex, H., Huang, L., Zhang, W., Hung, H., Traversi, R., Becagli, S., Sheesley, R. J., Moffett, C. E., Barrett, T. E., Bossi, R., Skov, H., Hünerbein, A., Lubitz, J., Löffler, M., Linke, O., Hartmann, M., Herenz, P., and Stratmann, F.: Annual variability of ice-nucleating particle concentrations at different Arctic locations, Atmos. Chem. Phys., 19, 5293–5311, https://doi.org/10.5194/acp-19-5293-2019, 2019. a, b, c
Wieder, J., Mignani, C., Schär, M., Roth, L., Sprenger, M., Henneberger, J., Lohmann, U., Brunner, C., and Kanji, Z. A.: Unveiling atmospheric transport and mixing mechanisms of ice-nucleating particles over the Alps, Atmos. Chem. Phys., 22, 3111–3130, https://doi.org/10.5194/acp-22-3111-2022, 2022. a, b, c, d