the Creative Commons Attribution 4.0 License.
the Creative Commons Attribution 4.0 License.
 | 10 Jun 2022
Evidence of haze-driven secondary production of supermicrometer aerosol nitrate and sulfate in size distribution data in South Korea
Joseph S. Schlosser
Connor Stahl
Yen Thi-Hoang Le
Ki-Joon Jeon
Peng Xian
Carolyn E. Jordan
Katherine R. Travis
James H. Crawford
Sung Yong Gong
Hye-Jung Shin
In-Ho Song
Jong-sang Youn
This study reports measurements of size-resolved aerosol composition at a site in Incheon along with other aerosol characteristics for contrast between Incheon (coastal) and Seoul (inland), South Korea, during a transboundary pollution event during the early part of an intensive sampling period between 4 and 11 March 2019. Anthropogenic emissions were dominant in the boundary layer over the study region between 4 and 6 March, with much smaller contributions from dust, smoke, and sea salt. The meteorology of this period (shallow boundary layer, enhanced humidity, and low temperature) promoted local heterogeneous formation of secondary inorganic and organic species, including high nitrate (NO relative to sulfate (SO. Seoul exhibited higher PM2.5 levels than Incheon, likely due to local emissions. The following findings point to secondary aerosol formation and growth sensitivity to water vapor during this pollution event: (i) significant concentrations of individual inorganic and organic acids in the supermicrometer range relative to their full size range (∼40 %) at higher humidity; (ii) high correlation (r=0.95) between oxalate and SO, a marker of secondary aqueous production of oxalate; (iii) increased sulfur and nitrogen oxidation ratios as a function of humidity; and (iv) matching composition apportionment (for soluble ions) between the PM1 and PM2.5−1 size fractions. The last finding confirms that PM1 aerosol composition measurements fully capture PM2.5 composition apportionment (for soluble ions) during haze events and may therefore be reliably applied in modeling studies of such events over the full PM2.5 size range. However, the differences evident in the periods following the haze event imply that under other atmospheric conditions PM1 composition measurements will not fully reflect the apportionment of PM2.5 aerosols. The study period was marked by relatively low temperatures that made NO the most abundant species detected, pointing to the sensitivity of PM2.5 levels and composition as a function of season during such transboundary events. For instance, other such events in previous studies exhibited more comparable levels between SO and NO coincident with higher temperatures than the current study. This dataset can contribute to future evaluation of model PM2.5 composition to better support regulatory efforts to control PM2.5 precursors.
- Article
(8902 KB) - Full-text XML
-
Supplement
(6887 KB) - BibTeX
- EndNote


South Korea has been the focus of extensive air quality research in recent years owing to continuing challenges as it is a growing metropolitan center with extensive sources of pollution both locally and regionally (Lee and Kim, 2007; Guttikunda et al., 2003). Although direct emission control policies have reduced primary pollutant concentrations over time (e.g., lead, carbon monoxide, sulfur dioxide), there has been less success to reduce levels of secondarily formed pollutants associated with particulate matter with diameters (D) less than or equal to 2.5 µm (PM2.5) (Kim and Lee, 2018). A common phenomenon leading to significant aerosol concentrations over large parts of South Korea is transboundary pollution events stemming from areas such as China (J. Choi et al., 2019; M. Choi et al., 2019; Peterson et al., 2019; S. Lee et al., 2019; Eck et al., 2020; Cha et al., 2019) that impact both coastal and inland parts of the peninsula. These events include dust (Heim et al., 2020; Kim et al., 2012), industrial and agricultural burning emissions (Lamb et al., 2018), sea salt (Lee et al., 2018), and wildfire plumes from Siberia (Lamb et al., 2018) that are superimposed on the local pollution sources that include biogenic emissions, urban and vehicular emissions, shipping emissions, industrial activities, and biomass burning (Park et al., 2021; Lamb et al., 2018).
While the influence of long-range transport on the Korean peninsula's air quality has been demonstrated (Lee et al., 2021; Koo et al., 2018), a question remains about the relative contributions of transboundary versus local emissions. Results from the Megacity Air Pollution Studies-Seoul (MAP-Seoul) study (May–June 2015) indicated that advected pollution from China mostly affects western coastal sites and that local emissions are significant in accounting for Seoul's radiation-absorbing aerosol particles (Lee et al., 2018). Others have pointed to the importance of domestic emissions during transboundary pollution events, especially when transport rates are below ∼250 km d−1 (S. Lee et al., 2019). Studies from the Korea–United States Air Quality (KORUS-AQ) campaign (1 May–10 June 2016) showed that during transboundary pollution episodes, Seoul (inland) exhibited significantly higher levels of PM2.5 than coastal areas (Eck et al., 2020). Nault et al. (2018) showed with in situ measurements that local emissions are the primary contributor to secondary organic aerosol (SOA) over Seoul. Furthermore, diurnal variations in aerosol optical depth (AOD) are also more significant at inland sites versus coastal sites (Lennartson et al., 2018). In their analysis of the same pollution episode as our study in early March 2019, D. Lee et al. (2019) showed that the foreign contribution to PM2.5 in Seoul was 78.8 % compared to 21.2 % from domestic sources based on the Community Multiscale Air Quality (CMAQ) model. It is important to note that such apportionments are sensitive to the modeled composition of PM2.5 as discussed in J. Choi et al. (2019) and Jordan et al. (2020). Hence, comparisons of measured and modeled PM2.5 composition are needed to validate apportionment between domestic and transported pollutants.
Local and upwind meteorology has been shown to play a major role in modulating temporal trends in PM and gas pollutant levels over South Korea (Seo et al., 2018; Cho et al., 2021; Jordan et al., 2020; Koo et al., 2020; Peterson et al., 2019; Ryu et al., 2021). Models have yet to adequately capture sulfate (SO formation in East Asian haze events (Shao et al., 2019) as they generally underestimate SO in haze, while the KORUS-AQ study also revealed that nitrate (NO formation in haze may be simultaneously overestimated, resulting in errors in aerosol liquid water content and other modeled properties (Jordan et al., 2020). Other recent studies of East Asian haze have pointed to the importance of secondary aerosol formation, primarily ammonium sulfate and nitrate salts, with additional SOA (Hu et al., 2014; Huang et al., 2014; Cheng et al., 2016; Li et al., 2018; Zhang et al., 2017). Moisture and thus aerosol-laden water have been shown to be especially important to promote the formation of these secondary species (Wu et al., 2018; Zhang et al., 2017, 2018; Wang et al., 2016). The May–June 2016 period of KORUS-AQ offered a detailed view of frontal passages transporting pollution from China to the Korean peninsula under cloudy and humid conditions that promoted haze and fog formation within a shallow stable boundary layer (Jordan et al., 2020; Peterson et al., 2019). Sulfate and NO formation was observed to be efficient owing to heterogeneous processing, with the former fueled by local and transported sulfur dioxide (SO2) and the latter from local nitrogen oxides (NOx) and enhanced nocturnal NO3 radical reactions. A positive feedback was suggested whereby increased water uptake by particles increased gas-to-particle partitioning, which in turn further increased water uptake. Furthermore, clouds reduced transmission of solar radiation to the surface, thereby reducing mixing and leading to more PM accumulation in a shallow boundary layer. Jordan et al. (2020) called for more detailed aerosol and meteorological measurements co-located with AirKorea sites (https://www.airkorea.or.kr/eng, last access: 1 October 2021) that routinely monitor PM2.5 and other basic pollutants (PM10, O3, SO2, NO2, CO) in order to advance knowledge of aerosol life cycle behavior over the Korean peninsula.
Aerosol composition provides important evidence for impacts of meteorology and atmospheric circulation on PM, which are sometimes challenging to reproduce in models. The current study exploits an Incheon dataset of size-resolved composition during a major pollution episode in March 2019 to expand on the evidence for these impacts and to help interpret observations from the larger network of ongoing Korean observations. Data were collected in both Incheon near the western coast of South Korea and at the inland city of Seoul (Fig. 1), which allows for a critical look at how PM2.5 levels compare between the sites and if Seoul has higher levels (suggesting local PM2.5 production) as described by Eck et al. (2020) and Jordan et al. (2020). This study examines the role of meteorological parameters like humidity in impacting size-resolved aerosol composition. This is especially important since past studies have mainly focused on bulk PM1, PM2.5, or PM10 (Park et al., 2018; Ryu and Min, 2021; Seo et al., 2018; Won et al., 2020). Size-resolved composition data are pertinent to improve understanding of how particles in the region impact cloud formation, visibility, and public health, all of which are sensitive to size-specific aerosol properties.
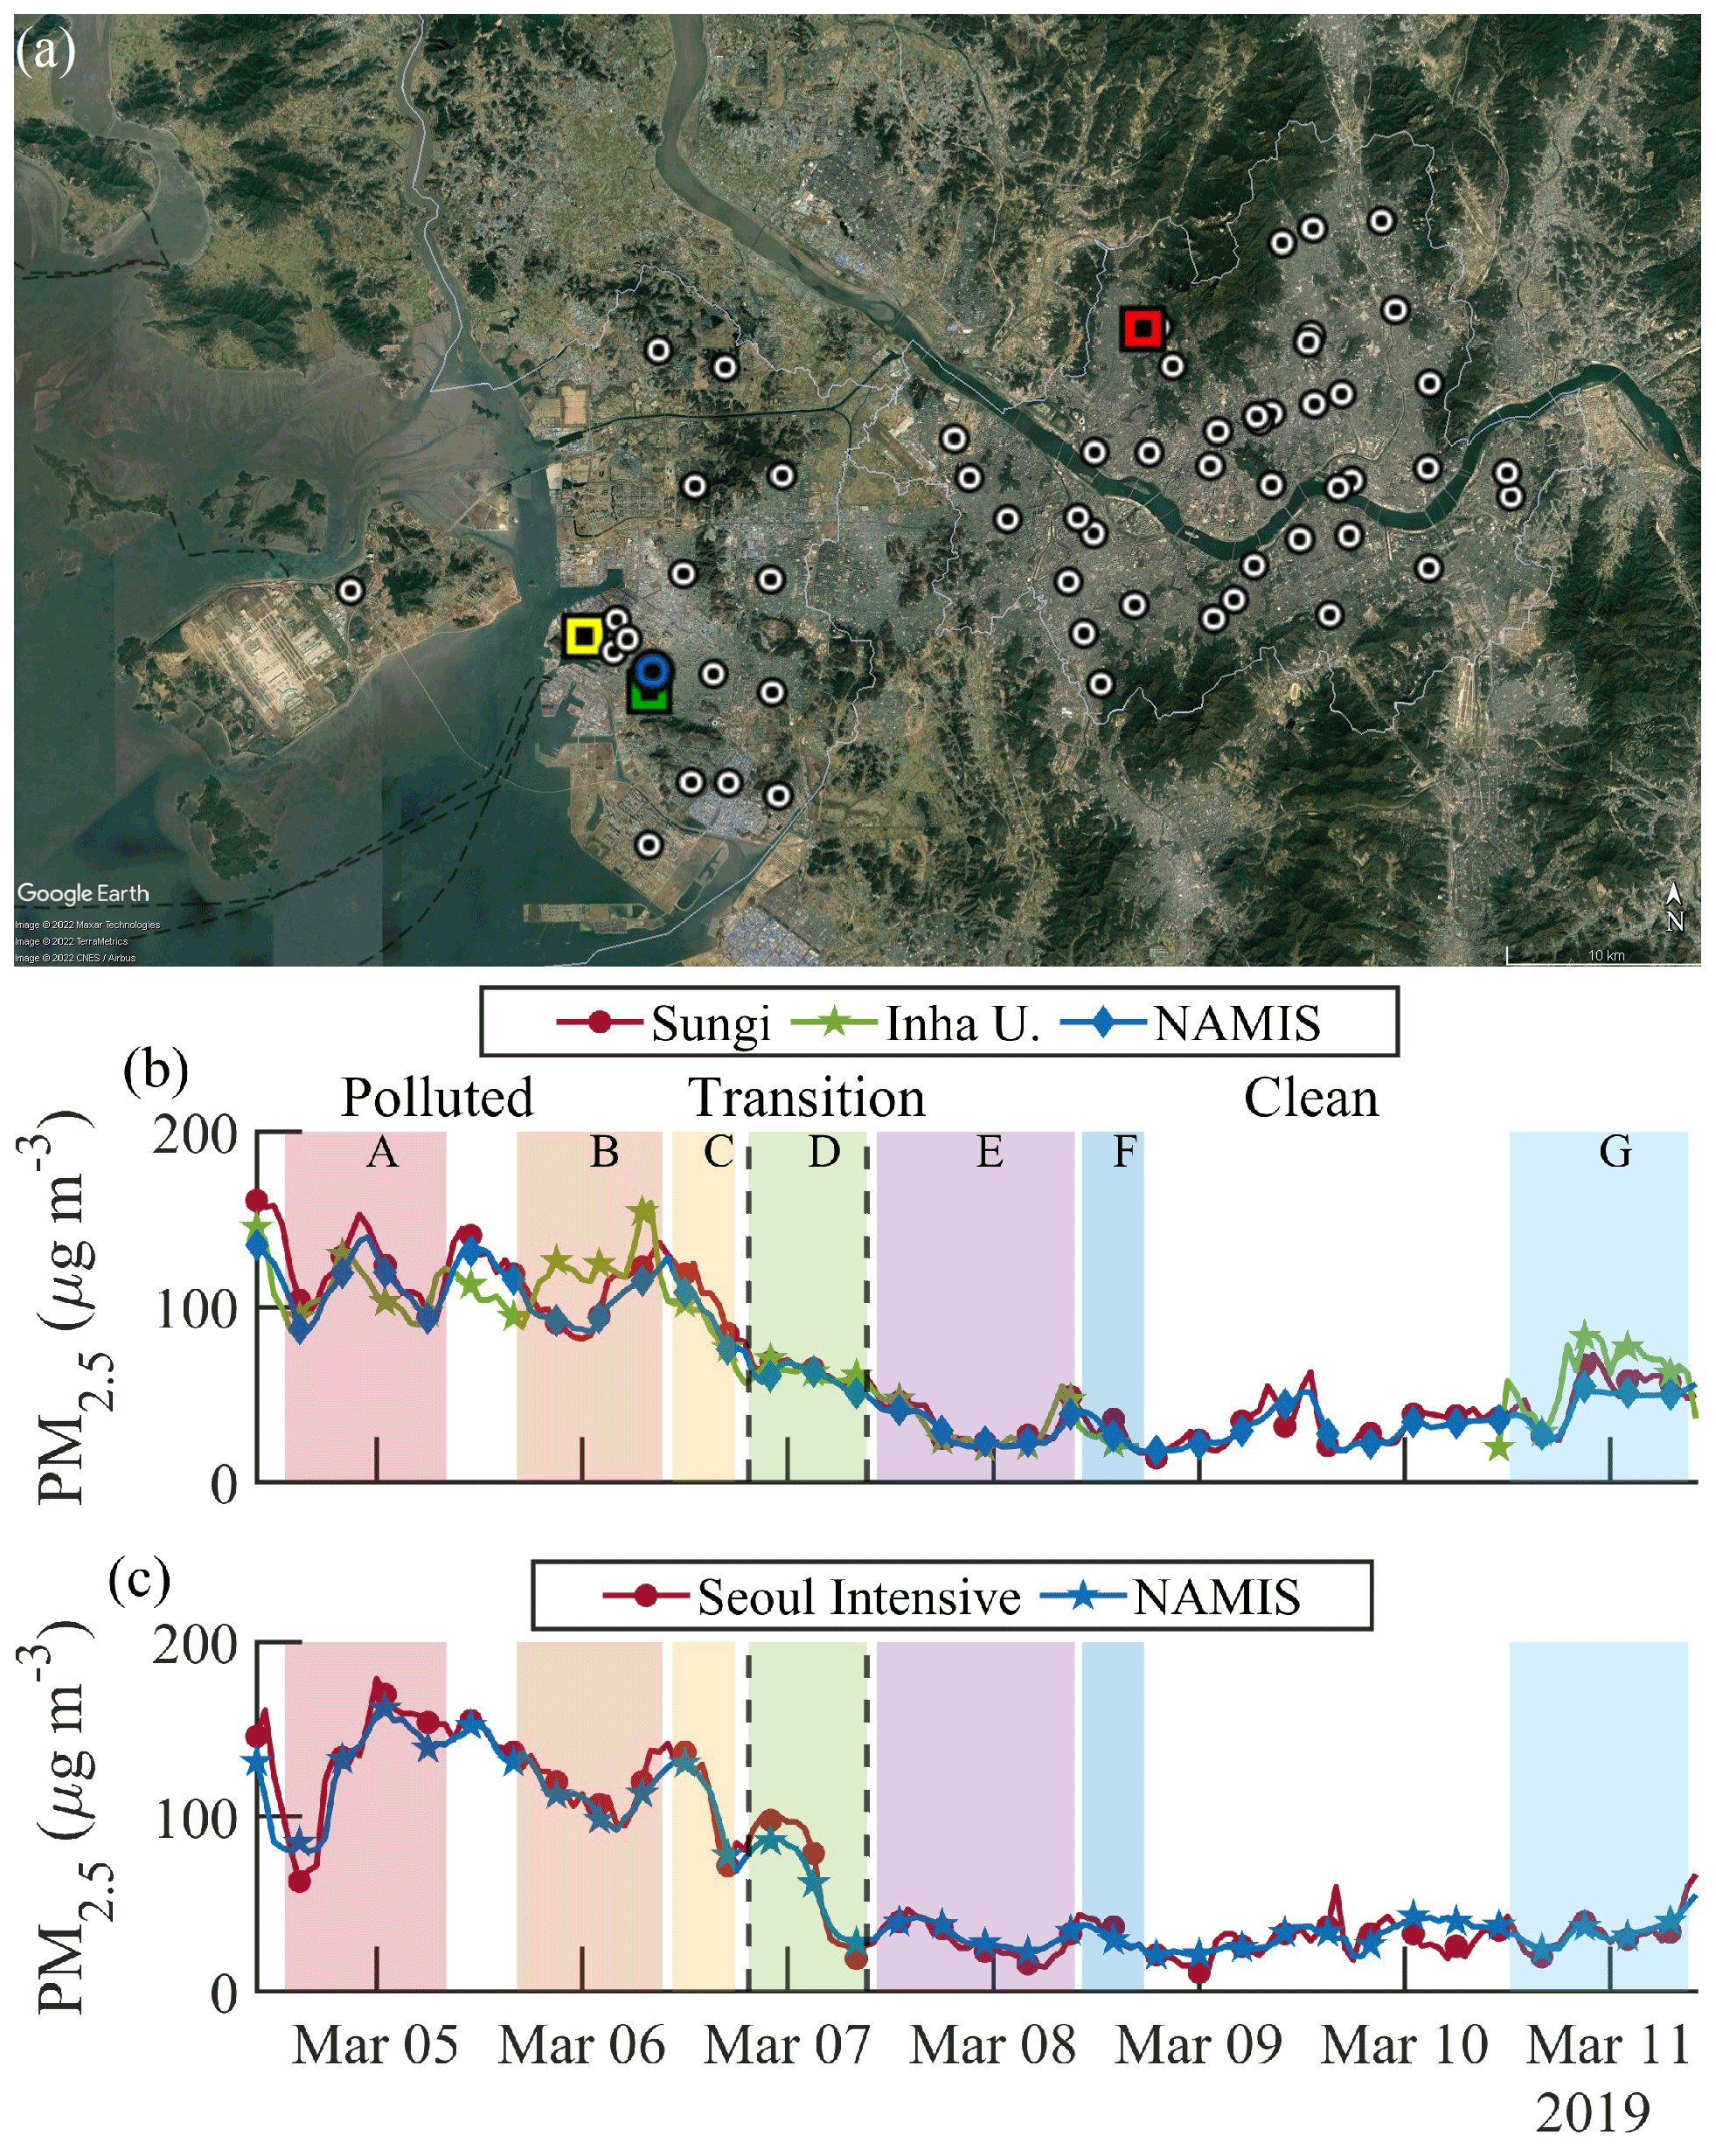
Figure 1(a) Spatial map showing the 17 and 40 National Ambient air quality Monitoring Information System (NAMIS) stations in Incheon and Seoul, respectively, along with the three main surface sites relied on for this study (yellow: Incheon meteorological site, green: Inha University, blue: Sungi – also a NAMIS station, red: Seoul Intensive Monitoring Station). PM2.5 comparison between (b) city-wide Incheon mean values and those for Sungi and Inha University and between (c) city-wide Seoul mean values and those for Seoul Intensive Monitoring Station. Coefficients of determination (R2) between the data points: (b) (Inha University) R2=0.82 and (Sungi) R2=0.98; (c) R2=0.96. Shaded regions of (b–c) are labeled with individual DLPI+ sets overlapping in time. All times are reported in Korea standard time (KST); KST is UTC+9 h.
During the period between 4 and 11 March 2019, there was a major regional haze pollution event that impacted Incheon and Seoul monitoring sites. The haze event lasted for approximately the first 3 d and then the air quality improved between 7 and 11 March (Figs. 1–2). We consider the period from 4 March 10:00–6 March 19:00 to be “polluted”, from 6 March 19:00–7 March 09:15 to be “transition”, and 7 March 09:15–11 March 10:00 to be “clean”; these time definitions are chosen based on start and stop times of size-resolved impactor measurements conducted in Incheon (Sect. 2.1.1) during periods with higher, intermediate, and lower PM concentrations (e.g., Figs. 1–2). Times in this study are in Korea standard time (KST); KST is UTC+9 h. This study relies on a variety of datasets summarized below.
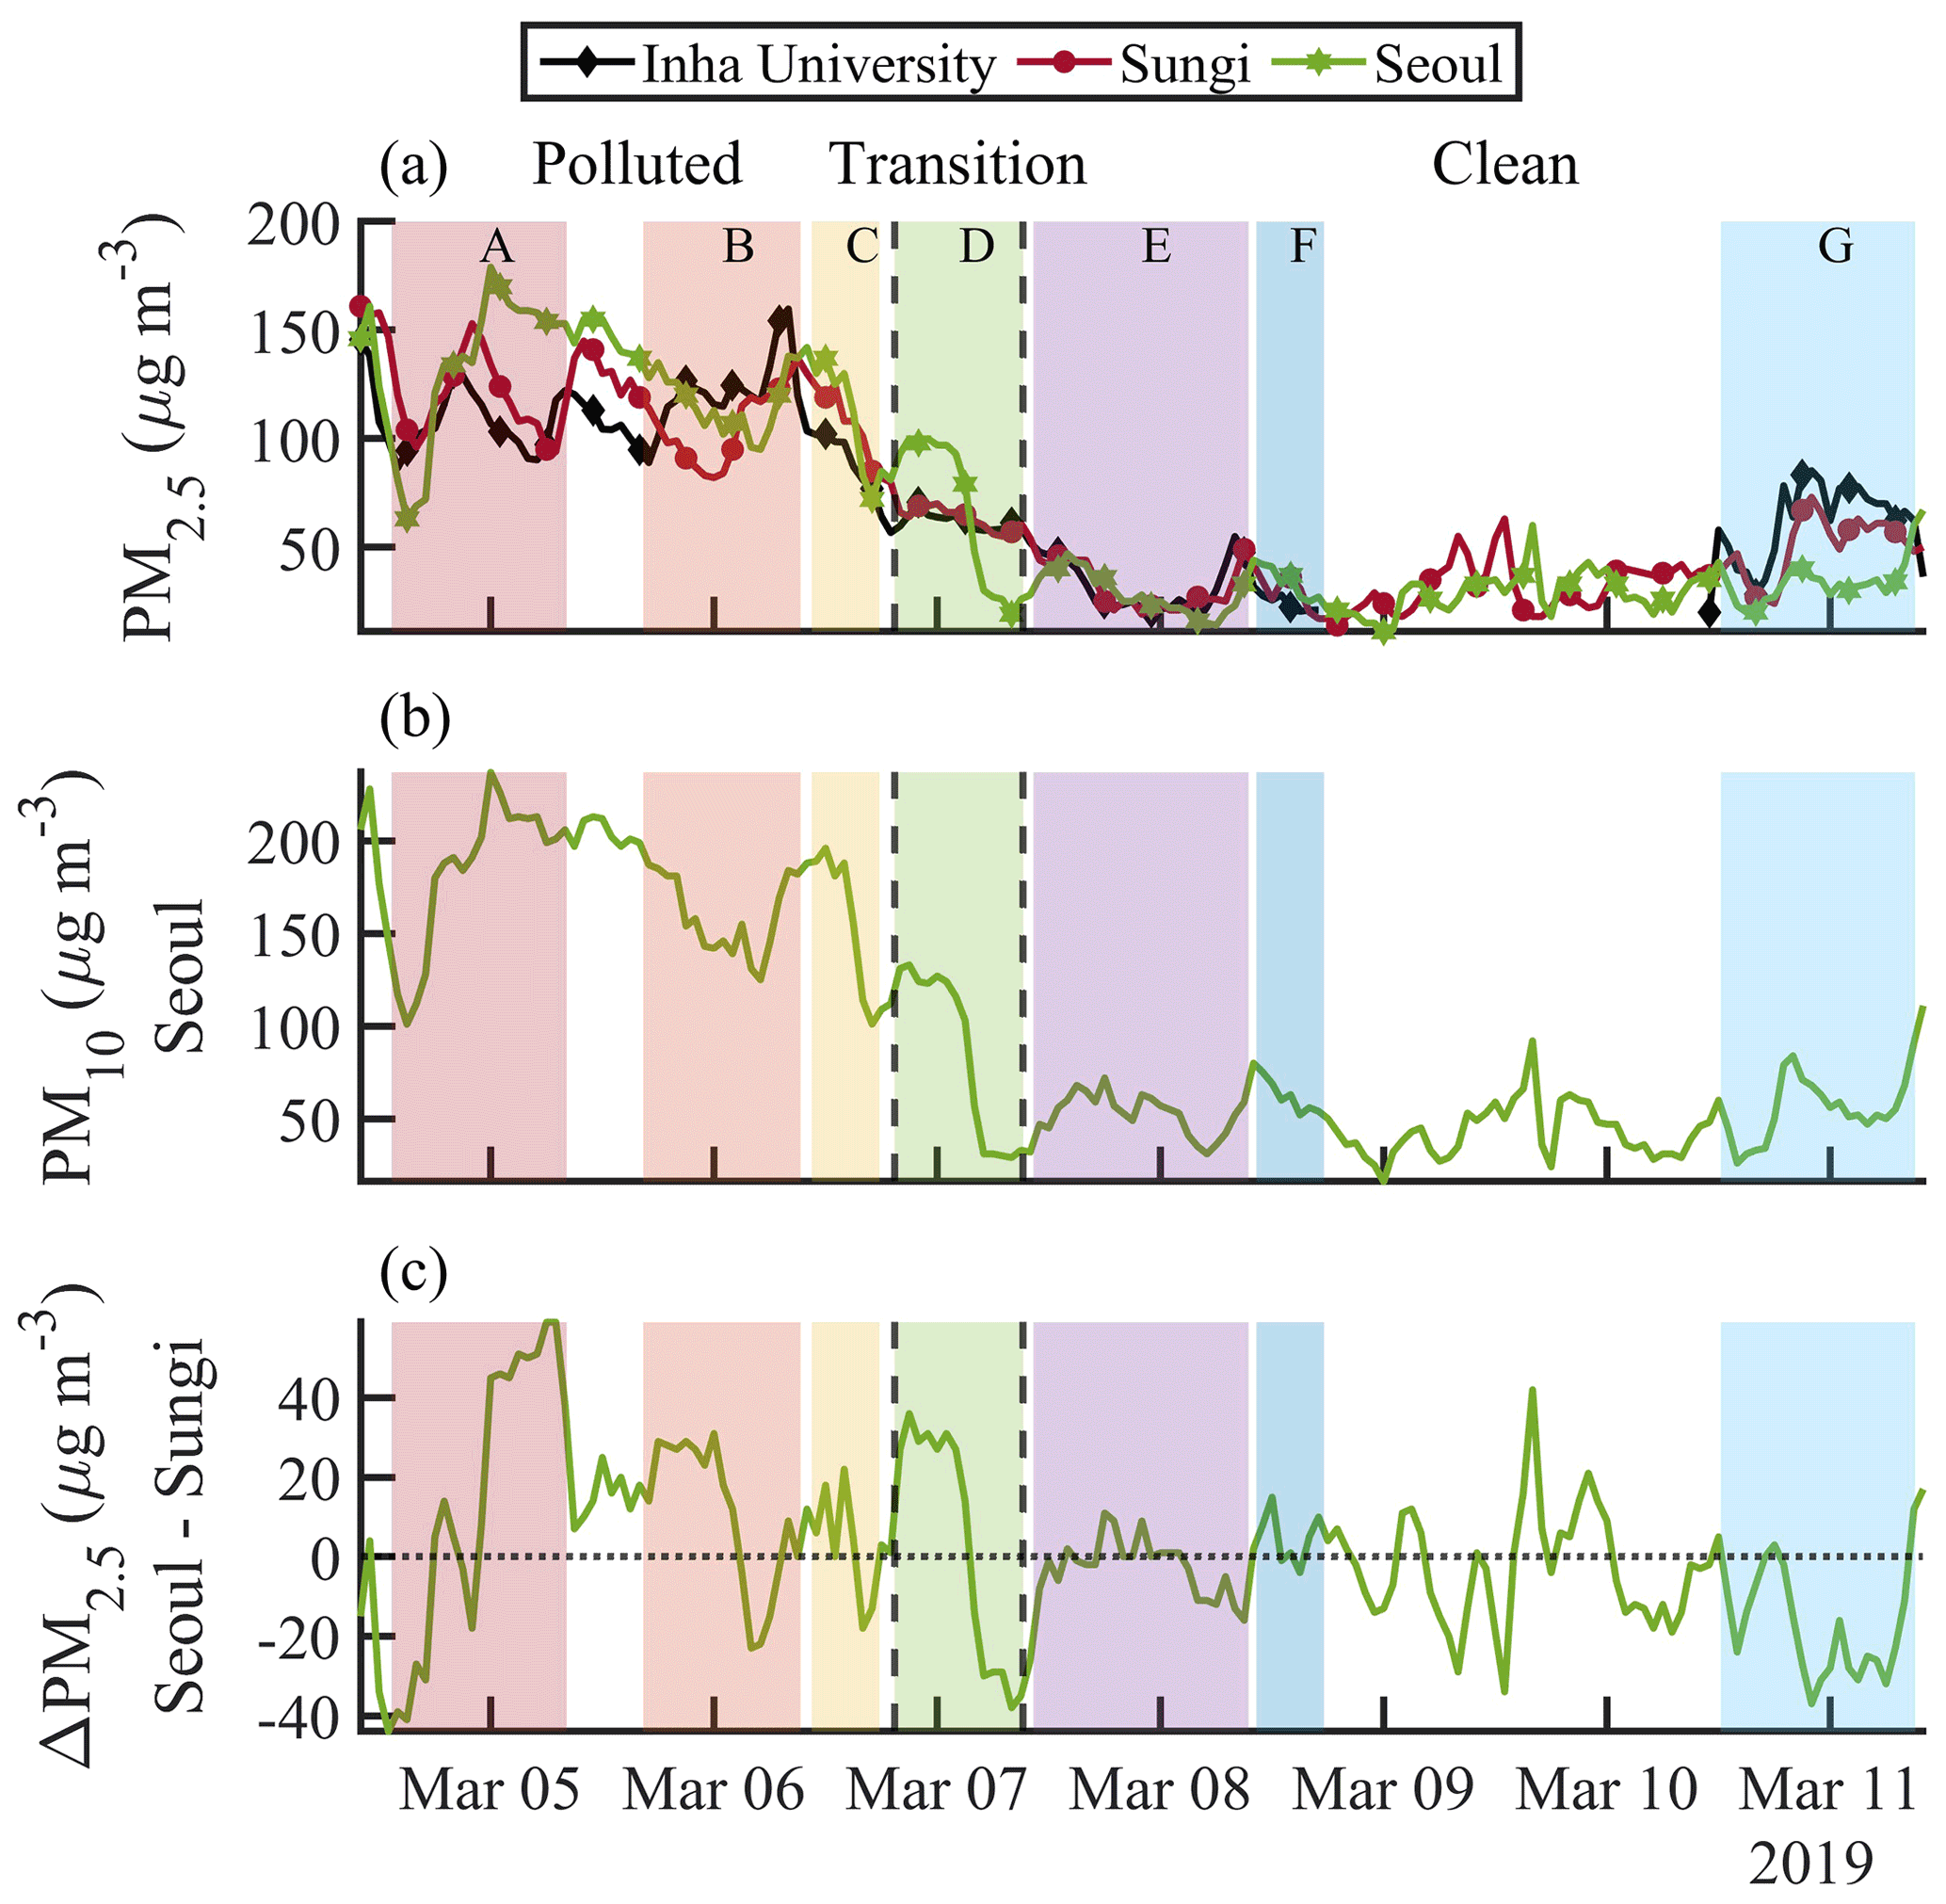
Figure 2Time series of the following parameters: (a) PM2.5 measured at Inha University, Sungi, and Seoul; (b) PM10 measured at Seoul; and (c) PM2.5 difference between Seoul and Sungi. The dashed black vertical lines separate the (left) polluted, (middle) transition, and (right) clean periods. The horizontal line in (c) denotes a PM2.5 difference of zero to clearly show positive and negative deviations from that value. Shaded regions are labeled with individual DLPI+ sets (see Table 2) overlapping in time.
2.1 Aerosol and gas monitoring
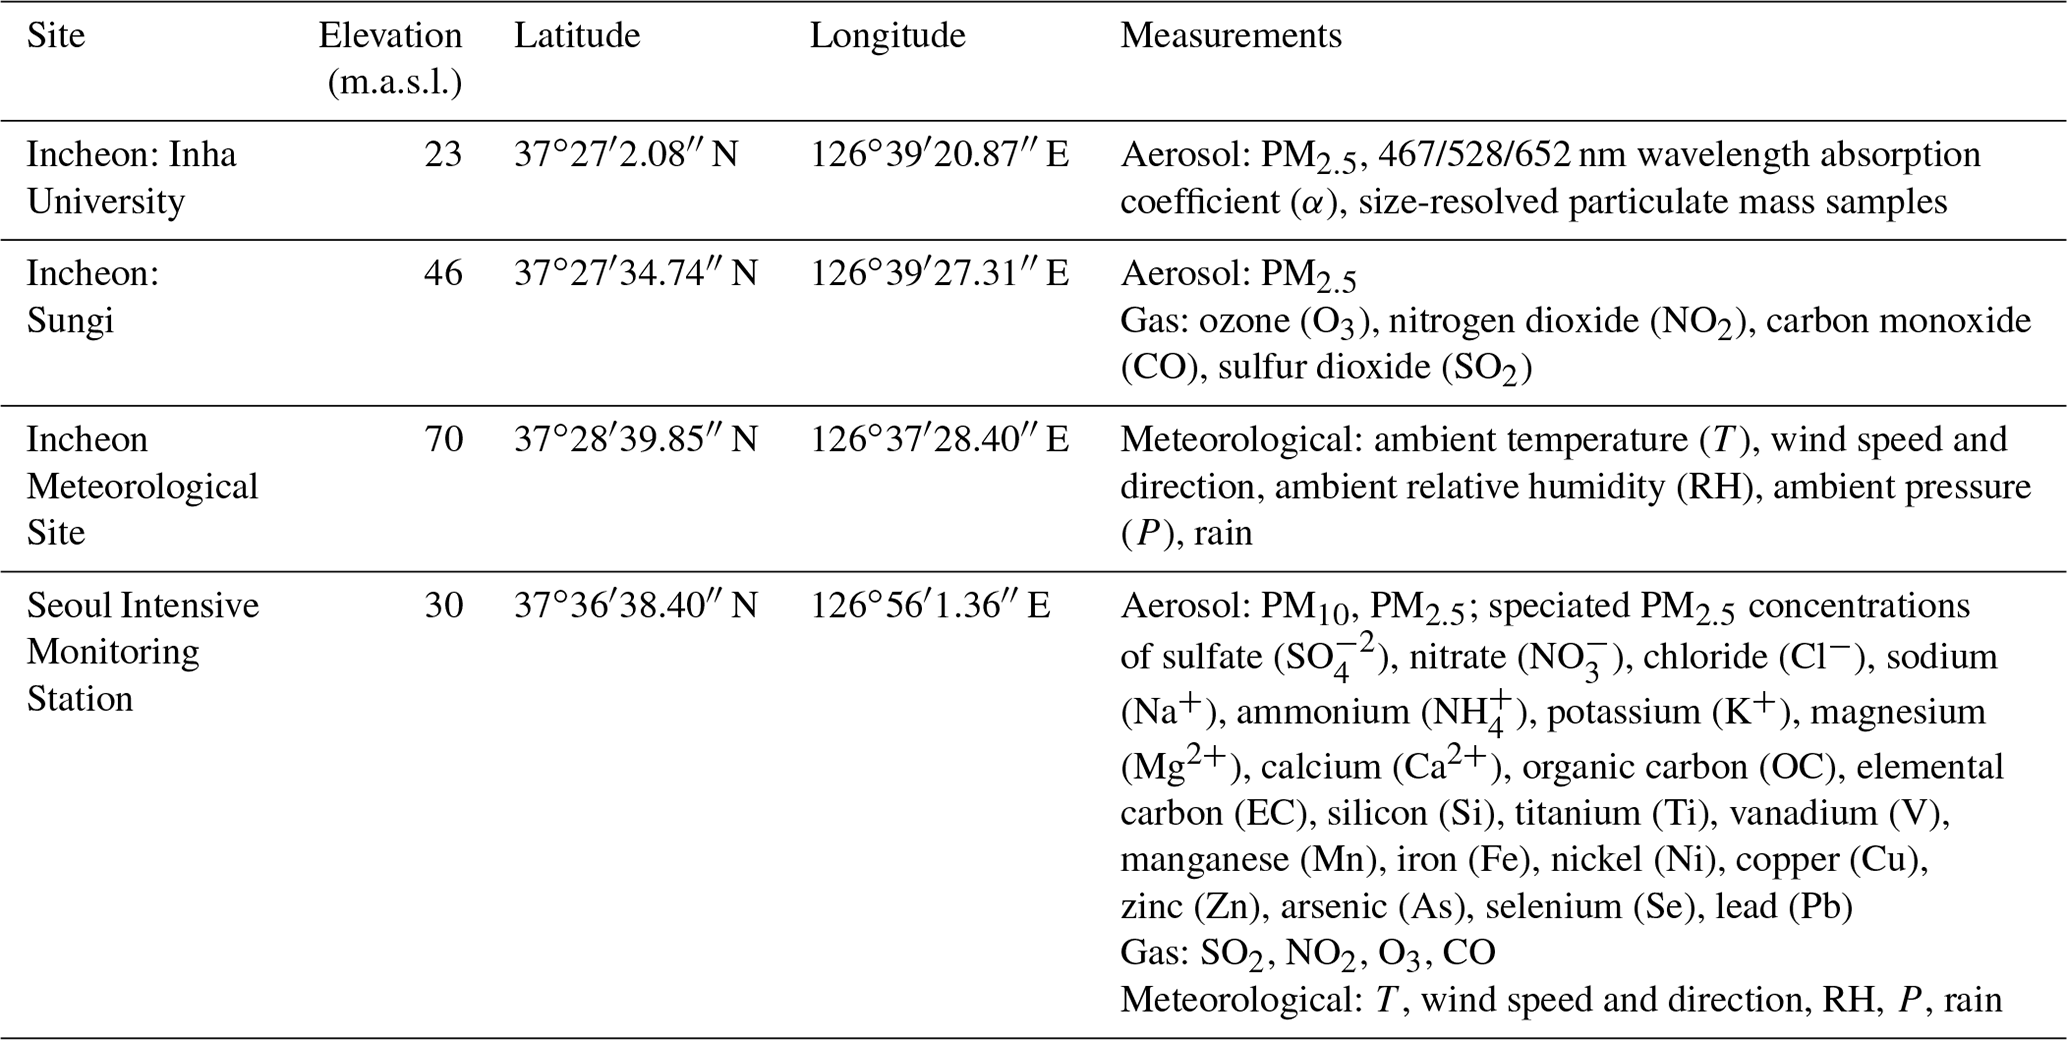
The focus of this study is on three specific monitoring sites in Incheon and Seoul (∼30 km apart), which were compared to a wide network of other stations in those cities to confirm agreement in temporal variability and concentrations. Incheon has a population of 2 936 367 in contrast to Seoul, having 9 565 990 (Korea, 2021). The three primary sites include Inha University and Sungi in Incheon, as well as the Seoul Intensive Monitoring Station (hereafter referred to as the Seoul site) in Seoul (locations in Fig. 1). Measurements at these sites are described below and summarized in Table 1. Figure 1 shows the location of the other 17 and 40 National Ambient air quality Monitoring Information System (NAMIS) stations in Incheon and Seoul, respectively, which were operational during the study period with data provided online by AirKorea; Sungi is one of those sites in Incheon, but the Inha and Seoul sites are not part of that network. The rationale for including two primary sites in Incheon is because Inha provided unique data not typically measured by NAMIS, and Sungi was closest to Inha among the NAMIS options. The Seoul site had very comprehensive measurements itself, and thus it was sufficient for this study.
Table 1Sample site name, elevation in meters above sea level (m.a.s.l.), latitude and longitude coordinates of each site, and the parameters measured at each site.
2.1.1 Inha University (Incheon)
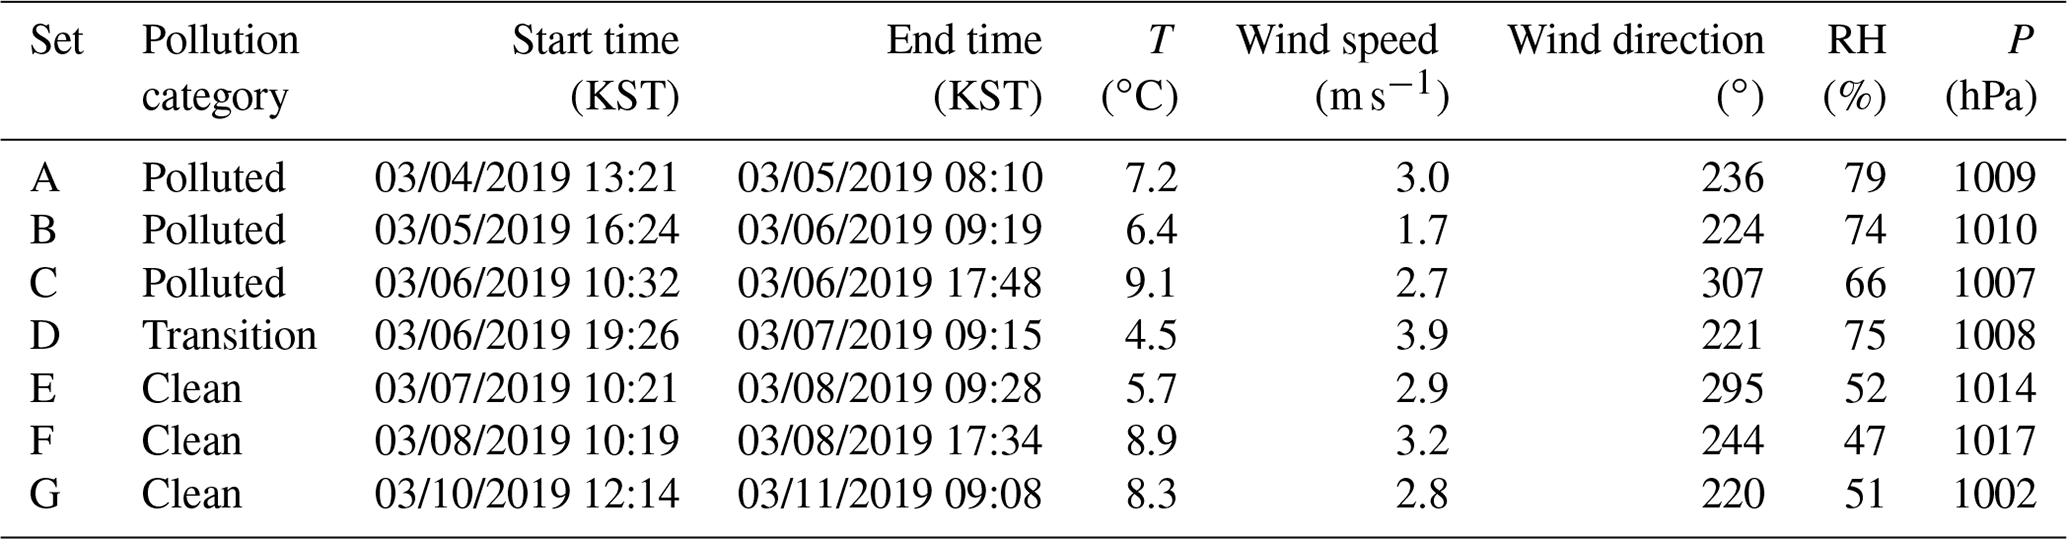
Aerosol composition measurements were conducted on a building rooftop (23 m a.s.l.; 37∘27′2.08′′ N, 126∘39′20.87′′ E) on the Inha University campus, which is a residential area ∼3 km away from Incheon harbor. Three instruments were operated simultaneously during the study period from 4 to 11 March 2019. Real-time PM2.5 measurements were conducted using an optical particle counter (OPC-Grimm model 1.109, Grimm Aerosol Technik, Germany) with 1 min time resolution. The OPC measures the number concentration of aerosol particles for 31 channels with size ranging from 0.253 to 31.15 µm, which then get converted into a mass concentration via mathematical extrapolation with a correction factor specific to the Grimm 1177 software. Real-time monitoring of light-absorbing aerosol particles was conducted with a tricolor absorption photometer (TAP model 2901, Brechtel Mfg. Inc., USA), which monitors light absorption by particles on a filter at three wavelengths (467, 528, 652 nm). In this study we focus on 652 nm data for simplicity. Lastly, size-resolved particulate matter samples were collected on Teflon filters (PTFE support, 0.1 µm pore, 25 mm, Zefon International) using a low-pressure impactor (DLPI+, Dekati, Finland) with aerodynamic lower cut point diameters of 0.016, 0.030, 0.054, 0.094, 0.15, 0.25, 0.38, 0.60, 0.94, 1.6, 2.5, 3.6, 5.3, and 10 µm. Daily filter sets were collected on the 7 d of the sampling period with details shown in Table 2. Temperature and relative humidity varied slightly between sets (Table 2) with potential impacts on size of particles owing to hygroscopic growth and evaporation–condensation (e.g., Chen et al., 2018). As temperatures were low (4.5–9.1 ∘C on average), evaporation is likely negligible. There was more potential for hygroscopic growth during the polluted and transition periods (66 % RH–79 % RH) compared to the clean period (47 % RH–52 % RH), and this does not alter conclusions of this work as size shifts owing to water uptake are an important aspect of understanding regional haze events in the study region. Note as well that hygroscopic influence on size cut-off shifts in cascade impactors are most important for RHs above 80 % and when sea salt is dominant (Chen et al., 2018), which does not apply to this study. Particles were extracted from the filters in 10 mL of deionized water and placed in an ultrasonic bath at 30 ∘C for 60 min for subsequent analysis with ion chromatography (IC, Thermo Scientific Dionex ICS-2100 system) to speciate anions and cations.
Table 2Summary of the DLPI+ sample sets including sample set name, pollution category, the start and end date in Korea standard time (KST: UTC+9 h), and the sample averages of T, wind speed and direction, RH, and P. Sample flow rate was 9.71 L min−1 for all sample sets.
The IC analysis has been described in other works (Stahl et al., 2020; MacDonald et al., 2018; Cruz et al., 2019), with limits of detection (LOD) for each species examined shown in Table S1 in the Supplement. Values measured below the LOD are replaced with LOD/2, with the percent of such samples per species provided in Table S1. For anion analysis, an AS11-HC 250 mm column and potassium hydroxide eluent were used with the following gradient program with a suppressor (AERS 500e) current of 28 mA: begin at 2 mM, increase to 8 mM from 0 to 20 min, and then increase from 8 to 28 mM from 20 to 30 min. Cation analysis involved a CS12A 250 mm column and methanesulfonic acid eluent with the following program with a suppressor (CERS 500e) current of 22 mA: start at 5 mM, isocratic from 0 to 13 min, increase from 5 to 18 mM from 13 to 16 min, and then isocratic at 18 mM from 16 to 30 min. Sample concentrations were corrected using background sample concentrations for individual species, which included sodium (Na+), ammonium (NH, potassium (K+), magnesium (Mg2+), calcium (Ca2+), chloride (Cl−), NO, SO, methanesulfonate (MSA), adipate, maleate, oxalate, and phthalate. The latter five species were summed in parts of the analysis and referred to as “organic acids” with the caveat that they represent the dissociation anion of either sulfonic or organic acids.
Concentrations for SO, Mg2+, K+, and Ca2+ refer to their non-sea-salt (NSS) values based on calculations relying on the measured concentrations of Na+ and its ratio with these species in pure sea salt (Seinfeld and Pandis, 2016). The mean percentage of sea salt mass removed for those four species relative to total speciated mass of each filter set (excluding the sea salt portion of those four species) was 2 %. Those species for which more than 15 % of samples were below the LOD (i.e., Mg2+, maleate, phthalate, adipate, MSA) are not discussed on an individual basis in this study but are used in calculations dependent on the cumulative dataset such as the overall charge balance; the exception is bromide (Br−), which is fully removed from calculations as it was always below the LOD.
2.1.2 Sungi site (Incheon)
We use PM2.5, O3, CO, NO2, and SO2 data at 1 h time intervals collected at Sungi (46 m a.s.l.; 37∘27′34.74′′ N, 126∘39′27.31′′ E) by NAMIS. These parameters are measured based on the following methods: PM2.5 via beta attenuation monitoring (BAM; MetOne Ins.), SO2 via the pulsed ultraviolet fluorescence method, CO via the non-dispersive infrared method, NO2 via the chemiluminescent method, and O3 via the ultraviolet photometric method. The gases were monitored by Teledyne API products (SO2 = 100 E, NO2 = 200 E, O3 = 300 E, CO = 400 E). Of note is that the PM2.5 measured at Sungi and Inha University with independent techniques generally agreed well during the study period (Fig. 1) with a coefficient of determination (R2) of 0.82.
2.1.3 Seoul Intensive Monitoring Station
Gas and aerosol (PM10 and PM2.5) data are used from the Seoul site (30 m a.s.l.; 37∘36′38.40′′ N, 126∘56′1.36′′ E), which is independent from the NAMIS network. The following parameters were measured: PM2.5 and PM10 via beta attenuation monitoring (BAM), ionic species concentrations (SO, NO, Cl−, Na+, NH, K+, Mg2+, Ca2+) via an ambient ion monitor (URG 9000D, URG Co.) and ion chromatography (Dionex, DX-1000; IonPac AS14A and the CS12A columns), organic carbon (OC) and elemental carbon (EC) via a semi-continuous analyzer (Sunset Laboratory) based on the thermal–optical reflectance (TOR) method, elemental concentrations (Si, Ti, V, Mn, Fe, Ni, Cu, Zn, As, Se, Pb) via an online X-ray fluorescence (XRF) analyzer (Xact-420, Cooper Environmental Co.), SO2 via the pulsed ultraviolet fluorescence method, CO via the non-dispersive infrared method, NO2 via the chemiluminescent method, and O3 via the ultraviolet photometric method. Gases were monitored with the same techniques as at the Sungi site. All speciated aerosol information in Seoul is for PM2.5.
2.2 Meteorological data
Meteorological data for winds, temperature (T), pressure (P), relative humidity (RH), and rain were used from monitoring stations in Incheon and Seoul. The Korea Meteorology Administration provided data from an Automated Synoptic Observing System (ASOS) for the Incheon station (70 m a.s.l.; 37∘28′39.85′′ N, 126∘37′28.40′′ E) (https://data.kma.go.kr, last access: 5 October 2021), which is located ∼5 km northwest of the Inha University sampling site. Meteorological data were collected at the same site described for Seoul in Sect. 2.1.3. Specific humidity (q) was calculated using measured values of T, P, and RH (Bolton, 1980).
Planetary boundary layer height (PBLH) data are used from the Modern-Era Retrospective Analysis for Research and Application version 2 (MERRA-2) (Gelaro et al., 2017). MERRA-2 uses the Goddard Earth Observing System Data Assimilation System Version 5 (GEOS-5) and is hosted and maintained by the National Aeronautics and Space Administration (NASA) Global Modeling and Assimilation Office (GMAO). The MERRA-2 PBLH product is provided as part of the surface flux diagnostics dataset (GMAO, 2015). The resolution of the PBLH product is and is assimilated on an hourly timescale. All four sample sites described above are within the same grid point (37.500∘ N, 126.875∘ E) in the MERRA-2 PBLH product.
2.3 Trajectory and chemical transport modeling
We use the NOAA HYSPLIT model (Rolph et al., 2017; Stein et al., 2015) for air mass back-trajectory information. We rely on the Global Data Assimilation System (GDAS) at resolution and the model vertical velocity method for treating vertical motion. 4 d back trajectories were calculated for each hour between 4 and 11 March 2019. We use an ending altitude of 500 m a.g.l. at the Inha University sampling site, which was sufficient to represent the predominant sources impacting the various sample sites during the week of focus owing to their close proximity. This ending altitude has proved to be successful for other surface air quality studies in other regions (e.g., Aldhaif et al., 2021; Crosbie et al., 2014; Mora et al., 2017; Hersey et al., 2015) and nearby in southeast Asia (e.g., AzadiAghdam et al., 2019). We obtained data for the following parameters along trajectories: ambient temperature (∘C), rainfall (mm h−1), mixed layer depth (m), RH (%), and downward solar radiation flux (W m−2).
For large-scale background aerosol information we rely on the Navy Aerosol Analysis and Prediction System (NAAPS) (Lynch et al., 2016) accessible at https://www.nrlmry.navy.mil/aerosol/ (last access: 15 September 2021). We specifically use the reanalysis version of NAAPS, called NAAPS-RA. This is a chemical transport model with 25 vertical levels using a terrain-following sigma-pressure coordinate system that provides data in grids every 6 h. The model is driven by the Navy Global Environmental Model (NAVGEM) for meteorological information (Hogan et al., 2014). The final reanalysis results are created after assimilating Moderate Resolution Imaging Spectroradiometer (MODIS) and Multi-angle Imaging Spectroradiometer (MISR) data into the model (Zhang and Reid, 2006; Hyer et al., 2011). Reanalysis output is provided for dust, sea salt, open biomass burning smoke, and “anthropogenic and biogenic fine (ABF)” that includes secondarily produced species (i.e., SO and SOA) and primary organic aerosols mainly confined to the fine mode (<1 µm).
March 2019 was characterized by a major transboundary pollution event impacting the Korean peninsula, with visual satellite imagery (Fig. S1 in the Supplement) clearly showing the presence and then absence of significant haze. Owing to their proximity to one another, the Inha and Sungi stations in Incheon revealed similar values and changes in PM2.5 (R2=0.82 for the full study period) with a significant reduction from polluted (∼115 µg m−3) to transition (∼63 µg m−3) and clean (∼40 µg m−3) periods (Table 3 and Figs. 1–2). Both Inha and Sungi PM2.5 levels were strongly correlated with the mean of data from 17 NAMIS stations across Incheon (Fig. 1: R2 of 0.82 and 0.98, respectively).
Table 3Average Incheon meteorological, aerosol, and gas parameters for the polluted, transition, and clean time periods, with standard deviations shown in parentheses. Speciated concentrations from Inha represent mass for particles with diameters above 0.016 µm (i.e., full size range of DLPI+ sampler) and are weighted by sample duration when calculating the time period average; species with concentrations below their respective LOD in more than 50 % of samples (see Table S1) are not shown. Standard deviations are not shown for the transition period speciated data owing to there only being one sample set.

Meanwhile, ∼30 km farther inland in Seoul, both PM10 and PM2.5 dropped at a similar rate as Incheon between the three periods (Table 4 and Figs. 1–2): PM, ∼91, ∼50 µg m−3; PM, ∼71, ∼31 µg m−3. The Seoul site PM2.5 data were strongly correlated with the 40 NAMIS stations across Seoul (Fig. 1: R2=0.96). Based on the three period averages, Seoul exhibited slightly higher PM2.5 levels in the polluted and transition periods, whereas Incheon was higher during the clean period. The time series of hourly PM data in Figs. 1–2 show that near the end of the clean period there was an increase in pollution levels, which is consistent with HYSPLIT data showing back trajectories shifting from northerly for most of the clean period to northwesterly (i.e., from the Beijing area) (Fig. 3). The R2 value between PM2.5 hourly data was 0.75 and 0.82 for Seoul–Inha and Seoul–Sungi, respectively. Although there was decent agreement, differences are apparent in the PM2.5 hourly time series (Fig. 2c), with Seoul's levels being significantly enhanced during parts of the polluted and transition periods. The difference in PM2.5 between Seoul and Incheon suggests enhanced local production promoting large differences between hourly PM2.5 over Seoul versus Incheon. For example, the maximum mean ± standard deviation in the PM2.5 differences (µg m−3) between Seoul and Sungi were as follows for the three periods: polluted ± 26; transition ± 28; clean .
Table 4Average meteorological, aerosol, and gas parameters for the polluted, transition, and clean time periods measured at the Seoul sampling site, with standard deviations shown in parentheses. Note that organic aerosol (OA) concentration was calculated by multiplying the OC concentration by a factor of 1.8 (i.e., OA = OC × 1.8).
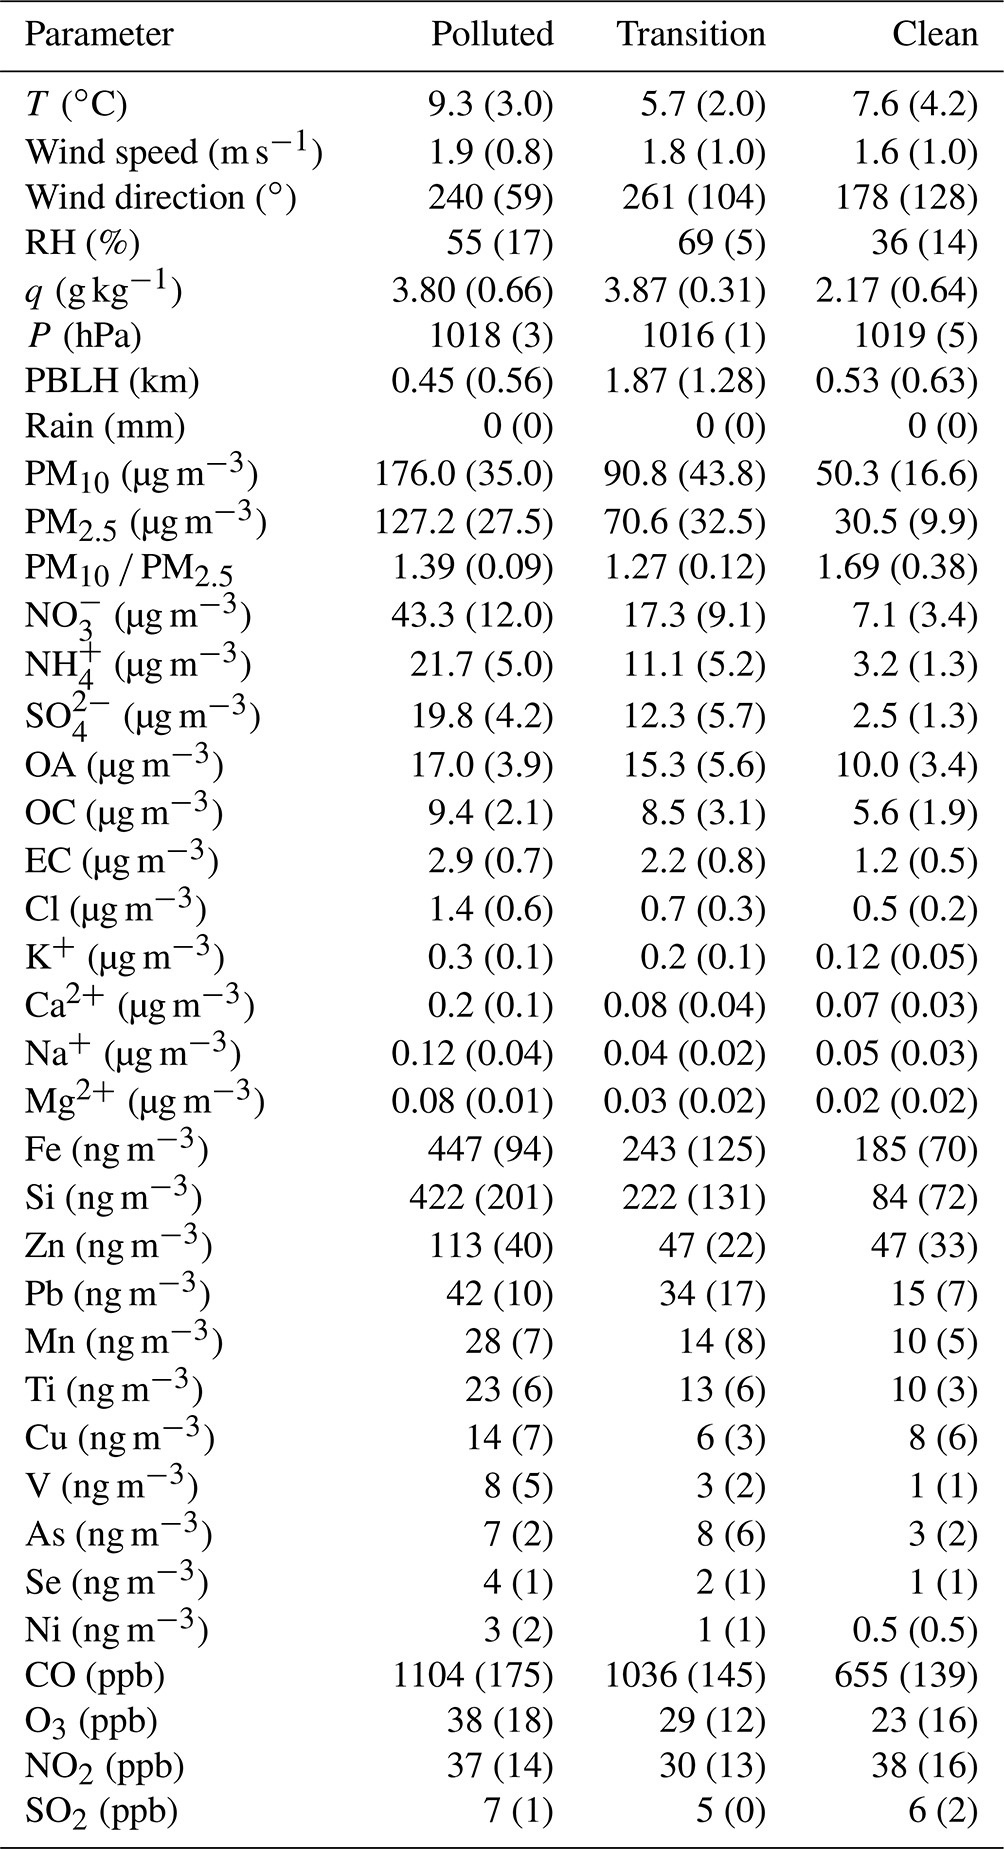
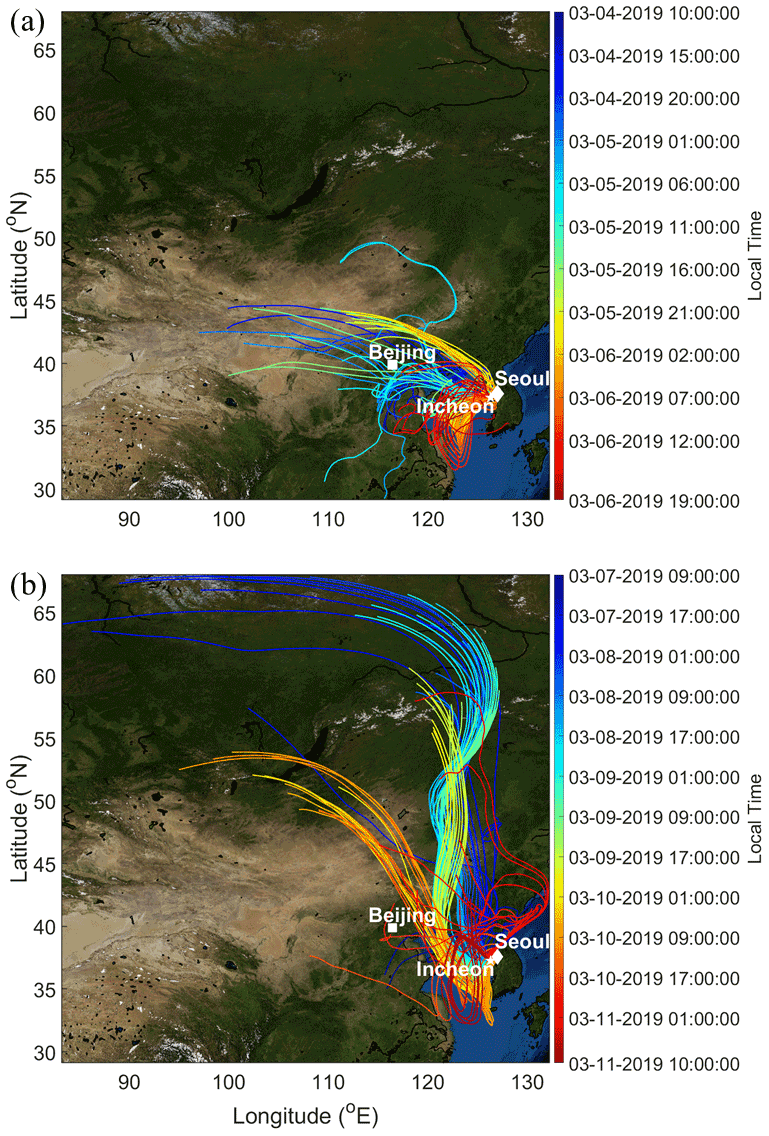
Figure 3The 4 d back trajectories based on hourly data during the (a) polluted and (b) the clean portion of the study period. The ending point of trajectories is at 500 m a.g.l. at Incheon, with environmental parameters along the trajectories summarized in Fig. S4. Images retrieved from https://worldview.earthdata.nasa.gov/ (last access: 15 November 2021).
The PM10 : PM2.5 ratio is helpful to examine whether a divergence in values occurs that would suggest a strong source of dust compared to typical background conditions. More specifically, higher values of this ratio could potentially suggest enhanced dust influence owing to mass concentrations of dust being abundant above 2.5 µm. As PM10 was only measured at Seoul, Table 4 compares the mean (± standard deviation) value of this ratio for the three time periods: polluted 1.39±0.09, transition 1.27±0.12, clean 1.69±0.38. As will be discussed more subsequently, dust did not drive the high PM concentrations during the polluted period, but rather it was driven in large part by secondarily produced species (i.e., SO, NO, NH that grew into the 1–2.5 µm range.
4.1 PM2.5 composition
Speciated PM2.5 data from Seoul (Table 4) reveal that the largest contributor was NO during the polluted and transition periods, with an average concentration during the polluted period of 43.3 µg m−3. Estimating OA mass from the measured mass concentration of OC (OA [µg m−3] = 1.8× OC [µg m−3]; Zhang et al., 2005) indicates that OA dominated the PM2.5 mass during the clean period, followed by NO. Of all species measured in Table 4, SO exhibited the highest relative enhancement during the polluted period versus the clean period (factor of 7.9), whereas NH and NO were enhanced by factors of 6.8 and 6.1, respectively. OA was only enhanced by a factor of 1.7. In terms of mass concentrations, the difference between the polluted and clean periods for the sum of nitrate, sulfate, and ammonium was 72 µg m−3 versus the difference in OA of 7 µg m−3 (Table 4). The change in OA is <10 % of the change in the three major inorganic ions.
The strong enhancement of the inorganic constituents is most likely due to rapid production (both locally and in transport) in contrast to transported PM that was already produced upwind; the latter would tend to increase OA along with inorganic constituents more comparably than what was observed. In lesser abundance were Cl−, Na+, K+, Mg2+, and Ca2+, which are linked to sea salt and dust (Seinfeld and Pandis, 2016) and thus expected to have appreciable concentrations above 2.5 µm. In terms of the elemental species, the most prevalent species in all three periods were the crustal tracer species Si and Fe, which were 5.0 and 2.4 times higher in concentration, respectively, during the polluted period versus the clean period (Table 4). Most of the crustal tracer species showed enhancements ranging from 1.8–2.8. Only Si, Se, and V showed greater enhancement ratios, with the latter two enhanced by factors of 4 and 8, respectively.
The sum of the PM2.5 components using OC in Table 4 accounted for 79 % (polluted), 75 % (transition), and 68 % (clean) of the total PM2.5, which is partly due to unmeasured species and the fact that OC includes only the carbon mass and not other elements associated with organic compounds. Using OA instead of OC yields improved PM2.5 closure: 85 % (polluted), 85 % (transition), 83 % (clean). This decent level of closure may be largely attributed to the high relative abundance of more easily measured inorganic species, predominantly NO, SO, and NH.
4.2 Mass size distributions
The mass size distribution measurements in Incheon provide a unique look into a typical transboundary pollution event, with the ability to contrast it with the subsequent transition and clean periods. Insights gathered from this analysis have direct relevance to Seoul owing to close proximity to Incheon (∼30 km) with the exception of any additional aerosol processing and formation that took place between Incheon and Seoul, especially including Seoul itself. Charge balance details can be found in Sect. S1 and Fig. S2, with a general anion deficit during the study period, including anions not speciated with the IC technique such as various types of organics.
Figure 4 summarizes size-resolved composition for the polluted, transition, and clean periods of this study. Ions typically associated with primary natural aerosol sources such as sea salt and dust (Arimoto et al., 1992; Seinfeld and Pandis, 2016), including Ca2+, Na+, and Cl−, did not exhibit any significant enhancement during the polluted period (cumulative mass concentrations in Table 3), with varying size distribution peaks based on the species and period during the study. In contrast, the ions linked to secondary formation via gas-to-particle conversion processes (i.e., SO, NO, NH, and organic acids) were dramatically enhanced during the polluted period compared to the clean period (Fig. 4) with the transition in between. These species exhibited their highest concentrations during the polluted period between 0.38 and 3.60 µm, a range which includes larger sizes for these secondarily produced species (especially SO and NH compared to other regions where their peaks are reported to be between 0.3 and 0.6 µm (Maudlin et al., 2015; Cruz et al., 2019). During the transition period, the inorganic species exhibited maximum concentrations for particles with diameters between 0.38 and 1.60 µm. The clean period was generally marked by these species exhibiting peak concentrations for particles between 0.25 and 0.38 µm with a secondary peak from 0.6 and 0.94 µm, although neither is pronounced.
The likely formation pathway for SO, NO, NH, and organic acids in the polluted period was secondary production, which was assisted in part by high humidity as discussed in more detail in Sect. 6.2. Their common formation mechanism is supported by significant correlations (r≥0.94; see time series in Fig. S5) during the polluted period between SO, NO, NH, and oxalate, with the latter being the most abundant organic acid during the entire study period but especially in the polluted period (∼70 % of organic acid mass). Oxalate is produced efficiently via aqueous-phase chemistry (Sorooshian et al., 2007, 2006; Wonaschuetz et al., 2012). The strong correlation between oxalate and SO during the polluted period is important as a strong correlation between these species (in the absence of biomass burning) is considered a marker for secondary aqueous aerosol formation (Ervens et al., 2004; Yu et al., 2005; Zhou et al., 2015; Hilario et al., 2021a). The fact that oxalate exhibits a greater enhancement ratio in Table 3 than OA in Table 4 is not surprising since not all OA is produced via aqueous processing and even components that are may be produced at different rates. Thus, it is cautioned that oxalate is not a good proxy for OA overall in haze.
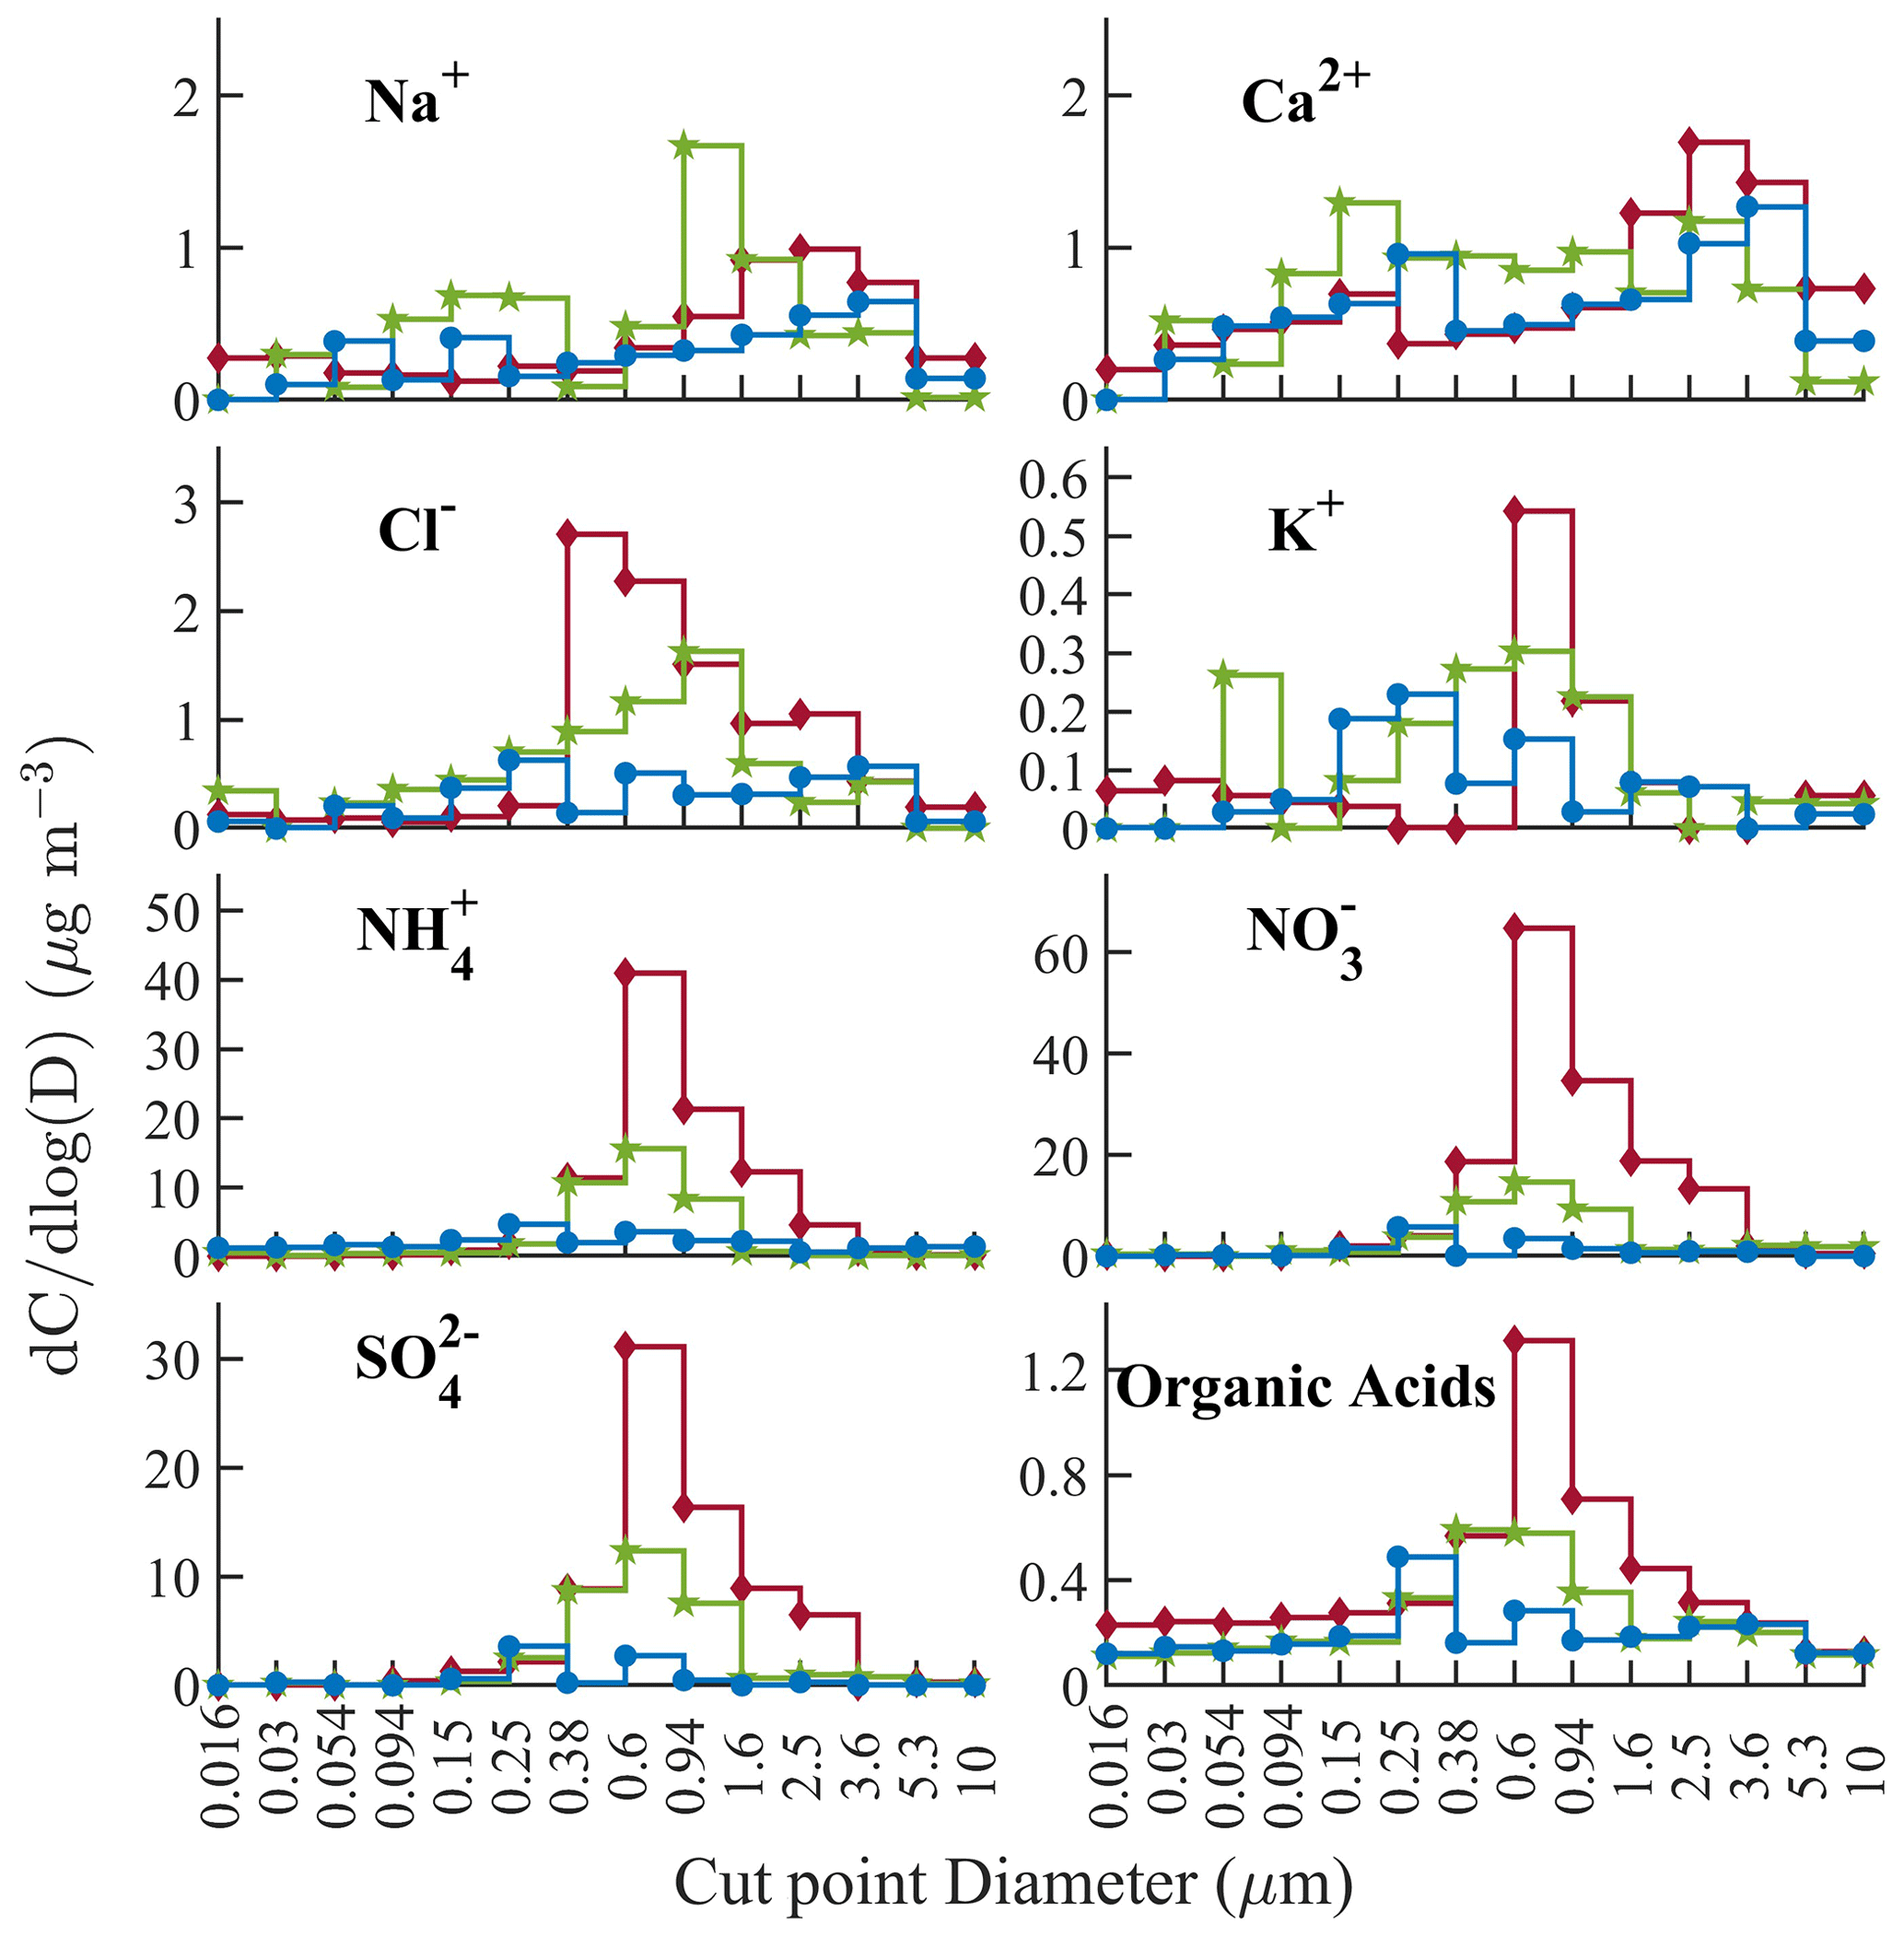
Figure 4Size-resolved composition for (red) polluted, (green) transition, and (blue) clear sample periods. Organic acids: sum of MSA, adipate, maleate, oxalate, phthalate. Sample set data were weighted by sample duration for the polluted and clean periods (note: transition period had just one set). Species that were below LOD in more than 50 % of samples (see Table S1) are not shown.
We next examine if NH3 was completely neutralized by HNO3 and H2SO4. A charge balance between SO, NO, and NH can indicate complete neutralization with a slope of unity, as has been tested by other studies (e.g., Lee et al., 2003). A charge balance using individual stages of the three polluted sets collected at Inha University (NH on y axis) between these three species (Fig. S3) yielded a best-fit line slope and y intercept of 1.34 and −0.02, respectively (R2=0.99, n=20). Our data reveal an anion deficit and that there was sufficient NH3 to fully neutralize HNO3 and H2SO4. Furthermore, there likely was limited interaction of these acidic gases with coarse particles (e.g., dust and sea salt) that were relatively low in abundance.
5.1 Atmospheric circulation and meteorology
According to previous meteorological analysis (I. S. Park et al., 2020), the air mass history for the polluted period was influenced by the interaction between a Siberian high-pressure system and a migratory anticyclone system, which were located over the Korean peninsula. From 28 February to 1 March 2019, a high-pressure system was located to the west and low-pressure systems were located to the east, all conspiring to yield westerly and northwesterly winds. D. Lee et al. (2019) examined a similar time period (27 February–7 March 2019) and suggested that pollution between 3 and 5 March was transported to the Seoul area at low and high altitudes from the Shandong Peninsula and Beijing, respectively. Pollution levels were exacerbated over South Korea due to a weak high-pressure system lingering over the Korean peninsula between 2 and 5 March (I. S. Park et al., 2020). This is evident from the HYSPLIT back trajectories (Fig. 3a) showing air masses moving slower in the polluted period versus the subsequent clean period (Fig. 3b). Following the lingering period, a low-pressure system moved in over Russia associated with more clouds and rain upwind of the sampling sites (Fig. S4). There were stronger winds that were northerly between 7 and 11 March. In both the polluted and clean periods, air masses descended from ∼2.5–4 km 4 d earlier to within the mixing layer (Fig. S4). The NAAPS spatial maps of speciated optical depths (Fig. S6) and surface mass concentrations (Fig. S7) confirm the spatial extent of the regional haze event extending from the Korean peninsula to areas like Beijing with the ABF (anthropogenic and biogenic fine: SO, primary organic aerosols, and SOA) component being most prominent during the study period and the driver of the polluted period enhancements in PM, consistent with the dominance of SO, NO, and NH from the in situ measurements.
The local weather conditions in both Incheon (Table 3) and Seoul (Table 4) exhibited the following common characteristics: (i) generally low average temperatures (<10 ∘C) that decreased after the polluted period; (ii) low average wind speeds (2.5–3.7 m s−1 in Incheon, <2 m s−1 in Seoul), (iii) the highest mean PBLH during the transition period (1.87 km compared to ≤0.53 km for the other periods), (iii) the lowest average humidity in the clean period (RH ≤ 51 % and q≤2.95 g kg−1), and (iv) negligible rain. Although locally there was negligible rain, there was some precipitation along the trajectories arriving at these sites in the polluted and clean periods (Fig. S4), with some potential to reduce aerosol concentrations via wet removal. The time series of these various environmental conditions in Incheon and Seoul (Fig. S8) demonstrate high temporal similarity and the similar characteristics noted above. The relatively low regional wind speeds during the polluted period (Figs. 3 and S8) indicate that transport was slow, allowing for the accumulation and persistence of the haze over this whole domain.
5.2 Gas concentrations
Gases (CO, O3, NO2, SO2) exhibited fairly similar values (Tables 3–4) and temporal patterns (Fig. S9) between Sungi and Seoul, with CO exhibiting the largest relative reduction between successive periods, followed by O3. PM2.5 only exhibited a strong relationship with CO in Sungi and Seoul based on correlation coefficients during the full study period (r=0.84 and 0.87, respectively). As CO is a tracer for anthropogenic emissions (Fishman and Seiler, 1983), its high correlation with PM2.5 at both sites supports the strong influence of anthropogenic aerosol at both sites. The reduction of CO from the polluted to the clean period is possibly due to Chinese influence; in contrast to South Korea, combustion efficiency has been shown to be worse in China (Halliday et al., 2019), which supports the high CO levels during the polluted period with air masses coming from China. Carbon monoxide concentrations in Seoul exceeded Incheon by 177 ppb on average during the polluted period, suggestive of added influence from local emissions in Seoul superimposed on top of the transported pollution. Carbon monoxide is commonly used in calculations related to aerosol transport studies (e.g., Dadashazar et al., 2021; Hilario et al., 2021b) as it is relatively insensitive to wet scavenging processes with a long lifetime in the atmosphere (∼1 month) compared to aerosol particles (Weinstock, 1969).
6.1 Differences between Seoul and Incheon
We now consider PM2.5 differences between Incheon and Seoul, with the latter exhibiting elevated levels during most of the polluted period (Fig. 2). KORUS-AQ research highlighted that while transport brings aerosol particles from upwind sources, high humidity and cloudiness concentrate local pollution in a shallow stable boundary layer, which promotes secondary aerosol production (Jordan et al., 2020). Jordan et al. (2020) showed that Seoul exhibited PM2.5 levels that were on average ∼10 µg m−3 higher than those at Incheon during the transport–haze period of KORUS-AQ that persisted for 7 d. The maximum daily mean enhancement of PM2.5 in Seoul from Incheon over that period was 24 µg m−3, while the peak hourly mean enhancement reached 32 µg m−3. These observations were plausibly attributed to more local emissions in Seoul. The same explanation arguably applies to a large extent in our study period too, for which the mean difference during the polluted period between Seoul and Incheon PM2.5 was 10 µg m−3 for Sungi and 17 µg m−3 for Inha (Tables 3 and 4), with the peak hourly enhancement between Seoul and Sungi being nearly 60 µg m−3 (Fig. 2). Here again, humidity (both q and RH) is elevated and PBLH is low compared to the subsequent clean period when PM levels were drastically lower. As the two sites are quite close to one another (∼30 km), the most likely explanation for higher PM levels in Seoul is more local emissions rather than additional aging to produce secondary aerosol species via transport.
6.2 Role of humidity
One finding in this work is a significant quantity of secondarily produced species in the supermicrometer range. More specifically, the relative fraction of SO, NO, NH, and organic acids in the supermicrometer range (i.e., technically D≥0.94 µm) compared to all sizes sampled at Inha (D≥0.016 µm) during the polluted period was 43 %, 44 %, 42 %, and 36 %, respectively, which is appreciable and potentially influenced by the humid conditions. More specifically, it is hypothesized that in the polluted period there was both hygroscopic growth of particles and additional chemical uptake in those swollen particles with enhanced aerosol-laden water to promote higher concentrations of these secondary species.
Of the meteorological parameters shown in Tables 3–4, PM2.5 levels at Inha University, Sungi, and Seoul were best correlated with q (r=0.66, 0.64, and 0.78, respectively) across the entire study period. The second-best relationship was with RH (r=0.53, 0.47, and 0.53, respectively), with minimal relationships with either temperature (r: 0.02–0.17) or wind speed (). This motivates an examination of the relationships between PM and humidity to assess the plausibility of a role for heterogeneous secondary aerosol production from local and transported gas-phase precursors.
One metric used to quantify such enhanced aerosol production is the oxidation ratio, specifically the sulfur and nitrogen oxidation ratios (SOR and NOR, respectively): SOR = SO (SO + SO2) and NOR = NO (NO + NO2) (Colbeck and Harrison, 1984). Higher values of SOR and NOR indicate that the gaseous precursors form higher relative amounts of SO and NO, respectively (Kaneyasu et al., 1995). Previous studies have reported increased SOR and NOR as a function of RH at several locations throughout China including Nanjing, Beijing, Hangzhou, and Xi'an (Zhang et al., 2021; Quan et al., 2015; Wu et al., 2018; Huang et al., 2020; Ji et al., 2018). In particular, Huang et al. (2020) showed that SOR increased exponentially with aerosol water content when RH > 50 % in Beijing during polluted periods in the wintertime. Given our finding that q is better correlated with PM2.5 than RH, we compare SOR and NOR to q (Fig. 5). We evaluate these ratios for Seoul data only as all the requisite data were measured at the same site. The mean (± standard deviation) NOR during the three time periods of the study was as follows: polluted 0.39±0.1, transition 0.22±0.10, clean 0.09±0.04. Similarly, the mean (± standard deviation) SOR was as follows: polluted 0.51±0.06, transition 0.44±0.14, clean 0.14±0.07. We find a positive relationship between NOR and SOR with q(RH), with R2 values being 0.58(0.24) and 0.82(0.43), respectively. For context, during a polluted period in Xi'an, China, NOR and SOR values were 0.32 and 0.33, respectively, with high R2 values with aerosol water content (NOR = 0.55; SOR = 0.81) (Zhang et al., 2021). While the average q and RH were slightly higher for the transition period in Seoul relative to the polluted period (Table 4), the peak values of q, RH, SOR, and NOR all occurred during the beginning of the polluted period (Fig. S10).
This study's results suggest there was significant heterogeneous processing to produce species like SO, NO, NH, and organic acids above ∼1 µm. These species accounted for ∼93 % of the total speciated ion mass at Inha during the polluted period (Table 3) and are strongly correlated with one another (). Heterogeneous production of inorganic species such as SO in cloudy and humid conditions is common for the study region (Jeon et al., 2021; Jordan et al., 2020; S. Park et al., 2020). Furthermore, significant secondary production of SO above 1 µm at high RH has been noted in Beijing (Wang et al., 2020). Mechanisms potentially responsible include aqueous oxidation by O3, H2O2, and transition-metal ion-catalyzed O2, as well as heterogeneous oxidation on surfaces of aerosol particles and droplets via the same oxidants (Li et al., 2020). Table 4 shows that in Seoul the concentrations of elements such as Fe, Cu, Zn, and Pb were higher during the polluted period, which is assumed to be similar in Incheon, supporting the possibility of transition-metal-catalyzed secondary production of secondary SO. Enhanced aerosol liquid water in more humid conditions also promotes partitioning of species to the aerosol phase as has been documented for NO in the study region (Seo et al., 2020) and is common for organic acid precursors (Hennigan et al., 2008, 2009; Sorooshian et al., 2010). The increased total concentration of NH in the polluted period relative to the clean period and strong correlation with SO, NO, and oxalate are related to its key role in salt formation (Paciga et al., 2014; Seinfeld and Pandis, 2016; Zhang et al., 2015).
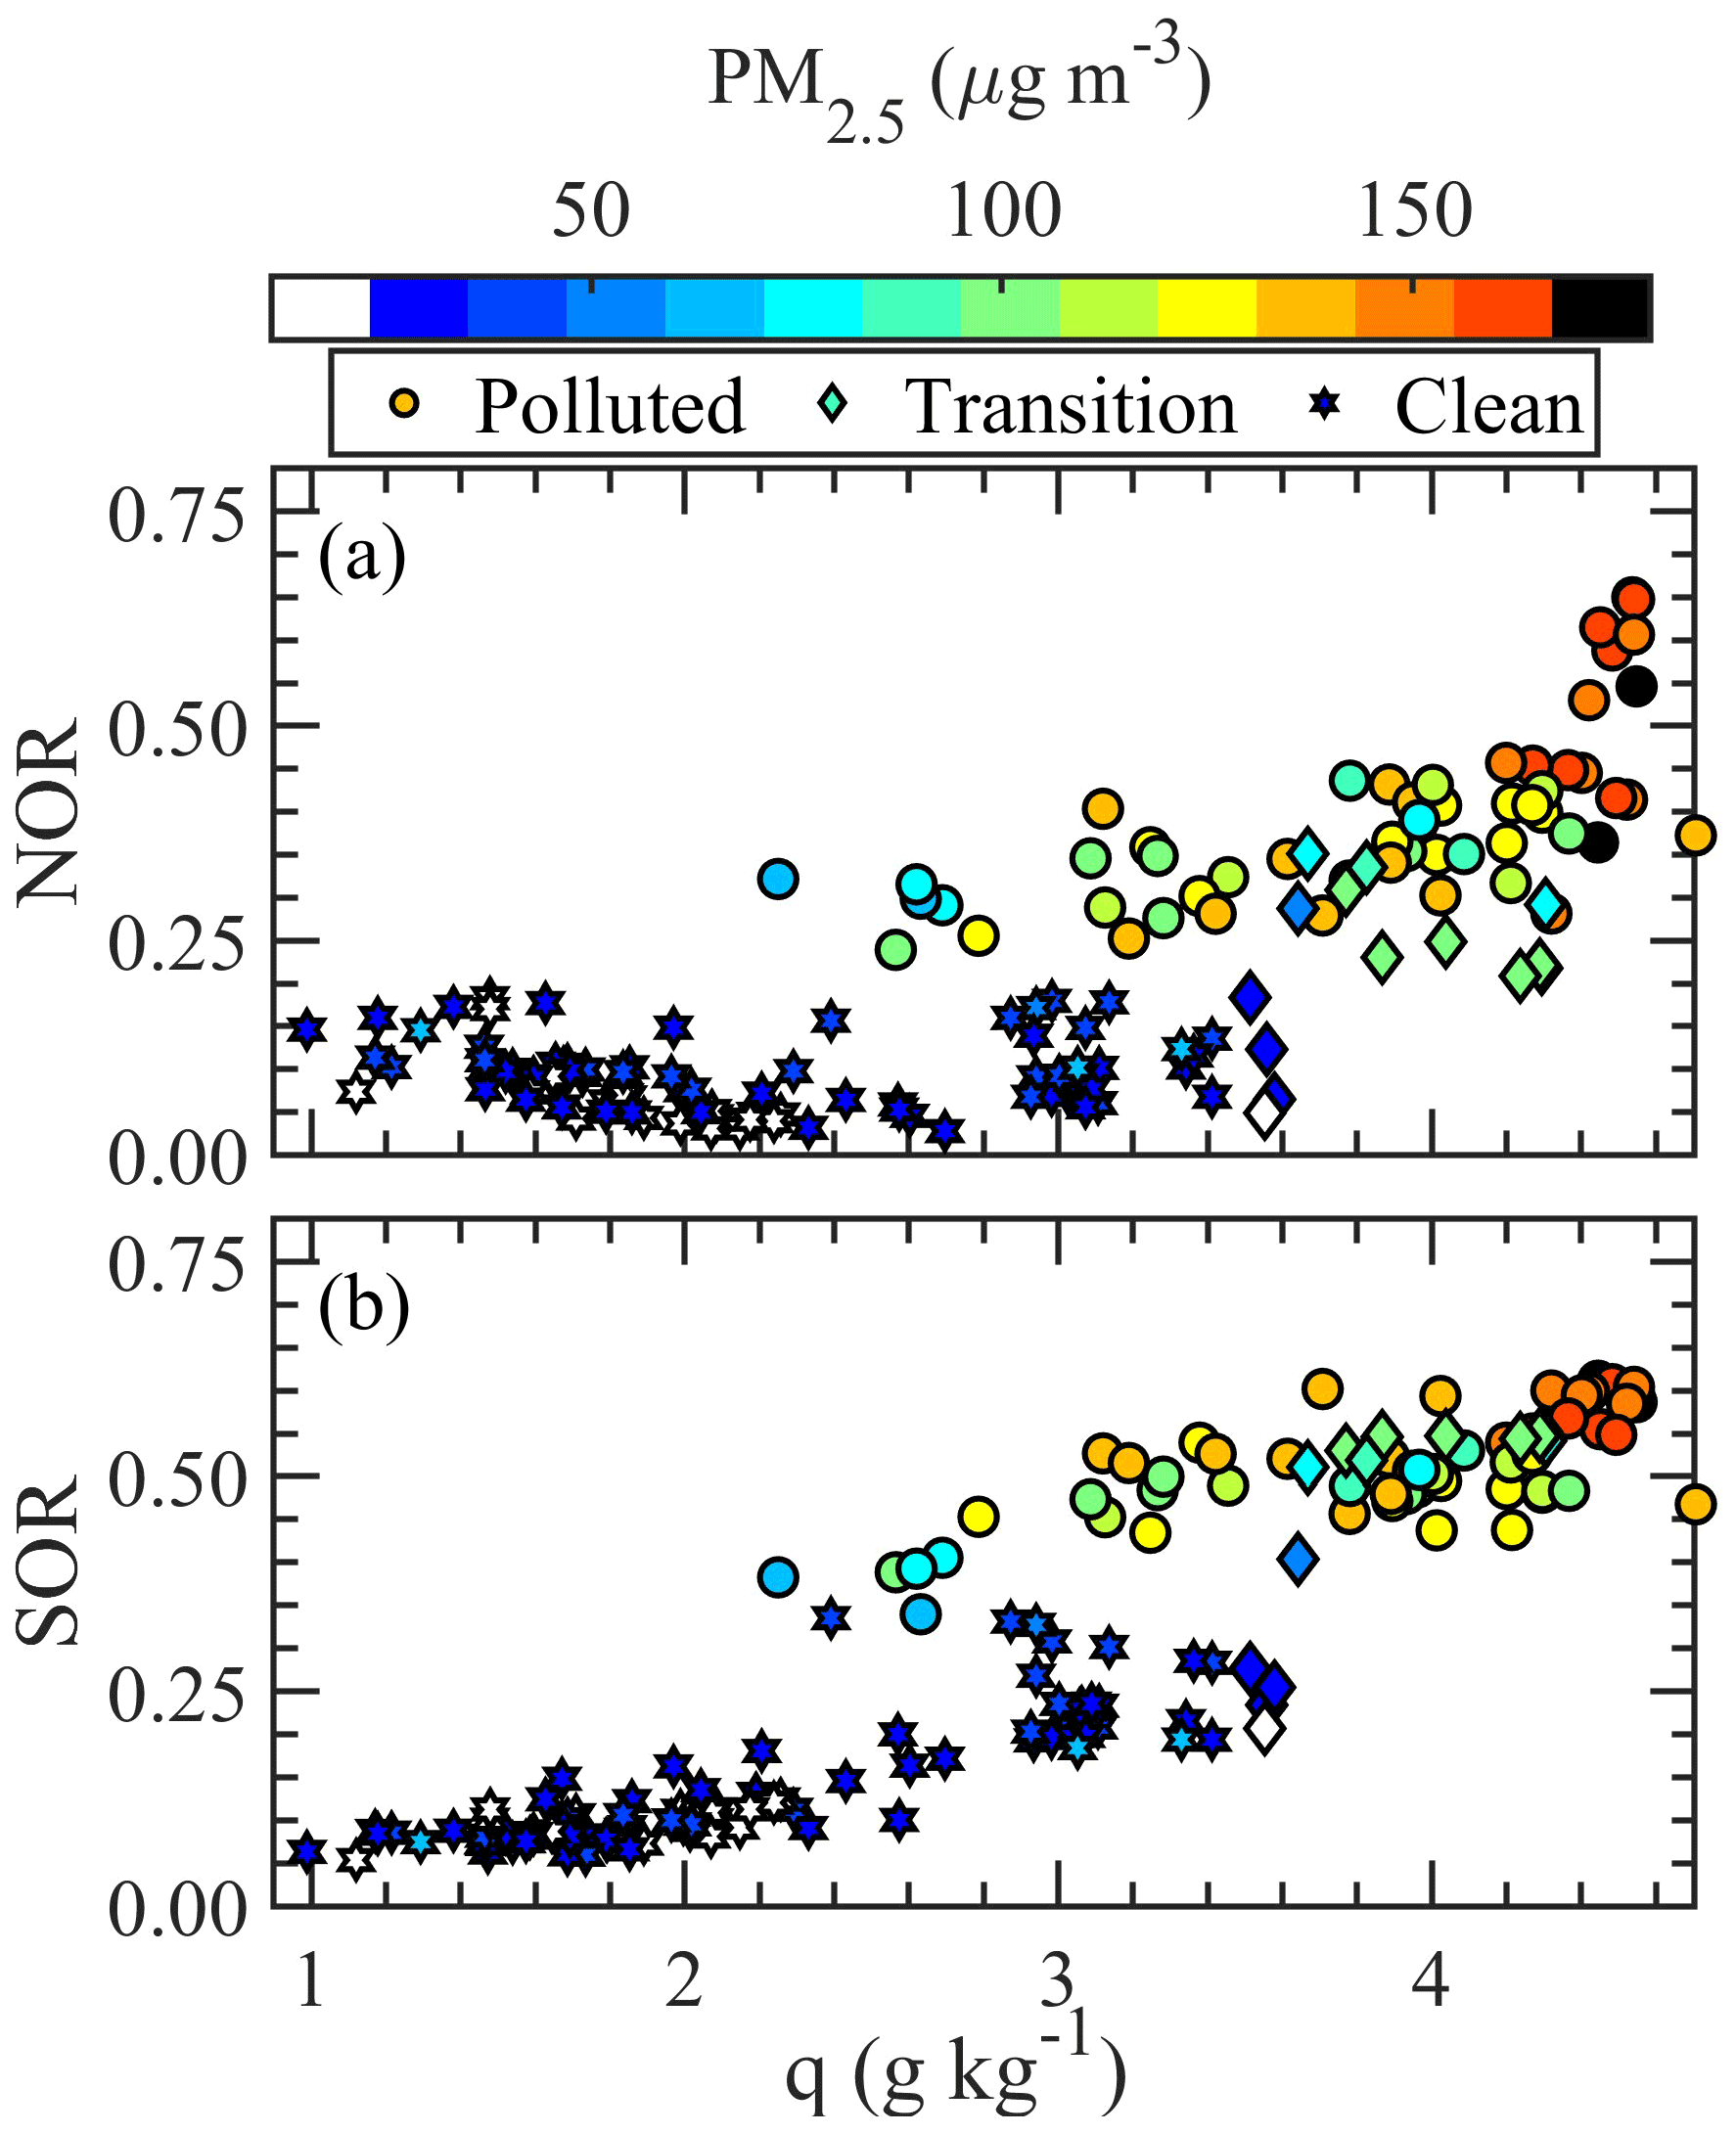
Figure 5(a) Nitrogen oxidation ratio (NOR) and (b) sulfur oxidation ratio (SOR) as a function of q based on hourly Seoul data. Points are colored by PM2.5 with shapes assigned to the three time periods in the study.
6.3 Does PM1 composition represent PM2.5 composition?
The size-resolved composition data in Incheon allow for a comparison of how the composition of PM0.94 differs from the fraction of remaining material contributing to PM2.5 (denoted PM2.5−0.94). Figure 6 shows that while the transition and clean periods exhibit differences between the apportionment of the mass between PM0.94 and PM2.5−0.94, during the polluted period the composition is essentially the same. This supports the argument that the presence of supermicrometer secondary inorganic species derives from the same processes the give rise to those compounds in PM0.94. Hence, composition measurements using instruments that exclude supermicrometer particles can be used to investigate the composition and evolution of East Asian haze events. Further, models can reliably apply PM1 composition apportionment to the full PM2.5 size range in their assessments of sources and mitigation strategies for these events. A cautionary note is that these implications apply when PM is dominated by inorganics, as with our case, with a limitation of our analysis being the lack of comprehensive size-resolved OC measurements. However, the differences evident in the transition and clean periods imply that under other atmospheric conditions PM1 composition measurements will not fully reflect the apportionment of PM2.5 aerosols. Another important conclusion from Fig. 6 is that the relative amount of PM2.5−0.94 versus PM0.94 was highest in the polluted period (39 % of speciated PM2.5 vs. 28 % for transition and 21 % for clean), further reinforcing the idea that there was increased production of secondarily formed inorganic species in the coarse mode.
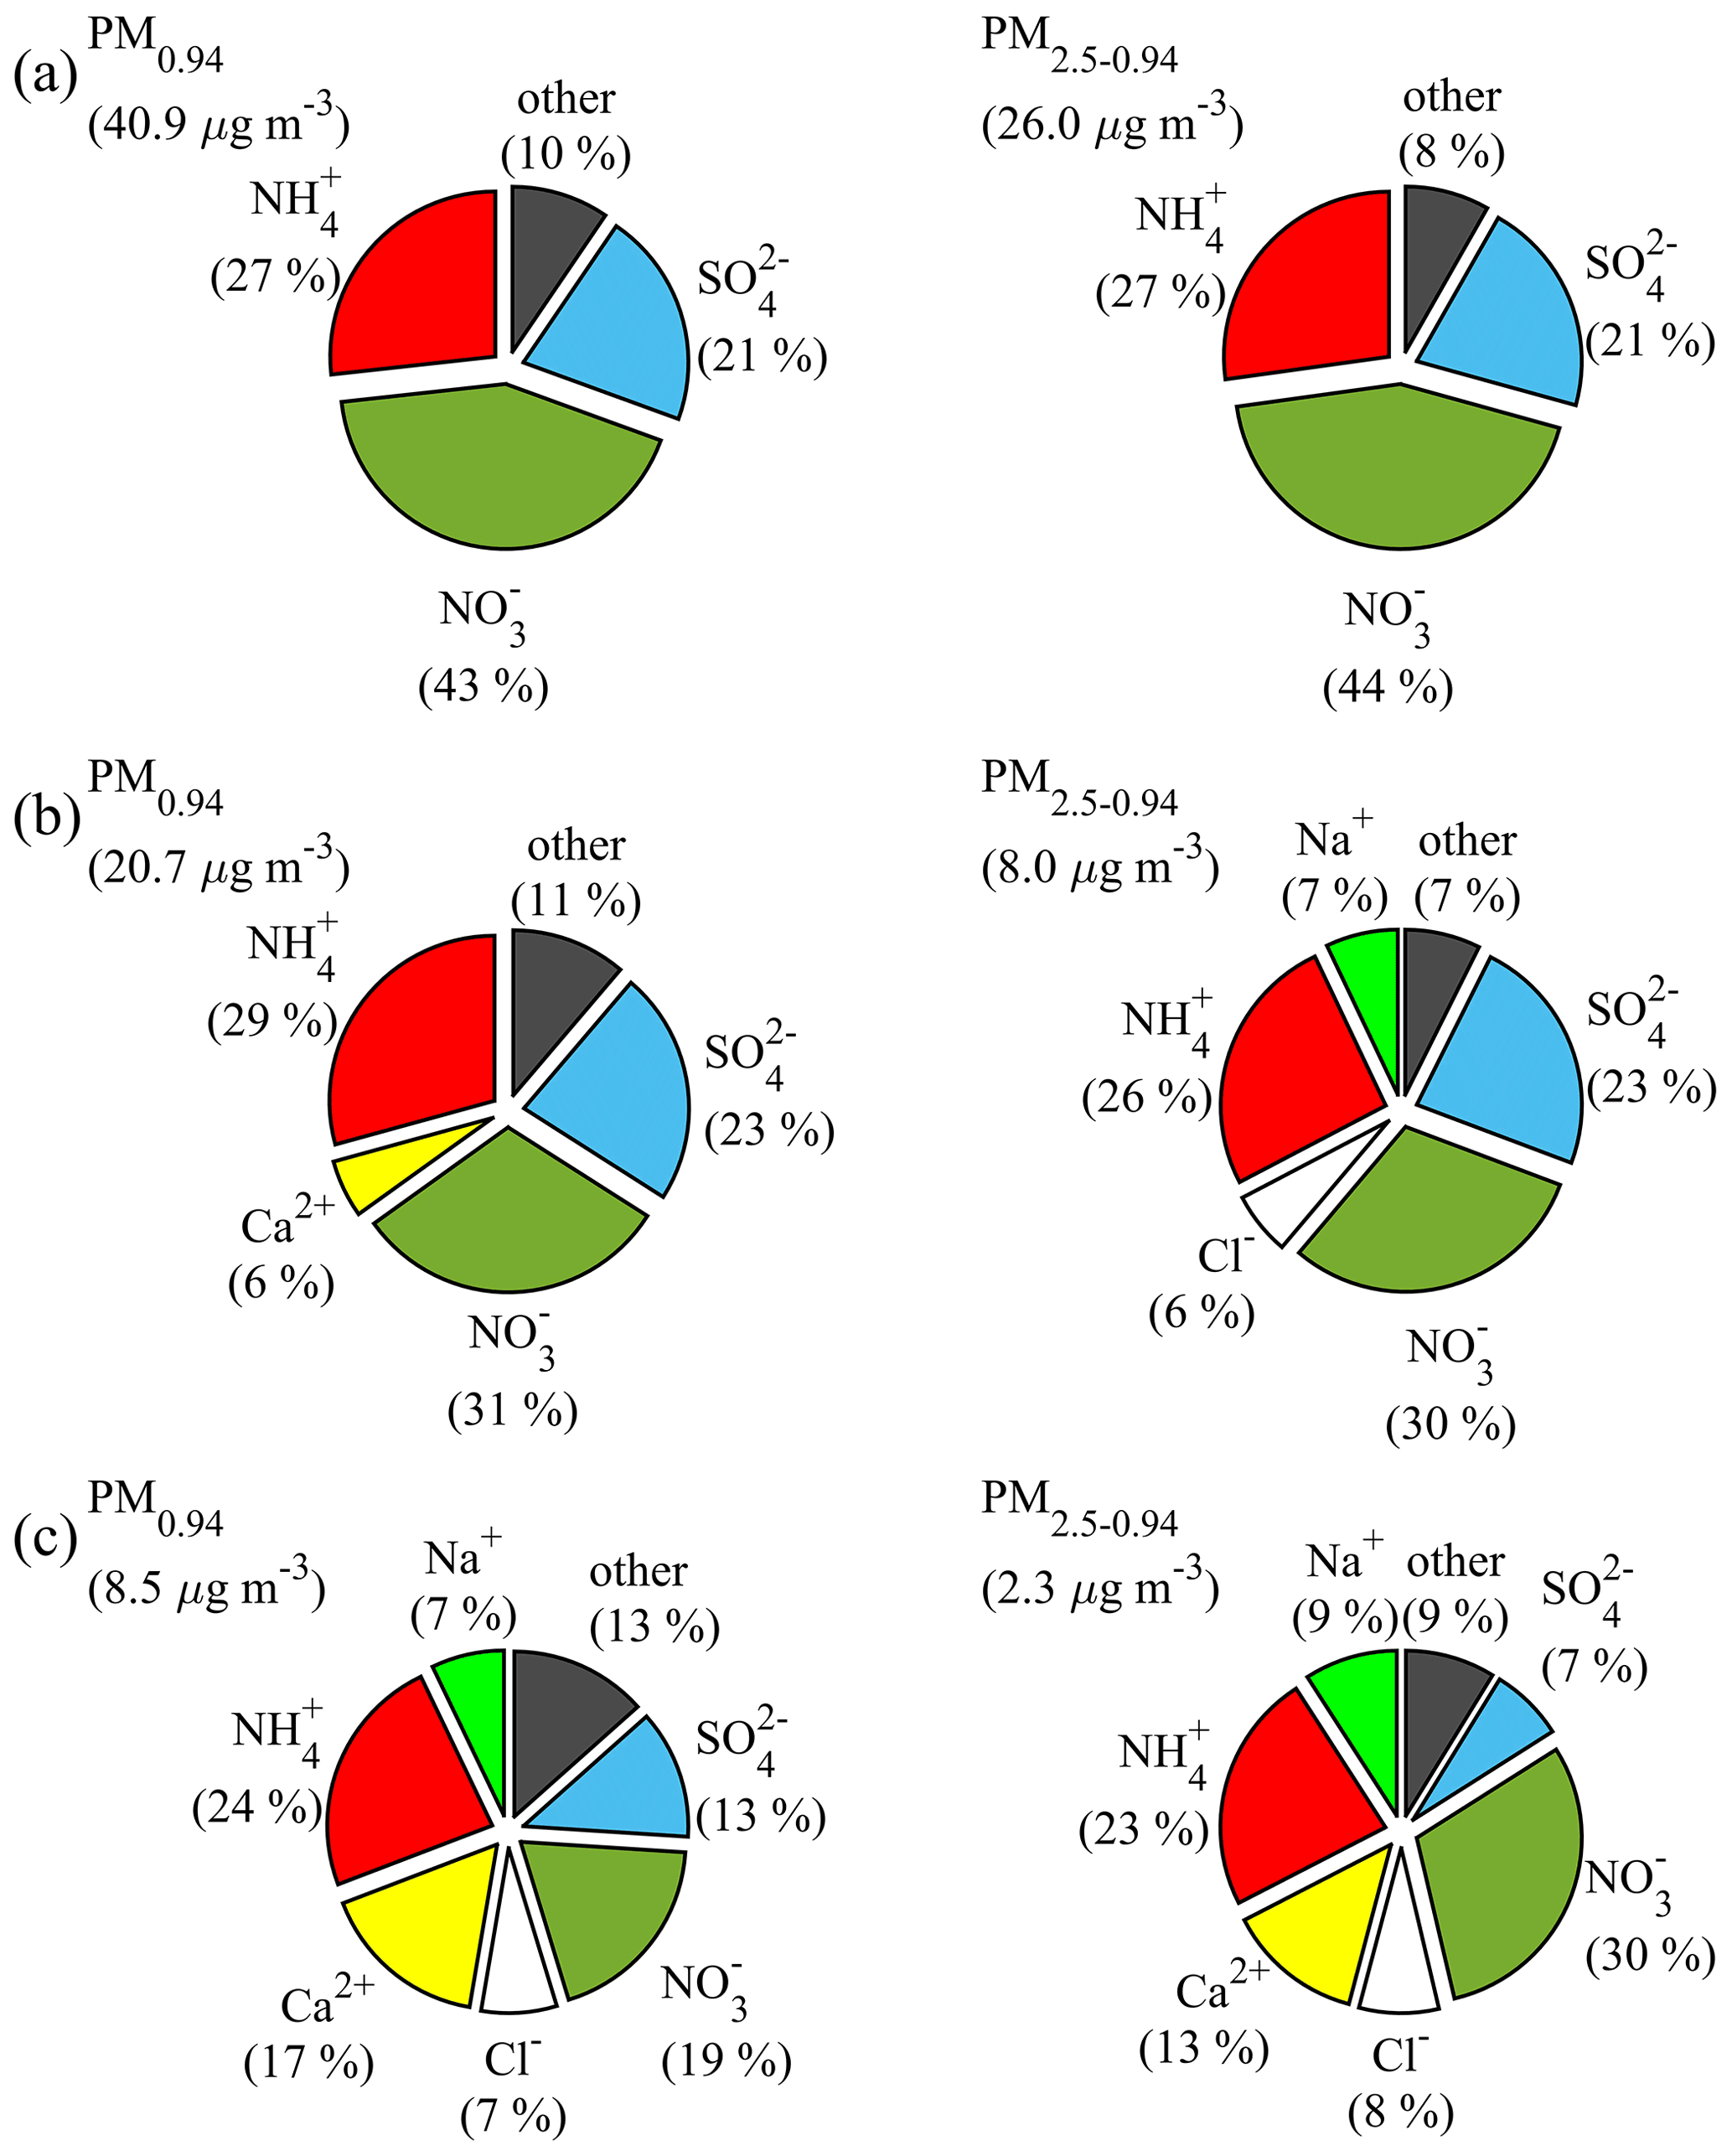
Figure 6Percent composition of (left panels) PM0.94 and (right panels) particulate mass between 0.94 and 2.50 µm (PM2.5−0.94) for the (a) polluted, (b) transition, and (c) clean periods. Any parameter with percent mass composition ≤5 % is grouped into the “other” category of each diagram. Mean mass concentrations associated with PM0.94 and PM2.5−0.94 for the three time periods (weighted by sample duration for each period) are provided next to each pie.
6.4 Nitrate-dominated haze event
Contrasting this pollution event with another one investigated during KORUS-AQ (May–June 2016) points to a difference in the relative amount of NO versus SO (Jordan et al., 2020). The KORUS-AQ event exhibited comparable amounts between the two species. Compared to that event's concentrations, NO is about an order of magnitude larger in this study, while SO is only about a factor of 2 greater. Gas-phase SO2 is comparable between the two events. The difference is most likely explained by the much lower temperatures in the March 2019 event relative to the other study, which is thermodynamically more favorable for HNO3 partitioning to the particle phase to increase NO levels (Seinfeld and Pandis, 2016). The ratio NO : SO based on the full size distribution of the Inha filter sets was ∼2.1 during the polluted period; for the Seoul PM2.5 data the ratio was ∼2.2. The relative production of NO relative to SO likely varies seasonally, with colder temperatures and higher humidity more conducive to higher NO and thus PM2.5 levels. High NO events were not particularly common, as shown especially for Beijing (Yang et al., 2017), requiring favorable conditions such as cold temperatures, high humidity, a shallow boundary layer, and high precursor levels. However, with reductions in sulfate precursor emissions, high NO events are increasingly reported in the literature (e.g., Xu et al., 2019; Zhou et al., 2022). The factors observed here in the March 2019 transboundary pollution event led to high NO levels.
This work relies on a unique dataset collected during a major transboundary pollution event that impacted the Korean peninsula in March 2019. In situ gas, aerosol, and meteorological data are compared between Incheon (coastal) and Seoul (inland) along with the use of HYSPLIT and NAAPS reanalysis data. The results reveal notable features that are important for both regulatory purposes and general understanding of aerosol transport and formation processes.
The pollution event stemmed from westerly transport under meteorological conditions that promoted secondary inorganic aerosol production in Incheon and Seoul.
Seoul exhibited significantly higher PM2.5 levels than Incheon during the polluted period, with the difference arising from some combination of local emissions and extensive secondary aerosol formation due to favorable environmental conditions: low temperatures, elevated q and RH, and a shallow boundary layer.
Secondarily produced inorganic and organic acids exhibited significant mass concentrations above 0.94 µm during the polluted period (∼40 % of total mass), and their size-resolved concentrations were highly correlated (). The lack of coarse particle influence in promoting concentrations of species like SO, NO, NH, and oxalate provided added support for the role of secondary aerosol formation assisted by high humidity. PM2.5 in Seoul and Incheon was best related to q and RH compared to other examined meteorological parameters. The higher humidities during the polluted period were coincident with increased sulfur and nitrogen oxidation ratios. This highlights the importance of heterogeneous processing and hygroscopic growth in contributing to the high supermicrometer concentrations of inorganic and organic acids in the polluted period. Increased particle size with hygroscopic growth in the humid conditions likely led to increased chemical uptake.
High values of both NO mass and NO : SO mass ratios were observed in both Incheon and Seoul, likely due to low temperatures promoting efficient NO formation.
The size distribution information from this work addresses specific concerns that have been raised about the applicability of PM1 composition datasets to understanding PM2.5 air quality exceedances in East Asian haze events. Here, we show that PM2.5 composition apportionment for water-soluble ions is fully captured by the PM1 fraction for this haze pollution event. Greater differences in the composition apportionment were observed for other atmospheric conditions after the haze period of this study. The contrast in the dominance of NO here (March 2019, T≈9 ∘C) versus the comparable amounts of NO and SO observed during the KORUS-AQ campaign haze event (May 2016, T≈20 ∘C) points to the importance of conducting measurements at different times of the year to more fully understand haze formation and its impacts on air quality. Equally important is the use of these data to rigorously test apportionment of PM2.5 composition in air quality models to ensure that the integrated impacts of transport and enhanced chemistry are adequately represented. This work contributes to the growing body of data required for ongoing model assessments of PM2.5 that will inform mitigation strategies to improve air quality in South Korea.
The sampled aerosol and meteorological data used in this study can be accessed at https://doi.org/10.6084/m9.figshare.16910686.v1 (Schlosser, 2021). The NAAPS data used in this study can be accessed at https://nrlgodae1.nrlmry.navy.mil/cgi-bin/datalist.pl?generate=summary (last access: 20 April 2022 GODAE, 2022).
The supplement related to this article is available online at: https://doi.org/10.5194/acp-22-7505-2022-supplement.
JSS, AS, CEJ, KRT, and JHC performed the analysis and prepared the paper. JY, CS, YTHL, HJS, and IHS conducted sample collection and/or analysis. All authors provided editorial support.
The contact author has declared that neither they nor their co-authors have any competing interests.
Publisher's note: Copernicus Publications remains neutral with regard to jurisdictional claims in published maps and institutional affiliations.
Incheon (Inha University) data were provided by the Particle Pollution Research and Management Center. Seoul monitoring data were provided by the National Institute of Environmental Research (NIER, NIER-2021-03-03-001). We acknowledge the use of imagery from the NASA Worldview application (https://worldview.earthdata.nasa.gov, last access: 15 November 2021), part of the NASA Earth Observing System Data and Information System (EOSDIS). The authors acknowledge the NOAA Air Resources Laboratory (ARL) for the provision of the HYSPLIT transport and dispersion model as well as the READY website (http://ready.arl.noaa.gov, last access: 27 October 2021) used in this work.
This research was supported by the FRIEND (Fine Particle Research Initiative in East Asia Considering National Differences) Project through the National Research Foundation of Korea (NRF) funded by the Ministry of Science and ICT (2020M3G1A1114626). Data analysis was funded by ONR grants N00014-21-1-2115 and N0001421WX00227. In addition, this work was supported by the Catholic University of Korea Research Fund 2021.
This paper was edited by Timothy Bertram and reviewed by two anonymous referees.
Aldhaif, A. M., Lopez, D. H., Dadashazar, H., Painemal, D., Peters, A. J., and Sorooshian, A.: An Aerosol Climatology and Implications for Clouds at a Remote Marine Site: Case Study Over Bermuda, J. Geophys. Res.-Atmos., 126, e2020JD034038, https://doi.org/10.1029/2020JD034038, 2021.
Arimoto, R., Duce, R. A., Savoie, D. L., and Prospero, J. M.: Trace elements in aerosol particles from Bermuda and Barbados: Concentrations, sources and relationships to aerosol sulfate, J. Atmos. Chem., 14, 439–457, https://doi.org/10.1007/BF00115250, 1992.
AzadiAghdam, M., Braun, R. A., Edwards, E.-L., Banaga, P. A., Cruz, M. T., Betito, G., Cambaliza, M. O., Dadashazar, H., Lorenzo, G. R., Ma, L., MacDonald, A. B., Nguyen, P., Simpas, J. B., Stahl, C., and Sorooshian, A.: On the nature of sea salt aerosol at a coastal megacity: Insights from Manila, Philippines in Southeast Asia, Atmos. Environ., 216, 116922, https://doi.org/10.1016/j.atmosenv.2019.116922, 2019.
Bolton, D.: The Computation of Equivalent Potential Temperature, Mon. Weather Rev., 108, 1046–1053, https://doi.org/10.1175/1520-0493(1980)108<1046:tcoept>2.0.co;2, 1980.
Cha, Y., Lee, S., and Lee, J.: Measurement of Black Carbon Concentration and Comparison with PM10 and PM2.5 Concentrations Monitored in Chungcheong Province, Korea, Aerosol Air Qual. Res., 19, 541–547, https://doi.org/10.4209/aaqr.2018.08.0325, 2019.
Chen, Y., Wild, O., Wang, Y., Ran, L., Teich, M., Gro, J., Wang, L., Spindler, G., Herrmann, H., van Pinxteren, D., McFiggans, G., and Wiedensohler, A.: The influence of impactor size cut-off shift caused by hygroscopic growth on particulate matter loading and composition measurements, Atmos. Environ., 195, 141–148, https://doi.org/10.1016/j.atmosenv.2018.09.049, 2018.
Cheng, Y., Zheng, G., Wei, C., Mu, Q., Zheng, B., Wang, Z., Gao, M., Zhang, Q., He, K., Carmichael, G., Pöschl, U., and Su, H.: Reactive nitrogen chemistry in aerosol water as a source of sulfate during haze events in China, Sci. Adv., 2, e1601530, https://doi.org/10.1126/sciadv.1601530, 2016.
Cho, J. H., Kim, H. S., and Chung, Y. S.: Spatio-temporal changes of PM10 trends in South Korea caused by East Asian atmospheric variability, Air Qual. Atmos. Health, 14, 1001–1016, https://doi.org/10.1007/s11869-021-00995-y, 2021.
Choi, J., Park, R. J., Lee, H.-M., Lee, S., Jo, D. S., Jeong, J. I., Henze, D. K., Woo, J.-H., Ban, S.-J., Lee, M.-D., Lim, C.-S., Park, M.-K., Shin, H. J., Cho, S., Peterson, D., and Song, C.-K.: Impacts of local vs. trans-boundary emissions from different sectors on PM2.5 exposure in South Korea during the KORUS-AQ campaign, Atmos. Environ., 203, 196–205, https://doi.org/10.1016/j.atmosenv.2019.02.008, 2019.
Choi, M., Lim, H., Kim, J., Lee, S., Eck, T. F., Holben, B. N., Garay, M. J., Hyer, E. J., Saide, P. E., and Liu, H.: Validation, comparison, and integration of GOCI, AHI, MODIS, MISR, and VIIRS aerosol optical depth over East Asia during the 2016 KORUS-AQ campaign, Atmos. Meas. Tech., 12, 4619–4641, https://doi.org/10.5194/amt-12-4619-2019, 2019.
Colbeck, I. and Harrison, R. M.: Ozone–secondary aerosol–visibility relationships in North-West England, Sci. Total Environ., 34, 87–100, 1984.
Crosbie, E., Sorooshian, A., Monfared, N. A., Shingler, T., and Esmaili, O.: A Multi-Year Aerosol Characterization for the Greater Tehran Area Using Satellite, Surface, and Modeling Data, Atmosphere, 5, 178–197, 2014.
Cruz, M. T., Bañaga, P. A., Betito, G., Braun, R. A., Stahl, C., Aghdam, M. A., Cambaliza, M. O., Dadashazar, H., Hilario, M. R., Lorenzo, G. R., Ma, L., MacDonald, A. B., Pabroa, P. C., Yee, J. R., Simpas, J. B., and Sorooshian, A.: Size-resolved composition and morphology of particulate matter during the southwest monsoon in Metro Manila, Philippines, Atmos. Chem. Phys., 19, 10675–10696, https://doi.org/10.5194/acp-19-10675-2019, 2019.
Dadashazar, H., Alipanah, M., Hilario, M. R. A., Crosbie, E., Kirschler, S., Liu, H., Moore, R. H., Peters, A. J., Scarino, A. J., Shook, M., Thornhill, K. L., Voigt, C., Wang, H., Winstead, E., Zhang, B., Ziemba, L., and Sorooshian, A.: Aerosol responses to precipitation along North American air trajectories arriving at Bermuda, Atmos. Chem. Phys., 21, 16121–16141, https://doi.org/10.5194/acp-21-16121-2021, 2021.
Eck, T. F., Holben, B. N., Kim, J., Beyersdorf, A. J., Choi, M., Lee, S., Koo, J. H., Giles, D. M., Schafer, J. S., Sinyuk, A., Peterson, D. A., Reid, J. S., Arola, A., Slutsker, I., Smirnov, A., Sorokin, M., Kraft, J., Crawford, J. H., Anderson, B. E., Thornhill, K. L., Diskin, G., Kim, S.-W., and Park, S.: Influence of cloud, fog, and high relative humidity during pollution transport events in South Korea: Aerosol properties and PM2.5 variability, Atmos. Environ., 232, 117530, https://doi.org/10.1016/j.atmosenv.2020.117530, 2020.
Ervens, B., Feingold, G., Frost, G. J., and Kreidenweis, S. M.: A modeling study of aqueous production of dicarboxylic acids: 1. Chemical pathways and speciated organic mass production, J. Geophys. Res.-Atmos., 109, D15205, https://doi.org/10.1029/2003JD004387, 2004.
Fishman, J. and Seiler, W.: Correlative nature of ozone and carbon monoxide in the troposphere: Implications for the tropospheric ozone budget, J. Geophys. Res. Oceans, 88, 3662–3670, https://doi.org/10.1029/JC088iC06p03662, 1983.
Gelaro, R., McCarty, W., Suarez, M. J., Todling, R., Molod, A., Takacs, L., Randles, C., Darmenov, A., Bosilovich, M. G., Reichle, R., Wargan, K., Coy, L., Cullather, R., Draper, C., Akella, S., Buchard, V., Conaty, A., da Silva, A., Gu, W., Kim, G.-K., Koster, R., Lucchesi, R., Merkova, D., Nielsen, J. E., Partyka, G., Pawson, S., Putman, W., Rienecker, M., Schubert, S. D., Sienkiewicz, M., and Zhao, B.: The Modern-Era Retrospective Analysis for Research and Applications, Version 2 (MERRA-2), J. Climate, 30, 5419–5454, https://doi.org/10.1175/JCLI-D-16-0758.1, 2017.
GMAO: MERRA-2 tavg1_2d_flx_Nx: 2d, 1-Hourly, Time-Averaged, Single-Level, Assimilation, Surface Flux Diagnostics V5.12.4, in: DISC, edited by: G. E. S. D. a. I. S. C. G., Greenbelt, MD, https://doi.org/10.5067/7MCPBJ41Y0K6, 2015.
GODAE (Global Ocean Data Assimilation Experiment): USGODAE Data Catalog – Summary View, [data set], https://nrlgodae1.nrlmry.navy.mil/cgi-bin/datalist.pl?generate=summary, last access: 20 April 2022.
Guttikunda, S. K., Carmichael, G. R., Calori, G., Eck, C., and Woo, J.-H.: The contribution of megacities to regional sulfur pollution in Asia, Atmos. Environ., 37, 11–22, https://doi.org/10.1016/S1352-2310(02)00821-X, 2003.
Halliday, H. S., DiGangi, J. P., Choi, Y., Diskin, G. S., Pusede, S. E., Rana, M., Nowak, J. B., Knote, C., Ren, X., He, H., Dickerson, R. R., and Li, Z.: Using Short-Term CO/CO2 Ratios to Assess Air Mass Differences Over the Korean Peninsula During KORUS-AQ, J. Geophys. Res.-Atmos., 124, 10951–10972, https://doi.org/10.1029/2018JD029697, 2019.
Heim, E. W., Dibb, J., Scheuer, E., Jost, P. C., Nault, B. A., Jimenez, J. L., Peterson, D., Knote, C., Fenn, M., Hair, J., Beyersdorf, A. J., Corr, C., and Anderson, B. E.: Asian dust observed during KORUS-AQ facilitates the uptake and incorporation of soluble pollutants during transport to South Korea, Atmos. Environ., 224, 117305, https://doi.org/10.1016/j.atmosenv.2020.117305, 2020.
Hennigan, C. J., Bergin, M. H., Dibb, J. E., and Weber, R. J.: Enhanced secondary organic aerosol formation due to water uptake by fine particles, Geophys. Res. Lett., 35, L18801, https://doi.org/10.1029/2008GL035046, 2008.
Hennigan, C. J., Bergin, M. H., Russell, A. G., Nenes, A., and Weber, R. J.: Gas/particle partitioning of water-soluble organic aerosol in Atlanta, Atmos. Chem. Phys., 9, 3613–3628, https://doi.org/10.5194/acp-9-3613-2009, 2009.
Hersey, S. P., Garland, R. M., Crosbie, E., Shingler, T., Sorooshian, A., Piketh, S., and Burger, R.: An overview of regional and local characteristics of aerosols in South Africa using satellite, ground, and modeling data, Atmos. Chem. Phys., 15, 4259–4278, https://doi.org/10.5194/acp-15-4259-2015, 2015.
Hilario, M. R. A., Crosbie, E., Banaga, P. A., Betito, G., Braun, R. A., Cambaliza, M. O., Corral, A. F., Cruz, M. T., Dibb, J. E., Lorenzo, G. R., MacDonald, A. B., Robinson, C. E., Shook, M. A., Simpas, J. B., Stahl, C., Winstead, E., Ziemba, L. D., and Sorooshian, A.: Particulate Oxalate-To-Sulfate Ratio as an Aqueous Processing Marker: Similarity Across Field Campaigns and Limitations, Geophys. Res. Lett., 48, e2021GL096520, https://doi.org/10.1029/2021GL096520, 2021a.
Hilario, M. R. A., Crosbie, E., Shook, M., Reid, J. S., Cambaliza, M. O. L., Simpas, J. B. B., Ziemba, L., DiGangi, J. P., Diskin, G. S., Nguyen, P., Turk, F. J., Winstead, E., Robinson, C. E., Wang, J., Zhang, J., Wang, Y., Yoon, S., Flynn, J., Alvarez, S. L., Behrangi, A., and Sorooshian, A.: Measurement report: Long-range transport patterns into the tropical northwest Pacific during the CAMP2Ex aircraft campaign: chemical composition, size distributions, and the impact of convection, Atmos. Chem. Phys., 21, 3777–3802, https://doi.org/10.5194/acp-21-3777-2021, 2021b.
Hogan, T. F., Liu, M., Ridout, J. A., Peng, M. S., Whitcomb, T. R., Ruston, B. C., Reynolds, C. A., Eckermann, S. D., Moskaitis, J. R., Baker, N. L., McCormack, J. P., Viner, K. C., McLay, J. G., Flatau, M. K., Xu, L., Chen, C., and Chang, S. W.: The Navy Global Environmental Model, Oceanography, 27, 116–125, 2014.
Hu, J., Wang, Y., Ying, Q., and Zhang, H.: Spatial and temporal variability of PM2.5 and PM10 over the North China Plain and the Yangtze River Delta, China, Atmos. Environ., 95, 598–609, https://doi.org/10.1016/j.atmosenv.2014.07.019, 2014.
Huang, R.-J., Zhang, Y., Bozzetti, C., Ho, K.-F., Cao, J.-J., Han, Y., Daellenbach, K. R., Slowik, J. G., Platt, S. M., Canonaco, F., Zotter, P., Wolf, R., Pieber, S. M., Bruns, E. A., Crippa, M., Ciarelli, G., Piazzalunga, A., Schwikowski, M., Abbaszade, G., Schnelle-Kreis, J., Zimmermann, R., An, Z., Szidat, S., Baltensperger, U., Haddad, I. E., and Prevot, A. S. H.: High secondary aerosol contribution to particulate pollution during haze events in China, Nature, 514, 218–222, https://doi.org/10.1038/nature13774, 2014.
Huang, R.-J., He, Y., Duan, J., Li, Y., Chen, Q., Zheng, Y., Chen, Y., Hu, W., Lin, C., Ni, H., Dai, W., Cao, J., Wu, Y., Zhang, R., Xu, W., Ovadnevaite, J., Ceburnis, D., Hoffmann, T., and O'Dowd, C. D.: Contrasting sources and processes of particulate species in haze days with low and high relative humidity in wintertime Beijing, Atmos. Chem. Phys., 20, 9101–9114, https://doi.org/10.5194/acp-20-9101-2020, 2020.
Hyer, E. J., Reid, J. S., and Zhang, J.: An over-land aerosol optical depth data set for data assimilation by filtering, correction, and aggregation of MODIS Collection 5 optical depth retrievals, Atmos. Meas. Tech., 4, 379–408, https://doi.org/10.5194/amt-4-379-2011, 2011.
Jeon, W., Park, J., Choi, Y., Mun, J., Kim, D., Kim, C.-H., Lee, H.-J., Bak, J., and Jo, H.-Y.: The mechanism of the formation of high sulfate concentrations over the Yellow Sea during the KORUS-AQ period: The effect of transport/atmospheric chemistry and ocean emissions, Atmos. Res., 261, 105756, https://doi.org/10.1016/j.atmosres.2021.105756, 2021.
Ji, Y., Qin, X., Wang, B., Xu, J., Shen, J., Chen, J., Huang, K., Deng, C., Yan, R., Xu, K., and Zhang, T.: Counteractive effects of regional transport and emission control on the formation of fine particles: a case study during the Hangzhou G20 summit, Atmos. Chem. Phys., 18, 13581–13600, https://doi.org/10.5194/acp-18-13581-2018, 2018.
Jordan, C. E., Crawford, J. H., Beyersdorf, A. J., Eck, T. F., Halliday, H. S., Nault, B. A., Chang, L.-S., Park, J., Park, R., Lee, G., Kim, H., Ahn, J.-y., Cho, S., Shin, H. J., Lee, J. H., Jung, J., Kim, D.-S., Lee, M., Lee, T., Whitehill, A., Szykman, J., Schueneman, M. K., Campuzano-Jost, P., Jimenez, J. L., DiGangi, J. P., Diskin, G. S., Anderson, B. E., Moore, R. H., Ziemba, L. D., Fenn, M. A., Hair, J. W., Kuehn, R. E., Holz, R. E., Chen, G., Travis, K., Shook, M., Peterson, D. A., Lamb, K. D., and Schwarz, J. P.: Investigation of factors controlling PM2.5 variability across the South Korean Peninsula during KORUS-AQ, Elementa, 8, https://doi.org/10.1525/elementa.424, 2020.
Kaneyasu, N., Ohta, S., and Murao, N.: Seasonal variation in the chemical composition of atmospheric aerosols and gaseous species in Sapporo, Japan, Atmos. Environ., 29, 1559–1568, https://doi.org/10.1016/1352-2310(94)00356-P, 1995.
Kim, H.-S., Chung, Y.-S., and Lee, S.-G.: Characteristics of aerosol types during large-scale transport of air pollution over the Yellow Sea region and at Cheongwon, Korea, in 2008, Environ. Monit. Assess., 184, 1973–1984, https://doi.org/10.1007/s10661-011-2092-9, 2012.
Kim, Y. P. and Lee, G.: Trend of Air Quality in Seoul: Policy and Science, Aerosol Air Qual. Res., 18, 2141–2156, https://doi.org/10.4209/aaqr.2018.03.0081, 2018.
Koo, J.-H., Kim, J., Lee, Y. G., Park, S. S., Lee, S., Chong, H., Cho, Y., Kim, J., Choi, K., and Lee, T.: The implication of the air quality pattern in South Korea after the COVID-19 outbreak, Sci. Rep., 10, 22462, https://doi.org/10.1038/s41598-020-80429-4, 2020.
Koo, Y.-S., Yun, H.-Y., Choi, D.-R., Han, J.-S., Lee, J.-B., and Lim, Y.-J.: An analysis of chemical and meteorological characteristics of haze events in the Seoul metropolitan area during January 12–18, 2013, Atmos. Environ., 178, 87–100, https://doi.org/10.1016/j.atmosenv.2018.01.037, 2018.
Lamb, K. D., Perring, A. E., Samset, B., Peterson, D., Davis, S., Anderson, B. E., Beyersdorf, A., Blake, D. R., Campuzano-Jost, P., Corr, C. A., Diskin, G. S., Kondo, Y., Moteki, N., Nault, B. A., Oh, J., Park, M., Pusede, S. E., Simpson, I. J., Thornhill, K. L., Wisthaler, A., and Schwarz, J. P.: Estimating Source Region Influences on Black Carbon Abundance, Microphysics, and Radiative Effect Observed Over South Korea, J. Geophys. Res.-Atmos., 123, 13527–513548, https://doi.org/10.1029/2018JD029257, 2018.
Lee, J. Y. and Kim, Y. P.: Source apportionment of the particulate PAHs at Seoul, Korea: impact of long range transport to a megacity, Atmos. Chem. Phys., 7, 3587–3596, https://doi.org/10.5194/acp-7-3587-2007, 2007.
Lee, D., Choi, J.-Y., Myoung, J., Kim, O., Park, J., Shin, H.-J., Ban, S.-J., Park, H.-J., and Nam, K.-P.: Analysis of a Severe PM2.5 Episode in the Seoul Metropolitan Area in South Korea from 27 February to 7 March 2019: Focused on Estimation of Domestic and Foreign Contribution, Atmosphere, 10, 756, https://doi.org/10.3390/atmos10120756, 2019.
Lee, S., Hong, J., Cho, Y., Choi, M., Kim, J., Park, S. S., Ahn, J.-Y., Kim, S.-K., Moon, K.-J., Eck, T. F., Holben, B. N., and Koo, J.-H.: Characteristics of Classified Aerosol Types in South Korea during the MAPS-Seoul Campaign, Aerosol Air Qual. Res., 18, 2195–2206, https://doi.org/10.4209/aaqr.2017.11.0474, 2018.
Lee, S., Kim, J., Choi, M., Hong, J., Lim, H., Eck, T. F., Holben, B. N., Ahn, J.-Y., Kim, J., and Koo, J.-H.: Analysis of long-range transboundary transport (LRTT) effect on Korean aerosol pollution during the KORUS-AQ campaign, Atmos. Environ., 204, 53–67, https://doi.org/10.1016/j.atmosenv.2019.02.020, 2019.
Lee, S., Kim, M., Kim, S.-Y., Lee, D.-W., Lee, H., Kim, J., Le, S., and Liu, Y.: Assessment of long-range transboundary aerosols in Seoul, South Korea from Geostationary Ocean Color Imager (GOCI) and ground-based observations, Environ. Pollut., 269, 115924, https://doi.org/10.1016/j.envpol.2020.115924, 2021.
Lee, Y.-N., Weber, R., Ma, Y., Orsini, D., Maxwell-Meier, K., Blake, D., Meinardi, S., Sachse, G., Harward, C., Chen, T.-Y., Thornton, D., Tu, F.-H., and Bandy, A.: Airborne measurement of inorganic ionic components of fine aerosol particles using the particle-into-liquid sampler coupled to ion chromatography technique during ACE-Asia and TRACE-P, J. Geophys. Res.-Atmos., 108, 8646, https://doi.org/10.1029/2002JD003265, 2003.
Lennartson, E. M., Wang, J., Gu, J., Castro Garcia, L., Ge, C., Gao, M., Choi, M., Saide, P. E., Carmichael, G. R., Kim, J., and Janz, S. J.: Diurnal variation of aerosol optical depth and PM2.5 in South Korea: a synthesis from AERONET, satellite (GOCI), KORUS-AQ observation, and the WRF-Chem model, Atmos. Chem. Phys., 18, 15125–15144, https://doi.org/10.5194/acp-18-15125-2018, 2018.
Li, J., Zhang, Y.-L., Cao, F., Zhang, W., Fan, M., Lee, X., and Michalski, G.: Stable Sulfur Isotopes Revealed a Major Role of Transition-Metal Ion-Catalyzed SO2 Oxidation in Haze Episodes, Environ. Sci. Technol., 54, 2626–2634, https://doi.org/10.1021/acs.est.9b07150, 2020.
Li, K., Chen, L., White, S. J., Zheng, X., Lv, B., Lin, C., Bao, Z., Wu, X., Gao, X., Ying, F., Shen, J., Azzi, M., and Cen, K.: Chemical characteristics and sources of PM1 during the 2016 summer in Hangzhou, Environ. Pollut., 232, 42–54, https://doi.org/10.1016/j.envpol.2017.09.016, 2018.
Lynch, P., Reid, J. S., Westphal, D. L., Zhang, J., Hogan, T. F., Hyer, E. J., Curtis, C. A., Hegg, D. A., Shi, Y., Campbell, J. R., Rubin, J. I., Sessions, W. R., Turk, F. J., and Walker, A. L.: An 11-year global gridded aerosol optical thickness reanalysis (v1.0) for atmospheric and climate sciences, Geosci. Model Dev., 9, 1489–1522, https://doi.org/10.5194/gmd-9-1489-2016, 2016.
MacDonald, A. B., Dadashazar, H., Chuang, P. Y., Crosbie, E., Wang, H., Wang, Z., Jonsson, H. H., Flagan, R. C., Seinfeld, J. H., and Sorooshian, A.: Characteristic Vertical Profiles of Cloud Water Composition in Marine Stratocumulus Clouds and Relationships With Precipitation, J. Geophys. Res.-Atmos., 123, 3704–3723, https://doi.org/10.1002/2017JD027900, 2018.
Maudlin, L. C., Wang, Z., Jonsson, H. H., and Sorooshian, A.: Impact of wildfires on size-resolved aerosol composition at a coastal California site, Atmos. Environ., 119, 59–68, https://doi.org/10.1016/j.atmosenv.2015.08.039, 2015.
Mora, M., Braun, R. A., Shingler, T., and Sorooshian, A.: Analysis of remotely sensed and surface data of aerosols and meteorology for the Mexico Megalopolis Area between 2003 and 2015, J. Geophys. Res.-Atmos., 122, 8705–8723, https://doi.org/10.1002/2017JD026739, 2017.
Nault, B. A., Campuzano-Jost, P., Day, D. A., Schroder, J. C., Anderson, B., Beyersdorf, A. J., Blake, D. R., Brune, W. H., Choi, Y., Corr, C. A., de Gouw, J. A., Dibb, J., DiGangi, J. P., Diskin, G. S., Fried, A., Huey, L. G., Kim, M. J., Knote, C. J., Lamb, K. D., Lee, T., Park, T., Pusede, S. E., Scheuer, E., Thornhill, K. L., Woo, J.-H., and Jimenez, J. L.: Secondary organic aerosol production from local emissions dominates the organic aerosol budget over Seoul, South Korea, during KORUS-AQ, Atmos. Chem. Phys., 18, 17769–17800, https://doi.org/10.5194/acp-18-17769-2018, 2018.
Population Statistics: https://kosis.kr, last access: 15 September 2021.
Paciga, A. L., Riipinen, I., and Pandis, S. N.: Effect of Ammonia on the Volatility of Organic Diacids, Environ. Sci. Technol., 48, 13769–13775, https://doi.org/10.1021/es5037805, 2014.
Park, G., Kim, K., Park, T., Kang, S., Ban, J., Choi, S., Yu, D.-G., Lee, S., Lim, Y., Kim, S., Mun, S., Woo, J.-H., Jeon, C.-S., and Lee, T.: Primary and secondary aerosols in small passenger vehicle emissions: Evaluation of engine technology, driving conditions, and regulatory standards, Environ. Pollut., 286, 117195, https://doi.org/10.1016/j.envpol.2021.117195, 2021.
Park, I.-S., Park, M.-S., Jang, Y. W., Kim, H.-K., Song, C.-K., Owen, J. S., Kim, S.-H., Cho, C.-R., and Kim, C.-H.: Impact Comparison of Synoptic Meteorology and Nationwide/local Emissions on the Seoul Metropolitan Area during High PM Multi-event and Non-event Days, Asian J. Atmos. Environ., 14, 263–279, https://doi.org/10.5572/ajae.2020.14.3.263, 2020.
Park, S.-M., Song, I.-H., Park, J. S., Oh, J., Moon, K. J., Shin, H. J., Ahn, J. Y., Lee, M.-D., Kim, J., and Lee, G.: Variation of PM2.5 Chemical Compositions and their Contributions to Light Extinction in Seoul, Aerosol Air Qual. Res., 18, 2220–2229, https://doi.org/10.4209/aaqr.2017.10.0369, 2018.
Park, S., Thi Hong, H. D., Cho, S. Y., and Bae, M.-S.: Chemical Composition and Light Absorption of PM2.5 Observed at Two Sites near a Busy Road during Summer and Winter, Appl. Sci., 10, 4858, https://doi.org/10.3390/app10144858, 2020.
Peterson, D. A., Hyer, E. J., Han, S.-O., Crawford, J. H., Park, R. J., Holz, R., Kuehn, R. E., Eloranta, E., Knote, C., Jordan, C. E., and Lefer, B. L.: Meteorology influencing springtime air quality, pollution transport, and visibility in Korea, Elementa, 7, 57, https://doi.org/10.1525/elementa.395, 2019.
Quan, J., Liu, Q., Li, X., Gao, Y., Jia, X., Sheng, J., and Liu, Y.: Effect of heterogeneous aqueous reactions on the secondary formation of inorganic aerosols during haze events, Atmos. Environ., 122, 306–312, https://doi.org/10.1016/j.atmosenv.2015.09.068, 2015.
Rolph, G., Stein, A., and Stunder, B.: Real-time Environmental Applications and Display sYstem: READY, Environ. Model Softw., 95, 210–228, https://doi.org/10.1016/j.envsoft.2017.06.025, 2017.
Ryu, Y.-H. and Min, S.-K.: Long-term evaluation of atmospheric composition reanalyses from CAMS, TCR-2, and MERRA-2 over South Korea: Insights into applications, implications, and limitations, Atmos. Environ., 246, 118062, https://doi.org/10.1016/j.atmosenv.2020.118062, 2021.
Ryu, Y.-H., Min, S.-K., and Hodzic, A.: Recent Decreasing Trends in Surface PM2.5 over East Asia in the Winter-spring Season: Different Responses to Emissions and Meteorology between Upwind and Downwind Regions, Aerosol Air Qual. Res., 21, 200654, https://doi.org/10.4209/aaqr.200654, 2021.
Schlosser, J.: Dataset for “Evidence of haze-driven secondary production of supermicrometer aerosol nitrate and sulfate in size distribution data in South Korea”, [data set], https://doi.org/10.6084/m9.figshare.16910686.v1, 2021.
Seinfeld, J. H. and Pandis, S. N.: Atmospheric Chemistry and Physics: From Air Pollution to Climate Change, 2nd Edition, John Wiley & Sons, New York, ISBN-13 978-0471720188, ISBN-10 0471720186, 2006.
Seo, J., Park, D.-S. R., Kim, J. Y., Youn, D., Lim, Y. B., and Kim, Y.: Effects of meteorology and emissions on urban air quality: a quantitative statistical approach to long-term records (1999–2016) in Seoul, South Korea, Atmos. Chem. Phys., 18, 16121–16137, https://doi.org/10.5194/acp-18-16121-2018, 2018.
Seo, J., Lim, Y. B., Youn, D., Kim, J. Y., and Jin, H. C.: Synergistic enhancement of urban haze by nitrate uptake into transported hygroscopic particles in the Asian continental outflow, Atmos. Chem. Phys., 20, 7575–7594, https://doi.org/10.5194/acp-20-7575-2020, 2020.
Shao, J., Chen, Q., Wang, Y., Lu, X., He, P., Sun, Y., Shah, V., Martin, R. V., Philip, S., Song, S., Zhao, Y., Xie, Z., Zhang, L., and Alexander, B.: Heterogeneous sulfate aerosol formation mechanisms during wintertime Chinese haze events: air quality model assessment using observations of sulfate oxygen isotopes in Beijing, Atmos. Chem. Phys., 19, 6107–6123, https://doi.org/10.5194/acp-19-6107-2019, 2019.
Sorooshian, A., Varutbangkul, V., Brechtel, F. J., Ervens, B., Feingold, G., Bahreini, R., Murphy, S. M., Holloway, J. S., Atlas, E. L., Buzorius, G., Jonsson, H., Flagan, R. C., and Seinfeld, J. H.: Oxalic acid in clear and cloudy atmospheres: Analysis of data from International Consortium for Atmospheric Research on Transport and Transformation 2004, J. Geophys. Res.-Atmos., 111, D23S45, https://doi.org/10.1029/2005JD006880, 2006.
Sorooshian, A., Lu, M.-L., Brechtel, F. J., Jonsson, H., Feingold, G., Flagan, R. C., and Seinfeld, J. H.: On the Source of Organic Acid Aerosol Layers above Clouds, Environ. Sci. Technol., 41, 4647–4654, https://doi.org/10.1021/es0630442, 2007.
Sorooshian, A., Murphy, S. M., Hersey, S., Bahreini, R., Jonsson, H., Flagan, R. C., and Seinfeld, J. H.: Constraining the contribution of organic acids and AMS 44 to the organic aerosol budget: On the importance of meteorology, aerosol hygroscopicity, and region, Geophys. Res. Lett., 37, L21807, https://doi.org/10.1029/2010GL044951, 2010.
Stahl, C., Cruz, M. T., Banaga, P. A., Betito, G., Braun, R. A., Aghdam, M. A., Cambaliza, M. O., Lorenzo, G. R., MacDonald, A. B., Pabroa, P. C., Yee, J. R., Simpas, J. B., and Sorooshian, A.: An annual time series of weekly size-resolved aerosol properties in the megacity of Metro Manila, Philippines, Sci. Data, 7, 128, https://doi.org/10.1038/s41597-020-0466-y, 2020.
Stein, A. F., Draxler, R. R., Rolph, G. D., Stunder, B. J. B., Cohen, M. D., and Ngan, F.: NOAA's hysplit atmospheric transport and dispersion modeling system, B. Am. Meteorol. Soc., 12, 2059–2077, 2015.
Wang, G., Zhang, R., Gomez, M. E., Yang, L., Levy Zamora, M., Hu, M., Lin, Y., Peng, J., Guo, S., Meng, J., Li, J., Cheng, C., Hu, T., Ren, Y., Wang, Y., Gao, J., Cao, J., An, Z., Zhou, W., Li, G., Wang, J., Tian, P., Marrero-Ortiz, W., Secrest, J., Du, Z., Zheng, J., Shang, D., Zeng, L., Shao, M., Wang, W., Huang, Y., Wang, Y., Zhu, Y., Li, Y., Hu, J., Pan, B., Cai, L., Cheng, Y., Ji, Y., Zhang, F., Rosenfeld, D., Liss, P. S., Duce, R. A., Kolb, C. E., and Molina, M. J.: Persistent sulfate formation from London Fog to Chinese haze, P. Natl. Acad. Sci. USA., 113, 13630–13635, https://doi.org/10.1073/pnas.1616540113, 2016.
Wang, J., Li, J., Ye, J., Zhao, J., Wu, Y., Hu, J., Liu, D., Nie, D., Shen, F., Huang, X., Huang, D. D., Ji, D., Sun, X., Xu, W., Guo, J., Song, S., Qin, Y., Liu, P., Turner, J. R., Lee, H. C., Hwang, S., Liao, H., Martin, S. T., Zhang, Q., Chen, M., Sun, Y., Ge, X., and Jacob, D. J.: Fast sulfate formation from oxidation of SO2 by NO2 and HONO observed in Beijing haze, Nat. Commun., 11, 2844, https://doi.org/10.1038/s41467-020-16683-x, 2020.
Weinstock, B.: Carbon Monoxide: Residence Time in the Atmosphere, Science, 166, 224–225, https://doi.org/10.1126/science.166.3902.224, 1969.
Won, W.-S., Oh, R., Lee, W., Kim, K.-Y., Ku, S., Su, P.-C., and Yoon, Y.-J.: Impact of Fine Particulate Matter on Visibility at Incheon International Airport, South Korea, Aerosol Air Qual. Res., 1048–1061, https://doi.org/10.4209/aaqr.2019.03.0106, 2020.
Wonaschuetz, A., Sorooshian, A., Ervens, B., Chuang, P. Y., Feingold, G., Murphy, S. M., de Gouw, J., Warneke, C., and Jonsson, H. H.: Aerosol and gas re-distribution by shallow cumulus clouds: An investigation using airborne measurements, J. Geophys. Res.-Atmos., 117, D17202, https://doi.org/10.1029/2012JD018089, 2012.
Wu, Y., Ge, X., Wang, J., Shen, Y., Ye, Z., Ge, S., Wu, Y., Yu, H., and Chen, M.: Responses of secondary aerosols to relative humidity and photochemical activities in an industrialized environment during late winter, Atmos. Environ., 193, 66–78, https://doi.org/10.1016/j.atmosenv.2018.09.008, 2018.
Xu, Q., Wang, S., Jiang, J., Bhattarai, N., Li, X., Chang, X., Qiu, X., Zheng, M., Hua, Y., and Hao, J.: Nitrate dominates the chemical composition of PM2.5 during haze event in Beijing, China, Sci. Total Environ., 689, 1293–1303, https://doi.org/10.1016/j.scitotenv.2019.06.294, 2019.
Yang, T., Sun, Y., Zhang, W., Wang, Z., Liu, X., Fu, P., and Wang, X.: Evolutionary processes and sources of high-nitrate haze episodes over Beijing, Spring, J. Environ. Sci., 54, 142–151, https://doi.org/10.1016/j.jes.2016.04.024, 2017.
Yu, J. Z., Huang, X.-F., Xu, J., and Hu, M.: When Aerosol Sulfate Goes Up, So Does Oxalate: Implication for the Formation Mechanisms of Oxalate, Environ. Sci. Technol., 39, 128–133, https://doi.org/10.1021/es049559f, 2005.
Zhang, J. and Reid, J. S.: MODIS aerosol product analysis for data assimilation: Assessment of over-ocean level 2 aerosol optical thickness retrievals, J. Geophys. Res.-Atmos., 111, D22207, https://doi.org/10.1029/2005JD006898, 2006.
Zhang, C., Lu, X., Zhai, J., Chen, H., Yang, X., Zhang, Q., Zhao, Q., Fu, Q., Sha, F., and Jin, J.: Insights into the formation of secondary organic carbon in the summertime in urban Shanghai, J. Environ. Sci., 72, 118–132, https://doi.org/10.1016/j.jes.2017.12.018, 2018.
Zhang, Q., Worsnop, D. R., Canagaratna, M. R., and Jimenez, J. L.: Hydrocarbon-like and oxygenated organic aerosols in Pittsburgh: insights into sources and processes of organic aerosols, Atmos. Chem. Phys., 5, 3289–3311, https://doi.org/10.5194/acp-5-3289-2005, 2005.
Zhang, R., Wang, G., Guo, S., Zamora, M. L., Ying, Q., Lin, Y., Wang, W., Hu, M., and Wang, Y.: Formation of Urban Fine Particulate Matter, Chem. Rev., 115, 3803–3855, https://doi.org/10.1021/acs.chemrev.5b00067, 2015.
Zhang, T., Shen, Z. X., Su, H., Liu, S. X., Zhou, J. M., Zhao, Z. Z., Wang, Q. Y., Prevot, A. S. H., and Cao, J. J.: Effects of Aerosol Water Content on the formation of secondary inorganic aerosol during a Winter Heavy PM2.5 Pollution Episode in Xi'an, China, Atmos. Environ., 252, 118304, https://doi.org/10.1016/j.atmosenv.2021.118304, 2021.
Zhang, Y., Tang, L., Croteau, P. L., Favez, O., Sun, Y., Canagaratna, M. R., Wang, Z., Couvidat, F., Albinet, A., Zhang, H., Sciare, J., Prévôt, A. S. H., Jayne, J. T., and Worsnop, D. R.: Field characterization of the PM2.5 Aerosol Chemical Speciation Monitor: insights into the composition, sources, and processes of fine particles in eastern China, Atmos. Chem. Phys., 17, 14501–14517, https://doi.org/10.5194/acp-17-14501-2017, 2017.
Zhou, Y., Huang, X. H., Bian, Q., Griffith, S. M., Louie, P. K. K., and Yu, J. Z.: Sources and atmospheric processes impacting oxalate at a suburban coastal site in Hong Kong: Insights inferred from 1 year hourly measurements, J. Geophys. Res.-Atmos., 120, 9772–9788, https://doi.org/10.1002/2015JD023531, 2015.
Zhou, M., Nie, W., Qiao, L., Huang, D. D., Zhu, S., Lou, S., Wang, H., Wang, Q., Tao, S., Sun, P., Liu, Y., Xu, Z., An, J., Yan, R., Su, H., Huang, C., Ding, A., and Chen, C.: Elevated formation of particulate nitrate from N2O5 hydrolysis in the Yangtze River Delta region from 2011 to 2019, Geophys. Res. Lett., 49, e2021GL097393, https://doi.org/10.1029/2021GL097393, 2022.
- Abstract
- Introduction
- Datasets and methods
- Time series of PM concentrations
- PM composition
- Regional conditions influencing PM
- Evidence for enhanced local secondary aerosol production
- Conclusions
- Data availability
- Author contributions
- Competing interests
- Disclaimer
- Acknowledgements
- Financial support
- Review statement
- References
- Supplement