the Creative Commons Attribution 4.0 License.
the Creative Commons Attribution 4.0 License.
 | 18 Jan 2022
Long-term characterisation of the vertical structure of the Saharan Air Layer over the Canary Islands using lidar and radiosonde profiles: implications for radiative and cloud processes over the subtropical Atlantic Ocean
África Barreto
Emilio Cuevas
Rosa D. García
Judit Carrillo
Joseph M. Prospero
Luka Ilić
Sara Basart
Alberto J. Berjón
Carlos L. Marrero
Yballa Hernández
Juan José Bustos
Slobodan Ničković
Margarita Yela
Every year, large-scale African dust outbreaks frequently pass over the Canary Islands (Spain). Here we describe the seasonal evolution of atmospheric aerosol extinction and meteorological vertical profiles on Tenerife over the period 2007–2018 using long-term micropulse lidar (MPL-3) and radiosonde observations. These measurements are used to categorise the different patterns of dust transport over the subtropical North Atlantic and, for the first time, to robustly describe the dust vertical distribution in the Saharan Air Layer (SAL) over this region. Three atmospheric scenarios dominate the aerosol climatology: dust-free (clean) conditions, the Saharan summer scenario (summer-SAL) and the Saharan winter scenario (winter-SAL).
A relatively well-mixed marine boundary layer (MBL) was observed in the case of clean (dust-free) conditions; it was associated with rather constant lidar extinction coefficients (α) below 0.036 km−1 with minimum α (< 0.022 km−1) in the free troposphere (FT). The summer-SAL has been characterised as a dust-laden layer strongly affecting both the MBL (Δα = +48 % relative to clean conditions) and the FT. The summer-SAL appears as a well-stratified layer, relatively dry at lower levels ( % at the SAL’s base, where r is the water vapour mixing ratio) but more humid at higher levels compared with clean FT conditions ( % at 5.3 km), with a peak of α> 0.066 km−1 at ∼ 2.5 km. Desert dust is present up to ∼ 6.0 km, the SAL top based on the altitude of SAL's temperature inversion. In the winter-SAL scenario, the dust layer is confined to lower levels below 2 km altitude. This layer is characterised by a dry anomaly at lower levels (Δr∼ −38 % in comparison to the clean scenario) and a dust peak at ∼ 1.3 km height. Clean FT conditions were found above 2.3 km.
Our results reveal the important role that both dust and water vapour play in the radiative balance within the summer-SAL and winter-SAL. The dominant dust-induced shortwave (SW) radiative warming in summer (heating rates up to +0.7 K d−1) is found slightly below the dust maximum. However, the dominant contribution of water vapour was observed as a net SW warming observed within the SAL (from 2.1 to 5.7 km) and as a strong cold anomaly near the SAL's top (−0.6 K d−1). The higher water vapour content found to be carried on the summer-SAL, despite being very low, represents a high relative variation in comparison to the very dry clean free troposphere in the subtropics. This relevant aspect should be properly taken into account in atmospheric modelling processes. In the case of the winter-SAL, we observed a dust-induced radiative effect dominated by SW heating (maximum heating of +0.7 K d−1 at 1.5 km, near the dust peak); both dust and atmospheric water vapour impact heating in the atmospheric column. This is the case of the SW heating within the SAL (maximum near the r peak), the dry anomaly at lower levels (Δr∼ −38 % at 1 km) and the thermal cooling (∼ 0.3 K d−1) from the temperature inversion upwards.
Finally, we hypothesise that the SAL can impact heterogeneous ice nucleation processes through the frequent occurrence of mid-level clouds observed near the SAL top at relatively warm temperatures. A dust event that affected Tenerife on August 2015 is simulated using the regional DREAM model to assess the role of dust and water vapour carried within SAL in the ice nucleation processes. The modelling results reproduce the arrival of the dust plume and its extension over the island and confirm the observed relationship between the summer-SAL conditions and the formation of mid- and high-level clouds.
- Article
(4661 KB) - Full-text XML
-
Supplement
(5275 KB) - BibTeX
- EndNote


Dust is one of the main components of the atmospheric aerosol load, representing about 75 % of the global aerosols injected into the atmosphere (Kinne et al., 2006; Huneeus et al., 2011; Mona et al., 2012; Wu et al., 2020). Mineral dust emitted from the Sahara and surrounding regions contributes to more than half of the global dust emissions (Kok et al., 2021).
The African dust is transported westwards as a hot, dry, dust-laden elevated layer (the so-called Saharan Air Layer or SAL) over the North Atlantic for thousands of kilometres (Carlson and Prospero, 1972; Prospero and Carlson, 1972; Karyampudi and Carlson, 1988; Karyampudi et al., 1999; Engelstaedter et al., 2006; Sunnu et al., 2008; Rodríguez et al., 2011). These large amounts of Saharan mineral dust within the SAL are advected off the African continent to the Caribbean (Prospero and Carlson, 1972; Carlson and Prospero, 1972; Prospero and Mayol-Bracero, 2013; Prospero et al., 2021), the Amazon rainforest (Yu et al., 2015; Prospero et al., 2020) or the Mediterranean basin (Carlson and Prospero, 1972; Hamonou et al., 1999; Reid et al., 2003). A large number of studies in the literature have found that mineral dust causes a strong radiative impact on atmospheric vertical stability, thermodynamics and wind shear (Carlson and Benjamin, 1980; Karyampudi et al., 1999; Quijano et al., 2000; Karyampudi and Pierce, 2002; Dunion and Velden, 2004; Kim et al., 2004; Wong and Dessler, 2005; Satheesh et al., 2007; Zhu et al., 2007; Chen et al., 2010, among others). Recently, some authors have shown that although mineral dust produces net radiative heating within the SAL in summer, the small amount of water vapour that this layer contains, significantly higher than that present in the clean free troposphere, represents the major radiative driver for the SAL in summer (Gutleben et al., 2019, 2020). Furthermore, many studies in the literature confirm that mineral dust within the SAL also plays an important role as cloud condensation nuclei (CCN), giant CCN (GCCN) and ice nuclei, affecting the properties of clouds and their indirect effect on radiative balance and consequently on climate (Sassen et al., 2003; DeMott et al., 2003; Murray et al., 2012; Boose et al., 2016).
Most of the studies on the SAL have been focused on dust transport to the Caribbean region through the northern equatorial Atlantic. Between the tropics and the Canary Islands, there is no place where the SAL can be analysed and characterised once it has left the African continent and has docked on the subtropical North Atlantic marine boundary layer (MBL), impacting the subtropical free troposphere (FT). Another problematic point of the current research is related to the preferential study of the dust leaving Africa at tropical latitudes in the summer season when the Saharan outbreaks over the North Atlantic are mostly confined in an elevated mixed layer (Carlson, 2016; Prospero and Carlson, 1980). As Tsamalis et al. (2013) showed, the SAL can be identified near the west coast of Africa all year round with a clear spatial seasonal cycle: between 5∘ S and 15∘ N in winter and 5–30∘ N in summer. Therefore, the Canary Islands lie on the northern edge of the dust belt in summer and are significantly affected by the SAL. The study of the SAL at subtropical latitudes will add important additional information since this location is representative of the almost pure Saharan convective boundary layer (CBL).
In winter, most of the dust in the eastern tropical North Atlantic is transported within the marine layer in a shallowest layer, up to 1.5–3 km (Prospero and Carlson, 1980; Chiapello et al., 1995; Zhu et al., 2007; Ansmann et al., 2011; Tsamalis et al., 2013; Rittmeister et al., 2017; Weinzierl et al., 2017; Senghor et al., 2017). Winter dust mobilisation in the Sahel region is often associated with the Harmattan winds that transport dust southwestward from the Bodélé and adjacent areas (Marticorena et al., 2010) at low levels (Cavalieri et al., 2010). During this dry season, dust is frequently mixed with biomass-burning aerosols confined in the upper layers (Haywood et al., 2008; Cavalieri et al., 2010). In contrast, the atmospheric mechanisms that cause dust intrusions over the subtropical North Atlantic in winter are generally linked to baroclinic processes and are usually of short duration and limited geographic extension. These baroclinic processes are often located in the vicinity of the Canary Islands and affect Western Sahara, northern Mauritania and western Algeria. Therefore, this dust is free of biomass-burning aerosols. An outstanding example was the huge dust intrusion that occurred in February 2020 (Cuevas et al., 2021). Although it is not strictly accurate to talk about the SAL in winter since the intrusions on the ocean do not constitute an elevated layer, in this study we will refer to them as “winter-SAL”. The impact of the winter-SAL on the subtropical MBL, and more specifically on the Canary Islands, was analysed by Alonso-Pérez et al. (2007, 2011, 2012).
The altitude to which the aerosols are initially lifted and in which they are subsequently transported will influence their lifetime and radiative effects (Generoso et al., 2008). Consequently, there is a need for systematic ground-based mineral dust and vertical thermodynamic observations near dust source regions to understand the evolution of the 3D spatial and temporal dust distribution and the role played by desert dust in the effective radiative forcing (ERF).
Lidar offer the most efficient technique for the identification and characterisation of the vertical distribution of atmospheric aerosols. However, the quantitative data inversion in the case of elastic backscatter lidar involves knowledge of the relationship between aerosol backscatter (β) and extinction coefficients (α), that is, the extinction-to-backscatter ratio (LR or lidar ratio) (Fernald, 1984; Klett, 1985). This presupposes knowledge of the vertical aerosol distribution, critical in the case of complex aerosol distributions such as in elevated layers. The uncertainty of this parameter determines the accuracy of the retrieved profiles (Cattrall et al., 2005). The accuracy of the retrievals can be improved by combining active and passive remote sensing aerosol observations. The synergetic aerosol monitoring of co-located photometer and lidar observations is a powerful tool for aerosol research (Ansmann et al., 2012; Lopatin et al., 2013; Mortier et al., 2013; Binietoglou et al., 2015; Chaikovsky et al., 2016; Bovchaliuk et al., 2016; Berjón et al., 2019).
In this study, we describe the seasonal evolution of the vertical atmospheric profiles over the subtropical North Atlantic region on Tenerife, Canary Islands, Spain, using 12 years of observations (2007–2018) with a micropulse lidar (MPL-3). In addition, we use radiosonde measurements in the same area. Sun photometer measurements allow us to minimise the uncertainties involved in the aerosol extinction retrieval from an elastic backscatter system. To assess the radiative effects, we use the two-layer approach presented in Berjón et al. (2019) in which two-column lidar ratios (LR1 and LR2) are calculated as inputs, retrieved from the aerosol optical depth (AOD) information in two layers (marine layer and free troposphere). This technique yields a better description of the LRi than the standard one-layer approach.
Section 2 describes the test site. All the instruments and ancillary information are described in Sect. 3. In Sect. 4.1 and 4.2 we characterise the lower troposphere under clean (dust-free) conditions (in four different seasons covering the whole year) and under Saharan dust conditions (focused on winter and summer seasons). Sections 5 and 6 present the main results on the SAL's impact on the atmospheric vertical thermodynamic aerosol extinction profiles as well as the corresponding radiative impact of this dusty layer. Section 7 studies the potential role of the SAL in summer and winter on the formation of mid-level clouds as a result of the activation of heterogeneous ice nucleation processes. Finally, Sect. 8 presents the summary and the main conclusions from this work.
The Canary Islands, located in the subtropical North Atlantic, are characterised by a very stable and well-stratified lower troposphere with strong temperature inversions (Cuevas, 1995; Dorta, 1996; Carrillo et al., 2016). These are modulated by quasi-permanent subsidence conditions as a result of the descending branch of the Hadley cell. Carrillo et al. (2016) made a comprehensive analysis of the temperature inversions in the lower troposphere of the Macaronesian region, including the Canary Islands. They found the presence of one or two sharp temperature inversions or transition levels below the 700 hPa level. The first transition level in the double-inversion structure coincides with the maximum extent of the surface-related turbulent mixing, which limits the dry adiabatic convection and caps the humid and well-mixed MBL. This transition level, denoted as the marine boundary inversion (MBI), is characterised by a strong vertical humidity gradient. The second transition level, denoted as the trade wind inversion (TWI), is located at the top of a highly stable layer, the trade wind layer (TWL), normally associated with synoptic-scale subsidence processes which limit vertically the quasi-permanent area of stratocumulus clouds frequently observed at this latitude. According to these authors, the percentage of occurrence of this double structure (normally found between 900 and 800 hPa) is low, with a maximum occurrence of 33 % in summer. Consequently, in this study we use a two-layer approach (one single temperature inversion) where the MBI and the TWI are the same temperature inversion capping the MBL, and separating it from the FT above. It is important to note that the study by Carrillo et al. (2016) on temperature inversions was carried out under no-dust conditions. However, the characteristics of the temperature inversions are modified by the impact of the SAL, which introduces a new temperature inversion in the lower troposphere. These aspects are also addressed in our study.
This study focuses on the observations and modelling results obtained over two locations in Tenerife: Santa Cruz de Tenerife station SCO (28.5∘ N; 16.2∘ W at 52 m a.s.l.) and the high-altitude Izaña Global Atmosphere Watch (GAW) Observatory IZO (28.3∘ N; 16.5∘ W at 2391 m a.s.l), horizontally spaced less than 30 km. These two sites belong to the State Meteorological Agency (AEMET) and are managed by the Izaña Atmospheric Research Centre (IARC) (Cuevas et al., 2017, 2021).
3.1 AOD from AERONET
Column-integrated aerosol optical depth (AOD) and Ångström Exponent (AE) data have been collected at IZO and SCO AERONET sites. AERONET (Aerosol Robotic Network, http://aeronet.gsfc.nasa.gov, last access: 1 March 2021) is a globally distributed federated network for aerosol optical properties using the CE-318 sun photometer as a standard instrument (Holben et al., 1998; Giles et al., 2019). Ground-based CE-318 sun measurements were performed at eight nominal wavelengths (340 to 1020 nm) with an approximate field of view of 1.3∘ (Holben et al., 1998; Torres et al., 2013). AERONET's AOD uncertainty is spectrally dependent: it is 0.01 at 500 nm, the approximate spectral wavelength used in the present study. Following Eck et al. (1999); Schuster et al. (2006), these uncertainties alter the AE by 0.03–0.04. We used cloud-screened and quality-assured AOD data from AERONET level 2.0 (Smirnov et al., 2000).
3.2 Aerosol extinction from MPL-3
The micropulse backscatter lidar version 3 (MPL-3), extensively described in Spinhirne et al. (1995); Campbell et al. (2002), contains a solid-state Nd:YLF laser system which emits at 523 nm. It has a high pulse repetition rate of 2500 Hz and eye-safe energy levels (∼ 7 µJ) by expanding the low-power transmitted beam using a Cassegrain telescope. The same configuration is used for transmission of the energy pulse and detection of the backscattered light. Range resolution is 75 m. Operationally, it can detect returns at distances up to 20 km. Efficient detection is achieved by an avalanche photodiode. The MPL is an autonomous instrument, operational in full-time continuous mode (24 h, 365 d yr−1). This instrument is the reference instrument of the NASA Micro-Pulse Lidar Network (MPLNET) (Welton et al., 2005), a federated global network contributing network to the World Meteorological Organization (WMO) GAW Aerosol Lidar Observation Network, GALION. The MPL was developed to obtain measurements of cloud-scattering cross sections and optical thickness, planetary boundary layer height, aerosol extinction, and optical thickness profiles (Campbell et al., 2002). The resulting signal extracted from the raw MPL data after the correction process is applied is called the normalised relative backscatter (NRB) signal (Welton and Campbell, 2002). This requires the application of background, dead time, afterpulse and overlap corrections (Campbell et al., 2002). Furthermore, the corrected profiles are hourly averaged to increase the signal-to-noise ratio (SNR). The MPL-3 installed at SCO station achieves a full overlap at an average of ∼ 5 km. Welton and Campbell (2002) estimated a relative uncertainty in the overlap calculation typically below 10 %. Sicard et al. (2020) estimated the errors of applying a non-appropriate overlap function to be up to 60 % in the lowermost atmospheric layers and up to 20 % above. Due to the overlap effect in addition to the saturation of the detector in the near range caused by the afterpulse phenomenon, the information below 300 m is disregarded.
We have used the lidar–sun photometer synergy to reduce the uncertainty in LR and thereby improve the aerosol characterisation (Ansmann et al., 2012; Lopatin et al., 2013; Binietoglou et al., 2015; Chaikovsky et al., 2016; Berjón et al., 2019). AODs (523 nm) at SCO and at IZO AERONET stations (see Section 3.1) have served as a constraint to more accurately fix LR in the two-layer approach, already presented by Berjón et al. (2019), and therefore retrieve a more accurate value for the aerosol extinction coefficient (α) at 523 nm. This iterative procedure enables the LR to be calculated for the boundary layer (principally containing marine and dust aerosols) and the lofted aerosols layer in the free troposphere (mainly dust in both clean and Saharan conditions). Since LR is an intensive aerosol property that does not depend on the number density of the aerosol, the two-layer approximation allows a quantitative description of clean conditions and the situations with complex aerosol layering typically related to Saharan dust outbreaks.
Following Berjón et al. (2019), cloud-free conditions in the one- and two-layer approach are ensured by means of the AERONET cloud-screened product as the first filter, and also using a specific cloud-screening for lidar data based on the smoothness of the lidar background (Clothiaux et al., 1998). Therefore, the two-layer procedure is more restrictive than the single method itself since cloudless conditions and output AOD control are simultaneously required for both stations (Berjón et al., 2019). See Berjón et al. (2019) for further details on the two-layer procedure.
3.3 Meteorological vertical profiles from radiosondes
Meteorological vertical profiles are provided by radiosondes launched at 12:00 UTC in 2007–2018 at AEMET's Güímar station (28.3∘ N, 16.4∘ W at 105 m a.s.l.; WMO GUAN no. 60018), located at the coastline, approximately 22 km from SCO and 11 km from IZO. Temperature (T), relative humidity (RH) and pressure (P) have been measured using Vaisala RS92 radiosondes, while a Global Positioning System (GPS) windfinder is used for wind speed and wind direction calculation (Rodríguez-Franco and Cuevas, 2013; Carrillo et al., 2016). Potential temperature (θ), equivalent potential temperature (θe) and water vapour mixing ratio (r) are computed from the basic meteorological sonde parameters.
3.4 FLEXTRA back-trajectories and the African air masses residence time index (ARTI)
The African air masses residence time index (ARTI) is an objective index developed in this study to discriminate between Saharan dust-laden air masses and those from clean or non-dust air masses. ARTI corresponds to the percentage of the time in which the air mass trajectory is within the Saharan–Sahel area. For the ARTI calculations, the FLEXible TRAjectories model (FLEXTRA; https://folk.nilu.no/~andreas/flextra.html, last access: 1 March 2021) (Stohl et al., 1995; Stohl and Seibert, 1998) is used for the determination of the origin of the different air masses arriving at Tenerife. FLEXTRA is a kinematic trajectory model developed at the Institute of Meteorology and Geophysics in Vienna that uses input data from the European Centre for Medium-Range Weather Forecasts (ECMWF). FLEXTRA was run to provide 120 h back-trajectories arriving at two levels, 150 and 2400 m, the most representative levels to study the long-range transport arriving at SCO and IZO, respectively. Saharan dust-laden air masses (ARTI > 0) can be discriminated from other clean or non-dust air masses (ARTI = 0), such as those associated with the trade wind regime within the MBL or airflows from northernmost latitudes and upper-middle troposphere over the North Atlantic in the FT. This restriction in the ARTI for clean conditions, although very restrictive, ensures that we correctly select clean scenarios for its characterisation.
3.5 Radiative transference simulations
Atmospheric heating rate calculations are performed using the LibRadtran radiative transfer model (Mayer and Kylling, 2005; Emde et al., 2016). The simulations are done with the radiative transfer solver DISORT (DIScrete Ordinate Radiative Transfer) (Stamnes et al., 1988) for spectral ranges of 280 to 4000 nm (shortwave; SW) and 4000 nm and 100 µm (longwave; LW). The absorption parameterisation REPTRAN (Gasteiger et al., 2014) included in LibRadtran is used in both spectral ranges. Regarding the atmosphere gas composition, we use the standard midlatitude summer atmosphere model (Anderson et al., 1986). The temperature and relative humidity profiles are taken from the monthly or seasonally median profiles obtained from radiosondes (Sect. 3.3). Henyey–Greenstein parameterisation is assumed for computing the aerosol-phase function using the asymmetry parameter g as an approximation of the full-phase function. Small but not negligible errors are expected from this approximation, generally considered acceptable for flux calculations (Boucher, 1998).
The key input parameters required for calculating the radiative heating rates are AOD (or α), single scattering albedo (SSA) and asymmetry parameter (g), which are all wavelength dependent. MOPSMAP (modelled optical properties of ensembles of aerosol particles) (Gasteiger and Wiegner, 2018) (https://mopsmap.net, last access: 1 March 2021) is used to reconstruct the required input aerosol parameters under different atmospheric conditions. A similar approach is used in different fields by (Barreto et al., 2020; Piontek et al., 2021; Chen-Chen et al., 2021; Jiang et al., 2021). This package consists of a dataset of pre-calculated optical properties of different user-defined aerosol ensembles under a high variety of atmospheric conditions. One of the most important advantages of this database in comparison to the Optical Properties of Aerosols and Clouds (OPAC) (Hess et al., 1998) database is that MOPSMAP includes more aerosol shape features such as spheroids and irregularly shaped dust particles. The details of the different optical properties extracted from MOPSMAP in the current study are given in Sect. 6.
3.6 Methodology for obtaining cloud type distribution for dust and clean scenarios
To determine the distribution of cloud types (low, middle and high clouds) and therefore to study the possible impact of the SAL on cloud formation, we have estimated the cloud height using lidar data for each clean and dust scenario in the 2007–2018 time period. In this way, a dataset of 16 400 057 bins at different altitudes classified as cloudy corresponding to 2877 different days has been used in this cloud classification. Since the MPL system used in this study cannot measure particle depolarisation, we are not able to directly estimate the presence of clouds and their respective altitudes. We addressed this issue by means of an indirect technique. We first extracted extinction coefficient values assuming a lidar ratio of 20 sr in the classical Fernald–Klett inversion procedure, close to the expected value for mid-level clouds (Yorks et al., 2011). Following this, we have identified molecular (particle-free and therefore with the sole contribution of molecules) and aerosol signals taking into account visibility and empirical thresholds in the value of the retrieved α and its quantile. The presence of clouds is considered when an empirical threshold in α is exceeded and the visibility is reduced to values < 5 km if the molecular layer starts from the surface level (WMO, 2019). Cloud is also identified when visibility is reduced to values < 10 km if the molecular layer starts above the surface level and empirical thresholds in α and in the 80 % quantile of α are exceeded.
According to WMO, low clouds are usually located between the surface and 2 km, middle clouds between this level and 7 km (8 km) at midlatitudes (tropics), and high clouds are usually located above this level.
3.7 Ice-nucleating particle parameterisations in the Dust Regional Atmospheric Model (DREAM)
We obtain predictions of ice nucleation particle concentration (INPC) using the Dust Regional Atmospheric Model (DREAM) (Nickovic et al., 2001; Nickovic, 2005; Nickovic et al., 2012; Vukovic et al., 2014). DREAM is an atmospheric dust mass concentration model that considers the major atmospheric processes of dust transport such as emission, horizontal and vertical turbulent mixing, long-range transport, and dust wet and dry deposition. The model uses the Non-hydrostatic Mesoscale Model (NMM) from the National Centers for Environmental Prediction (NCEP) as a meteorological driver. Dust particles are represented by eight size bins with effective radii from 0.15 to 7.1 µm. For this study, the model is run with 0.1∘ × 0.1∘ horizontal resolution and 28 vertical levels covering the dust-productive areas in the Sahara and the Middle East and dust transport in the eastern Atlantic Ocean. The initial and boundary conditions for the atmospheric driver are updated every 6 h from ECMWF analysis data with 0.5∘ × 0.5∘ horizontal resolution. Dust sources are defined using USGS (United States Geological Survey) land cover data combined with sediments in paleo-lake and riverine beds (Ginoux et al., 2001; Nickovic et al., 2016). DREAM model provides options for the parameterisation setups of the dust-derived INPC (Nickovic et al., 2016, 2021; Ilić et al., 2021). There are several dust-dependent INPC parameterisations for immersion freezing at or above water saturation (Niemand et al., 2012; Ullrich et al., 2017; DeMott et al., 2015) and deposition nucleation at ice supersaturation (Steinke et al., 2015; Ullrich et al., 2017). In this paper, we use the parameterisations provided by Ullrich et al. (2017) (hereafter referred to as U17) to address the immersion freezing (from −30.0 to −14.0 ∘C) and deposition nucleation (from −67.0 to −33.0 ∘C).
Atmospheric scenarios have been classified using two different and independent techniques: lidar extinction profiles, able to characterise the vertical distribution of aerosols, and atmospheric soundings necessary to characterise the atmosphere from a thermodynamic perspective. Only daytime lidar profiles and atmospheric soundings (launched at 12:00 UTC) have been included in this study. The emerging database is compiled with every lidar extinction profile and the corresponding daily sounding profile. We obtain consistent results of the MBL thickness retrieved with these two techniques as shown in Sect. S1 in the Supplement. This gives us confidence in the atmospheric layering performed in this study, both in terms of atmospheric aerosols and thermodynamic variables. Monthly average values of aerosol extinction at 523 nm (α) are shown in Sect. S2 (Figs. S1 and S2 and Table S1) giving us an overview of the dust vertical structure of the eastern subtropical North Atlantic atmosphere throughout the year. From this analysis, we can define the clean and Saharan scenarios as being predominant. Saharan scenarios present a different seasonality within the MBL, with maximum AOD values in winter, compared to the values shown in the upper layer with maximum AOD in July and August.
Clean air masses are defined as those with ARTI = 0 (i.e. non-African origin). Figure S3 shows how these clean scenarios predominate at both levels through the year. Saharan air masses might significantly impact SCO from November to January (74.0 % of the annual data), while IZO is mainly affected in July and August (29.5 % of the annual data). These results corroborate our findings based on lidar results presented in Sect. S2. Based on this information, clean scenarios are split into different seasons according to the ARTI monthly distribution, i.e. winter (November–January), extended spring (February–June), summer (July–August) and autumn (September–October). Otherwise, Saharan scenarios in winter (winter-SAL, confined to lower levels) are limited to the period November–January, while Saharan scenarios in summer (summer-SAL, as an elevated layer) are limited to July and August.
AERONET AOD and AE have been used to better categorise the Saharan scenarios, in addition to the previous criterion (ARTI > 0). The winter-SAL scenario is defined as those conditions in November–January with ARTI > 0, AOD at SCO ≥ 0.15 and Angström Exponent (AE) ≤ 0.5, according to the results from Guirado (2015). Similarly, the summer-SAL scenario is defined by ARTI > 0, AOD at IZO ≥ 0.10 and AE at IZO ≤ 0.6 (Guirado, 2015).
4.1 Clean scenarios
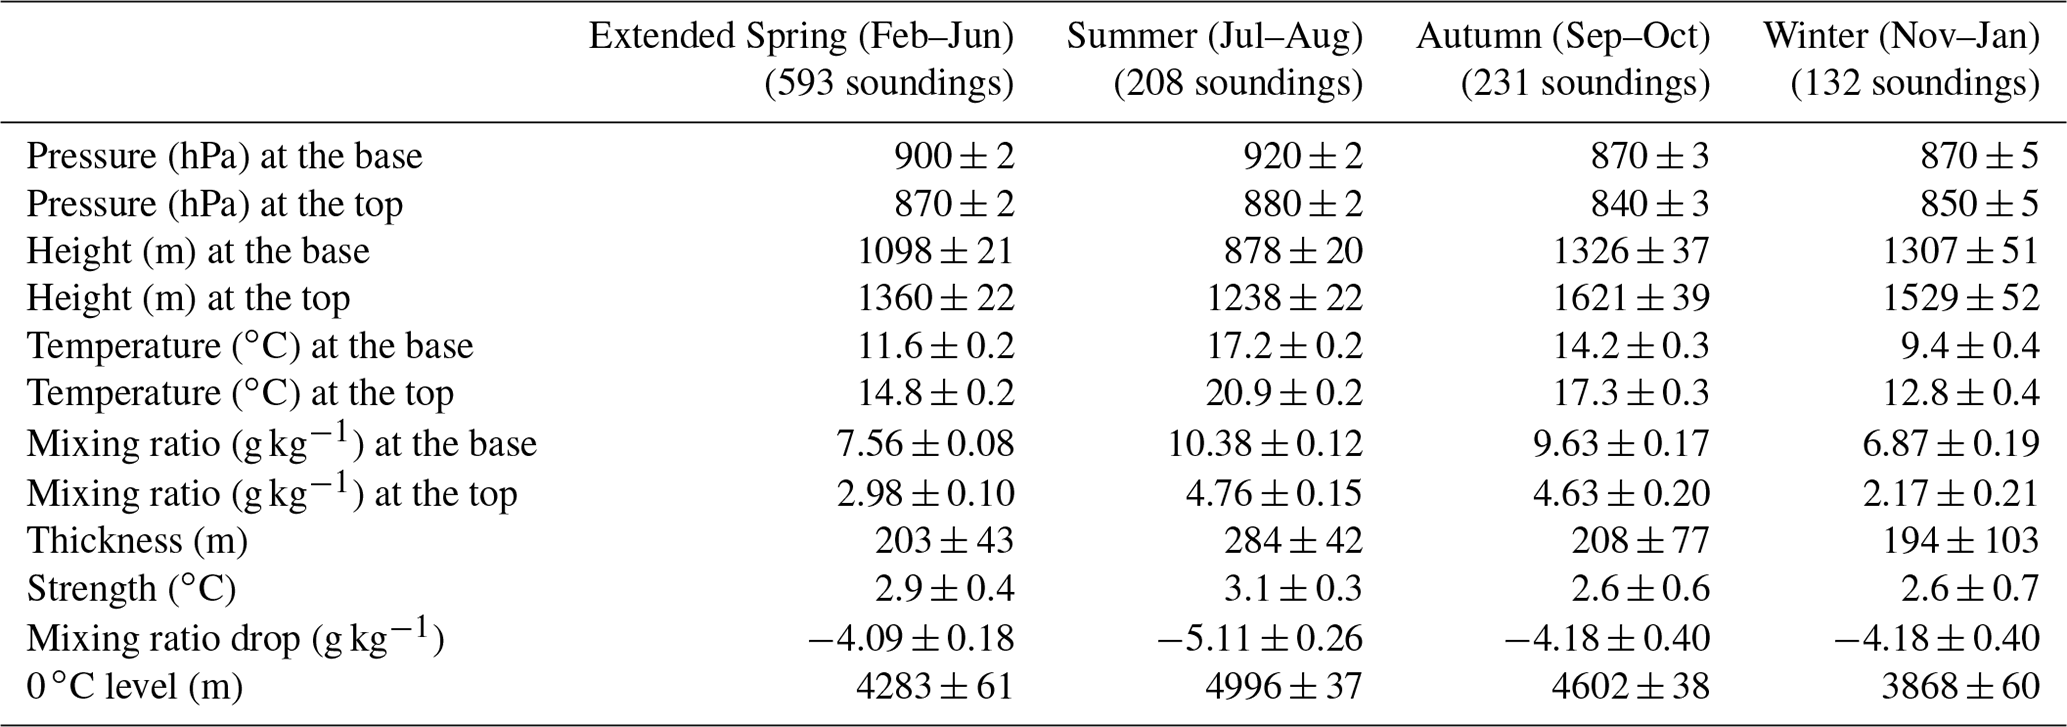
Vertical profiles of meteorological parameters (T, θ, θe, r and horizontal wind) and α, corresponding to the clean scenarios, are shown in Fig. 1 and Table 1. We used a total of 10 658 lidar cloud-free profiles corresponding to 610 d in the case of the extended spring scenario, 5341 (217 d) for summer, 3842 (240 d) for autumn, and 1532 (136 d) for winter. Average LR between 16 and 18 sr have been retrieved for the first layer, and between 48 and 50 sr for the second layer. These values are in agreement with those obtained in a previous study performed by Berjón et al. (2019) in Tenerife with the same two-layer analysis. The MBL is displayed in Fig. 1 as a light-blue-shaded layer with a horizontal blue line marking the top of the MBL, i.e. the MBI. The presence of the TWL in summer is represented as a dark-blue-shaded layer.
We find a marked seasonal dependence on the MBI's base altitude, with a minimum value in summertime (878 m) and a maximum in September–October (1326 m). This variability is strongly influenced by thermal processes at the surface and also by large-scale subsidence processes (Carrillo et al., 2016). The intensification of subsidence processes in summertime impacts positively on the strength of the MBI (maximum strength of 3.1 K in summer). It explains the greater vertical extension of the MBL observed in September–October (1238 m) because subsidence is at a minimum and its lower vertical extension in summer (1621 m) when subsidence is at a maximum.
Mean and median lidar profiles (Fig. 1) show a rather constant α profile within the MBL, with two secondary maximum values. The first maximum in the median profile, with α∼ 0.033 km−1, is located at altitudes ranging from 0.6 km in summer to 0.7 km in autumn–winter. Maximum α peak values are found in winter (0.036 km−1), which may be a consequence of residual dust caused by the frequent dust outbreaks at this level in this season. The second maximum (α∼ 0.023 km−1) is located near the top of the MBL (at ∼ 1.5–1.7 km height). Minimum α within the MBL are observed from 1.6 km in summer to 1.3 km in the other seasons. Low α values, below 0.022 km−1, are observed at 2 km, in the clean free troposphere above (minimum value of 0.016 km−1 in winter, and maximum value of 0.022 km−1 in autumn).
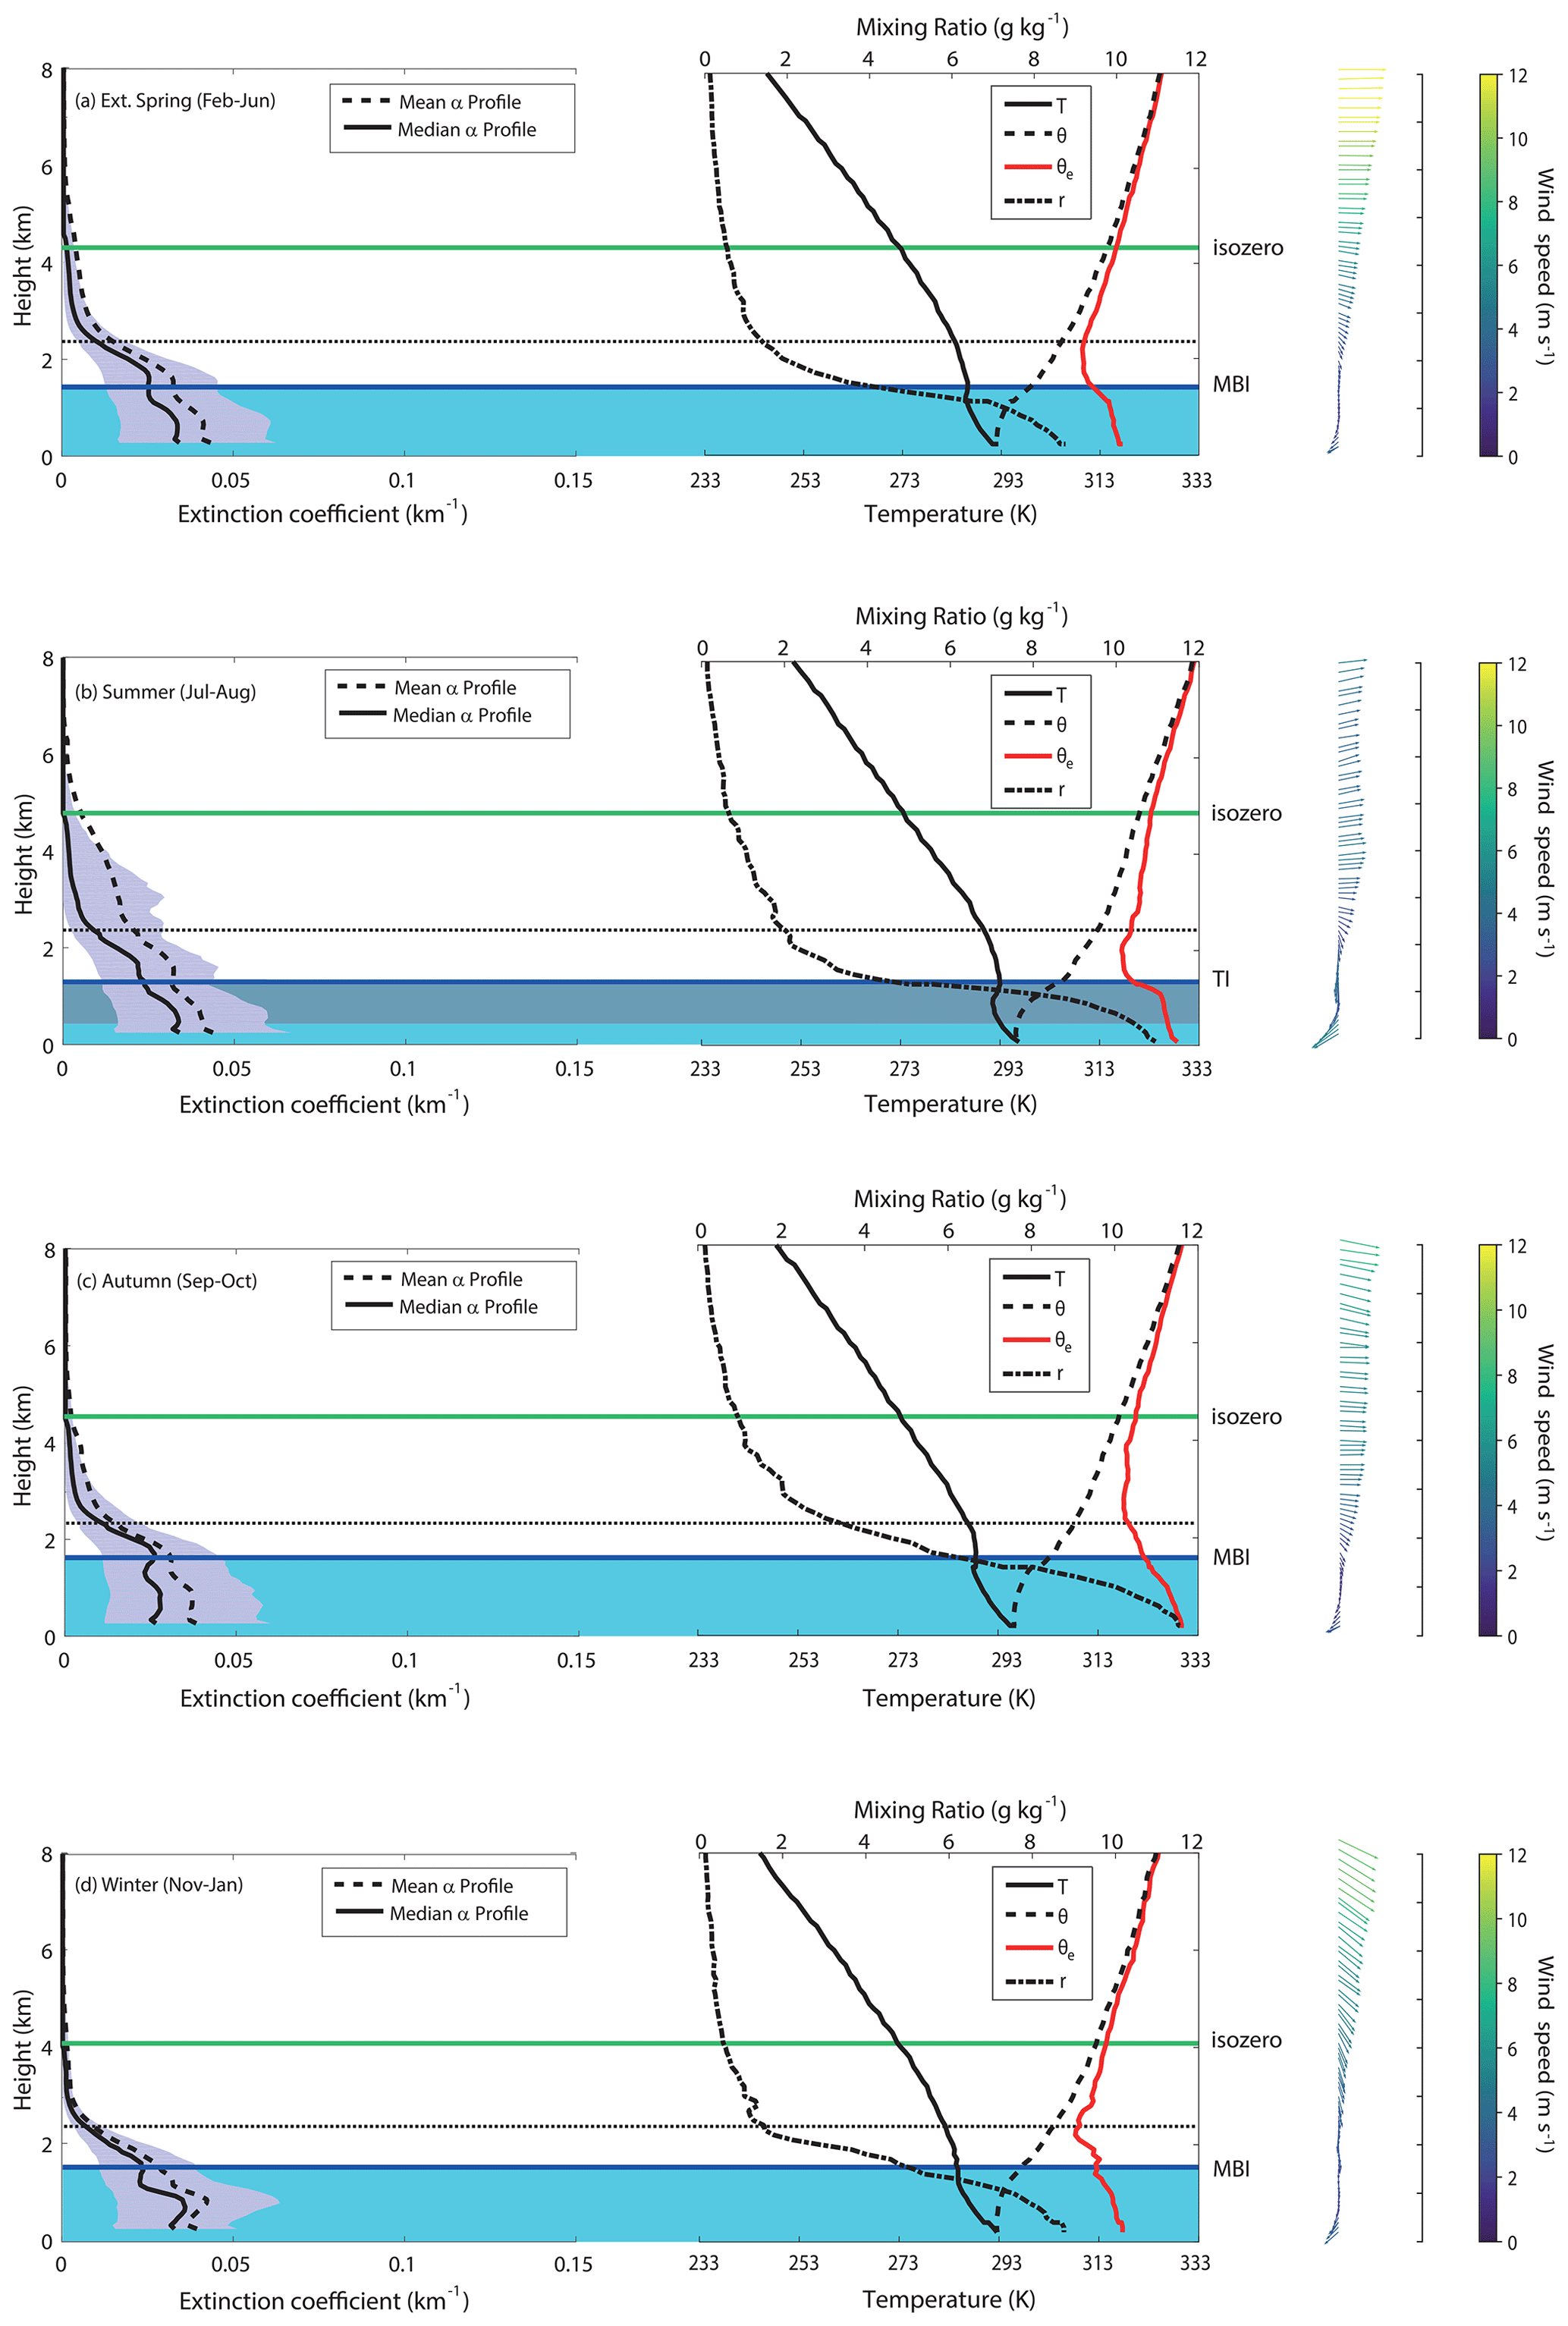
Figure 1Lidar total extinction (523 nm) at each level (mean and median, kilometres above sea level) and vertical profiles (median) of temperature (T), potential temperature (θ), equivalent potential temperature (θe) and water vapour mixing ratio (r) for (a) spring, (b) summer, (c) autumn and (d) winter clean scenarios. The horizontal broken black line represents the IZO altitude. The solid blue line represents the marine boundary inversion (MBI) and the transition inversion (TI) tops. The horizontal green line indicates the average 0 ∘C (iso-zero) level extracted from vertical soundings. The grey-shaded area is bounded by the 20th and 80th percentile values of lidar total extinction at each level. A two-dimensional field of wind profiles with arrows (wind direction) and magnitude in metres per second (colour bar) are also presented on the right.
Table 1The main descriptive statistics of the atmospheric vertical structure extracted from atmospheric soundings (median values) for clean scenarios in each season. Standard error of the mean (SEM) is also included. Note that the MBI top coincides with the MBL top.
Regarding the vertical thermodynamic profiles (Fig. 1, right-hand column), the moist MBL appears as an unstable layer (negative θe gradient), topped by a significant temperature inversion and a sharp change in the vertical humidity profile that defines the MBL's top. Above the top of the MBL, there is a stable layer with a slightly negative θe gradient, characterised by a strong reduction in the rate of vertical decrease of r and a minimum value in θe found at its top (nearly at that altitude of IZO). These observations show the presence of a separation between the moist air within the MBL and the dry air that lies above. This interface layer is followed by a sharp change in θe, with a positive θe gradient registered from this level. A positive θe gradient is registered from this transition layer upwards. At higher levels, very low and steady humidity profiles with almost constant θ and θe indicate the thermal stratification representative of clean free troposphere (CFT) conditions. The iso-zero level extracted from vertical soundings (horizontal green line in Fig. 1) ranges from ∼ 4.9 km in summer to ∼ 4.1 km in winter (see Table 1).
Northeast trade winds are observed within the MBL. In the FT the wind direction rotates anticlockwise with height. The W–NW subsiding dry airflow is the predominant wind pattern in the CFT. The presence of a second layer (the TWL) in summer above 400 m (Fig. 1b) shaded in dark blue) with an N–NE flow regime confirms the results of Carrillo et al. (2016). This combined MBL + TWL layer in summer can be considered as a layer of different nature than the MBL, capped by a “transition inversion” (TI) between the lower troposphere and the FT. The maximum wind shear, calculated as the gradient of the magnitude of the wind vector, is found between 1.2 and 1.8 km, roughly matching the height of the MBI, and the TI in summer. These results are also consistent with the maximum vertical variation of the wind direction.
4.2 Saharan scenarios
Here we perform a similar analysis for the two main scenarios of SAL intrusions that take place in summer (Fig. 2a) and winter (Fig. 2b). The winter-SAL scenario is included in this Saharan characterisation, although it does not strictly follow the original description of the SAL as a hot, dry and dusty layer generated over the Sahara desert. In this winter case, the dust intrusions do not constitute an elevated layer but a dust layer confined to lower levels.
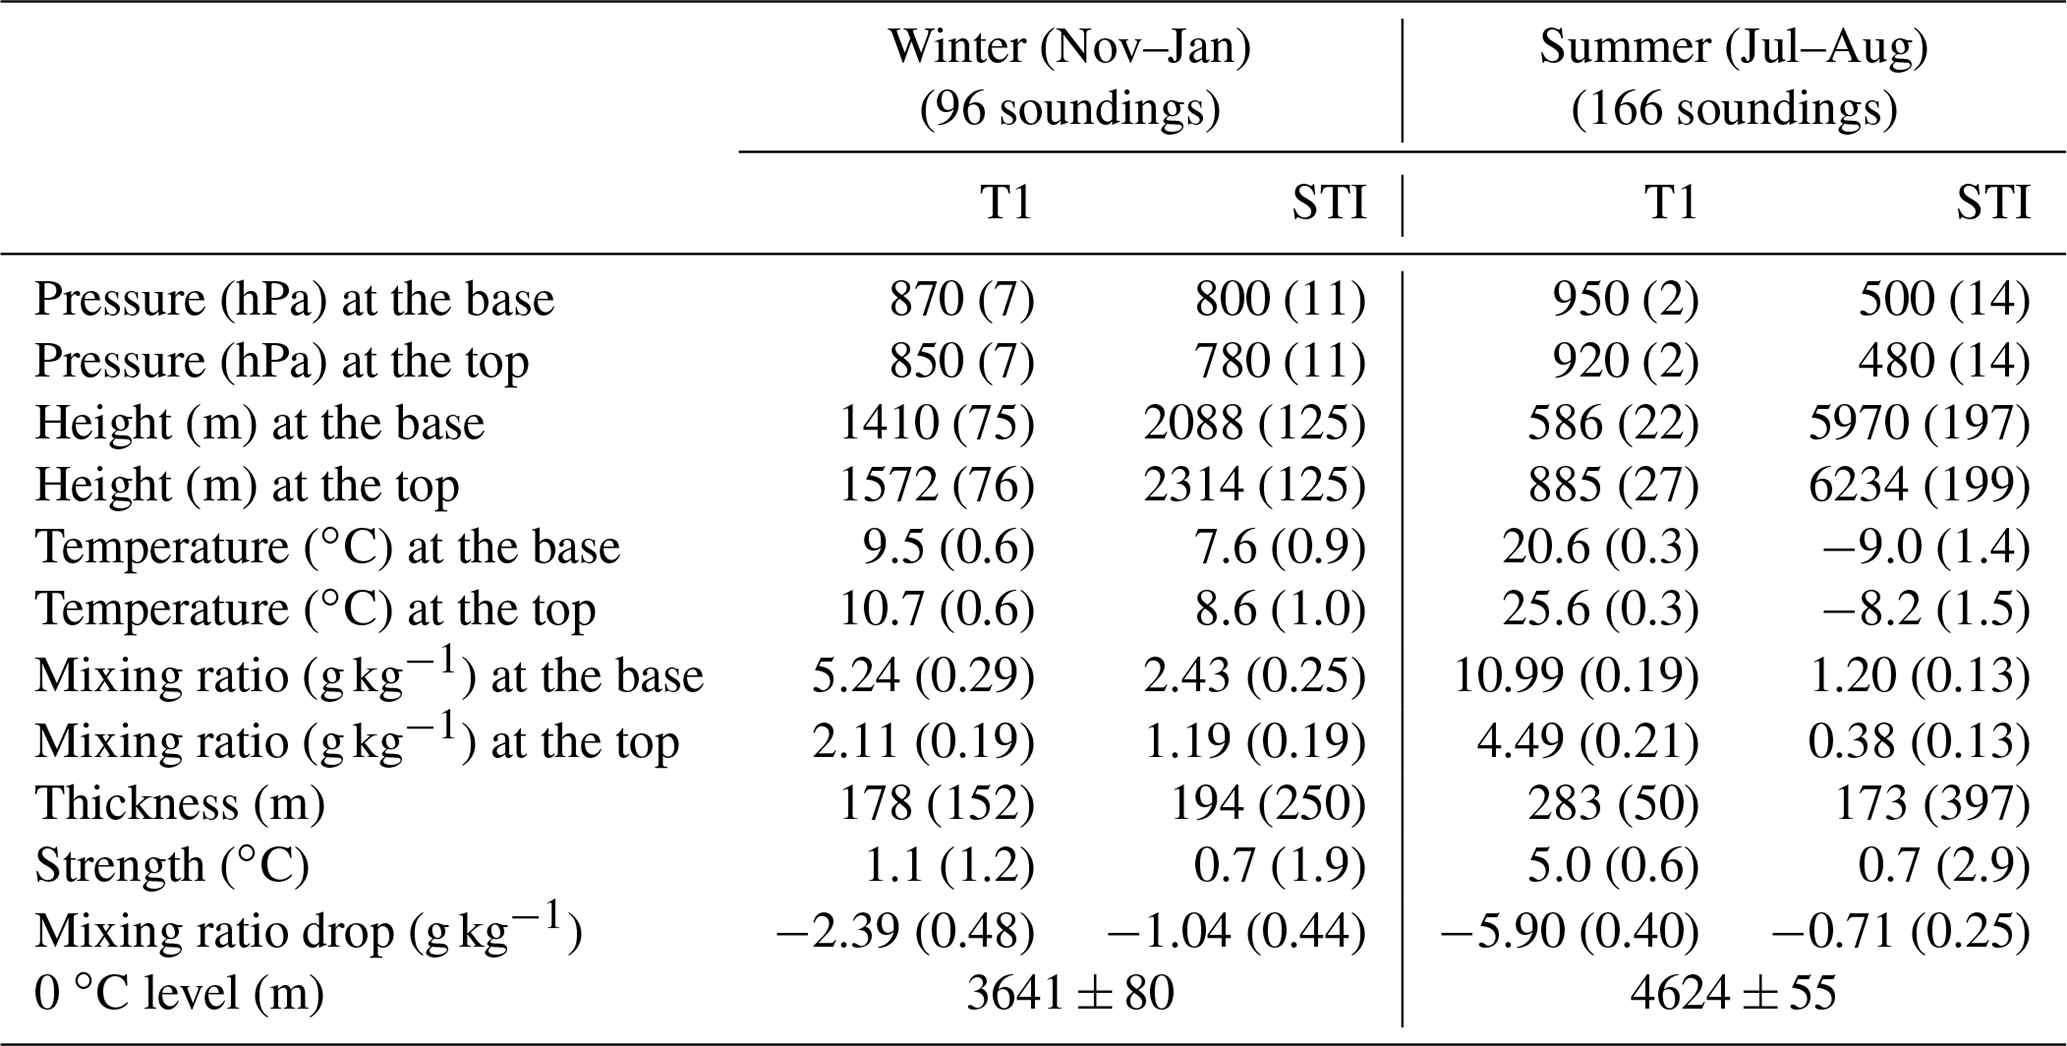
We used a total of 3529 lidar vertical cloud-free profiles (173 d) for summer and 2437 lidar cloud-free profiles (corresponding to 105 d) for winter. The main features of each dust scenario are shown in both Fig. 2 and Table 2. Average LR of 19 sr (summer) and 15 sr (winter) have been retrieved for the first layer, and 47 sr (summer) and 51 sr (winter) for the second layer. These LRs are consistent with the LR values reported by Berjón et al. (2019).
4.2.1 Saharan scenario in summer (summer-SAL)
In this season, a deep African CBL is established over North Africa (Sahara) due to the turbulent and convective fluxes of sensible heat from the hot surface. The temperature gradient in the lower troposphere (e.g. 925 hPa) between Tenerife and a point located 500 km away in the Western Sahara is roughly 10 K or higher (Fig. S5a), and a strong trade wind regime is established (Carrillo et al., 2016). This results in a cold and humid MBL that becomes an impenetrable barrier to the hot dust-laden SAL. When the SAL moves westwards over the subtropical North Atlantic, it often extends to 5–6 km height. Its base lifts over a cooler, denser and moister maritime air occupying the MBL. The superposition of these two very different air masses produces substantial changes in the vertical structure of the subtropical troposphere over the North Atlantic that can be identified well by comparing Figs. 1b and 2a.
Table 2Main statistics of the atmospheric vertical structure extracted from atmospheric soundings (median values) for winter and summer seasons. Standard error of the mean (SEM) is also included.
The base of the SAL reinforces the temperature inversion at the top of the MBL observed before the SAL intrusion (strength of the MBI inversion of 5 K from Table 2), causing the narrowing of the MBL (Fig. 2a). In the Supplement, we show a version of Fig. 2 that includes relative humidity (RH) (Fig. S4). In some cases, the MBL may be reduced to less than 500 m depth (Alastuey et al., 2005). The MBL retains its characteristics of θ and r, with the highest humidity confined to lower levels, with a maximum in r (∼ 11.6 g kg−1) at ∼ 200 m. The change in wind direction at this level, from NE to N–NE, points to the presence of two different layers, the MBL and the TWL that lies above. These results are similar to those found in the clean scenario in summer (Fig. 1b), and they are in concordance with the results of Carrillo et al. (2016). These two layers (MBL and TWL) are represented in Fig. 2 as shaded in light and dark blue, respectively. At surface level, θ does not change its value of ∼ 297 K found in summer-clean conditions, although α increases slightly up to values of 0.049 km−1, a 48 % higher in reference to the α maximum found in the summer-clean scenario at surface level (0.033 km−1). This residual dust found in the MBL underneath the SAL, also reported by other authors (i.e. Reid et al., 2003), is a result of turbulent mixing caused by wind shear in the transition region between the MBL and SAL (Colarco et al., 2003a, b; Rittmeister et al., 2017). The increase in temperature and the drying of the MBL top causes the condensation level to no longer be reached at the MBI height, dissipating the sea of clouds (stratocumulus) (see Sect. 7). A pronounced decrease in atmospheric moisture (lower r values by 3.5 g kg−1) and a negative θe vertical gradient is found above the MBI, with a minimum θe value at ∼ 1.1 km, matching the MBL's top. This level coincides with the minimum aerosol concentration and, as a result, indicates the limit between different air masses.
Above the MBL, the SAL maintains unchanged much of its original characteristics acquired when it was formed over the Sahara, even though its base has risen above the MBL and its top is capped by a temperature inversion (STI) (Carlson, 2016). The STI is located between 6.0 and 6.2 km in altitude. This feature is also confirmed by the θ vertical gradient, indicating 6.0–6.5 km height as the end of the well-mixed SAL layer, coinciding with the height of neutral or slightly positive θ and θe vertical gradients. The warm SAL maintains an almost constant θe at ∼ 327 K and θ at ∼ 318 K over a large part of its vertical extension, from 2.5 to 5 km height, which is the typical temperature of the mixing layer over the Sahara. The θ value within the SAL is consistent with those found by other authors, ∼ 316 K by Carlson (2016), ∼ 317 K by Carlson and Prospero (1972); Garcia-Carreras et al. (2015), and ∼ 315 K by Gutleben et al. (2019). In terms of aerosol load, the SAL likely maintains a similar dust content to that when it was formed over the continent, with aerosol extinction coefficients > 0.065 km−1. The maximum aerosol load is located slightly higher than the IZO level (2.5 km, 0.066 km−1). A sharp decrease in α is observed near the top of this layer in coincidence with an increase in the RH profile (Fig. S4), with a maximum of 47 % at 5.2–5.5 km height, ∼ 1 km below the STI level. It is noteworthy that the SAL has a water vapour content much higher (∼ 2 g kg−1) than that of the clean free troposphere over the subtropical North Atlantic, as Andrey et al. (2014) has reported.
Thus, in terms of its vertical features, the SAL is characterised by a well-mixed layer with a generally fairly constant potential temperature, vapour mixing ratio, dust particle concentration and size distribution with height (Maring et al., 2003). This relatively unchanged vertical thermodynamic structure, a consequence of the persistent temperature inversions located at the top and the base of the SAL, colder (near the top) and warmer (at the base) conditions than its surroundings (Jury and Whitehall, 2010), and the vertical mixing processes within the layer (Gasteiger et al., 2017), explains the longevity of this air mass and the higher than expected retention of coarse-mode particles during the long-range transport. According to Ryder et al. (2018) and references therein, this internal mixing is hypothesised to be sustained by vertical convection (mixing) by solar absorption, turbulence or electrostatic charging. This, together with the fact that the subtropical North Atlantic troposphere is basically barotropic in summer, means that the SAL can travel thousands of kilometres while maintaining its main thermodynamic properties and aerosol content.
Regarding the iso-zero level, our results indicate that this isotherm altitude is found 190 m lower than in the summer-clean scenario, indicating the presence of colder air at higher levels compared to the clean scenario.
The wind regime within the MBL corresponds to marine-aerosol-laden trade wind flow (NE), while the dust-laden SW airflow is predominant within the SAL layer. Similar to the clean scenario in summer (Fig. 1b), two different wind regimes are found in the lower levels, pointing to the presence of both MBL and TWL below the SAL. Maximum wind values are found at altitudes slightly below 6 km, coinciding with the maximum humidity change within the SAL layer (reduction of 63 % in r values between 5.5 and 6.3 km, the STI height). The summer-SAL is also identified by a counter-clockwise rotation (warm advection) of winds near the α peak. In fact, maximum shear in wind direction is found at 2.3 km and at 1.6, 2.5, and 6.3 km in the case of the maximum shear in the wind speed, a good match to the height of the lower part of the SAL, the dust peak and the STI, respectively.
Some of the characteristics of the lower middle troposphere vertical profile over the subtropical North Atlantic region in summer will be better understood once the SAL's impact is analysed in Sects. 5 and 6.
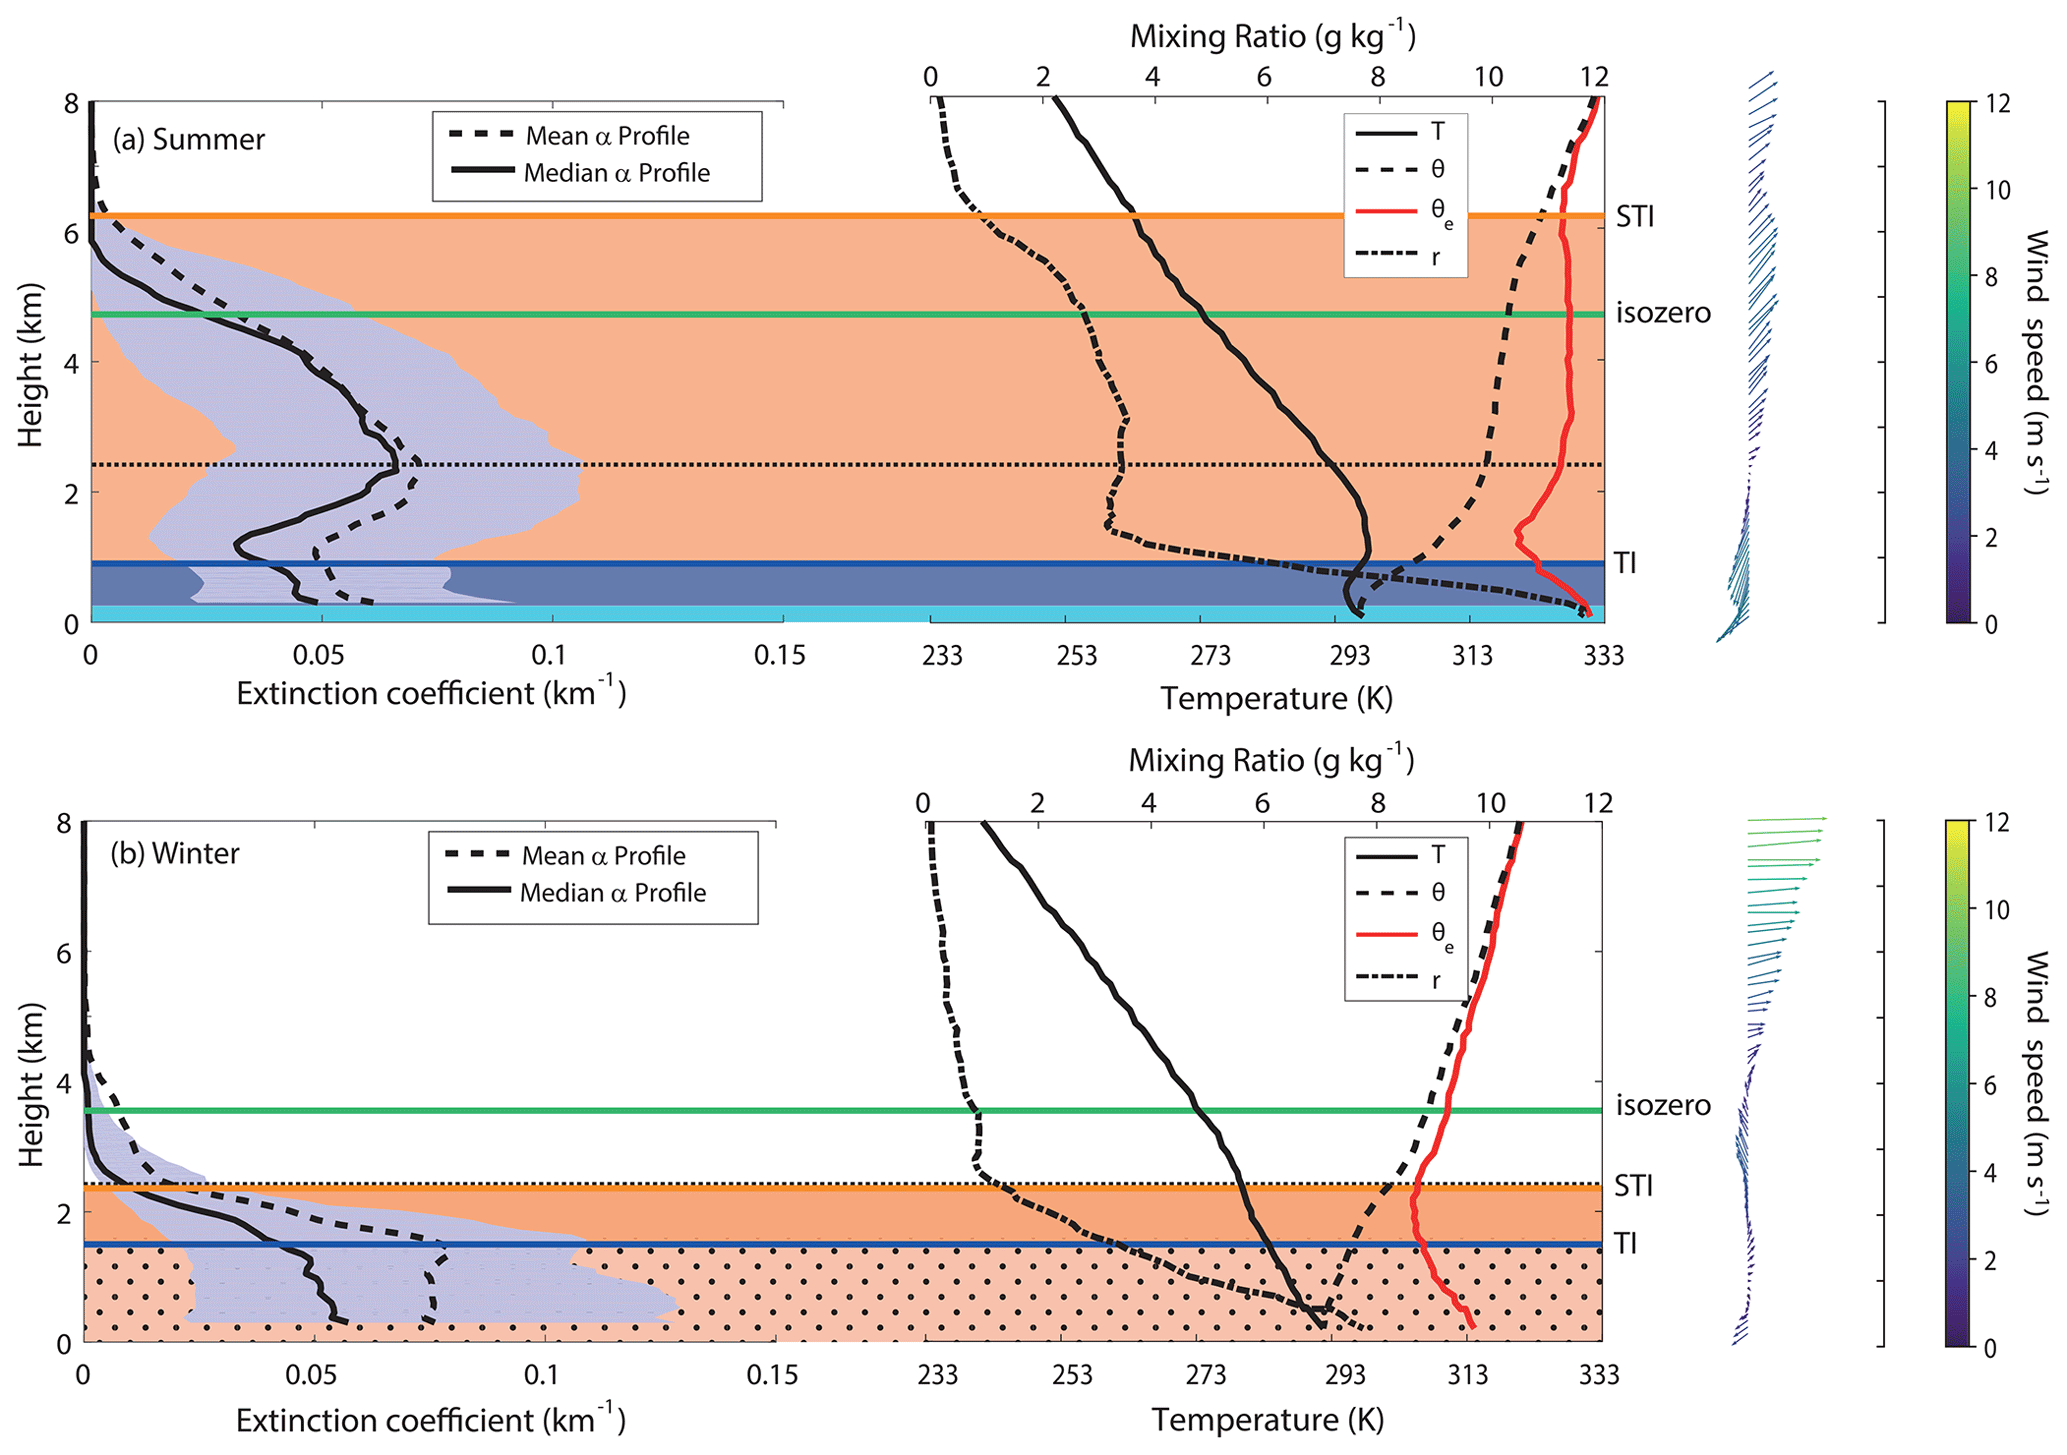
Figure 2The same as Fig. 1 but for Saharan scenarios in (a) summer and (b) winter. Dark and light blue areas in summer indicate the trade wind layer (TWL) and the marine boundary layer (MBL), respectively. Orange-shaded areas indicate the presence of the Saharan Air Layer (SAL). Orange-shaded areas with black spots in winter indicate a mixture of the SAL with the MBL.
4.2.2 Saharan scenario in winter (winter-SAL)
The winter dust intrusions over the subtropical eastern North Atlantic region are characterised by the presence of a relatively thin SAL reaching lower altitudes than the summer-SAL (up to about 2 km height). In this season, the temperature difference in the lower troposphere (e.g. 925 hPa) between Tenerife and a point located 500 km away in the Western Sahara is barely 2 K (Fig. S5b), and the flow associated with the trade wind regime is very weak (Carrillo et al., 2016). Thus, the winter-SAL penetrates the MBL mixing dust with marine aerosols.
Two different layers are observed in the vertical extinction profile in Fig. 2b below the IZO level: the MBL mixed with dust below the MBI and a relatively narrow layer of the original SAL just above this transition layer. The first α maximum, located at 1.2 km, presents median extinction coefficients of 0.057 km−1 that correspond to a mixture of mineral dust with marine aerosol, considerably higher than the maximum value found at these levels in the clean scenario in winter (0.036 km−1 as seen in Fig. 1d). It can be seen that dust conditions were also affecting SCO, with the extinction coefficient being almost 2 times higher than the value found in clean conditions (α of 0.032 km−1 as seen in Fig. 1d).
From the thermodynamic profiles, we observe that the MBL contains the maximum mixing ratio (r∼7.76 g kg−1) located at surface level. It suggests the atmosphere at lower levels is considerably drier than in clean conditions in winter when we found a peak in r of 8.76 g kg−1 at similar levels (reduction of 11 % relative to clean conditions). This layer presents a nearly stable α (0.057–0.049 km−1) and is followed by a transition layer capped by a strong change in the vertical humidity gradient. The second elevated layer is associated with the impact of the SAL on the lower FT with maximum α values (∼ 0.049 km−1) located at 1.3 km height. A continuous decrease in atmospheric moisture with altitude (r values of 1.57 g kg−1 in the MBI) is observed in this layer, with a minimum in θe observed at 2.3 km.
The weakness of the temperature inversion in this scenario (only 1.1 K) denotes that there is no marked decoupling between layers. We note the significant difference between mean and median α values at all levels, pointing to the occurrence of SAL intrusions of very different intensities. We have not found a significant reduction in the iso-zero level in comparison to the clean scenario in winter.
Wind vectors show the presence of NE wind component at the surface (Fig. 2b), indicative of the trade wind regime, followed by a cold advection (anti-clockwise rotation of wind with height) characterised by SW airflows laden with Saharan mineral dust within the SAL layer. High values of the wind shear are found at 2.4 km, coinciding with the STI. SE winds are observed to be the dominant pattern in CFT conditions up to 4 km, and the normal western pattern is retrieved above this level.
In order to understand the impact of the SAL on the subtropical atmospheric vertical structure, we have displayed in Fig. 3 the differences in T, r and α profiles between the summer and winter Saharan scenarios and their corresponding clean scenarios. The magnitude of the previous differences depends on the seasonal values of these parameters in the subtropical troposphere in addition to their seasonal values of the advected Saharan air mass.
In the case of the summer-SAL, these differences are readily appreciated, up to 6 K warmer at lower levels (Fig. 3a), in response to both the SAL radiative impact (Sect. 6) and the warm advection of dusty Saharan air masses. Negative temperature differences of up to 2 K are found at 5.2 km. This cooling effect results in an inversion at the summer-SAL top corresponding to the upper limit of the dust layer. In contrast, we can describe the winter-SAL, when dust transportation is confined to lower levels, as a layer with negligible impact in terms of T at lower levels (Fig. 3d). However, the T profile from 2 km up is roughly 3 K cooler than in clean conditions.
Our results show that the SAL also has a strong impact on atmospheric humidity (Fig. 5b and e), similar to the results presented by Dunion and Marron (2008); Andrey et al. (2014). Our results present the SAL as a dry layer at lower levels in both summer and winter. We observe negative r anomalies (Fig. 3b) at the SAL's base in the case of the summer-SAL (Δr∼ −3.6 g kg−1) and slightly higher α anomalies (Δα∼ +48 %) compared to clean summertime conditions. Regarding higher levels, positive and rather constant r anomalies of about 2 g kg−1 are found in the summer-SAL from the dust peak up to 5 km. These r anomalies, although small as absolute values, represent a high relative variation in comparison to the extremely dry FT under clean conditions (Δr up to +332 % at 5.3 km, roughly coinciding with the altitude of the maximum cooling). As a consequence, the SAL appears as a relatively moist layer at mid-levels. The anomaly in α peaks at 2.6 km, where maximum extinction values are commonly retrieved (Fig. 3c). The winter-SAL at lower levels is characterised by mixing ratio anomalies up to ∼ −3.0 g kg−1 (dry anomaly) below the SAL (Δr of −38 % at 1 km) (Fig. 3e), similar to those observed in the summer-SAL at similar levels. High α anomalies were also observed in the MBL (maximum values of Δα∼ +118 % located in the dust peak level) (Fig. 3f), with no significant anomaly in terms of r or α at higher levels.
The fact that the SAL in summer presents a significant and positive anomaly in water vapour content in the subtropics, as shown in this study, is consistent with previous results (i.e. Andrey et al., 2014; Kim et al., 2004; Gutleben et al., 2019, 2020, among others). This result shows that, despite being a dry layer, the SAL in the subtropical region is more humid than the clean FT around it. This fact is relevant since water vapour is a gas strongly absorbing longwave radiation. Consequently, moisture carried on the SAL can play a key role in the atmospheric radiative balance, depending on its vertical distribution, and therefore in the temporal evolution of the vertical structure of the SAL itself, as discussed in Sect. 6.
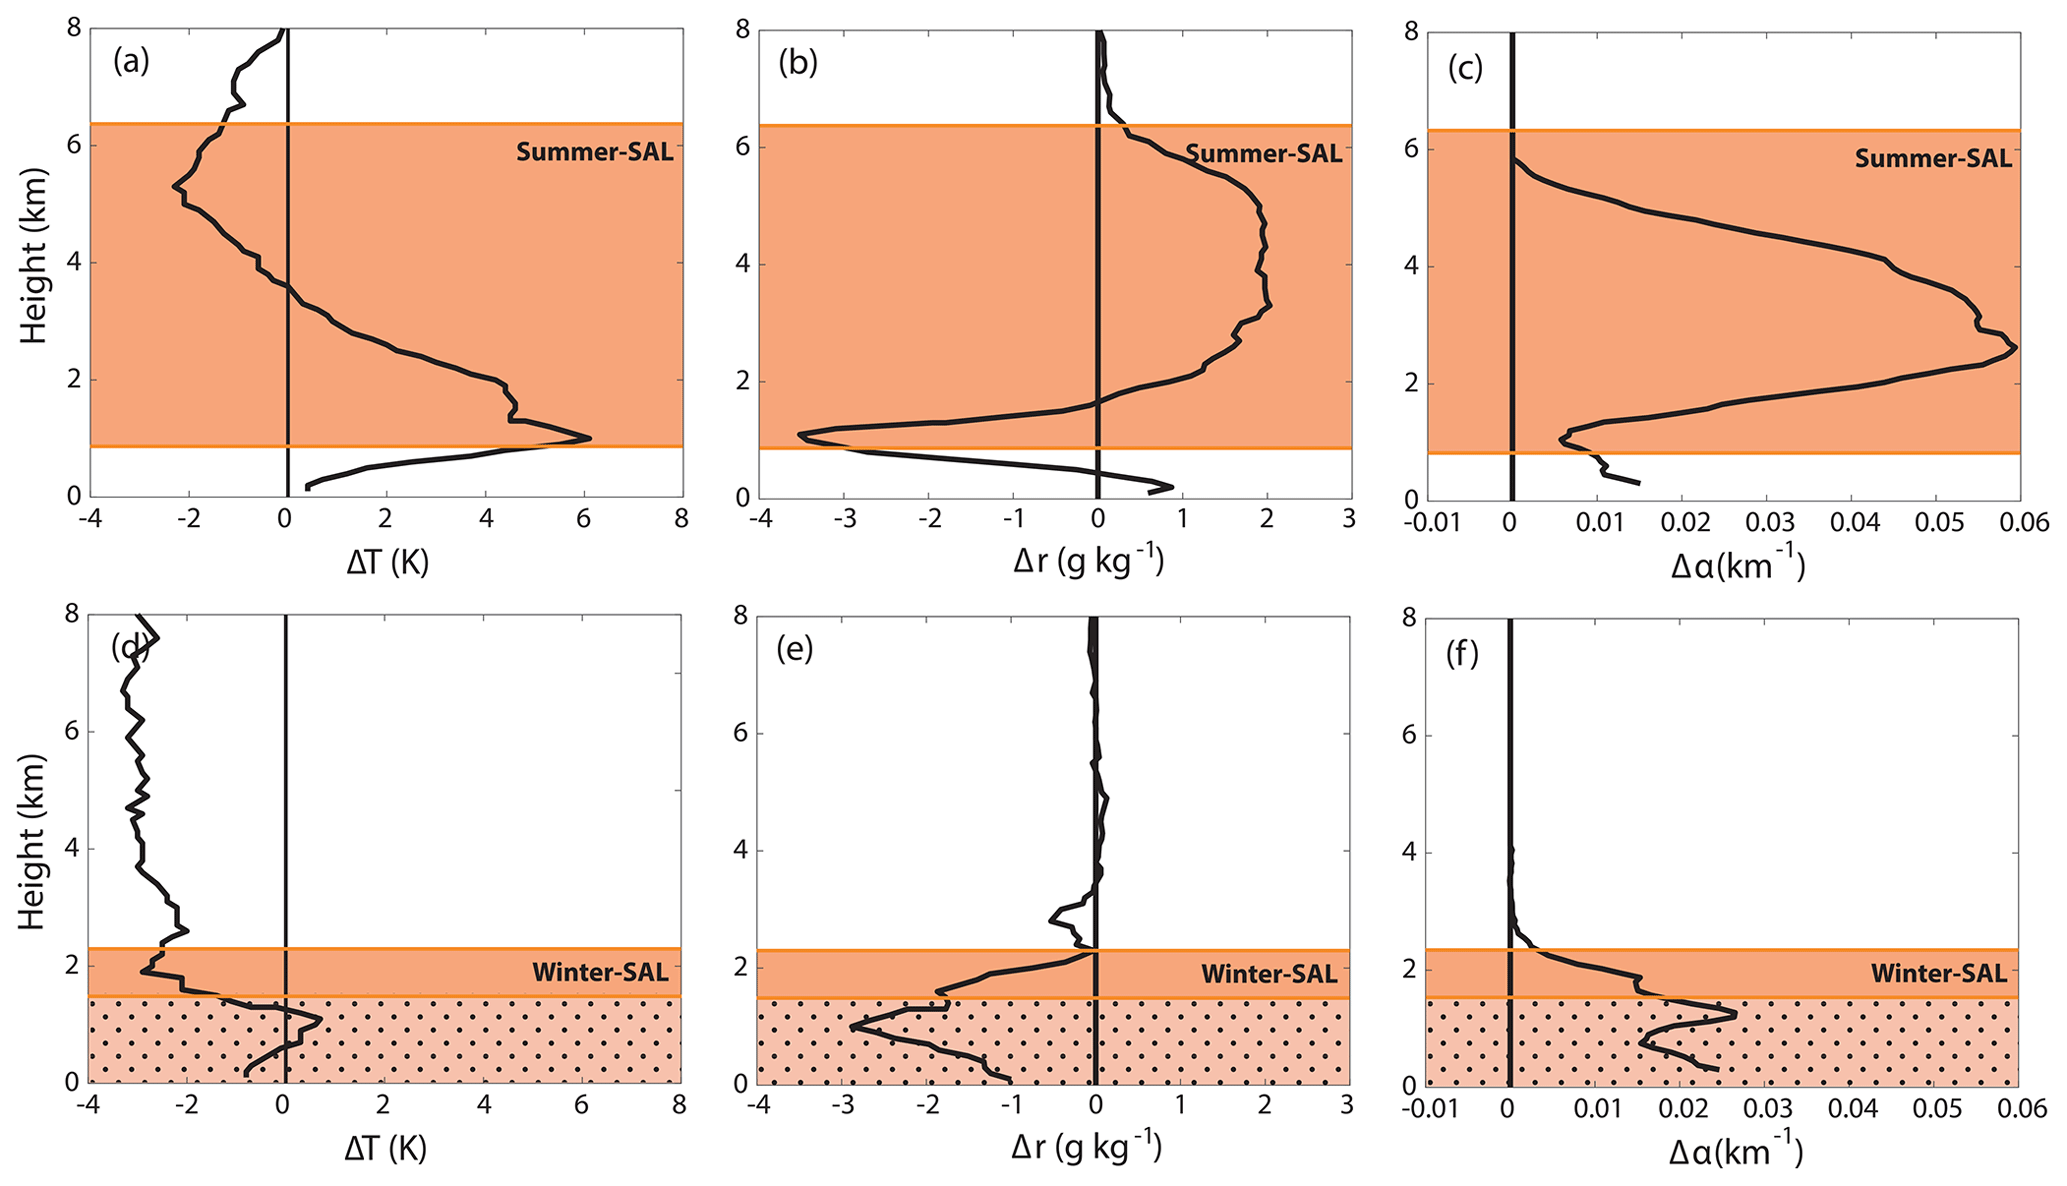
Figure 3Differences between Saharan and clean scenarios in summer and winter in terms of temperature (T) and water vapour mixing ratio (r), with both magnitudes retrieved from radiosondes, and extinction coefficient (α) from micropulse lidar (MPL) elastic backscatter lidar. Orange-shaded areas indicate the presence of the Saharan Air Layer (SAL). The orange-shaded area with black spots in winter indicates a mixture of SAL with the marine boundary layer (MBL).
Several papers in the literature have been focused on determining the SAL radiative effects in summer (Carlson and Benjamin, 1980; Kim et al., 2004; Wong et al., 2009; Chen et al., 2010; Gutleben et al., 2019, 2020). These authors found that under clear sky conditions the net radiative effect, a combination of LW and SW interactions, results in maximum net heating located slightly below the maximum dust concentration level and also a minor net heating observed near the surface. The existence of significant heating rates (∼ 1 K d−1 between 500 and 1000 hPa) indicates the important role of dust in stabilising the atmosphere, the same as, for example, the enhancement of a pre-existing trade wind temperature inversion found by Chen et al. (2010) as a result of the SAL layer above. In addition, cold anomalies above the SAL are hypothesised as the result of the strong vertical ascent of warm air due to the net warming within the SAL, yielding to an adiabatic cooling in these upper layers (Dunion and Marron, 2008; Wong et al., 2009; Chen et al., 2010). However, other authors (Kim et al., 2004; Gutleben et al., 2019, 2020) attributed an important role in the aforementioned vertical radiative heating rates to the enhanced atmospheric water vapour within the SAL. As a result, both dust and dry anomalies play an important role in heating of the SAL in the lower troposphere within the MBL (Wong et al., 2009).

Figure 4(a) Median potential temperature (θ) and water vapour mixing ratio (r) profiles extracted from the radiosondes and median lidar extinction (α) profiles at 523 nm for summer-clean and summer-SAL scenarios. (b) Diurnal averaged heating rates simulated with LibRadtran using MOPSMAP inputs for the scenarios summer-SAL (solid lines) and summer-clean* (dashed lines). Dust contribution to total heating is also included with dotted lines. The orange-shaded area indicates the presence of the Saharan Air Layer (SAL), while the dark and light blue areas represent the trade wind layer (TWL) and the marine boundary layer (MBL), respectively.
Atmospheric heating rates have been calculated using the radiative transfer model LibRadtran (see Sect. 3.5) in order to detect the vertical radiative impact of the dust layer in summer and winter. As we have shown in the previous section, this dust-laden layer acts by significantly modifying the thermodynamic profiles in the lower middle troposphere.
Diurnal-averaged heating rates have been retrieved for two different cases. The first case, representative of the real atmospheric conditions under the presence of the summer-SAL or winter-SAL, includes the median T, r (or RH) and α representative of each scenario (Sect. 4.2.1 and 4.2.2, respectively). A second case has been considered including the same median thermodynamic soundings as in the previous dusty scenarios but using the median α profiles representative of clean conditions (retrieved in Sect. 4.1). These scenarios, called summer-clean* and winter-clean*, are not real but can be used to separate contributions of mineral dust and water vapour to the radiative forcing in the atmospheric column. This approach is similar to that carried out in previous studies (Kim et al., 2004; Gutleben et al., 2019, 2020).
Simulations have been done including in LibRadtran spectral information of α, SSA and g extracted from MOPSMAP (Gasteiger and Wiegner, 2018) (see Sect. 3.5). In the case of both summer-SAL and winter-SAL scenarios, a mixture of maritime clean and desert dust aerosol types have been considered to form the MBL, and only desert dust aerosols are considered to form the atmosphere above this layer. In the case of the summer-clean* and winter-clean* scenarios, only maritime clean aerosols have been considered. MOPSMAP spectral resolution of these optical aerosol properties depends on the spectral range, being modelled between 400 and 1000 nm with a spectral resolution of 10 nm, between 1000 and 3000 nm with a resolution of 500 nm, and finally with a spectral resolution of 3000 nm in the range 3000 nm to 40 µm. Spectral AE retrieved from MOPSMAP has been used to calculate the α profiles at the other wavelengths by applying the Ångström power law (, ) once the vertical profile from the lidar at 523 nm is known.
Figure 4a shows T, r and α profiles for the summer-clean and the summer-SAL scenarios, while Fig. 4b presents the comparison of the modelled output heating rates (in K d−1) for the same scenarios. The maximum heating rate due to mineral dust (differences between the summer-SAL and the summer-clean* atmospheres) is +0.7 and −0.15 K d−1 for SW and LW (dotted lines in Fig. 4b), respectively, located at about 2.5 and 3 km, near the dust concentration peak. Following Chen et al. (2010), the net radiative effect near the surface is a balance between absorption heating, extinction cooling, emission cooling, and adiabatic heating and cooling. In our case, we have found net heating near the surface dominated by the SW forcing, attributed to the net effect of mineral dust (SW absorption and LW cooling). This result is consistent with previous studies in the literature (Carlson and Benjamin, 1980; Kim et al., 2004; Wong et al., 2009; Chen et al., 2010; Zhu et al., 2007) that found an expected and dominating dust-induced SW radiative warming slightly below the dust maximum. Below this dust peak, a weaker SW effect is expected, dominated by dust extinction processes. We have actually observed that LW dominates below the dust peak through upwards and downwards emission processes (Zhu et al., 2007). The mean net heating rate due to mineral dust observed in the first 1 km height is +0.34 and +0.13 K d−1 for SW and LW, respectively. The LW warming found at surface level has been also observed by Chen et al. (2010), who attributed it to the combined effect of dust LW absorption, reflection and re-emission processes at lower levels. Above 6 km the heating rate due to aerosols does not show any change due to the absence of dust. However, in view of Fig. 4b, one can see how the real summer-SAL radiative impact is characterised by a strong cold anomaly near the SAL's top that cannot be attributed to the solely radiative effect of mineral dust. This cold anomaly, also observed by other authors (Dunion and Marron, 2008; Wong et al., 2009; Chen et al., 2010; Gutleben et al., 2019, 2020), is consistent with the temperature difference of about −2 K (Fig. 3a) and also with the 190 m descent from iso-zero height level (Tables 1 and 2). Figure 4b quantifies the net summer-SAL heating rate to be −0.6 K at the SAL's top. Maximum LW cooling (−3.6 K d−1) is observed at 5.9 km, while maximum SW heating (3.5 K d−1) is observed slightly below, at 5.6 km, both located near the maximum RH peak within the SAL (see Fig. S4). Net warming is observed to occur within the SAL (from 2.1 to 5.7 km), with relatively constant heating rates of about 0.8 K d−1 in an altitude range between 3.5 and 5.1 km. Atmospheric water vapour absorbs part of the SW radiation, with a maximum effect found in the position of the RH peak within the SAL (5.6 km). LW cooling due to water vapour is attributed to the LW emission without absorption (adiabatic cooling) in the top of the SAL (maximum cooling found at 5.9 km), induced by the strong vertical ascent of air near the STI, acting as a thermodynamic layer of discontinuity between two different air masses.
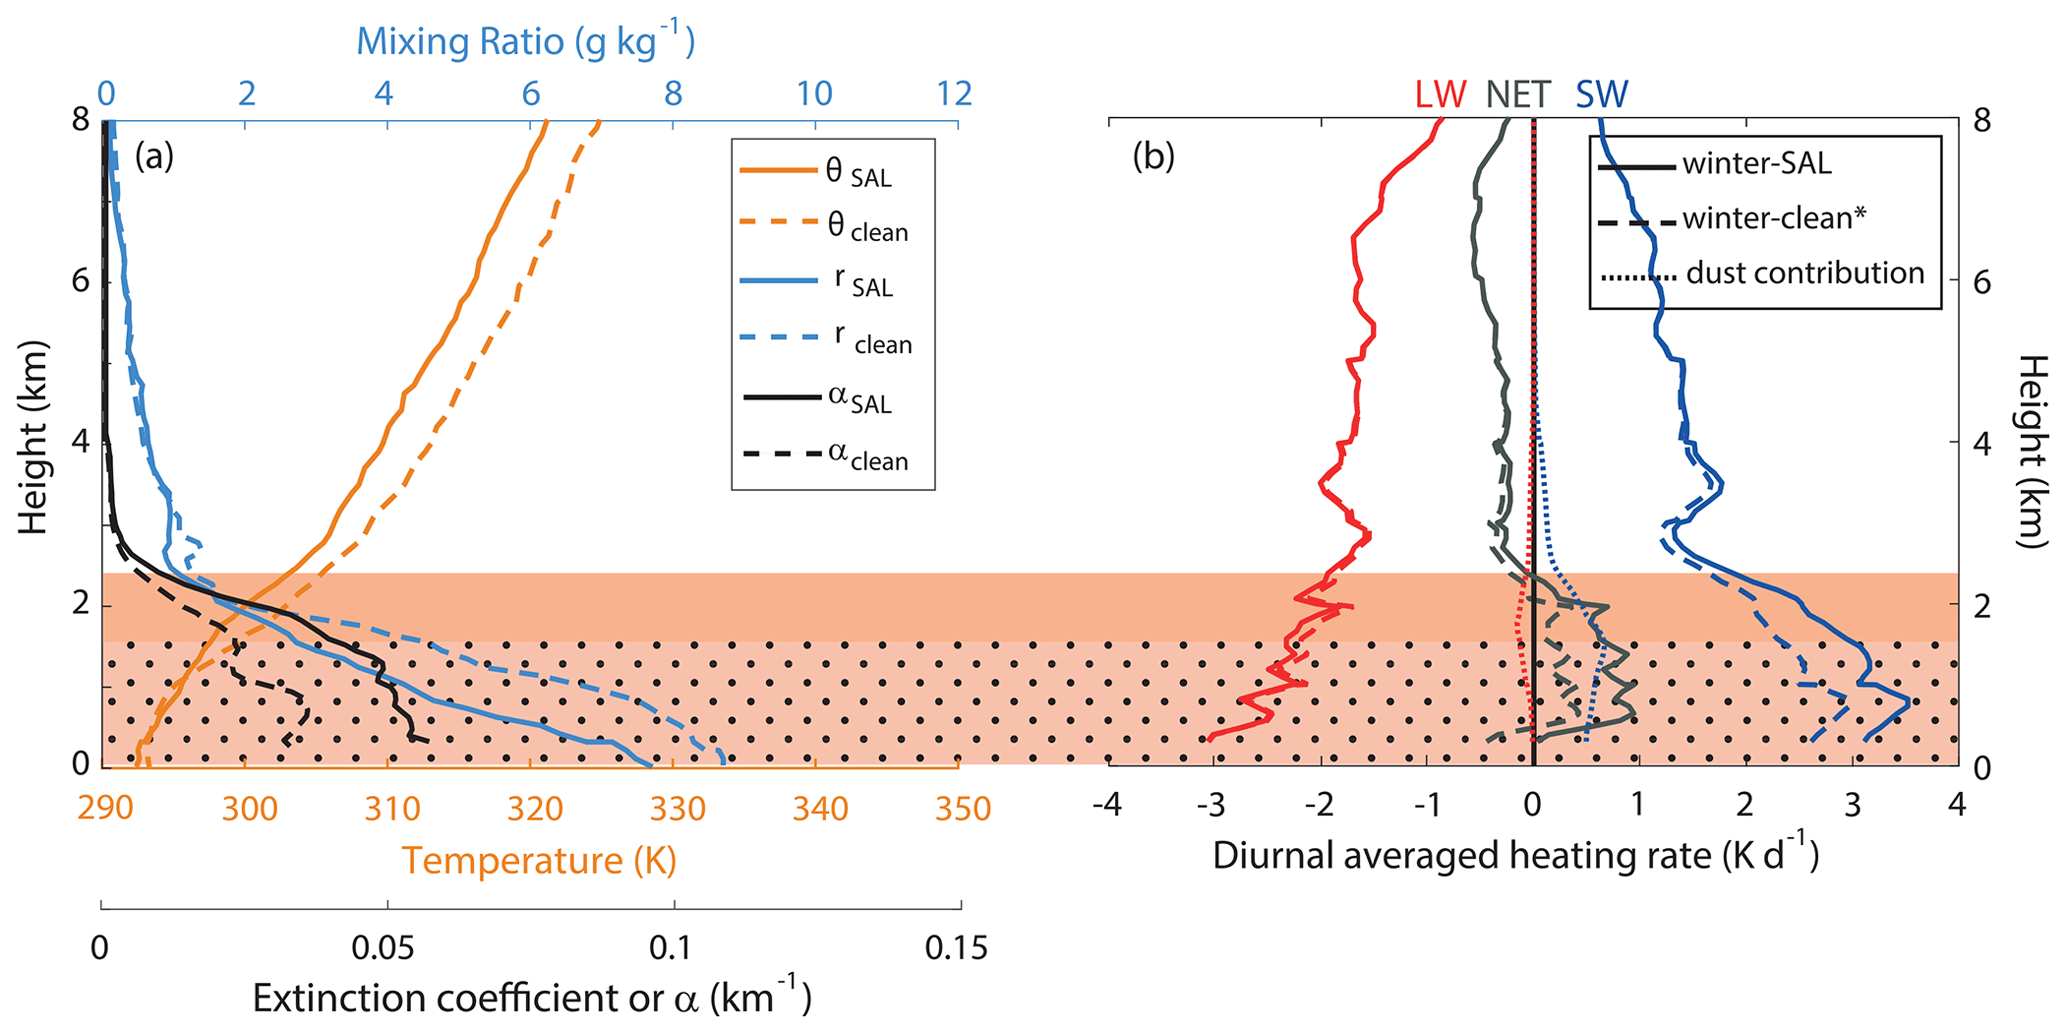
Figure 5The same as Fig. 4 but for winter-clean and winter-SAL scenarios. The orange-shaded area indicates the presence of the Saharan Air Layer (SAL), while the orange-shaded area with black spots indicate a mixture of the SAL with the marine boundary layer (MBL).
Our results highlight the important radiative role played by the water vapour on the atmospheric column in the summer-SAL scenario, not only in the cold anomaly near the STI but also at lower levels, counteracting the warming effect of aerosols in the SW. This is a relevant aspect to consider, especially in atmospheric modelling. Dust models might certainly introduce an overestimation of the aerosol radiative effect within the SAL if the water vapour radiative effect is obviated.
The same analysis in terms of modelled output heating rates (in K d−1) has been performed for the winter-clean and winter-dust scenarios (Fig. 5). As in the previous case of summer, the radiative effect of dust has been estimated by means of the heating rate differences between winter-SAL and winter-clean* atmospheres. We have observed a dust-induced radiative effect dominated by SW heating (maximum heating of +0.7 K d−1 at 1.5 km, near the dust peak), while below the dust peak the SW effect becomes lower. LW cooling is also maximum near the α peak (−0.13 K d−1). However, the real winter-SAL radiative impact presents maximum SW heating rates up to +3.5 K d−1 at 0.8 km (near the MBI), while the maximum LW cooling is found near the surface (−3.1 K d−1) (in Fig. 5). The net effect within the surface layer (MBL and SAL) implies a small and rather constant SW warming of about +0.7 K d−1 in the 0.6–2 km layer. This net heating near the surface is attributed to the combined effect of dominant dust SW heating and the predominant effect of water vapour SW absorption at these levels. Above the SAL, the net radiative effect is dominated by the dry anomaly of the winter-SAL in comparison to clean conditions. This removal of water vapour in the first 2 km reduces the greenhouse trapping of LW radiation, with an LW cooling effect of about +0.3 K d−1 (Wong et al., 2009). As a result, dry anomalies in the first levels have the consequence of thermal cooling (decrease in the net upward longwave flux) from the top of the SAL upwards. In this winter case, the SAL also impacts the atmospheric column, from the dry anomaly at lower levels to the thermal cooling at higher levels.
The previous findings, in addition to those on Sect. 5, allow us to assess the role of the thermal advection on the differences observed on the vertical temperature profiles taking place within the summer-SAL and winter-SAL. According to Fig. 3a, a temperature difference between the Saharan and the clean scenarios greater than 3 K occurs between 0.8 m and 2.5 km height, registering the maximum temperature increase in the presence of SAL at ∼ 1 km height, with a ΔT= +6 K. This height is precisely where the maximum net radiative forcing cooling is recorded in the lower troposphere (−0.5 K d−1 as shown in Fig. 4). This result might lead us to conclude that the warm air advection from the Sahara is the major driver of the temperature increase observed in this altitude interval. An analysis based on composites of average potential temperature from the NCEP/NCAR Reanalysis (Kalnay et al., 1996) in summer (July and August) in the time period 2007–2018 has served us to estimate the thermal advection at the Canary Islands from the warmest region of the Sahara, located over western central Algeria around the Greenwich meridian. This analysis (shown in Supplement Fig. S5a) estimated an increase in temperature of up to +9 K at 1 km height due to this warm advection. Thus, we can say that the advection dominates between 800 m and 2.5 km height, but the radiative processes are more important below 800 m in the MBL (heating), between 2.5 and 6 km (heating), and above 6 km (cooling). In winter, there is practically no temperature gradient between the ocean and the African continent in the troposphere (Fig. S5b), and thus temperature advection processes are not relevant. A more realistic separation of the effects of temperature advection from that of radiative processes would be possible with dust model simulations that allow for the activation and deactivation of the radiative processes of mineral dust and water vapour, a capability that is out of the scope of this paper.
As we have shown in Sects. 5 and 6, both SAL's dust and humidity anomalies profoundly change the vertical radiative fluxes. The relative frequency of cloud types from MPL data for both Saharan and clean scenarios for winter and summer has been calculated using the methodology described in Sect. 3.6 in order to explore the effect of SAL radiative impact on cloud formation. The cloud type distribution is shown in Fig. 6a and b for winter and summer, respectively. Analogous plots from cloud climatological and total sky camera observations at 13:00 UTC are shown in Fig. S6 of the Supplement. A notable reduction of low clouds in the case of the Saharan scenario (winter and summer) in comparison to clean conditions is observed using MPL data (Fig. 6a and b). On the contrary, a higher occurrence of mid- and high-level clouds under the summer-SAL scenario are observed in Fig. 6b (23 % under Saharan conditions versus 4 % in clean conditions). This pattern is corroborated, at least qualitatively, using direct and independent cloud observations (Fig. S6). Although the reduction in low-level clouds is observed for both winter-SAL and summer-SAL, the reduction is more prominent in summer, when the probability of occurrence of low clouds is reduced from 40 % in summer-clean conditions to 5 % under SAL conditions (Fig. 6b). In winter, this drop in low clouds is less pronounced, with a reduction from 25 % (winter-clean conditions) to ∼ 4 % (winter-SAL conditions). This observed reduction is explained taking into account that the SAL transports dryer air at lower levels in comparison to the MBL's air humidity (both in summer and winter), and therefore both the lifting condensation level and the level of free convection rise, increasing the energetic barrier to convection (Wong and Dessler, 2005). This low-level warming affects both summer (1.4 K d−1) and winter (0.8 K d−1) radiative fluxes, inhibiting the occurrence of convection, causing vertical changes or dissipation of clouds. However, there are some differences between cloud suppression in the summer-SAL and winter-SAL. In summer, SAL carries not only drier air but also warmer air masses, compressing the MBL in the first kilometre because of the enhanced subsidence processes at this time of the year. In winter the occurrence of low-level clouds is lower than in summertime due to a weaker TWL (Carrillo et al., 2016; Azorin-Molina et al., 2018). Consequently, the SAL effect is expected to be lower in winter. The result is a Saharan air mass with a strong suppressive influence on cumulus convection above the moist trade wind layer, with a more prominent effect in summer (Carlson and Prospero, 1972), which can cause dust to be transported into the MBL due to entrainment at the base of the SAL much more rapidly than dust vertical transport caused by gravitational settling.
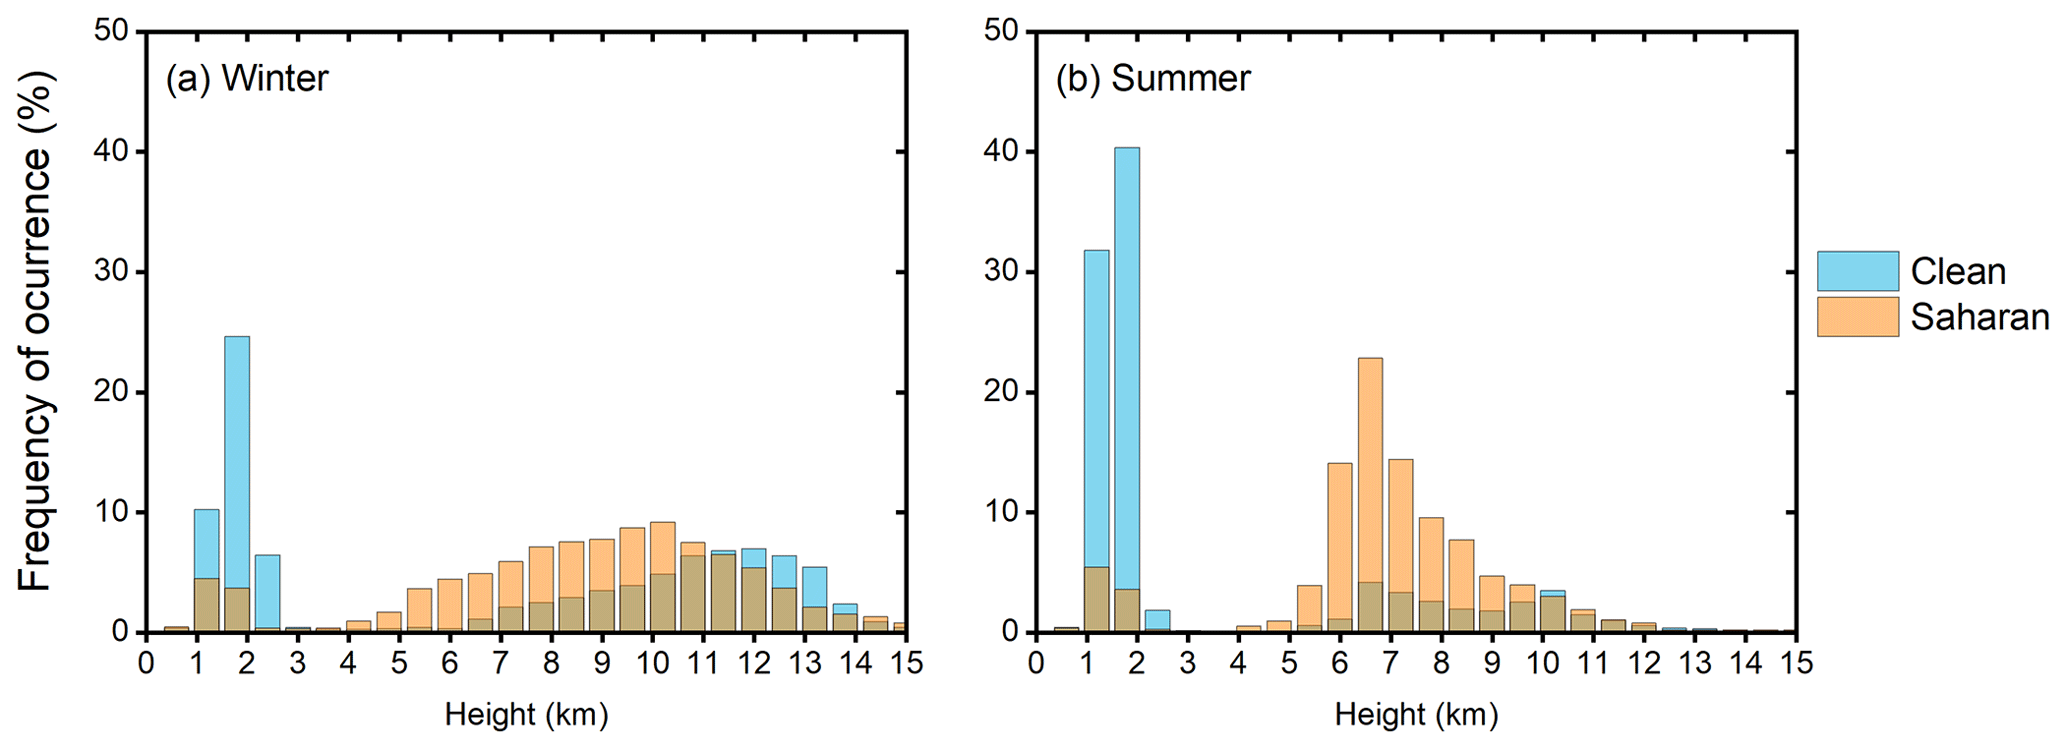
Figure 6Frequency of occurrence (%) of clouds detected by the MPL-3 lidar in the vertical column in (a) winter and (b) summer seasons under clean and Saharan conditions.
We can interpret some of the previous results in terms of the impact of dust on heterogeneous nucleation and the role of dust as ice nucleation particles (INPs) (Weinzierl et al., 2017). We know that nucleation of ice particles in the atmosphere occurs by homogeneous freezing conditions (at ∘C) in the absence of particles to catalyse ice formation and also by heterogeneous nucleation processes due to the presence of ice-nucleating particles. This last process can occur at any temperature below 0 ∘C and involves typically middle clouds composed of ice crystals and supercooled water droplets (Murray et al., 2012). Saharan dust is known to be capable of glaciating clouds at temperatures that are unusually warm, between −5 and −9 ∘C (Sassen et al., 2003), being this characteristic layer, typically consisting of altocumulus and altostratus, commonly found at the top of the near-adiabatic part of the profile, i.e. in the upper region of the SAL (Sassen et al., 2003; Parker et al., 2005). In our work, clouds observed under the summer-SAL influence are predominantly middle clouds (Fig. 6b), mostly located between 6 and 7 km height, coinciding with SAL's top (STI). Conversely, we have not observed any significant feature in the case of the comparison between clean and dusty scenarios in winter at mid-levels. These middle clouds under summer-SAL conditions are detected above the peak in RH (45 %–50 %) associated with the SAL layer (see Fig. S4) and also at altitudes higher than the iso-zero level (between 5 and 7 km). Temperatures at these altitudes are relatively warm, approximately between −9 and −15 ∘C according to the median temperature profile in Fig. 2a, which is in agreement with previous studies (Sassen et al., 2003).
As a result, we have found an indication of a possible effect of dust on heterogeneous ice nucleation, resulting in modestly supercooled middle clouds at altitudes where moisture and temperature conditions are favourable, i.e. near the STI. This enhancement of middle clouds when dust is present may have a significant impact on the atmospheric radiative balance.
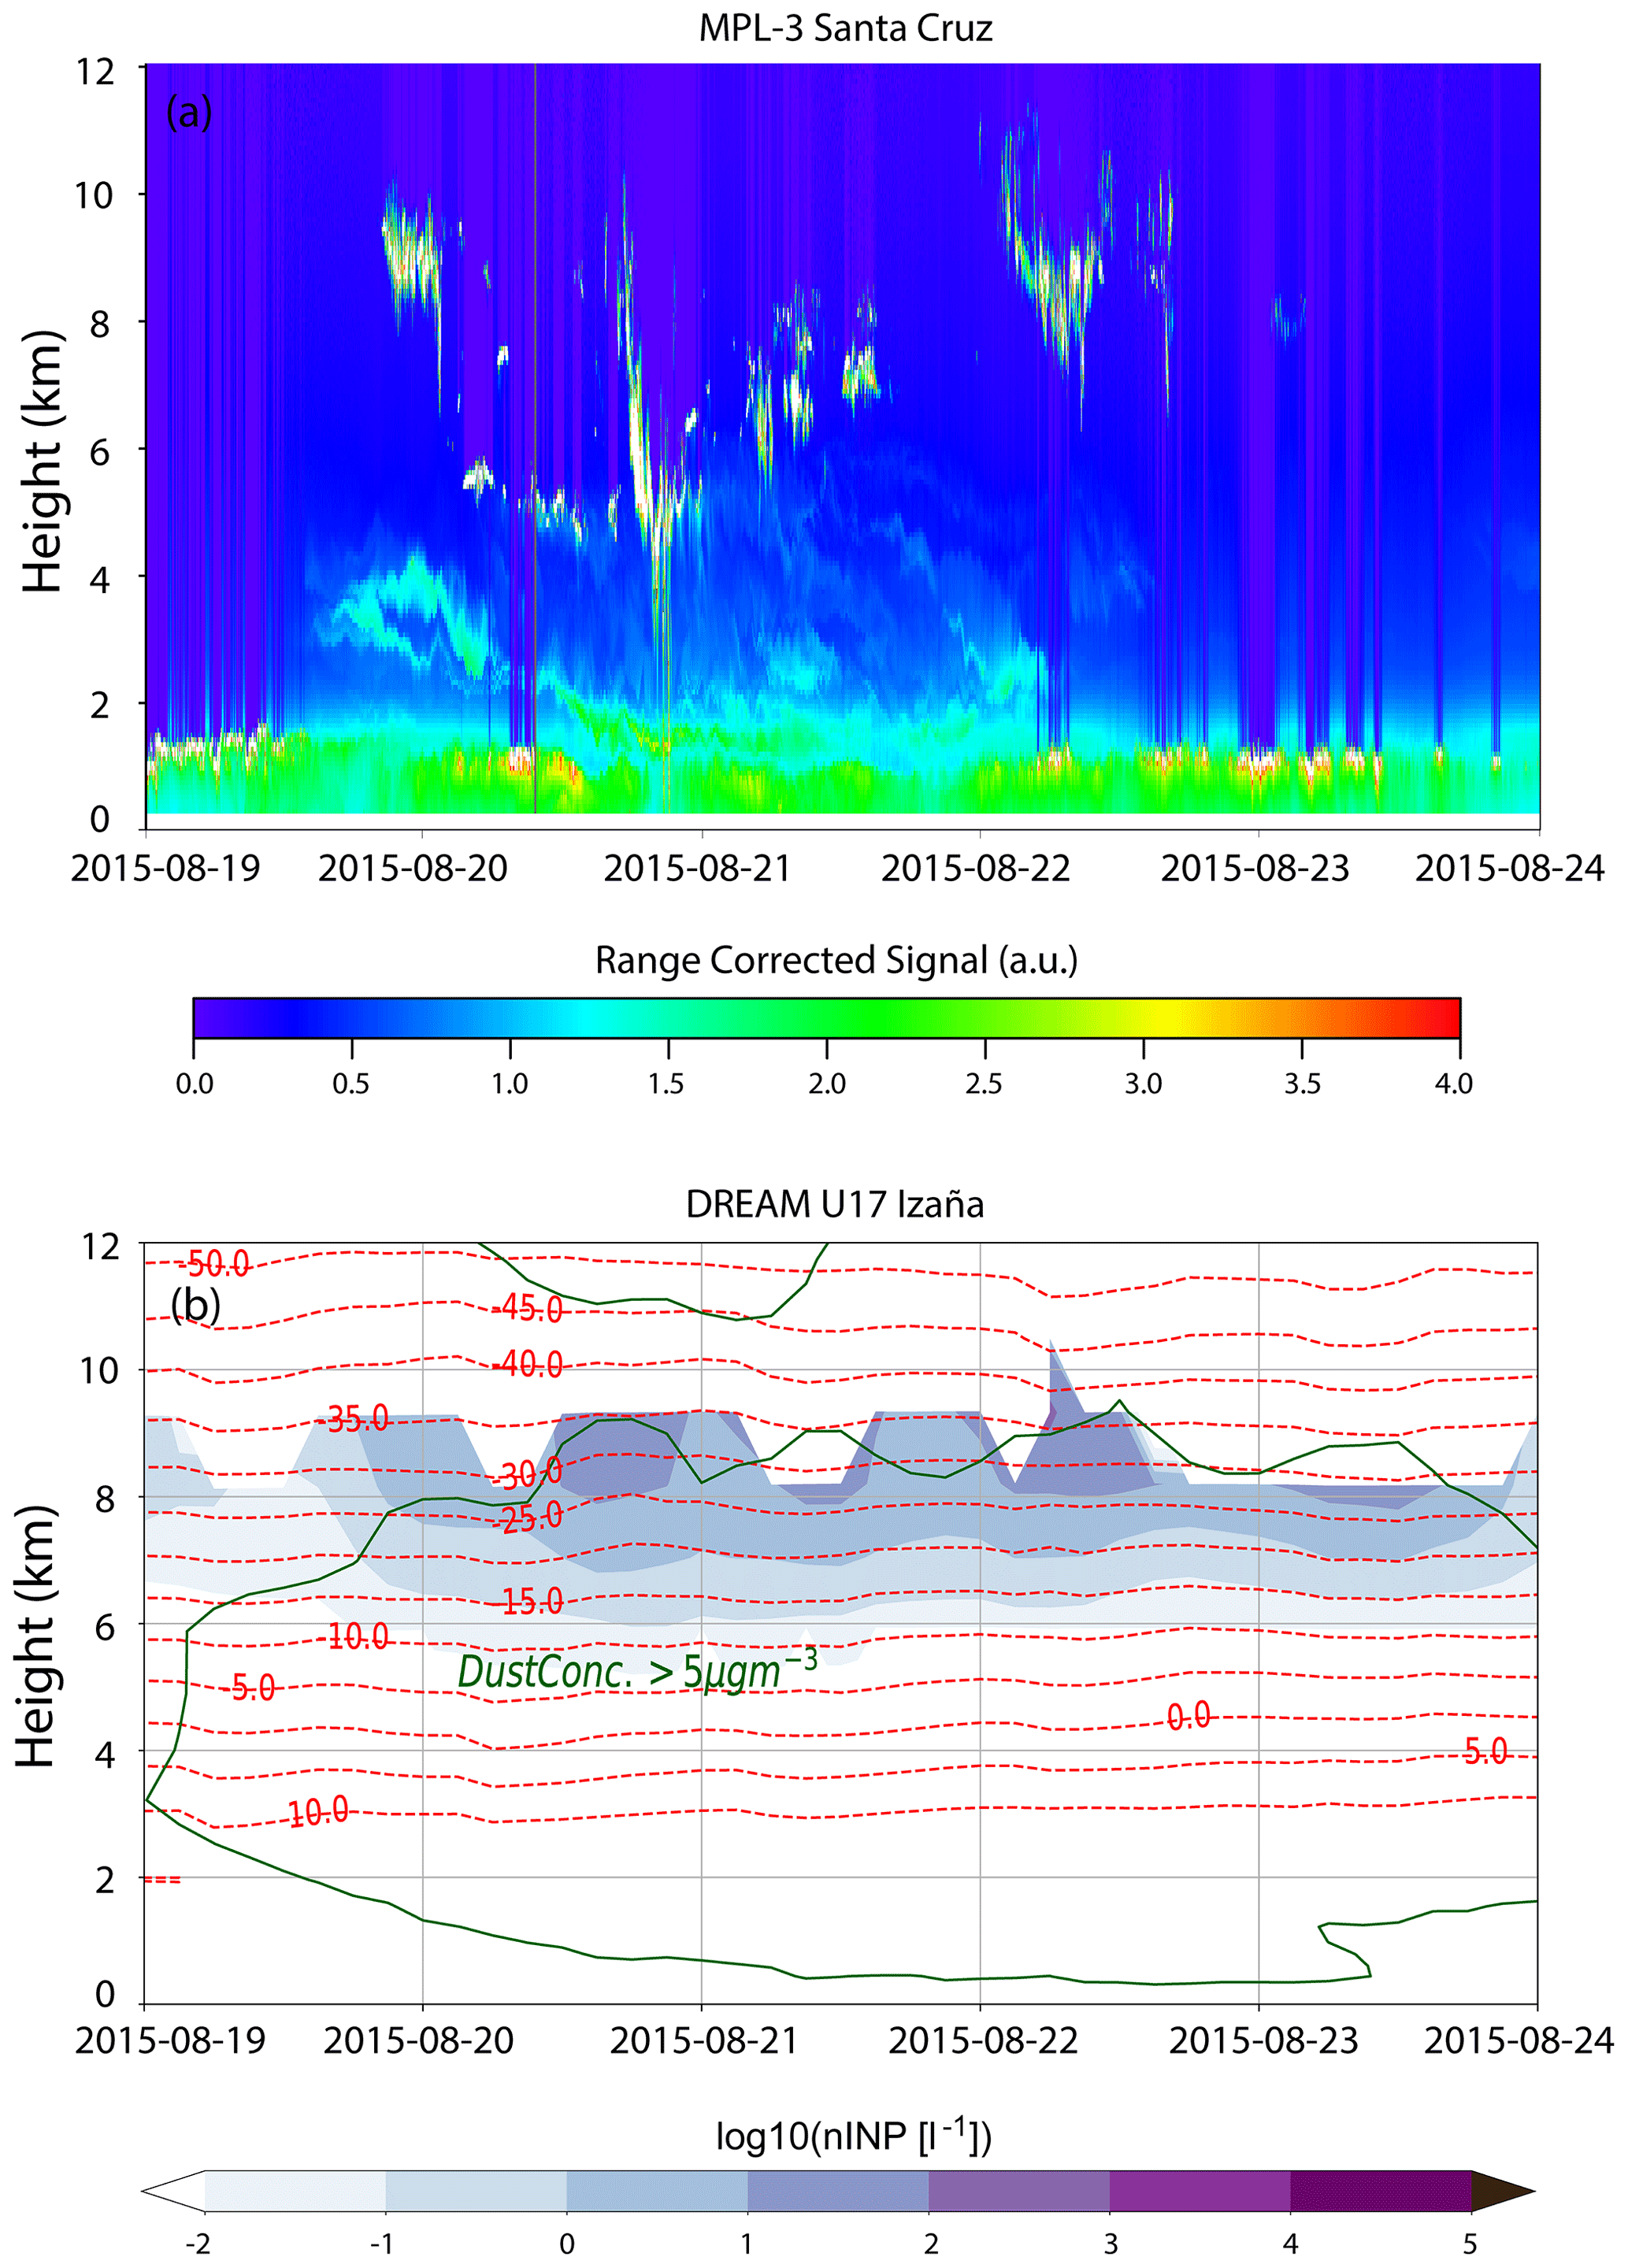
Figure 7(a) Range-corrected MPL-3 signal (in arbitrary units) of a dust plume over Tenerife on August 2015. (b) DREAM-predicted log10 (nINP) (in L−1) during the same dust episode over Tenerife. The green contour represents 5 µg m−3 dust concentration. Dashed red lines represent isotherms (in ∘C).
To further investigate the role of dust in cloud formation, a dust event that impacted Tenerife in summer has been simulated by the dust regional DREAM atmospheric model (see Sect. 3.7). The selected event on 19–24 August 2015 is associated with mid- and high-level clouds (> 5 km) as it is observed in the MPL-3 profiles (see Fig. 7a). MPL-3 displays a dust plume constantly influencing the station from the second half of 19 August until the first half of 22 August. Dust is definitively detected up to 6 km, with the presence of clouds observed during the entire event from 5 to 11 km (also observed from the Cloud–Aerosol Lidar with Orthogonal Polarization – CALIOP – total attenuated backscatter (Winker et al., 2009) in Fig. S6). INPC from the DREAM model (see Fig. 7) is calculated based on the U17 parameterisation described in Sect. 3.7 (Ilić et al., 2021). The model predicts that most of the dust mass is in a layer between 2 and 6 km, in agreement with the MPL-3. Maximum concentrations (> 100 µg m−3) were reached on the afternoon of 20 August (see Fig. S8). The lidar quick look indicates subsidence of the dust layer and a boundary layer intrusion. Lowering of the height of peak concentration was predicted by the model as well. However, at the top of the layer, at heights above 6 km, where temperatures are below −10 ∘C, dust concentrations of around 5 µg m−3 can serve as a reservoir for INPs. The INPC model captures some of the features of the clouds forming above the station. Due to the temporal resolution of model outputs (3 h), some features of cloud development are not seen. The predicted INPC values range from 1 to 10 L−1, reaching values of 100 L−1, in agreement with results of previous remote sensing and modelling studies (Ansmann et al., 2019; Marinou et al., 2019; Ilić et al., 2021). The clear overestimation of dust concentrations by DREAM (Figs. S7 and S8 in the Supplement) suggests an overestimation in INPC as well. Ilić et al. (2021) found that overestimation by 100 % in dust concentration results in an order of magnitude overestimation in INPC prediction. Low humidity and temperature limit at which deposition nucleation parameterisation is used indicate that this otherwise significant dust concentration does not contribute to INPC. Relatively warm middle clouds (T> −5 ∘C) observed by the lidar between 4 and 6 km (Fig. 7a) on 20 August were not predicted by DREAM because parameterisations are done for temperatures lower than −5 ∘C. The observed middle clouds were well captured by the model and were explained by indications of a local maximum in the INPC. The cirrus clouds present on 20 and 22 August are consistent with INPC values of 1–10 L−1 and above 10 L−1. DREAM also predicts INPC on August 22 (from noon) and 23, but the low cumulus clouds prevent observations of middle and high clouds. However, observations of clouds at Izaña with an all-sky camera proved the presence of cirrus from 00:00 to 05:00 UTC (not shown here). These high clouds predicted by DREAM at the beginning of 23 August are also slightly discernible from the lidar observations between the low clouds (see Fig. 7a). The deposition nucleation parameterisation requires supersaturation with respect to ice, a condition that is not reached above 9 km. Therefore, the predicted INPC is mostly due to immersion freezing mode according to the model. The convergence between lidar observations and dust model predictions allows us to link, at least in this one instance, summer-SAL conditions with the formation of mid- and high-level clouds. However, an extended observation period will be required to firmly establish this relationship.
There is a vast literature that describes the evolution of the SAL as dust outbreaks emerge from Africa and move into the North Atlantic. However, these studies lack a focus on the vertical characterisation of the Saharan layer using robust long-term datasets, a factor that limits our understanding of the atmospheric processes involved and hinders the validation of atmospheric numerical models. In addition, little attention has been paid to the seasonal variations and the radiative impact that the SAL exerts on the vertical atmospheric profiles.
Here we use long-term cloud-free lidar and vertical sounding observations performed in Tenerife during 2007–2018 to characterise the vertical structure of the lower and middle troposphere over the eastern subtropical North Atlantic. Tenerife is a key location for Saharan dust studies because of its proximity to the most important mineral dust sources. In addition, Tenerife experiences the full seasonality of dust transport at this latitude, ranging from clean normal flow to extreme dust-loaded Saharan air mass outbreaks that affect the lower atmospheric levels in winter and higher levels in summer. The study of the SAL in the Northern Hemisphere subtropical region adds important additional information since this location is representative of the almost pure Saharan dust. The results of this study have revealed that, in the case of clean conditions, the MBL is relatively well mixed with α values below 0.036 km−1, while significantly clean conditions are observed in the free troposphere (α< 0.022 km−1). We have observed a readily visible inversion layer, the MBI, with a secondary α maximum, which separates moist and marine aerosol-laden MBL from the clean FT above.
A clear influence of dust is observed in the summer-SAL scenario. An important increase in α and a decrease in r was found in the MBL, with α values 48 % higher and r values 44 % lower relative to clean conditions. The subtropical FT was observed to be significantly affected by the CBL. The SAL layer appears as a well-stratified layer according to the neutral or slightly positive θ and θe vertical gradients, with a peak in α> 0.066 km−1 at ∼ 2.5 km. Under SAL influence, the CBL reaches altitudes normally characterised by clean free troposphere conditions, being Saharan air masses more humid than FT at the same levels with a peak in r near the SAL’s top (Δr∼ +332 % at 5.3 km). It is noteworthy the decrease in the iso-zero level in this Saharan scenario, in comparison to the clean scenario in summer, indicating the presence of colder air at higher levels under the presence of SAL. Its top, the STI, has been located at ∼ 6.0 km. It is important to highlight the reinforcement in the MBI as a result of the SAL effect, with a strength of 3.1 K in the clean scenario in summer and 5.0 K in the same season with dust influence. In the winter-Saharan scenario, in which dust is only present at lower levels, we have found two different layers in the MBL but compressed in the first 2 km height: a dry (Δr∼ −38 % in comparison to the clean scenario) and well-mixed MBL and the SAL with extinction coefficients up to 0.049 km−1 (Δα maximum of +118 %) in the SAL's peak (∼ 1.3 km height). CFT conditions were found from 2.3 km on.
Significant anomalies in comparison to clean conditions were observed in the lower middle troposphere as a consequence of the warm and moist advection attributed to the summer-SAL. This layer appears as a warmer layer (ΔT up to +6 K within the SAL) and colder at its top (ΔT up to −2 K near the SAL’s top); drier at the base (Δr∼ −44 %) but more humid within the SAL (Δr∼ +332 % at 5.3 km). In the winter-SAL scenario, a net cooling of ∼ 3 K is observed above 2 km height. In this case, the SAL appeared as a drier (Δr∼ −38 %) and dustier (Δα maximum of +118 %) layer, in comparison to winter-clean conditions.
We have delved into the previous thermal and moisture anomalies by means of radiative transfer calculations using a 12-year climatology of lidar and thermodynamic profiles. The results revealed the important role that both dust and water vapour play in the heating rates within the summer-SAL and the winter-SAL. The dominant dust-induced SW radiative warming (up to 0.7 K d−1) is found slightly below the dust peak. However, we have confirmed that atmospheric water vapour has a dominant radiative impact on the net SW warming observed within the summer-SAL (from 2.1 to 5.7 km) in addition to the strong cold anomaly near the SAL's top (−0.6 K d−1) (LW adiabatic cooling). The higher water vapour content found to be carried on the summer-SAL (∼ 2 g kg−1) is very low but represents a high relative variation in comparison to the very dry free troposphere under clean conditions (Δr∼ +332 % at 5.3 km, roughly coinciding with the altitude of the maximum cooling). These results confirm the important radiative role played by water vapour on the atmospheric column, both at higher levels near the STI and at lower levels counteracting the warming effect of aerosols in the SW. This is a relevant aspect to be well thought out in atmospheric modelling since ignoring the radiative effect of water vapour would overestimate the aerosol radiative effect. In the case of the winter-SAL, the radiative effect has been attributed to the combined dust and moisture effect. This is the case of the SW heating found within the SAL (maximum near the peak observed in r), the dry anomaly at lower levels (Δr∼ −38 % at 1 km) and the thermal cooling (∼ 0.3 K d−1) from the STI upwards. Thermal advection processes were found to dominate in summer from 800 m to 2.5 km height as a consequence of the strong temperature gradient between the ocean and the African continent in the lower troposphere. In contrast, radiative processes are found to dominate below 800 m in the MBL which results in heating, between 2.5 and 6 km producing heating, and above 6 km producing cooling.
Finally, our results suggest the strong impact of the SAL in summer and winter on low clouds and the activation of heterogeneous ice nucleation processes under favourable moisture conditions in the presence of the summer-SAL. As a result, we have detected (1) a lower occurrence of low clouds due to drier and warmer conditions at lower levels causing a strong suppressive influence on cumulus convection, with a more prominent effect in summer, and (2) a higher occurrence of middle and high clouds under SAL influence in summer. These mid- and high-level clouds are mostly located near the SAL's top above the iso-zero level (between 5 and 7 km height) at relatively warm temperatures (between −9 and −15 ∘C) and are likely to have a big impact on the surface energy budget. A case study of a 5 d dust event with MPL-3 data and DREAM dust model INPC predictions was used to give some evidence of the role of dust and the water vapour carried within the SAL in ice nucleation processes. The convergence between lidar and dust model predictions has served us to verify, at least in the first instance, the impact of dust on cloud formation.
The results presented here introduce a robust characterisation of the eastern subtropical North Atlantic atmosphere and contribute to our understanding of the vertical and seasonal characteristics and radiative impact of the SAL and its role in cloud nucleation. This information is crucial to improve the current simulations and parameterisations of atmospheric processes in aerosol models. Our use of a long time series of observations (12 years) concurrently carried out with independent and reference-type measurements gives us confidence in our ability to closely characterise the SAL and the factors that impact its behaviour and the effects on the regional environment. However, we raise a number of issues that will require further studies to better assess the radiative effects of these modestly supercooled mid-level clouds as well as to incorporate the presence of SAL-induced clouds in the evaluation of the radiative impact. Furthermore, given the high complexities inherent to ice nucleation processes, which are strongly dependent on T, RH and dust concentration in a way not yet fully understood, an extended observation period should be used to elucidate the role of dust in ice initiation processes. All of these analyses are out of the scope of this paper and are planned to be carried out in future studies.
| AOD | Aerosol optical depth |
| AE | Ångström exponent |
| AEMET | State Meteorological Agency of Spain |
| AERONET | Aerosol Robotic Network |
| ARTI | African air masses residence time index |
| CALIOP | Cloud-Aerosol Lidar with Orthogonal |
| Polarization | |
| CCN | Cloud condensation nuclei |
| CBL | Convective boundary layer |
| CFT | Clean free troposphere |
| ECMWF | European Centre for Medium-Range Weather |
| Forecasts | |
| ERF | Effective radiative forcing |
| FLEXTRA | FLEXible TRAjectories model |
| FT | Free troposphere |
| GALION | GAW Aerosol Lidar Observation Network |
| GAW | Global Atmosphere Watch |
| GCCN | Giant cloud condensation nuclei |
| GCOS | Global Climate Observing System |
| GPS | Global Positioning System |
| GUAN | GCOS Upper-Air Network |
| IARC | Izaña Atmospheric Research Center |
| INP | Ice nucleation particle |
| INPC | Ice Nucleation particle concentration |
| IZO | Izaña Atmospheric Observatory |
| LR | Lidar ratio |
| LW | Longwave |
| MBI | Marine boundary inversion |
| MBL | Marine boundary layer |
| MOPSMAP | Modelled optical properties of ensembles of |
| aerosol particles | |
| MPL | Micropulse lidar |
| NCAR | National Center for Atmospheric Research |
| NCEP | National Centers for Environmental Prediction |
| NMM | Non-hydrostatic mesoscale model |
| NRB | Normalised relative backscatter |
| OPAC | Optical properties of aerosols and clouds |
| RH | Relative humidity |
| SAL | Saharan Air Layer |
| SCO | Santa Cruz station |
| SEM | Standard error of the mean |
| SNR | Signal-to-Noise ratio |
| STI | SAL temperature inversion |
| SW | Shortwave |
| TI | Transition inversion |
| TWI | Trade wind inversion |
| TWL | Trade wind layer |
| USGS | United States Geological Survey |
| WMO | World Meteorological Organization |
The data from AERONET used in the present study can be freely obtained from https://aeronet.gsfc.nasa.gov (Holben et al., 1998). The vertical soundings can be freely downloaded from http://weather.uwyo.edu/upperair/sounding.html (University of Wyoming, 2021). MOPSMAP simulations are a tool freely available at https://mopsmap.net/v1.0/mopsmap.php (MOPSMAP, 2021; Gasteiger and Wiegner, 2018). Lidar data used in this study can be provided by request to the corresponding author África Barreto at abarretov@aemet.es.
The supplement related to this article is available online at: https://doi.org/10.5194/acp-22-739-2022-supplement.
AB and EC designed the study and performed the analysis. RDG performed the radiative impact study. JC performed the analysis based on thermodynamic soundings. LI, SB and SN were in charge of DREAM simulations. JP assisted with the interpretation of the results. AJB and YH provided the results of the two-layer approach for lidar data. All authors discussed the ideas and results of this study.
The contact author has declared that neither they nor their co-authors have any competing interests.
Publisher’s note: Copernicus Publications remains neutral with regard to jurisdictional claims in published maps and institutional affiliations.
This work has been developed within the framework of the activities of the World Meteorological Organization (WMO) Commission for Instruments and Methods of Observations (CIMO) Izaña Testbed for Aerosols and Water Vapour Remote Sensing Instruments. AEMET and BSC authors have participated in this research to contribute to the WMO Sand and Dust Storm Warning Advisory System (SDS-WAS) Regional Center for Northern Africa, Middle East, and Europe. The LibRadtran Radiative Transfer Model has been used to estimate the heating rates. The authors also want to acknowledge Francisco Molero for his useful tips on the atmospheric heating rates retrieval.
The long-term meteorological sounding program has been supported by regular funds from AEMET. The long-term MPLNet program in Tenerife has been financed through R&D budgets from INTA and AEMET. AERONET sun photometers at Izaña have been calibrated within the AERONET Europe TNA, supported by the European Community Research Infrastructure Action under the FP7 ACTRIS (grant agreement no. 262254). This research has received support from the Institute of Physics Belgrade, through the grant by the Ministry of Education, Science, and Technological Development of the Republic of Serbia.
This paper was edited by Stelios Kazadzis and reviewed by two anonymous referees.
Alastuey, A., Querol, X., Castillo, S., Escudero, M., Avila, A., Cuevas, E., Torres, C., Romero, P., Expósito, F., García, O., Díaz, J., Van Dingenen, R., and Putaud, J.: Characterisation of TSP and PM2.5 at Izaña and Sta. Cruz de Tenerife (Canary Islands, Spain) during a Saharan Dust Episode (July 2002), Atmos. Environ., 39, 4715–4728, https://doi.org/10.1016/j.atmosenv.2005.04.018, 2005. a
Alonso-Pérez, S., Cuevas, E., Querol, X., Viana, M., and Guerra, J.: Impact of the Saharan dust outbreaks on the ambient levels of total suspended particles (TSP) in the marine boundary layer (MBL) of the Subtropical Eastern North Atlantic Ocean, Atmos. Environ., 41, 9468–9480, https://doi.org/10.1016/j.atmosenv.2007.08.049, 2007. a
Alonso-Pérez, S., Cuevas, E., Pérez, C., Querol, X., Baldasano, J., Draxler, R., and Bustos, J. D.: Trend changes of African airmass intrusions in the marine boundary layer over the subtropical Eastern North Atlantic region in winter, Tellus B, 63, 255–265, https://doi.org/10.1111/j.1600-0889.2010.00524.x, 2011. a
Alonso-Pérez, S., Cuevas, E., Querol, X., Guerra, J., and Pérez, C.: African dust source regions for observed dust outbreaks over the Subtropical Eastern North Atlantic region, above 25∘ N, J. Arid Environ., 78, 100–109, https://doi.org/10.1016/j.jaridenv.2011.11.013, 2012. a
Anderson, G., Clough, S., Kneizys, F., Chetwynd, J., and Shettle, E.: AFGL Atmospheric Constituent Profiles (0.120 km), Environmental research papers, p. 46, available at: https://www.osti.gov/biblio/6862535 (last access: 1 March 2021), 1986. a
Andrey, J., Cuevas, E., Parrondo, M., Alonso-Pérez, S., Redondas, A., and Gil-Ojeda, M.: Quantification of ozone reductions within the Saharan air layer through a 13-year climatologic analysis of ozone profiles, Atmos. Environ., 84, 28–34, https://doi.org/10.1016/j.atmosenv.2013.11.030, 2014. a, b, c
Ångström, A.: On the Atmospheric Transmission of Sun Radiation and on Dust in the Air, Geogr. Ann., 11, 156–166, available at: http://www.jstor.org/stable/519399 (last access: 1 March 2021), 1929. a
Ansmann, A., Petzold, A., Kandler, K., Tegen, I., Wendisch, M., Müller, D., Weinzierl, B., Müller, T., and Heintzenberg, J.: Saharan Mineral Dust Experiments SAMUM–1 and SAMUM–2: what have we learned?, Tellus B, 63, 403–429, https://doi.org/10.1111/j.1600-0889.2011.00555.x, 2011. a
Ansmann, A., Seifert, P., Tesche, M., and Wandinger, U.: Profiling of fine and coarse particle mass: case studies of Saharan dust and Eyjafjallajökull/Grimsvötn volcanic plumes, Atmos. Chem. Phys., 12, 9399–9415, https://doi.org/10.5194/acp-12-9399-2012, 2012. a, b
Ansmann, A., Mamouri, R.-E., Bühl, J., Seifert, P., Engelmann, R., Hofer, J., Nisantzi, A., Atkinson, J. D., Kanji, Z. A., Sierau, B., Vrekoussis, M., and Sciare, J.: Ice-nucleating particle versus ice crystal number concentrationin altocumulus and cirrus layers embedded in Saharan dust:a closure study, Atmos. Chem. Phys., 19, 15087–15115, https://doi.org/10.5194/acp-19-15087-2019, 2019. a
Azorin-Molina, C., Menendez, M., McVicar, T., Acevedo, A., Vicente-Serrano, S., Cuevas, E., Minola, L., and Chen, D.: Wind speed variability over the Canary Islands, 1948–2014: focusing on trend differences at the land–ocean interface and below–above the trade-wind inversion layer, Clim. Dynam., 50, 4061–4081, https://doi.org/10.1007/s00382-017-3861-0, 2018. a
Barreto, A., García, O. E., Schneider, M., García, R. D., Hase, F., Sepúlveda, E., Almansa, A. F., Cuevas, E., and Blumenstock, T.: Spectral Aerosol Optical Depth Retrievals by Ground-Based Fourier Transform Infrared Spectrometry, Remote Sens., 12, 3148, https://doi.org/10.3390/rs12193148, 2020. a
Berjón, A., Barreto, A., Hernández, Y., Yela, M., Toledano, C., and Cuevas, E.: A 10-year characterization of the Saharan Air Layer lidar ratio in the subtropical North Atlantic, Atmos. Chem. Phys., 19, 6331–6349, https://doi.org/10.5194/acp-19-6331-2019, 2019. a, b, c, d, e, f, g, h, i
Binietoglou, I., Basart, S., Alados-Arboledas, L., Amiridis, V., Argyrouli, A., Baars, H., Baldasano, J. M., Balis, D., Belegante, L., Bravo-Aranda, J. A., Burlizzi, P., Carrasco, V., Chaikovsky, A., Comerón, A., D'Amico, G., Filioglou, M., Granados-Muñoz, M. J., Guerrero-Rascado, J. L., Ilic, L., Kokkalis, P., Maurizi, A., Mona, L., Monti, F., Muñoz-Porcar, C., Nicolae, D., Papayannis, A., Pappalardo, G., Pejanovic, G., Pereira, S. N., Perrone, M. R., Pietruczuk, A., Posyniak, M., Rocadenbosch, F., Rodríguez-Gómez, A., Sicard, M., Siomos, N., Szkop, A., Terradellas, E., Tsekeri, A., Vukovic, A., Wandinger, U., and Wagner, J.: A methodology for investigating dust model performance using synergistic EARLINET/AERONET dust concentration retrievals, Atmos. Meas. Tech., 8, 3577–3600, https://doi.org/10.5194/amt-8-3577-2015, 2015. a, b
Boose, Y., Sierau, B., García, M. I., Rodríguez, S., Alastuey, A., Linke, C., Schnaiter, M., Kupiszewski, P., Kanji, Z. A., and Lohmann, U.: Ice nucleating particles in the Saharan Air Layer, Atmos. Chem. Phys., 16, 9067–9087, https://doi.org/10.5194/acp-16-9067-2016, 2016. a
Boucher, O.: On Aerosol Direct Shortwave Forcing and the Henyey–Greenstein Phase Function, J. Atmos. Sci., 55, 128–134, https://doi.org/10.1175/1520-0469(1998)055<0128:OADSFA>2.0.CO;2, 1998. a
Bovchaliuk, V., Goloub, P., Podvin, T., Veselovskii, I., Tanre, D., Chaikovsky, A., Dubovik, O., Mortier, A., Lopatin, A., Korenskiy, M., and Victori, S.: Comparison of aerosol properties retrieved using GARRLiC, LIRIC, and Raman algorithms applied to multi-wavelength lidar and sun/sky-photometer data, Atmos. Meas. Tech., 9, 3391–3405, https://doi.org/10.5194/amt-9-3391-2016, 2016. a
Campbell, J. R., Hlavka, D. L., Welton, E. J., Flynn, C. J., Turner, D. D., Spinhirne, J. D., Scott, V. S., and Hwang, I. H.: Full-Time, Eye-Safe Cloud and Aerosol Lidar Observation at Atmospheric Radiation Measurement Program Sites: Instruments and Data Processing, J. Atmos. Ocean. Tech., 19, 431–442, https://doi.org/10.1175/1520-0426(2002)019<0431:FTESCA>2.0.CO;2, 2002. a, b, c
Carlson, T. N.: The Saharan Elevated Mixed Layer and its Aerosol Optical Depth, Open Atmospheric Sci. J., 10, 26–38, https://doi.org/10.2174/1874282301610010026, 2016. a, b, c
Carlson, T. N. and Benjamin, S. G.: Radiative Heating Rates for Saharan Dust, J. Atmos. Sci., 37, 193–213, https://doi.org/10.1175/1520-0469(1980)037<0193:RHRFSD>2.0.CO;2, 1980. a, b, c
Carlson, T. N. and Prospero, J. M.: The Large-Scale Movement of Saharan Air Outbreaks over the Northern Equatorial Atlantic, J. Appl. Meteorol. Climatol., 11, 283–297, https://doi.org/10.1175/1520-0450(1972)011<0283:TLSMOS>2.0.CO;2, 1972. a, b, c, d, e
Carrillo, J., Guerra, J. C., Cuevas, E., and Barrancos, J.: Characterization of the Marine Boundary Layer and the Trade-Wind Inversion over the Sub-tropical North Atlantic, Bound.-Lay. Meteorol., 158, 311–330, https://doi.org/10.1007/s10546-015-0081-1, 2016. a, b, c, d, e, f, g, h, i, j
Cattrall, C., Reagan, J., Thome, K., and Dubovik, O.: Variability of aerosol and spectral lidar and backscatter and extinction ratios of key aerosol types derived from selected Aerosol Robotic Network locations, J. Geophys. Res.-Atmos., 110, D10S11, https://doi.org/10.1029/2004JD005124, 2005. a
Cavalieri, O., Cairo, F., Fierli, F., Di Donfrancesco, G., Snels, M., Viterbini, M., Cardillo, F., Chatenet, B., Formenti, P., Marticorena, B., and Rajot, J. L.: Variability of aerosol vertical distribution in the Sahel, Atmos. Chem. Phys., 10, 12005–12023, https://doi.org/10.5194/acp-10-12005-2010, 2010. a, b
Chaikovsky, A., Dubovik, O., Holben, B., Bril, A., Goloub, P., Tanré, D., Pappalardo, G., Wandinger, U., Chaikovskaya, L., Denisov, S., Grudo, J., Lopatin, A., Karol, Y., Lapyonok, T., Amiridis, V., Ansmann, A., Apituley, A., Allados-Arboledas, L., Binietoglou, I., Boselli, A., D'Amico, G., Freudenthaler, V., Giles, D., Granados-Muñoz, M. J., Kokkalis, P., Nicolae, D., Oshchepkov, S., Papayannis, A., Perrone, M. R., Pietruczuk, A., Rocadenbosch, F., Sicard, M., Slutsker, I., Talianu, C., De Tomasi, F., Tsekeri, A., Wagner, J., and Wang, X.: Lidar-Radiometer Inversion Code (LIRIC) for the retrieval of vertical aerosol properties from combined lidar/radiometer data: development and distribution in EARLINET, Atmos. Meas. Tech., 9, 1181–1205, https://doi.org/10.5194/amt-9-1181-2016, 2016. a, b
Chen, S.-H., Wang, S.-H., and Waylonis, M.: Modification of Saharan air layer and environmental shear over the eastern Atlantic Ocean by dust-radiation effects, J. Geophys. Res.-Atmos., 115, D21202, https://doi.org/10.1029/2010JD014158, 2010. a, b, c, d, e, f, g, h
Chen-Chen, H., Pérez-Hoyos, S., and Sánchez-Lavega, A.: Dust particle size, shape and optical depth during the 2018/MY34 martian global dust storm retrieved by MSL Curiosity rover Navigation Cameras, Icarus, 354, 114021, https://doi.org/10.1016/j.icarus.2020.114021, 2021. a
Chiapello, I., Bergametti, G., Gomes, L., Chatenet, B., Dulac, F., Pimenta, J., and Suares, E. S.: An additional low layer transport of Sahelian and Saharan dust over the north-eastern Tropical Atlantic, Geophys. Res. Lett., 22, 3191–3194, https://doi.org/10.1029/95GL03313, 1995. a
Clothiaux, E. E., Mace, G. G., Ackerman, T. P., Kane, T. J., Spinhirne, J. D., and Scott, V. S.: An Automated Algorithm for Detection of Hydrometeor Returns in Micropulse Lidar Data, J. Atmos. Ocean. Tech., 15, 1035–1042, https://doi.org/10.1175/1520-0426(1998)015<1035:AAAFDO>2.0.CO;2, 1998. a
Colarco, P. R., Toon, O. B., and Holben, B. N.: Saharan dust transport to the Caribbean during PRIDE: 1. Influence of dust sources and removal mechanisms on the timing and magnitude of downwind aerosol optical depth events from simulations of in situ and remote sensing observations, J. Geophys. Res.-Atmos., 108, 8589, https://doi.org/10.1029/2002JD002658, 2003a. a
Colarco, P. R., Toon, O. B., Reid, J. S., Livingston, J. M., Russell, P. B., Redemann, J., Schmid, B., Maring, H. B., Savoie, D., Welton, E. J., Campbell, J. R., Holben, B. N., and Levy, R.: Saharan dust transport to the Caribbean during PRIDE: 2. Transport, vertical profiles, and deposition in simulations of in situ and remote sensing observations, J. Geophys. Res.-Atmos., 108, 8590, https://doi.org/10.1029/2002JD002659, 2003b. a
Cuevas, E.: Estudio del Comportamiento del Ozono Troposferico en el Observatorio de Izaña (Tenerife) y su Relación con la Dinámica Atmosférica, PhD thesis, Universidad Complutense de Madrid, Madrid, available at: https://eprints.ucm.es/id/eprint/1964/ (last access: 1 March 2021), 1995. a
Cuevas, E., Milford, C., Bustos, J., del Campo-Hernández, R., García, O., García, R., Gómez-Peláez, A., Guirado-Fuentes, C., Marrero, C., Prats, N., Ramos, R., Redondas, A., Reyes, E., Romero-Campos, S. R. P., Schneider, M., Belmonte, J., Yela, M., Almansa, F., Barreto, A., López-Solano, C., Basart, S., Terradellas, E., Afonso, S., Bayo, C., Berjón, A., Bethencourt, J., Carreño, V., Castro, N., Cruz, A., Damas, M., Ory-Ajamil, F. D., García, M., Gómez-Trueba, V., González, Y., Hernández, C., Hernández, Y., Hernández-Cruz, B., Jover, M., León-Luís, S., López-Fernández, R., López-Solano, J., Rodríguez, E., Rodríguez-Franco, J., Rodríguez-Valido, M., Sálamo, C., Sanromá, E., Santana, D., Tomás, F. S., Sepúlveda, E., Sierra, M., and Sosa, E.: Izaña Atmospheric Research Center Activity Report 2015-2016, Tech. Rep. WMO/GAW No. 236, World Meteorological Organization & Izaña Atmospheric Resear Center (AEMET), available at: https://library.wmo.int/doc_num.php?explnum_id=4139 (last access: 12 December 2018), 2017. a
Cuevas, E., Milford, C., Barreto, A., Bustos, J. J., García, R. D., Marrero, C. L., Prats, N., Bayo, C., Ramos, R., Terradellas, E., Suárez, D., Rodríguez, S., de la Rosa, J., Vilches, J., Basart, S., Werner, E., López-Villarrubia, E., Rodríguez-Mireles, S., Pita Toledo, M. L., González, O., Belmonte, J., Puigdemunt, R., Lorenzo, J., Oromí, P., and del Campo-Hernández, R.: Desert Dust Outbreak in the Canary Islands (February 2020): Assessment and Impacts, Tech. Rep. WMO/GAW No. 259, World Meteorological Organization, available at: https://library.wmo.int/doc_num.php?explnum_id=10542 (last access: 1 March 2021), 2021. a, b
DeMott, P. J., Sassen, K., Poellot, M. R., Baumgardner, D., Rogers, D. C., Brooks, S. D., Prenni, A. J., and Kreidenweis, S. M.: African dust aerosols as atmospheric ice nuclei, Geophys. Res. Lett., 30, 1732, https://doi.org/10.1029/2003GL017410, 2003. a
DeMott, P. J., Prenni, A. J., McMeeking, G. R., Sullivan, R. C., Petters, M. D., Tobo, Y., Niemand, M., Möhler, O., Snider, J. R., Wang, Z., and Kreidenweis, S. M.: Integrating laboratory and field data to quantify the immersion freezing ice nucleation activity of mineral dust particles, Atmos. Chem. Phys., 15, 393–409, https://doi.org/10.5194/acp-15-393-2015, 2015. a
Dorta, P.: Las inversiones térmicas en Canarias, Investigaciones Geográficas, 15, 109–124, https://doi.org/10.14198/INGEO1996.15.01, 1996. a
Dunion, J. P. and Marron, C. S.: A Reexamination of the Jordan Mean Tropical Sounding Based on Awareness of the Saharan Air Layer: Results from 2002, J. Climate, 21, 5242–5253, https://doi.org/10.1175/2008JCLI1868.1, 2008. a, b, c
Dunion, J. P. and Velden, C. S.: The Impact of the Saharan Air Layer on Atlantic Tropical Cyclone Activity, B. Am. Meteorol. Soc., 85, 353–366, https://doi.org/10.1175/BAMS-85-3-353, 2004. a
Eck, T. F., Holben, B. N., Reid, J., Dubovik, O., Smirnov, A., O'Neill, N., Slutsker, I., and Kinne, S.: Wavelength dependence of the optical depth of biomass burning, urban, and desert dust aerosols, J. Geophys. Res., 104, 31333–31349, https://doi.org/10.1029/1999JD900923, 1999. a
Emde, C., Buras-Schnell, R., Kylling, A., Mayer, B., Gasteiger, J., Hamann, U., Kylling, J., Richter, B., Pause, C., Dowling, T., and Bugliaro, L.: The libRadtran software package for radiative transfer calculations (version 2.0.1), Geosci. Model Dev., 9, 1647–1672, https://doi.org/10.5194/gmd-9-1647-2016, 2016. a
Engelstaedter, S., Tegen, I., and Washington, R.: North African dust emissions and transport, Earth-Sci. Rev., 79, 73–100, https://doi.org/10.1016/j.earscirev.2006.06.004, 2006. a
Fernald, F. G.: Analysis of atmospheric lidar observations: some comments, Appl. Opt., 23, 652–653, https://doi.org/10.1364/AO.23.000652, 1984. a
Garcia-Carreras, L., Challinor, A. J., Parkes, B. J., Birch, C. E., Nicklin, K. J., and Parker, D. J.: The Impact of Parameterized Convection on the Simulation of Crop Processes, J. Appl. Meteorol. Clim., 54, 1283–1296, https://doi.org/10.1175/JAMC-D-14-0226.1, 2015. a
Gasteiger, J. and Wiegner, M.: MOPSMAP v1.0: a versatile tool for the modeling of aerosol optical properties, Geosci. Model Dev., 11, 2739–2762, https://doi.org/10.5194/gmd-11-2739-2018, 2018. a, b, c
Gasteiger, J., Emde, C., Mayer, B., Buras, R., Buehler, S. A., and Lemke, O.: Representative wavelengths absorption parameterization applied to satellite channels and spectral bands, J. Quant. Spectrosc. Ra., 148, 99–115, https://doi.org/10.1016/j.jqsrt.2014.06.024, 2014. a
Gasteiger, J., Groß, S., Sauer, D., Haarig, M., Ansmann, A., and Weinzierl, B.: Particle settling and vertical mixing in the Saharan Air Layer as seen from an integrated model, lidar, and in situ perspective, Atmos. Chem. Phys., 17, 297–311, https://doi.org/10.5194/acp-17-297-2017, 2017. a
Generoso, S., Bey, I., Labonne, M., and Bréon, F.-M.: Aerosol vertical distribution in dust outflow over the Atlantic: Comparisons between GEOS-Chem and Cloud-Aerosol Lidar and Infrared Pathfinder Satellite Observation (CALIPSO), J. Geophys. Res.-Atmos., 113, D24209, https://doi.org/10.1029/2008JD010154, 2008. a
Giles, D. M., Sinyuk, A., Sorokin, M. G., Schafer, J. S., Smirnov, A., Slutsker, I., Eck, T. F., Holben, B. N., Lewis, J. R., Campbell, J. R., Welton, E. J., Korkin, S. V., and Lyapustin, A. I.: Advancements in the Aerosol Robotic Network (AERONET) Version 3 database – automated near-real-time quality control algorithm with improved cloud screening for Sun photometer aerosol optical depth (AOD) measurements, Atmos. Meas. Tech., 12, 169–209, https://doi.org/10.5194/amt-12-169-2019, 2019. a
Ginoux, P., Chin, M., Tegen, I., Prospero, J. M., Holben, B., Dubovik, O., and Lin, S.-J.: Sources and distributions of dust aerosols simulated with the GOCART model, J. Geophys. Res.-Atmos., 106, 20255–20273, https://doi.org/10.1029/2000JD000053, 2001. a
Guirado, C.: Caracterización de las propiedades de los aerosoles en columna en la región subtropical, PhD thesis, Universidad de Valladolid, Valladolid, available at: http://uvadoc.uva.es/handle/10324/13220 (last access: 1 March 2021), 2015. a
Gutleben, M., Groß, S., Wirth, M., Emde, C., and Mayer, B.: Impacts of Water Vapor on Saharan Air Layer Radiative Heating, Geophys. Res. Lett., 46, 14854–14862, https://doi.org/10.1029/2019GL085344, 2019. a, b, c, d, e, f, g
Gutleben, M., Groß, S., Wirth, M., and Mayer, B.: Radiative effects of long-range-transported Saharan air layers as determined from airborne lidar measurements, Atmos. Chem. Phys., 20, 12313–12327, https://doi.org/10.5194/acp-20-12313-2020, 2020. a, b, c, d, e, f
Hamonou, E., Chazette, P., Balis, D., Dulac, F., Schneider, X., Galani, E., Ancellet, G., and Papayannis, A.: Characterization of the vertical structure of Saharan dust export to the Mediterranean basin, J. Geophys. Res.-Atmos., 104, 22257–22270, https://doi.org/10.1029/1999JD900257, 1999. a
Haywood, J. M., Pelon, J., Formenti, P., Bharmal, N., Brooks, M., Capes, G., Chazette, P., Chou, C., Christopher, S., Coe, H., Cuesta, J., Derimian, Y., Desboeufs, K., Greed, G., Harrison, M., Heese, B., Highwood, E. J., Johnson, B., Mallet, M., Marticorena, B., Marsham, J., Milton, S., Myhre, G., Osborne, S. R., Parker, D. J., Rajot, J.-L., Schulz, M., Slingo, A., Tanré, D., and Tulet, P.: Overview of the Dust and Biomass-burning Experiment and African Monsoon Multidisciplinary Analysis Special Observing Period-0, J. Geophys. Res.-Atmos., 113, D00C17, https://doi.org/10.1029/2008JD010077, 2008. a
Hess, M., Koepke, P., and Schult, I.: Optical Properties of Aerosols and Clouds: The Software Package OPAC, B. Am. Meteorol. Soc., 79, 831–844, https://doi.org/10.1175/1520-0477(1998)079<0831:OPOAAC>2.0.CO;2, 1998. a
Holben, B., Eck, T., Slutsker, I., Tanré, D., Buis, J., Setzer, A., Vermote, E., Reagan, J., Kaufman, Y., Nakajima, T., Lavenu, F., Jankowiak, I., and Smirnov, A.: AERONET – A Federated Instrument Network and Data Archive for Aerosol Characterization, Remote Sens. Environ., 66, 1–16, https://doi.org/10.1016/S0034-4257(98)00031-5, 1998 (data available at: https://aeronet.gsfc.nasa.gov, last access: 1 March 2021). a, b, c
Huneeus, N., Schulz, M., Balkanski, Y., Griesfeller, J., Prospero, J., Kinne, S., Bauer, S., Boucher, O., Chin, M., Dentener, F., Diehl, T., Easter, R., Fillmore, D., Ghan, S., Ginoux, P., Grini, A., Horowitz, L., Koch, D., Krol, M. C., Landing, W., Liu, X., Mahowald, N., Miller, R., Morcrette, J.-J., Myhre, G., Penner, J., Perlwitz, J., Stier, P., Takemura, T., and Zender, C. S.: Global dust model intercomparison in AeroCom phase I, Atmos. Chem. Phys., 11, 7781–7816, https://doi.org/10.5194/acp-11-7781-2011, 2011. a
Ilić, L., Jovanović, A., Kuzmanoski, M., Lazić, L., Madonna, F., Rosoldi, M., Mytilinaios, M., Marinou, E., and Ničković, S.: Mineralogy Sensitive Immersion Freezing Parameterization in DREAM 2021, J. Geophys. Res.-Atmos., submitted, 2021. a, b, c, d
Jiang, M., Liu, X., Han, J., Wang, Z., and Xu, M.: Influence of particle properties on measuring a low-particulate-mass concentration by light extinction method, Fuel, 286, 119460, https://doi.org/10.1016/j.fuel.2020.119460, 2021. a
Jury, M. and Whitehall, K.: Warming of an elevated layer over Africa Climatic Change, 99, 229–245, https://doi.org/10.1007/s10584-009-9657-4 2010. a
Kalnay, E., Kanamitsu, M., Kistler, R., Collins, W., Deaven, D., Gandin, L., Iredell, M., Saha, S., White, G., Woollen, J., Zhu, Y., Chelliah, M., Ebisuzaki, W., Higgins, W., Janowiak, J., Mo, K. C., Ropelewski, C., Wang, J., Leetmaa, A., Reynolds, R., Jenne, R., and Joseph, D.: The NCEP/NCAR 40-Year Reanalysis Project, B. Am. Meteorol. Soc., 77, 437–472, https://doi.org/10.1175/1520-0477(1996)077<0437:TNYRP>2.0.CO;2, 1996. a
Karyampudi, V. M. and Carlson, T. N.: Analysis and Numerical Simulations of the Saharan Air Layer and Its Effect on Easterly Wave Disturbances, J. Atmos. Sci., 45, 3102–3136, https://doi.org/10.1175/1520-0469(1988)045<3102:AANSOT>2.0.CO;2, 1988. a
Karyampudi, V. M. and Pierce, H. F.: Synoptic-Scale Influence of the Saharan Air Layer on Tropical Cyclogenesis over the Eastern Atlantic, Mon. Weather Rev., 130, 3100–3128, https://doi.org/10.1175/1520-0493(2002)130<3100:SSIOTS>2.0.CO;2, 2002. a
Karyampudi, V. M., Palm, S. P., Reagen, J. A., Fang, H., Grant, W. B., Hoff, R. M., Pierce, H. F., Torres, O., Browell, E. V., and Melfi, S. H.: Validation of the Saharan Dust plume conceptual model using Lidar, Meteosat, and ECMWF Data, B. Am. Meteorol. Soc., 80, 1045–1075, https://doi.org/10.1175/1520-0477(1999)080<1045:VOTSDP>2.0.CO;2, 1999. a, b
Kim, S.-W., Yoon, S.-C., Jefferson, A., Won, J.-G., Dutton, E. G., Ogren, J. A., and Anderson, T. L.: Observation of enhanced water vapor in Asian dust layer and its effect on atmospheric radiative heating rates, Geophys. Res. Lett., 31, L18113, https://doi.org/10.1029/2004GL020024, 2004. a, b, c, d, e, f
Kinne, S., Schulz, M., Textor, C., Guibert, S., Balkanski, Y., Bauer, S. E., Berntsen, T., Berglen, T. F., Boucher, O., Chin, M., Collins, W., Dentener, F., Diehl, T., Easter, R., Feichter, J., Fillmore, D., Ghan, S., Ginoux, P., Gong, S., Grini, A., Hendricks, J., Herzog, M., Horowitz, L., Isaksen, I., Iversen, T., Kirkevåg, A., Kloster, S., Koch, D., Kristjansson, J. E., Krol, M., Lauer, A., Lamarque, J. F., Lesins, G., Liu, X., Lohmann, U., Montanaro, V., Myhre, G., Penner, J., Pitari, G., Reddy, S., Seland, O., Stier, P., Takemura, T., and Tie, X.: An AeroCom initial assessment – optical properties in aerosol component modules of global models, Atmos. Chem. Phys., 6, 1815–1834, https://doi.org/10.5194/acp-6-1815-2006, 2006. a
Klett, J. D.: Lidar inversion with variable backscatter/extinction ratios, Appl. Opt., 24, 1638–1643, https://doi.org/10.1364/AO.24.001638, 1985. a
Kok, J. F., Adebiyi, A. A., Albani, S., Balkanski, Y., Checa-Garcia, R., Chin, M., Colarco, P. R., Hamilton, D. S., Huang, Y., Ito, A., Klose, M., Li, L., Mahowald, N. M., Miller, R. L., Obiso, V., Pérez García-Pando, C., Rocha-Lima, A., and Wan, J. S.: Contribution of the world's main dust source regions to the global cycle of desert dust, Atmos. Chem. Phys., 21, 8169–8193, https://doi.org/10.5194/acp-21-8169-2021, 2021. a
Lopatin, A., Dubovik, O., Chaikovsky, A., Goloub, P., Lapyonok, T., Tanré, D., and Litvinov, P.: Enhancement of aerosol characterization using synergy of lidar and sun-photometer coincident observations: the GARRLiC algorithm, Atmos. Meas. Tech., 6, 2065–2088, https://doi.org/10.5194/amt-6-2065-2013, 2013. a, b
Maring, H., Savioe, D. L., Izaguirre, M. A., Custals, L., and Reid, J. S.: Vertical distributions of dust and sea-salt aerosols over Puerto Rico during PRIDE measured from a light aircraft, J. Geophys. Res.-Atmos., 108, 8587, https://doi.org/10.1029/2002JD002544, 2003. a
Marinou, E., Tesche, M., Nenes, A., Ansmann, A., Schrod, J., Mamali, D., Tsekeri, A., Pikridas, M., Baars, H., Engelmann, R., Voudouri, K.-A., Solomos, S., Sciare, J., Groß, S., Ewald, F., and Amiridis, V.: Retrieval of ice-nucleating particle concentrations from lidar observations and comparison with UAV in situ measurements, Atmos. Chem. Phys., 19, 11315–11342, https://doi.org/10.5194/acp-19-11315-2019, 2019. a
Marticorena, B., Chatenet, B., Rajot, J. L., Traoré, S., Coulibaly, M., Diallo, A., Koné, I., Maman, A., NDiaye, T., and Zakou, A.: Temporal variability of mineral dust concentrations over West Africa: analyses of a pluriannual monitoring from the AMMA Sahelian Dust Transect, Atmos. Chem. Phys., 10, 8899–8915, https://doi.org/10.5194/acp-10-8899-2010, 2010. a
Mayer, B. and Kylling, A.: Technical note: The libRadtran software package for radiative transfer calculations – description and examples of use, Atmos. Chem. Phys., 5, 1855–1877, https://doi.org/10.5194/acp-5-1855-2005, 2005. a
MOPSMAP: https://mopsmap.net/v1.0/mopsmap.php, last access: 1 March 2021. a
Mona, L., Liu, Z., Müller, D., Omar, A., Papayannis, A., Pappalardo, G., Sugimoto, N., and Vaughan, M.: Lidar measurements for desert dust characterization: An overview, Adv. Meteorol., 1201212, 356265, https://doi.org/10.1155/2012/356265, 2012. a
Mortier, A., Goloub, P., Podvin, T., Deroo, C., Chaikovsky, A., Ajtai, N., Blarel, L., Tanre, D., and Derimian, Y.: Detection and characterization of volcanic ash plumes over Lille during the Eyjafjallajökull eruption, Atmos. Chem. Phys., 13, 3705–3720, https://doi.org/10.5194/acp-13-3705-2013, 2013. a
Murray, B. J., O'Sullivan, D., Atkinson, J. D., and Webb, M. E.: Ice nucleation by particles immersed in supercooled cloud droplets, Chem. Soc. Rev., 41, 6519–6554, https://doi.org/10.1039/C2CS35200A, 2012. a, b
Nickovic, S.: Distribution of dust mass over particle sizes: Impacts on atmospheric optics, Fourth ADEC Workshop: Aeolian Dust Experiment on Climate Impact, Nagasaki, Japan, 26–28 January, 357–360, 2005. a
Nickovic, S., Kallos, G., Papadopoulos, A., and Kakaliagou, O.: A model for prediction of desert dust cycle in the atmosphere, J. Geophys. Res.-Atmos., 106, 18113–18129, https://doi.org/10.1029/2000JD900794, 2001. a
Nickovic, S., Vukovic, A., Vujadinovic, M., Djurdjevic, V., and Pejanovic, G.: Technical Note: High-resolution mineralogical database of dust-productive soils for atmospheric dust modeling, Atmos. Chem. Phys., 12, 845–855, https://doi.org/10.5194/acp-12-845-2012, 2012. a
Nickovic, S., Cvetkovic, B., Madonna, F., Rosoldi, M., Pejanovic, G., Petkovic, S., and Nikolic, J.: Cloud ice caused by atmospheric mineral dust – Part 1: Parameterization of ice nuclei concentration in the NMME-DREAM model, Atmos. Chem. Phys., 16, 11367–11378, https://doi.org/10.5194/acp-16-11367-2016, 2016. a, b
Nickovic, S., Cvetkovic, B., Petković, S., Amiridis, V., Pejanović, G., Solomos, S., Marinou, E., and Nikolic, J.: Cloud icing by mineral dust and impacts to aviation safety, Sci. Rep.-UK, 11, 6411, https://doi.org/10.1038/s41598-021-85566-y, 2021. a
Niemand, M., Möhler, O., Vogel, B., Vogel, H., Hoose, C., Connolly, P., Klein, H., Bingemer, H., DeMott, P., Skrotzki, J., and Leisner, T.: A Particle-Surface-Area-Based Parameterization of Immersion Freezing on Desert Dust Particles, J. Atmos. Sci., 69, 3077–3092, https://doi.org/10.1175/JAS-D-11-0249.1, 2012. a
Parker, D. J., Burton, R. R., Diongue-Niang, A., Ellis, R. J., Felton, M., Taylor, C. M., Thorncroft, C. D., Bessemoulin, P., and Tompkins, A. M.: The diurnal cycle of the West African monsoon circulation, Q. J. Roy. Meteor. Soc., 131, 2839–2860, https://doi.org/10.1256/qj.04.52, 2005. a
Piontek, D., Hornby, A., Voigt, C., Bugliaro, L., and Gasteiger, J.: Determination of complex refractive indices and optical properties of volcanic ashes in the thermal infrared based on generic petrological compositions, J. Volcanol. Geoth. Res., 411, 107174, https://doi.org/10.1016/j.jvolgeores.2021.107174, 2021. a
Prospero, J. M. and Carlson, T. N.: Vertical and areal distribution of Saharan dust over the western equatorial north Atlantic Ocean, J. Geophys. Res., 77, 5255–5265, https://doi.org/10.1029/JC077i027p05255, 1972. a, b
Prospero, J. M. and Carlson, T. N.: Saharan air outbreaks over the Tropical North Atlantic, Pure Appl. Geophys., 119, 677–691, https://doi.org/10.1007/BF00878167, 1980. a, b
Prospero, J. M. and Mayol-Bracero, O. L.: Understanding the Transport and Impact of African Dust on the Caribbean Basin, B. Am. Meteorol. Soc., 94, 1329–1337, https://doi.org/10.1175/BAMS-D-12-00142.1, 2013. a
Prospero, J. M., Barkley, A. E., Gaston, C. J., Gatineau, A., Campos y Sansano, A., and Panechou, K.: Characterizing and Quantifying African Dust Transport and Deposition to South America: Implications for the Phosphorus Budget in the Amazon Basin, Global Biogeochem. Cy., 34, e2020GB006536, https://doi.org/10.1029/2020GB006536, 2020. a
Prospero, J. M., Delany, A. C., Delany, A. C., and Carlson, T. N.: The Discovery of African Dust Transport to the Western Hemisphere and the Saharan Air Layer: A History, B. Am. Meteorol. Soc., 102, 1–53, https://doi.org/10.1175/BAMS-D-19-0309.1, 2021. a
Quijano, A. L., Sokolik, I. N., and Toon, O. B.: Influence of the aerosol vertical distribution on the retrievals of aerosol optical depth from satellite radiance measurements, Geophys. Res. Lett., 27, 3457–3460, https://doi.org/10.1029/1999GL011235, 2000. a
Reid, J. S., Kinney, J. E., Westphal, D. L., Holben, B. N., Welton, E. J., Tsay, S.-C., Eleuterio, D. P., Campbell, J. R., Christopher, S. A., Colarco, P. R., Jonsson, H. H., Livingston, J. M., Maring, H. B., Meier, M. L., Pilewskie, P., Prospero, J. M., Reid, E. A., Remer, L. A., Russell, P. B., Savoie, D. L., Smirnov, A., and Tanré, D.: Analysis of measurements of Saharan dust by airborne and ground-based remote sensing methods during the Puerto Rico Dust Experiment (PRIDE), J. Geophys. Res.-Atmos., 108, 8586, https://doi.org/10.1029/2002JD002493, 2003. a, b
Rittmeister, F., Ansmann, A., Engelmann, R., Skupin, A., Baars, H., Kanitz, T., and Kinne, S.: Profiling of Saharan dust from the Caribbean to western Africa – Part 1: Layering structures and optical properties from shipborne polarization/Raman lidar observations, Atmos. Chem. Phys., 17, 12963–12983, https://doi.org/10.5194/acp-17-12963-2017, 2017. a, b
Rodríguez, S., Alastuey, A., Alonso-Pérez, S., Querol, X., Cuevas, E., Abreu-Afonso, J., Viana, M., Pérez, N., Pandolfi, M., and de la Rosa, J.: Transport of desert dust mixed with North African industrial pollutants in the subtropical Saharan Air Layer, Atmos. Chem. Phys., 11, 6663–6685, https://doi.org/10.5194/acp-11-6663-2011, 2011. a
Rodríguez-Franco, J. J. and Cuevas, E.: Characteristics of the subtropical tropopause region based on long-term highly resolved sonde records over Tenerife, J. Geophys. Res.-Atmos., 118, 10754–10769, https://doi.org/10.1002/jgrd.50839, 2013. a
Ryder, C. L., Marenco, F., Brooke, J. K., Estelles, V., Cotton, R., Formenti, P., McQuaid, J. B., Price, H. C., Liu, D., Ausset, P., Rosenberg, P. D., Taylor, J. W., Choularton, T., Bower, K., Coe, H., Gallagher, M., Crosier, J., Lloyd, G., Highwood, E. J., and Murray, B. J.: Coarse-mode mineral dust size distributions, composition and optical properties from AER-D aircraft measurements over the tropical eastern Atlantic, Atmos. Chem. Phys., 18, 17225–17257, https://doi.org/10.5194/acp-18-17225-2018, 2018. a
Sassen, K., DeMott, P. J., Prospero, J. M., and Poellot, M. R.: Saharan dust storms and indirect aerosol effects on clouds: CRYSTAL-FACE results, Geophys. Res. Lett., 30, 1633, https://doi.org/10.1029/2003GL017371, 2003. a, b, c, d
Satheesh, S. K., Dutt, C. B. S., Srinivasan, J., and Rao, U. R.: Atmospheric warming due to dust absorption over Afro-Asian regions, Geophys. Res. Lett., 34, L04805, https://doi.org/10.1029/2006GL028623, 2007. a
Schuster, G. L., Dubovik, O., and Holben, B. N.: Angstrom exponent and bimodal aerosol size distributions, J. Geophys. Res.-Atmos., 111, D07207, https://doi.org/10.1029/2005JD006328, 2006. a
Senghor, H., Machu, É., Hourdin, F., and Gaye, A. T.: Seasonal cycle of desert aerosols in western Africa: analysis of the coastal transition with passive and active sensors, Atmos. Chem. Phys., 17, 8395–8410, https://doi.org/10.5194/acp-17-8395-2017, 2017. a
Sicard, M., Rodríguez-Gómez, A., Comerón, A., and Muñoz-Porcar, C.: Calculation of the Overlap Function and Associated Error of an Elastic Lidar or a Ceilometer: Cross-Comparison with a Cooperative Overlap-Corrected System, Sensors, 20, 6312, https://doi.org/10.3390/s20216312, 2020. a
Smirnov, A., Holben, B. N., Eck, T. F., Dubovik, O., and Slutsker, I.: Cloud-screening and quality control algorithms for the AERONET database, Remote Sens. Environ., 73, 337–349, https://doi.org/10.1016/S0034-4257(00)00109-7, 2000. a
Spinhirne, J. D., Rall, J., and Scott, V. S.: Compact eye safe lidar systems, Rev. Laser Eng., 23, 112–118, 1995. a
Stamnes, K., Tsay, S.-C., Wiscombe, W., and Jayaweera, K.: Numerically stable algorithm for discrete-ordinate-method radiative transfer in multiple scattering and emitting layered media, Appl. Opt., 27, 2502–2509, https://doi.org/10.1364/AO.27.002502, 1988. a
Steinke, I., Hoose, C., Möhler, O., Connolly, P., and Leisner, T.: A new temperature- and humidity-dependent surface site density approach for deposition ice nucleation, Atmos. Chem. Phys., 15, 3703–3717, https://doi.org/10.5194/acp-15-3703-2015, 2015. a
Stohl, A. and Seibert, P.: Accuracy of trajectories as determined from the conservation of meteorological tracers, Q. J. Roy. Meteor. Soc., 124, 1465–1484, https://doi.org/10.1002/qj.49712454907, 1998. a
Stohl, A., Wotawa, G., Seibert, P., and Kromp-Kolb, H.: Interpolation Errors in Wind Fields as a Function of Spatial and Temporal Resolution and Their Impact on Different Types of Kinematic Trajectories, J. Appl. Meteorol. Clim., 34, 2149–2165, https://doi.org/10.1175/1520-0450(1995)034<2149:IEIWFA>2.0.CO;2, 1995. a
Sunnu, A., Afeti, G., and Resch, F.: A long-term experimental study of the Saharan dust presence in West Africa, Atmos. Res., 87, 13–26, https://doi.org/10.1016/j.atmosres.2007.07.004, 2008. a
Torres, B., Toledano, C., Berjón, A., Fuertes, D., Molina, V., Gonzalez, R., Canini, M., Cachorro, V. E., Goloub, P., Podvin, T., Blarel, L., Dubovik, O., Bennouna, Y., and de Frutos, A. M.: Measurements on pointing error and field of view of Cimel-318 Sun photometers in the scope of AERONET, Atmos. Meas. Tech., 6, 2207–2220, https://doi.org/10.5194/amt-6-2207-2013, 2013. a
Tsamalis, C., Chédin, A., Pelon, J., and Capelle, V.: The seasonal vertical distribution of the Saharan Air Layer and its modulation by the wind, Atmos. Chem. Phys., 13, 11235–11257, https://doi.org/10.5194/acp-13-11235-2013, 2013. a, b
Ullrich, R., Hoose, C., Möhler, O., Niemand, M., Wagner, R., Höhler, K., Hiranuma, N., Saathoff, H., and Leisner, T.: A New Ice Nucleation Active Site Parameterization for Desert Dust and Soot, J. Atmos. Sci., 74, 699–717, https://doi.org/10.1175/JAS-D-16-0074.1, 2017. a, b, c
University of Wyoming: http://weather.uwyo.edu/upperair/sounding.html, last access: 1 March 2021. a
Vukovic, A., Vujadinovic, M., Pejanovic, G., Andric, J., Kumjian, M. R., Djurdjevic, V., Dacic, M., Prasad, A. K., El-Askary, H. M., Paris, B. C., Petkovic, S., Nickovic, S., and Sprigg, W. A.: Numerical simulation of ”an American haboob”, Atmos. Chem. Phys., 14, 3211–3230, https://doi.org/10.5194/acp-14-3211-2014, 2014. a
Weinzierl, B., Ansmann, A., Prospero, J. M., Althausen, D., Benker, N., Chouza, F., Dollner, M., Farrell, D., Fomba, W. K., Freudenthaler, V., Gasteiger, J., Groß, S., Haarig, M., Heinold, B., Kandler, K., Kristensen, T. B., Mayol-Bracero, O. L., Müller, T., Reitebuch, O., Sauer, D., Schäfler, A., Schepanski, K., Spanu, A., Tegen, I., Toledano, C., and Walser, A.: The Saharan Aerosol Long-Range Transport and Aerosol–Cloud-Interaction Experiment: Overview and Selected Highlights, B. Am. Meteorol. Soc., 98, 1427–1451, https://doi.org/10.1175/BAMS-D-15-00142.1, 2017. a, b
Welton, E. J. and Campbell, J. R.: Micropulse Lidar Signals: Uncertainty Analysis, J. Atmos. Ocean. Tech., 19, 2089–2094, https://doi.org/10.1175/1520-0426(2002)019<2089:MLSUA>2.0.CO;2, 2002. a, b
Welton, E. J., Campbell, J. R., Berkoff, T. A., Valencia, S., Spinhime, J. D., Holben, B., and Tsay, S. C.: The NASA Micro-Pulse Lidar NETWORK (MPLNET): Co-location of lidars with aeronet sunphotometers and related earth science applications, in: 85th AMS Annual Meeting, American Meteorological Society, San Diego, 8–14 January 2005, 5165–5169, 2005. a
Winker, D. M., Vaughan, M. A., Omar, A., Hu, Y., Powell, K. A., Liu, Z., Hunt, W. H., and Young, S. A.: Overview of the CALIPSO Mission and CALIOP Data Processing Algorithms, J. Atmos. Ocean. Tech., 26, 2310–2323, https://doi.org/10.1175/2009JTECHA1281.1, 2009. a
WMO: Manual on Codes – International Codes, WMO No. 306, available at: https://library.wmo.int/index.php?lvl=notice_display&id=10684#.YMCFhPlKiUk (last access: 1 March 2021), 2019. a
Wong, S. and Dessler, A. E.: Suppression of deep convection over the tropical North Atlantic by the Saharan Air Layer, Geophys. Res. Lett., 32, L09808, https://doi.org/10.1029/2004GL022295, 2005. a, b
Wong, S., Dessler, A. E., Mahowald, N. M., Yang, P., and Feng, Q.: Maintenance of Lower Tropospheric Temperature Inversion in the Saharan Air Layer by Dust and Dry Anomaly, J. Climate, 22, 5149–5162, https://doi.org/10.1175/2009JCLI2847.1, 2009. a, b, c, d, e, f
Wu, M., Liu, X., Yu, H., Wang, H., Shi, Y., Yang, K., Darmenov, A., Wu, C., Wang, Z., Luo, T., Feng, Y., and Ke, Z.: Understanding processes that control dust spatial distributions with global climate models and satellite observations, Atmos. Chem. Phys., 20, 13835–13855, https://doi.org/10.5194/acp-20-13835-2020, 2020. a
Yorks, J. E., Hlavka, D. L., Hart, W. D., and McGill, M. J.: Statistics of Cloud Optical Properties from Airborne Lidar Measurements, J. Atmos. Ocean. Tech., 28, 869–883, https://doi.org/10.1175/2011JTECHA1507.1, 2011. a
Yu, H., Chin, M., Yuan, T., Bian, H., Remer, L. A., Prospero, J. M., Omar, A., Winker, D., Yang, Y., Zhang, Y., Zhang, Z., and Zhao, C.: The fertilizing role of African dust in the Amazon rainforest: A first multiyear assessment based on data from Cloud-Aerosol Lidar and Infrared Pathfinder Satellite Observations, Geophys. Res. Lett., 42, 1984–1991, https://doi.org/10.1002/2015GL063040, 2015. a
Zhu, A., Ramanathan, V., Li, F., and Kim, D.: Dust plumes over the Pacific, Indian, and Atlantic oceans: Climatology and radiative impact, J. Geophys. Res.-Atmos., 112, D16208, https://doi.org/10.1029/2007JD008427, 2007. a, b, c, d
- Abstract
- Introduction
- Experiment site
- Instruments and ancillary information
- Characterisation of atmospheric scenarios
- SAL's impact on the aerosol extinction and the thermodynamic profiles in the summer and winter troposphere
- SAL's impact on the vertical atmospheric heating rates
- Possible SAL's impact on cloud formation in the subtropical troposphere
- Conclusions
- Appendix A: Abbreviations
- Data availability
- Author contributions
- Competing interests
- Disclaimer
- Acknowledgements
- Financial support
- Review statement
- References
- Supplement