the Creative Commons Attribution 4.0 License.
the Creative Commons Attribution 4.0 License.
 | 08 Jun 2022
Spatial variability of air pollutants in a megacity characterized by mobile measurements
Reza Bashiri Khuzestani
Keren Liao
Ruqian Miao
Yan Zheng
Xi Cheng
Tianjiao Jia
Shiyi Chen
Guancong Huang
Characterization of the spatial distributions of air pollutants on an intracity scale is important for understanding local sources, secondary formation, and human exposure. In this study, we conducted in situ mobile measurements for the chemical composition of fine particles, volatile organic compounds (VOCs), oxygenated VOCs (OVOCs), and common gas pollutants in winter in the megacity of Beijing. The spatial patterns of these pollutants under different pollution conditions were investigated. During the non-haze days all pollutants showed significant spatial variability. Large spatial variations of secondary species including OVOCs and secondary aerosol species highlight the chemical heterogeneity. In particular, the inorganic chemical composition of fine particles varied greatly on the 65 km urban highway, suggesting a wide range of particle neutralization in the megacity of Beijing. Localized sources such as vehicle, cooking, and industrial emissions led to hot spots and nonuniform distributions of primary pollutants in the city. The spatial heterogeneity of air pollutants under less polluted conditions calls for a future need of using fine-resolution models to evaluate human exposure and to develop pollution control strategies. During the haze day the spatial variabilities of secondary gaseous and particulate pollutants were largely reduced, explained by both the elevated urban background of the polluted air mass and the enhanced secondary formation by elevated precursor concentrations and heterogeneous or aqueous pathways. Although localized primary emissions were accumulated under stagnant haze conditions, the chemical composition of fine particles became relatively homogeneous because of the predominant secondary contributions. A uniform spatial pattern of particle neutralization was observed. The concentrations of hydrocarbons and less oxygenated OVOCs showed good positive spatiotemporal correlations during the haze day, while the concentrations of more oxygenated OVOCs showed good positive correlations among themselves but moderate negative correlations with the concentrations of hydrocarbons, less oxygenated OVOCs, and aerosol species. Our results indicate a spatial chemical homogeneity on the megacity scale to promote efficient secondary organic aerosol (SOA) production under haze conditions.
- Article
(3757 KB) - Full-text XML
-
Supplement
(2787 KB) - BibTeX
- EndNote


Air quality degradation has become a serious problem in developing countries (Huang et al., 2014; Khuzestani et al., 2017). Cities in northern China suffer from severe haze events, especially in winter (Huang et al., 2014). High concentrations of volatile organic compounds (VOCs) and nitrogen oxides (NOx = NO + NO2) contribute to a high atmospheric oxidation capacity to produce ozone (O3) and secondary aerosols (Wang et al., 2017; Lu et al., 2019b). The mass concentrations of particles having an aerodynamic diameter less than 2.5 µm (PM2.5) may reach up to several hundred µg m−3, and the O3 concentrations may exceed 100 ppbv in megacities. High exposure to both PM2.5 and O3 are of great concern for human health (Liu et al., 2016; Bell et al., 2006).
Tremendous efforts have been made to characterize air pollutants in populated urban areas in China (Li et al., 2017; Wang et al., 2017; Quan and Jia, 2020). In most studies, stationary measurements were conducted to obtain the temporal variations of air pollutants for the analysis of the sources and formation mechanisms. Sulfates, nitrates, ammonium, and organic aerosols (OA) are the major chemical components of PM2.5 in cities in China (Li et al., 2017). Their mass concentrations show nationwide decreases since 2013 as a result of the emission reduction of gaseous precursors, such as sulfur dioxide (SO2), NOx, and VOCs under clean air actions as well as the changes of meteorological conditions (Zhang et al., 2019). Characterization of VOCs and oxygenated VOCs (OVOCs) is crucial for understanding the formation of O3 and secondary OAs (SOA). Alkanes, aromatics and OVOCs are abundant in urban areas in China (Mozaffar and Zhang, 2020; Li et al., 2016; Guo et al., 2017). These organic compounds may come from a variety of anthropogenic sources such as vehicles, industries, solvent usage, coal and biomass burning, and household use of volatile chemical products. In Beijing, the contribution of SOA to PM2.5 has significantly increased since 2018, while the contribution of primary OA (POA) from coal and biomass (biofuel) combustion and cooking emissions have decreased (Lei et al., 2021).
On an intracity scale, local emissions, advection, and boundary layer evolution affect the spatial distributions of air pollutants. Tower measurements have shown greater vertical gradients of particle concentration and composition during clean periods than during haze periods in Beijing, which is attributed to the influence of both physical (e.g., regional transport, mixing layer height, and inversions) and chemical processes (e.g., gas-particle partitioning and aqueous processing) (Zhou et al., 2018). The VOC concentrations also show significant vertical gradients in cities, affected by the transport of air masses, vertical diffusion, and species reactivity (Sun et al., 2018; Mo et al., 2020). Grid sampling and simultaneous measurements at multiple sites have shown that the surface concentrations of VOCs and PM2.5 chemical components can significantly vary on sparse spatial scales because of different source contributions in metropolitan areas in China (Chen et al., 2020; Song et al., 2021). Such measurements are however limited. The spatial variability of air pollutants remains quite unclear, limiting our understanding of source distribution, haze development, and human exposure.
Mobile laboratories equipped with fast response in situ instruments have been widely used in Europe and the USA to better characterize the spatial distributions of air pollutants (Kolb et al., 2004). For example, mobile measurements in Pittsburgh and Zurich indicated different spatial variability of submicron particle composition (Tan et al., 2014; Gu et al., 2018; Ye et al., 2018; Mohr et al., 2011; Elser et al., 2016). While primary carbonaceous sources led to the large spatial heterogeneity of the particle composition in Pittsburgh, a relatively uniform distribution was observed in the metropolitan area of Zurich especially during thermal inversions over the Swiss plateau. In China, mobile measurements have been conducted to obtain the spatial distributions of SO2, NOx, carbon monoxide (CO), and black carbon (BC) as well as the column densities of NO2 and SO2 for the evaluation of regional transport routes in the North China Plain (NCP) and the sources of these pollutants (Wang et al., 2009, 2011; Zhu et al., 2016; Wu et al., 2018). Online mass spectrometers have also been used for the mobile measurements of VOCs and PM2.5 chemical composition, although the spatial variabilities of these pollutants have not yet been systematically explored (X. Wang et al., 2021; Liang et al., 2020; Liao et al., 2021).
In this study, we conducted in situ sampling with gas analyzers and mass spectrometers on a newly developed mobile laboratory in winter in Beijing. Spatial distributions of the mass concentrations of non-refractory PM2.5 (NR-PM2.5) components (i.e., OA, nitrate, sulfate, ammonium, and chloride), VOC and OVOC species, and common gas pollutants such as SO2, CO, NO, NO2, and O3 were obtained. The spatial variabilities of these gaseous and particulate pollutants under different pollution conditions were investigated to provide new insights into urban pollution.
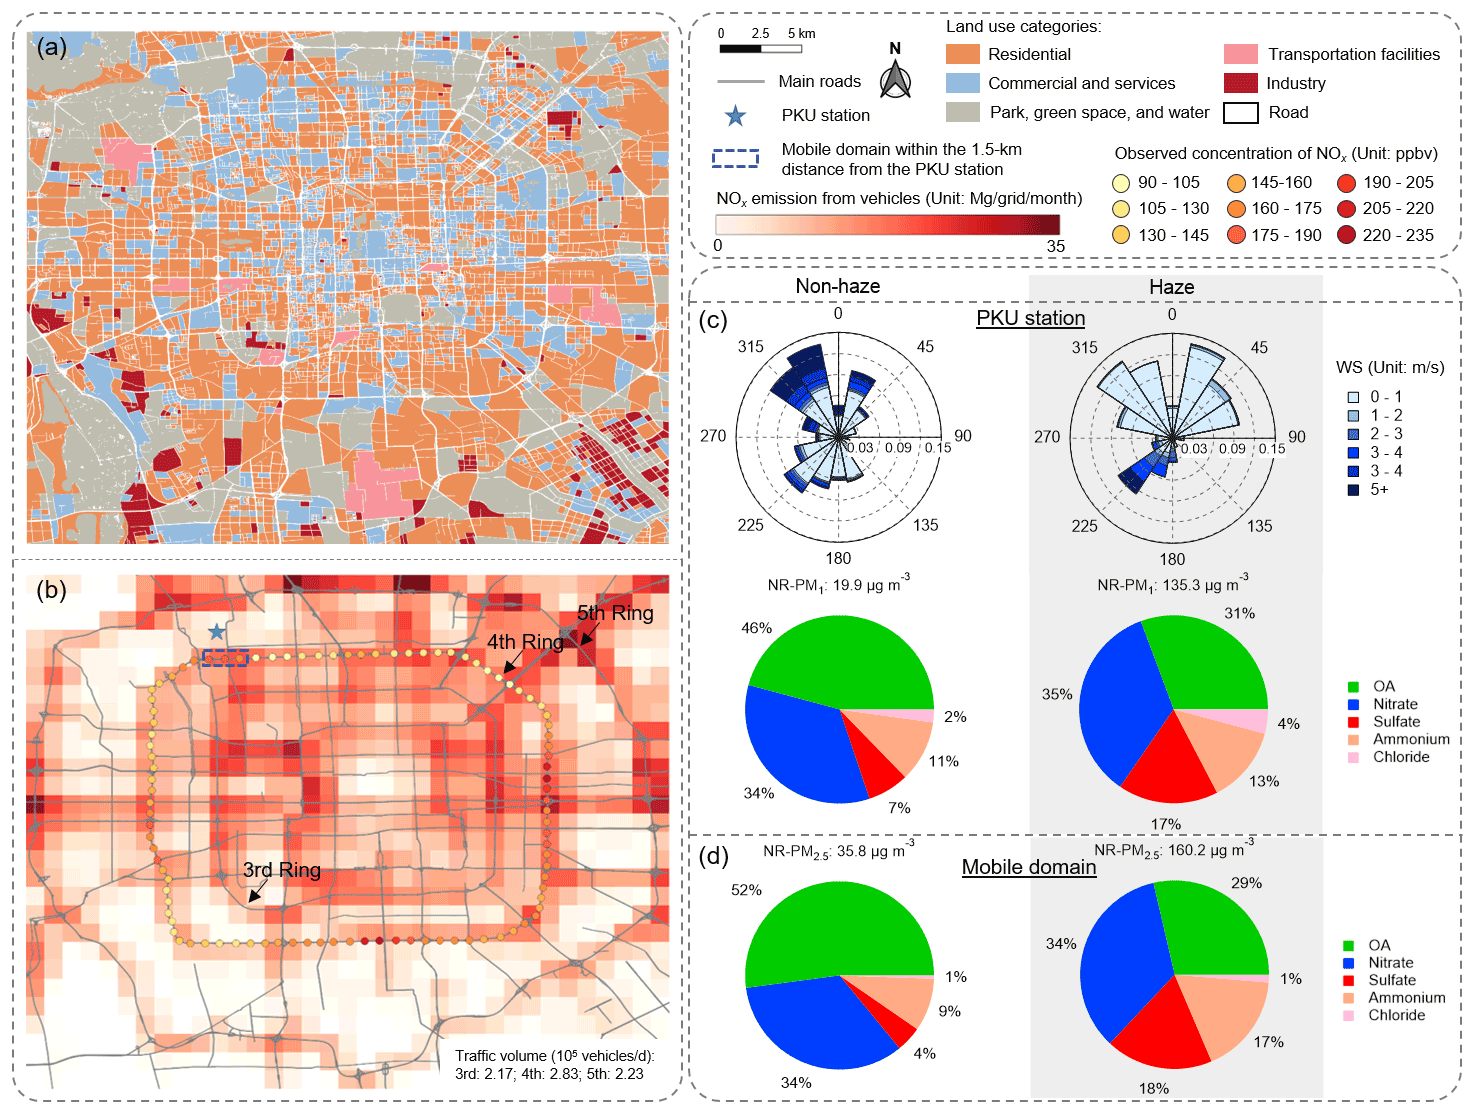
Figure 1(a) Land use categories in the area of Beijing that were taken from the Mapping Essential Urban Land Use Categories in China (EULUC-China) database (source: © OpenStreetMap contributors 2021, distributed under the Open Data Commons Open Database License (ODbL) v1.0.; Gong et al., 2020). (b) Monthly NOx emissions from vehicle provided by Yang et al. (2019) in November 2018 and the mean NOx concentrations observed by the mobile laboratory between 09:00 and 16:00 during the non-haze measurement period on the 4th Ring Road in Beijing. (c) Wind rose diagrams and the average NR-PM1 composition measured by LTOF-AMS at the Peking University (PKU) roof site. (d) The average NR-PM2.5 composition measured by the TOF-ACSM on the mobile laboratory on the 4th Ring Road over the distance of 1.5 km from the roof site.
On-road measurements were conducted by the Peking University (PKU) mobile laboratory on the 4th Ring Road of Beijing on 7–21 November 2018. The 4th Ring Road is a 65 km-long urban highway that passes through residential, commercial and services, park, and transportation areas in the megacity (Fig. 1a). Industrial facilities are mostly located in the south of Beijing and outside of the 4th Ring Road. The average traffic volume on the 4th Ring Road is about 1.2×10⁴ vehicles per hour (Fig. 1b), and over 90 % of the vehicles consisted of light duty gasoline vehicles (LDGVs) that meet national stages III–V emission standards (Wu et al., 2017; Deng et al., 2020; Lv et al., 2020). Our measurements started at around 09:00 and went one cycle after another until 16:00 to avoid rush hours. Each cycle took approximately 70 min with a mean speed of 60 km h−1. Self-contamination from the vehicle exhaust should be negligible for a vehicle speed over 30 km h−1 (Liao et al., 2021). The data that were collected at a speed of less than 30 km h−1 during occasional traffic jams have been excluded from the analysis. Additionally, online measurements of gaseous and particulate pollutants were conducted at a roof station in the PKU campus (39.99∘ N, 116.32∘ E) as a reference. Temperature, relative humidity (RH), barometric pressure, wind speed, and wind direction were acquired from a Met One weather station (Met Station One, MSO). Gas pollutants were measured by Thermo Scientific instruments, including CO (48i-TL), NO-NO2-NOx (42i-TL), SO2 (43i-TL), and O3 (49i-TL). The PM2.5 mass concentrations were measured by a tapered element oscillating microbalance monitor (Thermo, TEOM 1400A). Non-refractory chemical components of submicron particles (NR-PM1) were measured by an Aerodyne long time-of-flight aerosol mass spectrometer (LTOF-AMS). The roof site is located between the 4th and the 5th North Ring Roads, representing a typical urban background environment in Beijing (Zheng et al., 2021).
A suite of instruments was deployed in the mobile laboratory. Detailed information about the sampling system, instrument operation, calibration, and data analysis are provided in Sect. A of the Supplement. Gas and particle inlets were installed at the top front of the vehicle (i.e., about 3.4 m above ground) to sample on-road air that was influenced by diluted vehicle exhaust (Fig. S1 in the Supplement). Gas pollutants were detected by gas analyzers including NO2 (Teledyne, T500U), NO-NOx (Ecotech, EC9841A), SO2 (Ecotech, EC9850A), CO (Ecotech, EC9830A), and O3 (Ecotech, EC9810A) with a time resolution of 2 s. The chemical composition of NR-PM2.5 was measured by an Aerodyne time-of-flight aerosol chemical speciation monitor (TOF-ACSM) equipped with PM2.5 lens and capture vaporizer. The time resolution was 40 s, corresponding to a spatial resolution of ∼ 0.7 km for a driving speed of 60 km h−1. The mass resolution was about 400. A collection efficiency of about unity was used, and the uncertainty of mass quantification was ∼ 30 % (Zheng et al., 2020). Positive matrix factorization (PMF) analysis was performed on the unit-mass resolution OA mass spectra for mass-to-charge ratio () of 12–200 by using the Igor PMF evaluation tool (PET, version 3.00B). Details are given in Table S1, Figs. S2–S5, and Sect. A3 of the Supplement. A total of five OA factors have been resolved including hydrocarbon-like OA (HOA), cooking-related OA (COA), and three oxygenated OA (OOAs). The common OA factors related to biomass burning (BBOA) or coal burning (CCOA) were not resolved in this data set. They were likely mixed with HOA because of the similarity in the CV spectra (Zheng et al., 2020). Their contributions to OA were expected to be small because of the stringent emission control in the NCP in recent years (Zheng et al., 2020; Duan et al., 2020). Consistently, the PTR-MS data showed low concentrations of acetonitrile (i.e., 0.15 ± 0.20 ppbv for non-haze periods and 0.60 ± 0.22 ppbv for the haze period) during the mobile campaign. By comparison, the average concentrations of acetonitrile are usually greater than 0.7–1 ppbv in the winter of Beijing when biomass and coal burning contributes significantly (Huangfu et al., 2021; Shi et al., 2020).
The VOCs and OVOCs were detected by an Ionicon proton transfer reaction-quadrupole ion guide time-of-flight mass spectrometer (PTR-QiTOF) with a time resolution of 2 s. The overall quantification uncertainties were less than 20 % for calibrated species, and 19 % or 33 % for uncalibrated species with known or unknown reaction rate constants (Kptr), respectively (Huang et al., 2019). Table S2 in the Supplement lists the Kptr values, the mean concentrations, and the tentative categorization of VOCs and OVOCs measured herein (Yuan et al., 2017). A moving average window of 10 (i.e., 20 s) was applied to the entire data set for the VOC and OVOC species. Baseline concentrations for each 2 s point in the 20 s smoothed data were calculated as the 5th percentile concentration within a rolling window of 60 (i.e., 120 s) to represent the well-mixed urban background. Figure S6 in the Supplement shows the time series and the baselines of selected VOC and OVOC concentrations during two typical runs on the 4th Ring Road. We calculated the peak fraction (PF) parameter as 1 minus the ratio of the mean baseline value to the observed mean concentrations to indicate the contributions to the mean observed concentrations above the mean local baseline (Apte et al., 2017). In addition, we computed a batch of 12 h backward trajectories for the height of 3 m around the 4th Ring Road from the Hybrid Single-Particle Lagrangian Integrated Trajectory (HYSPLIT) model to investigate the influence of regional transport on our measurements during the haze day (Stein et al., 2015). The start time of the trajectory analysis was set at 09:00, and the trajectory calculations were repeated every 1 h until 16:00 (Fig. S7 in the Supplement).
3.1 Spatial distribution and variability during the non-haze days
Figure S8 in the Supplement shows the time series of meteorological parameters and mass concentrations (or mixing ratios) of air pollutants measured at the PKU roof station during the mobile campaign. We classified haze (≥ 75 µg m−3) and non-haze (< 75 µg m−3) days based on the daily mean PM2.5 mass concentrations measured at the roof site. The mobile measurements covered from 09:00 to 16:00 for 8 non-haze days and 1 haze day. Apte et al. (2017) suggested that a small number of drive days (i.e., < 5 d) may result in a biased data set to represent the long-term spatial patterns. Although we have limited data (1 d) to represent the weekend or haze conditions, some of the key characteristics of air pollutants from the mobile measurements are consistent with previous understanding about weekend effects and haze evolution in Beijing (Table S3 in the Supplement). For instance, lower mass concentrations of aerosol species presented at weekends than on weekdays in winter, similar to previous findings (Sun et al., 2015). NOx and VOC concentrations were lower at weekends than on weekdays because of heavier traffic loads and anthropogenic activities. By contrast, O3 concentrations were greater at weekends, indicating enhanced photochemical production (Wang et al., 2014; Liu et al., 2020). A severe haze event occurred on 13–14 November 2018 under stagnant weather conditions with occasional shifts between northerly and southerly winds (Fig. S8). The PM2.5 concentrations increased rapidly to nearly 300 µg m−3 during that event. Relative humidity (RH) increased and remained above 70 % on 14 November 2018, which was often observed in the later stage of severe winter haze in NCP in China (Sun et al., 2016). The elevated RH can lead to a large increase of aerosol liquid water content which may promote aqueous or heterogeneous chemistry to enhance the formation of secondary species (Peng et al., 2021). Indeed, the mass concentrations of sulfate, nitrate, and OA increased greatly, and nitrate became the most abundant component during the haze day. Moreover, the meteorological conditions and pollutant concentrations were similar to previous findings in Beijing (Zheng et al., 2021). The aerosol compositions measured by the mobile laboratory within a distance of 1.5 km from the site were also similar to the roof-site observations (Fig. 1c–d), taking into account the potential difference between PM1 and PM2.5 (Sun et al., 2020).
Figure 2 shows the spatial distributions of the mean mixing ratios of gaseous pollutants. During the non-haze days, gas pollutants all showed significant spatial variability. The mean mixing ratios varied by 2–3 times for SO2, CO, NO, NO2, and O3 and by 4–21 times for VOC subgroups on the 4th Ring Road. For SO2, the mean mixing ratios ranged from 3.7 to 7.1 ppbv. The lack of hot spots in the spatial pattern indicates a minor influence of on-road or near-road (e.g., off-road engines) sources. The overall low concentrations of SO2 are consistent with the predominant contribution of regional transport as a result of the phasing out of coal use in Beijing including power plants, coal boilers, and residential stoves (Zheng et al., 2018; Ge et al., 2018). High SO2 concentrations presented in the northwest segment, while the low concentrations were in the north segment. In summer, the southeast prevailing wind can lead to higher concentrations of SO2 in the southeast areas (Wang et al., 2011; Zhu et al., 2016). The northwest prevailing wind in winter, however, usually brings clean air masses that are far away from the NCP regional sources (Fig. 1c). The relatively high SO2 mixing ratios in the northwest segment were perhaps associated with residential coal burning near the mountain area where the replacement of coal has lagged behind compared with the plain area.
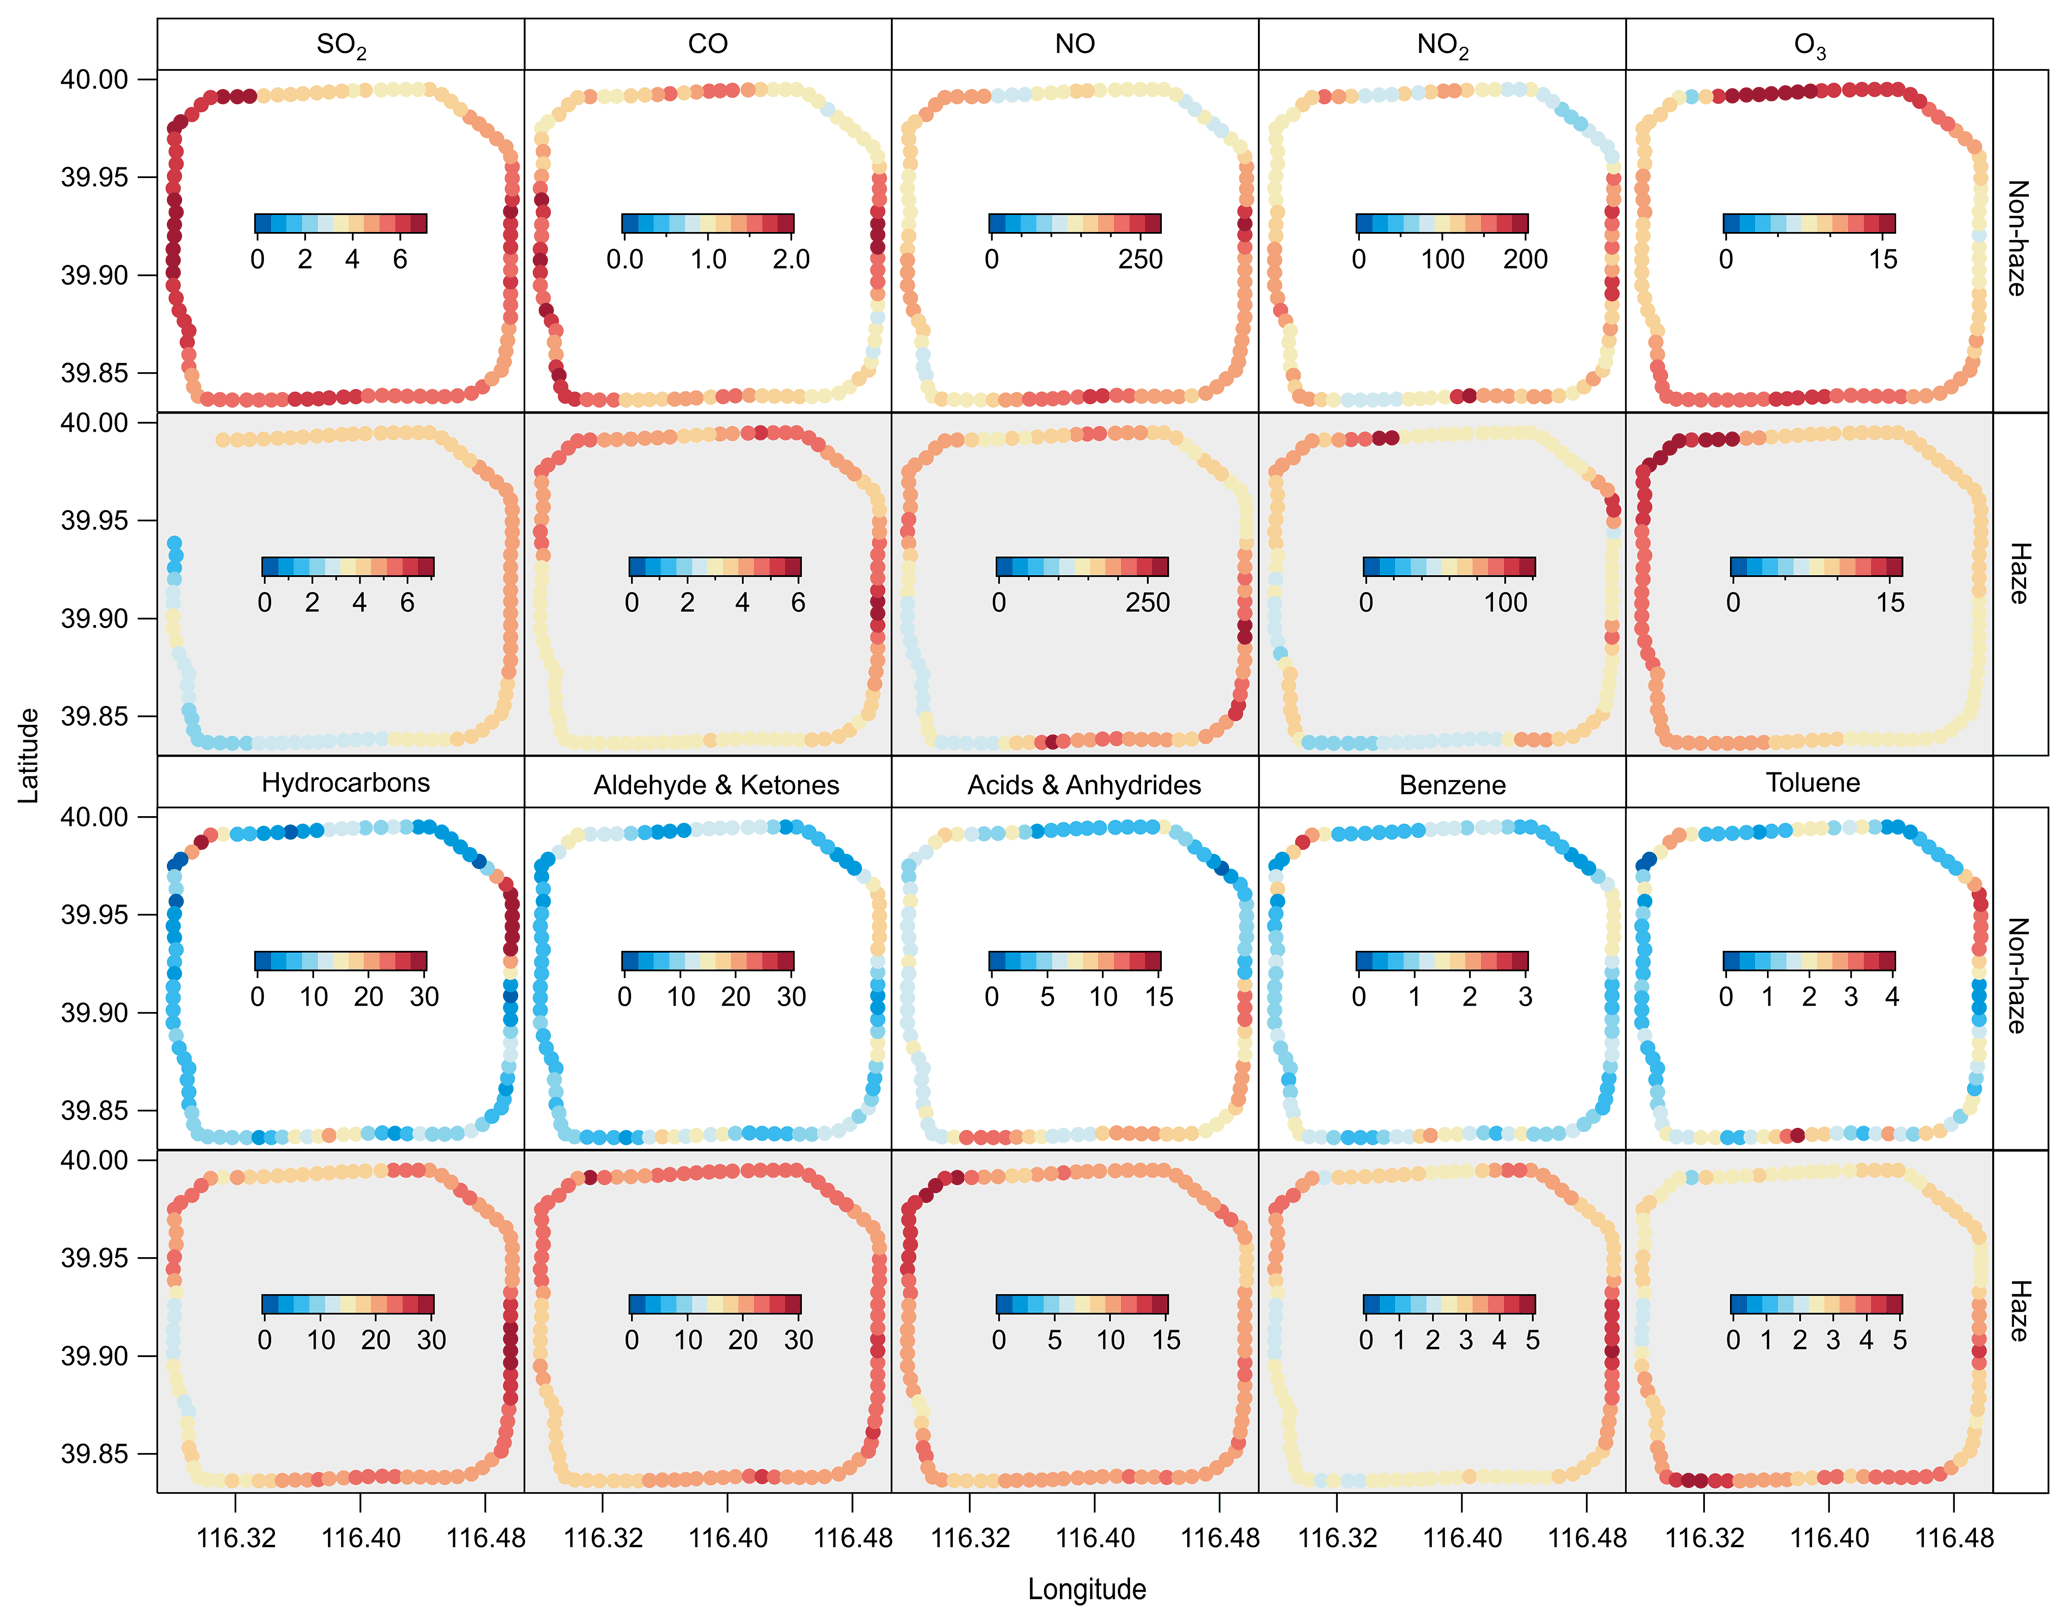
Figure 2Spatial patterns of the mean mass mixing ratios (units: ppmv for CO and ppbv for others) of gas pollutants measured on the 4th Ring Road in Beijing. Data covered from 09:00 to 16:00 during the measurement period.
For CO, the mean mixing ratio of 1.5 ± 0.7 ppmv was about three times greater than the urban background level (0.5 ± 0.3 ppmv at the PKU roof site), indicating significant contributions of localized sources during the non-haze days. Vehicle emissions are the main local source of NOx and CO in Beijing (Qi et al., 2017). The spatial distribution of NOx was generally consistent with that of CO, showing relatively high mixing ratios in the west and east segments of the 4th Ring Road (Fig. S9 in the Supplement). Differences remained in the southwest corner where CO showed high concentrations but NOx did not, which was perhaps related to non-vehicle sources or different fleet composition. On-road NO2 can be contributed by direct tailpipe NO2 emissions, NO titration, and urban background. The mean mixing ratios of on-road Ox (114.1 ppbv) were much greater than the roof-site mean ratio (48.7 ppbv) during the non-haze periods, indicating a possible contribution of direct tailpipe NO2 emissions, although tailpipe NO2 emissions for LDGVs of national stages III–V are expected to be low (Wu et al., 2017). On-road NO titration can also be strong (Yang et al., 2018), considering that the spatial patterns for O3 and NO were anticorrelated (Pearson ) and the mean mixing ratios of on-road O3 (11.2 ± 2.2 ppbv) were over 2 times lower than the roof-site observations (25.7 ± 12.8 ppbv). Quantitative analysis of the relative contributions to on-road NO2 is, however, difficult because the roof site was located in the upwind direction. Overall, the spatial pattern of NOx was consistent with the bottom-up emission inventory for (1) the nonuniform vehicle emissions on the 4th Ring Road and (2) high concentrations in the east segment of the 4th Ring Road where the traffic volume was high (Figs. 1b and S10 in the Supplement).
The spatial distributions of VOCs varied by species. The LDGVs emit aromatic hydrocarbons (e.g., benzene, toluene, ethylbenzene, and xylenes) and some oxygenated species (e.g., acetaldehyde) (Gentner et al., 2017). Solvent use and residential solid-fuel combustion are the other localized sources for hydrocarbons (L. W. Wang et al., 2021). The on-road concentrations of such primary VOCs were much greater than the concentrations measured at the urban and suburban sites in Beijing (Table S2). During the non-haze days, the tentatively assigned group of hydrocarbons showed the greatest spatial variability (by 21x) among VOCs, whereas the groups of aldehydes and ketones as well as acids and anhydrides showed less variability (by 4x and 9x , respectively) (Table S2). Secondary production is expected to contribute greatly to the latter two groups (L. W. Wang et al., 2021). The toluene to benzene concentration ratio (TB) has been widely used to differentiate the VOC sources. Some hot spots in the spatial pattern of hydrocarbons (e.g., high concentrations in the northwest corner and the northeast segment) were plausibly contributed by transient plumes of vehicle exhaust (Fig. S10). The TB ratios was ∼ 1 in the northwest corner and ∼ 2 in the northeast segment (Fig. S9), suggesting perhaps different fleet composition (Mo et al., 2016). Industry and solvent emissions have greater TB ratios than vehicle emissions, whereas emissions from biomass or solid fuel burning or aged air mass typically have lower TB ratios (Song et al., 2021; and references therein). Some other high TB ratios (∼ 3) in the south and southeast segments might be affected by industrial emissions in the south of Beijing (Fig. 1a). The spatial patterns of hydrocarbons (or benzene and toluene) were different from that of NO or NOx, explained by the potential differences in fleet composition and urban background contributions as well as the chemical conversion rate.
Figure 3 shows the spatial distributions of the mean mass concentrations of key PM2.5 components. During the non-haze days, the mean concentrations of OA, nitrate, sulfate, and ammonium on the 4th Ring Road varied by 9–13 times. The coefficients of variation (CV, the standard deviation divided by the mean) of the four components and chloride ranged from 38 % to 84 %, indicating strong variability on the 24x 17 km intracity scale (Table S4 in the Supplement). The spatial variability of aerosol species was similar to that of VOCs but greater than that of other gas pollutants. The OA was the major contributor to the NR-PM2.5 mass (Table S3). Its concentration varied by 9 times on the 4th Ring Road. The spatial variability of the OA mass was attributed to both POA and SOA. As shown in Fig. 4 the mass concentrations of POA factors, such as HOA and COA varied from 0 to 20 µg m−3 with hot spots in different segments of the 4th Ring Road. The 40 s PM2.5 measurements by TOF-ACSM roughly represents a maximum area of 0.16 km2 (for a mean wind speed of 6 m s−1 and wind direction perpendicular to the mobile path) upwind when the mobile laboratory was run on the 4th Ring Road by cycles. The HOA hot spots are generally consistent with the locations where the driving speed was relatively low (i.e., perhaps high traffic volume). We use the driving speed to indicate the traffic volume because the real-time traffic volume data were not available (Fig. S10 in the Supplement). The COA hot spots are consistent with the places where the 4th Ring Road passes through sparsely located residential areas (Fig. 1a).

Figure 3Spatial patterns of the mean mass concentrations (units: µg m−3) of the key PM2.5 chemical components measured on the 4th Ring Road in Beijing. Data covered from 09:00 to 16:00 during the measurement period.
Moreover, the mass concentrations of the sum of OOAs varied from 0 to 15 µg m−3. Local photochemical production of SOA is a significant source of OA in Beijing in winter, although the solar radiation is reduced (Duan et al., 2020; Lu et al., 2019a). The photochemical production depends on the distributions of SOA precursors and oxidants. In the northwest corner where hydrocarbons showed high concentrations, the OOA mass loadings were indeed high. Because the majority of the SOA precursors (i.e., intermediate volatility and semivolatile organic species from anthropogenic sources) were not measured by the PTR-Qi-ToF (Liao et al., 2021; Miao et al., 2021), it is difficult to investigate more about the OOA sources. The measurements in Pittsburgh also showed a significant spatial heterogeneity of primary carbonaceous components, such as HOA, COA, and BC (Gu et al., 2018). Less spatial variability was found for OOAs in the Pittsburgh study. The OA mass loadings in Pittsburgh were, however, much less than the loadings in Beijing. The SOA formation can be significantly more efficient and complicated under conditions of high oxidative capacity and abundant precursors in Beijing than in Pittsburgh (Lu et al., 2019a; Li et al., 2021; Yang et al., 2019). Imperfect separation of POA from SOA by the PMF analysis may also lead to misplaced spatial variability in OOA. For example, the CV-based PMF analysis may overestimate the SOA mass compared with the traditional AMS analysis (Zheng et al., 2020), which may lead to inappropriate attribution of POA to SOA and thus more spatial variability in SOA. Uncertainty remains in the mass separation of POA and SOA (Sect. A3 of the Supplement).
Among the inorganic aerosol species, chloride has the highest CV (Table S4). The mean concentration of chloride varied from below the detection limit (0.04 µg m−3) to 0.6 µg m−3. Although the TOF-ACSM equipped with capture vaporizer may underestimate the chloride mass concentrations by a factor of 2, its contribution to the mass and spatial variability of PM2.5 were negligible. The main source of chloride in winter in Beijing is coal burning by regional transport, which should not lead to high spatial variability. The cause of such a high spatial variability of chloride during the non-haze days remains unknown. One hypothesis is the resuspended particles from the road (Chen et al., 2012). The spatial variability of sulfate, nitrate, and ammonium were similar in terms of CV and the concentration variations. The spatial pattern of ammonium, however, showed a large heterogeneity. The molar ratio of ranged from ∼ 0.5 to 1.7 (Fig. 5), suggesting a wide range of particle neutralization in winter in Beijing during the non-haze days. In Beijing, the aerosol mass can be sensitive to either ammonia or the availability of nitric acid (Nenes et al., 2020). Traffic and agriculture (e.g., livestock) emissions are the main sources of ammonia in Beijing in winter (Sun et al., 2017; Pan et al., 2018). The former depends on vehicle type and volume and hence may vary greater on the Ring Road (Sun et al., 2017). The concentrations of nitric acid depend on the concentrations of NOx and hydroxyl radicals (OH), which may also vary spatially. Besides, the distribution of solar radiation on the surface is nonuniform because of the shade from buildings and occasional cloud cover. Therefore, the spatial heterogeneity of inorganic composition can be caused by different thermodynamic regimes in the megacity. The inorganic composition has less spatial variability in Pittsburgh than in Beijing (Gu et al., 2018). A possible explanation is that the formation of ammonium nitrate is sensitive to ammonia only in Pittsburgh (Nenes et al., 2020). The heterogeneity of the inorganic composition can be seen in each of the single cycles on the 4th Ring Road (Fig. S11 in the Supplement).
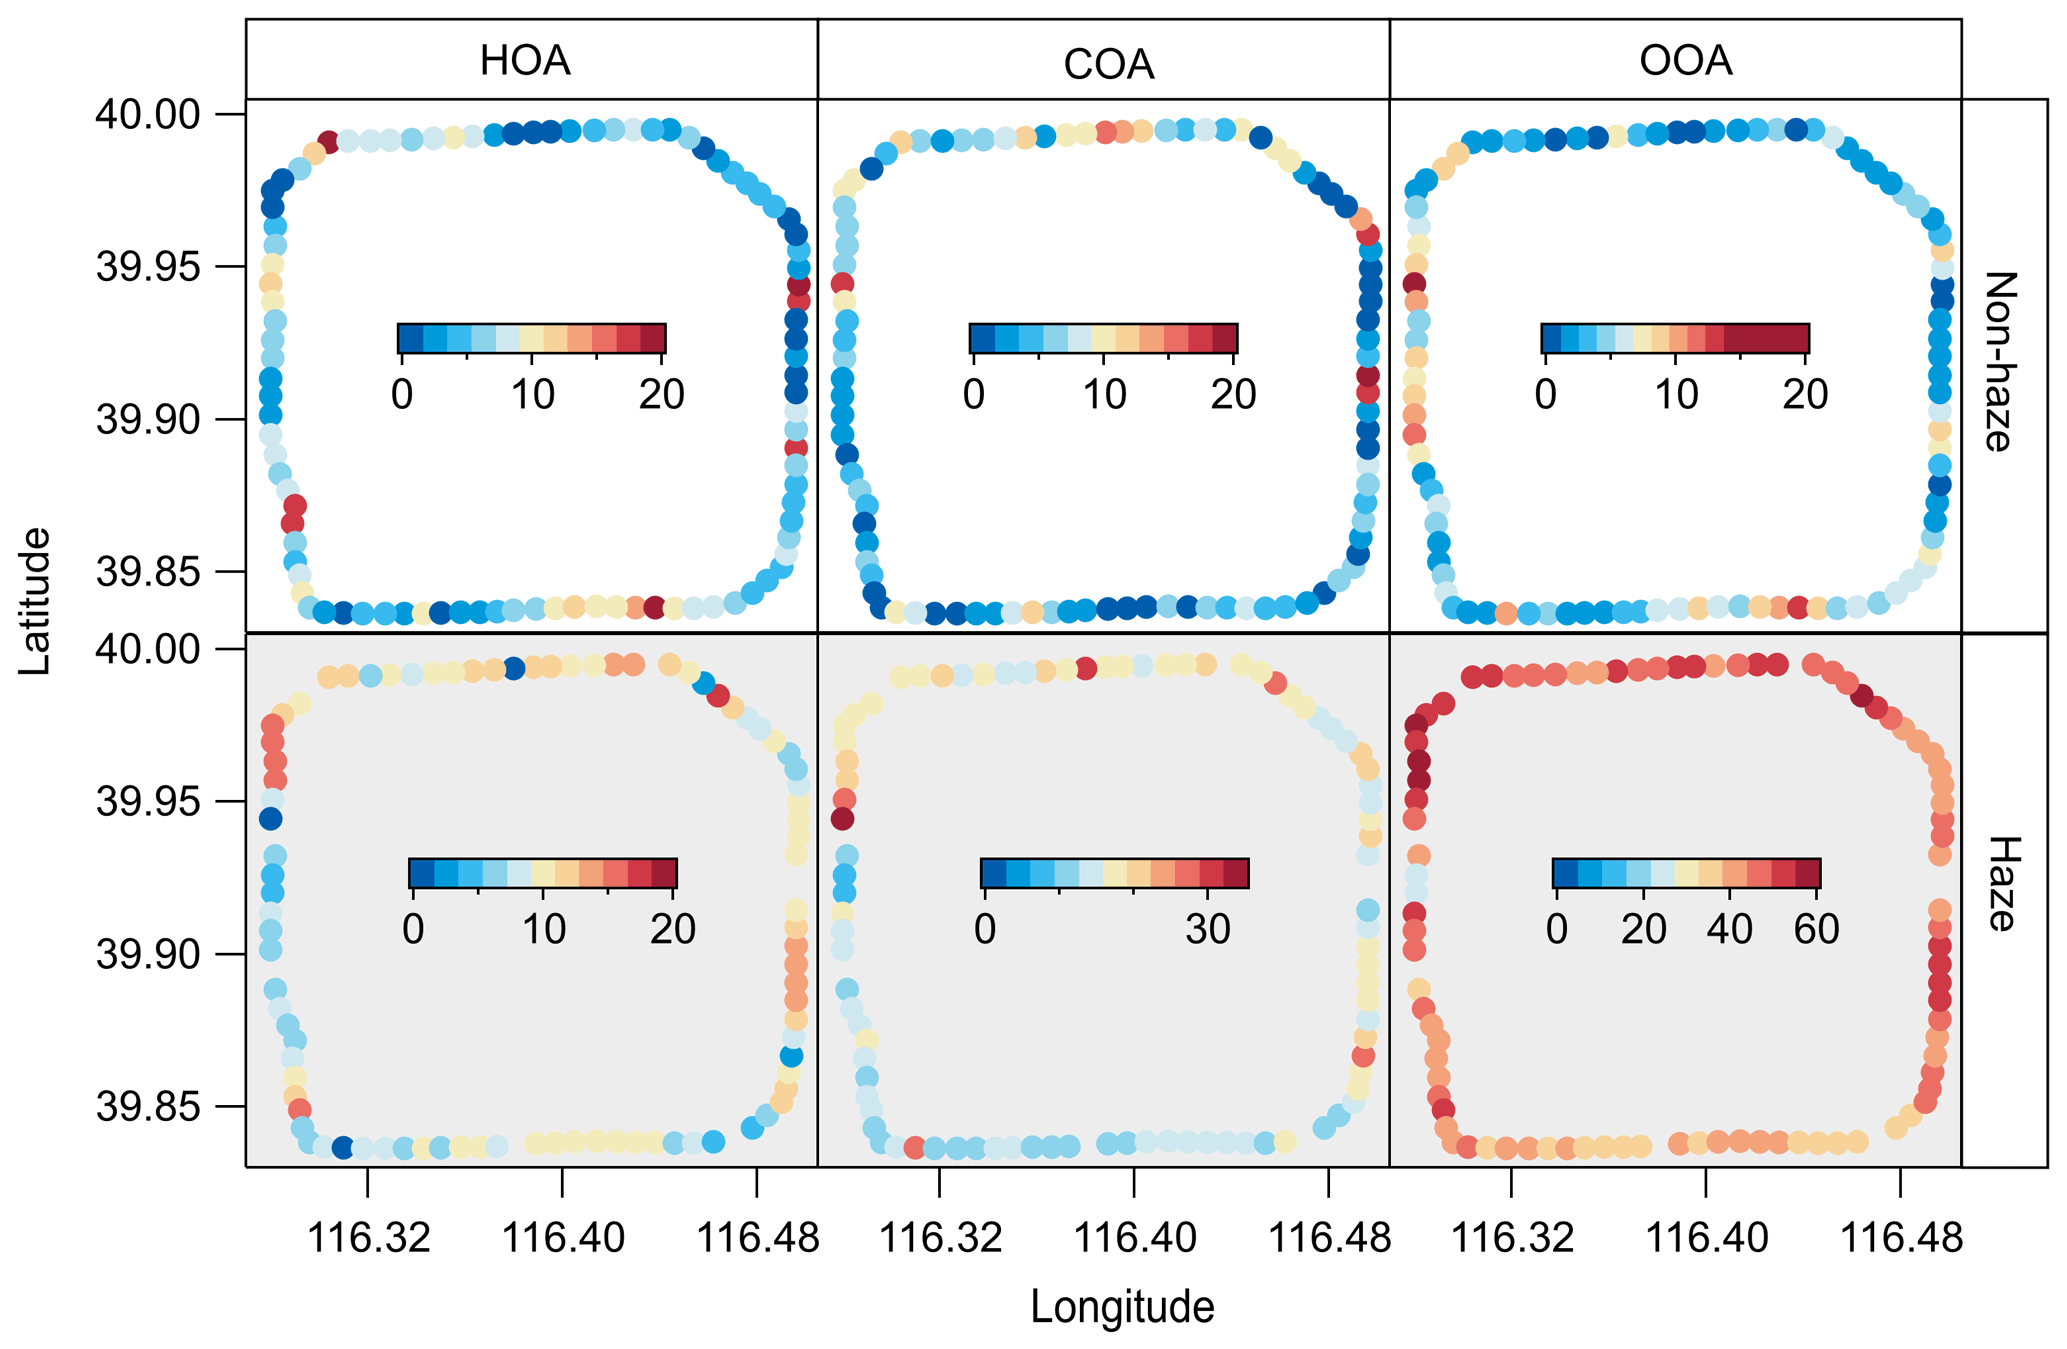
Figure 4Spatial patterns of the mean mass concentrations (units: µg m−3) of OA factors resolved by the PMF analysis of organic mass spectra obtained by the TOF-ACSM on the 4th Ring Road in Beijing. Data covered from 09:00 to 16:00 during the measurement period.

Figure 5Spatial patterns of the molar ratio of derived from the aerosol measurements on the 4th Ring Road in Beijing. Data covered from 09:00 to 16:00 during the measurement period.
3.2 Spatial distribution and variability during the haze day
The spatial patterns of air pollutants were very different under different pollution conditions. As shown in Fig. 2, the mean mixing ratios of SO2 during the haze day were lower than the non-haze day case (Table S3), explained by the large conversion of gaseous SO2 to sulfate by both of the photochemical and aqueous processes under severe haze conditions (W. G. Wang et al., 2021). The mean mixing ratios of CO were however greater than the non-haze day ratios, indicating accumulated pollution. CO and SO2 showed relatively high concentrations in the east and north segments of the 4th Ring Road during the haze day. The haze in NCP is usually developed regionally, meaning that the polluted air mass travels and would become more polluted when it suspends in urban areas to accumulate local emissions and secondary production under stagnant conditions. The 12 h backward trajectories around the 4th Ring Road show that the air masses were mostly from the east in the morning, started shifting towards south at ∼ 12:00, and then were mainly originated from the south around 16:00 (Fig. S7 in the Supplement). Southwesterly, southeasterly, and easterly fluxes have been recognized as regional pollution sources to Beijing (Chang et al., 2019). The spatial patterns of SO2 and CO are thus consistent with the transport routes, and the low concentrations in the southwest suggest a possible edge of the polluted air mass (Peng et al., 2021). For NO, the mean mixing ratio at the PKU roof site during the haze day (46.0 ± 19.8 ppbv) was much greater than that observed for the non-haze days (14.7 ± 17.4 ppbv), but was still much lower than the on-road mixing ratios because of the titration. The spatial patterns of NO were similar for the non-haze and haze days, except the slightly greater concentrations in the north segment during the haze day. The mean NO2 concentrations (69.7 ± 26.5 ppbv) were lower during the haze day than during the non-haze days (102.9 ± 37.3 ppbv). The corresponding PKU roof-site mean concentrations of NO2 was 63.0 ± 8.8 ppbv, which is similar to the on-road concentrations. This indicates a potentially high urban background contribution to on-road NO2 concentrations during the haze day, which is plausibly greater than its contribution during the non-haze days. The spatial pattern of NO2 was determined by both on-road titration and urban background (similarly for O3) during the haze day, and thus the spatial patterns of NO2 and O3 were different from those for the non-haze days.
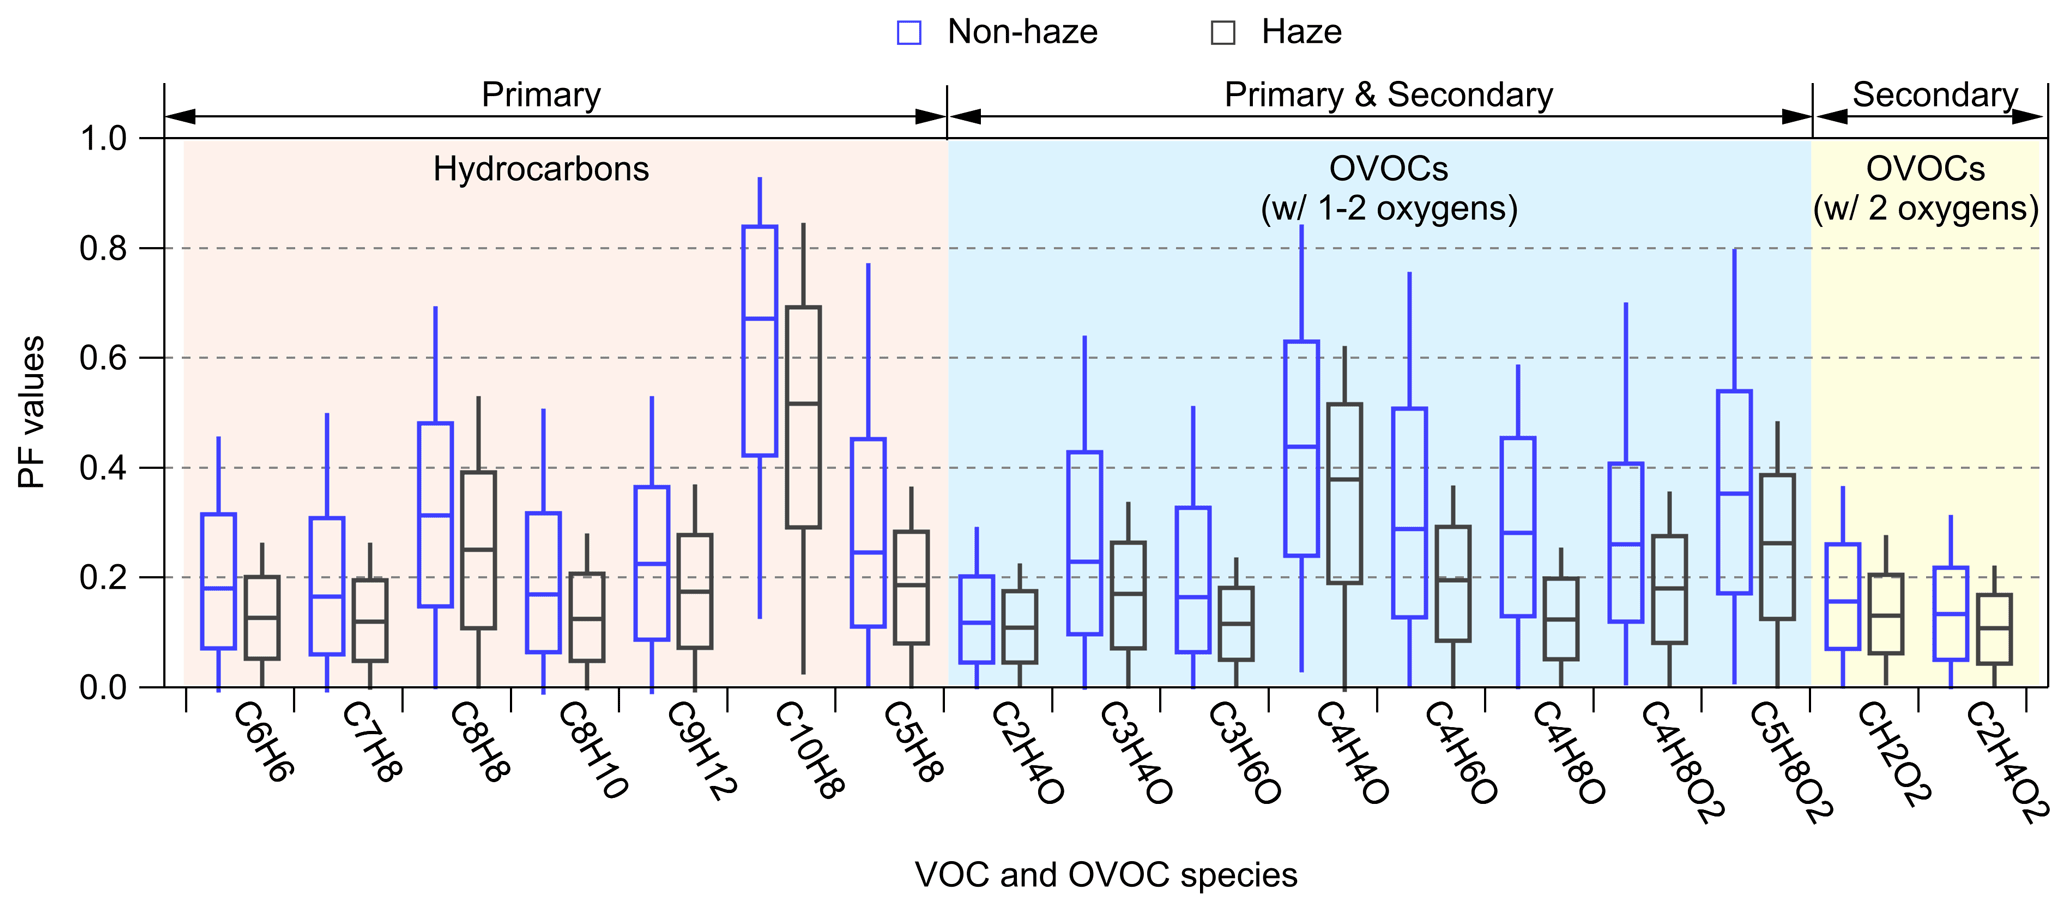
Figure 6Peak fraction (PF) values for common VOC species measured on the 4th Ring Road in Beijing. Data covered from 09:00 to 16:00 during the measurement period. The box and whisker plots show the median, 75th and 25th percentiles, and 90th and 10th percentiles of PF values calculated for each data point.
Overall, the spatial variabilities for SO2, CO, NO, NO2, and O3 were similar during the non-haze and haze days (i.e., varied by 2–4x with similar CV values) (Table S4). The spatial variability for VOCs was greatly reduced during the haze day (by 2–3x in contrast to 4–21x during the non-haze days), especially for the OVOCs. The spatial patterns of benzene and toluene during the haze day were different from those during the non-haze days with lower TB ratios. The low ratios suggest aged air mass during the haze day, which is consistent with the influence of regional pollution (de Gouw et al., 2005). The spatial patterns of OVOCs are similar to each other except for the OVOCs having 3–4 oxygen atoms in their formulae (see more discussion in Sect. 3.3). The calculated PF for VOCs ranged from 11 %–67 % (median) (Fig. 6). High PF values were found for hydrocarbons and some OVOCs (e.g., C8H8, C10H8 and C4H4O), indicating a major contribution of transient localized sources (e.g., traffic, industrial facilities) to these species. The time series of these so-called primary species showed low baselines and sharp peaks (Fig. S6). By contrast, OVOCs (i.e., with 2 or more oxygen in their formulae) that were typically considered as secondary species had low PF values (median: 11 %–16 %) and elevated baseline contribution from photochemistry. Significance tests indicate greater PF values for the primary species during the non-haze days, meaning that the localized sources contributed more to the measured concentrations during the non-haze days than during the haze day (p<0.001). During the haze day, the localized emissions should be accumulated near the source under stagnant conditions. Indeed, the peak concentrations of primary VOC species were significantly greater (e.g., ∼ 2–4x for C6H6 and C7H8) (Fig. S6). The lower PF values (by 30 % for C6H6 and C7H8) during the haze day were caused by much more elevated baselines (e.g., ∼ 9x for C6H6 and C7H8) that represent urban background affected by polluted air masses from regional transport plus gradually mixed local emissions. The mean VOC concentrations at the PKU roof site increased by about 2 times during the haze day, which agrees with the elevated baselines (Table S3 and Fig. S12 in the Supplement).
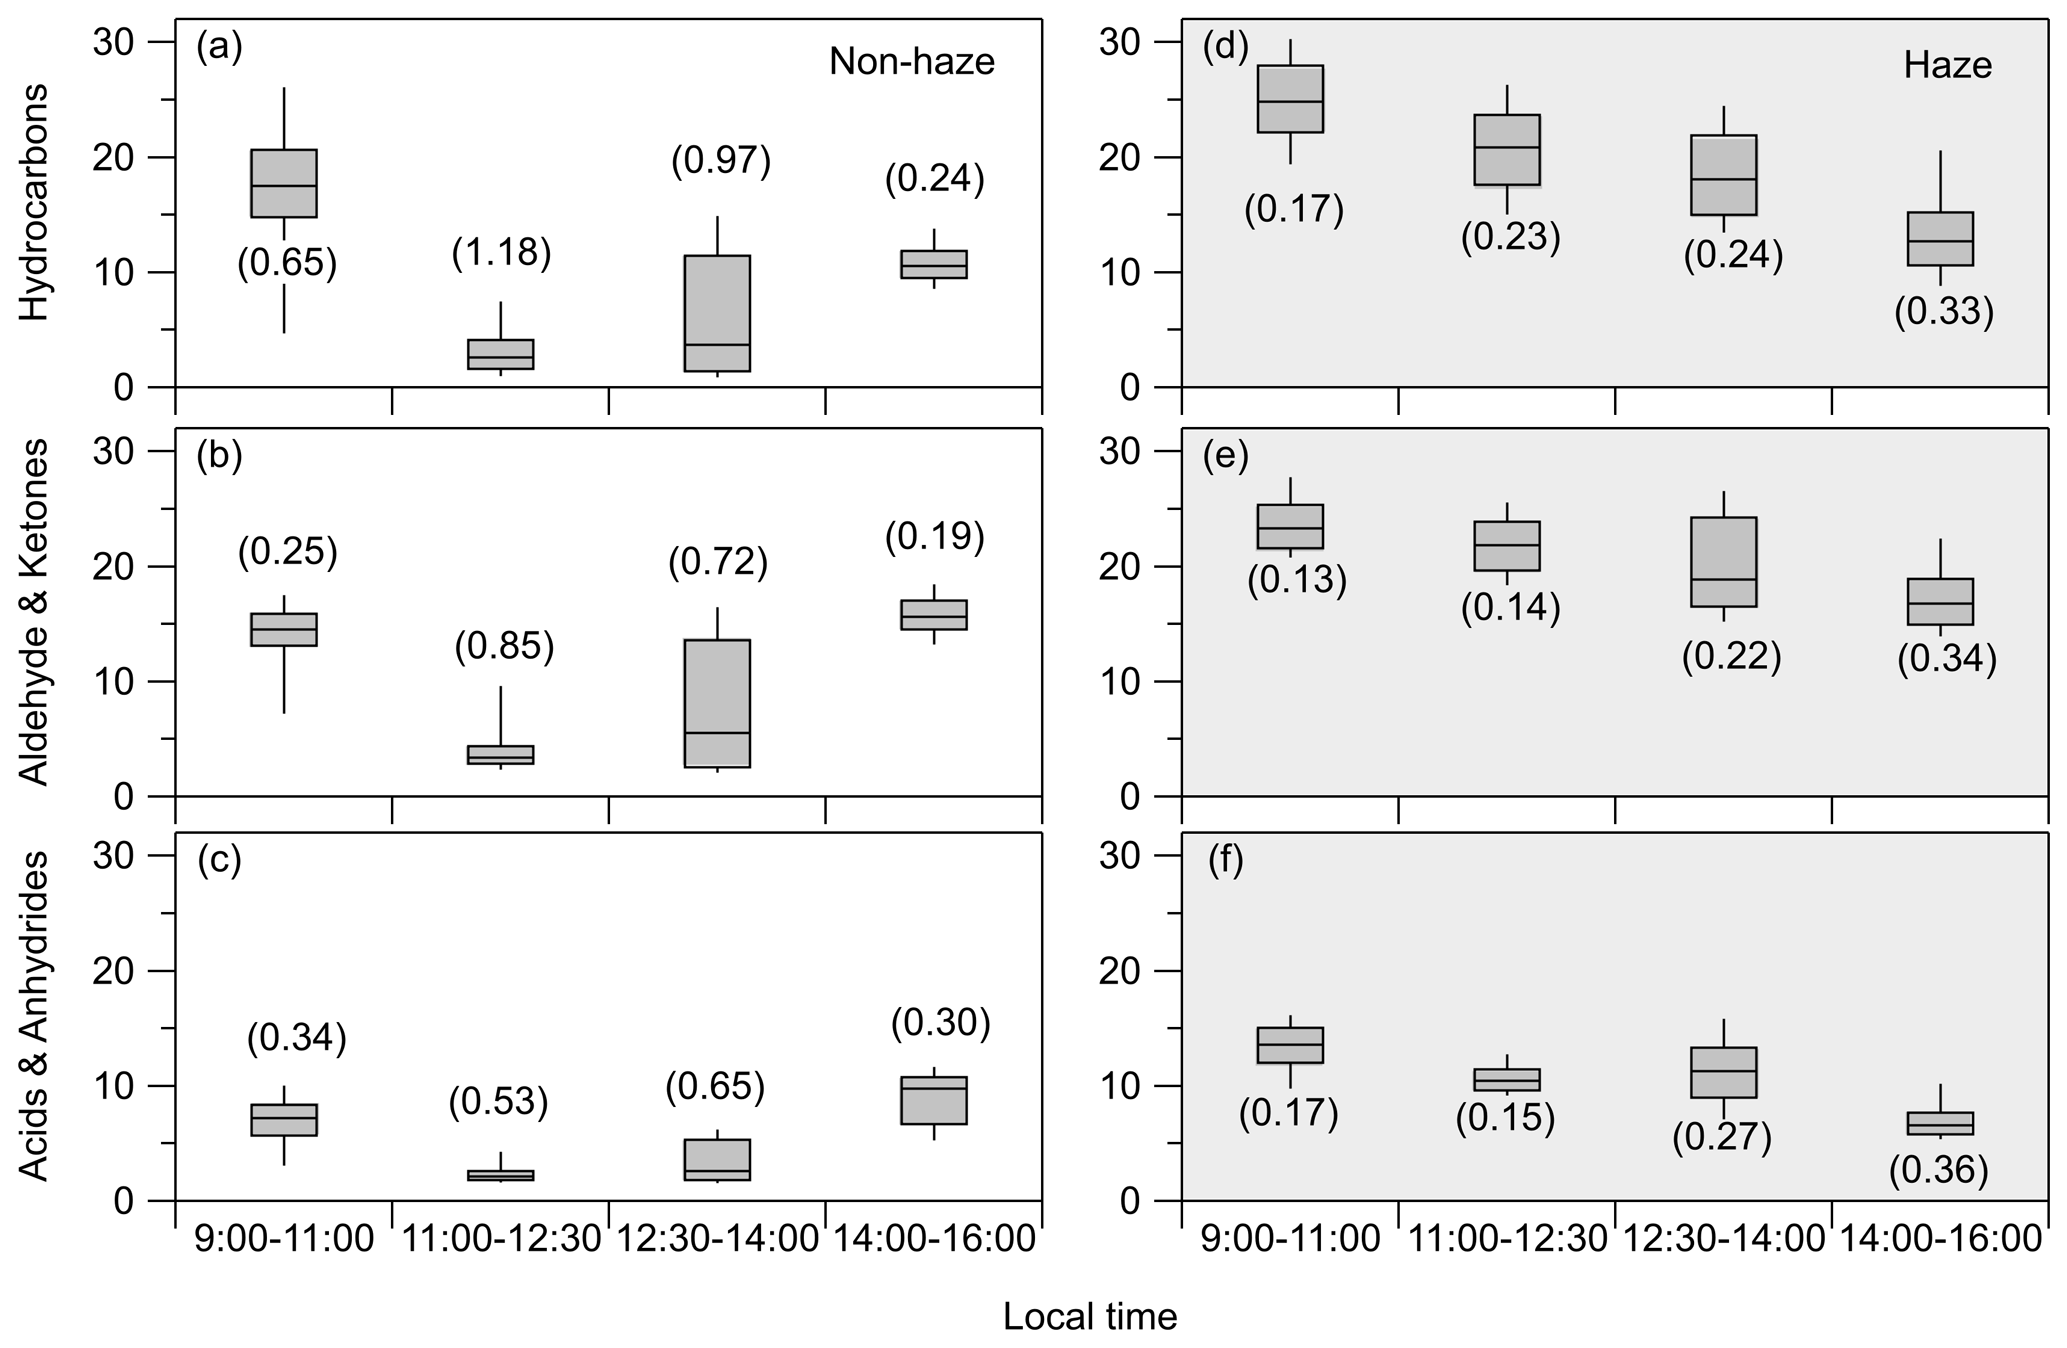
Figure 7Spatiotemporal distributions of the mixing ratios (units: ppbv) of ∑ hydrocarbons, ∑ aldehydes and ketones, and ∑ acids and anhydrides, measured during the non-haze and haze days. The box and whisker plots show median, 75th and 25th percentiles, 90th and 10th percentiles of all the data points. The numbers in parentheses represent the CV values. Data covered from 09:00 to 16:00 during the measurement period.
The haze day mean concentrations of aerosol species increased by about 5 times on the 4th Ring Road (Fig. 3). Similar to OVOCs, the spatial variability of aerosol species was greatly reduced with CV values of < 35 % vs. 38 %–84 % for the non-haze days. Hot spots of HOA and COA became more evident, which is consistent with the less dispersed primary emissions under stagnant conditions (Fig. 4). The OOA mass increased most and showed a spatial pattern that were consistent with inorganic species. Unlike the non-haze days, the spatial pattern of ammonium was similar to those of sulfate and nitrate. The chemical composition of PM2.5 became relatively homogeneous during the haze day. The molar ratio of was ∼ 1 (Fig. 5), suggesting a uniform neutralization pattern over the city during the haze day. Although stagnant conditions facilitate the accumulation of localized emissions, a polluted air mass leads to elevated urban background for both primary and secondary pollutants. Previous studies suggest that over 60 % of the PM2.5 mass in Beijing can be contributed by regional transport during the winter haze event (Sun et al., 2014; Wu et al., 2021). Secondary formation can also be enhanced because of the elevated precursor concentrations during the haze day and heterogeneous and aqueous pathways that occur at the high RH haze stage. Our results indicate a spatial chemical homogeneity perhaps in a regional scale in terms of particle formation (Sun et al., 2016; Chen et al., 2020). The uniform spatial distributions of PM composition under haze conditions are similar to the observations in the metropolitan area of Zurich when thermal inversions occur over the Swiss plateau and secondary pollution was built up regionally (Mohr et al., 2011), highlighting stagnant meteorological conditions as one of the key drivers of the chemical homogeneity.
3.3 Chemical homogeneity of OVOC formation under haze conditions
Figure 7 shows the spatiotemporal variations of the concentrations of the detected VOCs and OVOCs measured during the non-haze and haze days. The concentrations of ∑ hydrocarbons (i.e., aromatics and alkenes) were the highest in the morning (09:00–11:00) for both non-haze and haze periods, which may be explained by shallow boundary layer, rush hour traffic emissions, and slow chemical removal (de Gouw et al., 2009). The on-road measurements of hydrocarbons were largely affected by instantaneous vehicle plumes. The traffic volume in Beijing is usually less around noon than in the afternoon (Wu et al., 2017). Accordingly, the concentrations of hydrocarbons were greater with larger variations in the afternoon (14:00–16:00 p.m.) than in the earlier period (11:00–14:00), indicating more vehicle plumes were captured by the mobile measurements in the afternoon. Under non-haze conditions, the spatial variability of hydrocarbons varied significantly during the day. The CV values were high in the morning and low in the afternoon. It is likely that photochemistry and better mixing conditions in the afternoon smoothed out some of the spatial variability caused by the on-road vehicle emissions (Mellouki et al., 2015; Karl et al., 2018). In contrast, the concentrations continued to decrease during the day under haze conditions, and the greater concentrations of ∑ hydrocarbons than during the non-haze days were plausibly driven by the elevated urban background levels from regional pollution and less dispersed vehicle plumes under stagnant conditions. Under haze conditions, the spatial variability of hydrocarbons was slightly greater in the afternoon, which was probably because of the change in direction of the regional transport. As shown in Fig. S7, the backward trajectories suggest that the air masses gradually shifted from eastern to southern during the haze day. For the two categories of OVOCs, the non-haze temporal variations were similar to that of hydrocarbons. The CV values indicate much smaller spatial variability of OVOCs in the morning rush hour (09:00–11:00) than that of hydrocarbons, which is consistent with previous finding of the predominant contribution of secondary production to most OVOCs in Beijing (L. W. Wang et al., 2021). As the photochemical production proceeds during the day, the spatial variability of OVOCs increased and then decreased, similar to that of hydrocarbons. Besides, the haze day temporal and spatial variations of OVOCs were similar to that of hydrocarbons (CV < 0.36), corresponding to the predominant contribution of regional transport to the on-road concentrations of these pollutants.
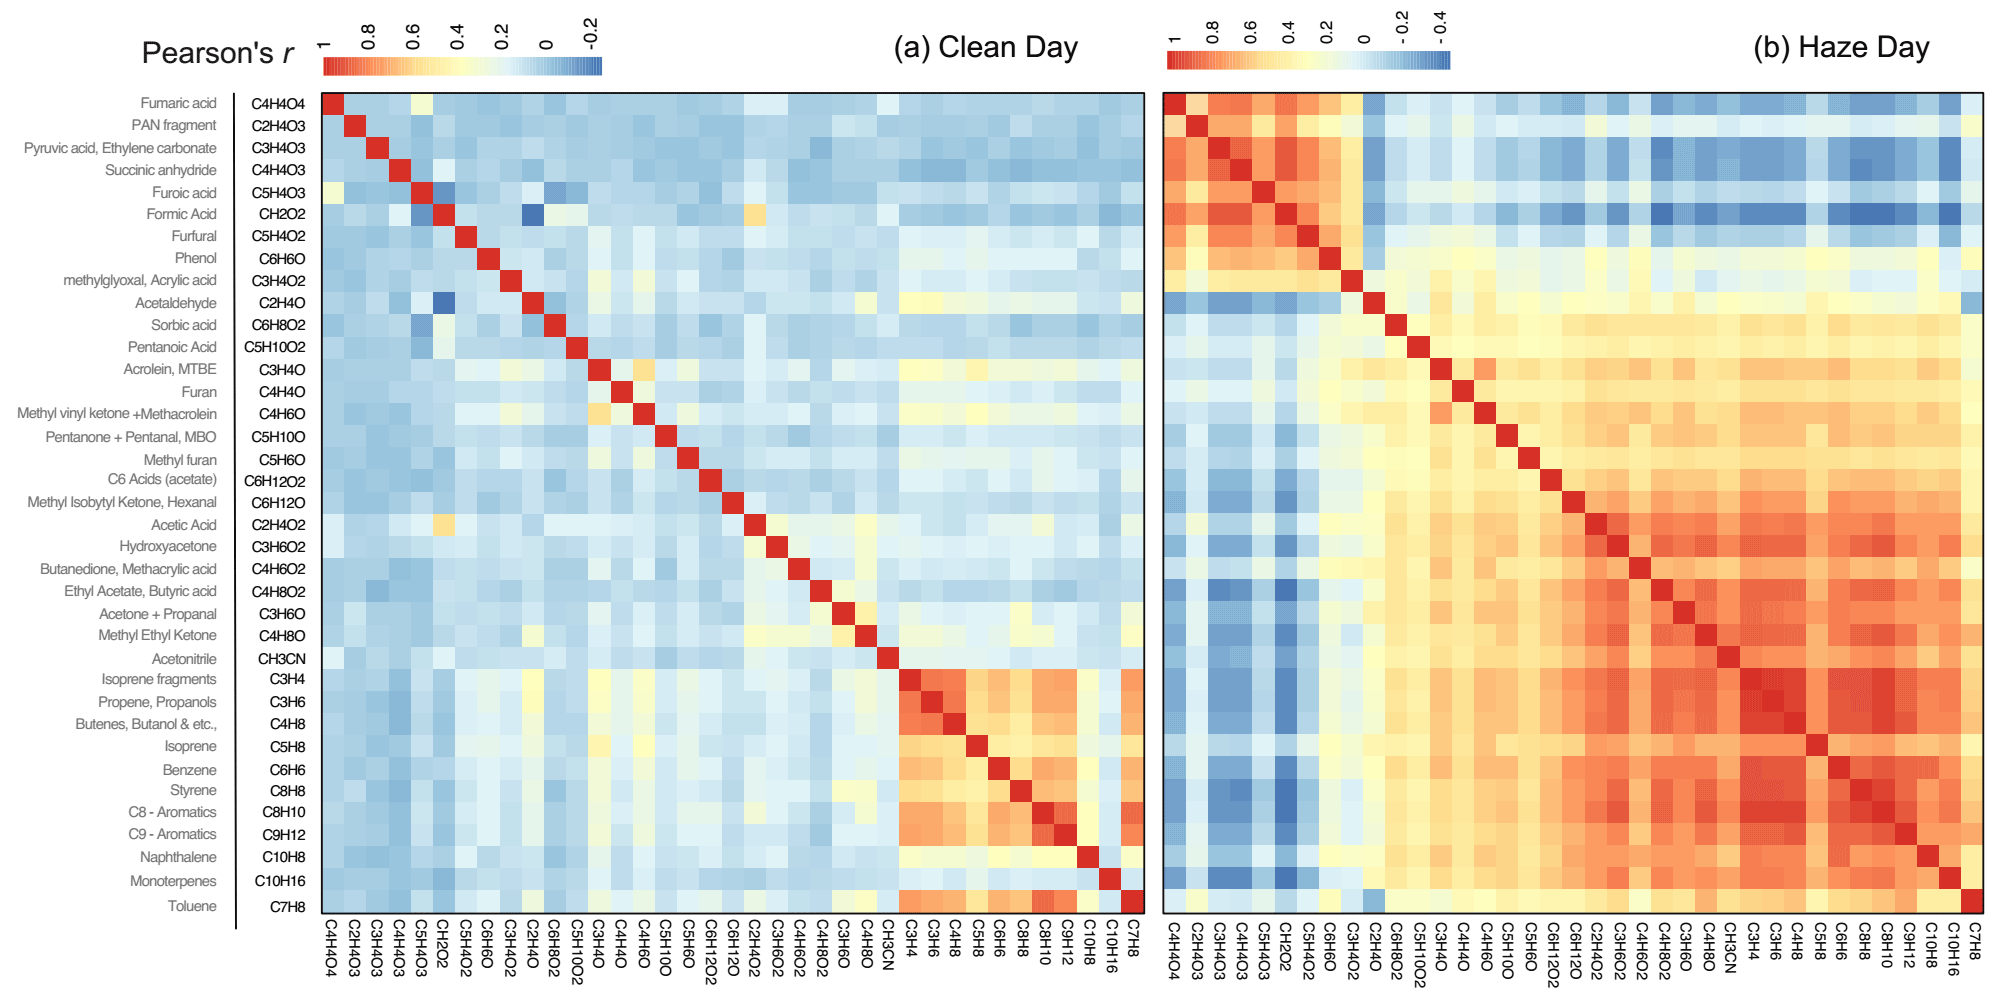
Figure 8Correlation heat maps for the concentrations of the main VOCs and OVOCs measured during (a) the clean day on 18 November 2018 and (b) the haze day on 14 November 2018.
Figure 8 shows the correlation heat maps of the concentrations of VOCs and OVOCs measured during the clean day and the haze day from 09:00 to 16:00 on the 4th Ring Road. Only 2 days were considered in this analysis to avoid inconsistent source profiles. Primary hydrocarbons showed good correlations with each other during the clean day (Fig. 8a), which was consistent with a predominant contribution of traffic emissions to the on-road concentrations. Secondary species, such as OVOCs and PM2.5 were more regional and did not correlate with primary hydrocarbons (Fig. S13 in the Supplement). They did not correlate with each other either, indicating a spatial chemical heterogeneity in OVOC and PM2.5 formation. By contrast, the haze day heat maps show significantly different patterns (Fig. 8b). Primary hydrocarbons correlated well with each other (Pearson ). They also showed good positive correlations with many less oxygenated OVOCs (e.g., aldehydes and ketones with 1–2 oxygen atoms in the formulae (Table S2). These OVOCs may be contributed by both primary and secondary sources, and they can be formed and accumulated along the transport routes. The NR-PM2.5 components also correlated with these VOCs and OVOCs (Fig. S13). Such good spatiotemporal correlations are consistent with the predominant contribution of regional pollution to high concentrations of hydrocarbons, less oxygenated OVOCs, and PM2.5 in Beijing during the haze event. Interestingly, more oxygenated OVOCs (e.g., anhydrides and acids with 2–4 oxygen atoms in the formulae) that were mainly contributed by secondary sources showed good positive correlations with each other () but moderately negative correlations with hydrocarbons and less oxygenated OVOCs as well as the NR-PM2.5 components. These species include CH2O2 (tentatively assigned as formic acid), C2H4O3, C3H4O3, C4H4O4, C4H4O3, C5H4O3, and C5H4O2. The spatiotemporal correlations for these more oxygenated OVOCs suggest similar more oxygenated OVOC composition on the megacity scale during the haze day, which may indicate a homogeneous photochemical production as well as gas-to-particle partitioning. Figure 14 in the Supplement shows similar correlations that were observed in another haze event in January 2021.
High oxidation capacity in winter in the NCP has been reported (Lu et al., 2019a; Slater et al., 2020). Secondary OVOCs can be formed and accumulated along the transport routes. With a relatively uniform distribution of hydroxyl radicals, which likely happens under winter haze conditions because of the thick cloud cover and increased particle scattering, the formation of more oxygenated OVOCs from less oxygenated OVOCs can be relatively homogeneous in the city. Although these more oxygenated OVOCs may partition to the particle phase, the gas-to-particle partitioning was not expected to have much affect on the spatial variability of the more-oxygenated OVOCs because of the similar chemical composition of PM2.5 and the narrow loading range on the intracity scale under haze conditions. The secondary production can thus explain the negative correlations of the more oxygenated OVOCs with their precursors (e.g., hydrocarbon and less oxygenated OVOCs) and PM2.5. Moreover, the gas-particle repartitioning caused by temperature differences may affect the distribution of more oxygenated OVOCs. This effect is, however, expected to be minor considering the range of OA loadings, the vapor pressures of these more oxygenated OVOCs, and the possible temperature elevation of 1–3 ∘C in the city (Chen et al., 2020; Wang et al., 2020; Yang et al., 2013). Peroxyacetyl nitrate (PAN) can be detected as C2H4O3H+ in PTR-QiToF (i.e., C2H4O3 in Fig. 8). Peracetic acid and glycolic acid may also contribute to this ion, although their contributions are plausibly minor in urban environments (Hansel and Wisthaler, 2000; Kaser et al., 2013; Yuan et al., 2017). The PAN is more sensitive to temperature and less stable than the other more oxygenated OVOCs (Seinfeld and Pandis, 2016), which may explain its lower correlation coefficient in Fig. 8b.
In this study, we conducted on-road mobile measurements of air pollutants including NR-PM2.5 and its components, gaseous pollutants, VOCs, and OVOCs under different pollution levels in winter in Beijing. During the non-haze days, large spatial variabilities of these pollutants were observed, which can be largely attributed to the influence of localized sources, chemical reactions, and meteorological conditions. In particular, the inorganic composition of NR-PM2.5 varied greatly, indicating a wide range of particle neutralization on the intracity scale. The spatial variabilities of HOA and COA were driven by vehicle and cooking emissions as well as atmospheric dilution. The spatial patterns of VOCs and OVOCs varied by species. Hydrocarbons (i.e., mostly aromatic species) were greatly affected by vehicle emissions and showed greater PF values than OVOCs. Secondary OVOCs showed the greatest spatial variability, indicating a large heterogeneity in their formation during the non-haze days. The spatial heterogeneity of the particle composition and VOCs may challenge the development of future pollution control strategies and accurate evaluation of human exposures in the megacity. On the other hand, the spatial variability of secondary gaseous and aerosol pollutants contributions were largely reduced during the haze day. More oxygenated OVOCs showed good positive correlation among themselves but moderate negative correlations with hydrocarbons, less oxygenated OVOCs, and aerosol species, suggesting a spatially homogeneous chemical production as well as gas-to-particle partitioning on the megacity scale. Such a chemical homogeneity of OVOC formation may lead to efficient local production of semivolatile oxidation products that enhances SOA production and haze development.
Data presented in this manuscript are available upon request to the corresponding author.
The supplement related to this article is available online at: https://doi.org/10.5194/acp-22-7389-2022-supplement.
QC and KL designed the study and conducted the measurements. KL and RK conducted the data analysis with the help of QC, YL, YZ, XC, TJ, and GH. QC, RK, and KL prepared the manuscript with contributions from all co-authors.
The contact author has declared that neither they nor their co-authors have any competing interests.
Publisher’s note: Copernicus Publications remains neutral with regard to jurisdictional claims in published maps and institutional affiliations.
The authors thank Theodore K. Koenig for helpful discussions.
This research has been supported by the National Natural Science Foundation of China (grant nos. 91544107, 41875165, 41961134034, and 51861135102) and the Higher Education Discipline Innovation Project (grant no. B20009).
This paper was edited by Aijun Ding and reviewed by five anonymous referees.
Apte, J. S., Messier, K. P., Gani, S., Brauer, M., Kirchstetter, T. W., Lunden, M. M., Marshall, J. D., Portier, C. J., Vermeulen, R. C. H., and Hamburg, S. P.: High-resolution air pollution mapping with Google street view cars: Exploiting big data, Environ. Sci. Technol., 51, 6999–7008, https://doi.org/10.1021/acs.est.7b00891, 2017.
Bell, M. L., Peng, R. D., and Dominici, F.: The exposure-response curve for ozone and risk of mortality and the adequacy of current ozone regulations, Environ. Health Perspect., 114, 532–536, https://doi.org/10.1289/ehp.8816, 2006.
Chang, X., Wang, S. X., Zhao, B., Xing, J., Liu, X. X., Wei, L., Song, Y., Wu, W. J., Cai, S. Y., Zheng, H. T., Ding, D., and Zheng, M.: Contributions of inter-city and regional transport to PM2.5 concentrations in the Beijing-Tianjin-Hebei region and its implications on regional joint air pollution control, Sci. Total Environ., 660, 1191–1200, https://doi.org/10.1016/j.scitotenv.2018.12.474, 2019.
Chen, J. H., Wang, W., Liu, H. J., and Ren, L. H.: Determination of road dust loadings and chemical characteristics using resuspension, Environ. Monit. Assess., 184, 1693–1709, https://doi.org/10.1007/s10661-011-2071-1, 2012.
Chen, Y., Cai, J., Wang, Z., Peng, C., Yao, X., Tian, M., Han, Y., Shi, G., Shi, Z., Liu, Y., Yang, X., Zheng, M., Zhu, T., He, K., Zhang, Q., and Yang, F.: Simultaneous measurements of urban and rural particles in Beijing – Part 1: Chemical composition and mixing state, Atmos. Chem. Phys., 20, 9231–9247, https://doi.org/10.5194/acp-20-9231-2020, 2020.
de Gouw, J. A., Middlebrook, A. M., Warneke, C., Goldan, P. D., Kuster, W. C., Roberts, J. M., Fehsenfeld, F. C., Worsnop, D. R., Canagaratna, M. R., Pszenny, A. A. P., Keene, W. C., Marchewka, M., Bertman, S. B., and Bates, T. S.: Budget of organic carbon in a polluted atmosphere: Results from the New England Air Quality Study in 2002, J. Geophys. Res.-Atmos., 110, 22, https://doi.org/10.1029/2004jd005623, 2005.
de Gouw, J. A., Welsh-Bon, D., Warneke, C., Kuster, W. C., Alexander, L., Baker, A. K., Beyersdorf, A. J., Blake, D. R., Canagaratna, M., Celada, A. T., Huey, L. G., Junkermann, W., Onasch, T. B., Salcido, A., Sjostedt, S. J., Sullivan, A. P., Tanner, D. J., Vargas, O., Weber, R. J., Worsnop, D. R., Yu, X. Y., and Zaveri, R.: Emission and chemistry of organic carbon in the gas and aerosol phase at a sub-urban site near Mexico City in March 2006 during the MILAGRO study, Atmos. Chem. Phys., 9, 3425–3442, https://doi.org/10.5194/acp-9-3425-2009, 2009.
Deng, F. Y., Lv, Z. F., Qi, L. J., Wang, X. T., Shi, M. S., and Liu, H.: A big data approach to improving the vehicle emission inventory in China, Nat. Commun., 11, 12, https://doi.org/10.1038/s41467-020-16579-w, 2020.
Duan, J., Huang, R.-J., Li, Y., Chen, Q., Zheng, Y., Chen, Y., Lin, C., Ni, H., Wang, M., Ovadnevaite, J., Ceburnis, D., Chen, C., Worsnop, D. R., Hoffmann, T., O'Dowd, C., and Cao, J.: Summertime and wintertime atmospheric processes of secondary aerosol in Beijing, Atmos. Chem. Phys., 20, 3793–3807, https://doi.org/10.5194/acp-20-3793-2020, 2020.
Elser, M., Bozzetti, C., El-Haddad, I., Maasikmets, M., Teinemaa, E., Richter, R., Wolf, R., Slowik, J. G., Baltensperger, U., and Prévôt, A. S. H.: Urban increments of gaseous and aerosol pollutants and their sources using mobile aerosol mass spectrometry measurements, Atmos. Chem. Phys., 16, 7117–7134, https://doi.org/10.5194/acp-16-7117-2016, 2016.
Ge, B. Z., Wang, Z. F., Lin, W. L., Xu, X. B., Li, J., Ji, D. S., and Ma, Z. Q.: Air pollution over the North China Plain and its implication of regional transport: A new sight from the observed evidences, Environ. Pollut., 234, 29–38, https://doi.org/10.1016/j.envpol.2017.10.084, 2018.
Gentner, D. R., Jathar, S. H., Gordon, T. D., Bahreini, R., Day, D. A., El Haddad, I., Hayes, P. L., Pieber, S. M., Platt, S. M., de Gouw, J., Goldstein, A. H., Harley, R. A., Jimenez, J. L., Prevot, A. S. H., and Robinson, A. L.: Review of urban secondary organic aerosol formation from gasoline and diesel motor vehicle emissions, Environ. Sci. Technol., 51, 1074–1093, https://doi.org/10.1021/acs.est.6b04509, 2017.
Gong, P., Chen, B., Li, X. C., Liu, H., Wang, J., Bai, Y. Q., Chen, J. M., Chen, X., Fang, L., Feng, S. L., Feng, Y. J., Gong, Y. L., Gu, H., Huang, H. B., Huang, X. C., Jiao, H. Z., Kang, Y. D., Lei, G. B., Li, A. N., Li, X. T., Li, X., Li, Y. C., Li, Z. L., Li, Z. D., Liu, C., Liu, C. X., Liu, M. C., Liu, S. G., Mao, W. L., Miao, C. H., Ni, H., Pan, Q. S., Qi, S. H., Ren, Z. H., Shan, Z. R., Shen, S. Q., Shi, M. J., Song, Y. M., Su, M., Suen, H. P., Sun, B., Sun, F. D., Sun, J., Sun, L., Sun, W. Y., Tian, T., Tong, X. H., Tseng, Y. H., Tu, Y., Wang, H., Wang, L., Wang, X., Wang, Z. M., Wu, T. H., Xie, Y. W., Yang, J., Yang, J., Yuan, M., Yue, W. Z., Zeng, H. D., Zhang, K., Zhang, N., Zhang, T., Zhang, Y., Zhao, F., Zheng, Y. C., Zhou, Q. M., Clinton, N., Zhu, Z. L., and Xu, B.: Mapping essential urban land use categories in China (EULUC-China): preliminary results for 2018, Sci. Bull., 65, 182–187, https://doi.org/10.1016/j.scib.2019.12.007, 2020.
Gu, P. S., Li, H., Ye, Q., Robinson, E. S., Apte, J. S., Robinson, A. L., and Presto, A. A.: Intracity variability of particulate matter exposure is driven by carbonaceous sources and correlated with land-use variables, Environ. Sci. Technol., 52, 11545–11554, https://doi.org/10.1021/acs.est.8b03833, 2018.
Guo, H., Ling, Z. H., Cheng, H. R., Simpson, I. J., Lyu, X. P., Wang, X. M., Shao, M., Lu, H. X., Ayoko, G., Zhang, Y. L., Saunders, S. M., Lam, S. H. M., Wang, J. L., and Blake, D. R.: Tropospheric volatile organic compounds in China, Sci. Total Environ., 574, 1021–1043, https://doi.org/10.1016/j.scitotenv.2016.09.116, 2017.
Hansel, A. and Wisthaler, A.: A method for real-time detection of PAN, PPN and MPAN in ambient air, Geophys. Res. Lett., 27, 895–898, https://doi.org/10.1029/1999gl010989, 2000.
Huang, G. C., Liu, Y., Shao, M., Li, Y., Chen, Q., Zheng, Y., Wu, Z. J., Liu, Y. C., Wu, Y. S., Hu, M., Li, X., Lu, S. H., Wang, C. J., Liu, J. Y., Zheng, M., and Zhu, T.: Potentially important contribution of gas-phase oxidation of naphthalene and methylnaphthalene to secondary organic aerosol during haze events in Beijing, Environ. Sci. Technol., 53, 1235–1244, https://doi.org/10.1021/acs.est.8b04523, 2019.
Huang, R. J., Zhang, Y. L., Bozzetti, C., Ho, K. F., Cao, J. J., Han, Y. M., Daellenbach, K. R., Slowik, J. G., Platt, S. M., Canonaco, F., Zotter, P., Wolf, R., Pieber, S. M., Bruns, E. A., Crippa, M., Ciarelli, G., Piazzalunga, A., Schwikowski, M., Abbaszade, G., Schnelle-Kreis, J., Zimmermann, R., An, Z. S., Szidat, S., Baltensperger, U., El Haddad, I., and Prevot, A. S. H.: High secondary aerosol contribution to particulate pollution during haze events in China, Nature, 514, 218–222, https://doi.org/10.1038/nature13774, 2014.
Huangfu, Y., Yuan, B., Wang, S. H., Wu, C. H., He, X. J., Qi, J. P., de Gouw, J., Warneke, C., Gilman, J. B., Wisthaler, A., Karl, T., Graus, M., Jobson, B. T., and Shao, M.: Revisiting acetonitrile as tracer of biomass burning in anthropogenic-influenced environments, Geophys. Res. Lett., 48, 10, https://doi.org/10.1029/2020gl092322, 2021.
Karl, T., Striednig, M., Graus, M., Hammerle, A., and Wohlfahrt, G.: Urban flux measurements reveal a large pool of oxygenated volatile organic compound emissions, Proc. Natl. Acad. Sci. U.S.A., 115, 1186–1191, https://doi.org/10.1073/pnas.1714715115, 2018.
Kaser, L., Karl, T., Schnitzhofer, R., Graus, M., Herdlinger-Blatt, I. S., DiGangi, J. P., Sive, B., Turnipseed, A., Hornbrook, R. S., Zheng, W., Flocke, F. M., Guenther, A., Keutsch, F. N., Apel, E., and Hansel, A.: Comparison of different real time VOC measurement techniques in a ponderosa pine forest, Atmos. Chem. Phys., 13, 2893–2906, https://doi.org/10.5194/acp-13-2893-2013, 2013.
Khuzestani, R. B., Schauer, J. J., Wei, Y. J., Zhang, L. L., Cai, T. Q., Zhang, Y., and Zhang, Y. X.: Quantification of the sources of long-range transport of PM2.5 pollution in the Ordos region, Inner Mongolia, China, Environ. Pollut., 229, 1019–1031, https://doi.org/10.1016/j.envpol.2017.07.093, 2017.
Kolb, C. E., Herndon, S. C., McManus, B., Shorter, J. H., Zahniser, M. S., Nelson, D. D., Jayne, J. T., Canagaratna, M. R., and Worsnop, D. R.: Mobile laboratory with rapid response instruments for real-time measurements of urban and regional trace gas and particulate distributions and emission source characteristics, Environ. Sci. Technol., 38, 5694–5703, https://doi.org/10.1021/es030718p, 2004.
Lei, L., Zhou, W., Chen, C., He, Y., Li, Z. J., Sun, J. X., Tang, X., Fu, P. Q., Wang, Z. F., and Sun, Y. L.: Long-term characterization of aerosol chemistry in cold season from 2013 to 2020 in Beijing, China, Environ. Pollut., 268, 9, https://doi.org/10.1016/j.envpol.2020.115952, 2021.
Li, J., Wu, R. R., Li, Y. Q., Hao, Y. F., Xie, S. D., and Zeng, L. M.: Effects of rigorous emission controls on reducing ambient volatile organic compounds in Beijing, China, Sci. Total Environ., 557, 531–541, https://doi.org/10.1016/j.scitotenv.2016.03.140, 2016.
Li, J., Han, Z. W., Sun, Y. L., Li, J. W., and Liang, L.: Chemical formation pathways of secondary organic aerosols in the Beijing-Tianjin-Hebei region in wintertime, Atmos. Environ., 244, 15, https://doi.org/10.1016/j.atmosenv.2020.117996, 2021.
Li, Y. J., Sun, Y., Zhang, Q., Li, X., Li, M., Zhou, Z., and Chan, C. K.: Real-time chemical characterization of atmospheric particulate matter in China: A review, Atmos. Environ., 158, 270–304, https://doi.org/10.1016/j.atmosenv.2017.02.027, 2017.
Liang, Q., Bao, X., Sun, Q., Zhang, Q., Zou, X., Huang, C., Shen, C., and Chu, Y.: Imaging VOC distribution in cities and tracing VOC emission sources with a novel mobile proton transfer reaction mass spectrometer, Environ. Pollut., 265, 114628, https://doi.org/10.1016/j.envpol.2020.114628, 2020.
Liao, K., Chen, Q., Liu, Y., Li, Y. J., Lambe, A. T., Zhu, T., Huang, R.-J., Zheng, Y., Cheng, X., Miao, R., Huang, G., Khuzestani, R. B., and Jia, T.: Secondary organic aerosol formation of fleet vehicle emissions in China: Potential seasonality of spatial distributions, Environ. Sci. Technol., 7276–7286, https://doi.org/10.1021/acs.est.0c08591, 2021.
Liu, J., Han, Y. Q., Tang, X., Zhu, J., and Zhu, T.: Estimating adult mortality attribuTable to PM2.5 exposure in China with assimilated PM2.5 concentrations based on a ground monitoring network, Sci. Total Environ., 568, 1253–1262, https://doi.org/10.1016/j.scitotenv.2016.05.165, 2016.
Liu, Y. F., Song, M. D., Liu, X. G., Zhang, Y. P., Hui, L. R., Kong, L. W., Zhang, Y. Y., Zhang, C., Qu, Y., An, J. L., Ma, D. P., Tan, Q. W., and Feng, M.: Characterization and sources of volatile organic compounds (VOCs) and their related changes during ozone pollution days in 2016 in Beijing, China, Environ. Pollut., 257, 12, https://doi.org/10.1016/j.envpol.2019.113599, 2020.
Lu, K. D., Fuchs, H., Hofzumahaus, A., Tan, Z. F., Wang, H. C., Zhang, L., Schmitt, S. H., Rohrer, F., Bohn, B., Broch, S., Dong, H. B., Gkatzelis, G. I., Hohaus, T., Holland, F., Li, X., Liu, Y., Liu, Y. H., Ma, X. F., Novelli, A., Schlag, P., Shao, M., Wu, Y. S., Wu, Z. J., Zeng, L. M., Hu, M., Kiendler-Scharr, A., Wahner, A., and Zhang, Y. H.: Fast photochemistry in wintertime haze: Consequences for pollution mitigation strategies, Environ. Sci. Technol., 53, 10676–10684, https://doi.org/10.1021/acs.est.9b02422, 2019a.
Lu, K. D., Guo, S., Tan, Z. F., Wang, H. C., Shang, D. J., Liu, Y. H., Li, X., Wu, Z. J., Hu, M., and Zhang, Y. H.: Exploring atmospheric free-radical chemistry in China: the self-cleansing capacity and the formation of secondary air pollution, Natl. Sci. Rev., 6, 579–594, https://doi.org/10.1093/nsr/nwy073, 2019b.
Lv, Z. F., Wang, X. T., Deng, F. Y., Ying, Q., Archibald, A. T., Jones, R. L., Ding, Y., Cheng, Y., Fu, M. L., Liu, Y., Man, H. Y., Xue, Z. G., He, K. B., Hao, J. M., and Liu, H. A.: Source-receptor relationship revealed by the halted traffic and aggravated haze in Beijing during the COVID-19 lockdown, Environ. Sci. Technol., 54, 15660–15670, https://doi.org/10.1021/acs.est.0c04941, 2020.
Mellouki, A., Wallington, T. J., and Chen, J.: Atmospheric chemistry of oxygenated volatile organic compounds: Impacts on air quality and climate, Chem. Rev., 115, 3984–4014, https://doi.org/10.1021/cr500549n, 2015.
Miao, R., Chen, Q., Shrivastava, M., Chen, Y., Zhang, L., Hu, J., Zheng, Y., and Liao, K.: Process-based and observation-constrained SOA simulations in China: the role of semivolatile and intermediate-volatility organic compounds and OH levels, Atmos. Chem. Phys., 21, 16183–16201, https://doi.org/10.5194/acp-21-16183-2021, 2021.
Mo, Z. W., Shao, M., and Lu, S. H.: Compilation of a source profile database for hydrocarbon and OVOC emissions in China, Atmos. Environ., 143, 209–217, https://doi.org/10.1016/j.atmosenv.2016.08.025, 2016.
Mo, Z. W., Huang, S., Yuan, B., Pei, C. L., Song, Q. C., Qi, J. P., Wang, M., Wang, B. L., Wang, C., Li, M., Zhang, Q., and Shao, M.: Deriving emission fluxes of volatile organic compounds from tower observation in the Pearl River Delta, China, Sci. Total Environ., 741, 9, https://doi.org/10.1016/j.scitotenv.2020.139763, 2020.
Mohr, C., Richter, R., DeCarlo, P. F., Prévôt, A. S. H., and Baltensperger, U.: Spatial variation of chemical composition and sources of submicron aerosol in Zurich during wintertime using mobile aerosol mass spectrometer data, Atmos. Chem. Phys., 11, 7465–7482, https://doi.org/10.5194/acp-11-7465-2011, 2011.
Mozaffar, A. and Zhang, Y. L.: Atmospheric volatile organic compounds (VOCs) in China: a Review, Curr. Pollut. Rep., 6, 250–263, https://doi.org/10.1007/s40726-020-00149-1, 2020.
Nenes, A., Pandis, S. N., Weber, R. J., and Russell, A.: Aerosol pH and liquid water content determine when particulate matter is sensitive to ammonia and nitrate availability, Atmos. Chem. Phys., 20, 3249–3258, https://doi.org/10.5194/acp-20-3249-2020, 2020.
Pan, Y. P., Tian, S. L., Liu, D. W., Fang, Y. T., Zhu, X. Y., Gao, M., Wentworth, G. R., Michalski, G., Huang, X. J., and Wang, Y. S.: Source apportionment of aerosol ammonium in an ammonia-rich atmosphere: An isotopic study of summer clean and hazy days in urban Beijing, J. Geophys. Res.-Atmos., 123, 5681–5689, https://doi.org/10.1029/2017jd028095, 2018.
Peng, J. F., Hu, M., Shang, D. J., Wu, Z. J., Du, Z. F., Tan, T. Y., Wang, Y. N., Zhang, F., and Zhang, R. Y.: Explosive secondary aerosol formation during severe haze in the North China Plain, Environ. Sci. Technol., 55, 2189–2207, https://doi.org/10.1021/acs.est.0c07204, 2021.
Qi, J., Zheng, B., Li, M., Yu, F., Chen, C. C., Liu, F., Zhou, X. F., Yuan, J., Zhang, Q., and He, K. B.: A high-resolution air pollutants emission inventory in 2013 for the Beijing-Tianjin-Hebei region, China, Atmos. Environ., 170, 156–168, https://doi.org/10.1016/j.atmosenv.2017.09.039, 2017.
Quan, J. N. and Jia, X. C.: Review of aircraft measurements over China: aerosol, atmospheric photochemistry, and cloud, Atmos. Res., 243, 14, https://doi.org/10.1016/j.atmosres.2020.104972, 2020.
Seinfeld, J. H. and Pandis, S. N.: Atmospheric chemistry and physics: From air pollution to climate change, 3 edn., John Wiley & Sons, Inc., Hoboken, New Jersey, 1152 pp., ISBN 978-1-118-94740-1, 2016.
Shi, Y., Xi, Z., Simayi, M., Li, J., and Xie, S.: Scattered coal is the largest source of ambient volatile organic compounds during the heating season in Beijing, Atmos. Chem. Phys., 20, 9351–9369, https://doi.org/10.5194/acp-20-9351-2020, 2020.
Slater, E. J., Whalley, L. K., Woodward-Massey, R., Ye, C., Lee, J. D., Squires, F., Hopkins, J. R., Dunmore, R. E., Shaw, M., Hamilton, J. F., Lewis, A. C., Crilley, L. R., Kramer, L., Bloss, W., Vu, T., Sun, Y., Xu, W., Yue, S., Ren, L., Acton, W. J. F., Hewitt, C. N., Wang, X., Fu, P., and Heard, D. E.: Elevated levels of OH observed in haze events during wintertime in central Beijing, Atmos. Chem. Phys., 20, 14847–14871, https://doi.org/10.5194/acp-20-14847-2020, 2020.
Song, M., Li, X., Yang, S., Yu, X., Zhou, S., Yang, Y., Chen, S., Dong, H., Liao, K., Chen, Q., Lu, K., Zhang, N., Cao, J., Zeng, L., and Zhang, Y.: Spatiotemporal variation, sources, and secondary transformation potential of volatile organic compounds in Xi'an, China, Atmos. Chem. Phys., 21, 4939–4958, https://doi.org/10.5194/acp-21-4939-2021, 2021.
Stein, A. F., Draxler, R. R., Rolph, G. D., Stunder, B. J. B., Cohen, M. D., and Ngan, F.: NOAA'S hysplit atmospheric transport and dispersion modeling system, B. Am. Meteorol. Soc., 96, 2059–2077, https://doi.org/10.1175/bams-d-14-00110.1, 2015.
Sun, J., Wang, Y. S., Wu, F. K., Tang, G. Q., Wang, L. L., Wang, Y. H., and Yang, Y.: Vertical characteristics of VOCs in the lower troposphere over the North China Plain during pollution periods, Environ. Pollut., 236, 907–915, https://doi.org/10.1016/j.envpol.2017.10.051, 2018.
Sun, K., Tao, L., Miller, D. J., Pan, D., Golston, L. M., Zondlo, M. A., Griffin, R. J., Wallace, H. W., Leong, Y. J., Yang, M. M., Zhang, Y., Mauzerall, D. L., and Zhu, T.: Vehicle emissions as an important urban ammonia source in the United States and China, Environ. Sci. Technol., 51, 2472–2481, https://doi.org/10.1021/acs.est.6b02805, 2017.
Sun, Y. L., Jiang, Q., Wang, Z. F., Fu, P. Q., Li, J., Yang, T., and Yin, Y.: Investigation of the sources and evolution processes of severe haze pollution in Beijing in January 2013, J. Geophys. Res.-Atmos., 119, 4380–4398, https://doi.org/10.1002/2014jd021641, 2014.
Sun, Y. L., Wang, Z. F., Du, W., Zhang, Q., Wang, Q. Q., Fu, P. Q., Pan, X. L., Li, J., Jayne, J., and Worsnop, D. R.: Long-term real-time measurements of aerosol particle composition in Beijing, China: seasonal variations, meteorological effects, and source analysis, Atmos. Chem. Phys., 15, 10149–10165, https://doi.org/10.5194/acp-15-10149-2015, 2015.
Sun, Y. L., Chen, C., Zhang, Y. J., Xu, W. Q., Zhou, L. B., Cheng, X. L., Zheng, H. T., Ji, D. S., Li, J., Tang, X., Fu, P. Q., and Wang, Z. F.: Rapid formation and evolution of an extreme haze episode in Northern China during winter 2015, Sci. Rep., 6, 9, https://doi.org/10.1038/srep27151, 2016.
Sun, Y. L., He, Y., Kuang, Y., Xu, W. Y., Song, S. J., Ma, N., Tao, J. C., Cheng, P., Wu, C., Su, H., Cheng, Y. F., Xie, C. H., Chen, C., Lei, L., Qiu, Y. M., Fu, P. Q., Croteau, P., and Worsnop, D. R.: Chemical differences between PM1 and PM2.5 in highly polluted environment and implications in air pollution studies, Geophys. Res. Lett., 47, 10, https://doi.org/10.1029/2019gl086288, 2020.
Tan, Y., Lipsky, E. M., Saleh, R., Robinson, A. L., and Presto, A. A.: Characterizing the spatial variation of air pollutants and the contributions of high emitting vehicles in Pittsburgh, PA, Environ. Sci. Technol., 48, 14186–14194, https://doi.org/10.1021/es5034074, 2014.
Wang, L. W., Slowik, J. G., Tong, Y. D., Duan, J., Gu, Y. F., Rai, P., Qi, L., Stefenelli, G., Baltensperger, U., Huang, R. J., Cao, J. J., and Prevot, A. S. H.: Characteristics of wintertime VOCs in urban Beijing: Composition and source apportionment, Atmos. Environ.-X, 9, 12, https://doi.org/10.1016/j.aeaoa.2020.100100, 2021.
Wang, M., Zhu, T., Zheng, J., Zhang, R. Y., Zhang, S. Q., Xie, X. X., Han, Y. Q., and Li, Y.: Use of a mobile laboratory to evaluate changes in on-road air pollutants during the Beijing 2008 Summer Olympics, Atmos. Chem. Phys., 9, 8247–8263, https://doi.org/10.5194/acp-9-8247-2009, 2009.
Wang, M., Zhu, T., Zhang, J. P., Zhang, Q. H., Lin, W. W., Li, Y., and Wang, Z. F.: Using a mobile laboratory to characterize the distribution and transport of sulfur dioxide in and around Beijing, Atmos. Chem. Phys., 11, 11631–11645, https://doi.org/10.5194/acp-11-11631-2011, 2011.
Wang, Q., Zhang, C., Ren, C., Hang, J., and Li, Y. G.: Urban heat island circulations over the Beijing-Tianjin region under calm and fair conditions, Build. Environ., 180, 1–12, https://doi.org/10.1016/j.buildenv.2020.107063, 2020.
Wang, T., Xue, L. K., Brimblecombe, P., Lam, Y. F., Li, L., and Zhang, L.: Ozone pollution in China: A review of concentrations, meteorological influences, chemical precursors, and effects, Sci. Total Environ., 575, 1582–1596, https://doi.org/10.1016/j.scitotenv.2016.10.081, 2017.
Wang, W. G., Liu, M. Y., Wang, T. T., Song, Y., Zhou, L., Cao, J. J., Hu, J. N., Tang, G. G., Chen, Z., Li, Z. J., Xu, Z. Y., Peng, C., Lian, C. F., Chen, Y., Pan, Y. P., Zhang, Y. H., Sun, Y. L., Li, W. J., Zhu, T., Tian, H. Z., and Ge, M. F.: Sulfate formation is dominated by manganese-catalyzed oxidation of SO2 on aerosol surfaces during haze events, Nat. Commun., 12, 10, https://doi.org/10.1038/s41467-021-22091-6, 2021.
Wang, X., Cai, Y. J., Wang, J. J., and Zhao, Y. F.: Concentration monitoring of volatile organic compounds and ozone in Xi'an based on PTR-TOF-MS and differential absorption lidar, Atmos. Environ., 245, 12, https://doi.org/10.1016/j.atmosenv.2020.118045, 2021.
Wang, Y. H., Hu, B., Ji, D. S., Liu, Z. R., Tang, G. Q., Xin, J. Y., Zhang, H. X., Song, T., Wang, L. L., Gao, W. K., Wang, X. K., and Wang, Y. S.: Ozone weekend effects in the Beijing–Tianjin–Hebei metropolitan area, China, Atmos. Chem. Phys., 14, 2419–2429, https://doi.org/10.5194/acp-14-2419-2014, 2014.
Wu, F., Xie, P., Li, A., Mou, F., Chen, H., Zhu, Y., Zhu, T., Liu, J., and Liu, W.: Investigations of temporal and spatial distribution of precursors SO2 and NO2 vertical columns in the North China Plain using mobile DOAS, Atmos. Chem. Phys., 18, 1535–1554, https://doi.org/10.5194/acp-18-1535-2018, 2018.
Wu, J., Bei, N., Wang, Y., Li, X., Liu, S., Liu, L., Wang, R., Yu, J., Le, T., Zuo, M., Shen, Z., Cao, J., Tie, X., and Li, G.: Insights into particulate matter pollution in the North China Plain during wintertime: local contribution or regional transport?, Atmos. Chem. Phys., 21, 2229–2249, https://doi.org/10.5194/acp-21-2229-2021, 2021.
Wu, Y., Zhang, S. J., Hao, J. M., Liu, H., Wu, X. M., Hu, J. N., Walsh, M. P., Wallington, T. J., Zhang, K. M., and Stevanovic, S.: On-road vehicle emissions and their control in China: A review and outlook, Sci. Total Environ., 574, 332–349, https://doi.org/10.1016/j.scitotenv.2016.09.040, 2017.
Yang, B., Zhang, K. M., Xu, W. D., Zhang, S. J., Batterman, S., Baldauf, R. W., Deshmukh, P., Snow, R., Wu, Y., Zhang, Q., Li, Z. H., and Wu, X.: On-road chemical transformation as an important mechanism of NO2 formation, Environ. Sci. Technol., 52, 4574–4582, https://doi.org/10.1021/acs.est.7b05648, 2018.
Yang, P., Ren, G. Y., and Liu, W. D.: Spatial and temporal characteristics of Beijing urban heat island intensity, J. Appl. Meteorol. Climatol., 52, 1803–1816, https://doi.org/10.1175/jamc-d-12-0125.1, 2013.
Yang, W. Y., Li, J., Wang, W. G., Li, J. L., Ge, M. F., Sun, Y. L., Chen, X. S., Ge, B. Z., Tong, S. R., Wang, Q. Q., and Wang, Z. F.: Investigating secondary organic aerosol formation pathways in China during 2014, Atmos. Environ., 213, 133–147, https://doi.org/10.1016/j.atmosenv.2019.05.057, 2019.
Ye, Q., Gu, P., Li, H. Z., Robinson, E. S., Lipsky, E., Kaltsonoudis, C., Lee, A. K. Y., Apte, J. S., Robinson, A. L., Sullivan, R. C., Presto, A. A., and Donahue, N. M.: Spatial variability of sources and mixing state of atmospheric particles in a metropolitan area, Environ. Sci. Technol., 52, 6807–6815, https://doi.org/10.1021/acs.est.8b01011, 2018.
Yuan, B., Koss, A. R., Warneke, C., Coggon, M., Sekimoto, K., and de Gouw, J. A.: Proton-transfer-reaction mass spectrometry: Applications in atmospheric sciences, Chem. Rev., 117, 13187–13229, https://doi.org/10.1021/acs.chemrev.7b00325, 2017.
Zhang, Q., Zheng, Y. X., Tong, D., Shao, M., Wang, S. X., Zhang, Y. H., Xu, X. D., Wang, J. N., He, H., Liu, W. Q., Ding, Y. H., Lei, Y., Li, J. H., Wang, Z. F., Zhang, X. Y., Wang, Y. S., Cheng, J., Liu, Y., Shi, Q. R., Yan, L., Geng, G. N., Hong, C. P., Li, M., Liu, F., Zheng, B., Cao, J. J., Ding, A. J., Gao, J., Fu, Q. Y., Huo, J. T., Liu, B. X., Liu, Z. R., Yang, F. M., He, K. B., and Hao, J. M.: Drivers of improved PM2.5 air quality in China from 2013 to 2017, Proc. Natl. Acad. Sci. U. S. A., 116, 24463–24469, https://doi.org/10.1073/pnas.1907956116, 2019.
Zheng, B., Tong, D., Li, M., Liu, F., Hong, C., Geng, G., Li, H., Li, X., Peng, L., Qi, J., Yan, L., Zhang, Y., Zhao, H., Zheng, Y., He, K., and Zhang, Q.: Trends in China's anthropogenic emissions since 2010 as the consequence of clean air actions, Atmos. Chem. Phys., 18, 14095–14111, https://doi.org/10.5194/acp-18-14095-2018, 2018.
Zheng, Y., Cheng, X., Liao, K., Li, Y., Li, Y. J., Huang, R.-J., Hu, W., Liu, Y., Zhu, T., Chen, S., Zeng, L., Worsnop, D. R., and Chen, Q.: Characterization of anthropogenic organic aerosols by TOF-ACSM with the new capture vaporizer, Atmos. Meas. Tech., 13, 2457–2472, https://doi.org/10.5194/amt-13-2457-2020, 2020.
Zheng, Y., Chen, Q., Cheng, X., Mohr, C., Cai, J., Huang, W., Shrivastava, M., Ye, P., Fu, P., Shi, X., Ge, Y., Liao, K., Miao, R., Qiu, X., Koenig, T. K., and Chen, S.: Precursors and pathways leading to enhanced secondary organic aerosol formation during severe haze episodes, Environ. Sci. Technol., 55, 15680–15693, https://doi.org/10.1021/acs.est.1c04255, 2021.
Zhou, W., Sun, Y. L., Xu, W. Q., Zhao, X. J., Wang, Q. Q., Tang, G. Q., Zhou, L. B., Chen, C., Du, W., Zhao, J., Xie, C. H., Fu, P. Q., and Wang, Z. F.: Vertical characterization of aerosol particle composition in Beijing, China: Insights from 3-month measurements with two aerosol mass spectrometers, J. Geophys. Res.-Atmos., 123, 13016–13029, https://doi.org/10.1029/2018jd029337, 2018.
Zhu, Y., Zhang, J., Wang, J., Chen, W., Han, Y., Ye, C., Li, Y., Liu, J., Zeng, L., Wu, Y., Wang, X., Wang, W., Chen, J., and Zhu, T.: Distribution and sources of air pollutants in the North China Plain based on on-road mobile measurements, Atmos. Chem. Phys., 16, 12551–12565, https://doi.org/10.5194/acp-16-12551-2016, 2016.