the Creative Commons Attribution 4.0 License.
the Creative Commons Attribution 4.0 License.
 | 08 Jun 2022
The impacts of marine-emitted halogens on OH radicals in East Asia during summer
Shidong Fan
Relationships between oceanic emissions and air chemistry are intricate and still not fully understood. For regional air chemistry, a better understanding of marine halogen emission on the hydroxyl (OH) radical is crucial. The OH radical is a key species in atmospheric chemistry because it can oxidize almost all trace species in the atmosphere. In the marine atmosphere, OH levels could be significantly affected by the halogen species emitted from the ocean. However, due to the complicated interactions of halogens with OH through different pathways, it is not well understood how halogens influence OH and even what the sign of the net effect is. Therefore, in this study, we aim to quantify the impact of marine-emitted halogens (including Cl, Br, and I) through different pathways on OH in the high OH season by using the WRF-CMAQ model with process analysis and state-of-the-art halogen chemistry in East Asia and near the western Pacific. Results show a very complicated response of the OH production rate (POH) to marine halogen emissions. The monthly POH is generally decreased over the ocean by up to a maximum of about 10 %–15 % in the Philippine Sea, but it is increased in many nearshore areas by up to about 7 %–9 % in the Bohai Sea. In the coastal areas of southern China, the monthly POH could also decrease 3 %–5 %, but hourly values can decrease over 30 % in the daytime. Analysis of the individual reactions using the integrated reaction rate shows that the net change in POH is controlled by the competition of three main pathways (OH from O3 photolysis, OH from HO2 conversion, and OH from HOX, X=Cl, Br, I) through different halogen species. Sea spray aerosol (SSA) and inorganic iodine gases are the major species influencing the strengths of these three pathways and therefore have the most significant impacts on POH. Both of these two types of species decrease POH through physical processes, while generally increasing POH through chemical processes. In the ocean atmosphere, inorganic iodine gases determine the basic pattern of ΔPOH through complicated iodine chemistry, which generally positively influences POH near O3 sources while negatively influencing it when O3 experiences longer transport over the ocean. Over the continent, SSA is the controlling species, and the SSA extinction effect leads to the negative ΔPOH in southern China. Our results show that marine-emitted halogen species have notable impacts over the ocean and potential impacts on coastal atmospheric oxidation by species (SSA, inorganic iodine, and halocarbons), processes (chemistry, radiation, and deposition), and main pathways. The notable impacts of the marine-emitted halogen species on the atmospheric oxidation capacity have further implications for the lifetime of long-lived species such as CH4 in the long term and the quantity of air pollutants such as O3 in the episodic events in East Asia and in other circumstances (e.g., different domains, regions, and emission rates).
- Article
(13349 KB) - Full-text XML
-
Supplement
(7486 KB) - BibTeX
- EndNote


The hydroxyl radical is the most important daytime oxidant in the troposphere. It can oxidize almost all directly emitted gases such as CO, CH4, and other volatile organic compounds (VOCs), while producing some secondary species such as O3 and secondary aerosols at the same time. The primary source of OH in the troposphere is O3 through the reaction of water vapor with O(1D), which is produced from the photolysis of O3. In urban areas, the photolysis of nitrous acid (HONO) is also a significant source of OH and may be more important than the photolysis of O3, especially in spring, autumn, and winter because of the very large seasonal variations of O3 photolysis and humidity (e.g., Tan et al., 2019; Whalley et al., 2021; Liu et al., 2019). When there is abundant NO, as is typical in the polluted continental atmosphere, peroxy radicals (RO2 and HO2) will be formed by the oxidation of hydrocarbons by OH and will form OH again in the reaction with NO. This HOx (= OH + HO2) cycling maintains a high OH concentration that cannot be achieved by primary sources alone. The main sinks of OH are CO and VOCs. Due to the complexity of the HOx chemistry, the sources and sinks of OH are not fully understood. For example, recent studies showed that when the NOx concentration is very low (e.g., NO concentration less than several hundred parts per trillion by volume) there may be missing sources of OH (Tan et al., 2019; Rohrer et al., 2014; Lelieveld et al., 2008; Hofzumahaus et al., 2009; Lu et al., 2019a; Fuchs et al., 2013; Stone et al., 2012; Fittschen et al., 2019; Whalley et al., 2021). In addition, HOx chemistry can interact with other oxidizers in the atmosphere in specific circumstances.
In the marine atmosphere, the abundant marine-emitted halogen species have significant impacts on OH. Marine-emitted halogen could make the tropospheric HOx–NOx–O3–VOC chemistry more complex. One relevant reaction is that XO (X=Cl, Br, and I) shifts the HOx balance towards OH (Saiz-Lopez and von Glasow, 2012). As a consequence, previous box-model studies usually showed positive impacts of halogen chemistry on OH (Stone et al., 2018; Whalley et al., 2010). However, there is an opposite impact of halogens on OH, as usually shown by chemical transport model (CTM) studies that halogen species will consume O3, which in turn would reduce the production of OH (e.g., Sherwen et al., 2016; Stone et al., 2018). For example, Wang et al. (2021) showed that the net effect of halogen chemistry on global tropospheric HOx is that both OH and HO2 are reduced by 3 %–4 %. In a box model, when long-lived species such as O3 are observation-constrained, it cannot reflect the complete influence of halogens, which probably explains the different results between box models and CTMs (Stone et al., 2018). Therefore, special attention needs to be paid when using box models to quantify the complicated impacts of halogen species on the HOx–NOx–O3–VOC chemistry.
To present the global impact quantitatively, a more comprehensive understanding of the changes by species (sea spray aerosol – SSA, inorganic iodine, and halocarbons) and their associated processes (chemistry, radiation, and deposition) is needed in order to better explain relevant observed or modeled phenomena and their driving factors. However, the pathways and processes by which halogens influence OH have not been well quantified in previous studies. Recent studies in understanding the impacts of halogen chemistry on OH usually focused on the two pre-described pathways (i.e., enhanced HO2 conversion by XO and O3 consumption by X atoms). Even though we know all the important pathways, due to their opposite impacts on OH, we need to further understand the controlling processes of these pathways in order to better explain the trend of halogen-induced ΔOH in a specific circumstance. Moreover, since current estimations of marine halogen emissions, including SSA Cl and Br ions (and their activations), inorganic iodine (I2 and HOI), and very short-lived halocarbons, have large uncertainties (Carpenter et al., 2021; Ordóñez et al., 2012; Ziska et al., 2013; Inamdar et al., 2020; Lennartz et al., 2015; Zhu et al., 2019; Sekiya et al., 2020; Wang et al., 2021; Grythe et al., 2014), the net effect of different pathways may be subject to the uncertainties in the emission estimation and variation in controlling factors of the various pathways. Therefore, in order to better understand the role of halogen chemistry in tropospheric OH, we explore the pathways by which halogen species influence OH, how these pathways interact with each other, and how they are influenced by different species-related processes in this study based on current knowledge about halogen chemistry and marine emissions of halogen species. We carried out model simulations to quantify the contributions of different pathways by using a regional CTM (Community Multiscale Air Quality Modeling System, CMAQ) with process analysis (PA, including integrated process rate, IPR, and integrated reaction rate, IRR) over East Asia and the western Pacific during summer. The controlling factors of the strengths of the different pathways, mainly represented by different species-related processes, are analyzed based on PA and relevant sensitivity simulations, and their interactions are discussed. With spatial resolution higher than global models, we also explore the interaction of anthropogenic emissions with marine halogen emissions when discussing the controlling factors of the strengths of the different pathways in iodine chemistry. The emission uncertainties are taken into consideration by running sensitivity simulations using the largest or the smallest emission rates that have been used or reported in previous studies. The setup of the models and the estimations of marine emission and its extreme uncertainties of halogen species are described in Sect. 2. Results and discussion are in Sect. 3. Section 4 gives conclusions.
2.1 Model setup
We use the CMAQ model, driven by meteorological fields from the Weather Research and Forecasting Model (WRF), to explore the impact of halogens on OH. For WRF (version 3.9.1), the domain has a horizontal resolution of 27 km and the number of grids is 283 × 184. The vertical coordinates contain 39σ levels up to 50 hPa. The initial and boundary conditions are generated from the NCEP GDAS/FNL 0.25∘ analysis data. Analysis and observation nudging are applied. The data used for observation nudging are obtained from NCEP datasets ds461.0 (for the surface) and ds361.1 (for the upper layer). For major physical parameterizations, the Rapid Radiative Transfer Model (RRTM) longwave radiation scheme, the Dudhia shortwave radiation scheme, the WRF single-moment three-class microphysics scheme, the Noah Land Surface Model, and the Grell–Freitas ensemble cumulus scheme are applied.
CMAQ (version 5.3.2) (Appel et al., 2021) has the same horizontal resolution as WRF, but with a slightly smaller domain. The vertical layers are the lowest 20 layers plus 6 of the remaining 19 layers of WRF. The chemical mechanism adopted here is CB6r3m released in CMAQv5.3, which is updated by adding halogen chemistry to CB6r3 mechanism based on the work of Sarwar and co-workers (Sarwar et al., 2012, 2014, 2015, 2019). Details of the gaseous reactions and heterogeneous reactions can be found in the recent work of Sarwar et al. (2019) and Sarwar et al. (2012) (see also Table S1). A Rosenbrock (ROS3) solver is used to solve the chemical reactions, and the absolute and relative error tolerances are set to 10−9 ppm and 10−3, respectively. The initial and boundary conditions for CMAQ are extracted from a seasonal average hemispheric CMAQ output file that is obtained from the CMAS data warehouse (https://github.com/USEPA/CMAQ/blob/master/DOCS/Users_Guide/Tutorials/CMAQ_UG_tutorial_HCMAQ_IC_BC.md, last access: 6 October 2021). This hemispheric CMAQ used the same chemical mechanism as ours. The anthropogenic emissions are from MEIC (http://www.meicmodel.org/, last access: 5 May 2022), while the emissions in the Guangdong province are replaced by local emissions that are based on a local emission inventory (Yin et al., 2015; Zheng et al., 2009) and processed by the Sparse Matrix Operator Kernel Emissions (SMOKE) processor. No halogen species are contained in the anthropogenic emissions. The terrestrial biogenic emissions are processed by MEGAN2.1 (Guenther et al., 2012). Other routine configuration setups of the model can be found in Fan et al. (2021). Because the OH concentration is highest in summer, the simulations of this study are for the month of July 2019, including an additional 10 d in June for spin-up following Li et al. (2020).
2.2 Marine emissions of halogen species
There are three main types of halogen species emitted from the ocean: SSA (Cl and Br), inorganic iodine (I2 and HOI), and halocarbons including CHBr3, CH2Br2, CH2BrCl, CHBr2Cl, CHBrCl2, CH3I, CH2ICl, CH2IBr, and CH2I2 (e.g., Sarwar et al., 2019; Carpenter et al., 2013; Ordóñez et al., 2012; Wang et al., 2019). The latest release version of CMAQ (v5.3) contains these emissions online.
The SSA emission in the current CMAQ is updated by Gantt et al. (2015) on top of the work of Kelly et al. (2010). The source function is based on the widely used source function developed by Gong (2003), which is an update of Monahan et al. (1986). Two main changes were implemented by Gantt et al. (2015). One is to add a sea surface temperature (SST) correction function to the source function because SST has large impacts on SSA flux (e.g., Barthel et al., 2019; Liu et al., 2021). The other is to change the shape factor of the source function (which determines the shape of the flux distribution) to emit more submicron SSA (see Fig. S1 of Gantt et al., 2015). The SST correction function is based on the work of Ovadnevaite et al. (2014) and is linear. This is different from another widely used observation-based SST correction function developed by Jaeglé et al. (2011), which is a three-order function of SST, but at high temperature (∼ 30 ∘C) their values are close (see Eq. 2 of Gantt et al., 2015, and Eq. 4 of Jaeglé et al., 2011). In addition to these two main changes, surf-enhanced emissions are also reduced by narrowing the surf zone, which was previously defined as 50 m to the coast and is now reduced to 25 m as in the study of Gantt et al. (2015).
Inorganic iodine and halocarbons, as well as Br in SSA, are implemented as by Sarwar and co-workers (Sarwar et al., 2019). Inorganic iodine emissions are based on the work of Carpenter et al. (2013), which parameterized the emission of I2 and HOI as functions of O3 concentration, aqueous iodine concentration, and surface wind speed (see Eqs. 19 and 20 in the SI of Carpenter et al., 2013). Halocarbon emissions are calculated based on the work of Ordóñez et al. (2012), which directly related flux of halocarbons to chlorophyll a (chl a) concentration.
Current estimations of marine halogen emissions have large uncertainties. There are many different source functions of SSA, and the difference of the SSA flux calculated based on these source functions is very large (Grythe et al., 2014). The parameterizations of aqueous iodine also have different versions and differ largely (MacDonald et al., 2014; Sherwen et al., 2019; Chance et al., 2014). The halocarbon emissions are entirely empirical and have few physical bases. Therefore, it is necessary to consider the influence of the uncertainty in the emissions in final results. We design two simulation groups with different emission rates, one high and one low. The high and low emission rates are taken from previously used estimations, similar to the work of Sekiya et al. (2020). The low emission rate of SSA is calculated using the source function in Gong (2003) directly, while the high emission rate uses the source function modified by Gantt et al. (2015) because adding an SST correction function is somewhat more important than using different source functions (Barthel et al., 2019), and the source function of Gong (2003) (or its modifications) is the most widely used one. The parameterizations of I2 and HOI emissions are less variable and only that by Carpenter et al. (2013) is widely used. However, there are two widely used parameterizations of aqueous iodine with large differences. Therefore, the low emission rate of I2 and HOI is calculated using a low concentration of aqueous iodine, taken from MacDonald et al. (2014), while the high emission rate uses a high concentration, taken from Chance et al. (2014). The calculation of halocarbon emissions, which is based on the estimation of Ordóñez et al. (2012), is constrained by the global annual flux (Sarwar et al., 2015); therefore, we increase or decrease halocarbon emissions based on the ratios of global annual halocarbon fluxes reported by the WMO (Engel et al., 2019) to that in Ordóñez et al. (2012). The scale factors are shown in Table S2. The chl a data are obtained from the merged products of the GlobColour dataset (http://globcolour.info, last access: 6 October 2021) that is developed, validated, and distributed by ACRI-ST, France.
The emissions of inorganic iodine are accompanied by the consumption of O3 at the ocean surface. An enhanced O3 dry deposition by oceanic iodine is usually added (Luhar et al., 2018; Fairall et al., 2007; Luhar et al., 2017). In CMAQ, this O3 deposition to the ocean is based on the work of Chang et al. (2004) and uses the oceanic iodine concentration parametrization by MacDonald et al. (2014) (Sarwar et al., 2015). We use the aqueous iodine parameterizations consistent with that in the calculation of inorganic iodine emissions above.
To investigate the contribution from different species and pathways, we carried out more than eight simulation runs in total other than the control run (BASE) in this study. The description of all the simulations and their differences can be found in Table 1 (see also Tables S3), and the cross-reference between cases and figures in this study is shown in Table S4.
Table 1Case design in this study.
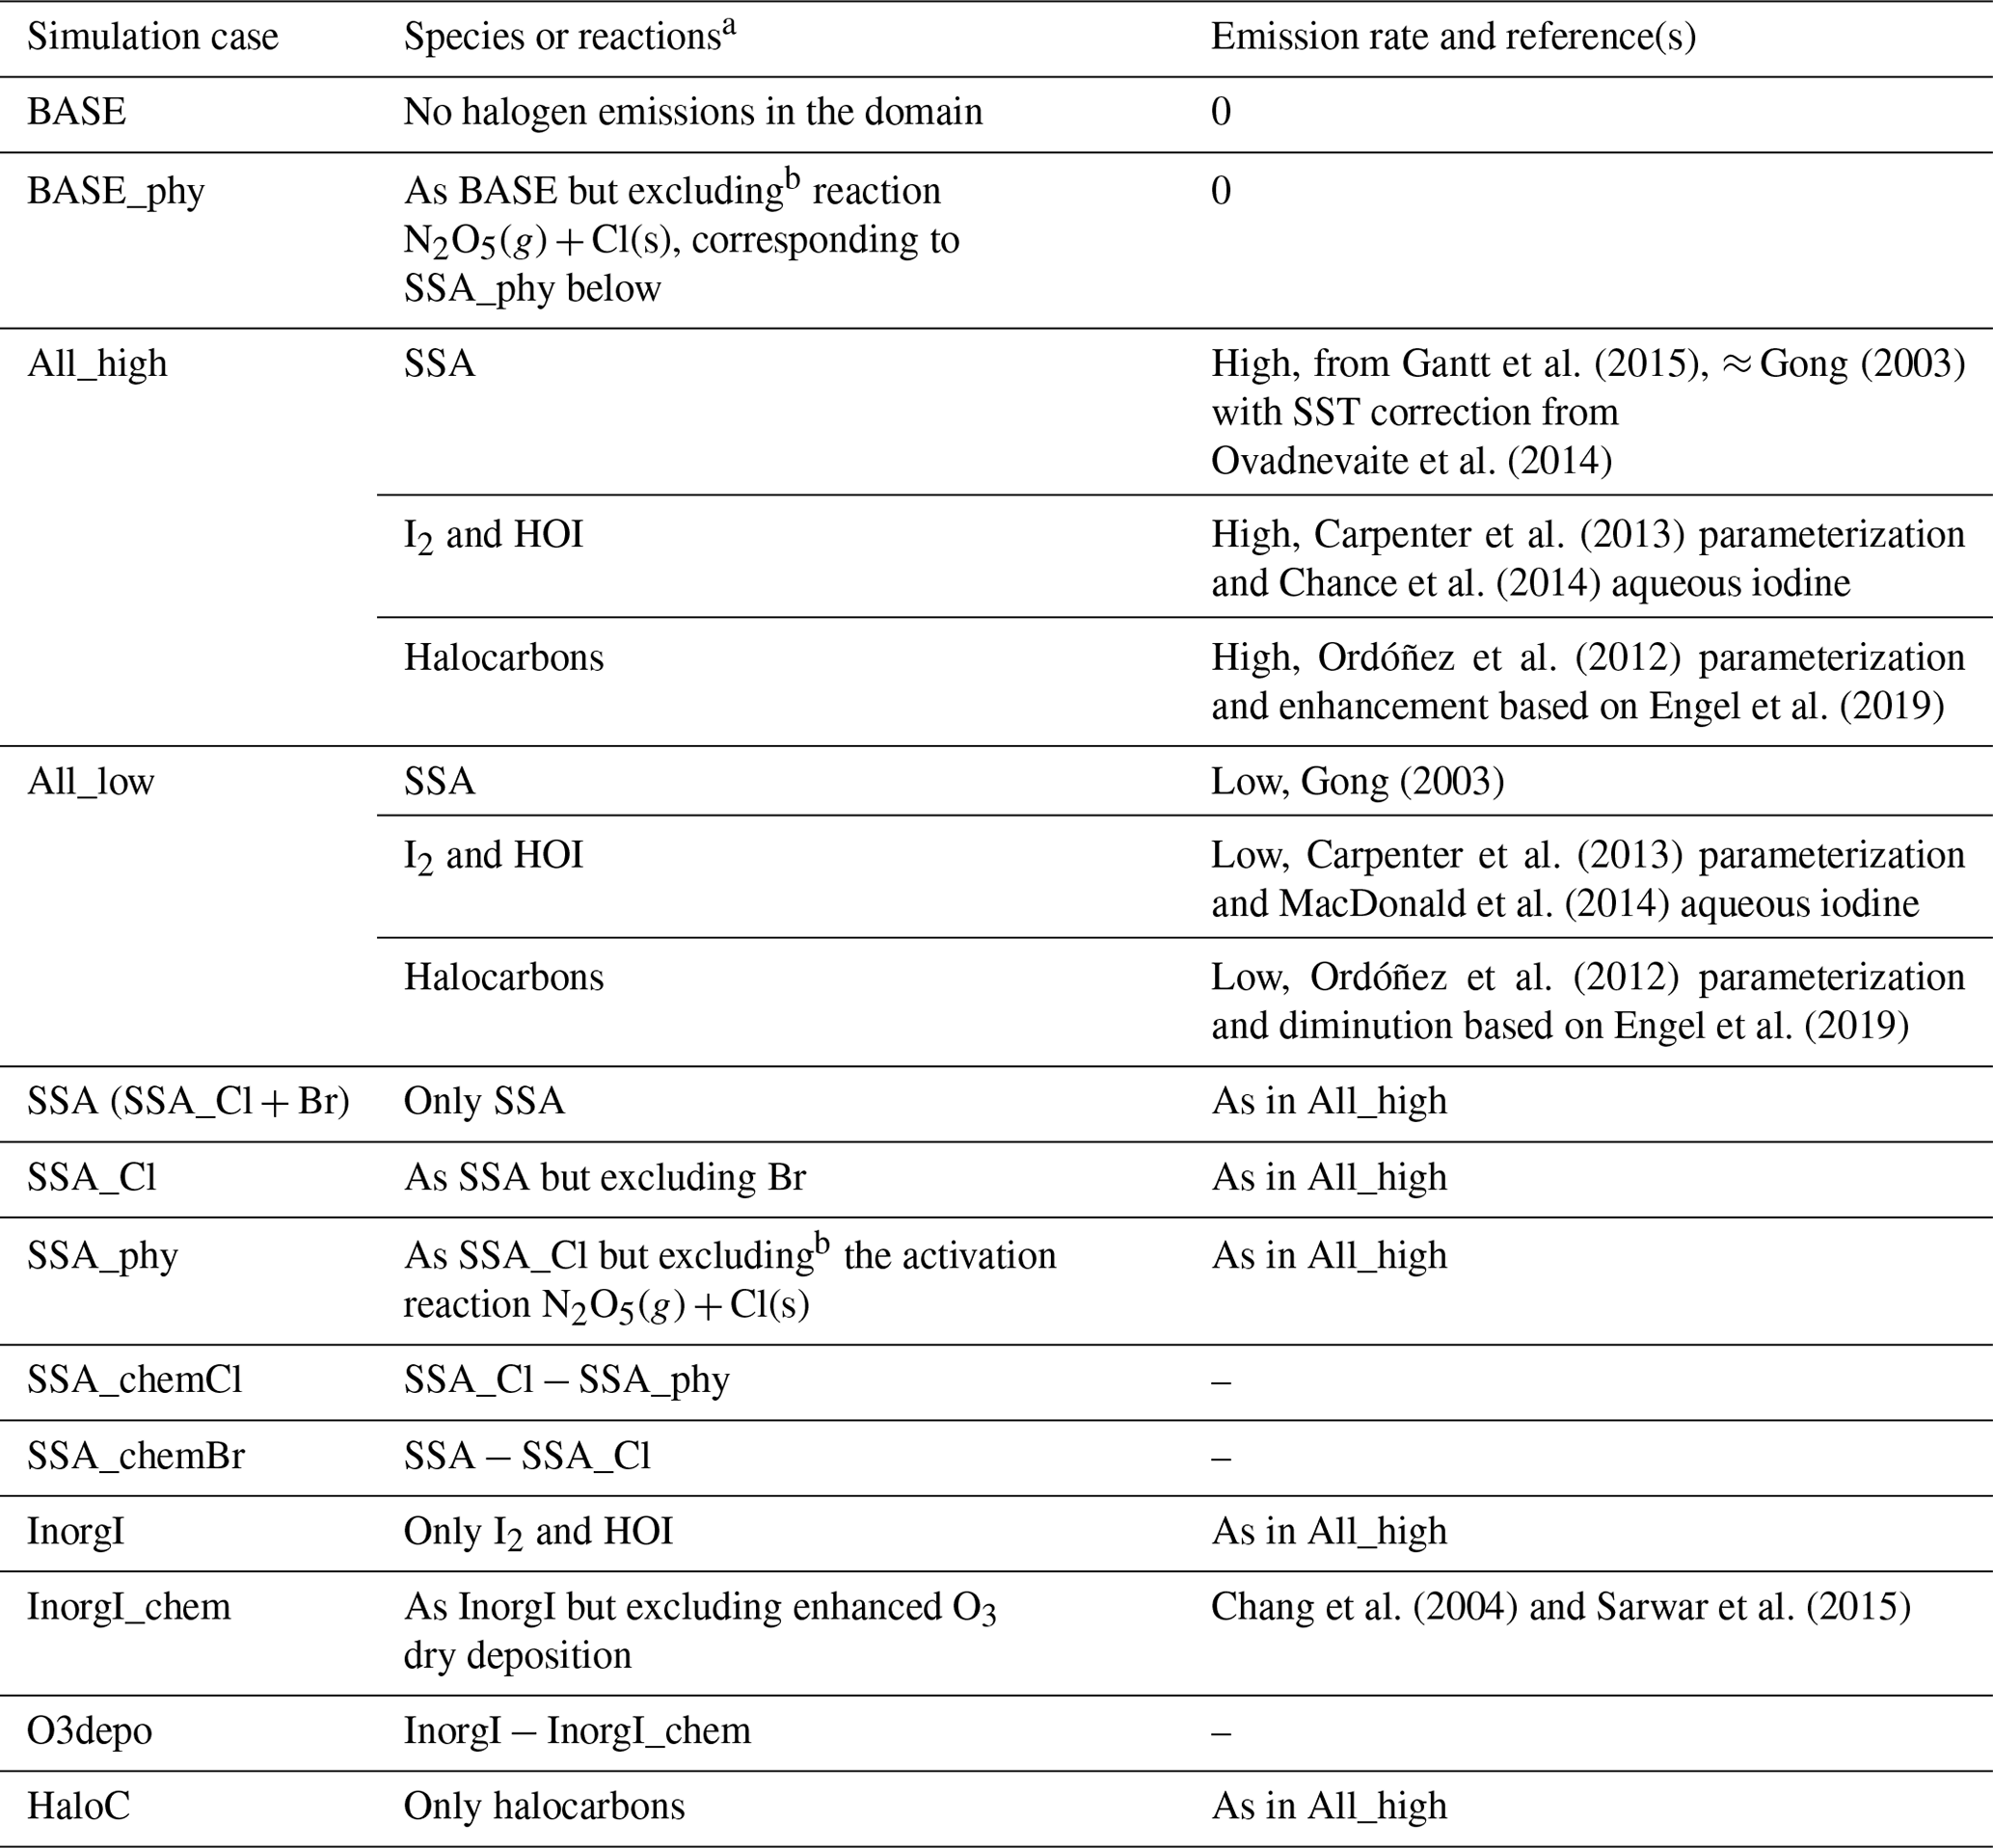
a All cases implement full halogen chemistry as in Sarwar et al. (2019) and Sarwar et al. (2012) unless otherwise stated. b The reaction is unchanged but the uptake coefficient of N2O5(g) and the yield of ClNO2 are set to 0.
3.1 Performance of the model
To evaluate the performance of our models, O3, the key species for OH primary production, is compared between simulated and observed data over land (in China) and an island (Yonaguni) just east of Taiwan. The metrics for evaluation include the average observation (Obs_mean) and simulation (Sim_mean) values, root mean square error (RMSE), normalized mean bias (NMB), normalized mean error (NME), correlation coefficient (r), and index of agreement (IOA). The benchmarks are taken from the study of Emery et al. (2017). The statistical metrics of all stations are calculated, and the average values are presented in Table 2. We evaluate stations in three major polluted areas near the seas in mainland China, namely the North China Plain (NCP), the Yangtze River Delta (YRD), and the Pearl River Delta (PRD) (Fig. S1a). For O3 over the ocean, which is more relevant to this study, we obtain the measurements at the Yonaguni island (24.467∘ N, 123.011∘ E) to validate our simulation (data accessible at https://ebas.nilu.no/, last access: 11 January 2022) (Torseth et al., 2012). It can be seen that the O3 concentrations are also reasonably simulated (Fig. S1b). In addition, adding the halogen emissions (especially with low emission rates) can noticeably lower the bias for the high ozone concentration (i.e., days before 22 July) and improve the correlation between observation and simulations, which indicate the potential to improve the capability of ozone forecast at coastal stations by adding marine-halogen emissions in regional CTMs. Except NMB in the YRD, all these values meet the benchmarks (Emery et al., 2017), which shows that the model performance is comparable to those applications in different regions in China (J. Gao et al., 2020; Li et al., 2022; Gao et al., 2022; Yao et al., 2020) and sufficient for our application.
Table 2Model performance metrics for 1 h O3 in mainland China and at Yonaguni island. The benchmarks are taken from Emery et al. (2017).
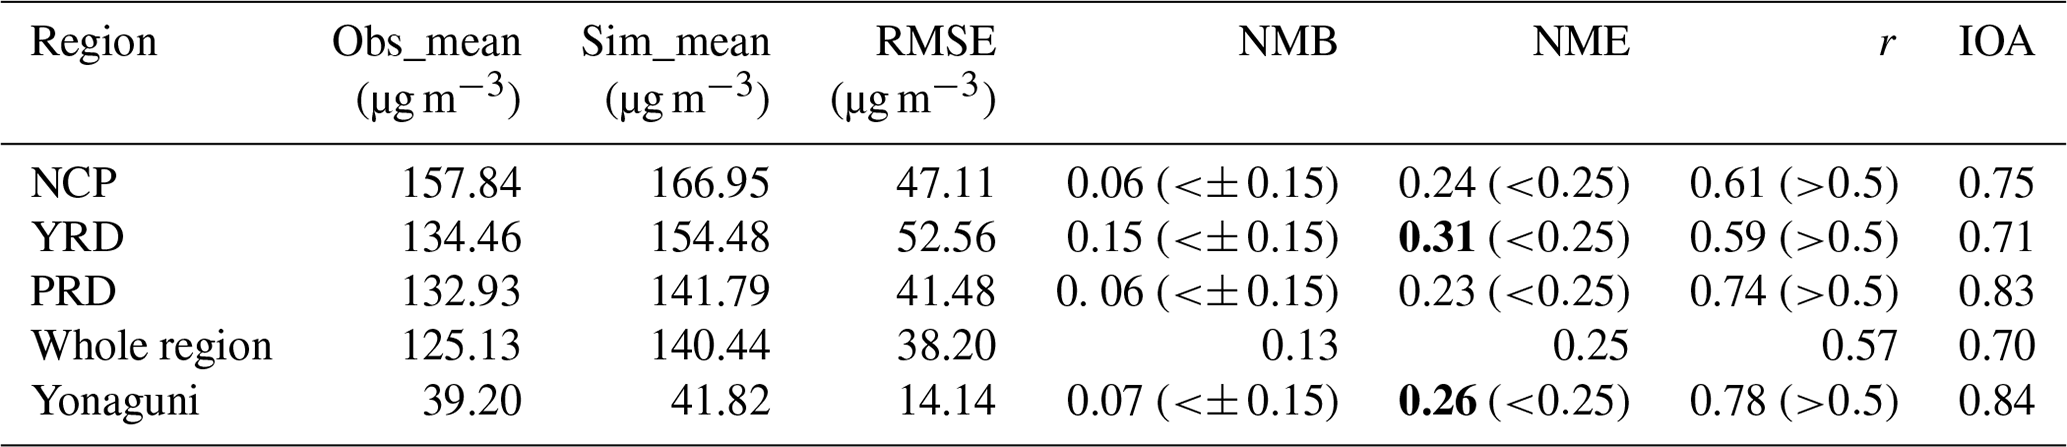
Note: there is a threshold value of 40 ppbv for observations in mainland China as recommended by Emery et al. (2017). For data at Yonaguni no threshold is applied because there is no significant diurnal cycle of O3 concentration. Numbers in bold face indicate that the values do not meet the benchmarks.
Figure S2 indicates a pretty good performance of the aerosol optical depth (AOD) stimulation, which is important for the extinction effect of SSA as discussed in Sect. 3.4.2.
For the relevant halogen species, although the in situ observational data over the marine area are limited, the model skills of marine halogens could generally be evaluated by the levels of BrO and IO due to their importance in halogen chemistry and the availability of ship- and aircraft-based data as well as satellite remote sensing data (Li et al., 2020; Stone et al., 2018; Saiz-Lopez and von Glasow, 2012). Observations of BrO and IO are very rare around the world, especially in East Asian seas. The available measurements of mean concentrations of BrO in the western Pacific show 1.0, 1.7, and <0.5 pptv in three flights (Koenig et al., 2017) and 0.69 pptv (Le Breton et al., 2017) during two related campaigns (CONTRAST and CAST). These values are generally smaller than measurements in the Atlantic Ocean (e.g., Read et al., 2008). In addition, according to the global model results (Zhu et al., 2019) and satellite remote sensing (e.g., http://www.doas-bremen.de/bro_from_gome.htm, last access: 4 June 2021), surface BrO concentrations have large annual variations in the western Pacific, with the largest values in January and the smallest values in July. On a cruise in October from Japan to Australia, Großmann et al. (2013) measured IO, showing that the daytime average of the IO concentration ranges from ∼ 0.5 to ∼ 1.5 pptv, with a typical daytime value of ∼ 1 pptv. Previous model results showed that surface IO in the western Pacific has a significant seasonal variation and peaks in summer (Huang et al., 2020); the difference between July and October is about 0.2–0.4 pptv according to their Fig. 3m and p. Therefore, it is expected that our simulation values (in July) will be slightly larger than the values reported by Großmann et al. (2013). Moreover, since modeled IO also decreases with height in the lower troposphere (see Fig. 2 of Huang et al., 2020), the surface IO is also expected to be slightly larger than the boundary layer average of IO.
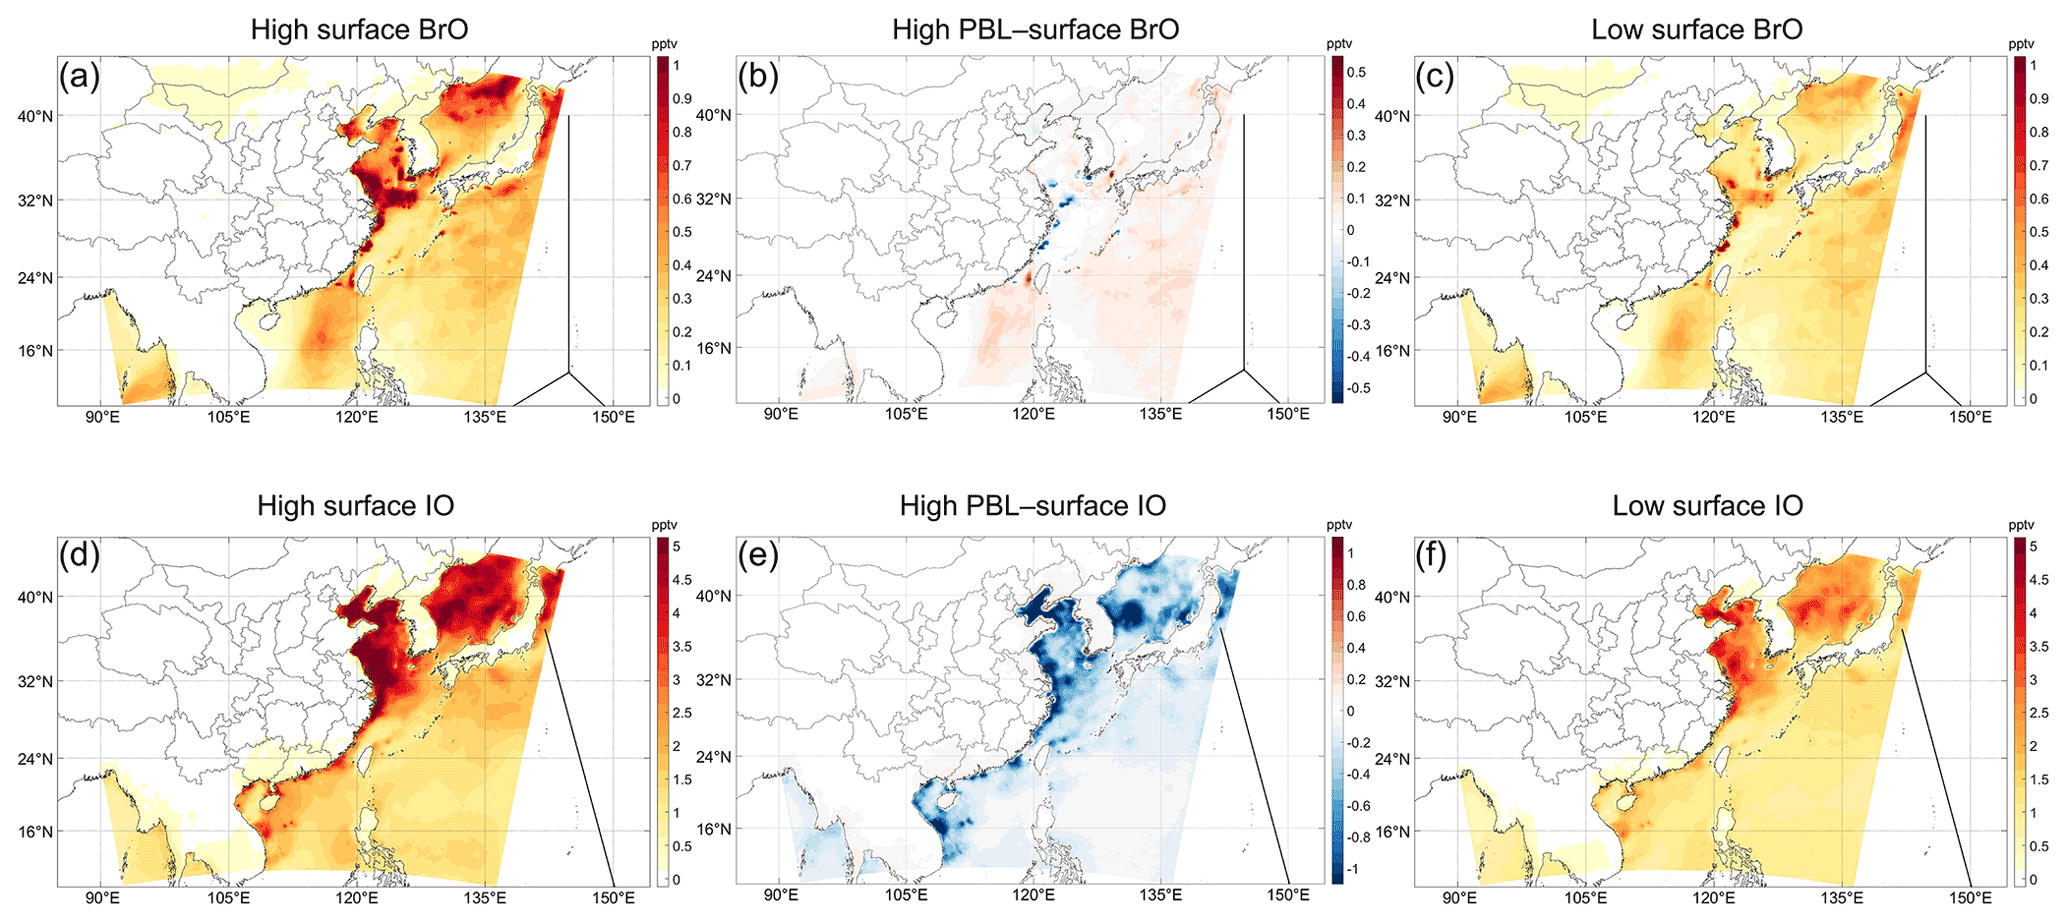
Figure 1Daytime (local time 08:00–16:00) average of (a) surface BrO, (b) difference between planetary boundary layer (PBL) and surface BrO for a high emission rate, and (c) surface BrO for a low emission rate. Panels (d)–(f) are for IO. The black lines indicate roughly the trajectories of flights or cruises in previous studies reporting relevant measurements (see Table 3).
Table 3Comparison of BrO and IO in the Philippine Sea in our simulations (surface layer) with observations and simulations reported in other studies.

a Only data at altitudes below 500 m. 1 Koenig et al. (2017), 2 Le Breton et al. (2017), 3 Zhu et al. (2019), 4 Großmann et al. (2013), 5 Huang et al. (2020).
Figure 1 shows the daytime (local time 08:00–16:00) average BrO and IO simulated in our studies. Due to the lack of observation data in the coastal seas for comparison, we only discuss the results in the Philippine Sea (i.e., the open ocean east to the line connecting the Philippines, Taiwan, and Japan). In this sea, the concentrations of BrO and IO are generally lower than nearshore areas. The maximum mean values of the daytime BrO and IO are 1.2 (0.9) and 2.5 (1.8) for high (low) emissions; for the average over all these grids, the daytime BrO is about 0.25 (0.2) pptv, while IO is about 1.4 (1.0) pptv for high (low) emission rates. For the boundary layer average, the values for IO are lower than surface values by ∼ 0.08 pptv for the grid average and by ∼ 0.4 pptv for the grid maximum in the Philippine Sea in the All_high case (Fig. 1d) (due to the storage limitation, we did not output upper-layer results in All_low case). Different from IO, BrO does not decrease with height in the lower ∼ 500 m in the study of Huang et al. (2020), and our simulations also show that the boundary layer average of BrO is slightly larger than surface values by ∼ 0.05 pptv (Fig. 1b).
Table 3 lists the comparison of the available measurements and global model results in the area and our model results. It can be seen that our model results generally agree well with measurements and other model results. It should be emphasized that the comparison is only indirect and there is a lack of data for even indirect comparison in the nearshore areas where the IO concentration is the largest. Since the inorganic iodine emission is closely related to O3 concentration, which is high in the nearshore areas due to the outflow from the continent, the higher concentration of IO is reasonable, and in other regions, observations also support a very high concentration of IO in nearshore areas (Saiz-Lopez and von Glasow, 2012); nevertheless, relevant observations are expected for a better validation.
3.2 The changes in OH production rate (POH) and concentration
Figure 2 illustrates the halogen-induced changes in POH and OH concentration in All_high (all halogen species high emission rates) and All_low (all halogen species low emission rates) cases. ΔPOH and ΔOH, with both high and low emission rates, have similar spatial distributions but with different magnitudes. The most significant changes in POH and OH appear in the marine atmosphere (Fig. 2). The impacts are very complicated, with negative ΔPOH and ΔOH in the middle area of the ocean and positive values in the northern and southern parts of the ocean in the domain, but the area with negative impacts is larger than that with positive impacts. The decreases in OH can reach ∼ 13 % and ∼ 8 % (ΔPOH ∼ 15 % and ∼ 10 %) in the Philippine Sea, and the increase can reach ∼ 11 % and ∼ 9 % (ΔPOH ∼ 9 % and ∼ 7 %) in the Bohai Sea, with high and low emission rates, respectively. This is in line with previous studies that generally showed a decrease in globally averaged OH but a certain increase in some regions due to halogen chemistry (e.g., Sherwen et al., 2016; Stone et al., 2018). More specifically, in the East Asian seas, the studies of Stone et al. (2018), Wang et al. (2019) and Sherwen et al. (2016) generally showed a slight decrease (≲ 5 %) in annually averaged surface OH, while Stone et al. (2018) also showed a slight increase in some regions. For studies in July, the study of Li et al. (2019) showed a decrease in monthly averaged surface OH in the Atlantic Ocean near Europe but an increase in the Mediterranean Sea and the Baltic Sea. The decrease in the Atlantic Ocean can reach ∼ 20 % in the middle latitudes. In the Indian Ocean, Mahajan et al. (2021) showed a slight decrease (< 5 %) in monthly averaged surface OH near the Indian subcontinent increasing (< 10 %) near the Equator, and the area with decreased OH is larger than that with increased OH in their model domain. In the coastal areas the absolute changes in POH and OH can be comparable to or even larger than that over the ocean, but the relative values are relatively small due to the large absolute value over land (Fig. 2b, d, f, h). The largest decreases in monthly POH and OH can reach ∼ 3 %–5 % and ∼ 4 %–6 %, respectively (Fig. 2b, f).
Generally speaking, our results are comparable to previous studies, showing overall negative halogen-induced ΔOH but with a complicated spatial distribution of negative and positive ΔOH (and ΔPOH), especially in nearshore areas. Previous studies have qualitatively and partially explained the reasons why halogens have such a complicated impact on OH, as the two pathways by which halogens influence OH (i.e., enhanced HO2 conversion by XO and O3 consumption by X atoms) have opposite impacts on OH (e.g., Stone et al., 2018). However, the complicated spatial distribution of negative and positive ΔOH indicates a complicated interaction of the pathways. Furthermore, it is unclear whether there are other important pathways by which halogens influence OH. Therefore, in order to better understand the impacts of halogens on OH, more specifically to understand why halogens increase OH in certain regions (especially in nearshore areas) but decrease it in other regions, we need to find out all possible important pathways and to further analyze the controlling factors of the strengths of the pathways.
In the following, we will further analyze the causes of such a complicated distribution. Since the spatial distributions of relative ΔPOH and ΔOH are very similar despite the small difference in magnitudes, the OH chemistry is generally discussed in terms of POH in the literature (e.g., Tan et al., 2019; Hofzumahaus et al., 2009; Whalley et al., 2021), and we can directly separate different pathways which influence POH, we will focus on POH in the following. In addition, because the patterns of ΔPOH and ΔOH (Fig. 2), as well as the IRR results (Figs. 4 and S3), are quite similar in the All_high and All_low cases (Fig. 2), we will mainly focus on cases with high emission rates.
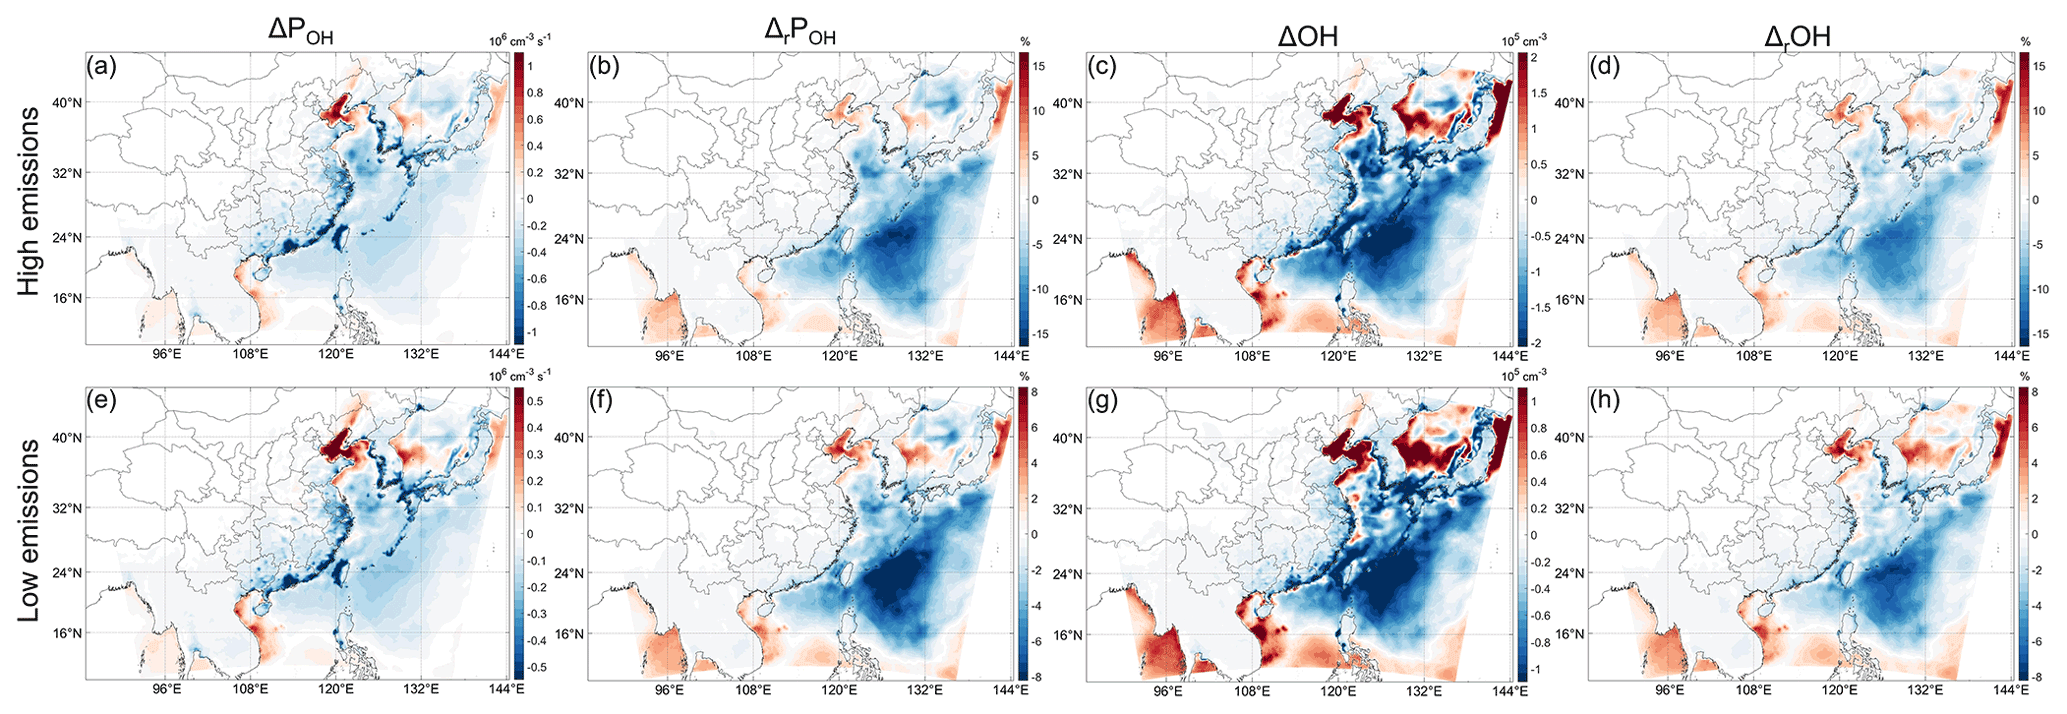
Figure 2Change or relative change compared to the BASE case in monthly averaged surface-layer POH and OH in All_high case (first row) and All_low case (second row). The subscript r denotes “relative”. Note the different scales in the All_high and All_low cases; the latter is exactly half of the former.
3.3 Quantification of different pathway contributions
As mentioned above, there is complexity in the cause of the ΔPOH. In this section, IRR is used to unravel important chemical reactions in changing POH. The main sources of OH in the CB6 mechanism of the CMAQ model include primary sources and secondary sources. Primary sources include the photolysis of O3 (through the reaction O(1D)+ H2O, which will not always be explicitly stated in the following), HONO, and H2O2, as well as ozonolysis of some alkenes. The secondary source is mainly the reactions HO2+ Y (Y=NO, O3, etc.). With halogen chemistry, an additional source, HOX photolysis, needs to be considered as HOI can be directly emitted and can be very rapidly cycled. The changes in POH due to the change in all these sources (denoted as ΔPOH_XX in the following, where XX is clear from the context) based on IRR analysis are quantified. According to the IRR results, we only focus on the main three changes (photolysis of O3 and HOX, as well as the reaction HO2+ Y) (Fig. 3a–c). Since the changes in other sources are ignorable (Fig. 3d), we do not show them individually. We denote the halogen-induced change in these sources as pathways by which halogens influence OH, and therefore there are three main pathways through which marine-emitted halogens influence POH, i.e., POH_O1D, POH_HO2, and POH_HOX.
In line with previous studies, the results show that the change in O3 and the addition of HOX are the two most important pathways by which halogens influence POH (Stone et al., 2018). ΔPOH caused by the change in O3 and HOX photolysis (denoted as ΔPOH_O1D and ΔPOH_HOX, respectively) is very large in the northern part of the ocean in the domain, especially in the Bohai Sea and the Yellow Sea, which is probably a result of the higher concentration of related species such as O3 that is commonly reported at high concentrations in the midlatitude in summer (e.g., M. Gao et al., 2020; Lu et al., 2019b; Hu et al., 2017). ΔPOH_HOX (Fig. 3f) can reach 4 × 106 cm−3 s−1 (∼ 0.6 ppbv h−1) for the whole-day average and 1 × 107 cm−3 s−1 (∼ 1.5 ppbv h−1) for the daytime average. Our results show that HOX is an important source of OH over the ocean (may be compared to urban-area HONO), but it was generally ignored in the previous HOx budget studies (e.g., Tan et al., 2019; Hofzumahaus et al., 2009; Whalley et al., 2021). Therefore, our results indicate the necessity to measure HOX in HOx budget studies under the potential influence of the marine atmosphere.
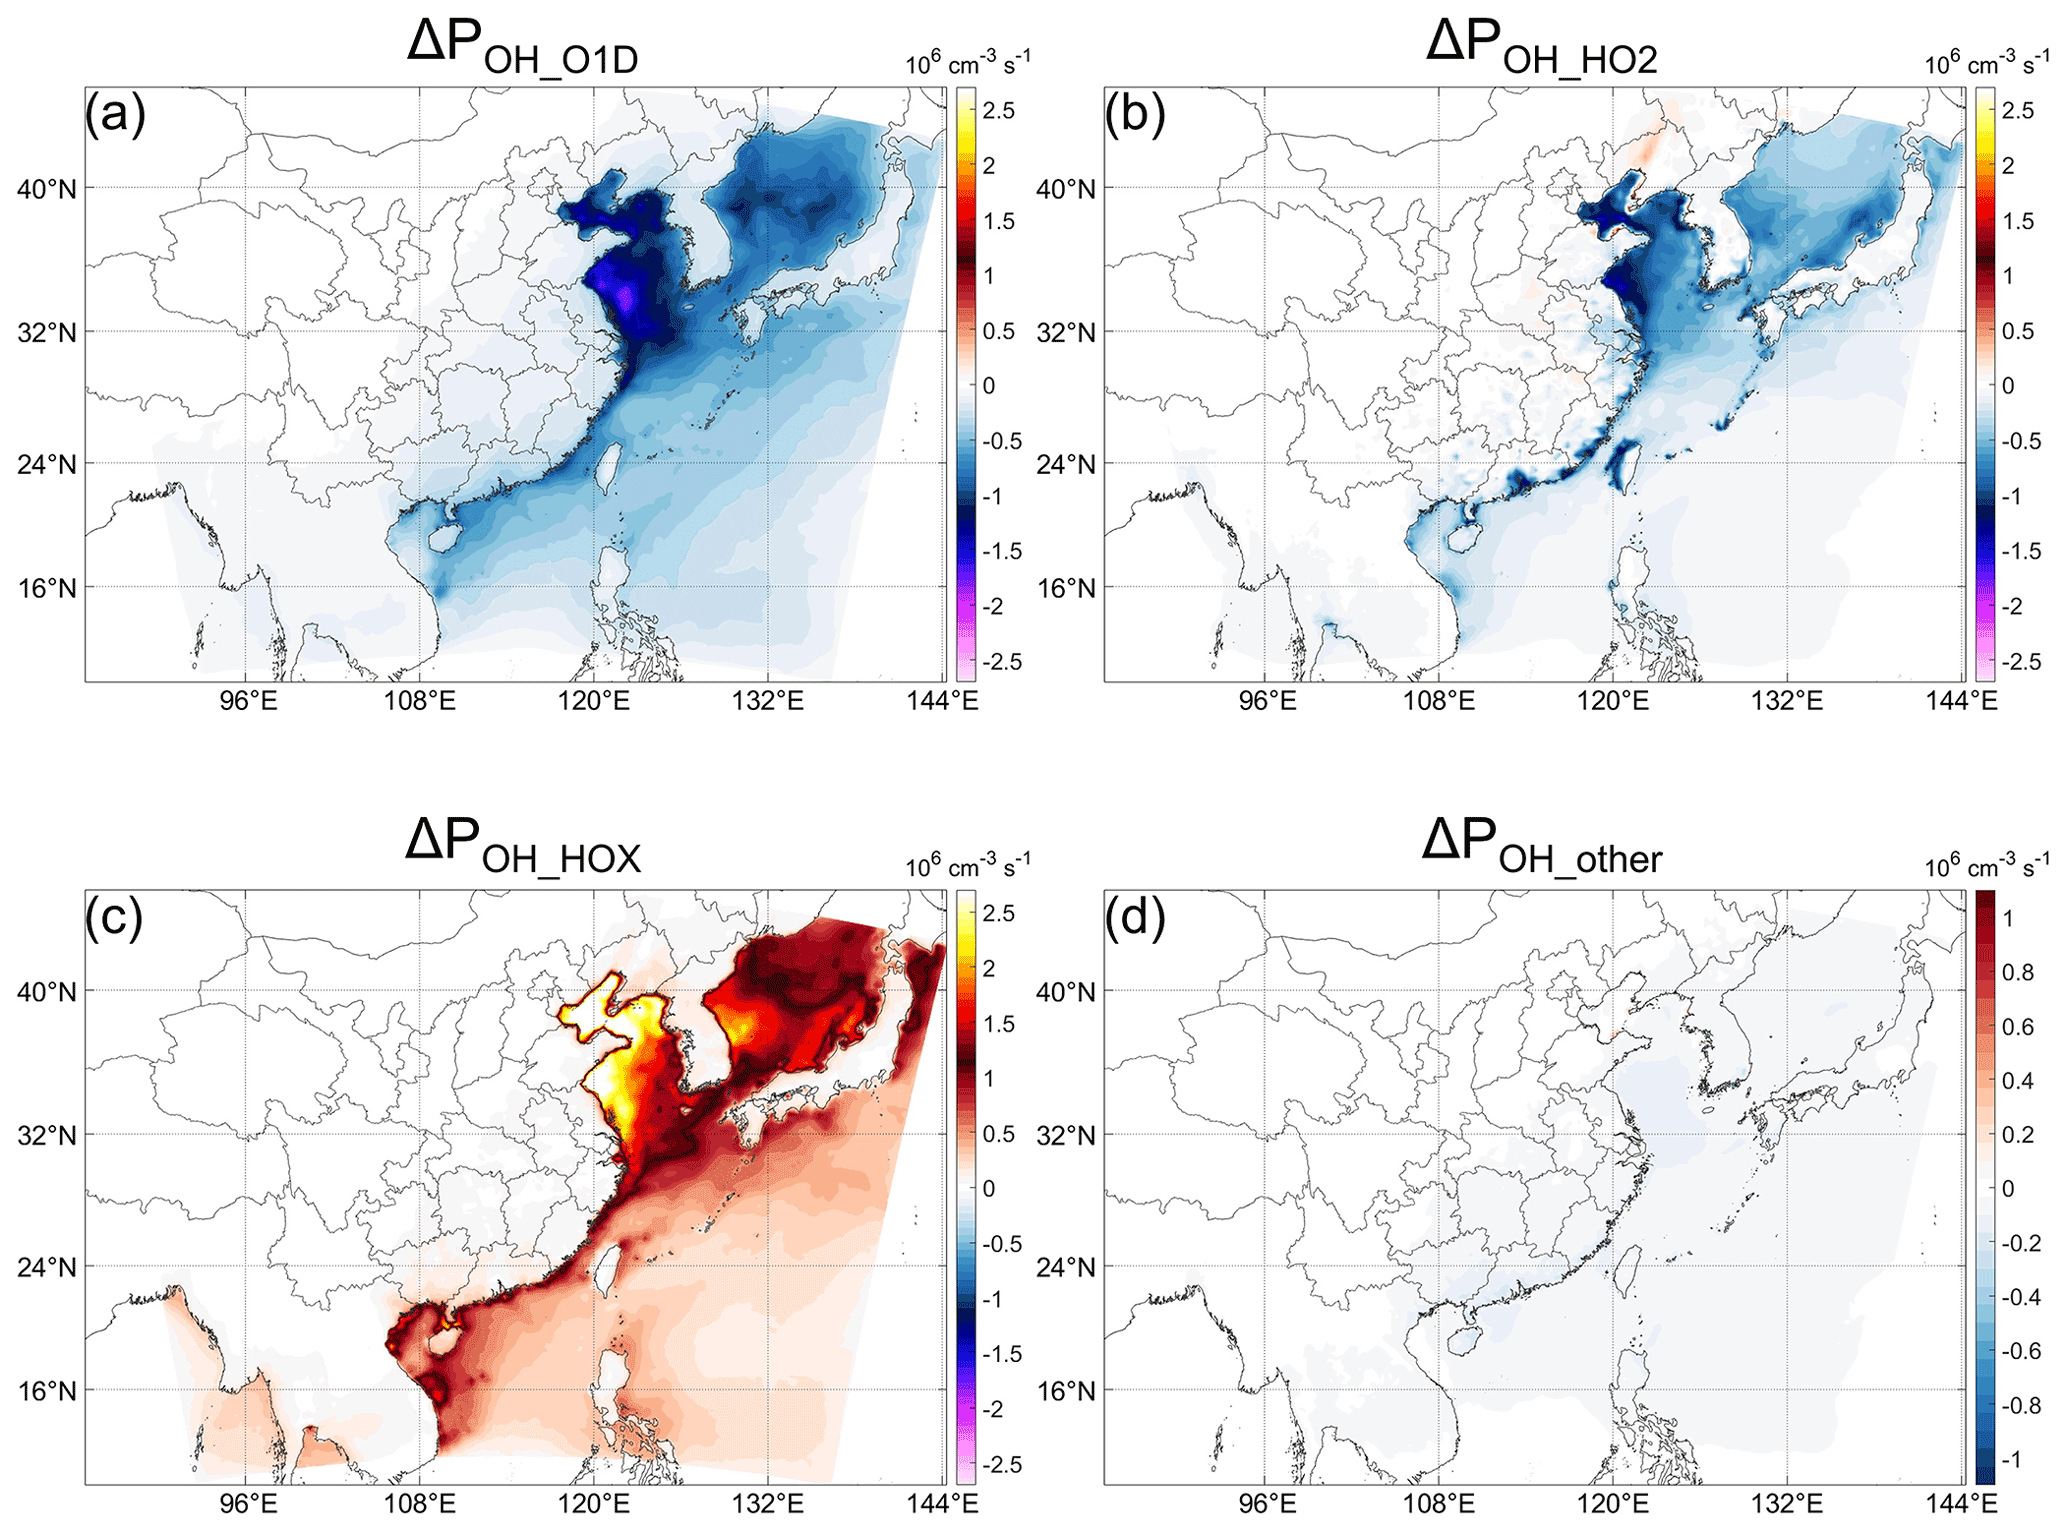
Figure 3Decomposition of Fig. 2a for different pathways: change in POH (All_high-BASE case) caused by the changes in (a) O(1D) (ΔPOH_O1D), (b) HO2+ Y (ΔPOH_HO2, Y = NO, O3, etc.), and (c) HOX + hν (ΔPOH_HOX), as well as (d) other pathways (Fig. 2a minus the sum of a and c). The red and blue color scales are the same in (a)–(d).
In addition to ΔPOH_O1D and ΔPOH_HOX, ΔPOH_HO2 is also very important to ΔPOH as shown in Fig. 3b. If we considered only ΔPOH_O1D and ΔPOH_HOX, only a relatively small area close to Taiwan would show negative ΔPOH, and the general impacts of halogens on OH would be positive (compare Figs. 2a and S4a).
As mentioned above, the production rate of OH from HOX is very large. However, this large production rate is canceled by the large decrease in ΔPOH_O1D and ΔPOH_HO2 (Fig. 3a, e), resulting in the relatively small net ΔPOH compared to ΔPOH_O1D and ΔPOH_HOX (and even ΔPOH_HO2 for many regions) over the ocean, but this is still significant along the coastal areas (Fig. 3). It can be seen that the cancel-out effect of the three pathways with different signs results in the complicated spatial distribution of ΔPOH, making ΔPOH positive in the areas with larger ΔPOH_HOX and negative otherwise. From these three pathways themselves, however, it is difficult to explain under what conditions ΔPOH_HOX will be stronger than the other two pathways, and it is therefore difficult to explain why ΔPOH is generally positive in the nearshore areas but negative in the open ocean. Then we need to further analyze the details of the processes influencing the strengths of these three pathways.
3.4 Factors influencing the strengths of the three pathways
3.4.1 Overview of the contributions from different marine-emitted species
There are several factors that can change the strengths of the three main sources of OH (Fig. S5). Some of these factors are independent, and some are interrelated. The independent factors include a decrease in O3 photolysis rate (J(O1D)) and O3 concentration by SSA-induced light extinction and enhancement of O3 deposition by oceanic iodine. The interrelated factors are generally closely related to halogen chemistry, the most important reactions of which are the four below (R1–R4; Saiz-Lopez and von Glasow, 2012; Simpson et al., 2015).
For convenience, we also list the two reactions producing OH that are relevant to Reactions (R1)–(R3) and have been mentioned above.
Since these factors just mentioned above are generally species-related, we separately modeled the impacts of different halogen species in addition to the case with all emissions (All_high) (Table 1). The results are shown in Fig. 4. It can be seen that the most significant contributor to the three pathways is inorganic iodine (Fig. 4e–g). However, the three pathways cancel each other out to a large extent, and the resultant ΔPOH is relatively small. Nevertheless, the impact of inorganic iodine is more pronounced than that of all species together (Figs. 2a and 4e). The contribution of SSA to ΔPOH is notable and comparable to that of inorganic iodine in most regions. There is a positive contribution of SSA to ΔPOH in the Bohai Sea and surroundings, while in other regions the contribution is negative. The negative contribution again neutralizes the positive contribution of inorganic iodine, resulting in the more negative ΔPOH in the All_high case (Fig. 2a) than in the InorgI case (Fig. 4e). The contribution of halocarbons is relatively small and restricted to a small area near the China coastline. In addition, the interactions between these three types of emitted species (Fig. 4m) have very similar impacts with halocarbons (Fig. 4i) but with opposing sign. Since we only focus on major contributions of different halogen species to ΔPOH, we will not go into the details about the rest of the interactions of the three types of halogen emissions, and therefore we also do not discuss the influences of halocarbons in the following as they roughly cancel out the effects of the interactions. It should be noted, however, that this does not imply that the interactions are caused by halocarbons.

Figure 4Decomposition of Fig. 3 for different halogen species. Panels (a)–(d), (e)–(h), and (i)–(l) are results for the SSA, InorgI, and HaloC cases, respectively. Panels (m)–(p) are the residue between All_high and SSA + InorgI + HaloC, representing the interactions of different halogen species. The red and blue color scales are the same in (a)–(p).
3.4.2 Physical and chemical contributions of SSA emission
Regarding SSA, whose components are mainly Cl− ions and inert non-volatile cations (NVCs, including Na+, K+, Ca2+, and Mg2+), with minor contributions from sulfate and Br− ions, these emissions (see Fig. S6c,d for the emission rates) could influence OH through both actinic flux and chemical effects of Cl and Br. The SSA impact on OH (Fig. 4a–d SSA) is further decomposed into the impact of the extinction effect of SSA, Cl chemistry, and Br chemistry (Fig. 5). Figure 5 indicates that the most important factor that determines the negative impact of SSA on POH (Fig. 4a) is its extinction effect (Fig. 5a–d). The decrease in actinic flux caused by the extinction effect of SSA can decrease the photolysis rate constant of O3 (J(O1D)) and the O3 concentration (probably through influencing J(NO2), see e.g., J. Gao et al., 2020) at the same time (Fig. S6a, b), which will in turn decrease the OH production from O3 photolysis (Reaction R5). The negative impacts of Br chemistry are very small compared to this extinction effect. In addition to the overall large impacts, the importance of the SSA extinction effect is also embodied in its impact on the continental atmosphere. As shown in Fig. 4a, e, and i the ΔPOH over land induced by SSA is the most significant among the three halogen emissions, and here we know that the relatively large decrease in POH in southern China is caused by the extinction effect of SSA. The decrease in monthly POH caused by SSA can reach ∼ 3 % (Fig. 6a) (hourly ΔrPOH up to 30 % in the daytime). Therefore, even without halogen chemistry, adding SSA emissions in CTM studies may be important for atmospheric chemistry.
Another important factor that influences POH is the Cl chemistry (Figs. 5e–h and 6b). Similar to previous studies, Cl chemistry has positive impacts on ΔPOH because Cl can oxidize VOCs, which can come from both anthropogenic and oceanic sources (Yu and Li, 2021), efficiently producing RO2 radicals (Reaction R4) as shown in Fig. 5e (Li et al., 2020; Wang et al., 2020; Simpson et al., 2015). As such, the change in POH by Cl chemistry (Fig. 5e) is mostly through the change in OH production from HO2 (Fig. 5g). The impacts of Cl chemistry are most significant in the Bohai Sea and surroundings. As shown in Fig. S7, in these areas, the concentration of ClNO2 (the key species for the activation of SSA Cl) is higher than other regions (Fig. S7a) and the Cl reactivity (kCl, × [VOC]) is very high, resulting in the larger impact of the Cl chemistry. ClNO2 is a product of N2O5 with particulate Cl, and N2O5 is a product of NO2 and the NO3 radical (e.g., Yu et al., 2020). Therefore, the larger impacts of Cl chemistry in the Bohai Sea and surroundings probably reflects the influence of higher NOx in the area. The impact of Br chemistry on POH is quite small in general (Fig. 5i–l), and we will not discuss it further (see more discussion about Br chemistry in Sect. 3.5). Nevertheless, the results from Br chemistry emphasize the importance of pathway POH_HO2 in interpreting the roles of halogens in influencing HOx cycling: when considering the influence of halogens on HOx, it is believed that XO will shift the HOx balance to OH in general (e.g., Li et al., 2020; Stone et al., 2018; Saiz-Lopez and von Glasow, 2012). But these results are derived without considering the indirect influence of halogens on Reaction (R6) (i.e., pathway 2, POH_HO2, in our study). In our study, when the inhibition of halogen chemistry on the HO2 conversion to OH through HO2+ Y is considered (Reaction R6), only IO can uniformly enhance the HO2 conversion and BrO cannot in some areas (compare Fig. 5k and l, or see Fig. S4b), which is probably because of the lower reactivity of BrO with HO2 (see also discussion in Sect. 3.4.2 of Whalley et al., 2010).
In regards to the three main pathways discussed in Sect. 3.3, the physical contribution of SSA is achieved not only through the decrease in the photolysis of O3 (J(O1D) and the O3 concentration) (Fig. 5b), but also through the decrease in HO2 conversion to OH (Fig. 5c), which is probably feedback induced by the decrease in O3 photolysis because HO2 production is less influenced by photolysis change. In contrast, the chemical contribution of SSA Cl is achieved through the increase in RO2 that can rapidly react with NO to form HO2 (Seinfeld and Pandis, 2016), and therefore the second pathway, OH from HO2, is more prominent (Fig. 5g), while the increase in O3 concentration is of minor importance (Fig. 5f).
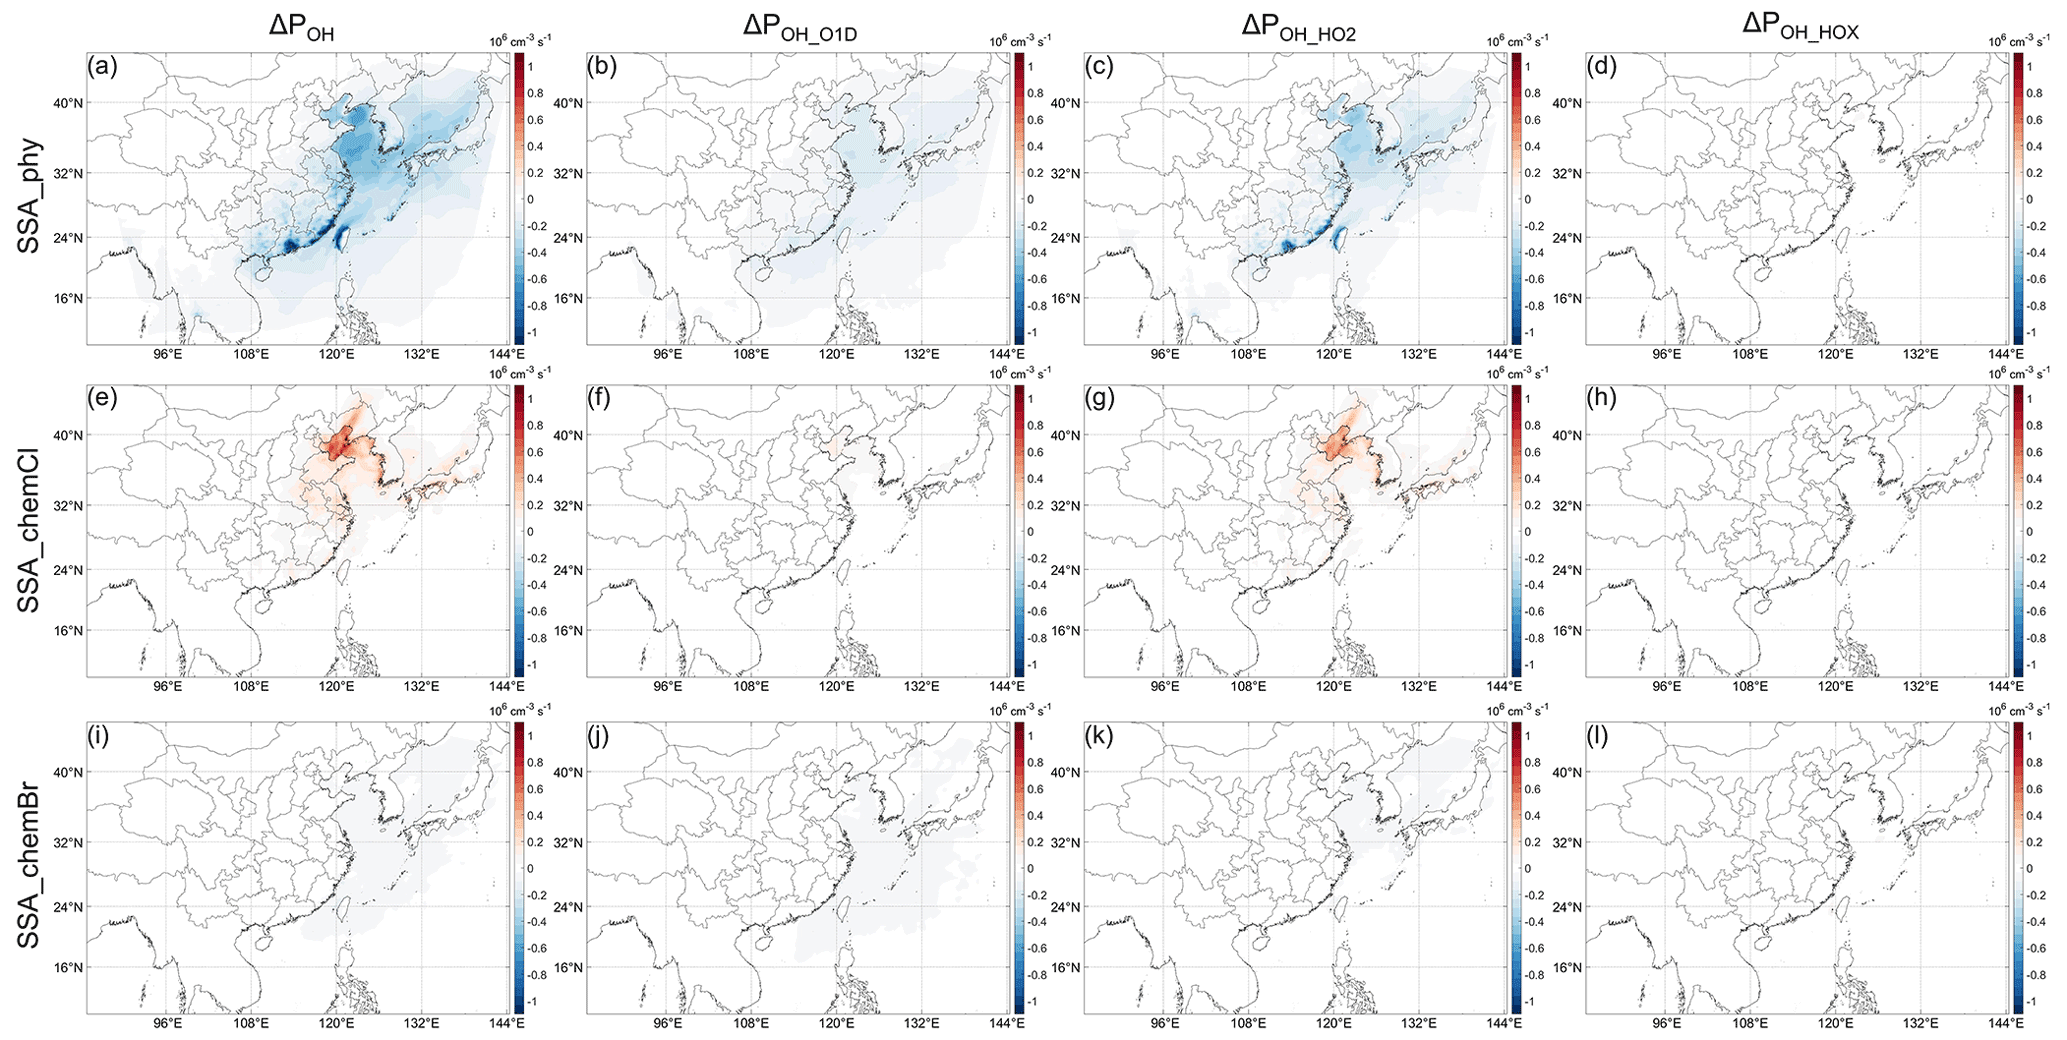
Figure 5Decomposition of Fig. 4a–d (SSA): the changes in POH, POH_O1D, ΔPOH_HO2, and ΔPOH_HOX caused by (a)–(d) the extinction effect of SSA, denoted as SSA_phy, (e)–(h) Cl chemistry (only the activation of Cl through ClNO2), and (i)–(l) Br chemistry.

Figure 6Relative change in POH compared to BASE caused by (a) SSA extinction effect, (b) SSA Cl chemistry, (c) enhanced O3 deposition by aqueous iodine, and (d) atmospheric inorganic iodine chemistry.
3.4.3 Physical and chemical contributions of inorganic iodine species and the interactions between O3 and iodine chemistry
Regarding the contributions from inorganic iodine species to ΔPOH, the indirect effects from the enhanced O3 deposition by iodine ion in the ocean (e.g., Pound et al., 2020) and atmospheric iodine chemistry (including the direct emission of HOI) should be considered. The change in POH caused by the enhanced O3 deposition is shown in Fig. 7a. This O3-deposition-induced decrease in POH is most significant in the Bohai and Yellow Sea, where it can reach ∼ 0.4 × 106 cm−3 s−1, corresponding to ∼ 6 % (hourly ΔrPOH can reach > 30 % in the daytime) in the Yellow Sea relative to POH in the BASE case (Fig. 6c). The larger absolute decrease in POH (Fig. 7a) is probably caused by the higher deposition of O3 in the Bohai and Yellow Sea because of the higher O3 concentration there as mentioned above (see also Fig. 8). For the relative change, the decrease in POH is most significant in the Sea of Japan, where the relative decrease can reach more than 10 % (hourly ΔrPOH can reach > 45 % in the daytime) (Fig. 6c). By decomposing to different pathways, the decrease in POH induced by O3 deposition is caused by the decrease in O3 (POH_O1D, Fig. 7b) and by the decrease in HOX photolysis (POH_HOX, Fig. 7d), which probably results from the slower cycling of HOI through Reactions (R1)–(R3) due to the lower O3 concentration.
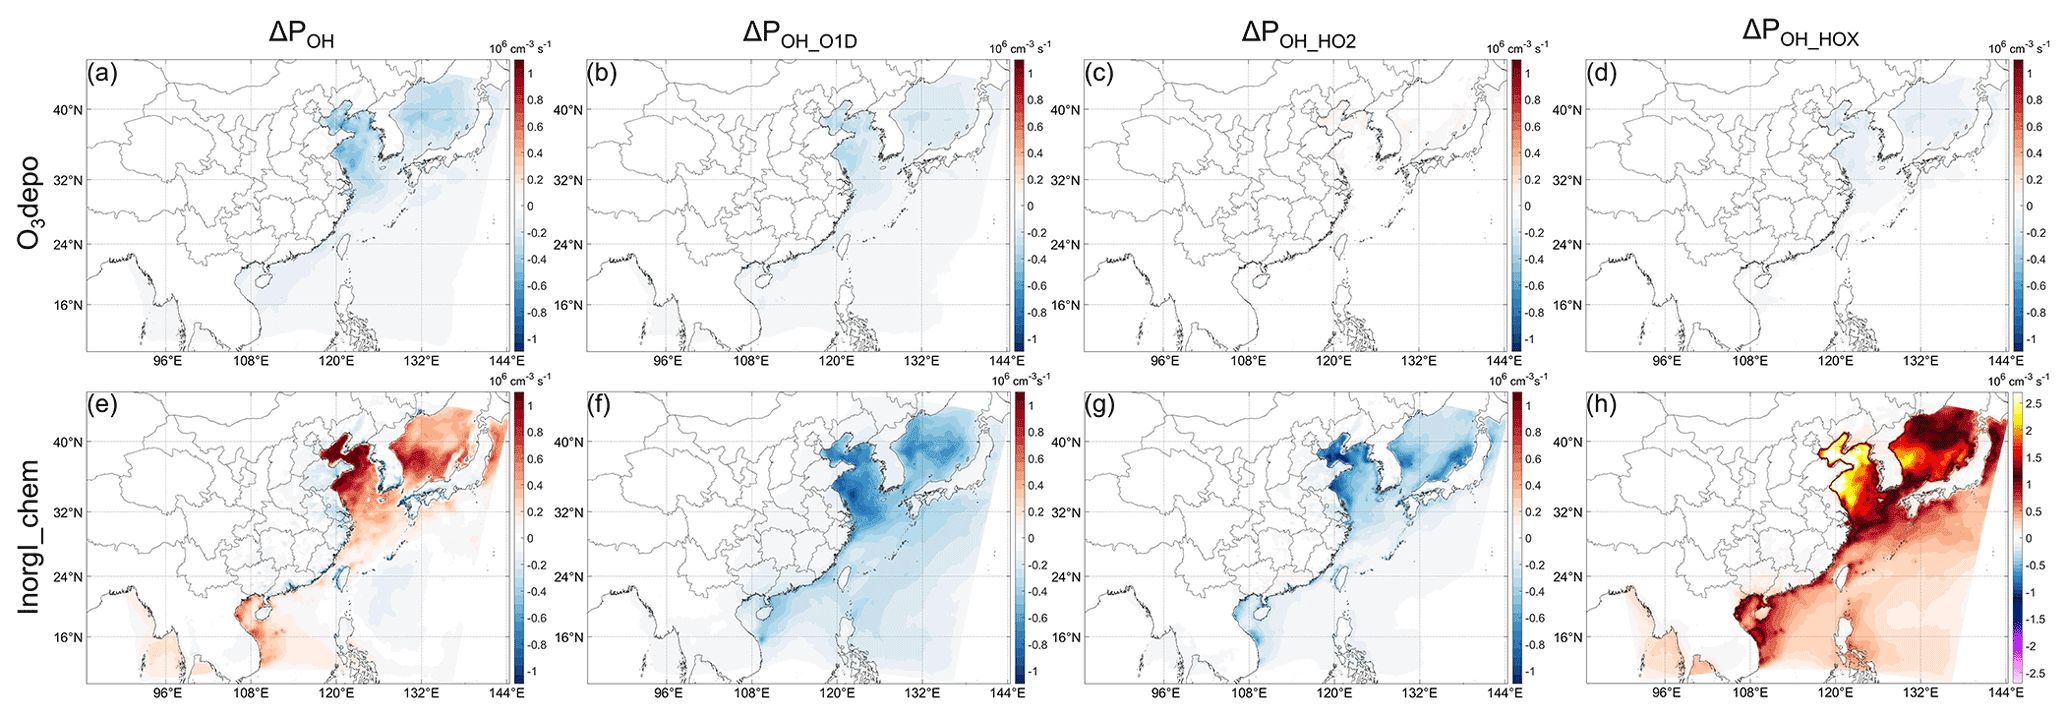
Figure 7Decomposition of Fig. 4e–h (InorgI): the changes in net OH production rate caused by (a)–(d) the enhanced O3 deposition by oceanic iodine ions and (e)–(h) atmospheric iodine chemistry (including direct HOI emission). The red and blue color scales are the same in (a)–(h).
Regarding the contributions from the atmospheric iodine chemistry to ΔPOH, it has a generally positive impact on POH except in a limited area (Figs. 6d and 7e). More specifically, the decrease in ΔPOH is relatively significant in the Philippine Sea (up to ∼ 8 % of the BASE case). The positive ΔPOH in the Bohai and Yellow Sea can reach more than 10 % of BASE case, and the relative increase can reach more than 15 % in the Sea of Japan. The changes in POH caused by the atmospheric iodine chemistry from different pathways are shown in Fig. 7e–h. It can be seen in Fig. 7 that the contributions of the three pathways are all significantly influenced by iodine chemistry. Different from Cl chemistry, iodine chemistry can both increase POH via Reaction (R3) (Fig. 7h) and decrease POH via Reactions (R1)–(R2) (Fig. 7f–g).

Figure 8Monthly average of parameters related to inorganic emission in the All_high case. (a) HOI emission rate, (b) I2 emission rate, (c) HOI concentration, (d) O3 deposition velocity over the ocean, (e) seawater iodine ion concentration, and (f) O3 concentration. Note the different scales of (a) and (b). Panel (d) is comparable to the values in the study of Pound et al. (2020), with an annual average O3 deposition velocity of about 0.03 cm s−1, and in summer the deposition velocity is close to the annual average in the western Pacific; see their Figs. 2b and 3c.
The negative change in POH caused by atmospheric iodine chemistry in the Philippines Sea shown in Fig. 6d is interesting, and to our knowledge there is no study previously published detailing the cause of both the positive and negative impacts of iodine chemistry (e.g., Stone et al., 2018). To investigate the factors driving the spatial variability of iodine-induced OH production, the monthly averaged values of the parameters related to inorganic emission in the All_high case are plotted in Fig. 8. As expected, the pattern of ΔPOH does not coincide with the patterns of seawater iodine concentration (Fig. 8e) and the ozone deposition velocity (Fig. 8d), which decrease with latitude due to the increase in temperature. The location of the area with negative ΔPOH roughly coincides with the area with lower emission rates of HOI and I2 (Fig. 8a, b) and concentrations of HOI (Fig. 8c) and O3 (Fig. 8f). The positive change in POH could be directly attributable to the effect of iodine chemical cycling, but what are the causes of the negative change in POH? To figure out the causes, we conduct sensitivity simulations to analyze the contribution of I2 and HOI emissions as well as the O3 concentration to the negative ΔPOH.
First, we find that the emission of HOI as a primary OH source is not the cause. The PA results show that the emission rate of HOI is much smaller than that of the HOI cycling rate (Fig.S8a, b). Moreover, the change in POH_HOX by replacing direct HOI emission with an equivalent amount of I2 using the emission scaling technique developed by Murphy et al. (2021) is relatively ignorable (Fig. S8c). Even without direct HOI emission (i.e., replaced by I2) there can also be negative ΔPOH in the area (Fig. S8d). Second, we show that the lower emission rate of inorganic iodine (emitted as HOI or I2) in the Philippine Sea is probably not the cause of the negative ΔPOH there by two sensitivity runs (addressing the impacts of the absolute value and the spatial distribution of the emissions, respectively). When reducing HOI and I2 emission rates by 50 % uniformly, the area of negative ΔPOH does not increase (Fig. S9a, b), indicating that fewer available iodine atoms do not necessarily enlarge the area of negative ΔPOH in the Philippines Sea. Furthermore, when we set HOI and I2 emission rates in the whole domain to constants (6.86 = µmole km−2 s−1 for HOI and of HOI for I2; see Fig. 8a and b for comparison), which are between the emission rates in the Philippine Sea and that in the Bohai Sea, the pattern of ΔPOH is very similar to that in the InorgI_chem case (Figs. S9e and 7e). This similarity strongly suggests that the distribution of inorganic iodine emission is also not important to determine the positive or negative pattern of iodine-chemistry-induced ΔPOH.
Is it the complex interaction between the marine iodine chemistry and the continental atmospheric pollution that leads to the special negative ΔPOH in the Philippine Sea? Third, to investigate whether this is true, we conduct simulations increasing the O3 concentration downwind of the Philippines (Fig. S10a) by increasing NOx and VOC emission rates in the Philippines by a factor of 5. The iodine-chemistry-induced change in POH is negative in most of the Philippines Sea but positive near the land (Fig. S10c). This characteristic results from the different distributions of ΔPOH_O1D (Fig. S10d) and ΔPOH_HOX (Fig. S10e) along the O3 plume: the former is relatively evenly distributed, while the latter weakens gradually along the plume. The gradual decrease in ΔPOH_HOX (via Reaction R2) along the plume path is similar to the O3 distribution (Fig. S10a) because the HOI cycle is essentially local due to the very high cycling rate, leading to the local impact of POH_HOX. In contrast, ΔPOH_O1D caused by the O3 consumption via Reaction (R1) does not gradually weaken along the plume as the O3 concentration and ΔPOH_HOX do, which is because the decrease in POH_O1D (via Reaction R1) is not only controlled by the local O3 consumption but also the upwind O3 depletion along the plume. To confirm the impact of the upwind O3 depletion by iodine (Reaction R1) in the Philippine Sea, the ratio of the total O3 concentration decrease to the local O3 loss rate is shown in Fig. 9c. Indeed, the ratio has maxima in the Philippine Sea where the iodine-chemistry-induced ΔPOH is negative (Fig. 7e), indicating an “excessive” decrease in O3 compared to its local consumption in the area (Fig. 9), which can only be explained by the gradual enhancement of the upwind O3 depletion by iodine along the plume paths (as the iodine atom is the only significant consumer of O3 in the InorgI_chem case compared to the BASE case).
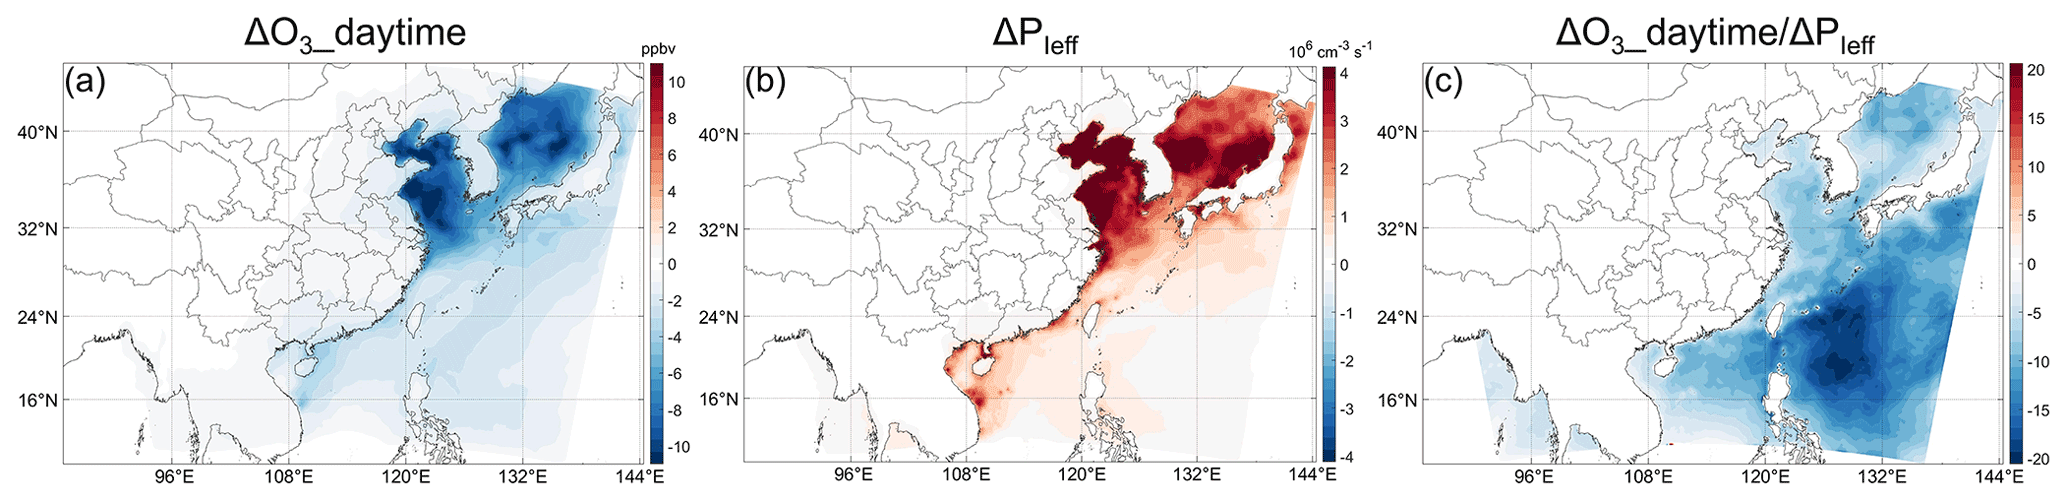
Figure 9Iodine-chemistry-induced change in (a) daytime (LT 08:00–16:00) O3 concentration and (b) production rate of the effective iodine atom (iodine atom that can consume O3, including all reactions that can produce the iodine atom except IO photolysis and reactions which produce NO2; ≈ O3 loss rate by local iodine chemistry). (c) The ratio between (a) and (b), only for qualitative illustration. The large negative values in the Philippine Sea of (c) indicate the large “excessive” decrease in O3 compared to its local consumption.
As such, we can conclude that whether the iodine-chemistry-induced ΔPOH is negative or positive over the ocean is determined by the relative abundance of O3 and the transport length of the O3-abundant air mass before it reaches the target ocean areas as the accumulation of O3 decrease depends on both speed and time of the accumulation, and the latter is possibly more important (Fig. S10). In the Philippine Sea area, O3 concentration is low, and O3 is generally transported far away from the Philippines and the southeastern boundaries, indicating the possibility to experience significant consumption by iodine when the “fresh” O3 arrives there (see Fig. S10c as an example); therefore, it is possible for the dominant effect to be the upwind O3 depletion by iodine along the plume paths, which results in an overall negative iodine-chemistry-induced ΔPOH. On the other hand, the O3 in the Chinese seas and the Sea of Japan has different sources and higher concentrations than that of Philippine areas, possibly resulting in a shorter transport path length before the air mass arrives at ocean areas, and there is therefore a relatively prominent effect of iodine cycling and a relatively weak effect of the upwind O3 depletion by iodine along the plume paths, which results in an overall positive iodine-chemistry-induced ΔPOH. In short, the negative ΔPOH in part of the Philippine Sea results from the more important contribution from the effect of the O3 depletion (local + upwind) than the influence of the additional local production of OH from HOI photolysis.
3.4.4 Summary of the influences of the factors
In summary, we can conclude that marine-emitted halogen species can result in a complicated change in POH in East Asia (Fig. 2), with negative ΔPOH in most areas of the ocean but positive in the northern and southern parts, especially in the nearshore areas. IRR analysis results show that the changes in photolysis of O3 and HOX and the reaction HO2 + Y are the main contributors to ΔPOH (Fig. 3). These three pathways are influenced by different factors related to different species. For the photolysis of O3, both SSA and iodine can significantly decrease it, but with different mechanisms. SSA mainly influences photolysis through a physical factor, by extinction of solar radiation, which in turn can decrease both J(O1D) and O3 concentration. Inorganic iodine can only decrease O3 concentration through enhanced O3 deposition and the atmospheric destruction of O3, but to a much larger extent than that caused by SSA. For the photolysis of HOX, only the cycling of HOI has a significant contribution. For the conversion of HO2 to OH, IO will compete with NO and O3 to consume HO2, resulting a significant decrease in the conversion, while SSA can also lead to a decrease in the conversion, probably through more complicated feedbacks.
By influencing the strengths of the three pathways, these factors determine the pattern of the net ΔPOH. More specifically, the basic pattern of ΔPOH, with the largest relative decrease in the Philippine Sea (Fig. 2b), is controlled by the atmospheric iodine chemistry, which shows a negative ΔPOH value only there (Fig. 6d), while the other marine areas can be roughly seen as the competition between the relatively evenly distributed negative ΔPOH and the positive iodine-chemistry-induced ΔPOH. In the Philippine Sea, the O3 concentration decrease is more than consumed locally, resulting in an “excessive” decrease in O3 and therefore negative ΔPOH. The excessive decrease in O3 illustrates the effect of accumulated upwind O3 depletion by iodine, which results from the high concentration of O3 and possibly the long transport path length of the O3-abundant air mass before reaching the location; whether the emission rates of HOI I2 in the area are low or high is not important. Other areas show more influence of local chemical consumption of O3 (Fig. 9c), which is generally accompanied by the more efficient HOI cycling (and OH production) and therefore positive iodine-chemistry-induced ΔPOH.
In the Bohai Sea, the chemistry of SSA Cl also plays a role in increasing POH, probably due to the higher concentrations of NOx (for Cl activation) and VOCs (for RO2 production) there. Similarly, the NCP also shows a noticeable contribution of SSA Cl chemistry to ΔPOH, but the impact is overshadowed by the negative contribution of the SSA extinction effect to ΔPOH (Figs. 4a, 5a,e).
3.5 Limitations
There are several limitations in our investigation. Our results rely heavily on the current halogen chemistry in CTMs, which is still under development. The uncertainty in the Cl activation and its oxidations of VOCs may have larger impacts, but the recent update of N2O5 uptake in China does not improve Cl chemistry significantly (Dai et al., 2020), and due to the complexity of VOC reactions, there are very few studies focused on the updates of Cl–VOC chemistry. More studies on the parameterization of Cl activation and following Cl–VOC reactions are needed. Recent GEOS-Chem studies improved the uptake of HOBr substantially, but the two major revisions have opposite effects on BrO: increasing HOBr uptake by using more sophisticated parameterizations (Schmidt et al., 2016) and decreasing Br2 yield by adding competition reactions of HOBr with S(IV) (Zhu et al., 2019; Chen et al., 2017; Wang et al., 2021). The uptake of HOBr in our study is simply parameterized with a constant reactive uptake coefficient of 0.1 (Sarwar et al., 2019), which may result in a lower debromination rate. However, since Br chemistry influences OH mainly through the consumption of O3 (Stone et al., 2018), the constraint on modeled BrO is sufficient for our purpose. As shown in Sect. 3.1, modeled BrO is comparable to previous studies (Zhu et al., 2019), indicating the update of HOBr chemistry may not be critical to our results, but more measurements of BrO with seasonality information are needed for further evaluation of the impacts of Br chemistry. Furthermore, the fact that exclusion of SSA debromination through HOBr + Br− reaction in several previous GEOS-Chem studies (Sherwen et al., 2016; Stone et al., 2018; Schmidt et al., 2016) does not decrease BrO burden (Zhu et al., 2019) indicates that there are more complicated interactions between different reactive bromine species (Bry) and more careful checks are needed. The largest limitation comes from the iodine chemistry because it is the main contributor to the change in POH through different pathways. A recent observation study reported a much faster uptake of HOI and release of ICl and IBr (Tham et al., 2021), which may have large impacts on the cycling of HOI. In particular, since the photolysis of ICl and IBr is faster than that of HOI, the iodine atom would be more rapidly recycled and O3 would be more efficiently consumed (Tham et al., 2021) but without producing OH. At the same time, OH production from HOI photolysis would be slower since HOI is more efficiently removed from the system. As a result, the impact of iodine chemistry on OH would be more negative (Kanaya et al., 2002). Related to the iodine chemistry, the enhancement of O3 deposition to the ocean is also not satisfactorily parameterized (Loades et al., 2020; Luhar et al., 2018; Pound et al., 2020). Therefore, incomplete halogen chemistry may limit the representativeness of our results but probably result in a larger impact of halogen chemistry on OH.
On the other hand, the uncertainties in the emission estimations cannot be fully described by using different emission rates, since some discrepancy could be driven by spatial variability of emissions. For example, a new dataset of gridded iodide concentration produced using machine-learning methods based on observations has recently become available (Sherwen et al., 2019), showing different average concentrations and spatial distributions from the two parameterizations used in this study (Chance et al., 2014; MacDonald et al., 2014). Future studies focusing on the impacts of iodine chemistry should include the new dataset, though the reported iodide values by Sherwen et al. (2019) lie between those calculated values used in this study. In addition, the emissions of halocarbons are less understood than SSA and inorganic iodine, and simply scaling the emission rates using global annual fluxes may not capture the variations of emission rates in different areas well. In our domain, because the observations are very sparse, the constraints on the emission estimations are very weak, and more studies are needed to better characterize the halocarbon emissions, especially in the tropical western Pacific, which is potentially important for stratospheric injection.
To examine the impacts of gas and particle exchanges between the ocean and atmosphere on the regional air oxidation capacity, we explore the impact of marine-emitted halogen species on atmospheric OH in East Asia in summer. The net ΔPOH caused by all marine-emitted halogen species has both positive and negative signs in the marine atmosphere, and the positive ΔPOH appears mainly at nearshore areas. The monthly POH is generally decreased over the ocean, with maxima of 10 %–15 % in the Philippine Sea, but is increased in many nearshore areas, with maxima of 7 %–9 % in the Bohai Sea. In the coastal areas of southern China, the monthly change in POH can be comparable to or even larger than that over the ocean, though the relative values are relatively small (up to 3 %–5 %) due to the large absolute value over land. These results indicate a notable impact of marine-emitted halogens on atmospheric oxidation capacity, which could have significant implications for the lifetime of long-lived species such as CH4 (one of the major greenhouse gases) in the long term and the quantity of air pollutants such as O3 in episodic events.
IRR analysis shows that the net effect of ΔPOH is controlled by the competition of three main pathways through different halogen species, while the contributions of other pathways are minor. In addition to the two well-known pathways involving changes in the photolysis of O3 and HOX, the competition on HO2 of XO with NO and O3 also significantly changes the OH production rate. These three main pathways are influenced by different factors that are related to different halogen species. SSA and inorganic iodine gases have the most significant impacts on POH. In this study, in addition to the chemical impacts, the physical impacts of the marine-emitted halogens on OH are also explicitly and quantitatively examined. More specifically, SSA and inorganic iodine decrease POH through physical processes, including the extinction effect of SSA and the enhancement of ozone deposition by oceanic iodine, while generally increasing POH through chemical processes among which the Cl (from SSA) and inorganic iodine chemistry are the most important. The physical impacts are quite comparable to the chemical impacts. On the continent, SSA is the controlling species and its extinction effect leads to the negative ΔPOH in southern China. In the ocean atmosphere, inorganic iodine gases are more important as the complicated iodine chemistry determines the basic pattern of ΔPOH. It is the competition between iodine's enhancing effect on the conversion of HO2 to OH and iodine's decreasing effect on OH production from O3 that determines the sign of iodine-chemistry-induced ΔPOH. The relative strengths of these two opposing effects are controlled by the O3 concentration and the transport path length of an O3-abundant air mass over the ocean, which determine the relative importance of accumulated upwind O3 depletion by iodine (negative effect) compared to the local iodine cycle (positive effect).
Although the uncertainties in estimating the emission rates of different halogen species could influence the magnitude and even the distribution of the halogen-induced change in POH, the response of the main contributors of POH to the individual species and pathway as well as their influencing factors have been quantified, which explains the spatial variability of halogen-induced ΔPOH over East Asia and can also be applied in other circumstances (e.g., different domains, regions, and emission rates).
Hourly O3 concentration data in mainland China were obtained from the national air quality monitoring network (https://air.cnemc.cn:18007/, China National Environmental Monitoring Center, 2022). NCEP datasets are available at https://rda.ucar.edu (NCAR, 2022). The chl a data can be downloaded from the merged products of the GlobColour dataset (https://globcolour.info/, ACRI-ST, 2022).
The supplement related to this article is available online at: https://doi.org/10.5194/acp-22-7331-2022-supplement.
YL designed the study and wrote the paper. SF ran the simulations, conducted analyses, and wrote the paper.
The contact author has declared that neither they nor their co-author has any competing interests.
Publisher's note: Copernicus Publications remains neutral with regard to jurisdictional claims in published maps and institutional affiliations.
We thank the editor and three anonymous reviewers for their valuable comments. We thank the principal investigators of the AERONET sites used in this study for maintaining their stations. We thank Yousuke Sawa for maintaining the Yonaguni station and the Center for Computational Science and Engineering at Southern University of Science and Technology.
This research has been supported by the Guangdong Basic and Applied Basic Research Fund Committee (grant no. 2020B1515130003), the Key Special Project for Introduced Talents Team of Southern Marine Science and Engineering Guangdong Laboratory (Guangzhou, grant no. GML2019ZD0210), the National Natural Science Foundation of China (grant nos. 41961160728, 41575106, and 42105124), the Shenzhen Science and Technology Program (grant no. KQTD20180411143441009), the Key-Area Research and Development Program of Guangdong Province (grant no. 2020B1111360001), the Shenzhen Key Laboratory Foundation (grant no. ZDSYS20180208184349083), and the Guangdong Province Science and Technology Planning Project of China (grant no. 2017A050506003).
This paper was edited by John Orlando and reviewed by Daniel Stone and two anonymous referees.
ACRI-ST: GlobColour Project, https://globcolour.info/, last access: 5 May 2022.
Appel, K. W., Bash, J. O., Fahey, K. M., Foley, K. M., Gilliam, R. C., Hogrefe, C., Hutzell, W. T., Kang, D. W., Mathur, R., Murphy, B. N., Napelenok, S. L., Nolte, C. G., Pleim, J. E., Pouliot, G. A., Pye, H. O. T., Ran, L. M., Roselle, S. J., Sarwar, G., Schwede, D. B., Sidi, F. I., Spero, T. L., and Wong, D. C.: The Community Multiscale Air Quality (CMAQ) model versions 5.3 and 5.3.1: system updates and evaluation, Geosci. Model Dev., 14, 2867–2897, https://doi.org/10.5194/gmd-14-2867-2021, 2021.
Barthel, S., Tegen, I., and Wolke, R.: Do new sea spray aerosol source functions improve the results of a regional aerosol model?, Atmos. Environ., 198, 265–278, https://doi.org/10.1016/j.atmosenv.2018.10.016, 2019.
Carpenter, L. J., MacDonald, S. M., Shaw, M. D., Kumar, R., Saunders, R. W., Parthipan, R., Wilson, J., and Plane, J. M. C.: Atmospheric iodine levels influenced by sea surface emissions of inorganic iodine, Nat. Geosci., 6, 108–111, https://doi.org/10.1038/ngeo1687, 2013.
Carpenter, L. J., Chance, R. J., Sherwen, T., Adams, T. J., Ball, S. M., Evans, M. J., Hepach, H., Hollis, L. D. J., Hughes, C., Jickells, T. D., Mahajan, A., Stevens, D. P., Tinel, L., and Wadley, M. R.: Marine iodine emissions in a changing world, Proc. R. Soc. A, 477, 20200824, https://doi.org/10.1098/rspa.2020.0824, 2021.
Chance, R., Baker, A. R., Carpenter, L., and Jickells, T. D.: The distribution of iodide at the sea surface, Environ. Sci.-Proc. Imp., 16, 1841–1859, https://doi.org/10.1039/c4em00139g, 2014.
Chang, W. N., Heikes, B. G., and Lee, M. H.: Ozone deposition to the sea surface: chemical enhancement and wind speed dependence, Atmos. Environ., 38, 1053–1059, https://doi.org/10.1016/j.atmosenv.2003.10.050, 2004.
Chen, Q., Schmidt, J. A., Shah, V., Jaegle, L., Sherwen, T., and Alexander, B.: Sulfate production by reactive bromine: Implications for the global sulfur and reactive bromine budgets, Geophys. Res. Lett., 44, 7069–7078, https://doi.org/10.1002/2017gl073812, 2017.
China National Environmental Monitoring Center: China National Urban air quality real-time publishing platform, https://air.cnemc.cn:18007/, last access: 5 May 2022.
Dai, J. N., Liu, Y. M., Wang, P., Fu, X., Xia, M., and Wang, T.: The impact of sea-salt chloride on ozone through heterogeneous reaction with N2O5 in a coastal region of south China, Atmos. Environ., 236, 117604, https://doi.org/10.1016/j.atmosenv.2020.117604, 2020.
Emery, C., Liu, Z., Russell, A. G., Odman, M. T., Yarwood, G., and Kumar, N.: Recommendations on statistics and benchmarks to assess photochemical model performance, J. Air Waste Manag. Assoc., 67, 582–598, https://doi.org/10.1080/10962247.2016.1265027, 2017.
Engel, A., Rigby, M., Burkholder, J., Fernandez, R., Froidevaux, L., Hall, B., Hossaini, R., Saito, T., Vollmer, M., and Yao, B. J. S. A. O. O. D.: Update on Ozone-Depleting Substances (ODSs) and Other Gases of Interest to the Montreal Protocol, in: Scientific Assessment of Ozone Depletion: 2018, Global Ozone Research and Monitoring Project–Report No. 58, World Meteorological Organization, Geneva, Switzerland, 1–87, ISBN 978-1-7329317-1-8, 2019.
Fairall, C. W., Helmig, D., Ganzeveld, L., and Hare, J.: Water-side turbulence enhancement of ozone deposition to the ocean, Atmos. Chem. Phys., 7, 443–451, https://doi.org/10.5194/acp-7-443-2007, 2007.
Fan, S., Li, Y., and Liu, C.: Are Environmentally Friendly Fireworks Really ”Green” for Air Quality? A Study from the 2019 National Day Fireworks Display in Shenzhen, Environ. Sci. Technol., 55, 3520–3529, https://doi.org/10.1021/acs.est.0c03521, 2021.
Fittschen, C., Al Ajami, M., Batut, S., Ferracci, V., Archer-Nicholls, S., Archibald, A. T., and Schoemaecker, C.: ROOOH: a missing piece of the puzzle for OH measurements in low-NO environments?, Atmos. Chem. Phys., 19, 349–362, https://doi.org/10.5194/acp-19-349-2019, 2019.
Fuchs, H., Hofzumahaus, A., Rohrer, F., Bohn, B., Brauers, T., Dorn, H. P., Haseler, R., Holland, F., Kaminski, M., Li, X., Lu, K., Nehr, S., Tillmann, R., Wegener, R., and Wahner, A.: Experimental evidence for efficient hydroxyl radical regeneration in isoprene oxidation, Nat. Geosci., 6, 1023–1026, https://doi.org/10.1038/ngeo1964, 2013.
Gantt, B., Kelly, J. T., and Bash, J. O.: Updating sea spray aerosol emissions in the Community Multiscale Air Quality (CMAQ) model version 5.0.2, Geosci. Model Dev., 8, 3733–3746, https://doi.org/10.5194/gmd-8-3733-2015, 2015.
Gao, J., Li, Y., Zhu, B., Hu, B., Wang, L., and Bao, F.: What have we missed when studying the impact of aerosols on surface ozone via changing photolysis rates?, Atmos. Chem. Phys., 20, 10831–10844, https://doi.org/10.5194/acp-20-10831-2020, 2020.
Gao, J., Li, Y., Xie, Z., Hu, B., Wang, L., Bao, F., and Fan, S.: The impact of the aerosol reduction on the worsening ozone pollution over the Beijing-Tianjin-Hebei region via influencing photolysis rates, Sci. Total Environ., 821, 153197, https://doi.org/10.1016/j.scitotenv.2022.153197, 2022.
Gao, M., Gao, J. H., Zhu, B., Kumar, R., Lu, X., Song, S. J., Zhang, Y. Z., Jia, B. X., Wang, P., Beig, G. R., Hu, J. L., Ying, Q., Zhang, H. L., Sherman, P., and McElroy, M. B.: Ozone pollution over China and India: seasonality and sources, Atmos. Chem. Phys., 20, 4399–4414, https://doi.org/10.5194/acp-20-4399-2020, 2020.
Gong, S. L.: A parameterization of sea-salt aerosol source function for sub- and super-micron particles, Global Biogeochem. Cy., 17, 1097, https://doi.org/10.1029/2003gb002079, 2003.
Großmann, K., Friess, U., Peters, E., Wittrock, F., Lampel, J., Yilmaz, S., Tschritter, J., Sommariva, R., von Glasow, R., Quack, B., Kruger, K., Pfeilsticker, K., and Platt, U.: Iodine monoxide in the Western Pacific marine boundary layer, Atmos. Chem. Phys., 13, 3363–3378, https://doi.org/10.5194/acp-13-3363-2013, 2013.
Grythe, H., Strom, J., Krejci, R., Quinn, P., and Stohl, A.: A review of sea-spray aerosol source functions using a large global set of sea salt aerosol concentration measurements, Atmos. Chem. Phys., 14, 1277–1297, https://doi.org/10.5194/acp-14-1277-2014, 2014.
Guenther, A. B., Jiang, X., Heald, C. L., Sakulyanontvittaya, T., Duhl, T., Emmons, L. K., and Wang, X.: The Model of Emissions of Gases and Aerosols from Nature version 2.1 (MEGAN2.1): an extended and updated framework for modeling biogenic emissions, Geosci. Model Dev., 5, 1471–1492, https://doi.org/10.5194/gmd-5-1471-2012, 2012.
Hofzumahaus, A., Rohrer, F., Lu, K. D., Bohn, B., Brauers, T., Chang, C. C., Fuchs, H., Holland, F., Kita, K., Kondo, Y., Li, X., Lou, S. R., Shao, M., Zeng, L. M., Wahner, A., and Zhang, Y. H.: Amplified Trace Gas Removal in the Troposphere, Science, 324, 1702–1704, https://doi.org/10.1126/science.1164566, 2009.
Hu, L., Jacob, D. J., Liu, X., Zhang, Y., Zhang, L., Kim, P. S., Sulprizio, M. P., and Yantosca, R. M.: Global budget of tropospheric ozone: Evaluating recent model advances with satellite (OMI), aircraft (IAGOS), and ozonesonde observations, Atmos. Environ., 167, 323–334, https://doi.org/10.1016/j.atmosenv.2017.08.036, 2017.
Huang, Y., Lu, X., Fung, J. C. H., Sarwar, G., Li, Z., Li, Q., Saiz-Lopez, A., and Lau, A. K. H.: Effect of bromine and iodine chemistry on tropospheric ozone over Asia-Pacific using the CMAQ model, Chemosphere, 262, 127595–127595, https://doi.org/10.1016/j.chemosphere.2020.127595, 2020.
Inamdar, S., Tinel, L., Chance, R., Carpenter, L. J., Sabu, P., Chacko, R., Tripathy, S. C., Kerkar, A. U., Sinha, A. K., Bhaskar, P. V., Sarkar, A., Roy, R., Sherwen, T., Cuevas, C., Saiz-Lopez, A., Ram, K., and Mahajan, A. S.: Estimation of reactive inorganic iodine fluxes in the Indian and Southern Ocean marine boundary layer, Atmos. Chem. Phys., 20, 12093–12114, https://doi.org/10.5194/acp-20-12093-2020, 2020.
Jaeglé, L., Quinn, P. K., Bates, T. S., Alexander, B., and Lin, J. T.: Global distribution of sea salt aerosols: new constraints from in situ and remote sensing observations, Atmos. Chem. Phys., 11, 3137–3157, https://doi.org/10.5194/acp-11-3137-2011, 2011.
Kanaya, Y., Yokouchi, Y., Matsumoto, J., Nakamura, K., Kato, S., Tanimoto, H., Furutani, H., Toyota, K., and Akimoto, H.: Implications of iodine chemistry for daytime HO2 levels at Rishiri Island, Geophys. Res. Lett., 29, 1212, https://doi.org/10.1029/2001gl014061, 2002.
Kelly, J. T., Bhave, P. V., Nolte, C. G., Shankar, U., and Foley, K. M.: Simulating emission and chemical evolution of coarse sea-salt particles in the Community Multiscale Air Quality (CMAQ) model, Geosci. Model Dev., 3, 257–273, https://doi.org/10.5194/gmd-3-257-2010, 2010.
Koenig, T. K., Volkamer, R., Baidar, S., Dix, B., Wang, S. Y., Anderson, D. C., Salawitch, R. J., Wales, P. A., Cuevas, C. A., Fernandez, R. P., Saiz-Lopez, A., Evans, M. J., Sherwen, T., Jacob, D. J., Schmidt, J., Kinnison, D., Lamarque, J. F., Apel, E. C., Bresch, J. C., Campos, T., Flocke, F. M., Hall, S. R., Honomichl, S. B., Hornbrook, R., Jensen, J. B., Lueb, R., Montzka, D. D., Pan, L. L., Reeves, J. M., Schauffler, S. M., Ullmann, K., Weinheimer, A. J., Atlas, E. L., Donets, V., Navarro, M. A., Riemer, D., Blake, N. J., Chen, D. X., Huey, L. G., Tanner, D. J., Hanisco, T. F., and Wolfe, G. M.: BrO and inferred Br-y profiles over the western Pacific: relevance of inorganic bromine sources and a Br-y minimum in the aged tropical tropopause layer, Atmos. Chem. Phys., 17, 15245–15270, https://doi.org/10.5194/acp-17-15245-2017, 2017.
Le Breton, M., Bannan, T. J., Shallcross, D. E., Khan, M. A., Evans, M. J., Lee, J., Lidster, R., Andrews, S., Carpenter, L. J., Schmidt, J., Jacob, D., Harris, N. R. P., Bauguitte, S., Gallagher, M., Bacak, A., Leather, K. E., and Percival, C. J.: Enhanced ozone loss by active inorganic bromine chemistry in the tropical troposphere, Atmos. Environ., 155, 21–28, https://doi.org/10.1016/j.atmosenv.2017.02.003, 2017.
Lelieveld, J., Butler, T. M., Crowley, J. N., Dillon, T. J., Fischer, H., Ganzeveld, L., Harder, H., Lawrence, M. G., Martinez, M., Taraborrelli, D., and Williams, J.: Atmospheric oxidation capacity sustained by a tropical forest, Nature, 452, 737–740, https://doi.org/10.1038/nature06870, 2008.
Lennartz, S. T., Krysztofiak, G., Marandino, C. A., Sinnhuber, B. M., Tegtmeier, S., Ziska, F., Hossaini, R., Kruger, K., Montzka, S. A., Atlas, E., Oram, D. E., Keber, T., Bonisch, H., and Quack, B.: Modelling marine emissions and atmospheric distributions of halocarbons and dimethyl sulfide: the influence of prescribed water concentration vs. prescribed emissions, Atmos. Chem. Phys., 15, 11753–11772, https://doi.org/10.5194/acp-15-11753-2015, 2015.
Li, Q. Y., Borge, R., Sarwar, G., de la Paz, D., Gantt, B., Domingo, J., Cuevas, C. A., and Saiz-Lopez, A.: Impact of halogen chemistry on summertime air quality in coastal and continental Europe: application of the CMAQ model and implications for regulation, Atmos. Chem. Phys., 19, 15321–15337, https://doi.org/10.5194/acp-19-15321-2019, 2019.
Li, Q. Y., Badia, A., Wang, T., Sarwar, G., Fu, X., Zhang, L., Zhang, Q., Fung, J., Cuevas, C. A., Wang, S. S., Zhou, B., and Saiz-Lopez, A.: Potential Effect of Halogens on Atmospheric Oxidation and Air Quality in China, J. Geophys. Res.-Atmos., 125, e2019JD032058, https://doi.org/10.1029/2019jd032058, 2020.
Li, Y., Zhao, X., Deng, X., and Gao, J.: The impact of peripheral circulation characteristics of typhoon on sustained ozone episodes over the Pearl River Delta region, China, Atmos. Chem. Phys., 22, 3861–3873, https://doi.org/10.5194/acp-22-3861-2022, 2022.
Liu, S., Liu, C.-C., Froyd, K. D., Schill, G. P., Murphy, D. M., Bui, T. P., Dean-Day, J. M., Weinzierl, B., Dollner, M., Diskin, G. S., Chen, G., and Gao, R.-S.: Sea spray aerosol concentration modulated by sea surface temperature, P. Natl. Acad. Sci. USA, 118, e2020583118, https://doi.org/10.1073/pnas.2020583118, 2021.
Liu, Y. L., Nie, W., Xu, Z., Wang, T. Y., Wang, R. X., Li, Y. Y., Wang, L., Chi, X. G., and Ding, A. J.: Semi-quantitative understanding of source contribution to nitrous acid (HONO) based on 1 year of continuous observation at the SORPES station in eastern China, Atmos. Chem. Phys., 19, 13289–13308, https://doi.org/10.5194/acp-19-13289-2019, 2019.
Loades, D. C., Yang, M. X., Belli, T. G., Vaughan, A. R., Pound, R. J., Metzger, S., Lee, J. D., and Carpenter, L. J.: Ozone deposition to a coastal sea: comparison of eddy covariance observations with reactive air-sea exchange models, Atmos. Meas. Tech., 13, 6915–6931, https://doi.org/10.5194/amt-13-6915-2020, 2020.
Lu, K. D., Guo, S., Tan, Z. F., Wang, H. C., Shang, D. J., Liu, Y. H., Li, X., Wu, Z. J., Hu, M., and Zhang, Y. H.: Exploring atmospheric free-radical chemistry in China: the self-cleansing capacity and the formation of secondary air pollution, Nat. Sci. Rev., 6, 579–594, https://doi.org/10.1093/nsr/nwy073, 2019a.
Lu, X., Zhang, L., Chen, Y., Zhou, M., Zheng, B., Li, K., Liu, Y., Lin, J., Fu, T. M., and Zhang, Q.: Exploring 2016–2017 surface ozone pollution over China: source contributions and meteorological influences, Atmos. Chem. Phys., 19, 8339–8361, https://doi.org/10.5194/acp-19-8339-2019, 2019b.
Luhar, A. K., Galbally, I. E., Woodhouse, M. T., and Thatcher, M.: An improved parameterisation of ozone dry deposition to the ocean and its impact in a global climate-chemistry model, Atmos. Chem. Phys., 17, 3749–3767, https://doi.org/10.5194/acp-17-3749-2017, 2017.
Luhar, A. K., Woodhouse, M. T., and Galbally, I. E.: A revised global ozone dry deposition estimate based on a new two-layer parameterisation for air-sea exchange and the multi-year MACC composition reanalysis, Atmos. Chem. Phys., 18, 4329–4348, https://doi.org/10.5194/acp-18-4329-2018, 2018.
MacDonald, S. M., Martin, J. C. G., Chance, R., Warriner, S., Saiz-Lopez, A., Carpenter, L. J., and Plane, J. M. C.: A laboratory characterisation of inorganic iodine emissions from the sea surface: dependence on oceanic variables and parameterisation for global modelling, Atmos. Chem. Phys., 14, 5841–5852, https://doi.org/10.5194/acp-14-5841-2014, 2014.
Mahajan, A. S., Li, Q., Inamdar, S., Ram, K., Badia, A., and Saiz-Lopez, A.: Modelling the impacts of iodine chemistry on the northern Indian Ocean marine boundary layer, Atmos. Chem. Phys., 21, 8437–8454, https://doi.org/10.5194/acp-21-8437-2021, 2021.
Monahan, E., Spiel, D., and Davidson, K.: A model of marine aerosol generation via whitecaps and wave disruption, in: Oceanic whitecaps, edited by: Monahan, E. and Niocaill, G. M., Springer, 167–174, https://doi.org/10.1007/978-94-009-4668-2, 1986.
Murphy, B. N., Nolte, C. G., Sidi, F., Bash, J. O., Appel, K. W., Jang, C., Kang, D. W., Kelly, J., Mathur, R., Napelenok, S., Pouliot, G., and Pye, H. O. T.: The Detailed Emissions Scaling, Isolation, and Diagnostic (DESID) module in the Community Multiscale Air Quality (CMAQ) modeling system version 5.3.2, Geosci. Model Dev., 14, 3407–3420, https://doi.org/10.5194/gmd-14-3407-2021, 2021.
NCAR (National Center for Atmospheric Research): Research Data Archive, https://rda.ucar.edu/, last access: 5 May 2022.
Ordóñez, C., Lamarque, J. F., Tilmes, S., Kinnison, D. E., Atlas, E. L., Blake, D. R., Santos, G. S., Brasseur, G., and Saiz-Lopez, A.: Bromine and iodine chemistry in a global chemistry-climate model: description and evaluation of very short-lived oceanic sources, Atmos. Chem. Phys., 12, 1423–1447, https://doi.org/10.5194/acp-12-1423-2012, 2012.
Ovadnevaite, J., Manders, A., de Leeuw, G., Ceburnis, D., Monahan, C., Partanen, A. I., Korhonen, H., and O'Dowd, C. D.: A sea spray aerosol flux parameterization encapsulating wave state, Atmos. Chem. Phys., 14, 1837–1852, https://doi.org/10.5194/acp-14-1837-2014, 2014.
Pound, R. J., Sherwen, T., Helmig, D., Carpenter, L. J., and Evans, M. J.: Influences of oceanic ozone deposition on tropospheric photochemistry, Atmos. Chem. Phys., 20, 4227–4239, https://doi.org/10.5194/acp-20-4227-2020, 2020.
Read, K. A., Mahajan, A. S., Carpenter, L. J., Evans, M. J., Faria, B. V. E., Heard, D. E., Hopkins, J. R., Lee, J. D., Moller, S. J., Lewis, A. C., Mendes, L., McQuaid, J. B., Oetjen, H., Saiz-Lopez, A., Pilling, M. J., and Plane, J. M. C.: Extensive halogen-mediated ozone destruction over the tropical Atlantic Ocean, Nature, 453, 1232–1235, https://doi.org/10.1038/nature07035, 2008.
Rohrer, F., Lu, K. D., Hofzumahaus, A., Bohn, B., Brauers, T., Chang, C. C., Fuchs, H., Haseler, R., Holland, F., Hu, M., Kita, K., Kondo, Y., Li, X., Lou, S. R., Oebel, A., Shao, M., Zeng, L. M., Zhu, T., Zhang, Y. H., and Wahner, A.: Maximum efficiency in the hydroxyl-radical-based self-cleansing of the troposphere, Nat. Geosci., 7, 559–563, https://doi.org/10.1038/ngeo2199, 2014.
Saiz-Lopez, A. and von Glasow, R.: Reactive halogen chemistry in the troposphere, Chem. Soc. Rev., 41, 6448–6472, https://doi.org/10.1039/c2cs35208g, 2012.
Sarwar, G., Simon, H., Bhave, P., and Yarwood, G.: Examining the impact of heterogeneous nitryl chloride production on air quality across the United States, Atmos. Chem. Phys., 12, 6455–6473, https://doi.org/10.5194/acp-12-6455-2012, 2012.
Sarwar, G., Simon, H., Xing, J., and Mathur, R.: Importance of tropospheric ClNO2 chemistry across the Northern Hemisphere, Geophys. Res. Lett., 41, 4050–4058, https://doi.org/10.1002/2014gl059962, 2014.
Sarwar, G., Gantt, B., Schwede, D., Foley, K., Mathur, R., and Saiz-Lopez, A.: Impact of Enhanced Ozone Deposition and Halogen Chemistry on Tropospheric Ozone over the Northern Hemisphere, Environ. Sci. Technol., 49, 9203–9211, https://doi.org/10.1021/acs.est.5b01657, 2015.
Sarwar, G., Gantt, B., Foley, K., Fahey, K., Spero, T. L., Kang, D. W., Mathur, R., Foroutan, H., Xing, J., Sherwen, T., and Saiz-Lopez, A.: Influence of bromine and iodine chemistry on annual, seasonal, diurnal, and background ozone: CMAQ simulations over the Northern Hemisphere, Atmos. Environ., 213, 395–404, https://doi.org/10.1016/j.atmosenv.2019.06.020, 2019.
Schmidt, J. A., Jacob, D. J., Horowitz, H. M., Hu, L., Sherwen, T., Evans, M. J., Liang, Q., Suleiman, R. M., Oram, D. E., Le Breton, M., Percival, C. J., Wang, S., Dix, B., and Volkamer, R.: Modeling the observed tropospheric BrO background: Importance of multiphase chemistry and implications for ozone, OH, and mercury, J. Geophys. Res.- Atmos., 121, 11819–11835, https://doi.org/10.1002/2015jd024229, 2016.
Seinfeld, J. H. and Pandis, S. N.: Atmospheric chemistry and physics: from air pollution to climate change, 3rd Edn., John Wiley & Sons, ISBN 9781119221166, 2016.
Sekiya, T., Kanaya, Y., Sudo, K., Taketani, F., Iwamoto, Y., Aita, M. N., Yamamoto, A., and Kawamoto, K.: Global Bromine- and Iodine-Mediated Tropospheric Ozone Loss Estimated Using the CHASER Chemical Transport Model, Sola, 16, 220–227, https://doi.org/10.2151/sola.2020-037, 2020.
Sherwen, T., Schmidt, J. A., Evans, M. J., Carpenter, L. J., Grossmann, K., Eastham, S. D., Jacob, D. J., Dix, B., Koenig, T. K., Sinreich, R., Ortega, I., Volkamer, R., Saiz-Lopez, A., Prados-Roman, C., Mahajan, A. S., and Ordonez, C.: Global impacts of tropospheric halogens (Cl, Br, I) on oxidants and composition in GEOS-Chem, Atmos. Chem. Phys., 16, 12239–12271, https://doi.org/10.5194/acp-16-12239-2016, 2016.
Sherwen, T., Chance, R. J., Tinel, L., Ellis, D., Evans, M. J., and Carpenter, L. J.: A machine-learning-based global sea-surface iodide distribution, Earth Syst. Sci. Data, 11, 1239–1262, https://doi.org/10.5194/essd-11-1239-2019, 2019.
Simpson, W. R., Brown, S. S., Saiz-Lopez, A., Thornton, J. A., and von Glasow, R.: Tropospheric Halogen Chemistry: Sources, Cycling, and Impacts, Chem. Rev., 115, 4035–4062, https://doi.org/10.1021/cr5006638, 2015.
Stone, D., Whalley, L. K., and Heard, D. E.: Tropospheric OH and HO2 radicals: field measurements and model comparisons, Chem. Soc. Rev., 41, 6348–6404, https://doi.org/10.1039/c2cs35140d, 2012.
Stone, D., Sherwen, T., Evans, M. J., Vaughan, S., Ingham, T., Whalley, L. K., Edwards, P. M., Read, K. A., Lee, J. D., Moller, S. J., Carpenter, L. J., Lewis, A. C., and Heard, D. E.: Impacts of bromine and iodine chemistry on tropospheric OH and HO2: comparing observations with box and global model perspectives, Atmos. Chem. Phys., 18, 3541–3561, https://doi.org/10.5194/acp-18-3541-2018, 2018.
Tan, Z. F., Lu, K. D., Hofzumahaus, A., Fuchs, H., Bohn, B., Holland, F., Liu, Y. H., Rohrer, F., Shao, M., Sun, K., Wu, Y. S., Zeng, L. M., Zhang, Y. S., Zou, Q., Kiendler-Scharr, A., Wahner, A., and Zhang, Y. H.: Experimental budgets of OH, HO2, and RO2 radicals and implications for ozone formation in the Pearl River Delta in China 2014, Atmos. Chem. Phys., 19, 7129–7150, https://doi.org/10.5194/acp-19-7129-2019, 2019.
Tham, Y. J., He, X.-C., Li, Q., Cuevas, C. A., Shen, J., Kalliokoski, J., Yan, C., Iyer, S., Lehmusjärvi, T., Jang, S., Thakur, R. C., Beck, L., Kemppainen, D., Olin, M., Sarnela, N., Mikkilä, J., Hakala, J., Marbouti, M., Yao, L., Li, H., Huang, W., Wang, Y., Wimmer, D., Zha, Q., Virkanen, J., Spain, T. G., O'Doherty, S., Jokinen, T., Bianchi, F., Petäjä, T., Worsnop, D. R., Mauldin, R. L., Ovadnevaite, J., Ceburnis, D., Maier, N. M., Kulmala, M., O'Dowd, C., Dal Maso, M., Saiz-Lopez, A., and Sipilä, M.: Direct field evidence of autocatalytic iodine release from atmospheric aerosol, P. Natl. Acad. Sci. USA, 118, e2009951118, https://doi.org/10.1073/pnas.2009951118, 2021.
Torseth, K., Aas, W., Breivik, K., Fjaeraa, A. M., Fiebig, M., Hjellbrekke, A. G., Myhre, C. L., Solberg, S., and Yttri, K. E.: Introduction to the European Monitoring and Evaluation Programme (EMEP) and observed atmospheric composition change during 1972–2009, Atmos. Chem. Phys., 12, 5447–5481, https://doi.org/10.5194/acp-12-5447-2012, 2012.
Wang, X., Jacob, D. J., Eastham, S. D., Sulprizio, M. P., Zhu, L., Chen, Q. J., Alexander, B., Sherwen, T., Evans, M. J., Lee, B. H., Haskins, J. D., Lopez-Hilfiker, F. D., Thornton, J. A., Huey, G. L., and Liao, H.: The role of chlorine in global tropospheric chemistry, Atmos. Chem. Phys., 19, 3981–4003, https://doi.org/10.5194/acp-19-3981-2019, 2019.
Wang, X., Jacob, D. J., Fu, X., Wang, T., Le Breton, M., Hallquist, M., Liu, Z. R., McDuffie, E. E., and Liao, H.: Effects of Anthropogenic Chlorine on PM2.5 and Ozone Air Quality in China, Environ. Sci. Technol., 54, 9908–9916, https://doi.org/10.1021/acs.est.0c02296, 2020.
Wang, X., Jacob, D. J., Downs, W., Zhai, S., Zhu, L., Shah, V., Holmes, C. D., Sherwen, T., Alexander, B., Evans, M. J., Eastham, S. D., Neuman, J. A., Veres, P. R., Koenig, T. K., Volkamer, R., Huey, L. G., Bannan, T. J., Percival, C. J., Lee, B. H., and Thornton, J. A.: Global tropospheric halogen (Cl, Br, I) chemistry and its impact on oxidants, Atmos. Chem. Phys., 21, 13973–13996, https://doi.org/10.5194/acp-21-13973-2021, 2021.
Whalley, L. K., Furneaux, K. L., Goddard, A., Lee, J. D., Mahajan, A., Oetjen, H., Read, K. A., Kaaden, N., Carpenter, L. J., Lewis, A. C., Plane, J. M. C., Saltzman, E. S., Wiedensohler, A., and Heard, D. E.: The chemistry of OH and HO2 radicals in the boundary layer over the tropical Atlantic Ocean, Atmos. Chem. Phys., 10, 1555–1576, https://doi.org/10.5194/acp-10-1555-2010, 2010.
Whalley, L. K., Slater, E. J., Woodward-Massey, R., Ye, C., Lee, J. D., Squires, F., Hopkins, J. R., Dunmore, R. E., Shaw, M., Hamilton, J. F., Lewis, A. C., Mehra, A., Worrall, S. D., Bacak, A., Bannan, T. J., Coe, H., Percival, C. J., Ouyang, B., Jones, R. L., Crilley, L. R., Kramer, L. J., Bloss, W. J., Vu, T., Kotthaus, S., Grimmond, S., Sun, Y., Xu, W., Yue, S., Ren, L., Acton, W. J. F., Hewitt, C. N., Wang, X., Fu, P., and Heard, D. E.: Evaluating the sensitivity of radical chemistry and ozone formation to ambient VOCs and NOx in Beijing, Atmos. Chem. Phys., 21, 2125–2147, https://doi.org/10.5194/acp-21-2125-2021, 2021.
Yao, T., Li, Y., Gao, J., Fung, J. C. H., Wang, S., Li, Y., Chan, C. K., and Lau, A. K. H.: Source apportionment of secondary organic aerosols in the Pearl River Delta region: Contribution from the oxidation of semi-volatile and intermediate volatility primary organic aerosols, Atmos. Environ., 222, 117111, https://doi.org/10.1016/j.atmosenv.2019.117111, 2020.
Yin, S. S., Zheng, J. Y., Lu, Q., Yuan, Z. B., Huang, Z. J., Zhong, L. J., and Lin, H.: A refined 2010-based VOC emission inventory and its improvement on modeling regional ozone in the Pearl River Delta Region, China, Sci. Total Environ., 514, 426–438, https://doi.org/10.1016/j.scitotenv.2015.01.088, 2015.
Yu, C., Wang, Z., Xia, M., Fu, X., Wang, W., Tham, Y. J., Chen, T., Zheng, P., Li, H., Shan, Y., Wang, X., Xue, L., Zhou, Y., Yue, D., Ou, Y., Gao, J., Lu, K., Brown, S. S., Zhang, Y., and Wang, T.: Heterogeneous N2O5 reactions on atmospheric aerosols at four Chinese sites: improving model representation of uptake parameters, Atmos. Chem. Phys., 20, 4367–4378, https://doi.org/10.5194/acp-20-4367-2020, 2020.
Yu, Z. and Li, Y.: Marine volatile organic compounds and their impacts on marine aerosol-A review, Sci. Total Environ., 768, 145054, https://doi.org/10.1016/j.scitotenv.2021.145054, 2021.
Zheng, J. Y., Zhang, L. J., Che, W. W., Zheng, Z. Y., and Yin, S. S.: A highly resolved temporal and spatial air pollutant emission inventory for the Pearl River Delta region, China and its uncertainty assessment, Atmos. Environ., 43, 5112–5122, https://doi.org/10.1016/j.atmosenv.2009.04.060, 2009.
Zhu, L., Jacob, D. J., Eastham, S. D., Sulprizio, M. P., Wang, X., Sherwen, T., Evans, M. J., Chen, Q. J., Alexander, B., Koenig, T. K., Volkamer, R., Huey, L. G., Le Breton, M., Bannan, T. J., and Percival, C. J.: Effect of sea salt aerosol on tropospheric bromine chemistry, Atmos. Chem. Phys., 19, 6497–6507, https://doi.org/10.5194/acp-19-6497-2019, 2019.
Ziska, F., Quack, B., Abrahamsson, K., Archer, S. D., Atlas, E., Bell, T., Butler, J. H., Carpenter, L. J., Jones, C. E., Harris, N. R. P., Hepach, H., Heumann, K. G., Hughes, C., Kuss, J., Kruger, K., Liss, P., Moore, R. M., Orlikowska, A., Raimund, S., Reeves, C. E., Reifenhauser, W., Robinson, A. D., Schall, C., Tanhua, T., Tegtmeier, S., Turner, S., Wang, L., Wallace, D., Williams, J., Yamamoto, H., Yvon-Lewis, S., and Yokouchi, Y.: Global sea-to-air flux climatology for bromoform, dibromomethane and methyl iodide, Atmos. Chem. Phys., 13, 8915–8934, https://doi.org/10.5194/acp-13-8915-2013, 2013.