the Creative Commons Attribution 4.0 License.
the Creative Commons Attribution 4.0 License.
 | 07 Jun 2022
Impact of eastern and central Pacific El Niño on lower tropospheric ozone in China
Zhongjing Jiang
Tropospheric ozone, as a critical atmospheric component, plays an important role in influencing radiation equilibrium and ecological health. It is affected not only by anthropogenic activities but also by natural climate variabilities. Here we examine the tropospheric ozone changes in China associated with the eastern Pacific (EP) and central Pacific (CP) El Niño using satellite observations from 2007 to 2017 and GEOS-Chem simulations from 1980 to 2017. GEOS-Chem reasonably reproduced the satellite-retrieved lower tropospheric ozone (LTO) changes despite a slight underestimation. In general, both types of El Niño exert negative impacts on LTO concentration in China, except for southeastern China during the pre-CP El Niño autumn and post-EP El Niño summer. Ozone budget analysis further reveals that for both events, LTO changes are dominated by the transport processes controlled by circulation patterns and the chemical processes influenced by local meteorological anomalies associated with El Niño, especially the changes in solar radiation and relative humidity. The differences between EP- and CP-induced LTO changes mostly lie in southern China. The different strengths, positions, and duration of the western North Pacific anomalous anticyclone induced by tropical warming are likely responsible for the different EP and CP LTO changes. During the post-EP El Niño summer, the Indian Ocean capacitor effect also plays an important role in mediating LTO changes over southern China.
- Article
(9691 KB) - Full-text XML
-
Supplement
(4841 KB) - BibTeX
- EndNote


Tropospheric ozone is an important greenhouse gas and a major air pollutant affecting human health and the ecosystem (Fleming et al., 2018; Maji et al., 2019; Mills et al., 2018). It is produced from the photochemical oxidation of carbon monoxide (CO) and volatile organic compounds (VOCs) in the presence of nitrogen oxides (NOx) and sunlight. Tropospheric ozone concentration is largely affected by anthropogenic emissions, regional transport, and local meteorological conditions. Meteorological variables, such as solar radiation, relative humidity, and temperature, can influence the ozone precursor emissions and photochemical reaction rates (Guenther et al., 2012; Jeong et al., 2018). Thus, El Niño–Southern Oscillation (ENSO), as one of the most prominent modes of interannual climate variabilities, can influence ozone concentration by affecting the local meteorological fields and modulating the ozone distribution through changes in atmospheric circulation (Bjerknes, 1969; Chandra et al., 1998; Oman et al., 2013; Sudo and Takahashi, 2001).
Because ENSO is a tropical signal, the majority of previous studies focus on discussing the impacts of ENSO on tropical tropospheric ozone (Oman et al., 2011; Ziemke et al., 2010; Ziemke and Chandra, 2003). A few studies demonstrated that the influence of ENSO on tropospheric ozone could also extend to subtropics and mid-latitudes. Over Southeast Asia, Marlier et al. (2013) show that during the strong El Niño years, fires contribute up to 50 ppbv in annual average ozone surface concentrations near fire sources. Over the USA, Xu et al. (2017) examined the impact of ENSO on surface ozone from 1993 to 2013 and found that the monthly ozone decreased by about 1.8 ppbv per standard deviation of the Niño 3.4 index during El Niño years. They found significant spatial dependence and seasonality of ENSO's influence on ozone. ENSO affects surface ozone via different processes during warm or cold seasons in different regions in the USA. As for China, a few studies have discussed the impact of ENSO on the total column or tropospheric column ozone concentration over part of China, such as Tibet, or included China as part of their study regions (Koumoutsaris et al., 2008; Singh et al., 2002; Xu et al., 2018; Zou et al., 2001). However, studies that specifically have focused on the influence of ENSO on tropospheric ozone over China are still limited. Yet, ENSO, in its developing and decaying phases, may profoundly impact temperature and precipitation in China (Cao et al., 2017; Fang et al., 2021; Li et al., 2021, 2018; Xu et al., 2018), and can further affect ozone concentrations. In view of the severe ozone pollution in China and the substantial role of natural impacts, it is essential to clarify how ozone concentrations in China respond to ENSO.
On the other hand, increasing studies have noted the different flavors of ENSO. A widely accepted view is to categorize El Niño into the eastern Pacific (EP) and central Pacific (CP) El Niño (Ashok et al., 2007; Yeh et al., 2009), whose positive sea surface temperature (SST) anomalies are located over the eastern and central Pacific, respectively. Due to the different generation mechanisms (Yu et al., 2010) of the two types of El Niño, they can induce distinct changes in climate or synoptic weather in the mid-to-high latitudes as well as the tropics (Shi and Qian, 2018; Yu et al., 2012). The impact of ENSO on East Asia climate is known as the “Pacific-East Asia teleconnection”, including the central Pacific cyclone, western North Pacific anticyclone, and the northeastern Asian cyclone (Wang et al., 2000; Zhang et al., 2011). During the developing autumn, the anomalous atmospheric circulation over the western North Pacific is nearly opposite in response to EP and CP El Niño. The EP El Niño is generally accompanied by an anticyclone, while the CP type usually has a cyclone over the western North Pacific. Yu and Sun (2018) found that East Asia winter monsoon is strong for EP ENSO but weak for CP ENSO. Feng et al. (2011) showed that during the decaying phases of El Niño, the EP type generally corresponds to the anomalous western Pacific anticyclone and brings ample moisture to southern China, contributing to the increased rainfall over these regions. However, the CP type generally has a weak western Pacific anticyclone and thus corresponds to the drier conditions over southern China. Except for the rainfall patterns, other studies also show that different types of El Niño can induce different changes in tropical cyclone genesis and water vapor transport over China (Feng et al., 2011; Li et al., 2014; Wang and Wang, 2013). Accompanied by these meteorological changes, the two types of El Niño are also likely to exert different impacts on pollution conditions. However, previous studies on the response of ozone to ENSO generally used the Niño 3.4 index (Olsen et al., 2016; Oman et al., 2013) or the Southern Oscillation index (Koumoutsaris et al., 2008; Ziemke and Chandra, 2003) to represent the intensity of ENSO, but the difference between the two types of El Niño is rarely considered. Some other research explores the teleconnections of different types of El Niño with climate anomalies and haze pollution in China (Gao et al., 2020; Ren et al., 2018; Xu et al., 2018; Yu et al., 2019, 2020), whereas few studies have discussed the teleconnection between ozone and different El Niño types, which is thus the focus of this study.
In this paper, we investigate the changes of tropospheric ozone in China associated with EP and CP El Niño, using satellite observations and the GEOS-Chem chemistry transport model simulations. This study aims to explore how El Niño influences the lower tropospheric ozone in China to shed light on the ozone air quality control on the interannual timescale. We hope this study can also improve our understanding of the mechanism of teleconnections between ENSO and tropospheric ozone concentration in mid-latitudes.
2.1 The classification of eastern and central Pacific El Niño
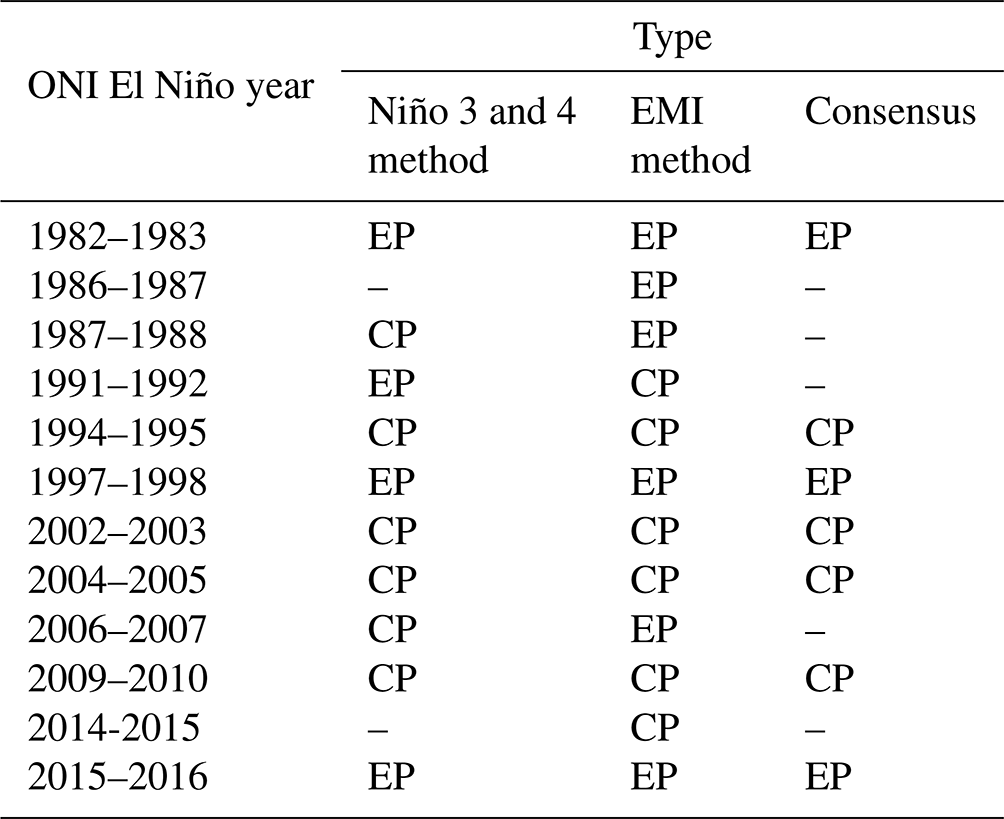
To distinguish the type of El Niño, we first use the Oceanic Niño index (ONI) from the Climate Prediction Center (CPC) of the National Oceanic and Atmospheric Administration (NOAA) to filter out El Niño events. The ONI is defined as the 3-month running mean of ERSST.v5 SST anomalies in the Niño 3.4 region (5∘ N–5∘ S, 120–170∘ W), based on centered 30-year base periods updated every 5 years. An El Niño event is defined when the ONI is greater than or equal to 0.5 ∘C for a period of at least five consecutive overlapping seasons. Then we combine two methods, namely the Niño 3 and 4 method in Yeh et al. (2009) and the ENSO Modoki index (EMI) method in Ashok et al. (2007), to distinguish between EP and CP El Niño. When the two methods show consensus results, we define it as a typical EP or CP event.
2.1.1 Niño 3 and 4 method
We first adopt the same Niño 3 and 4 method in Yeh et al. (2009). This classification is based on the comparison between boreal winter (DJF) seasonal mean Niño 3 and Niño 4 indices. The DJF Niño 3 SST index is defined as the DJF seasonal SST anomaly in the Niño 3 region (150–90∘ W, 5∘ N–5∘ S), and the DJF Niño 4 SST index is defined as the DJF seasonal SST anomaly in the Niño 4 region (160∘ E–150∘ W, 5∘ N–5∘ S). The first step is to select the years when the DJF Niño 3 and Niño 4 indices are both greater than 0.5 ∘C. Then we compare the DJF Niño 3 and Niño 4 SST indices. When the DJF Niño 3 SST index is greater than the DJF Niño 4 SST index, it is defined as an EP El Niño event; otherwise, as a CP El Niño event.
2.1.2 El Niño Modoki index method
Ashok et al. (2007) derived an El Niño Modoki index (EMI) to capture whether there is a typical CP-type event:
where [SSTA]A, [SSTA]B, and [SSTA]C represent the area-averaged SST anomaly of regions A (165∘ E–140∘ W, 10∘ S–10∘ N), B (110–70∘ W, 15∘ S–5∘ N), and C (125–145∘ E, 10∘ S–20∘ N), respectively. We call a CP El Niño event “typical” when the index amplitude is equal to or greater than 0.7σ, where σ is the seasonal standard deviation.
The classification results of EP and CP El Niño of the total 12 events from 1980 to 2017 are shown in Table 1.
Table 1The classification results of EP and CP El Niño of the total 12 El Niño events from 1980 to 2017 using the Niño 3 and 4 method and the EMI method. The en dash means that the method cannot distinguish the type of the El Niño event.
2.2 Satellite-retrieved ozone and meteorological data
Ozone abundance in the atmosphere can be measured from space using different remote-sensing techniques. Frequently used tropospheric column ozone datasets include the OMI/MLS carried by AURA and the infrared atmospheric sounding interferometer (IASI) carried by the MetOp satellites. As we focus on lower tropospheric ozone in this study, we chose to use IASI, which can retrieve the ozone from the surface to 6 km. In addition, the IASI is a superior choice considering the spatial coverage, resolution, and data quality. The IASI is a thermal infrared Fourier transform spectrometer onboard the MetOp-A and B satellites. As a spaceborne nadir-viewing instrument, it probes the troposphere using the thermal infrared spectral range, and the atmospheric data are further retrieved by inversion algorithms (Boynard et al., 2009, 2016). The IASI-A and -B instruments have been operationally providing atmospheric products since October 2007 and March 2013, respectively. Ozone monthly gridded data are available on https://cds.climate.copernicus.eu/cdsapp#!/dataset/satellite-ozone-v1?tab=form (last access: 8 November 2021). We use the ozone data from September 2007 to Autumn 2017, mostly from MetOp-A v0001, with substitutes from MetOp-B v0001 for several missing months in 2015.
Meteorological fields for 1980–2017 are obtained from the Goddard Earth Observing System (MERRA-2) database (Bosilovich et al., 2016), which is the current operational met data product from the Global Modeling and Assimilation Office (GMAO). The data are available at http://ftp.as.harvard.edu/gcgrid/data/GEOS_2x2.5/MERRA2/ (last access: 8 November 2021). Meteorological variables used in Sect. 3.2 include surface downwelling solar radiation (SR), relative humidity (RH), total precipitation (TP), temperature (T), sea level pressure (SLP), and wind fields. As for multilevel variables, including RH, T, and winds, we calculate the 0–6 km column averages of these variables to be consistent with column ozone concentration, whereas SR, TP, and SLP are single-level variables.
2.3 GEOS-Chem simulations
The GEOS-Chem (GC) chemical transport model (Bey et al., 2001; v12.3.2; http://geos-chem.org (last access: 8 November 2021) is used to explore the EP and CP El Niño-related tropospheric ozone changes. We use the standard chemistry mechanism, which includes both troposphere and stratosphere. The Universal Tropospheric–Stratospheric Chemistry eXtension (UCX) mechanism developed by Eastham et al. (2014) combines tropospheric and stratospheric reactions into a single chemistry mechanism. The model is driven by MERRA-2 meteorological fields with 72 vertical levels and 2 × 2.5∘ horizontal resolution. We first perform a historical run from 1980 to 2017 with anthropogenic emissions fixed at the year 2000, so the difference among different events is only caused by the meteorological fields. A drawback of this setting is that the biomass burning is also fixed at the year 2000; however, the biogenic emission will still change as it interacts with meteorology.
The transient ozone simulation is further validated against tropospheric ozone within the same altitude range retrieved by IASI. Because IASI only retrieves column ozone concentration between 0 and 6 km, our comparison and analysis also focus on 0–6 km integrated column ozone concentration, referred to as lower tropospheric ozone (LTO) hereafter. This focus on column ozone concentration can also reduce the impact of mismatch in anthropogenic emission between IASI and GC, which mainly influence the near-surface ozone concentration. As satellite observation starts in October 2007, to ensure comparability, we select the 2015–2016 and 2009–2010 events to represent EP and CP El Niño, respectively. A 10-year (September 2007–August 2017) seasonal average is used as the climatological state. The missing month of IASI data in September 2007 is filled as NaN in our calculation. As we focus on the ozone changes, the bias induced by the mismatch of anthropogenic emissions is further mitigated by subtracting the climatological state. Therefore, we expect the ozone changes in ENSO years to show similar patterns during the ENSO years between GC simulation and IASI observation. Figure S1 in the Supplement shows the seasonal mean SST anomalies for the two periods selected, which correspond well to EP (2015–2016) and CP (2009–2010) El Niño patterns. The comparison results are shown in Fig. 1 and discussed in Sect. 3.1.
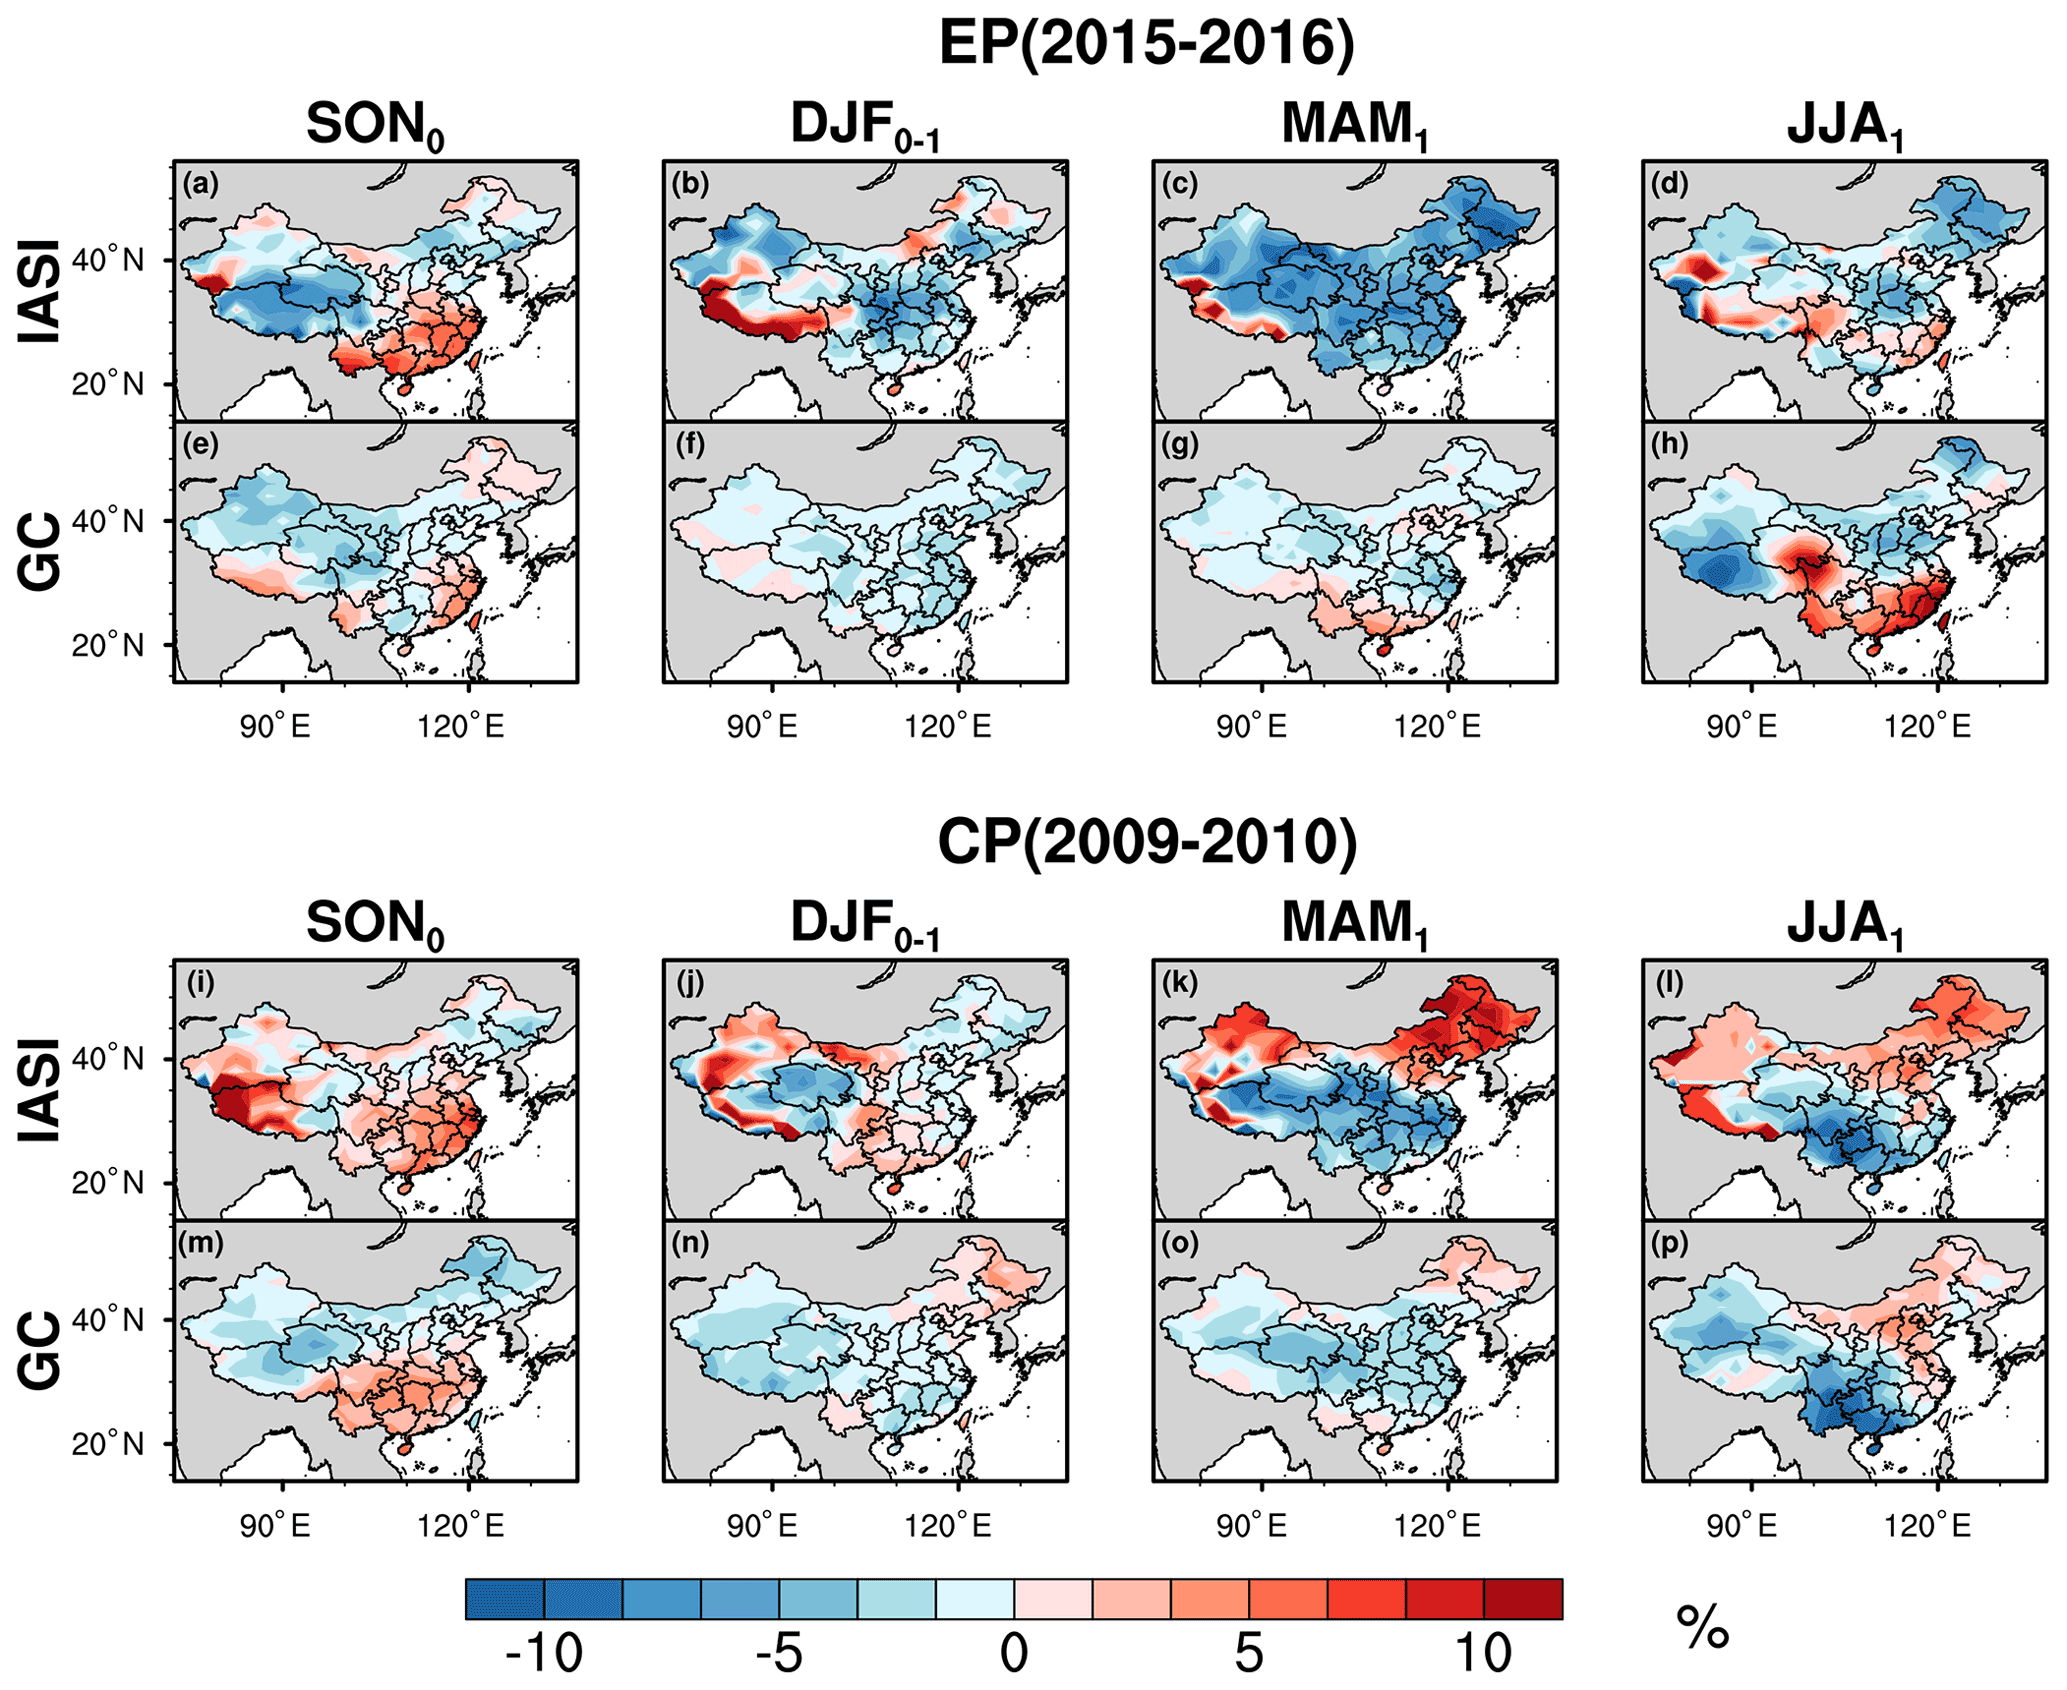
Figure 1The changes (in %) relative to climatology state (September 2007–August 2017) of satellite-observed (IASI) and model-simulated (GC) tropospheric column ozone (0–6 km; in DU) for the four seasons in EP (2015–2016) and CP (2009–2010) El Niño years.
To further distinguish the ozone changes between EP and CP El Niño, we also perform three composite model simulations driven by the composite meteorological fields of the four seasons of (1) the three most typical EP events (1982–1983, 1997–1998, 2015–2016), (2) the four most typical CP events (1994–1995, 2002–2003, 2004–2005, 2009–2010), and (3) a 30 year averaged climatology (September 1985–August 2015). Figure S2 in the Supplement shows the composites of seasonal mean SST anomalies, which well corresponded to EP and CP El Niño. To save computing resources and time, we calculate the seasonal mean and archive it in daily data files; each season was run for 10 d with the same seasonal-averaged meteorological fields every day. These three simulations started on the same day from a previous transient run to save time for spin-up. In this set of composite simulations, the difference between the result of simulations 1 and 3 (simulations 2 and 3) can represent the ozone changes driven by EP (CP) meteorological changes.
Moreover, to explain the physical and chemical drivers of the ozone changes, we analyze the composite meteorological fields to check the ENSO-related meteorological changes. We also diagnose the 0–6 km ozone budget changes of different model processes and quantify the absolute contribution of each process. These budget diagnoses are calculated by taking the difference in 0–6 km vertically integrated column ozone mass before and after major GEOS-Chem simulation components, including chemistry, transport, mixing, and convection, at each time step.
3.1 Lower tropospheric ozone changes associated with EP and CP El Niño
An ENSO event usually develops in autumn (September–October–November, SON0), reaches its peak in winter (December–January–February, DJF0−1), and decays in the following spring (March-April-May, MAM1) and summer (June–July–August, JJA1) (Xu et al., 2017). We denote the ENSO developing year as year 0 and the following year as year 1. We first compare the climatology state for ozone (Fig. S3 in the Supplement) between observation and simulation. Model performance is comparable to that in previous modeling works (Dang et al., 2021; Lu et al., 2019; Ni et al., 2018). The bias mainly comes from the resolution, chemical mechanism, microphysics processes, and site representativeness (Sun et al., 2019; Young et al., 2018). Then we examine the change in satellite-retrieved and simulated 0–6 km column ozone during the 2015–2016 EP and 2009–2010 CP events relative to the climatology state (Fig. 1) to validate the model response to ENSO-related signals.
The EP El Niño generally exerts negative effects on LTO in China in both observation and simulation, except for a dipole mode change over southern China during pre-EP autumn and post-EP summer. Satellite-retrieved LTO shows an increase in the south and a decrease in the north in autumn, whereas this dipole mode is obscure in the simulation. In winter and spring, both the satellite-retrieved and simulated LTO exhibit coherent decreases throughout China, but the intensity in the model is much smaller. In summer, the observation still shows declines over most regions except for a slight increase over the southeast coastal area and southwestern China. The simulation shows a similar pattern but with much stronger positive signals over southern China. In contrast, in CP El Niño, there are more prominent LTO increases, such as over southern China in autumn, northeastern China in spring, and northern China in summer. In autumn, the satellite observation and simulation both exhibit a dipole mode change in the north and south, with LTO decrease over northern and increase over southern China. In winter, the observed and simulated LTO both show a reverse change with slightly positive and negative signals. The LTO changes in spring and summer are consistent between observation and simulation.
In general, the LTO changes range from −1 to 1 DU (Fig. S4 in the Supplement), accounting for 5 %–10 % of the 0–25 DU mean range. The spatial patterns of the simulated and observed LTO changes agree well, despite an overall underestimation by the model. This underestimation can be explained by the fixed biomass-burning emission in the simulation that weakens the sensitivity of tropospheric ozone to ENSO, as this leads to milder changes in ozone precursors such as carbon monoxide. The underestimation in spring and summer is the most significant in high-latitude areas, such as northeastern China, for both EP and CP events. This deviation probably represents the interferences of other high-latitude climate variabilities. Another reason is that the model underestimates the average ozone concentration at high latitudes in winter and spring (Fig. S3), which leads to less ozone transport from polar regions to northern China in the model. The IASI-retrieved data exhibit high ozone concentration in the Arctic during winter and spring (Fig. S3f, g); this phenomenon is also shown in previous studies (Cooper et al., 2014). However, the GEOS-Chem simulation did not capture the high values in polar regions. A possible explanation for this underestimation is that the Brewer–Dobson circulation (BDC) may be insufficiently represented in the model. The BDC consists of an upward transport branch across the tropopause in the tropics and has a strong poleward and downward circulation branch in the winter hemisphere (Hu et al., 2017), which contributes to the high LTO concentration in polar regions through the stratosphere–troposphere exchange. Another potential reason for the underestimation is due to the imprecise halogen chemistry in GEOS-Chem. Wang et al. (2021) point out that the halogen chemistry can worsen the underestimation of tropospheric ozone in the Northern Hemisphere by halogen-catalyzed loss. Thus, the ozone transport from polar regions to northern China can be much less in the model. The overall consistency between simulated and observed LTO changes gives us the confidence to use the model for composite analysis, as the satellite record only covers limited El Niño events.
To include more El Niño events and check the response of ozone to meteorological fields, we further use the composite meteorological fields of three EP events and four CP events to drive the GEOS-Chem model. Figure 2 shows the LTO changes in China during different seasons of the EP and CP El Niño. The patterns agree well with the composite results from historical simulations (Fig. S7 in the Supplement) but show stronger changing magnitudes due to the more direct response of ozone to meteorological changes. It is seen that LTO decreases over most regions in both EP and CP types in the range of 5 %–10% (2 %–5% in the composite of historical run), whereas only some regional increases are seen in pre-El Niño autumn and post-El Niño summer. During winter and spring, LTO decreases consistently, reaching ∼ 10 % for western and northern China. The changes associated with CP El Niño are more extensive, spatially uniform, and stronger than EP. For summer, however, EP appears to correspond to a more substantial LTO decrease, especially for the northern and southwestern parts. The region exhibiting the most LTO change differences between EP and CP events is southern China. The differences between EP and CP patterns will be further examined in the next section. It appears that the seasonal alternation of LTO changes in southern China may represent the extension of the remarkable ozone changes over the tropical regions. During the EP (CP) El Niño developing, sustaining, and first decaying periods, there are significant dipolar (tripolar) modes of ozone changes over the tropical Pacific area (Fig. S5 in the Supplement), which is consistent with the result of previous studies (Chandra et al., 1998; Oman et al., 2013). These ozone changing patterns correspond well with solar radiation changes (Fig. S6 in the Supplement) since they can modulate the photolysis rates and biogenic emissions.
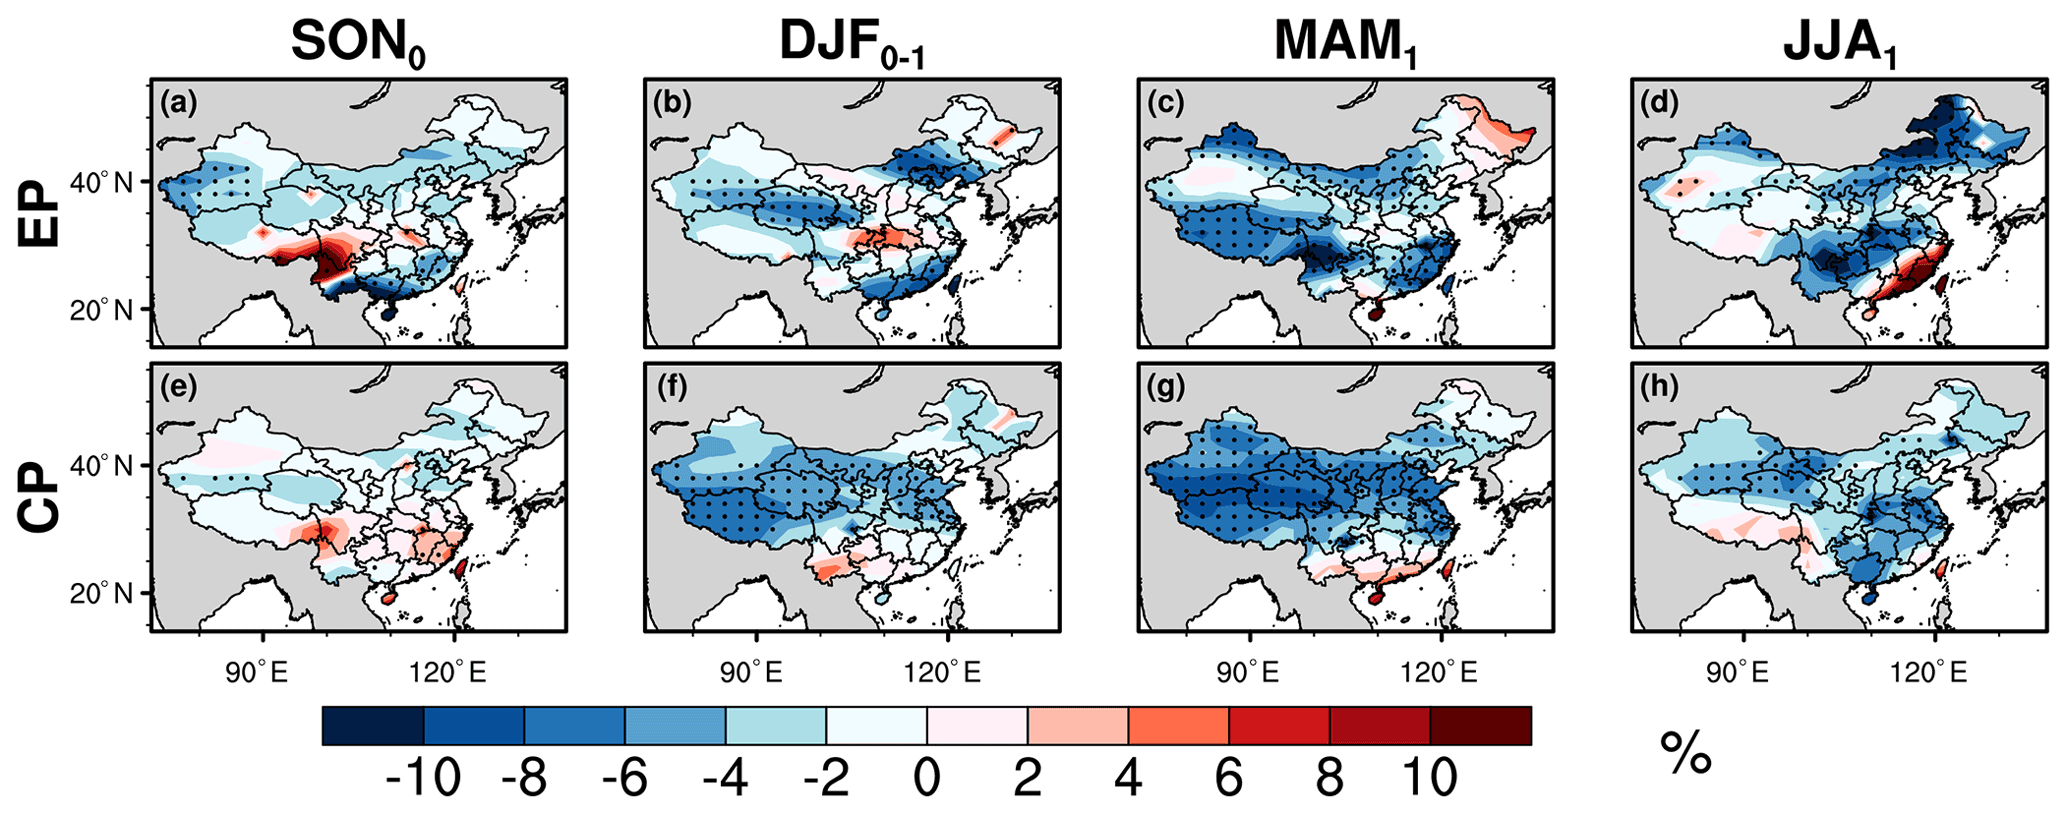
Figure 2The changes (in %) of simulated (GC) tropospheric column ozone (0–6 km; in DU) anomalies driven by composite meteorological fields for four seasons in EP and CP El Niño years. Black dots represent the 95 % confidence level by t test.
Because El Niño is generally associated with decreased tropospheric ozone concentration, we also briefly examine the LTO changes during the negative phase, i.e., La Niña events (Fig. S7). In contrast to El Niño, La Niña tends to be associated with extensive LTO increases by ∼2 %–5 %, especially over northern China, indicating an adverse impact on the already severe tropospheric ozone pollution in this region. An increase in ozone concentration during the post-La Niña spring has also been reported by Wie et al. (2021). However, because El Niño teleconnections are typically stronger and better established, we still focus on El Niño in this study.
3.2 Differences in ozone changes associated with EP and CP El Niño
To clarify the mechanism associated with different LTO changes of the two types of El Niño, we further examine the changes in meteorological variables, including SR, RH, TP, T, SLP, and wind fields during EP (Fig. 3) and CP events (Fig. 4). The leading two variables (SR and RH) impact the local production, and the circulation changes represented by SLP and winds control the regional transport. Although wet scavenging of ozone by TP is negligible because ozone is insoluble in water, TP is closely related to SR and RH; it is also the primary variable examined to identify ENSO teleconnections. We thus also include TP in the comparison. In addition, we calculate the budget changes corresponding to the EP and CP events from GEOS-Chem simulations. The simulated ozone concentration is mainly determined by four processes, namely chemistry, transport, mixing, and convection. Since each process can contribute to ozone either positively or negatively, in Fig. 5 we calculate the absolute value of the column integrated ozone budget in each grid box and then calculate the mean value of the chosen domain (24.0–42.0∘ N, 100.0–117.5∘ E; purple box in Fig. 6a) to better quantify the impact of each process. Because chemistry and transport are the two dominant processes accounting for more than 70 % of the ozone changes in all conditions, we focus our following discussions on these two processes. Figure 6 shows the spatial distribution of ozone budgets corresponding to the chemistry and transport processes from the simulation driven by composite meteorological fields.
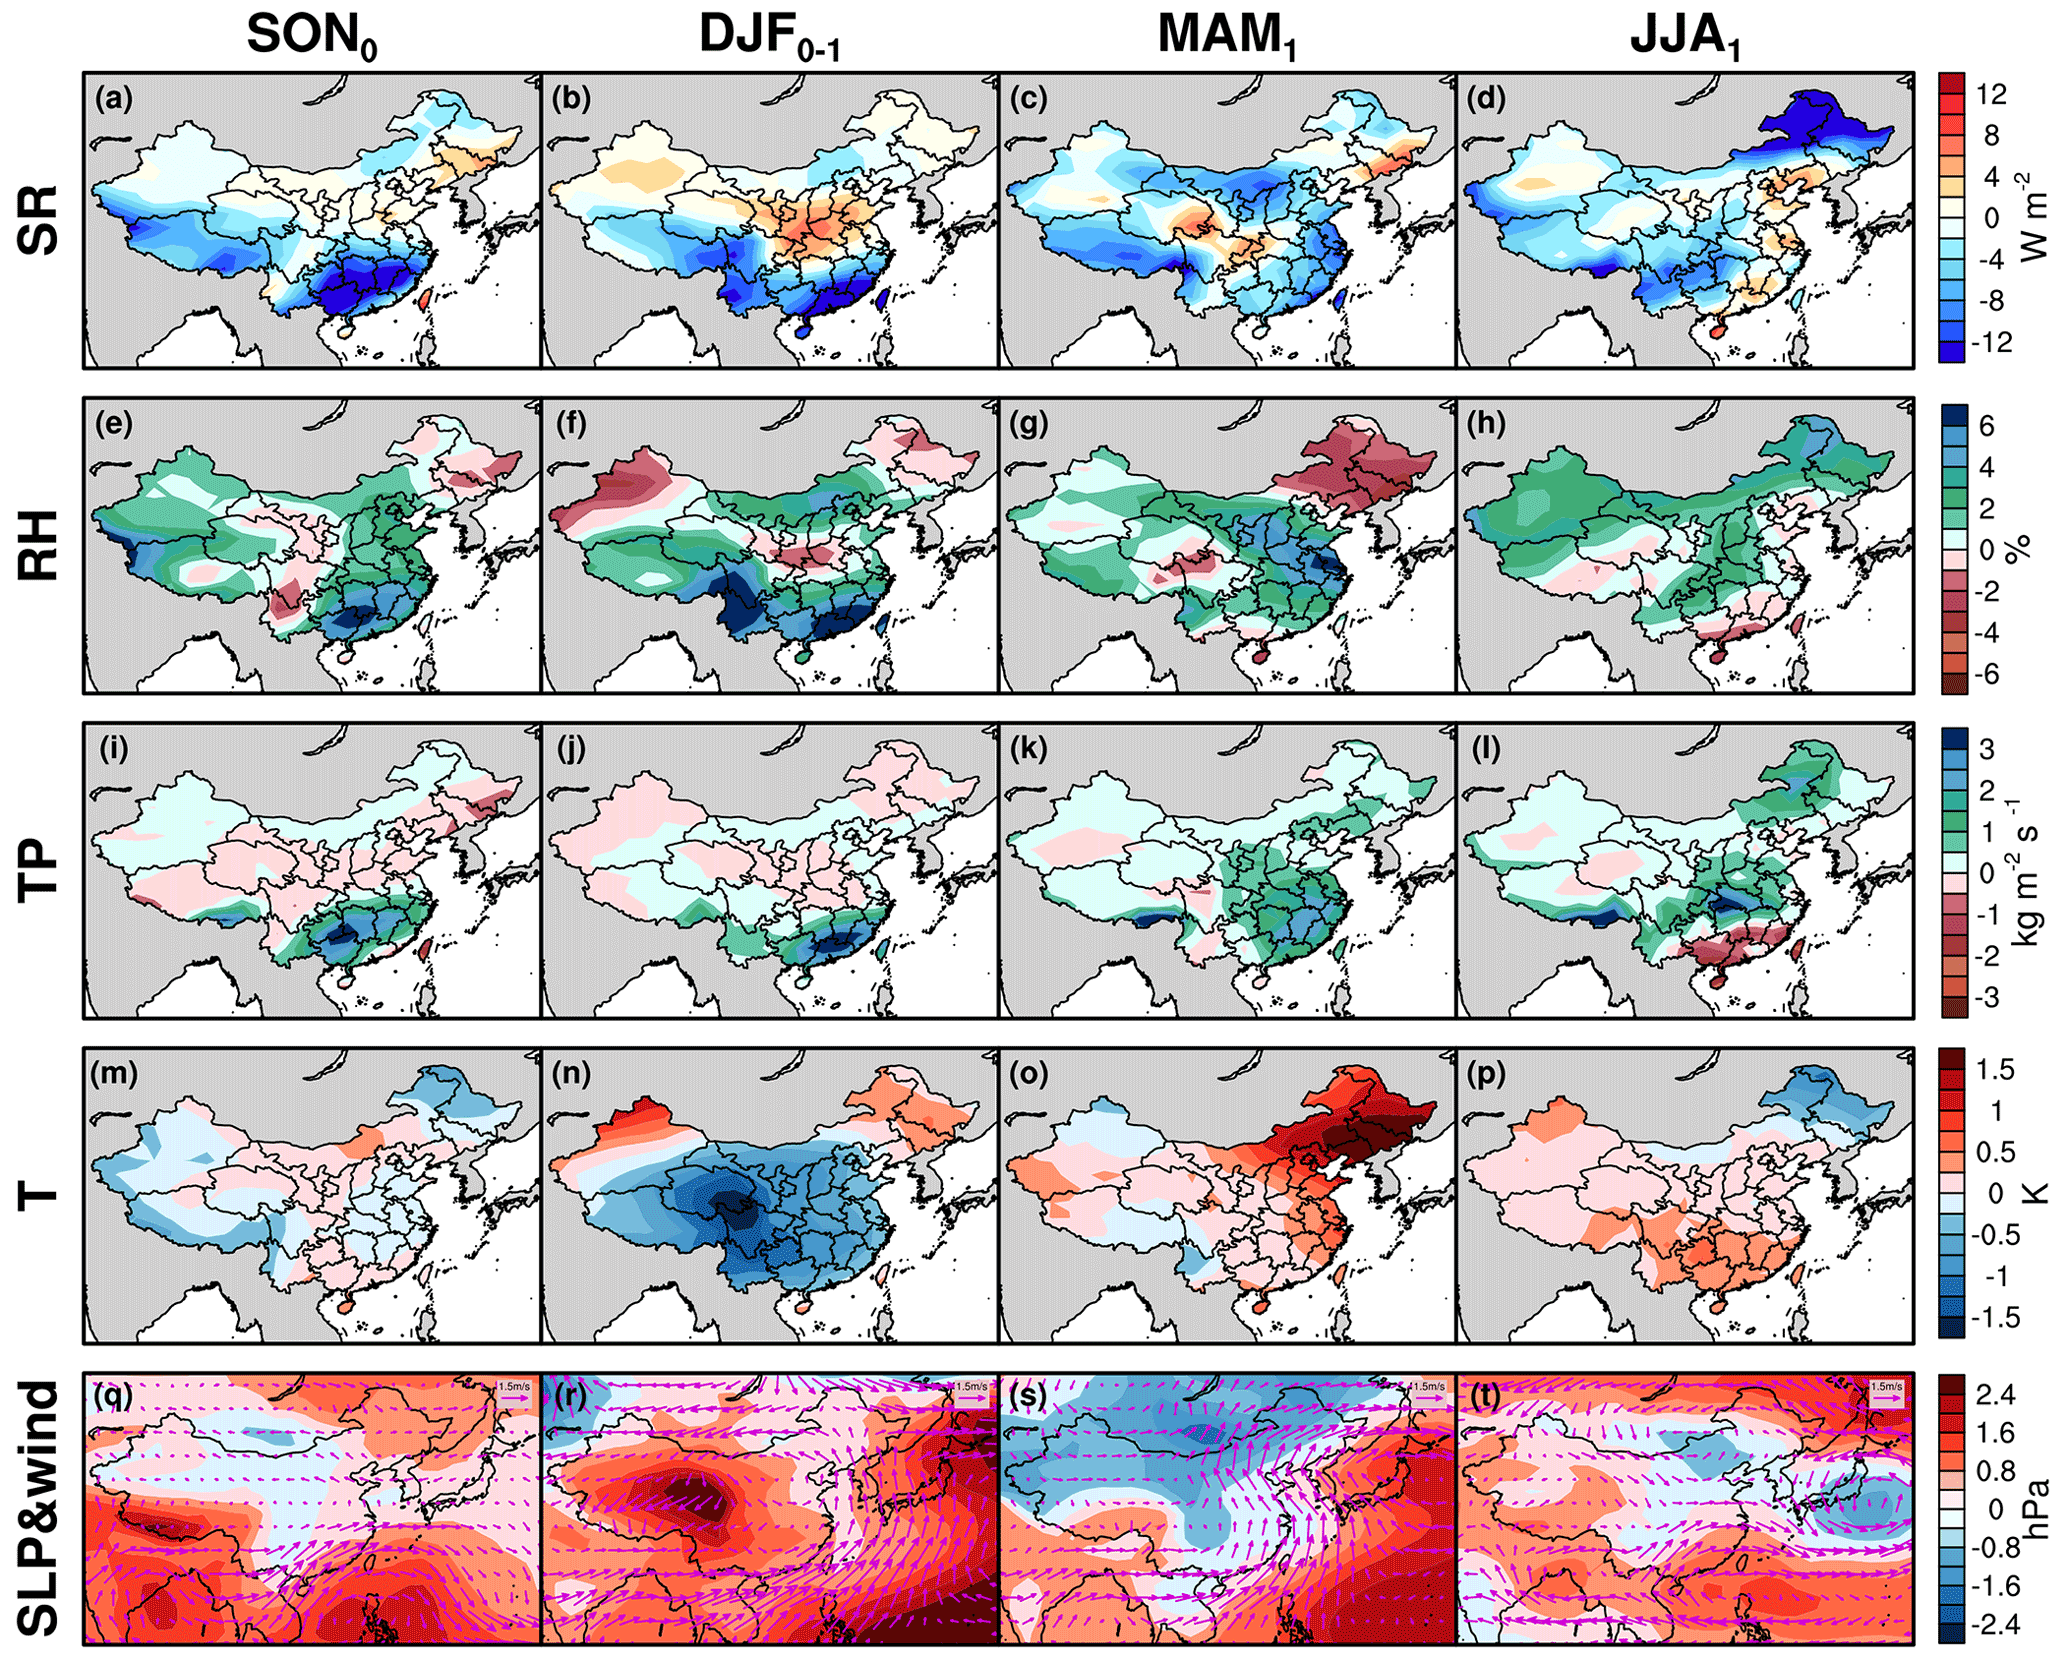
Figure 3The composite anomalies of meteorological variables, including surface downwelling solar radiation (SR), relative humidity (RH), total precipitation (TP), temperature (T), sea level pressure (SLP), and winds, for four seasons in EP El Niño years.
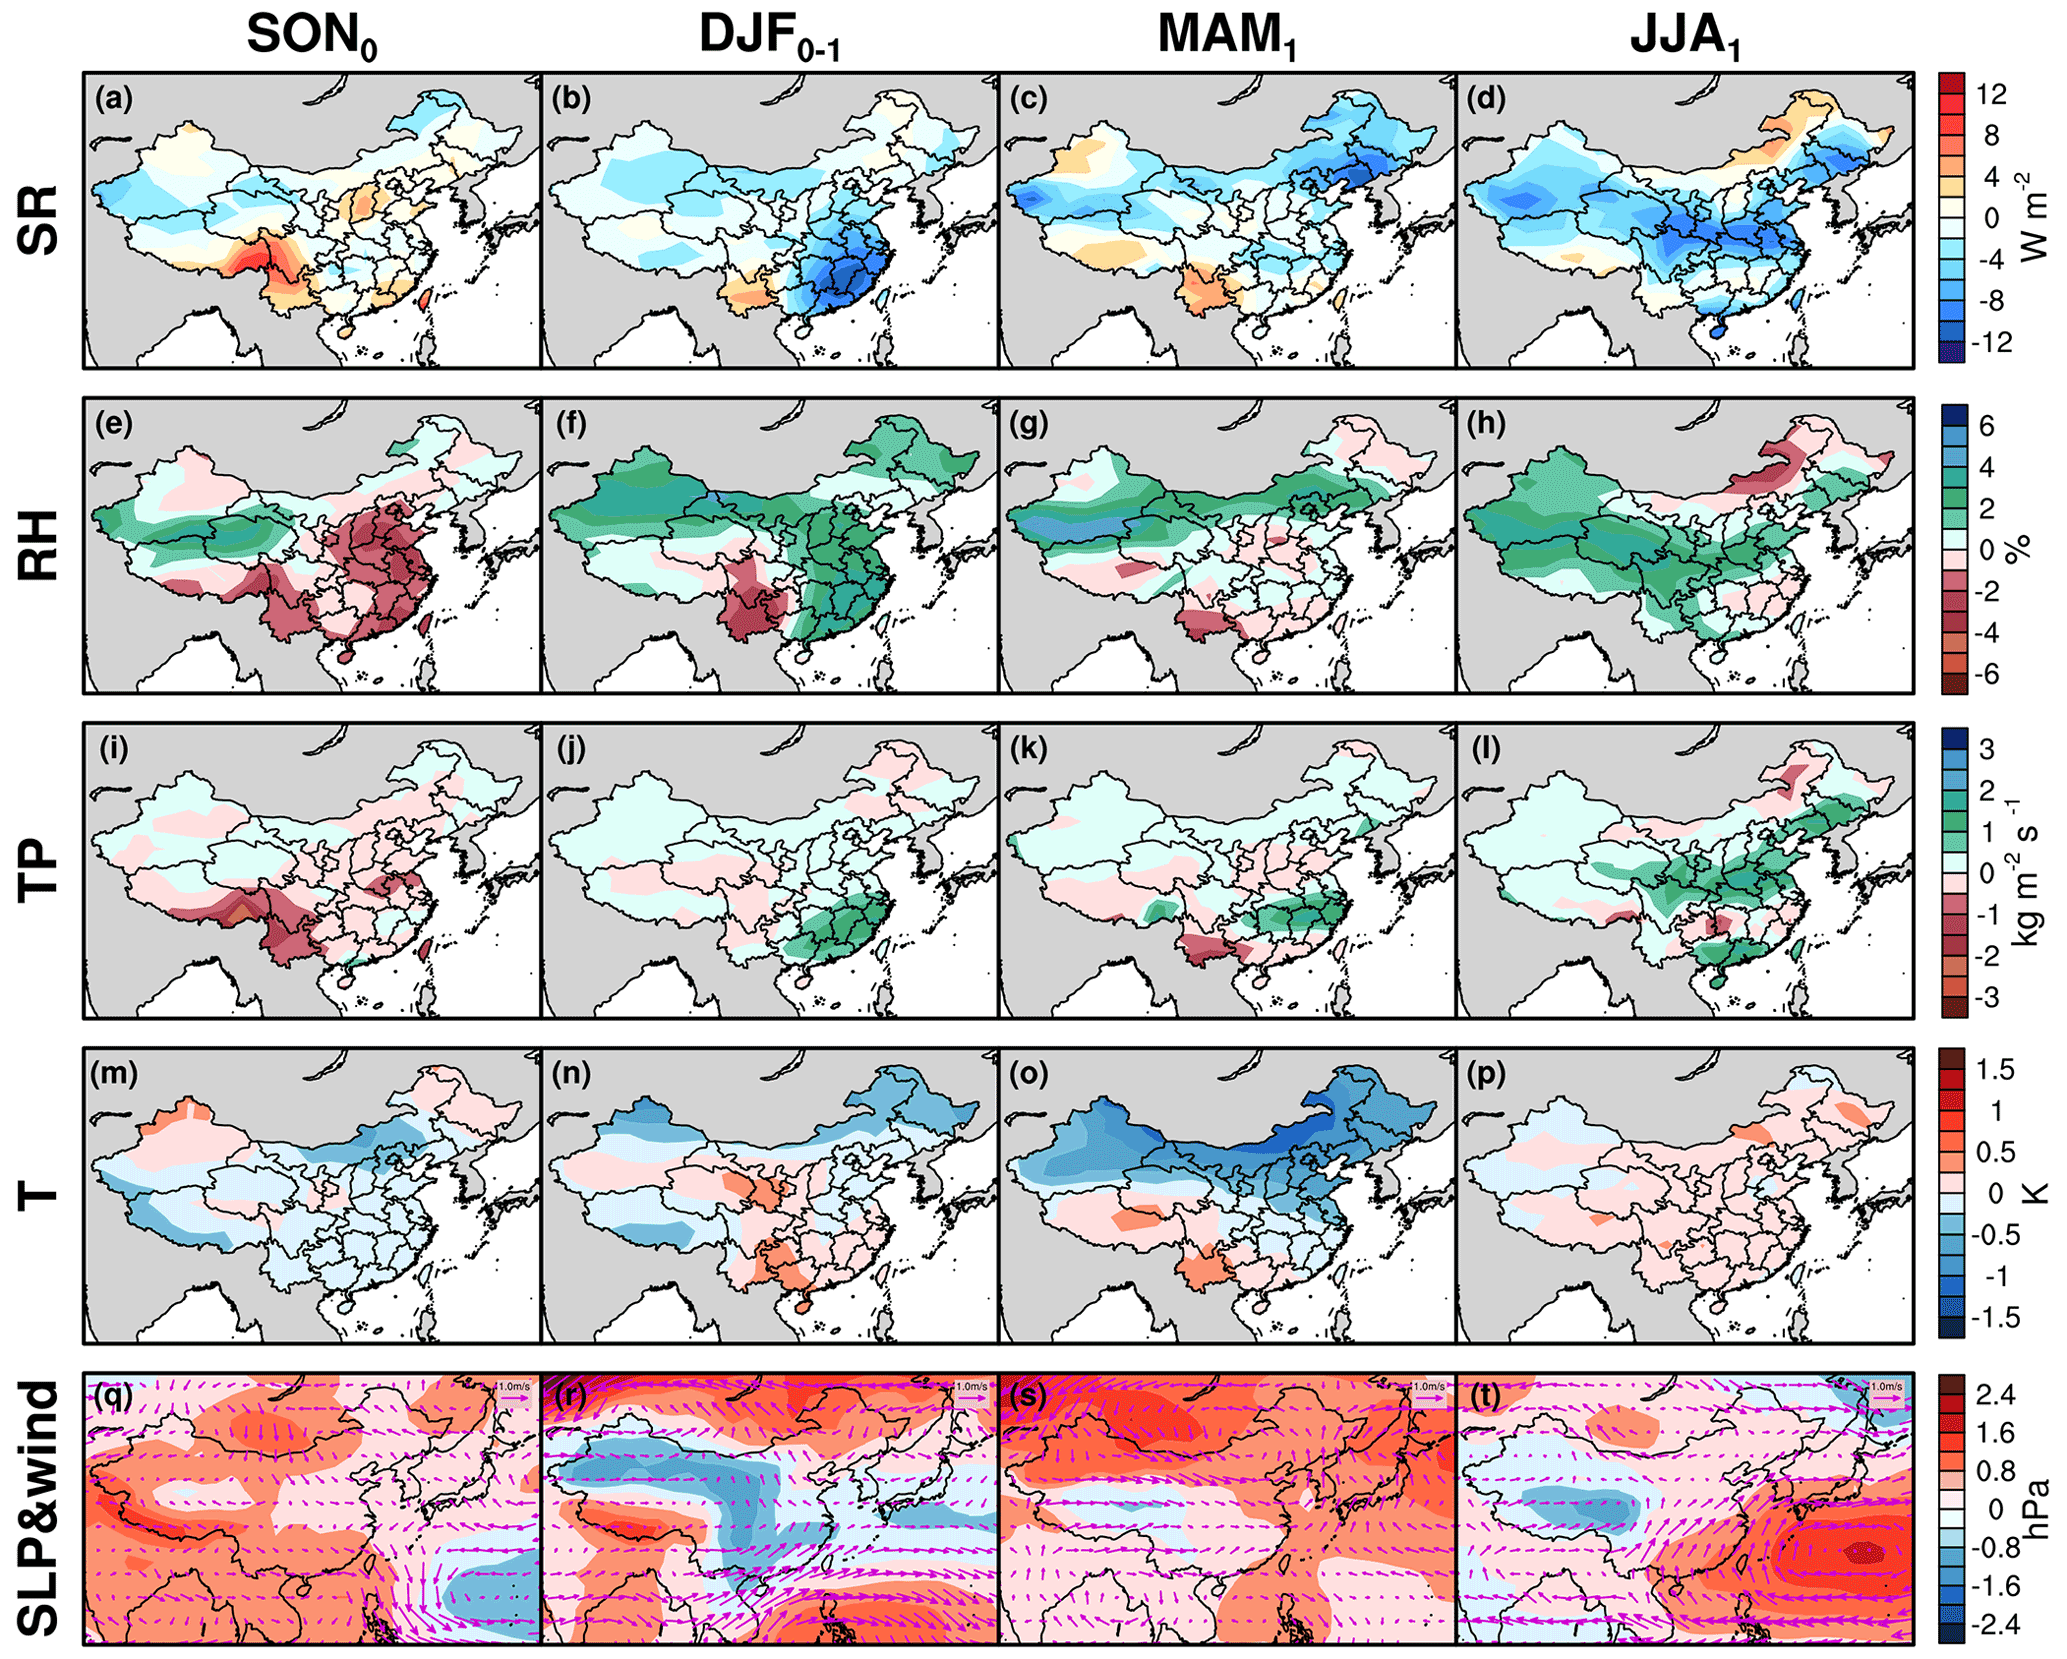
Figure 4Same as Fig. 3 except for CP El Niño.
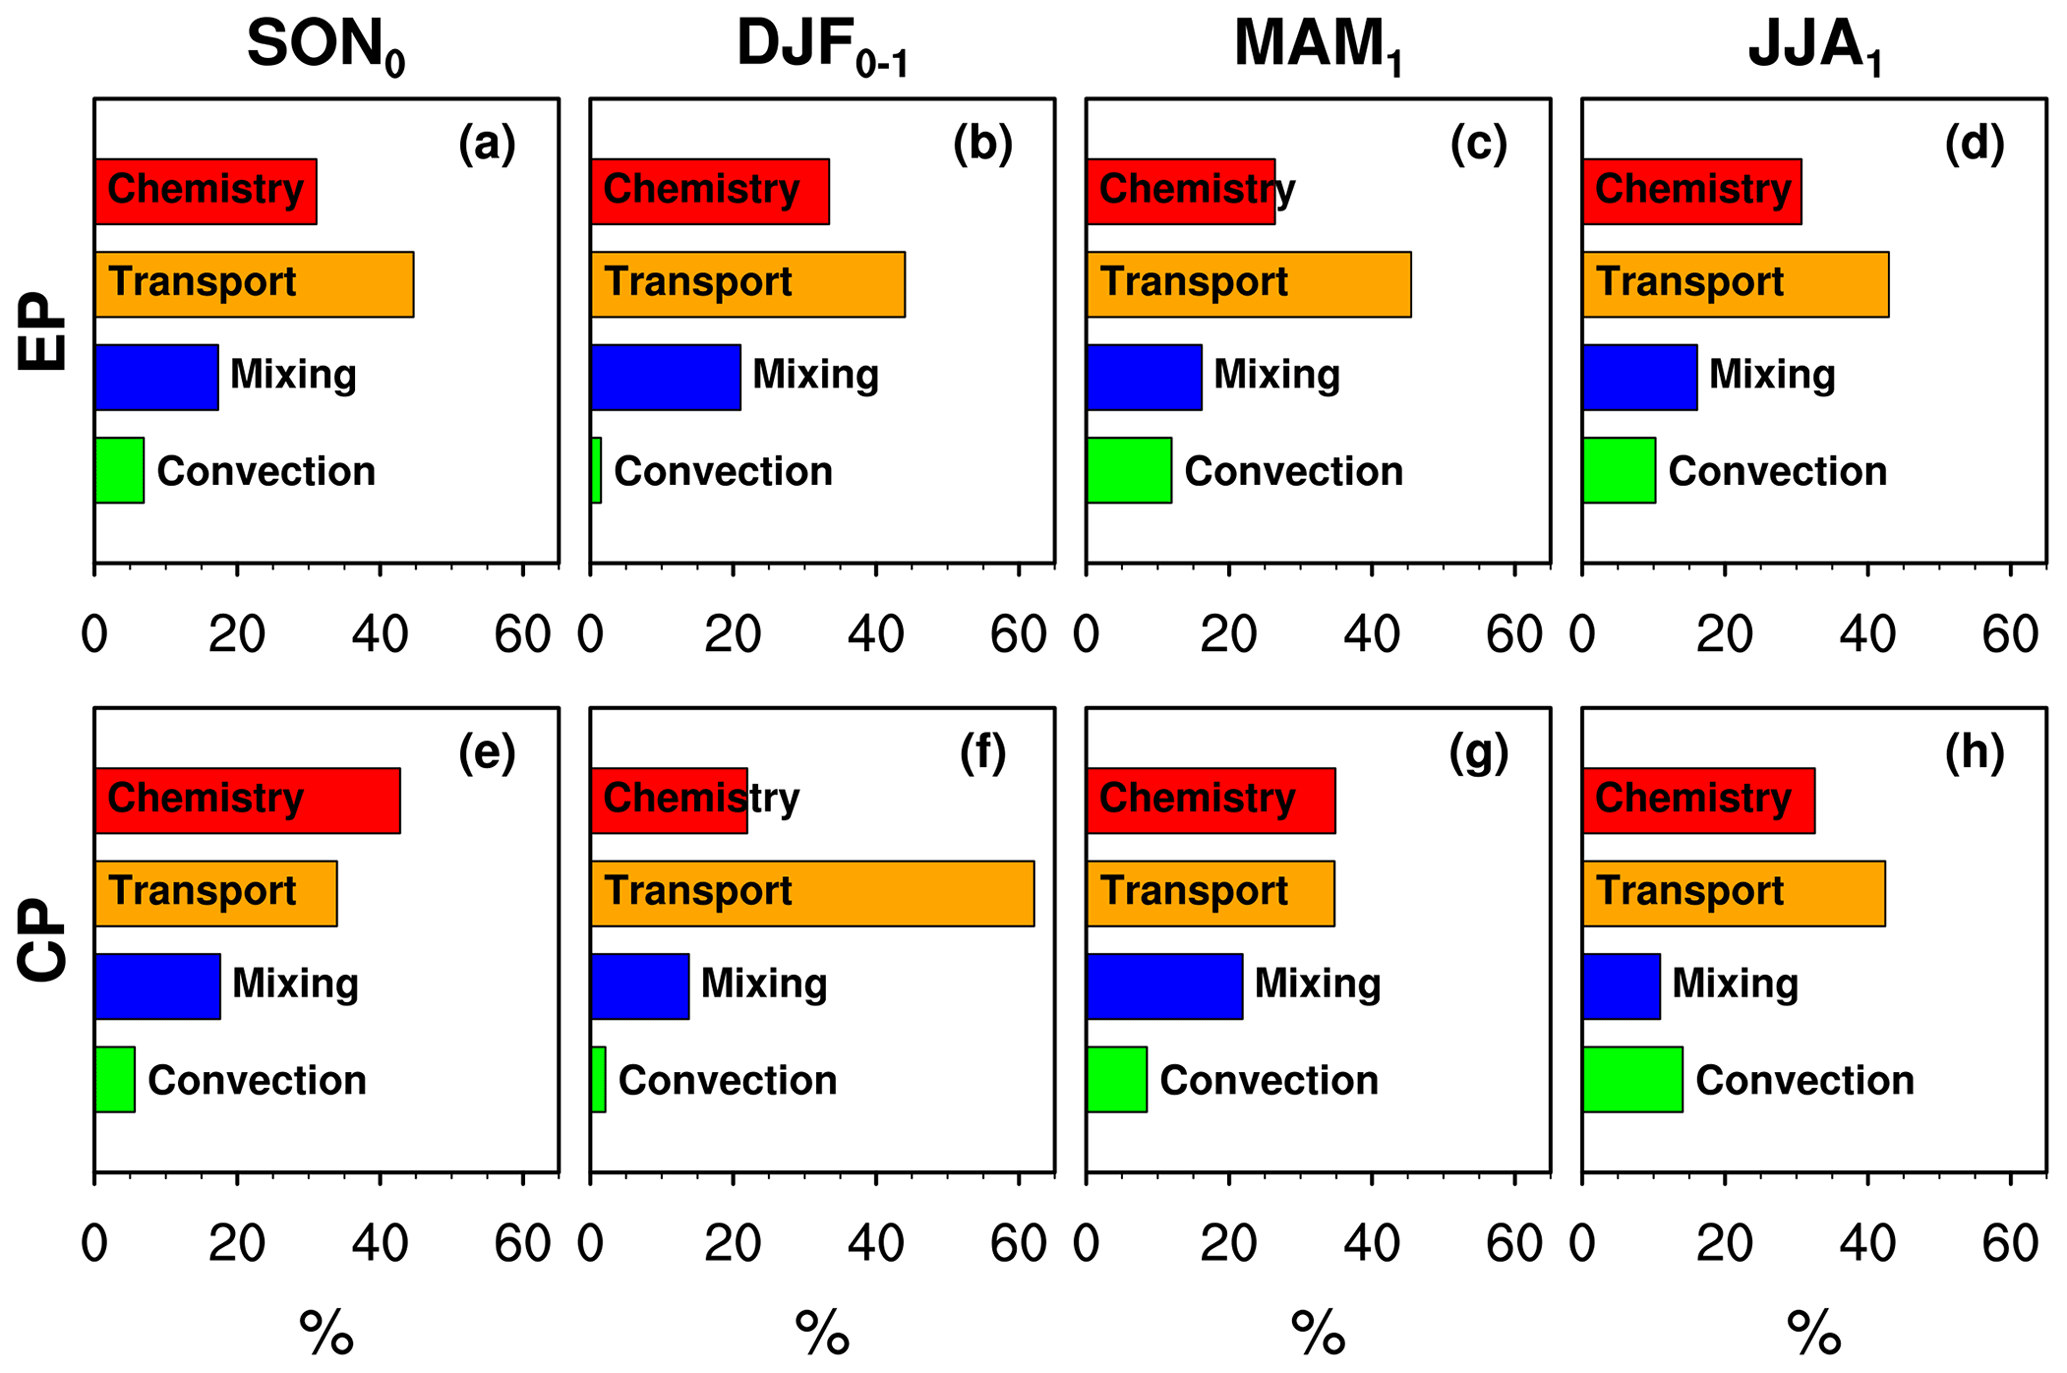
Figure 5The absolute contribution (in %) of model processes, including chemistry (red), transport (orange), mixing (blue), and convection (green) driven by the composite meteorological fields, for four seasons in EP and CP El Niño years. These are the area-averaged values eastern China region (24.0–42.0∘ N, 100.0–117.5∘ E, purple box in Fig. 6a).
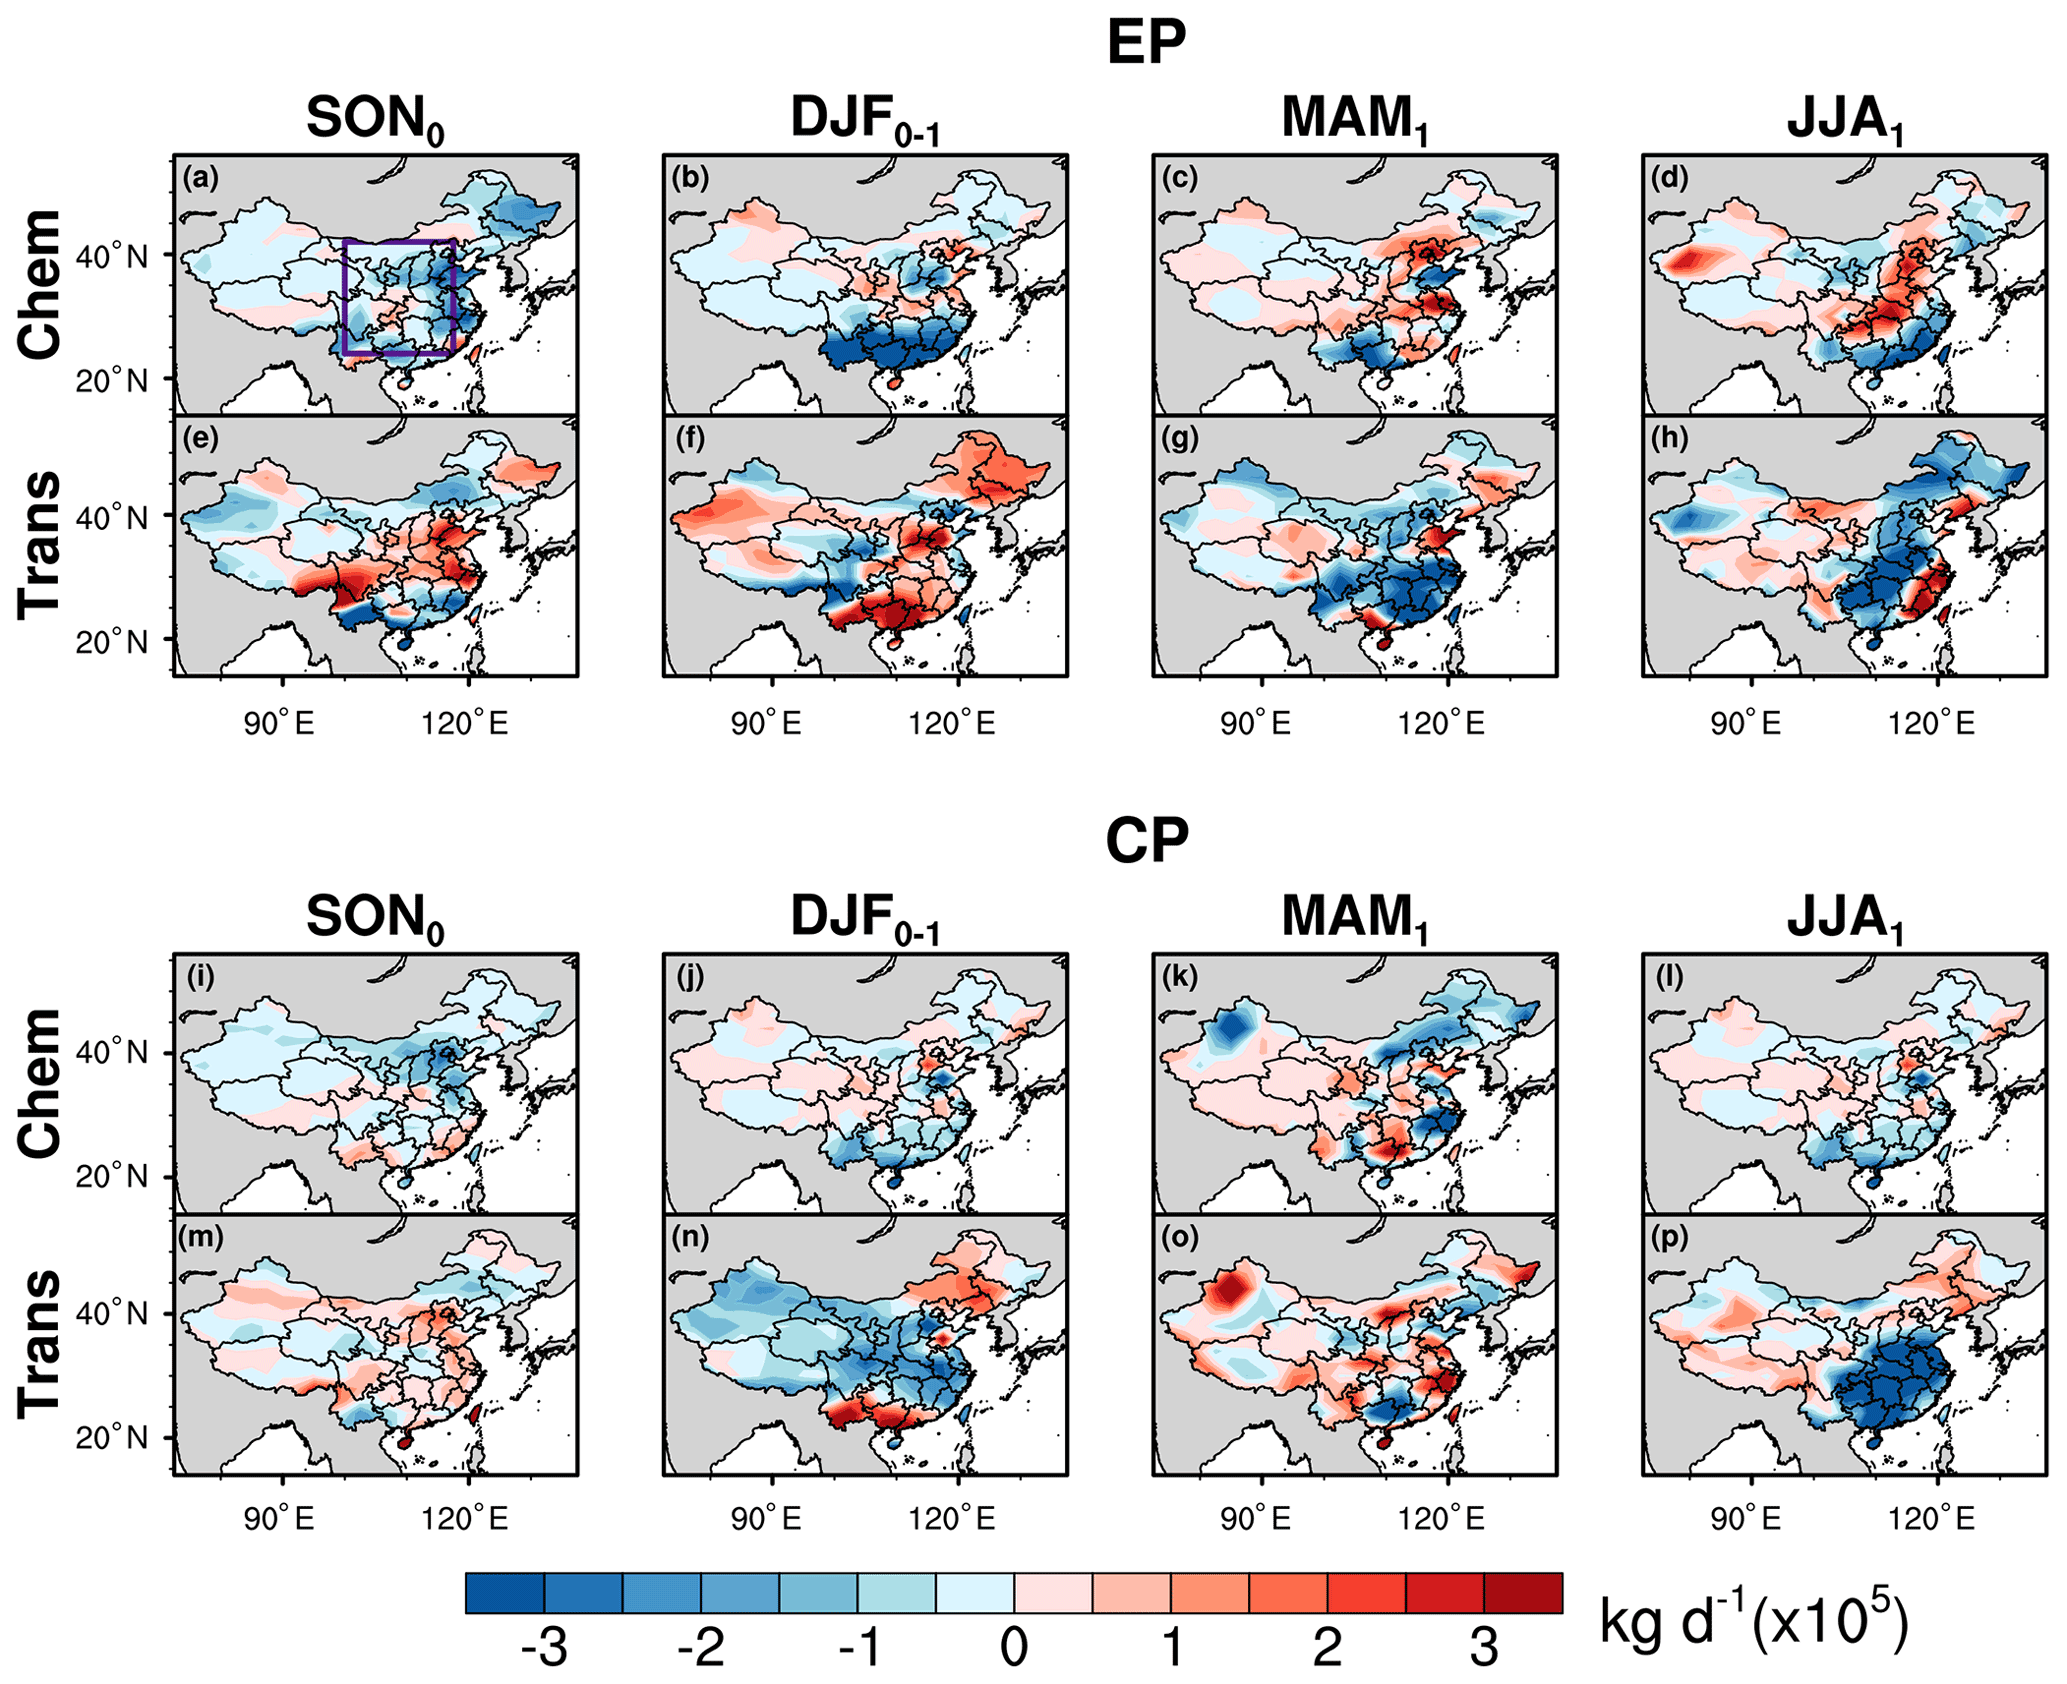
Figure 6The tropospheric column ozone mass anomalies of chemistry and transport processes (0–6 km; in kg d−1) driven by composite meteorological fields for four seasons in EP and CP El Niño years.
In the autumn before El Niño, LTO changes for EP type show a general decrease in China (Fig. 2a), especially in the southeastern part. The EP El Niño is always accompanied by an anomalous anticyclone in the Philippine sea (Fig. 3q), which produces strong southwesterly wind anomalies that transport moisture from the ocean, resulting in increased TP and RH but decreased SR over southeastern China (Fig. 3i, e, a). These changes are unfavorable for ozone production but efficient for ozone removal, thus leading to a chemical loss of LTO over southern China (Fig. 6a). Some regional increase over southwestern China has been observed and likely is due to the positive contribution of transport (Fig. 6e) from India as indicated by the westerly wind anomalies (Fig. 3q). During the CP event, there is a moderate dipole mode change (Fig. 2e), with decreases in northern China and increases in the southern part. In contrast to EP, an anomalous cyclone appears over the Philippine Sea, leading to northwesterly wind anomalies over southern China that produce a dry condition with increased SR (Fig. 4i, e, a). The slight decrease in LTO over northern China is likely attributed to the decreased chemical production (Fig. 6i) associated with negative temperature anomalies (Fig. 4m), although the signal is not statistically significant. The opposite atmospheric circulation patterns over the Philippine Sea during EP and CP events are responses to the different SST anomaly regions under these two conditions, as shown by Wang and Wang (2013) using simple atmospheric model experiments.
In winter, when the Pacific SST anomalies reach their maxima, EP and CP El Niño are both associated with increased TP and RH, and decreased SR, over southern China (Figs. 3b, f, j and 4b, f, j). These similar changes are due to the moisture transport induced by western North Pacific anomalous anticyclones (WNPAC) that occur in both EP and CP El Niño, while EP exhibits greater meteorological changes than CP due to the much stronger anomalous anticyclone (Figs. 3r and 4r). WNPAC is a critical system that links El Niño and East Asia climate change, and its formation and maintenance mechanisms are discussed thoroughly in Li et al. (2017). WNPAC is initiated and maintained by local atmosphere–ocean interaction (Wang et al., 2000) and the moist enthalpy advection/Rossby wave modulation (Wu et al., 2017a, b). Although the meteorological variables change in the same direction, the EP- and CP-related LTO changes in winter are still opposite over southern China (Fig. 2b, f), where the El Niño teleconnection signal is the most prominent (Wang et al., 2020). Budget analysis reveals that this phenomenon is due to the varying contribution of different model processes. Consistent with the increased RH and decreased SR, the contributions of chemical processes are both negative over this region during EP and CP (Fig. 6b, j). The southwestern wind anomalies (Figs. 3r and 4r) bring not only water vapor from the ocean but also ozone from India and the China–Indochina Peninsula to southern China, contributing to LTO concentration there. During EP, the chemical loss (Fig. 6b) suppressed the positive transport (Fig. 6f) due to the severe change of SR and RH over southern China (Fig. 3b, f). However, for CP conditions, the chemical loss (Fig. 6j) due to the increased RH is much weaker and is offset, or even exceeded, by transport (Fig. 6n). This is also consistent with the much larger absolute contribution of transport than chemistry for CP (Fig. 5f).
In spring, LTO decreases extensively over the entire northern China under both EP and CP conditions (Fig. 2c, g), coherent with the large-scale reduction in SR and increase in RH (Figs. 3c, g and 4c, g). WNPAC persists under EP conditions according to the moist enthalpy advection mechanism (Wu et al., 2017a), whereas it nearly disappears in CP (Feng et al., 2011). In EP conditions, with the slight westward shift of the anticyclone center from winter to spring, the wind anomalies also shift from southwesterly to southerly, bringing more moisture and further enhancing TP in higher latitudes where RH increases and SR decreases coherently. Although these changes are generally unfavorable to the local ozone production, the chemistry process still contributes positively in eastern China (Fig. 6c). We attribute this pattern to the large-scale increase in temperature related to the warm southerly wind anomalies (Fig. 3o, s). As the climate warms from winter to spring, the role of temperature becomes increasingly important and may compensate or even exceed the impact of SR reduction. On the other hand, as the southerlies blow low ozone air from the ocean, the severe negative transport (Fig. 6g) dominates the overall ozone decrease. In CP, regional transport is weaker due to the unremarkable change in circulation patterns over the western North Pacific compared with the EP condition; thus, the absolute contributions of transport and chemistry are comparable to those for CP (Fig. 5g).
The situation for the post-El Niño summer is more complicated as El Niño teleconnections substantially involve air–sea interactions and interbasin teleconnections (Feng et al., 2011; Kug et al., 2009). Ozone changes for the EP conditions show a decrease over central and northern China and a band-like ozone increase over southeastern China (Fig. 2d). Although the chemical production (Fig. 6d) increases with the slight SR increase and RH decrease (Fig. 3d, h) over China's eastern coastal line, the transport process (Fig. 6h) controlled by southwestern wind anomalies dominates the ozone decline over the Yangtze River basin and increases over the southeastern coastal line. The circulation anomalies manifest as a tripolar pattern with an anomalous anticyclone (AAC) over the southern China Sea and an anomalous cyclone circulation (ACC) over Japan (Fig. 3t). This pattern appears to be induced by the Indian Ocean capacitor (IOC) effect, which indicates the Indian Ocean memory of ENSO influence (Chen et al., 2012; Xie et al., 2009; Yang et al., 2007). Since the convection is suppressed in the anomalous anticyclone, the drier condition corresponds well to the positive LTO changes over the Philippine Sea (Fig. S5d). This positive signal extends to southeastern China's coastal areas due to the transport by the southwest wind anomalies. During CP, ozone decreases coherently over most of China (Fig. 2h). As no significant Indian Ocean warming appears (Fig. S2h), the summer climate is influenced more by the western Pacific warm pool. The negative SST anomalies in the central–east Pacific imply an upcoming La Niña. According to a previous study, the western tropical Pacific warm pool spreads eastward near the surface as El Niño builds (Johnson and Birnbaum, 2017). As La Niña generally shows opposite characteristics to El Niño, the western tropical Pacific warm pool under the former condition will shrink. Associated with the SST drop, SLP increases over the northwestern Pacific (Fig. 4t), resulting in an enhanced western Pacific subtropical high (WPSH), a typical feature of CP El Niño (Chen et al., 2019). Controlled more by the local Pacific than the Indian Ocean, the SLP anomaly center shifts eastward during CP El Niño compared with the anomalous anticyclone during EP El Niño, and the positive LTO anomalies also move eastward accordingly (Fig. S5h). Regional transport (Fig. 6p) by the southwest wind anomalies surrounding the positive SLP center (Fig. 4t) exerts a consistent negative contribution to LTO in southern China (Fig. 2h; Jiang et al., 2021). In sum, the post-El Niño summer LTO change is dominated by the IOC effect for EP and WPSH enhancement for CP.
This study investigates the changes of tropospheric ozone concentration in China associated with the EP and CP El Niño using satellite observations and GEOS-Chem chemical transport model simulations. The general consistency between observed and simulated results confirms the model's credibility. Overall, both types of El Niño exert a negative effect on LTO by 5 %–10 %, except for some regional increases. The ozone changes are explained from the perspective of El Niño-induced meteorological fields, which further modulate local production, regional transport, etc. Budget analysis indicates that transport controlled by circulation patterns plays the leading role, and chemistry affected by SR and RH plays the secondary role, in driving the ozone changes. The difference between EP and CP mainly lies in southern China. During the autumn, LTO decreases (increases) by about 4 %–8 % (+2 %–4 %) over southern China for EP (CP) type, corresponding well to the reversed changes in TP and related variables controlled by the different locations of SST anomalies. In winter, the established WNPAC persists during both EP and CP, exerting a counteracting effect on local production and regional transport. The impact of chemistry outweighs the transport for EP, resulting in a slight LTO decrease over southern China (4 %–6 %), and vice versa for CP (+0 %–2 %). In spring, WNPAC persists under EP conditions and keeps impacting LTO; thus, the regional transport dominates the overall decline in LTO by 5 %–10 %. However, the role of transport is weakened due to the disappearance of WNPAC under CP conditions. On the other hand, the local ozone production increases due to the drier environment, which leads to a slight ozone increase (+0 %–4 %) over southern China. As for summer, the LTO decreases by 5 %–10 % in both types, except for an increase over the southeastern coastal line for EP. Ozone changes in the EP type are dominated by the Indian Ocean capacitor, and ozone changes in the CP type are influenced more by the western Pacific subtropical high.
Our study indicates that natural variability, such as ENSO, can significantly impact lower tropospheric ozone in mid-to-high latitudes. This has particular implications for ozone pollution control in China. As many efforts have been undertaken to control anthropogenic emissions, meteorological factors may play an increasingly important role in the future. The occurrence of El Niño events produces a favorable environment for ozone pollution control in general, but caution needs to be exercised for southern China during CP autumn and EP summer. By contrast, when a La Niña is predicted to occur in winter, stricter emission control measures should be taken in the subsequent seasons, especially in northern China. Furthermore, by exploring the relationship between different ENSO flavors and lower tropospheric ozone in China, this study enriches the theory of ENSO teleconnection in mid-latitudes.
Nonetheless, there are still limitations in the current study that are subject to future improvements. Tropospheric ozone concentration is influenced by stratospheric–tropospheric exchange (Ding and Wang, 2006; Langford, 1999), although the effect is primarily concentrated in the upper troposphere (Lin et al., 2015; Neu et al., 2014). Future work is needed to explain the variation in ozone concentration in the vertical dimension and quantify the role of stratospheric–tropospheric exchange in the ENSO-induced LTO changes. The variation in biomass-burning emission is not included in our study. However, the increased frequency and intensity of wildfires induced by El Niño over Southeast Asia and Australia can generate more carbon monoxide, which is an important ozone precursor. The LTO changes should be even larger than the simulated results shown in this study if taking this factor into consideration. A previous study shows that the ENSO-modulated fires in Southeast Asia dominate the subtropical trans-Pacific ozone transport during the springtime (Xue et al., 2021). Based on the structure of the wind fields (Figs. 3q–t, 4q–t), the impact of long-distance transportation from Southeast Asia to China is relatively small, and thus its impact on the spatial patterns of LTO changes in China is limited. The role of biomass-burning emission on ozone will be quantitatively investigated in the future. Furthermore, long-term observations, especially in China, are needed to verify the model results reported here.
The IASI satellite tropospheric column ozone data are from the climate data store (CDS) at ECMWF and are available at https://doi.org/10.24381/cds.4ebfe4eb (Copernicus, 2020). The MERRA2 meteorology data are available at http://ftp.as.harvard.edu/gcgrid/data/GEOS_2x2.5/MERRA2/ (Bosilovich et al., 2016). The GEOS-Chem model is a community model and is freely available at https://doi.org/10.5281/zenodo.2658178 (Yantosca, 2019).
The supplement related to this article is available online at: https://doi.org/10.5194/acp-22-7273-2022-supplement.
JL and ZJ designed the study. ZJ ran the GEOS-Chem model and performed the analysis. ZJ and JL wrote the paper.
The contact author has declared that neither they nor their co-authors have any competing interests.
Publisher’s note: Copernicus Publications remains neutral with regard to jurisdictional claims in published maps and institutional affiliations.
We appreciate GMAO for providing the MERRA-2 meteorological data. We thank ECMWF for providing the ozone monthly gridded data. We also acknowledge the efforts of the GEOS-Chem Working Groups and Support Team for developing and maintaining the GEOS-Chem model.
This research has been supported by the National Natural Science Foundation of China (grant no. 41975023).
This paper was edited by Xiaohong Liu and reviewed by two anonymous referees.
Ashok, K., Behera, S. K., Rao, S. A., Weng, H., and Yamagata, T.: El Niño Modoki and its possible teleconnection, J. Geophys. Res.-Oceans, 112, 1–27, https://doi.org/10.1029/2006JC003798, 2007.
Bey, I., Jacob, D. J., Yantosca, R. M., Logan, J. A., Field, B. D., Fiore, A. M., Li, Q., Liu, H. Y., Mickley, L. J., and Schultz, M. G.: Global modeling of tropospheric chemistry with assimilated meteorology: Model description and evaluation, J. Geophys. Res.-Atmos., 106, 23073–23095, https://doi.org/10.1029/2001JD000807, 2001.
Bjerknes, J.: Atmospheric Teleconnections From the Equatorial Pacific, Mon. Weather Rev., 97, 163–172, https://doi.org/10.1175/1520-0493(1969)097<0163:ATFTEP>2.3.CO;2, 1969.
Bosilovich, M. G., Lucchesi, R., and Suarez, M.: MERRA-2: File Specification, GMAO Office Note No. 9 (Version 1.1), 73 pp., http://gmao.gsfc.nasa.gov/pubs/office_notes (last access: 8 November 2021), 2016 (data available at: http://ftp.as.harvard.edu/gcgrid/data/GEOS_2x2.5/MERRA2/, last access: 8 November 2021).
Boynard, A., Clerbaux, C., Coheur, P.-F., Hurtmans, D., Turquety, S., George, M., Hadji-Lazaro, J., Keim, C., and Meyer-Arnek, J.: Measurements of total and tropospheric ozone from IASI: comparison with correlative satellite, ground-based and ozonesonde observations, Atmos. Chem. Phys., 9, 6255–6271, https://doi.org/10.5194/acp-9-6255-2009, 2009.
Boynard, A., Hurtmans, D., Koukouli, M. E., Goutail, F., Bureau, J., Safieddine, S., Lerot, C., Hadji-Lazaro, J., Wespes, C., Pommereau, J.-P., Pazmino, A., Zyrichidou, I., Balis, D., Barbe, A., Mikhailenko, S. N., Loyola, D., Valks, P., Van Roozendael, M., Coheur, P.-F., and Clerbaux, C.: Seven years of IASI ozone retrievals from FORLI: validation with independent total column and vertical profile measurements, Atmos. Meas. Tech., 9, 4327–4353, https://doi.org/10.5194/amt-9-4327-2016, 2016.
Cao, Q., Hao, Z., Yuan, F., Su, Z., Berndtsson, R., Hao, J., and Nyima, T.: Impact of ENSO regimes on developing- and decaying-phase precipitation during rainy season in China, Hydrol. Earth Syst. Sci., 21, 5415–5426, https://doi.org/10.5194/hess-21-5415-2017, 2017.
Chandra, S., Ziemke, J. R., Min, W., and Read, W. G.: Effects of 1997–1998 El Niño on tropospheric ozone and water vapor, Geophys. Res. Lett., 25, 3867–3870, https://doi.org/10.1029/98GL02695, 1998.
Chen, M., Yu, J. Y., Wang, X., and Jiang, W.: The Changing Impact Mechanisms of a Diverse El Niño on the Western Pacific Subtropical High, Geophys. Res. Lett., 46, 953–962, https://doi.org/10.1029/2018GL081131, 2019.
Chen, W., Park, J. K., Dong, B., Lu, R., and Jung, W. S.: The relationship between El Niño and the western North Pacific summer climate in a coupled GCM: Role of the transition of El Niño decaying phases, J. Geophys. Res.-Atmos., 117, D12111, https://doi.org/10.1029/2011JD017385, 2012.
Cooper, O. R., Parrish, D. D., Ziemke, J., Balashov, N. V., Cupeiro, M., Galbally, I. E., Gilge, S., Horowitz, L., Jensen, N. R., Lamarque, J. F., Naik, V., Oltmans, S. J., Schwab, J., Shindell, D. T., Thompson, A. M., Thouret, V., Wang, Y., and Zbinden, R. M.: Global distribution and trends of tropospheric ozone: An observation-based review, Elementa, 2, 000029, https://doi.org/10.12952/journal.elementa.000029, 2014.
Copernicus (Europe's eyes on Earth): Ozone monthly gridded data from 1970 to present derived from satellite observations, climate data store CDS at ECMWF [data set] https://doi.org/10.24381/cds.4ebfe4eb, 2020.
Dang, R., Liao, H., and Fu, Y.: Quantifying the anthropogenic and meteorological influences on summertime surface ozone in China over 2012–2017, Sci. Total Environ., 754, 142394, https://doi.org/10.1016/j.scitotenv.2020.142394, 2021.
Ding, A. and Wang, T.: Influence of stratopshere-to-troposhere exchange on the seasonal cycle of surface ozone at Mount Waliguan in western China, Geophys. Res. Lett., 33, 4–7, https://doi.org/10.1029/2005GL024760, 2006.
Eastham, S. D., Weisenstein, D. K., and Barrett, S. R. H.: Development and evaluation of the unified tropospheric-stratospheric chemistry extension (UCX) for the global chemistry-transport model GEOS-Chem, Atmos. Environ., 89, 52–63, https://doi.org/10.1016/j.atmosenv.2014.02.001, 2014.
Fang, K., Yao, Q., Guo, Z., Zheng, B., Du, J., Qi, F., Yan, P., Li, J., Ou, T., Liu, J., He, M., and Trouet, V.: ENSO modulates wildfire activity in China, Nat. Commun., 12, 1–8, https://doi.org/10.1038/s41467-021-21988-6, 2021.
Feng, J., Chen, W., Tam, C. Y., and Zhou, W.: Different impacts of El Niño and El Niño Modoki on China rainfall in the decaying phases, Int. J. Climatol., 31, 2091–2101, https://doi.org/10.1002/joc.2217, 2011.
Fleming, Z. L., Doherty, R. M., Von Schneidemesser, E., Malley, C. S., Cooper, O. R., Pinto, J. P., Colette, A., Xu, X., Simpson, D., Schultz, M. G., Lefohn, A. S., Hamad, S., Moolla, R., Solberg, S., and Feng, Z.: Tropospheric Ozone Assessment Report: Present-day ozone distribution and trends relevant to human health, Elementa, 6, 12, https://doi.org/10.1525/elementa.273, 2018.
Gao, T., Luo, M., Lau, N. C., and Chan, T. O.: Spatially Distinct Effects of Two El Niño Types on Summer Heat Extremes in China, Geophys. Res. Lett., 47, 1–9, https://doi.org/10.1029/2020GL086982, 2020.
Guenther, A. B., Jiang, X., Heald, C. L., Sakulyanontvittaya, T., Duhl, T., Emmons, L. K., and Wang, X.: The Model of Emissions of Gases and Aerosols from Nature version 2.1 (MEGAN2.1): an extended and updated framework for modeling biogenic emissions, Geosci. Model Dev., 5, 1471–1492, https://doi.org/10.5194/gmd-5-1471-2012, 2012.
Hu, D., Guo, Y., Wang, F., Xu, Q., Li, Y., Sang, W., Wang, X., and Liu, M.: Brewer-Dobson Circulation: Recent-Past and Near-Future Trends Simulated by Chemistry-Climate Models, Adv. Meteorol., 2017, 18–20, https://doi.org/10.1155/2017/2913895, 2017.
Jeong, J. I., Park, R. J., and Yeh, S. W.: Dissimilar effects of two El Niño types on PM2.5 concentrations in East Asia, Environ. Pollut., 242, 1395–1403, https://doi.org/10.1016/j.envpol.2018.08.031, 2018.
Jiang, Z., Li, J., Lu, X., Gong, C., Zhang, L., and Liao, H.: Impact of western Pacific subtropical high on ozone pollution over eastern China, Atmos. Chem. Phys., 21, 2601–2613, https://doi.org/10.5194/acp-21-2601-2021, 2021.
Johnson, G. C. and Birnbaum, A. N.: As El Niño builds, Pacific Warm Pool expands, ocean gains more heat, Geophys. Res. Lett., 44, 438–445, https://doi.org/10.1002/2016GL071767, 2017.
Koumoutsaris, S., Bey, I., Generoso, S., and Thouret, V.: Influence of El Niño-Southern Oscillation on the interannual variability of tropospheric ozone in the northern midlatitudes, J. Geophys. Res.-Atmos., 113, 1–21, https://doi.org/10.1029/2007JD009753, 2008.
Kug, J. S., Jin, F. F., and An, S.: Two types of El Niño events: Cold tongue El Niño and warm pool El Niño, J. Clim., 22, 1499–1515, https://doi.org/10.1175/2008JCLI2624.1, 2009.
Langford, A. O.: Stratosphere-troposphere exchange at the subtropical jet: Contribution to the tropospheric ozone budget at midlatitudes, Geophys. Res. Lett., 26, 2449–2452, https://doi.org/10.1029/1999GL900556, 1999.
Li, H., Fan, K., He, S., Liu, Y., Yuan, X., and Wang, H.: Intensified impacts of central pacific ENSO on the reversal of December and January surface air temperature anomaly over China since 1997, J. Clim., 34, 1601–1618, https://doi.org/10.1175/JCLI-D-20-0048.1, 2021.
Li, J., Huang, D., Li, F., and Wen, Z.: Circulation characteristics of EP and CP ENSO and their impacts on precipitation in South China, J. Atmos. Solar-Terrestrial Phys., 179, 405–415, https://doi.org/10.1016/j.jastp.2018.09.006, 2018.
Lin, M., Fiore, A. M., Horowitz, L. W., Langford, A. O., Oltmans, S. J., Tarasick, D., and Rieder, H. E.: Climate variability modulates western US ozone air quality in spring via deep stratospheric intrusions, Nat. Commun., 6, 1–11, https://doi.org/10.1038/ncomms8105, 2015.
Li, T., Wang, B., Wu, B., Zhou, T., Chang, C. P., and Zhang, R.: Theories on formation of an anomalous anticyclone in western North Pacific during El Niño: A review, J. Meteorol. Res., 31, 987–1006, https://doi.org/10.1007/s13351-017-7147-6, 2017.
Li, X., Zhou, W., Chen, D., Li, C., and Song, J.: Water vapor transport and moisture budget over eastern China: Remote forcing from the two types of El Niño, J. Clim., 27, 8778–8792, https://doi.org/10.1175/JCLI-D-14-00049.1, 2014.
Lu, X., Zhang, L., Chen, Y., Zhou, M., Zheng, B., Li, K., Liu, Y., Lin, J., Fu, T.-M., and Zhang, Q.: Exploring 2016–2017 surface ozone pollution over China: source contributions and meteorological influences, Atmos. Chem. Phys., 19, 8339–8361, https://doi.org/10.5194/acp-19-8339-2019, 2019.
Maji, K. J., Ye, W. F., Arora, M., and Nagendra, S. M. S.: Ozone pollution in Chinese cities: Assessment of seasonal variation, health effects and economic burden, Environ. Pollut., 247, 792–801, https://doi.org/10.1016/j.envpol.2019.01.049, 2019.
Marlier, M. E., Defries, R. S., Voulgarakis, A., Kinney, P. L., Randerson, J. T., Shindell, D. T., Chen, Y., and Faluvegi, G.: El Niño and health risks from landscape fire emissions in southeast Asia, Nat. Clim. Chang., 3, 131–136, https://doi.org/10.1038/nclimate1658, 2013.
Mills, G., Pleijel, H., Malley, C. S., Sinha, B., Cooper, O. R., Schultz, M. G., Neufeld, H. S., Simpson, D., Sharps, K., Feng, Z., Gerosa, G., Harmens, H., Kobayashi, K., Saxena, P., Paoletti, E., Sinha, V., and Xu, X.: Tropospheric Ozone Assessment Report: Present-day tropospheric ozone distribution and 35 trends relevant to vegetation, Elementa, 6, 47, https://doi.org/10.1525/elementa.302, 2018
Neu, J. L., Flury, T., Manney, G. L., Santee, M. L., Livesey, N. J., and Worden, J.: Tropospheric ozone variations governed by changes in stratospheric circulation, Nat. Geosci., 7, 340–344, https://doi.org/10.1038/ngeo2138, 2014.
Ni, R., Lin, J., Yan, Y., and Lin, W.: Foreign and domestic contributions to springtime ozone over China, Atmos. Chem. Phys., 18, 11447–11469, https://doi.org/10.5194/acp-18-11447-2018, 2018.
Olsen, M. A., Wargan, K., and Pawson, S.: Tropospheric column ozone response to ENSO in GEOS-5 assimilation of OMI and MLS ozone data, Atmos. Chem. Phys., 16, 7091–7103, https://doi.org/10.5194/acp-16-7091-2016, 2016.
Oman, L. D., Ziemke, J. R., Douglass, A. R., Waugh, D. W., Lang, C., Rodriguez, J. M., and Nielsen, J. E.: The response of tropical tropospheric ozone to ENSO, Geophys. Res. Lett., 38, 2–7, https://doi.org/10.1029/2011GL047865, 2011.
Oman, L. D., Douglass, A. R., Ziemke, J. R., Rodriguez, J. M., Waugh, D. W., and Nielsen, J. E.: The ozone response to enso in aura satellite measurements and a chemistry-climate simulation, J. Geophys. Res.-Atmos., 118, 965–976, https://doi.org/10.1029/2012JD018546, 2013.
Ren, H. L., Lu, B., Wan, J., Tian, B., and Zhang, P.: Identification Standard for ENSO Events and Its Application to Climate Monitoring and Prediction in China, J. Meteorol. Res., 32, 923–936, https://doi.org/10.1007/s13351-018-8078-6, 2018.
Shi, J. and Qian, W.: Asymmetry of two types of ENSO in the transition between the East Asian winter monsoon and the ensuing summer monsoon, Clim. Dyn., 51, 3907–3926, https://doi.org/10.1007/s00382-018-4119-1, 2018.
Singh, R. P., Sarkar, S., and Singh, A.: Effect of El Niño on inter-annual variability of ozone during the period 1978-2000 over the Indian subcontinent and China, Int. J. Remote Sens., 23, 2449–2456, https://doi.org/10.1080/01431160110075893, 2002.
Sudo, K. and Takahashi, M.: Simulation of tropospheric ozone changes during 1997-1998 El Niño: Meteorological impact on tropospheric photochemistry, Geophys. Res. Lett., 28, 4091–4094, https://doi.org/10.1029/2001GL013335, 2001.
Sun, L., Xue, L., Wang, Y., Li, L., Lin, J., Ni, R., Yan, Y., Chen, L., Li, J., Zhang, Q., and Wang, W.: Impacts of meteorology and emissions on summertime surface ozone increases over central eastern China between 2003 and 2015, Atmos. Chem. Phys., 19, 1455–1469, https://doi.org/10.5194/acp-19-1455-2019, 2019.
Wang, B., Wu, R., and Fu, X.: Pacific-East Asian teleconnection: How does ENSO affect East Asian climate?, J. Clim., 13, 1517–1536, https://doi.org/10.1175/1520-0442(2000)013<1517:PEATHD>2.0.CO;2, 2000.
Wang, B., Luo, X., and Liu, J.: How robust is the asian precipitation-ENSO relationship during the industrial warming period (1901–2017)?, J. Clim., 33, 2779–2792, https://doi.org/10.1175/JCLI-D-19-0630.1, 2020.
Wang, C. and Wang, X.: Classifying el niño modoki I and II by different impacts on rainfall in southern China and typhoon tracks, J. Clim., 26, 1322–1338, https://doi.org/10.1175/JCLI-D-12-00107.1, 2013.
Wang, X., Jacob, D. J., Downs, W., Zhai, S., Zhu, L., Shah, V., Holmes, C. D., Sherwen, T., Alexander, B., Evans, M. J., Eastham, S. D., Neuman, J. A., Veres, P. R., Koenig, T. K., Volkamer, R., Huey, L. G., Bannan, T. J., Percival, C. J., Lee, B. H., and Thornton, J. A.: Global tropospheric halogen (Cl, Br, I) chemistry and its impact on oxidants, Atmos. Chem. Phys., 21, 13973–13996, https://doi.org/10.5194/acp-21-13973-2021, 2021.
Wie, J., Moon, B., Yeh, S., Park, R. J., and Kim, B.: La Niña-related tropospheric column ozone enhancement over East Asia, Atmos. Environ., 261, 118575, https://doi.org/10.1016/j.atmosenv.2021.118575, 2021.
Wu, B., Zhou, T., and Li, T.: Atmospheric dynamic and thermodynamic processes driving the western North Pacific anomalous anticyclone during El Niño. Part I: Maintenance mechanisms, J. Clim., 30, 9621–9635, https://doi.org/10.1175/JCLI-D-16-0489.1, 2017a.
Wu, B., Zhou, T., and Li, T.: Atmospheric dynamic and thermodynamic processes driving the western north Pacific anomalous anticyclone during El Niño. Part II: Formation processes, J. Clim., 30, 9637–9650, https://doi.org/10.1175/JCLI-D-16-0495.1, 2017b.
Xie, S. P., Hu, K., Hafner, J., Tokinaga, H., Du, Y., Huang, G., and Sampe, T.: Indian Ocean capacitor effect on Indo-Western pacific climate during the summer following El Niño, J. Clim., 22, 730–747, https://doi.org/10.1175/2008JCLI2544.1, 2009.
Xue, L., Ding, A., Cooper, O., Huang, X., Wang, W., Zhou, D., Wu, Z., McClure-Begley, A., Petropavlovskikh, I., Andreae, M. O., and Fu, C.: ENSO and Southeast Asian biomass burning modulate subtropical trans-Pacific ozone transport, Natl. Sci. Rev., 8, nwaa132, https://doi.org/10.1093/nsr/nwaa132, 2021.
Xu, K., Huang, Q.-L., Tam, C.-Y., Wang, W., Chen, S., and Zhu, C.: Roles of tropical SST patterns during two types of ENSO in 5 modulating wintertime rainfall over southern China, Clim. Dyn., 52, 523–538, https://doi.org/10.1007/s00382-018-4170-y, 2018.
Xu, L., Yu, J. Y., Schnell, J. L., and Prather, M. J.: The seasonality and geographic dependence of ENSO impacts on U.S. surface ozone variability, Geophys. Res. Lett., 44, 3420–3428, https://doi.org/10.1002/2017GL073044, 2017.
Yang, J., Liu, Q., Xie, S. P., Liu, Z., and Wu, L.: Impact of the Indian Ocean SST basin mode on the Asian summer monsoon, Geophys. Res. Lett., 34, 1–5, https://doi.org/10.1029/2006GL028571, 2007.
Yantosca, B.: geoschem/geos-chem: GEOS-Chem 12.3.2 (12.3.2), Zenodo [code], https://doi.org/10.5281/zenodo.2658178, 2019.
Yeh, S. W., Kug, J. S., Dewitte, B., Kwon, M. H., Kirtman, B. P., and Jin, F. F.: El Niño in a changing climate, Nature, 461, 511–514, https://doi.org/10.1038/nature08316, 2009.
Young, P. J., Naik, V., Fiore, A. M., Gaudel, A., Guo, J., Lin, M. Y., Neu, J. L., Parrish, D. D., Rieder, H. E., Schnell, J. L., Tilmes, S., Wild, O., Zhang, L., Ziemke, J., Brandt, J., Delcloo, A., Doherty, R. M., Geels, C., Hegglin, M. I., Hu, L., Im, U., Kumar, R., Luhar, A., Murray, L., Plummer, D., Rodriguez, J., Saiz-Lopez, A., Schultz, M. G., Woodhouse, M. T., and Zeng, G.: Tropospheric ozone assessment report: Assessment of global-scale model performance for global and regional ozone distributions, variability, and trends, Elementa, 6, 10, https://doi.org/10.1525/elementa.265, 2018.
Yu, J. Y., Kao, H. Y., and Lee, T.: Subtropics-related interannual sea surface temperature variability in the central equatorial pacific, J. Clim., 23, 2869–2884, https://doi.org/10.1175/2010JCLI3171.1, 2010.
Yu, J. Y., Zou, Y., Kim, S. T., and Lee, T.: The changing impact of El Niño on US winter temperatures, Geophys. Res. Lett., 39, L15702, https://doi.org/10.1029/2012GL052483, 2012.
Yu, S. and Sun, J.: Revisiting the relationship between El Niño-Southern Oscillation and the East Asian winter monsoon, Int. J. Climatol., 38, 4846–4859, https://doi.org/10.1002/joc.5702, 2018.
Yu, X., Wang, Z., Zhang, H., and Zhao, S.: Impacts of different types and intensities of El Niño events on winter aerosols over China, Sci. Total Environ., 655, 766–780, https://doi.org/10.1016/j.scitotenv.2018.11.090, 2019.
Yu, X., Wang, Z., Zhang, H., He, J., and Li, Y.: Contrasting impacts of two types of El Niño events on winter haze days in China's Jing-Jin-Ji region, Atmos. Chem. Phys., 20, 10279–10293, https://doi.org/10.5194/acp-20-10279-2020, 2020.
Zhang, W., Jin, F. F., Li, J., and Ren, H. L.: Contrasting impacts of two-type El Niño over the western North Pacific during boreal autumn, J. Meteorol. Soc. Japan, 89, 563–569, https://doi.org/10.2151/jmsj.2011-510, 2011.
Ziemke, J. R. and Chandra, S.: La Niña and El Niño – Induced variabilities of ozone in the tropical lower atmosphere during 1970–2001, Geophys. Res. Lett., 30, 30–33, https://doi.org/10.1029/2002GL016387, 2003.
Ziemke, J. R., Chandra, S., Oman, L. D., and Bhartia, P. K.: A new ENSO index derived from satellite measurements of column ozone, Atmos. Chem. Phys., 10, 3711–3721, https://doi.org/10.5194/acp-10-3711-2010, 2010.
Zou, H., Ji, C., Zhou, L., Wang, W., and Jian, Y.: ENSO Signal in Total Ozone over Tibet, Adv. Atmos. Sci., 18, 231–238, 2001.