the Creative Commons Attribution 4.0 License.
the Creative Commons Attribution 4.0 License.
 | 03 Jun 2022
Source and variability of formaldehyde (HCHO) at northern high latitudes: an integrated satellite, aircraft, and model study
Tianlang Zhao
William R. Simpson
Isabelle De Smedt
Thomas F. Hanisco
Glenn M. Wolfe
Jason M. St. Clair
Gonzalo González Abad
Caroline R. Nowlan
Barbara Barletta
Simone Meinardi
Donald R. Blake
Eric C. Apel
Rebecca S. Hornbrook
Here we use satellite observations of formaldehyde (HCHO) vertical column densities (VCD) from the TROPOspheric Monitoring Instrument (TROPOMI), aircraft measurements, combined with a nested regional chemical transport model (GEOS-Chem at resolution), to better understand the variability and sources of summertime HCHO in Alaska. We first evaluate GEOS-Chem with in-situ airborne measurements during the Atmospheric Tomography Mission 1 (ATom-1) aircraft campaign. We show reasonable agreement between observed and modeled HCHO, isoprene, monoterpenes and the sum of methyl vinyl ketone and methacrolein (MVK+MACR) in the continental boundary layer. In particular, HCHO profiles show spatial homogeneity in Alaska, suggesting a minor contribution of biogenic emissions to HCHO VCD. We further examine the TROPOMI HCHO product in Alaska in summer, reprocessed by GEOS-Chem model output for a priori profiles and shape factors. For years with low wildfire activity (e.g., 2018), we find that HCHO VCDs are largely dominated by background HCHO (58 %–71 %), with minor contributions from wildfires (20 %–32 %) and biogenic VOC emissions (8 %–10 %). For years with intense wildfires (e.g., 2019), summertime HCHO VCD is dominated by wildfire emissions (50 %–72 %), with minor contributions from background (22 %–41 %) and biogenic VOCs (6 %–10 %). In particular, the model indicates a major contribution of wildfires from direct emissions of HCHO, instead of secondary production of HCHO from oxidation of larger VOCs. We find that the column contributed by biogenic VOC is often small and below the TROPOMI detection limit, in part due to the slow HCHO production from isoprene oxidation under low NOx conditions. This work highlights challenges for quantifying HCHO and its precursors in remote pristine regions.
- Article
(4114 KB) - Full-text XML
-
Supplement
(5649 KB) - BibTeX
- EndNote


The Arctic (north of 66.5∘ N) and boreal region (between 45 and 65∘ N) have undergone dramatic temperature and ecological changes over the past century, and the rate of this change has accelerated in recent decades (Cohen et al., 2014). Satellite-based observations of leaf area index (LAI) and normalized difference vegetation index (NDVI) suggest that northern high latitudes have shown a significant trend of greening in the past three decades as a result of vegetation growth (Bhatt et al., 2017; Keeling et al., 1996; Myers-Smith et al., 2011; Myneni et al., 1997; Xu et al., 2013; Zhou et al., 2001; Zhu et al., 2016), in part because the temperature is the limiting factor for vegetation growth in this region (Nemani et al., 2003). In the meantime, boreal forest fires have shown an increasing trend over the past few decades, which is likely to continue (Abatzoglou and Williams, 2016).
Volatile organic compounds (VOCs) emitted from terrestrial vegetation play a major role in air quality and chemistry-climate interactions (Guenther et al., 1995). These biogenic VOCs (BVOCs) undergo photochemical degradation, leading to the formation of ozone and aerosol particles that play major roles in climate and air quality (Mao et al., 2018). Biogenic VOCs account for more than 80 % of global VOC emissions and represent a major source of reactive carbon to the atmosphere (Guenther et al., 1995, 2006). Primary biogenic VOCs, including both isoprene (2-methyl-1, 3-butadiene, C5H8) and monoterpenes (a class of terpenes that consists of two isoprene units, C10H16), rapidly producing HCHO through oxidation after being emitted to the atmosphere (Millet et al., 2006; Palmer et al., 2006). The emissions of these biogenic VOCs are dependent on the air temperature, light intensity, plant functional type (PFT), LAI, leaf age, soil moisture, ambient carbon dioxide (CO2) concentrations and a number of other factors (Guenther et al., 2006). It has been suggested that at least some ecosystems in northern high latitudes are highly sensitive to temperature, leading to a strong increase in BVOC emissions in recent years (Kramshøj et al., 2016; Lindwall et al., 2016). BVOC emissions are further complicated by land cover and LAI changes in this region (Tang et al., 2016).
Biogenic VOC emissions in the Arctic and boreal region are poorly characterized, due to a lack of measurements. Previous measurements have generally focused on European boreal forests, with a major focus on monoterpenes (Bäck et al., 2012; Juráň et al., 2017; Rantala et al., 2015; Rinne et al., 2000; Spirig et al., 2004; Zhou et al., 2017). Biogenic VOC emissions in other boreal forests outside of Europe have been rarely quantified. Some early aircraft-based measurements show abundant isoprene in Alaskan boreal forests (Blake et al., 1992), suggesting a major gap in the current understanding of BVOC emissions in this region. Isoprene fluxes in tundra systems have been measured in Greenland (Kramshøj et al., 2016; Lindwall et al., 2016; Vedel-Petersen et al., 2015), northern Sweden (Faubert et al., 2010; Tang et al., 2016) and the Alaskan North Slope (Angot et al., 2020; Potosnak et al., 2013). All these tundra measurements show a very strong positive temperature dependence of isoprene fluxes, likely due to higher emission potentials for isoprenoids than temperate species (Rinnan et al., 2014). The high temperature sensitivity suggests that climate warming plays an important role on BVOC emissions.
HCHO serves as an important indicator of BVOC emissions on regional and global scales (Millet et al., 2006). The HCHO column density has been observed from space by several satellite sensors, including the Global Ozone Monitoring Experiment (GOME) (Palmer et al., 2001), the Scanning Imaging Absorption Spectrometer for Atmospheric Cartography (SCIAMACHY) (De Smedt et al., 2008) and the Ozone Monitoring Instrument (OMI) (González Abad et al., 2015). A number of studies use satellite-based observations of the HCHO column density to quantify regional and global isoprene emissions in vegetated regions (Guenther et al., 2006; Millet et al., 2008; Palmer et al., 2003, 2006; Stavrakou et al., 2009, 2014) and their interannual variability (De Smedt et al., 2010, 2015; Stavrakou et al., 2014, 2015, 2018; Zhu et al., 2017; Bauwens et al., 2016).
Biomass burning represents another major source of HCHO from both primary emissions and secondary production from VOC precursors. Biomass burning is the second largest source of global non-methane volatile organic compounds (NMVOCs) after biogenic emissions (Yokelson et al., 2008). The GFED4s burned area dataset including small fires shows that boreal forests are responsible for 2.5 % of global burned area but 9 % of fire carbon emission and 15 % of fire methane (CH4) emission (van der Werf et al., 2017). Several studies have reported a similar level of HCHO emitted from wildfire plumes. Liu et al. (2017) found formaldehyde to be the second most abundant NMVOC from wildfires in western US, with an emission factor of 2.3 (±0.3) g kg−1 dry matter for temperate forests and a similar emission factor for boreal forest fires. WE-CAN aircraft measurement reports the HCHO emission factor in near-fire smoke plume to be 1.9 (±0.43) g kg−1 (Permar et al., 2021). As boreal fires have become more intense in the past few decades (Macias Fauria and Johnson, 2008), HCHO from boreal fires is likely to play an important role in the temporal and spatial variability of HCHO in this region.
While satellite-based observations of HCHO appear promising, their application in air quality and regional photochemical modeling remains challenging. There are large uncertainties and inconsistencies among different satellite-based sensors and retrieval methods for HCHO, due to instrumental sensitivity, retrieval algorithms, timing of observations with respect to the diurnal cycle, as well as several other factors (De Smedt et al., 2015; Zhu et al., 2016). Zhu et al. (2016) show that differences among these satellite sensors can be as much as a factor of 2, posing a challenge for the comparison of different satellite-based HCHO observations. Another uncertainty lies in the reference sector correction, which is usually done by subtracting the retrieved SCD measured over the remote Pacific from the retrieved terrestrial SCD observed at the same latitude (Khokhar et al., 2005). The corrected differential SCD, which is referred to as “dSCD”, represents a HCHO enhancement relative to the Pacific background (Zhu et al., 2016). Several studies have shown systematic biases in satellite HCHO products. Wolfe et al. (2019) finds a small bias in OMI HCHO when comparing to ATom-1 and ATom-2 datasets. Using FTIR ground-based measurements, Vigouroux et al. (2020) finds a positive bias of 25 % in the TROPOMI HCHO vertical column density in regions with low HCHO (<2.5×10¹⁵ molecules cm−2) and a negative bias of 31 % in regions with high HCHO (>8.0×10¹⁵ molecules cm−2), which is consistent with a recent comparison between MAX-DOAS and TROPOMI (De Smedt et al., 2021). Zhu et al. (2020) find a similar bias for the OMI HCHO product, with in-situ measurements from aircraft campaigns.
Here, we use satellite-based observations of HCHO VCDs from TROPOMI, aircraft measurements, combined with a high-resolution chemical transport model (GEOS-Chem at resolution), to better understand the sources and variability of summertime HCHO in Alaska.
2.1 TROPOMI
In this study, we use the TROPOMI operational level 2 (L2) HCHO vertical column density (VCD) product, version 1.1.5-7. The TROPOMI sensor on board the Sentinel-5 Precursor (S5P) satellite provides a horizontal resolution of 3.5×7 km from May 2018 to August 2019, 3.5×5.5 km since August 2019. This product provides a continuous record of reprocessed + offline data (RPRO+OFFL) since May 2018. More details can be found in the S5P TROPOMI HCHO L2 product user manual (Veefkind et al., 2012).
The retrieval algorithm for the S5P TROPOMI HCHO product is based on the DOAS technique, following the OMI QA4ECV product retrieval algorithm (http://www.qa4ecv.eu/ecv/hcho-p/data, last access: 20 May 2022) detailed in De Smedt et al. (2018). The HCHO slant column density (SCD1,SAT) is retrieved in the fitting window of 328.5–359 nm (TROPOMI channel 3). The DOAS reference spectrum is based on the spectra averaged over the tropical Pacific region from previous day (Vigouroux et al., 2020). Therefore, since dSCDSAT is derived from the difference between local spectra and the reference spectrum, it quantifies the slant column exceeding the average Pacific background. The L2 product provides an air mass factor (AMFSAT) to convert slant column absorbances of trace gases to vertical column absorbances. AMFSAT is computed from a radiative transfer model (RTM) VLIDORT v2.6 (Spurr, 2008) and is dependent on the observation geometry, surface albedo, cloud properties, and the vertical distribution of relevant species. The retrieval uses the 1×1∘ monthly averaged surface albedo measured by OMI (Kleipool et al., 2008). A priori vertical profiles of relevant species are provided by the daily forecast of a chemical transport model, TM5-MP, at 1×1∘ spatial resolution (Williams et al., 2017).
To correct for possible systematic time- and latitude-dependent offsets, a reference sector correction is applied to calculate the differential slant column, dSCDSAT. This correction is based on the background HCHO column over remote oceanic regions, provided by a chemical transport model (TM5-MP). The TROPOMI-measured HCHO differential slant column, dSCDSAT equals the SCD1,SAT minus the reference sector SCDRef,SAT. The reference sector SCDRef,SAT consists of two parts, an across-track correction (the mean SCD1,SAT in the equatorial reference sector ([−5, 5∘], [180, 240∘])) and the zonal along-track correction (a polynomial of all-rows-combined mean SCD1,SAT in 5∘ latitude bins (only selecting SCD1,SAT lower than 5×10¹⁶ molecules cm−2) in the reference sector ([−90, 90∘], [180, 240∘])). The resulting differential column, dSCDSAT, is then added to the background slant column calculated by the TM5-MP CTM, for the tropospheric vertical column (VCDSAT):
Here, SCD1,SAT is the measured slant column density, SCDRef,SAT is the background slant column correction in the reference sector. AMFSAT is the air mass factor provided by the TROPOMI HCHO product. AMF0,SAT is the air mass factor for the background column in the reference sector. VCD0,CTM is the vertical column in reference sector calculated by a CTM model (TM5-MP CTM), in the TROPOMI HCHO product. Further details can be referred to De Smedt et al. (2018).
Following the S5P TROPOMI HCHO L2 user manual (Veefkind et al., 2012), we applied several criteria to ensure the data quality in this work. This includes: (1) quality assurance values (QA) greater than 0.5; (2) cloud fraction at 340 nm less than 0.5; (3) a solar zenith angle (SZA) less than 60∘; (4) a surface albedo less than 0.1 and (5) a derived AMF greater than 0.1. In particular, northern Alaska can be covered by snow and ice even in summer with the criteria of the surface albedo. We do not use the data over the snow/ice surface, as the retrieval algorithm may not work well on these surfaces (De Smedt et al., 2018). We use the overpass data in the local time window 12:00–15:00 AKDT (20:00–23:00 UTC).
To compare the HCHO column density from TROPOMI with our model, we recalculate the AMF based on vertical shapes derived from GEOS-Chem simulations and the scattering weight from the TROPOMI HCHO product. GEOS-Chem vertical profiles are updated hourly with collocated TROPOMI HCHO pixels. This method has been applied in a number of previous studies (Palmer et al., 2001; Boersma et al., 2004; González Abad et al., 2015; Zhu et al., 2016).
Here, ΩGC(p) is the column density of the air parcel at vertical air pressure p, for a specific air column. ΩA,GC is the total column of the specific air column, w(p) is the scattering weight of the TROPOMI HCHO product at each altitude, calculated by the product of TROPOMI averaging kernel and air mass factor AMFSAT and Ps is the surface layer pressure.
We further replace the original background HCHO (VCD0,SAT in Eq. 1), taken from the TM5-MP model, with VCD0,GC from a nested GEOS-Chem background simulation (González Abad et al., 2015; Kaiser et al., 2018). The GEOS-Chem background simulation is performed over the reference sector, with both biogenic and biomass burning emissions switched off (Table 1). Following De Smedt et al. (2018), we do not consider the variability of the AMF0,GC/AMFGC (AMF0,GC is AMFGC in the reference sector averaged in 5∘ latitude bins), and the reprocessed TROPOMI HCHO VCD is expressed as
We estimate the total uncertainty of the reprocessed TROPOMI HCHO vertical column to be ≥90 % fora fire-free region (TROPOMI L2 HCHO Algorithm Theoretical Basis Document, https://sentinels.copernicus.eu/documents/247904/2476257/, last access: 24 February 2022, and references therein). This includes 75 % of uncertainties from the AMFSAT, 25 % from dSCDSAT and 40 % from VCD0,SAT. The uncertainties in regions with strong fire are estimated to be ≥35 %, including 30 % of uncertainties from AMFSAT, 15 % from dSCDSAT and 10 % from VCD0,SAT. The relative lower uncertainties reflect much stronger VCDs in these wildfire regions.
2.2 ATom-1 aircraft campaign
The NASA Atmospheric Tomography (ATom) studied atmospheric compositions in remote regions (Wofsy et al., 2018). ATom had four phases over a 2 year period, with each phase sampling the global atmosphere in one of four seasons. ATom deployed a comprehensive gas and aerosol particle measurement payload on the NASA DC-8 aircraft. During ATom-1, two flights sampled eight vertical profiles over Alaska during 1–3 August 2016. We make use of 1 min averaged measurements of HCHO, isoprene, monoterpenes (α-pinene and β-pinene) and the sum of methyl vinyl ketone and methacrolein (MVK+MACR). HCHO measurements sampled in 1 Hz frequency were made by laser-induced fluorescence by the NASA In Situ Airborne Formaldehyde (ISAF) instrument (Cazorla et al., 2015). Isoprene and monoterpenes were measured by two instruments: the University of Irvine Whole Air Sampler (WAS) followed by laboratory gas chromatography (GC) analysis, sampled every 3–5 min (Simpson et al., 2020), and the National Center for Atmospheric Research (NCAR) Trace Organic Gas Analyzer (TOGA), sampled every 2 min with a 35 s integrated sampling time (Apel et al., 2021). MVK and MACR were also measured by TOGA. These measurements are interpolated to 1 min time resolution for model comparison. Within our study domain, there are 341 1 min averaged mixing ratio values for HCHO, 101 and 231 for isoprene and α-pinene/β-pinene from WAS, 337 for isoprene, α-pinene/β-pinene and MVK/MACR from TOGA. The reported measurement uncertainties are ±10 % for HCHO, ±10 % for WAS isoprene and monoterpenes, ±15 % for TOGA isoprene and ±30 % for TOGA monoterpenes, ±30 % for MVK and ±20 % for MACR.
2.3 Nested GEOS-Chem simulation
GEOS-Chem is a 3-D global chemical transport model driven by the Modern-Era Retrospective Analysis for Research and Applications, Version 2 (MERRA-2) by the Global Modeling and Assimilation Office (GMAO) at NASA's Goddard Space Flight Center (Rienecker et al., 2011), at a horizontal resolution of 0.5×0.625∘ and 72 vertical layers from surface to 0.01 hPa. Here, we use GEOS-Chem v12.7.2 (http://wiki.seas.harvard.edu/geos-chem/index.php/GEOS-Chem_12#12.7.2, last access: 20 April 2022), with an update on cloud chemistry (https://github.com/geoschem/geos-chem/issues/906, last access: 20 April 2022). GEOS-Chem v12.7.2 provides a new nested capability, FlexGrid, allowing users to define the model grid at run time (http://wiki.seas.harvard.edu/geos-chem/index.php/FlexGrid, last access: 20 April 2022). We take advantage of this nested capability to investigate the spatial variability of HCHO and VOCs over the Alaska domain (170–130∘ W, 50–75∘ N), at a horizontal resolution of 0.5×0.625∘. The boundary conditions for the nested run are from a GEOS-Chem global simulation at 2×2.5∘, updated every 3 h. The nested simulation was conducted for two summers (1 May to 31 August) in 2018 and 2019.
Biomass burning emissions follow the Global Fire Emission Database, GFED4.1s biomass burning emissions processed for GEOS-Chem (Giglio et al., 2013). We use 3 h emissions calculated in GFED4.1s based on fire detection and burning area from MODIS satellite (van der Werf et al., 2017). The biomass burning emissions in 2018 and 2019 have been updated to reflect the year-specific emissions. The GFED4s inventory reports the HCHO emission factor to be 1.86 g kg−1 dry matter for boreal forest fires and 2.09 g kg−1 dry matter for temperate forest fires, consistent with recent field measurements (Liu et al., 2017; Permar et al., 2021).
BVOC emissions in the model are calculated using the Model of Emissions of Gases and Aerosols from Nature (MEGAN, v2.1) (Guenther et al., 2006, 2012). In this work, BVOC emission activity factors are calculated online, expressed as
Here, Cce is a standard environment coefficient normalizing γ to 1 under standard environmental conditions. LAI is the leaf area index (m2m−2), γP and γT are emission activity factors accounting for light and temperature effects, respectively; γP is calculated based on the photosynthetic photon flux density (PPFD) (µmol of photons in 400–700 nm range m−2 s−1). Terrestrial vegetation for BVOC emissions is based on the plant functional type (PFT) distribution derived from the Community Land Model (CLM4) (Lawrence et al., 2011; Oleson et al., 2013). CLM4 output suggests two dominating PFTs in the state of Alaska: needle leaf evergreen boreal trees (mainly in the interior boreal forest region) and broadleaf deciduous boreal shrubs (mainly over North Slope and southwest Alaska), both with high emission factors in isoprene (3000 and 4000 µg m−2 h−1, respectively) and low EFs in monoterpenes (α-pinene +β-pinene, 800 and 300 µg m−2 h−1, respectively). Thus, we expect a major contribution from isoprene to BVOC emissions in Alaska in the model results. Despite the shrub having a higher emission factor of isoprene, we expect a larger isoprene emission flux from the central Alaska boreal forest region mainly due to higher temperatures and LAI.
In this work, we use the detailed O3-NOx-HOx-VOC chemistry (“tropchem” mechanism) (Park et al., 2004; Mao et al., 2010, 2013), with updates on isoprene chemistry (Fisher et al., 2016). This version of isoprene chemistry in GEOS-Chem has been extensively evaluated by recent field campaigns and satellite observations over southeast US (Fisher et al., 2016; Travis et al., 2016), including HCHO production from isoprene oxidation (Zhu et al., 2016, 2020; Kaiser et al., 2018). To our knowledge, this chemistry has not been evaluated at northern high latitudes. In general, under high-NOx conditions (1 ppbv), HCHO production is prompt, reaching 70 %–80 % of its maximum yield within a few hours. While under low-NOx conditions (0.1 ppbv or lower) it takes several days to reach the maximum yield, and the cumulative yield is still lower than the high-NOx condition by a factor of 2–3 (Marais et al., 2012).
For the comparisons between observations and model shown below, we sample the model output along the flight track at a flight time with 1 min time resolution. To examine the influence of different sources on HCHO columns in Alaska, we conducted a series of nested GEOS-Chem simulations, as described in Table 1. The background HCHO column (VCD0,GC) is calculated from a GEOS-Chem simulation where both biogenic emissions and biomass burning emissions are turned off. The HCHO differential column induced by wildfire or biogenic emission is derived from the difference between the control run and the run with wildfire or biogenic emission turned off. The boundary conditions are provided by a global simulation with both wildfire and biogenic emission turned on.
Table 1Configurations of GEOS-Chem nested simulations in this study.
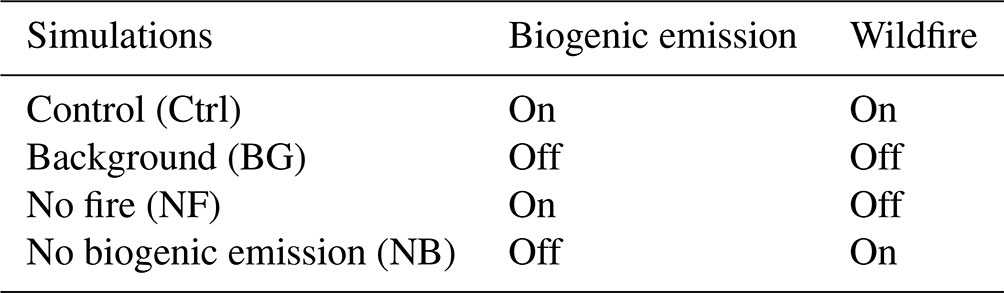
Figure 1 shows a comparison of measured and modeled vertical profiles of formaldehyde, isoprene, monoterpenes and MVK+MACR across the Alaska domain during ATom-1. We show that the measured HCHO mixing ratio decreases exponentially from <2 km near the surface (405 pptv) to the ∼ 10 km upper troposphere (100 pptv). The HCHO surface mixing ratio in Alaska is an order of magnitude lower than other high-BVOC regions such as Southeast US (Li et al., 2016). Observed isoprene and monoterpenes show the highest mixing ratios in the lowest 2 km layer. The mean observed isoprene mixing ratio from WAS is ∼ 82 pptv in the boundary layer, a factor of 10 higher than that of monoterpenes from WAS (7 pptv). Measurements from TOGA also shows the predominant role of isoprene but in relatively lower levels near the surface (mean value, isoprene: ∼ 28 pptv, monoterpenes: ∼ 2 pptv). We also find that the observed sum of MVK and MACR shows enhancement in the boundary layer with a mean mixing ratio of 38 pptv, in line with observed isoprene. As isoprene has a shorter lifetime (∼ 1.1 h) than monoterpenes (∼ 2.1 h), this indicates a stronger isoprene emission flux than monoterpene emission flux over Alaskan boreal forests. The predominance of isoprene emissions in Alaskan boreal forests is different from some European boreal forests, where monoterpenes are often the predominant BVOC species (Juráň et al., 2017; Bäck et al., 2012).
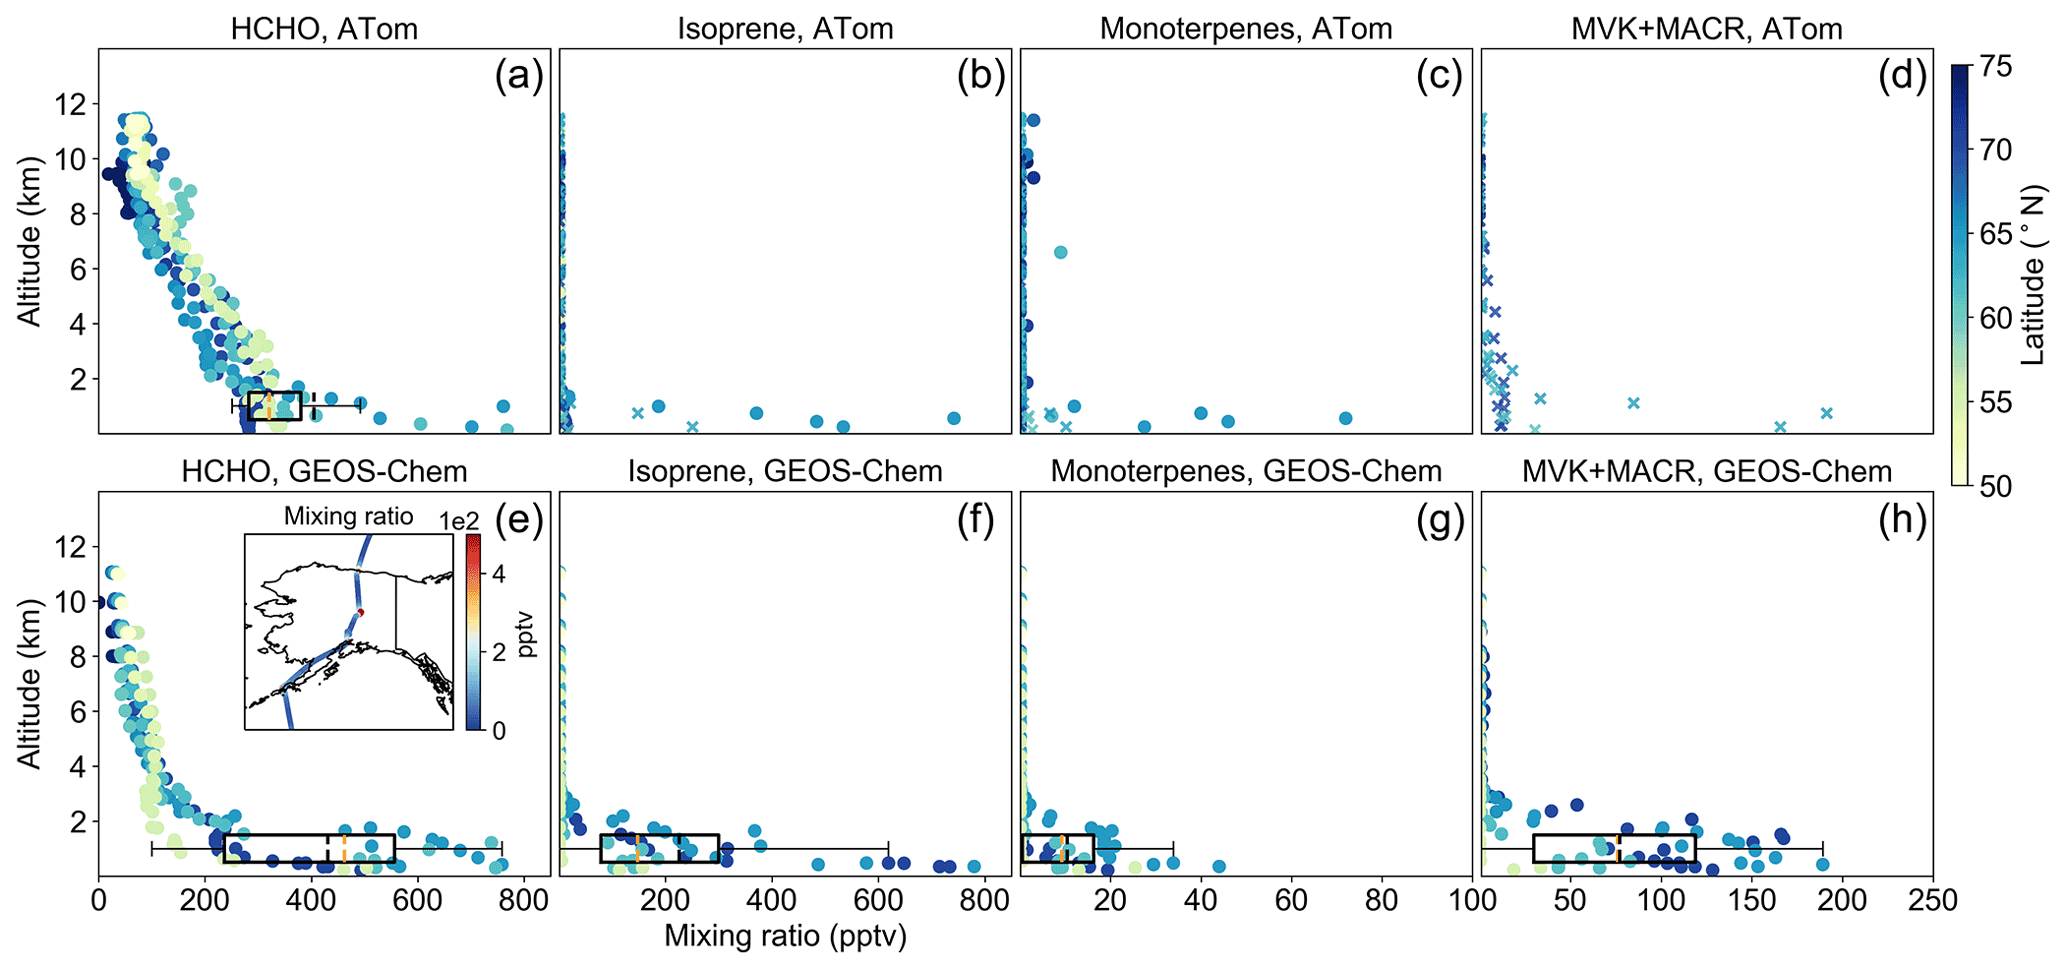
Figure 1Vertical profiles of HCHO, isoprene, monoterpenes and MVK+MACR mixing ratios from ATom-1 and GEOS-Chem, along the ATom-1 flight track from 1 August 2016, 20:11 UTC, to 3 August 2016, 21:20 UTC. GEOS-Chem data are resampled along the ATom-1 flight track. Panels (a) to (d) are from ATom-1, panels (e) to (h) are from GEOS-Chem simulation. The subpanel in (e) shows a GEOS-Chem HCHO mixing ratio along the ATom-1 flight track crossing Alaska. For panels (b) to (d), circles represent values measured by WAS, and crosses represent measurements from TOGA. Box plots represent data distribution in <2 km layers. Orange dashes show the median values, and black dashes show the mean values.
Our model shows reasonable agreement with measurements in the boundary layer (<2 km). Modeled HCHO has a mean mixing ratio of 431 pptv, slightly higher than the observed value (405 pptv). Modeled isoprene has a mean mixing ratio of 225 pptv in the boundary layer, in agreement with observed values given the large variability of observations. Both observations and model show significantly fewer monoterpenes compared to isoprenes, on the order of tens of pptv. In addition, modeled MVK+MACR shows average mixing ratio of 77 pptv, while observations show 38 pptv, providing additional constraints on isoprene oxidation.
Our model tends to underestimate HCHO above the boundary layer (>2 km). In Fig. 1, we show that the mean modeled HCHO is 98 pptv at 3–6 km, and ∼ 46 pptv at 6–10 km, compared to observed values of 219 and 89 pptv, respectively. The reason is unknown but could be related to the large underestimate of CH3OH in the same region (Bates et al., 2021). As a result, the model-derived HCHO VCD is likely lower than that calculated from ATom measurements by 2.5×10¹⁵ molecules cm−2. Such bias may lead to a systematic bias on our estimate of background HCHO VCD0 in this region.
One remarkable feature in Fig. 1 is the spatial homogeneity in HCHO vertical profiles, as shown in both observations and model. We find that all sampled HCHO vertical profiles in Alaska show similar magnitude and vertical distribution, despite different land types and locations of these sampled profiles. The homogeneity is not observed in isoprene and monoterpene mixing ratios, which show maximums in central and south Alaska, where boreal forests are located (Fig. S1). Such spatial discrepancies between HCHO and isoprene/monoterpenes suggest a minor contribution of biogenic VOC emissions to HCHO column density over Alaska during summertime.
We further examine the abundance of isoprene and monoterpenes in Alaska with surface VOC measurements available from field campaigns at Toolik Field Station (TFS; 68∘38′ N, 149∘36′ W). Angot et al. (2020) reported surface-level ambient mixing ratios of isoprene (0–505 pptv, mean of 36.1 pptv) and monoterpenes (3–537 pptv; 14±18 pptv, median ± standard deviation) in the summers of 2018 and 2019. GEOS-Chem is in reasonable agreement with measurements at TFS, with mean isoprene and monoterpene mixing ratios of 333 and 13 pptv, respectively, during corresponding measurement periods. Both field measurements and model suggest that isoprene is the predominant BVOC in this region.
In this section, we evaluate the TROPOMI HCHO product over Alaska during the summers of 2018 and 2019. As noted above, these two years differ substantially on local wildfire emissions, providing useful information on satellite capability of detecting biogenic and wildfire HCHO in remote regions.
4.1 Background HCHO VCD in summer in Alaska
Figure 2a shows the reprocessed monthly TROPOMI HCHO vertical column density (VCDSAT,GC), along with background (VCD0,GC) in Alaska during May–August 2018. Over the Alaska domain, HCHO VCDSAT,GC peaks around the interior Alaska boreal forest region (Fig. S1), with VCDSAT,GC as 3.5×10¹⁵ molecules cm−2 in July; near the North Slope and the Gulf of Alaska, VCDSAT,GC is around 2×10¹⁵ molecules cm−2 in July.

Figure 2Reprocessed TROPOMI HCHO VCDSAT,GC and background in the summer of 2018. (a) reprocessed TROPOMI HCHO VCDSAT,GC, (b) HCHO background VCD0,GC used in the reprocessed TROPOMI product, provided by GEOS-Chem. GEOS-Chem results are applied the same local noon time window (12:00–15:00) AKDT. TROPOMI data have been regridded to GEOS-Chem output spatial resolution (0.5×0.625∘).
To understand the drivers of HCHO variability we first examine the background HCHO VCD provided by GEOS-Chem (VCD0,GC). Figure 2b shows that from May to August 2018, VCD0,GC in central Alaska increased from 1.7×10¹⁵ to 2.6×10¹⁵ molecules cm−2, then decreased to 2.1×10¹⁵ molecules cm−2, accounting for 73 %–80 % of VCDSAT,GC. This indicates that VCDSAT,GC is largely dominated by background signals VCD0,GC in 2018. The spatial pattern of VCD0,GC, most noticeable in July, is driven by the geography in Alaska, instead of surface vegetation or snow. As the majority of HCHO VCD resides in lowest atmospheric layers (Fig. 1), the high elevation in the Alaska Range in southern Alaska (63∘ N, 151∘ W, peaks at Denali, elevation 6190 m) and the Brooks Range in northern Alaska (68∘ N, 152∘ W, peaks at Mount Isto, elevation 2736 m) are responsible for the significantly lower HCHO VCD in these regions. We also find that VCD0,GC (2.4–2.8×10¹⁵ molecules cm−2) over the northern Pacific in July and August is higher than that in central Alaska. Enhanced methane oxidation likely results from the increase of water vapor and, therefore, OH production, leading to a higher HCHO production via CH3O2+ NO reactions at the near surface and CH3O2+ CH3O2 at higher altitudes. This enhanced methane oxidation also leads to a temperature dependence of VCD0,GC (Fig. S2).
4.2 Evaluating TROPOMI HCHO dVCD
Now we further examine measured HCHO signals other than modeled background. Figure 3a shows a monthly spatial pattern of TROPOMI differential HCHO vertical column (dVCD – VCD0,GC), persistent throughout summer 2018. In July 2018, the monthly dVCDSAT,GC is positive over central Alaska (8.7×10¹⁴ molecules cm−2) and the North Slope (1.1×10¹⁴ molecules cm−2) and is negative over southwest Alaska and the Gulf of Alaska ( molecules cm−2). Negative values reflect the fact that the averaged HCHO dVCDSAT is close to zero as a result of reference sector correction (TROPOMI L2 HCHO ATBD). This pattern is also seen in summer 2019 outside of the wildfire region.
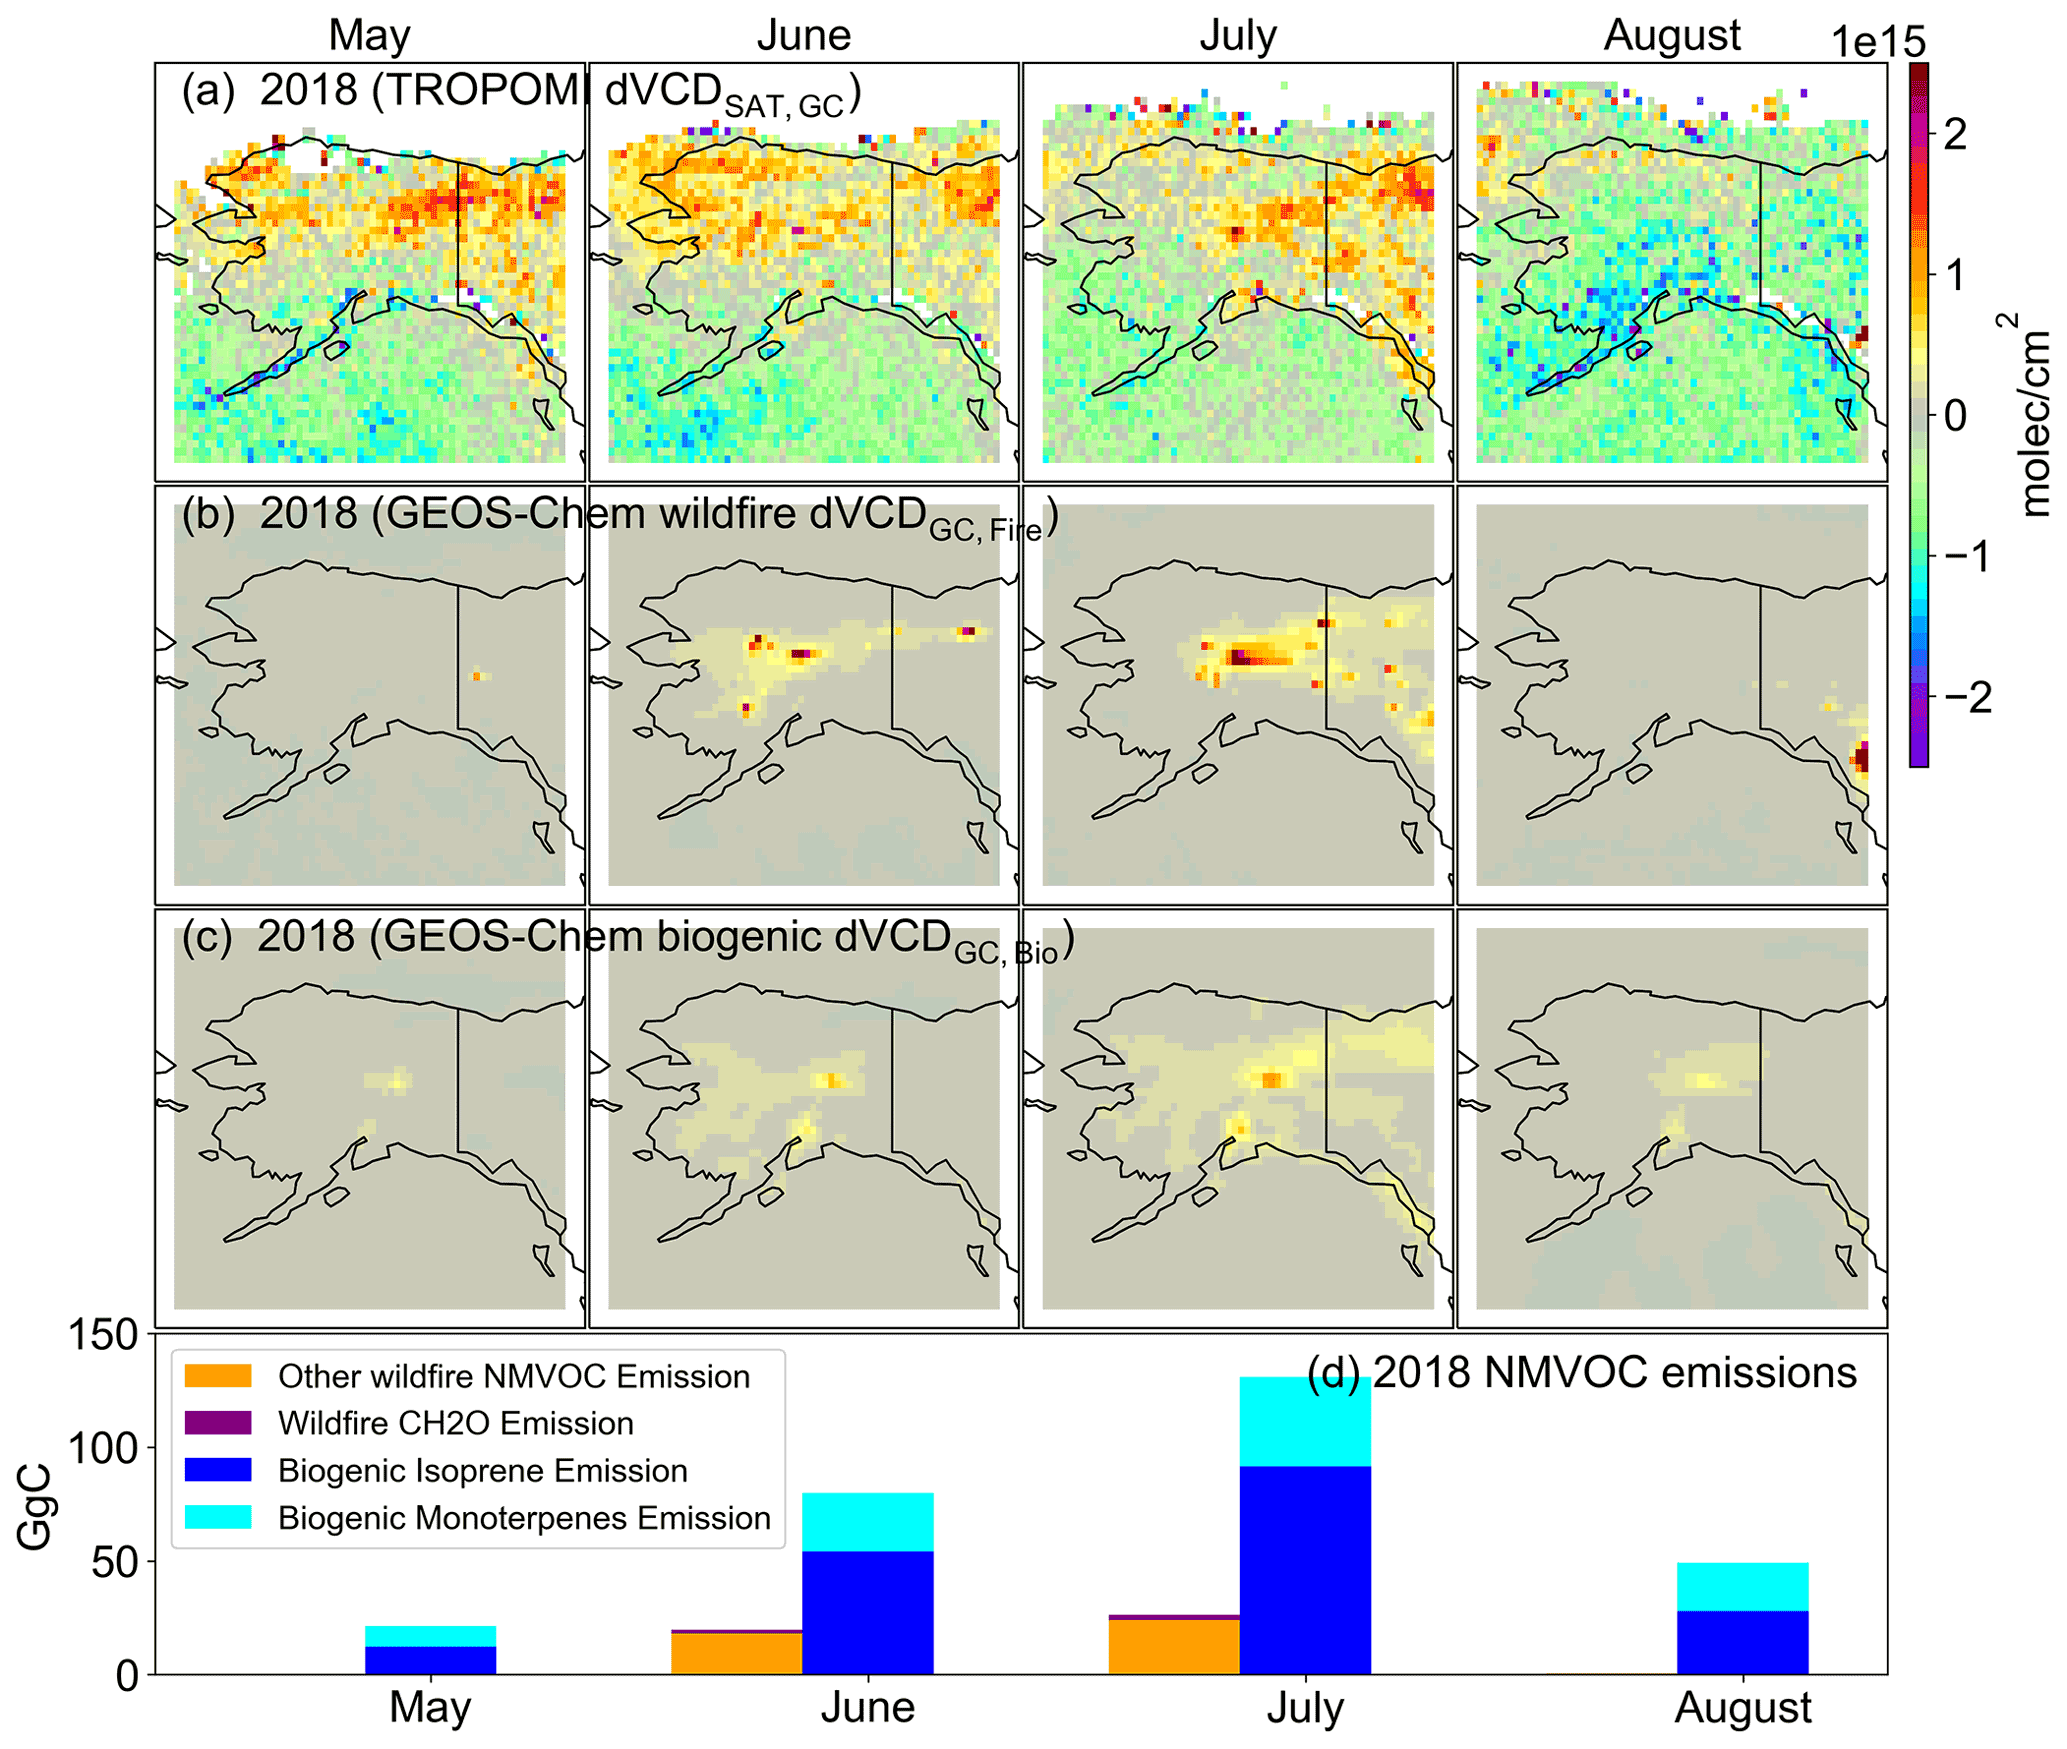
Figure 3dVCD and emission in Alaska in summer 2018. Panels (a) are reprocessed TROPOMI monthly HCHO dVCDSAT,GC in May, June, July and August (unit: molecules cm−2). Panels (b) are GEOS-Chem wildfire emission-induced monthly dVCDGC,Fire. Panels (c) are GEOS-Chem biogenic emission-induced monthly dVCDGC,Bio. Panel (d) is the total NMVOC carbon emission from terrestrial vegetation and biomass burning in Alaska each month (unit: GgC); blue bars are biogenic isoprene emissions, cyan bars are biogenic monoterpenes emissions, purple bars represent wildfire direct HCHO emissions and orange bars represent other NMVOCs emitted by wildfires.
To quantify the sources of HCHO dVCD we derive two variables: dVCD induced by wildfire emission (dVCDGC,Fire) and biogenic emission (dVCDGC,Bio), computed by the differences between the model control run and sensitivity runs with wildfire or biogenic emissions turned off (Table 1).
In Fig. 3c, we show that dVCDGC,Bio presents a similar spatial pattern and monthly cycle as modeled isoprene emission (Fig. S6), with high values over the central boreal forest region (4.5×10¹⁴ molecules cm−2) and low values in other parts (3.5–11.0×10¹³ molecules cm−2), in July 2018. The widespread biogenic HCHO enhancement can in part be explained by the slow photooxidation in Alaska and low HCHO yield under low NOx conditions (∼ 25–35 pptv near surface in GEOS-Chem) (Marais et al., 2012). Indeed, the HCHO production from isoprene and monoterpene emissions is lower under low NOx conditions than under high NOx conditions (∼ 1 ppbv) by a factor of 10 after 24 h of oxidation, and it only reaches 20 % of its 5 d cumulative yield, leading to a suppressed but prolonged HCHO production (Marais et al., 2012). As a result, dVCDGC,Bio in Alaska is lower than that in mid-latitude by more than a factor of 10 for the same amount of isoprene emissions.
Despite the relatively weak Alaskan fire in summer 2018, we find a higher fraction of dVCDGC,Fire than dVCDGC,Bio in total dVCDGC. Figure 3b shows a dVCDGC,Fire enhancement of molecules cm−2 co-located around fire hot spots. The GFED4s burning area measured by MODIS is shown in Fig. S5. A model sensitivity test in 2018 suggests that over 90 % of dVCDGC,Fire is from wildfire direct emission, instead of secondary production of HCHO from oxidation of other VOCs. The HCHO emission factor in our model is consistent with recent in-situ measurements in wildfire smoke, providing indirect evaluation on the model HCHO under strong wildfires (Liu et al., 2017; Permar et al., 2021). It can also partly be due to the lack of wildfire VOC emissions (Akagi et al., 2011) and the underestimation of secondary wildfire VOC oxidation (Liao et al., 2021; Alvarado et al., 2020). The predominance of combustion HCHO in dVCDGC,Fire is consistent with the strong localization of dVCDGC,Fire enhancement, as the HCHO lifetime is on the order of hours in the presence of sunlight. This also explains why weak wildfire emission (46 GgC) can lead to a stronger HCHO dVCD than biogenic emission (281 GgC) does. As a result, dVCDGC,Fire contributes to 20 %–32 % of dVCDGC, while dVCDGC,Bio contributes to 8 %–10 % of dVCDGC. Wildfire and biogenic emission are both important for dVCDGC and are most active in central boreal forest region, posing a challenge to attribute TROPOMI dVCDSAT,GC to individual sources.
4.3 Impacts of wildfire on HCHO column in Alaska
Figure 4a shows monthly VCDSAT,GC in the 2019 Alaskan summer. In contrast to 2018, TROPOMI observations show an extensive HCHO VCD enhancement over central Alaska in July 2019. The monthly average value reaches 8.7×10¹⁵ molecules cm−2. In Fig. 5, GEOS-Chem VCDGC reproduces the spatial and temporal variation of VCDSAT,GC for the summer of 2019. VCDGC shows a monthly HCHO VCD value of 1.2×10¹⁶ molecules cm−2 in central Alaska for July 2019, similar to VCDSAT,GC. In wildfire areas, we expect VCDSAT,GC to be higher than VCDSAT by 20 %–30 %, due to a smaller AMF, when strongly absorbing aerosols from wildfire are treated explicitly (Jung et al., 2019). The spatial pattern of VCDGC enhancements agree well with the burned area (Fig. S5b), indicating that the enhancements of VCDSAT,GC and VCDGC in July 2019 are both strongly induced by wildfire sources. In contrast, HCHO VCD outside of central Alaska are close to the background level, with little enhancement on background HCHO.
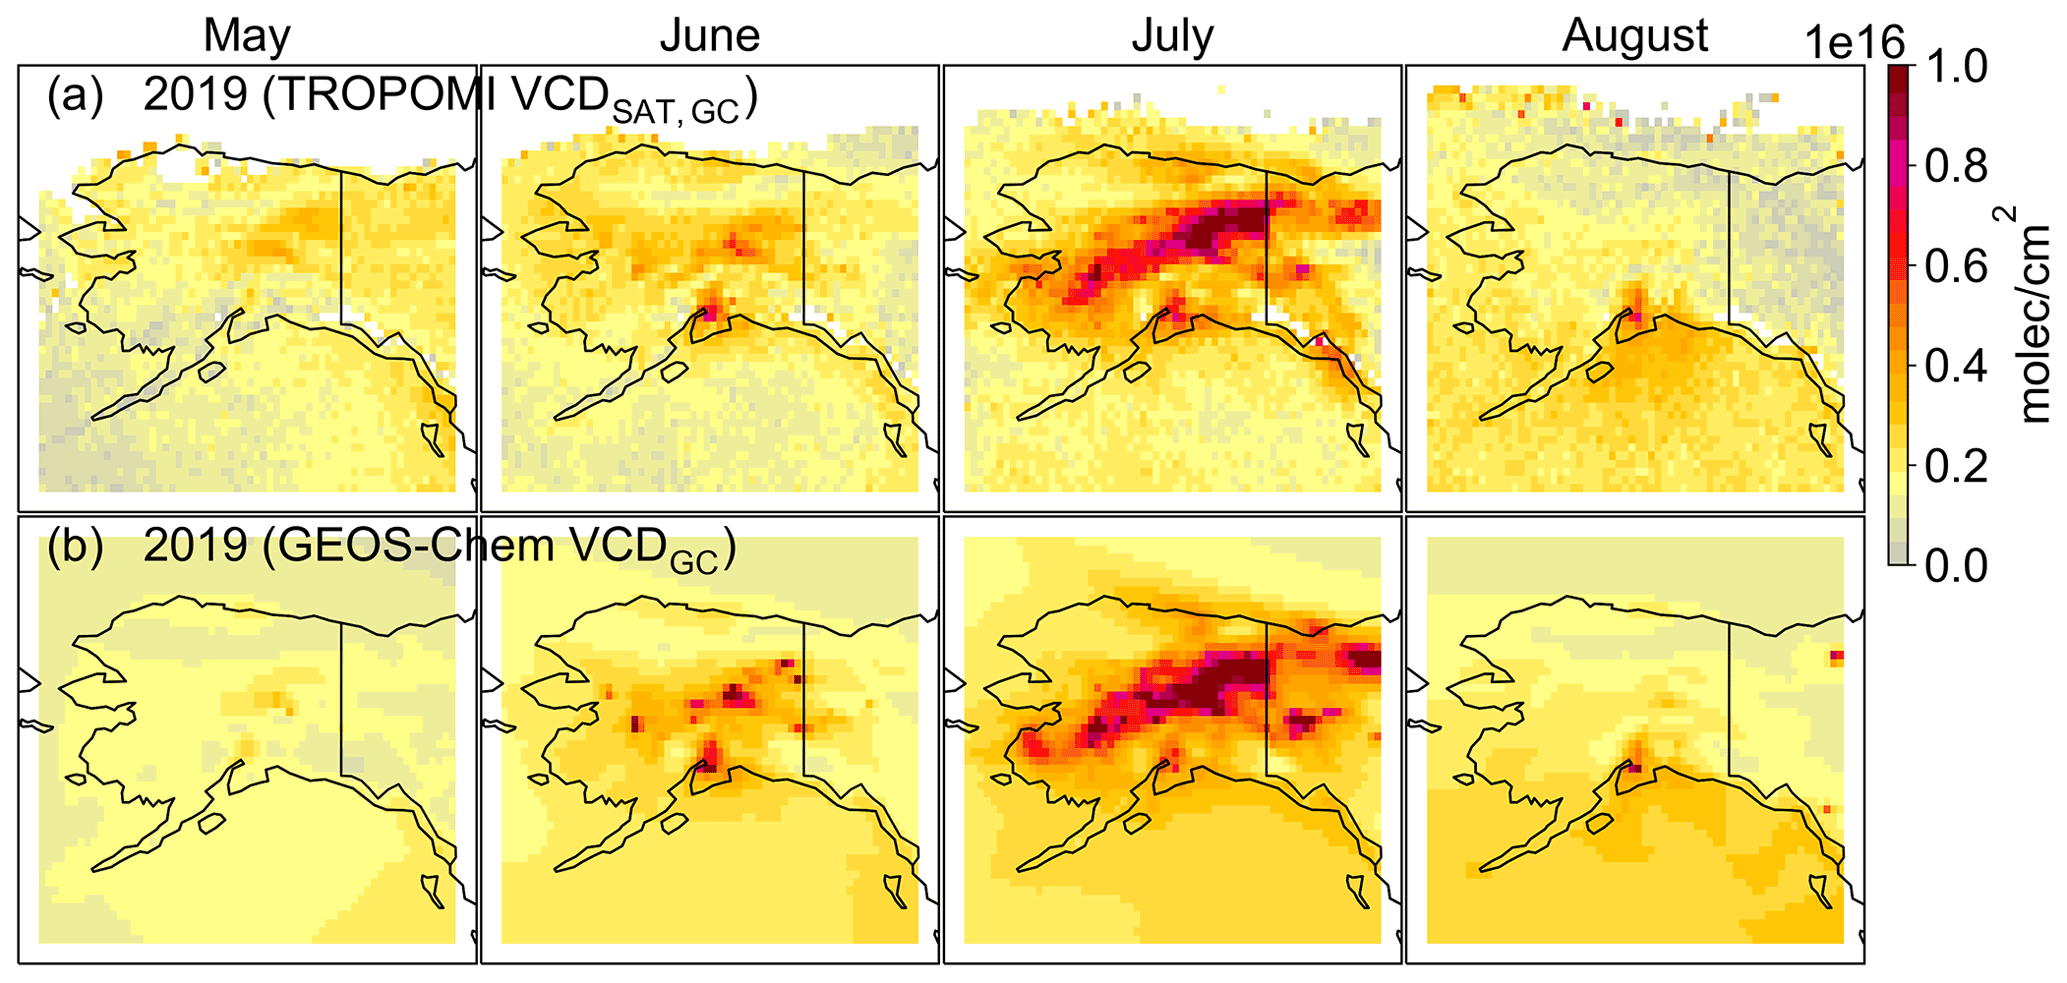
Figure 4Reprocessed TROPOMI HCHO VCDSAT,GC (a) and GEOS-Chem HCHO VCDGC (b) in 2019 summer. The TROPOMI operational HCHO L2 product after 5 August 2019 is upgraded to 5.5×3.5 km resolution.
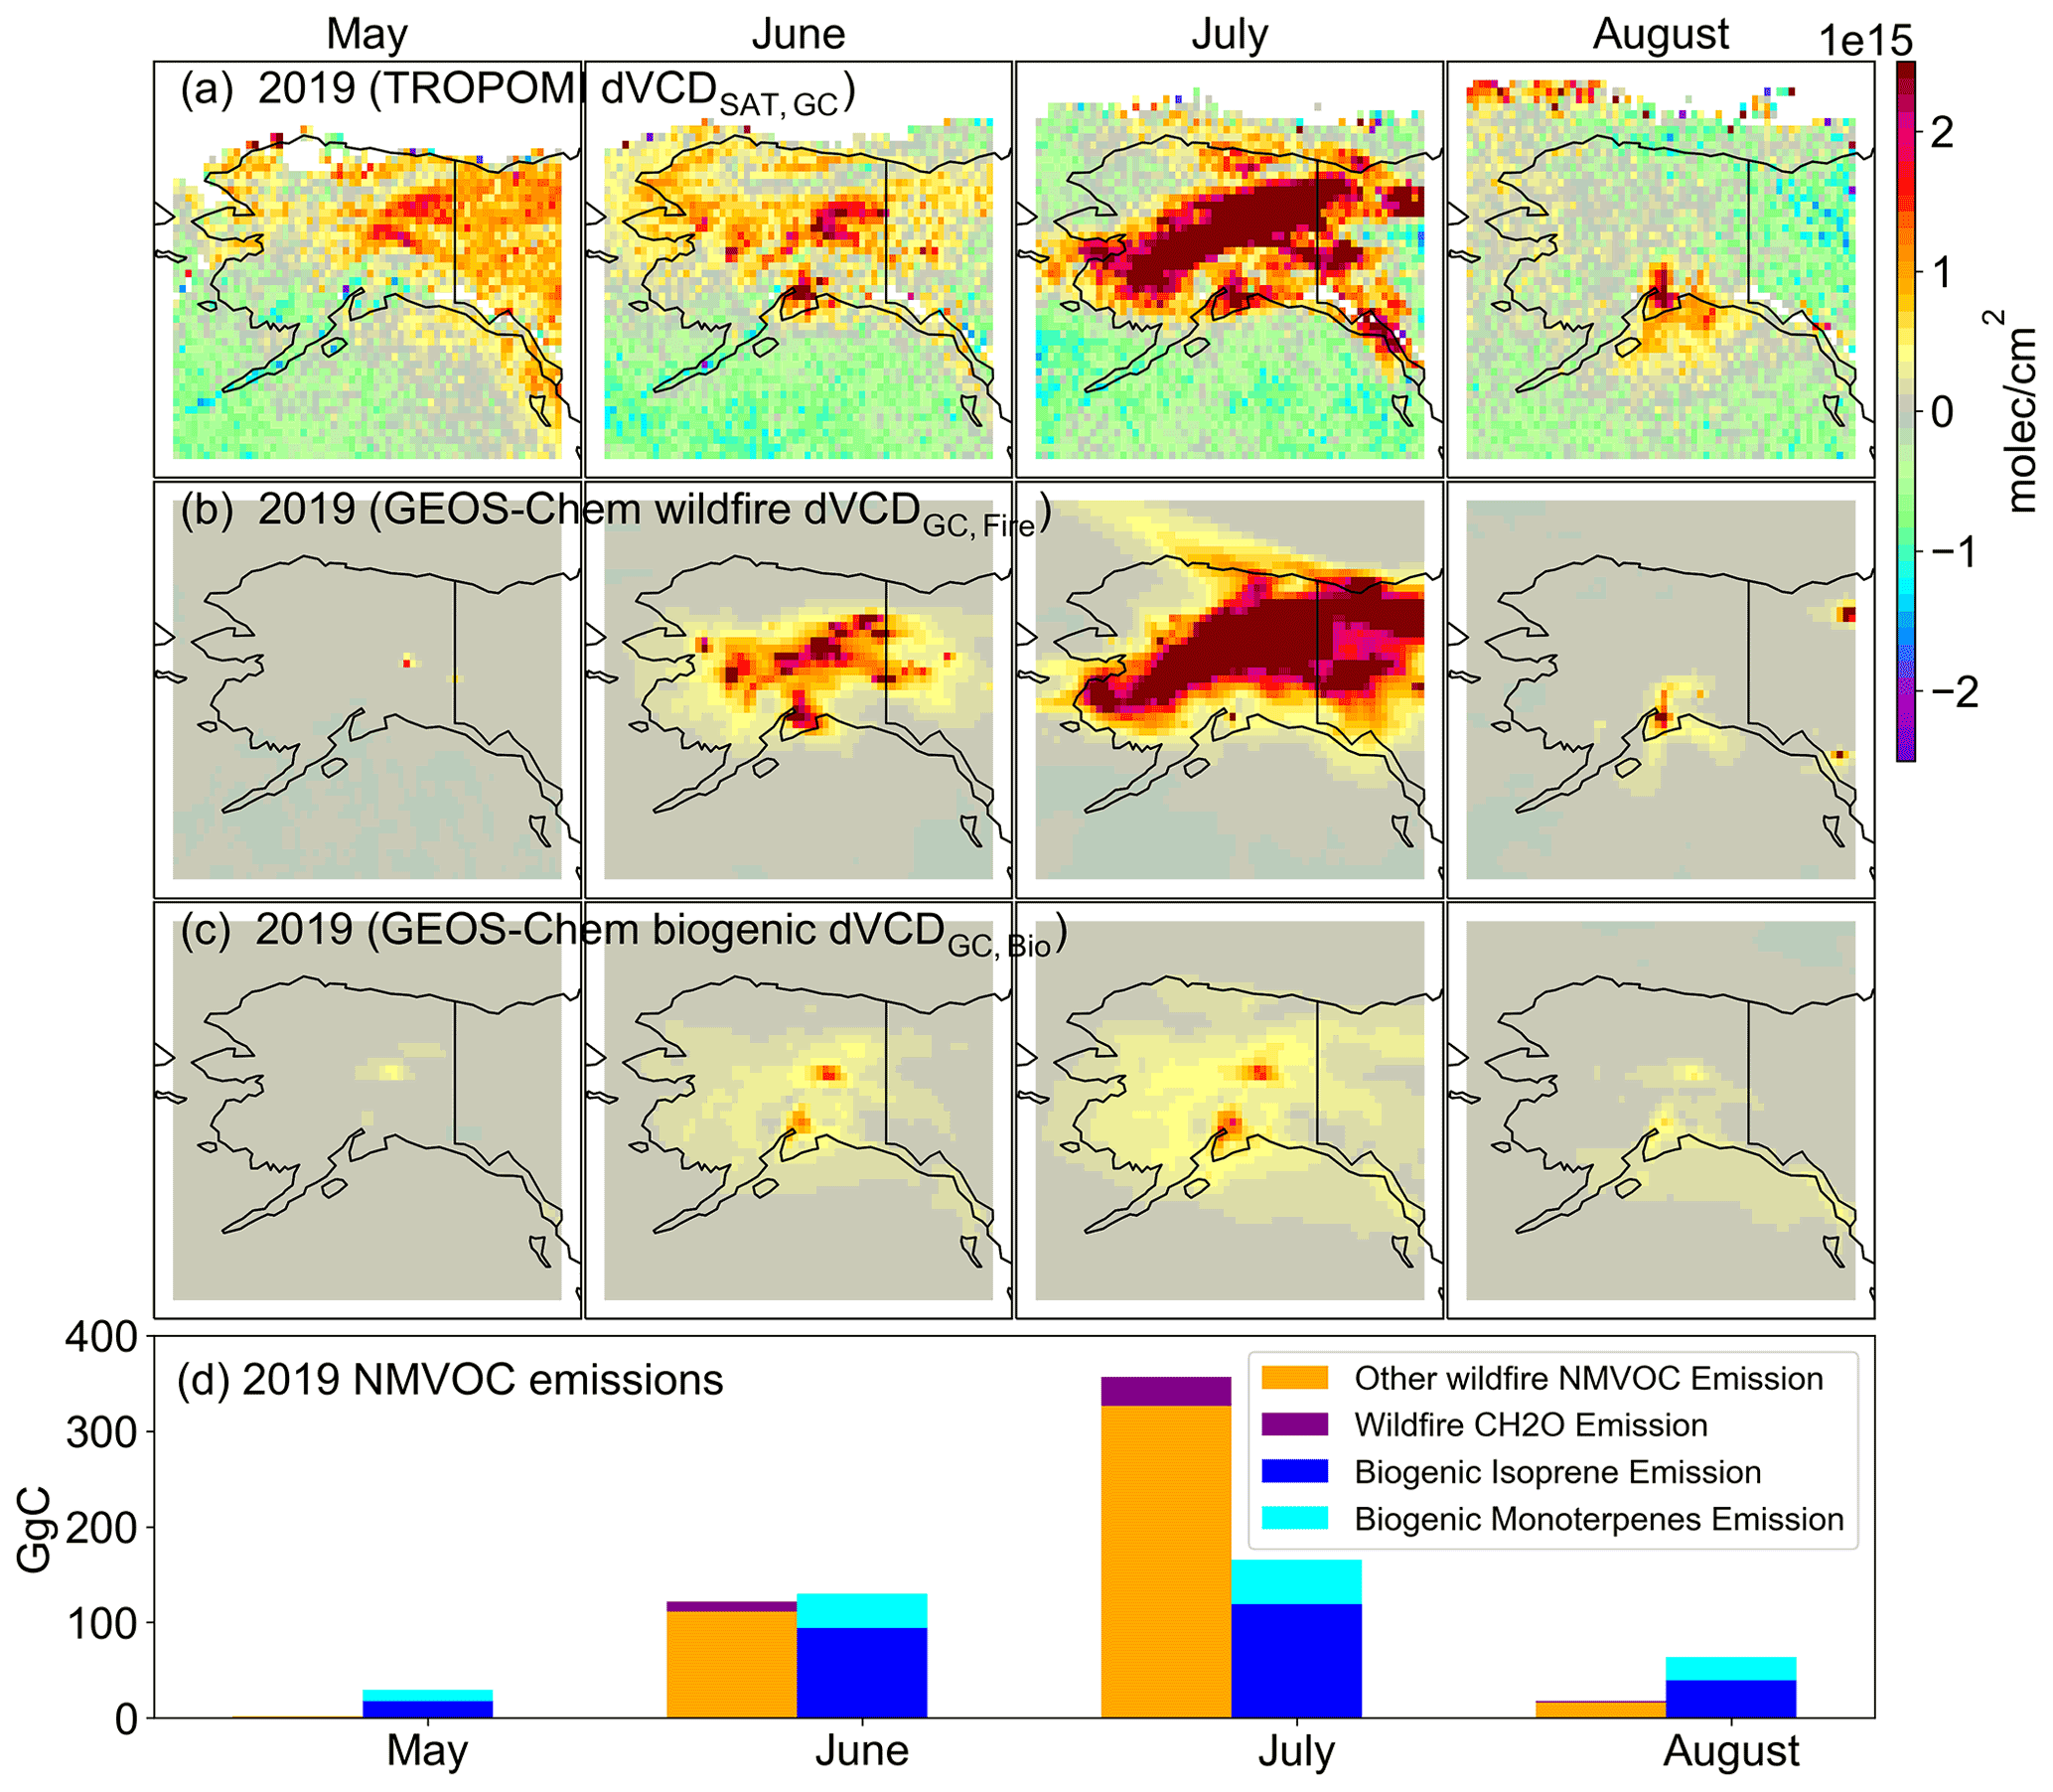
Figure 5HCHO dVCD and emission in Alaska in summer 2019. Similar to Fig. 3 but for 2019. The y-axis range of (d) is larger than that in Fig. 3.
Further detailed examination shows the predominance of wildfire emissions on central Alaskan HCHO VCD in summer 2019. We find little change on VCD0,GC and dVCDGC,Bio ( molecules cm−2) from summer 2018 to 2019 in model sensitivity tests, while dVCDGC,Fire appears to be solely responsible for the 2018–2019 HCHO VCD difference, especially in July. As a result, dVCDGC,Fire accounts for 72 % of VCDGC in central Alaska, while dVCDGC,Bio only takes 6 % of VCDGC and background oxidation accounts for 22 % of VCDGC. We emphasize that modeled direct emissions of HCHO from wildfires contribute to ∼ 60 % of dVCDGC,Fire. Consequently, dVCDGC,Fire is higher than dVCDGC,Bio by a factor of 10 in the 2019 Alaskan summer, despite the fact that NMVOC from wildfires (498 GgC) are only higher than biogenic emissions (389 GgC) by 30 %. Due to model sensitivity tests, intercontinental transport of wildfire emissions contributes a minor part of dVCDGC,Fire (∼ 1 % in interior Alaska, ∼ 10 % in southwest Alaska for 2019 July).
Satellite retrievals of HCHO in wildfire regions remains a major challenge. One source of uncertainty stems from a priori profiles used in AMF calculation (Kwon et al., 2017). We find that for regions with heavy smoke, our calculated GEOS-Chem AMFGC is 50 % lower than the AMFSAT in the operational product, due to the difference in HCHO vertical profiles (Fig. S3, S7). As a result, our reprocessed HCHO VCD product, VCDSAT,GC, is higher than the operational product by 3–5×10¹⁵ molecules cm−2 in heavy smoke regions in July 2019 (Fig. S10). Another uncertainty lies in the aerosol optical properties. Wildfire smoke is a major source of brown carbon (June et al., 2020). As the current retrieval algorithm for HCHO does not account for absorbing aerosols, smoke can reduce the sensitivity of satellite measurements to atmospheric layers below and above the aerosol layer, leading to a smaller AMF by 20 %–30 % (Jung et al., 2019; Martin et al., 2003).
The Arctic/boreal terrestrial ecosystem has been undergoing rapid changes in recent decades, but VOC emissions from Arctic and boreal vegetation and wildfires remain poorly quantified, limiting our capability to understand biosphere–atmosphere exchange in this region and its feedback on Arctic climate and air quality. In this work, we use satellite-based observations of HCHO VCD from the TROPOMI instrument on-board S5P satellite, combined with a nested grid chemical transport model, to examine the source and variability of HCHO VCD in Alaska for summers with low fire activity (2018) and high fire activity (2019).
We first evaluate the GEOS-Chem nested simulation (0.5×0.625∘) with in-situ airborne measurements in Alaska from the ATom-1 mission. We show reasonable agreement between observed and modeled HCHO, isoprene, monoterpenes and the sum of MVK+MACR in the continental boundary layer. In particular, HCHO profiles show spatial homogeneity in Alaska, suggesting a minor contribution of biogenic emissions to HCHO VCD.
We further compared GEOS-Chem results with the TROPOMI HCHO L2 product, reprocessed with background HCHO VCD and AMF using GEOS-Chem model output. The reprocessed product may benefit from the finer horizontal and vertical resolution of GEOS-Chem compared to the TM5-MP model, as well as the year-specific wildfire emissions. We find that reprocessed TROPOMI HCHO VCDSAT,GC is dominated by background HCHO VCD0,GC from methane oxidation in a mild wildfire summer. Wildfires have a larger contribution to the HCHO total column than biogenic emissions, even in a year with mild wildfires. This result is in part due to the direct emission of HCHO from wildfires and in part due to the slow and small production of HCHO from isoprene and monoterpenes oxidation under low NOx conditions.
For the year with large wildfires in Alaska (2019), we find that TROPOMI and the model show good agreement on the magnitude and spatial pattern of HCHO VCD, and wildfire becomes the largest contributor to HCHO VCD. Model sensitivity suggests that the direct emission of HCHO from wildfires accounts for the majority of HCHO VCD. While the emission factor of HCHO from wildfires (1.86 g kg−1 dry matter for boreal forest) applied in our model largely agrees with field measurements, the role of secondary production of HCHO is likely underestimated due to unaccounted for VOCs and underrepresented plume chemistry. We show that wildfire signals can be detected by the TROPOMI HCHO product, making TROPOMI a semi-quantitative tool to constrain wildfire emissions in Alaska given the large uncertainties associated with HCHO retrieval in wildfire plumes. As the Arctic and boreal regions continue to warm up, we expect HCHO VCD in Alaska to continue to be driven by wildfires and background methane oxidation.
Quantification of HCHO at northern high latitudes can be further improved in several aspects. First, we show that background signals, often taken from model output, can be dominant in the final product of HCHO VCD. However, model results differ significantly in HCHO even over the Pacific Ocean (Fig. S8), leading to a large uncertainty in the final satellite product in this region. Second, reference sector correction represents another major uncertainty (Zhu et al., 2020). This is particularly a problem for Alaska, as it lies in the reference sector defined by most retrieval algorithms (González Abad et al., 2015; De Smedt et al., 2018). Any systematic bias in Alaska can propagate to retrievals in other regions. Third, pristine regions can also be influenced by wildfire plumes, which can largely impact HCHO retrieval. Future work is warranted to improve HCHO retrieval and therefore our understanding of HCHO at northern high latitudes.
ATom data is available at https://doi.org/10.3334/ORNLDAAC/1581 (Wofsy et al., 2018). The TROPOMI HCHO L2 product is available at https://doi.org/10.5270/S5P-tjlxfd2 (Copernicus Sentinel-5P, 2018). Some reprocessed data is available at https://doi.org/10.6084/m9.figshare.19883254 (Zhao, 2022). Data processing codes are available at https://doi.org/10.5281/zenodo.6582851 (Holton1, 2022). The GEOS-Chem model is publicly available at: https://doi.org/10.5281/zenodo.3701669 (GEOS-Chem, 2020).
The supplement related to this article is available online at: https://doi.org/10.5194/acp-22-7163-2022-supplement.
TZ and JM designed the research, performed the simulations and conducted the analysis. WRS, IDS, LZ, GGA, CRN helped process and analyze the data. TFH, GMW, JMSC, BB, SM, DRB, ECA, RSH provided ATom data. TZ and JM wrote the paper with all co-authors providing input.
The contact author has declared that neither they nor their co-authors have any competing interests.
Publisher’s note: Copernicus Publications remains neutral with regard to jurisdictional claims in published maps and institutional affiliations.
TZ, JM and WRS acknowledge funding from NASA 80NSSC19M0154. JM also acknowledges support from NASA grant 80NSSC21K0428. This material is based upon work supported by the National Center for Atmospheric Research, which is a major facility sponsored by the National Science Foundation under Cooperative Agreement No. 1852977. We thank Dylan Millet (University of Minnesota Twin Cities), Xiaoyi Zhao (Environment and Climate Change Canada) for helpful discussions.
This research has been supported by US NASA (grant no. 80NSSC19M0154).
This paper was edited by Kostas Tsigaridis and reviewed by Robert George Ryan and one anonymous referee.
Abatzoglou, J. T. and Williams, A. P.: Impact of anthropogenic climate change on wildfire across western US forests, Proc. Natl. Acad. Sci., 113, 11770–11775, https://doi.org/10.1073/pnas.1607171113, 2016.
Akagi, S. K., Yokelson, R. J., Wiedinmyer, C., Alvarado, M. J., Reid, J. S., Karl, T., Crounse, J. D., and Wennberg, P. O.: Emission factors for open and domestic biomass burning for use in atmospheric models, Atmos. Chem. Phys., 11, 4039–4072, https://doi.org/10.5194/acp-11-4039-2011, 2011.
Alvarado, L. M. A., Richter, A., Vrekoussis, M., Hilboll, A., Kalisz Hedegaard, A. B., Schneising, O., and Burrows, J. P.: Unexpected long-range transport of glyoxal and formaldehyde observed from the Copernicus Sentinel-5 Precursor satellite during the 2018 Canadian wildfires, Atmos. Chem. Phys., 20, 2057–2072, https://doi.org/10.5194/acp-20-2057-2020, 2020.
Angot, H., McErlean, K., Hu, L., Millet, D. B., Hueber, J., Cui, K., Moss, J., Wielgasz, C., Milligan, T., Ketcherside, D., Bret-Harte, M. S., and Helmig, D.: Biogenic volatile organic compound ambient mixing ratios and emission rates in the Alaskan Arctic tundra, Biogeosciences, 17, 6219–6236, https://doi.org/10.5194/bg-17-6219-2020, 2020.
Apel, E. C., Asher, E. C., Hills, A. J., and Hornbrook, R. S.: ATom: Volatile Organic Compounds (VOCs) from the TOGA instrument, Version 2, ORNL DAAC, Oak Ridge, Tennessee, USA, https://doi.org/10.3334/ORNLDAAC/1936, 2021.
Bäck, J., Aalto, J., Henriksson, M., Hakola, H., He, Q., and Boy, M.: Chemodiversity of a Scots pine stand and implications for terpene air concentrations, Biogeosciences, 9, 689–702, https://doi.org/10.5194/bg-9-689-2012, 2012.
Bates, K. H., Jacob, D. J., Wang, S., Hornbrook, R. S., Apel, E. C., Kim, M. J., Millet, D. B., Wells, K. C., Chen, X., Brewer, J. F., Ray, E. A., Commane, R., Diskin, G. S., and Wofsy, S. C.: The Global Budget of Atmospheric Methanol: New Constraints on Secondary, Oceanic, and Terrestrial Sources, J. Geophys. Res.-Atmos., 126, e2020JD033439, https://doi.org/10.1029/2020JD033439, 2021.
Bauwens, M., Stavrakou, T., Müller, J.-F., De Smedt, I., Van Roozendael, M., van der Werf, G. R., Wiedinmyer, C., Kaiser, J. W., Sindelarova, K., and Guenther, A.: Nine years of global hydrocarbon emissions based on source inversion of OMI formaldehyde observations, Atmos. Chem. Phys., 16, 10133–10158, https://doi.org/10.5194/acp-16-10133-2016, 2016.
Bhatt, U. S., Walker, D. A., Raynolds, M. K., Bieniek, P. A., Epstein, H. E., Comiso, J. C., Pinzon, J. E., Tucker, C. J., Steele, M., Ermold, W., and Zhang, J.: Changing seasonality of panarctic tundra vegetation in relationship to climatic variables, Environ. Res. Lett., 12, 055003, https://doi.org/10.1088/1748-9326/aa6b0b, 2017.
Blake, D. R., Hurst, D. F., Smith, T. W., Whipple, W. J., Chen, T.-Y., Blake, N. J., and Rowland, F. S.: Summertime measurements of selected nonmethane hydrocarbons in the Arctic and Subarctic during the 1988 Arctic Boundary Layer Expedition (ABLE 3A), J. Geophys. Res.-Atmos., 97, 16559–16588, https://doi.org/10.1029/92JD00892, 1992.
Boersma, K. F., Eskes, H. J., and Brinksma, E. J.: Error analysis for tropospheric NO2 retrieval from space, J. Geophys. Res.-Atmos., 109, 875–898, https://doi.org/10.1029/2003JD003962, 2004.
Cazorla, M., Wolfe, G. M., Bailey, S. A., Swanson, A. K., Arkinson, H. L., and Hanisco, T. F.: A new airborne laser-induced fluorescence instrument for in situ detection of formaldehyde throughout the troposphere and lower stratosphere, Atmos. Meas. Tech., 8, 541–552, https://doi.org/10.5194/amt-8-541-2015, 2015.
Cohen, J., Screen, J. A., Furtado, J. C., Barlow, M., Whittleston, D., Coumou, D., Francis, J., Dethloff, K., Entekhabi, D., Overland, J., and Jones, J.: Recent Arctic amplification and extreme mid-latitude weather, Nat. Geosci., 7, 627–637, https://doi.org/10.1038/ngeo2234, 2014.
Copernicus Sentinel-5P (processed by ESA): TROPOMI Level 2 Formaldehyde Total Column products, Version 01, European Space Agency [data set], https://doi.org/10.5270/S5P-tjlxfd2, 2018.
De Smedt, I., Müller, J.-F., Stavrakou, T., van der A, R., Eskes, H., and Van Roozendael, M.: Twelve years of global observations of formaldehyde in the troposphere using GOME and SCIAMACHY sensors, Atmos. Chem. Phys., 8, 4947–4963, https://doi.org/10.5194/acp-8-4947-2008, 2008.
De Smedt, I., Stavrakou, T., Müller, J.-F., A, R. J. van der, and Van Roozendael, M.: Trend detection in satellite observations of formaldehyde tropospheric columns, Geophys. Res. Lett., 37, L18808, https://doi.org/10.1029/2010GL044245, 2010.
De Smedt, I., Stavrakou, T., Hendrick, F., Danckaert, T., Vlemmix, T., Pinardi, G., Theys, N., Lerot, C., Gielen, C., Vigouroux, C., Hermans, C., Fayt, C., Veefkind, P., Müller, J.-F., and Van Roozendael, M.: Diurnal, seasonal and long-term variations of global formaldehyde columns inferred from combined OMI and GOME-2 observations, Atmos. Chem. Phys., 15, 12519–12545, https://doi.org/10.5194/acp-15-12519-2015, 2015.
De Smedt, I., Theys, N., Yu, H., Danckaert, T., Lerot, C., Compernolle, S., Van Roozendael, M., Richter, A., Hilboll, A., Peters, E., Pedergnana, M., Loyola, D., Beirle, S., Wagner, T., Eskes, H., van Geffen, J., Boersma, K. F., and Veefkind, P.: Algorithm theoretical baseline for formaldehyde retrievals from S5P TROPOMI and from the QA4ECV project, Atmos. Meas. Tech., 11, 2395–2426, https://doi.org/10.5194/amt-11-2395-2018, 2018.
De Smedt, I., Pinardi, G., Vigouroux, C., Compernolle, S., Bais, A., Benavent, N., Boersma, F., Chan, K.-L., Donner, S., Eichmann, K.-U., Hedelt, P., Hendrick, F., Irie, H., Kumar, V., Lambert, J.-C., Langerock, B., Lerot, C., Liu, C., Loyola, D., Piters, A., Richter, A., Rivera Cárdenas, C., Romahn, F., Ryan, R. G., Sinha, V., Theys, N., Vlietinck, J., Wagner, T., Wang, T., Yu, H., and Van Roozendael, M.: Comparative assessment of TROPOMI and OMI formaldehyde observations and validation against MAX-DOAS network column measurements, Atmos. Chem. Phys., 21, 12561–12593, https://doi.org/10.5194/acp-21-12561-2021, 2021.
Faubert, P., Tiiva, P., Rinnan, Å., Michelsen, A., Holopainen, J. K., and Rinnan, R.: Doubled volatile organic compound emissions from subarctic tundra under simulated climate warming, New Phytol., 187, 199–208, https://doi.org/10.1111/j.1469-8137.2010.03270.x, 2010.
Fisher, J. A., Jacob, D. J., Travis, K. R., Kim, P. S., Marais, E. A., Chan Miller, C., Yu, K., Zhu, L., Yantosca, R. M., Sulprizio, M. P., Mao, J., Wennberg, P. O., Crounse, J. D., Teng, A. P., Nguyen, T. B., St. Clair, J. M., Cohen, R. C., Romer, P., Nault, B. A., Wooldridge, P. J., Jimenez, J. L., Campuzano-Jost, P., Day, D. A., Hu, W., Shepson, P. B., Xiong, F., Blake, D. R., Goldstein, A. H., Misztal, P. K., Hanisco, T. F., Wolfe, G. M., Ryerson, T. B., Wisthaler, A., and Mikoviny, T.: Organic nitrate chemistry and its implications for nitrogen budgets in an isoprene- and monoterpene-rich atmosphere: constraints from aircraft (SEAC4RS) and ground-based (SOAS) observations in the Southeast US, Atmos. Chem. Phys., 16, 5969–5991, https://doi.org/10.5194/acp-16-5969-2016, 2016.
GEOS-Chem: geoschem/geos-chem: GEOS-Chem 12.7.2 release, Zenodo [code], https://doi.org/10.5281/zenodo.3701669, 2020.
Giglio, L., Randerson, J. T., and van der Werf, G. R.: Analysis of daily, monthly, and annual burned area using the fourth-generation global fire emissions database (GFED4), J. Geophys. Res.-Biogeo., 118, 317–328, https://doi.org/10.1002/jgrg.20042, 2013.
González Abad, G., Liu, X., Chance, K., Wang, H., Kurosu, T. P., and Suleiman, R.: Updated Smithsonian Astrophysical Observatory Ozone Monitoring Instrument (SAO OMI) formaldehyde retrieval, Atmos. Meas. Tech., 8, 19–32, https://doi.org/10.5194/amt-8-19-2015, 2015.
Guenther, A., Hewitt, C. N., Erickson, D., Fall, R., Geron, C., Graedel, T., Harley, P., Klinger, L., Lerdau, M., Mckay, W. A., Pierce, T., Scholes, B., Steinbrecher, R., Tallamraju, R., Taylor, J., and Zimmerman, P.: A global model of natural volatile organic compound emissions, J. Geophys. Res.-Atmos., 100, 8873–8892, https://doi.org/10.1029/94JD02950, 1995.
Guenther, A., Karl, T., Harley, P., Wiedinmyer, C., Palmer, P. I., and Geron, C.: Estimates of global terrestrial isoprene emissions using MEGAN (Model of Emissions of Gases and Aerosols from Nature), Atmos. Chem. Phys., 6, 3181–3210, https://doi.org/10.5194/acp-6-3181-2006, 2006.
Guenther, A. B., Jiang, X., Heald, C. L., Sakulyanontvittaya, T., Duhl, T., Emmons, L. K., and Wang, X.: The Model of Emissions of Gases and Aerosols from Nature version 2.1 (MEGAN2.1): an extended and updated framework for modeling biogenic emissions, Geosci. Model Dev., 5, 1471–1492, https://doi.org/10.5194/gmd-5-1471-2012, 2012.
Holton1: Holton1/Codes-for-Alaskan-HCHO-VCD-variability-study: Source and variability of formaldehyde (HCHO) at northern high latitudes: an integrated satellite, aircraft, and model study (v1.0), Zenodo [data set], https://doi.org/10.5281/zenodo.6582851, 2022.
June, N. A., Wang, X., Chen, L.-W. A., Chow, J. C., Watson, J. G., Wang, X., Henderson, B. H., Zheng, Y., and Mao, J.: Spatial and Temporal Variability of Brown Carbon in the United States: Implications for Direct Radiative Effects, Geophys. Res. Lett., 47, e2020GL090332, https://doi.org/10.1029/2020GL090332, 2020.
Jung, Y., González Abad, G., Nowlan, C. R., Chance, K., Liu, X., Torres, O., and Ahn, C.: Explicit Aerosol Correction of OMI Formaldehyde Retrievals, Earth Space Sci., 6, 2087–2105, https://doi.org/10.1029/2019EA000702, 2019.
Juráň, S., Pallozzi, E., Guidolotti, G., Fares, S., Šigut, L., Calfapietra, C., Alivernini, A., Savi, F., Večeřová, K., Křůmal, K., Večeřa, Z., and Urban, O.: Fluxes of biogenic volatile organic compounds above temperate Norway spruce forest of the Czech Republic, Agric. For. Meteorol., 232, 500–513, https://doi.org/10.1016/j.agrformet.2016.10.005, 2017.
Kaiser, J., Jacob, D. J., Zhu, L., Travis, K. R., Fisher, J. A., González Abad, G., Zhang, L., Zhang, X., Fried, A., Crounse, J. D., St. Clair, J. M., and Wisthaler, A.: High-resolution inversion of OMI formaldehyde columns to quantify isoprene emission on ecosystem-relevant scales: application to the southeast US, Atmos. Chem. Phys., 18, 5483–5497, https://doi.org/10.5194/acp-18-5483-2018, 2018.
Keeling, C. D., Chin, J. F. S., and Whorf, T. P.: Increased activity of northern vegetation inferred from atmospheric CO2 measurements, Nature, 382, 146–149, https://doi.org/10.1038/382146a0, 1996.
Khokhar, M. F., Frankenberg, C., Van Roozendael, M., Beirle, S., Kühl, S., Richter, A., Platt, U., and Wagner, T.: Satellite observations of atmospheric SO2 from volcanic eruptions during the time-period of 1996–2002, Adv. Space Res., 36, 879–887, https://doi.org/10.1016/j.asr.2005.04.114, 2005.
Kleipool, Q. L., Dobber, M. R., Haan, J. F. de, and Levelt, P. F.: Earth surface reflectance climatology from 3 years of OMI data, J. Geophys. Res.-Atmos., 113, D18308, https://doi.org/10.1029/2008JD010290, 2008.
Kramshøj, M., Vedel-Petersen, I., Schollert, M., Rinnan, Å., Nymand, J., Ro-Poulsen, H., and Rinnan, R.: Large increases in Arctic biogenic volatile emissions are a direct effect of warming, Nat. Geosci, 9, 349–352, https://doi.org/10.1038/ngeo2692, 2016.
Kwon, H.-A., Park, R. J., Jeong, J. I., Lee, S., González Abad, G., Kurosu, T. P., Palmer, P. I., and Chance, K.: Sensitivity of formaldehyde (HCHO) column measurements from a geostationary satellite to temporal variation of the air mass factor in East Asia, Atmos. Chem. Phys., 17, 4673–4686, https://doi.org/10.5194/acp-17-4673-2017, 2017.
Lawrence, D. M., Oleson, K. W., Flanner, M. G., Thornton, P. E., Swenson, S. C., Lawrence, P. J., Zeng, X., Yang, Z.-L., Levis, S., Sakaguchi, K., Bonan, G. B., and Slater, A. G.: Parameterization improvements and functional and structural advances in Version 4 of the Community Land Model, J. Adv. Model. Earth Syst., 3, M03001, https://doi.org/10.1029/2011MS000045, 2011.
Li, J., Mao, J., Min, K.-E., Washenfelder, R. A., Brown, S. S., Kaiser, J., Keutsch, F. N., Volkamer, R., Wolfe, G. M., Hanisco, T. F., Pollack, I. B., Ryerson, T. B., Graus, M., Gilman, J. B., Lerner, B. M., Warneke, C., de Gouw, J. A., Middlebrook, A. M., Liao, J., Welti, A., Henderson, B. H., McNeill, V. F., Hall, S. R., Ullmann, K., Donner, L. J., Paulot, F., and Horowitz, L. W.: Observational constraints on glyoxal production from isoprene oxidation and its contribution to organic aerosol over the Southeast United States, J. Geophys. Res.-Atmos., 121, 9849–9861, https://doi.org/10.1002/2016JD025331, 2016.
Liao, J., Wolfe, G. M., Hannun, R. A., St. Clair, J. M., Hanisco, T. F., Gilman, J. B., Lamplugh, A., Selimovic, V., Diskin, G. S., Nowak, J. B., Halliday, H. S., DiGangi, J. P., Hall, S. R., Ullmann, K., Holmes, C. D., Fite, C. H., Agastra, A., Ryerson, T. B., Peischl, J., Bourgeois, I., Warneke, C., Coggon, M. M., Gkatzelis, G. I., Sekimoto, K., Fried, A., Richter, D., Weibring, P., Apel, E. C., Hornbrook, R. S., Brown, S. S., Womack, C. C., Robinson, M. A., Washenfelder, R. A., Veres, P. R., and Neuman, J. A.: Formaldehyde evolution in US wildfire plumes during the Fire Influence on Regional to Global Environments and Air Quality experiment (FIREX-AQ), Atmos. Chem. Phys., 21, 18319–18331, https://doi.org/10.5194/acp-21-18319-2021, 2021.
Lindwall, F., Schollert, M., Michelsen, A., Blok, D., and Rinnan, R.: Fourfold higher tundra volatile emissions due to arctic summer warming, J. Geophys. Res. Biogeo., 121, 895–902, https://doi.org/10.1002/2015JG003295, 2016.
Liu, X., Huey, L. G., Yokelson, R. J., Selimovic, V., Simpson, I. J., Müller, M., Jimenez, J. L., Campuzano-Jost, P., Beyersdorf, A. J., Blake, D. R., Butterfield, Z., Choi, Y., Crounse, J. D., Day, D. A., Diskin, G. S., Dubey, M. K., Fortner, E., Hanisco, T. F., Hu, W., King, L. E., Kleinman, L., Meinardi, S., Mikoviny, T., Onasch, T. B., Palm, B. B., Peischl, J., Pollack, I. B., Ryerson, T. B., Sachse, G. W., Sedlacek, A. J., Shilling, J. E., Springston, S., St. Clair, J. M., Tanner, D. J., Teng, A. P., Wennberg, P. O., Wisthaler, A., and Wolfe, G. M.: Airborne measurements of western U.S. wildfire emissions: Comparison with prescribed burning and air quality implications, J. Geophys. Res.-Atmos., 122, 6108–6129, https://doi.org/10.1002/2016JD026315, 2017.
Macias Fauria, M. and Johnson, E. A: Climate and wildfires in the North American boreal forest, Philos. T. Roy. Soc. B, 363, 2315–2327, https://doi.org/10.1098/rstb.2007.2202, 2008.
Mao, J., Jacob, D. J., Evans, M. J., Olson, J. R., Ren, X., Brune, W. H., Clair, J. M. St., Crounse, J. D., Spencer, K. M., Beaver, M. R., Wennberg, P. O., Cubison, M. J., Jimenez, J. L., Fried, A., Weibring, P., Walega, J. G., Hall, S. R., Weinheimer, A. J., Cohen, R. C., Chen, G., Crawford, J. H., McNaughton, C., Clarke, A. D., Jaeglé, L., Fisher, J. A., Yantosca, R. M., Le Sager, P., and Carouge, C.: Chemistry of hydrogen oxide radicals (HOx) in the Arctic troposphere in spring, Atmos. Chem. Phys., 10, 5823–5838, https://doi.org/10.5194/acp-10-5823-2010, 2010.
Mao, J., Paulot, F., Jacob, D. J., Cohen, R. C., Crounse, J. D., Wennberg, P. O., Keller, C. A., Hudman, R. C., Barkley, M. P., and Horowitz, L. W.: Ozone and organic nitrates over the eastern United States: Sensitivity to isoprene chemistry, J. Geophys. Res.-Atmos., 118, 11256–11268, https://doi.org/10.1002/jgrd.50817, 2013.
Mao, J., Carlton, A., Cohen, R. C., Brune, W. H., Brown, S. S., Wolfe, G. M., Jimenez, J. L., Pye, H. O. T., Lee Ng, N., Xu, L., McNeill, V. F., Tsigaridis, K., McDonald, B. C., Warneke, C., Guenther, A., Alvarado, M. J., de Gouw, J., Mickley, L. J., Leibensperger, E. M., Mathur, R., Nolte, C. G., Portmann, R. W., Unger, N., Tosca, M., and Horowitz, L. W.: Southeast Atmosphere Studies: learning from model-observation syntheses, Atmos. Chem. Phys., 18, 2615–2651, https://doi.org/10.5194/acp-18-2615-2018, 2018.
Marais, E. A., Jacob, D. J., Kurosu, T. P., Chance, K., Murphy, J. G., Reeves, C., Mills, G., Casadio, S., Millet, D. B., Barkley, M. P., Paulot, F., and Mao, J.: Isoprene emissions in Africa inferred from OMI observations of formaldehyde columns, Atmos. Chem. Phys., 12, 6219–6235, https://doi.org/10.5194/acp-12-6219-2012, 2012.
Martin, R. V., Jacob, D. J., Chance, K., Kurosu, T. P., Palmer, P. I., and Evans, M. J.: Global inventory of nitrogen oxide emissions constrained by space-based observations of NO2 columns, J. Geophys. Res.-Atmos., 108, D17, https://doi.org/10.1029/2003JD003453, 2003.
Millet, D. B., Jacob, D. J., Turquety, S., Hudman, R. C., Wu, S., Fried, A., Walega, J., Heikes, B. G., Blake, D. R., Singh, H. B., Anderson, B. E., and Clarke, A. D.: Formaldehyde distribution over North America: Implications for satellite retrievals of formaldehyde columns and isoprene emission, J. Geophys. Res.-Atmos., 111, D24S02, https://doi.org/10.1029/2005JD006853, 2006.
Millet, D. B., Jacob, D. J., Boersma, K. F., Fu, T.-M., Kurosu, T. P., Chance, K., Heald, C. L., and Guenther, A.: Spatial distribution of isoprene emissions from North America derived from formaldehyde column measurements by the OMI satellite sensor, J. Geophys. Res.-Atmos., 113, D02307, https://doi.org/10.1029/2007JD008950, 2008.
Myers-Smith, I. H., Forbes, B. C., Wilmking, M., Hallinger, M., Lantz, T., Blok, D., Tape, K. D., Macias-Fauria, M., Sass-Klaassen, U., Lévesque, E., Boudreau, S., Ropars, P., Hermanutz, L., Trant, A., Collier, L. S., Weijers, S., Rozema, J., Rayback, S. A., Schmidt, N. M., Schaepman-Strub, G., Wipf, S., Rixen, C., Ménard, C. B., Venn, S., Goetz, S., Andreu-Hayles, L., Elmendorf, S., Ravolainen, V., Welker, J., Grogan, P., Epstein, H. E., and Hik, D. S.: Shrub expansion in tundra ecosystems: dynamics, impacts and research priorities, Environ. Res. Lett., 6, 045509, https://doi.org/10.1088/1748-9326/6/4/045509, 2011.
Myneni, R. B., Keeling, C. D., Tucker, C. J., Asrar, G., and Nemani, R. R.: Increased plant growth in the northern high latitudes from 1981 to 1991, Nature, 386, 698–702, https://doi.org/10.1038/386698a0, 1997.
Nemani, R. R., Keeling, C. D., Hashimoto, H., Jolly, W. M., Piper, S. C., Tucker, C. J., Myneni, R. B., and Running, S. W.: Climate-driven increases in global terrestrial net primary production from 1982 to 1999, Science, 300, 1560–1563, https://doi.org/10.1126/science.1082750, 2003.
Oleson, K., Lawrence, M., Bonan, B., Drewniak, B., Huang, M., Koven, D., Levis, S., Li, F., Riley, J., Subin, M., Swenson, S., Thornton, E., Bozbiyik, A., Fisher, R., Heald, L., Kluzek, E., Lamarque, J.-F., Lawrence, J., Leung, R., Lipscomb, W., Muszala, P., Ricciuto, M., Sacks, J., Sun, Y., Tang, J., and Yang, Z.-L.: Technical description of version 4.5 of the Community Land Model (CLM), no. NCAR/TN-503+STR, https://doi.org/10.5065/D6RR1W7M, 2013.
Palmer, P. I., Jacob, D. J., Chance, K., Martin, R. V., Spurr, R. J. D., Kurosu, T. P., Bey, I., Yantosca, R., Fiore, A., and Li, Q.: Air mass factor formulation for spectroscopic measurements from satellites: Application to formaldehyde retrievals from the Global Ozone Monitoring Experiment, J. Geophys. Res.-Atmos., 106, 14539–14550, https://doi.org/10.1029/2000JD900772, 2001.
Palmer, P. I., Jacob, D. J., Fiore, A. M., Martin, R. V., Chance, K., and Kurosu, T. P.: Mapping isoprene emissions over North America using formaldehyde column observations from space, J. Geophys. Res.-Atmos., 108, 4180, https://doi.org/10.1029/2002JD002153, 2003.
Palmer, P. I., Abbot, D. S., Fu, T.-M., Jacob, D. J., Chance, K., Kurosu, T. P., Guenther, A., Wiedinmyer, C., Stanton, J. C., Pilling, M. J., Pressley, S. N., Lamb, B., and Sumner, A. L.: Quantifying the seasonal and interannual variability of North American isoprene emissions using satellite observations of the formaldehyde column, J. Geophys. Res.-Atmos., 111, D12315, https://doi.org/10.1029/2005JD006689, 2006.
Park, R. J., Jacob, D. J., Field, B. D., Yantosca, R. M., and Chin, M.: Natural and transboundary pollution influences on sulfate-nitrate-ammonium aerosols in the United States: Implications for policy, J. Geophys. Res.-Atmos., 109, D15204, https://doi.org/10.1029/2003JD004473, 2004.
Permar, W., Wang, Q., Selimovic, V., Wielgasz, C., Yokelson, R. J., Hornbrook, R. S., Hills, A. J., Apel, E. C., Ku, I., Zhou, Y., Sive, B. C., Sullivan, A. P., Collett, J. L., Campos, T. L., Palm, B. B., Peng, Q., Thornton, J. A., Garofalo, L. A., Farmer, D. K., Kreidenweis, S. M., Levin, E. J. T., DeMott, P. J., Flocke, F., Fischer, E. V., and Hu, L.: Emissions of Trace Organic Gases From Western U.S. Wildfires Based on WE-CAN Aircraft Measurements, J. Geophys. Res.-Atmos., 126, e2020JD033838, https://doi.org/10.1029/2020JD033838, 2021.
Potosnak, M. J., Baker, B. M., LeStourgeon, L., Disher, S. M., Griffin, K. L., Bret-Harte, M. S., and Starr, G.: Isoprene emissions from a tundra ecosystem, Biogeosciences, 10, 871–889, https://doi.org/10.5194/bg-10-871-2013, 2013.
Rantala, P., Aalto, J., Taipale, R., Ruuskanen, T. M., and Rinne, J.: Annual cycle of volatile organic compound exchange between a boreal pine forest and the atmosphere, Biogeosciences, 12, 5753–5770, https://doi.org/10.5194/bg-12-5753-2015, 2015.
Rienecker, M. M., Suarez, M. J., Gelaro, R., Todling, R., Bacmeister, J., Liu, E., Bosilovich, M. G., Schubert, S. D., Takacs, L., Kim, G.-K., Bloom, S., Chen, J., Collins, D., Conaty, A., da Silva, A., Gu, W., Joiner, J., Koster, R. D., Lucchesi, R., Molod, A., Owens, T., Pawson, S., Pegion, P., Redder, C. R., Reichle, R., Robertson, F. R., Ruddick, A. G., Sienkiewicz, M., and Woollen, J.: MERRA: NASA's Modern-Era Retrospective Analysis for Research and Applications, J. Climate, 24, 3624–3648, https://doi.org/10.1175/JCLI-D-11-00015.1, 2011.
Rinnan, R., Steinke, M., Mcgenity, T., and Loreto, F.: Plant volatiles in extreme terrestrial and marine environments, Plant Cell Environ., 37, 1776–1789, https://doi.org/10.1111/pce.12320, 2014.
Rinne, J., Hakola, H., Laurila, T., and Rannik, Ü.: Canopy scale monoterpene emissions of Pinus sylvestris dominated forests, Atmos. Environ., 34, 1099–1107, https://doi.org/10.1016/S1352-2310(99)00335-0, 2000.
Simpson, I. J., Blake, D. R., Blake, N. J., Meinardi, S., Barletta, B., Hughes, S. C., Fleming, L. T., Crawford, J. H., Diskin, G. S., Emmons, L. K., Fried, A., Guo, H., Peterson, D. A., Wisthaler, A., Woo, J.-H., Barré, J., Gaubert, B., Kim, J., Kim, M. J., Kim, Y., Knote, C., Mikoviny, T., Pusede, S. E., Schroeder, J. R., Wang, Y., Wennberg, P. O., and Zeng, L.: Characterization, sources and reactivity of volatile organic compounds (VOCs) in Seoul and surrounding regions during KORUS-AQ, Elementa, 8, 37, https://doi.org/10.1525/elementa.434, 2020.
Spirig, C., Guenther, A., Greenberg, J. P., Calanca, P., and Tarvainen, V.: Tethered balloon measurements of biogenic volatile organic compounds at a Boreal forest site, Atmos. Chem. Phys., 4, 215–229, https://doi.org/10.5194/acp-4-215-2004, 2004.
Spurr, R.: LIDORT and VLIDORT: Linearized pseudo-spherical scalar and vector discrete ordinate radiative transfer models for use in remote sensing retrieval problems, in: Light Scattering Reviews 3: Light Scattering and Reflection, edited by: Kokhanovsky, A. A., Springer, Berlin, Heidelberg, 229–275, https://doi.org/10.1007/978-3-540-48546-9_7, 2008.
Stavrakou, T., Müller, J.-F., De Smedt, I., Van Roozendael, M., van der Werf, G. R., Giglio, L., and Guenther, A.: Global emissions of non-methane hydrocarbons deduced from SCIAMACHY formaldehyde columns through 2003–2006, Atmos. Chem. Phys., 9, 3663–3679, https://doi.org/10.5194/acp-9-3663-2009, 2009.
Stavrakou, T., Müller, J.-F., Bauwens, M., De Smedt, I., Van Roozendael, M., Guenther, A., Wild, M., and Xia, X.: Isoprene emissions over Asia 1979–2012: impact of climate and land-use changes, Atmos. Chem. Phys., 14, 4587–4605, https://doi.org/10.5194/acp-14-4587-2014, 2014.
Stavrakou, T., Müller, J.-F., Bauwens, M., De Smedt, I., Van Roozendael, M., De Mazière, M., Vigouroux, C., Hendrick, F., George, M., Clerbaux, C., Coheur, P.-F., and Guenther, A.: How consistent are top-down hydrocarbon emissions based on formaldehyde observations from GOME-2 and OMI?, Atmos. Chem. Phys., 15, 11861–11884, https://doi.org/10.5194/acp-15-11861-2015, 2015.
Stavrakou, T., Müller, J.-F., Bauwens, M., De Smedt, I., Van Roozendael, M., and Guenther, A.: Impact of Short-Term Climate Variability on Volatile Organic Compounds Emissions Assessed Using OMI Satellite Formaldehyde Observations, Geophys. Res. Lett., 45, 8681–8689, https://doi.org/10.1029/2018GL078676, 2018.
Tang, J., Schurgers, G., Valolahti, H., Faubert, P., Tiiva, P., Michelsen, A., and Rinnan, R.: Challenges in modelling isoprene and monoterpene emission dynamics of Arctic plants: a case study from a subarctic tundra heath, Biogeosciences, 13, 6651–6667, https://doi.org/10.5194/bg-13-6651-2016, 2016.
Travis, K. R., Jacob, D. J., Fisher, J. A., Kim, P. S., Marais, E. A., Zhu, L., Yu, K., Miller, C. C., Yantosca, R. M., Sulprizio, M. P., Thompson, A. M., Wennberg, P. O., Crounse, J. D., St. Clair, J. M., Cohen, R. C., Laughner, J. L., Dibb, J. E., Hall, S. R., Ullmann, K., Wolfe, G. M., Pollack, I. B., Peischl, J., Neuman, J. A., and Zhou, X.: Why do models overestimate surface ozone in the Southeast United States?, Atmos. Chem. Phys., 16, 13561–13577, https://doi.org/10.5194/acp-16-13561-2016, 2016.
van der Werf, G. R., Randerson, J. T., Giglio, L., van Leeuwen, T. T., Chen, Y., Rogers, B. M., Mu, M., van Marle, M. J. E., Morton, D. C., Collatz, G. J., Yokelson, R. J., and Kasibhatla, P. S.: Global fire emissions estimates during 1997–2016, Earth Syst. Sci. Data, 9, 697–720, https://doi.org/10.5194/essd-9-697-2017, 2017.
Vedel-Petersen, I., Schollert, M., Nymand, J., and Rinnan, R.: Volatile organic compound emission profiles of four common arctic plants, Atmos. Environ., 120, 117–126, https://doi.org/10.1016/j.atmosenv.2015.08.082, 2015.
Veefkind, J. P., Aben, I., McMullan, K., Förster, H., de Vries, J., Otter, G., Claas, J., Eskes, H. J., de Haan, J. F., Kleipool, Q., van Weele, M., Hasekamp, O., Hoogeveen, R., Landgraf, J., Snel, R., Tol, P., Ingmann, P., Voors, R., Kruizinga, B., Vink, R., Visser, H., and Levelt, P. F.: TROPOMI on the ESA Sentinel-5 Precursor: A GMES mission for global observations of the atmospheric composition for climate, air quality and ozone layer applications, Remote Sens. Environ., 120, 70–83, https://doi.org/10.1016/j.rse.2011.09.027, 2012.
Vigouroux, C., Langerock, B., Bauer Aquino, C. A., Blumenstock, T., Cheng, Z., De Mazière, M., De Smedt, I., Grutter, M., Hannigan, J. W., Jones, N., Kivi, R., Loyola, D., Lutsch, E., Mahieu, E., Makarova, M., Metzger, J.-M., Morino, I., Murata, I., Nagahama, T., Notholt, J., Ortega, I., Palm, M., Pinardi, G., Röhling, A., Smale, D., Stremme, W., Strong, K., Sussmann, R., Té, Y., van Roozendael, M., Wang, P., and Winkler, H.: TROPOMI–Sentinel-5 Precursor formaldehyde validation using an extensive network of ground-based Fourier-transform infrared stations, Atmos. Meas. Tech., 13, 3751–3767, https://doi.org/10.5194/amt-13-3751-2020, 2020.
Williams, J. E., Boersma, K. F., Le Sager, P., and Verstraeten, W. W.: The high-resolution version of TM5-MP for optimized satellite retrievals: description and validation, Geosci. Model Dev., 10, 721–750, https://doi.org/10.5194/gmd-10-721-2017, 2017.
Wofsy, S. C., Afshar, S., Allen, H. M., Apel, E., Asher, E. C., Barletta, B., Bent, J., Bian, H., Biggs, B. C., Blake, D. R., Blake, N., Bourgeous, I., Brock, C. A., Brune, W. H., Budney, J. W., Bui, T. P., Butler, A., Campuzano-Jost, P., Chang, C. S., Chin, M., Commane, R., Correa, G., Crounse, J. D., Cullis, P. D., Daube, B. C., Day, D. A., Dean-Day, J. M., Dibb, J. E., DiGangi, J. P., Diskin, G. S., Dollner, M., Elkins, J. W., Erdesz, F., Fiore, A. M., Flynn, C. M., Froyd, K., Gesler, D. W., Hall, S. R., Hanisco, T. F., Hannun, R. A., Hills, A. J., Hintsa, E. J., Hoffman, A., Hornbrook, R. S., Huey, L. G., Hughes, S., Jimenez, J. L., Johnson, B. J., Katich, J. M., Keeling, R., Kim, M. J., Kupc, A., Lait, L. R., Lamarque, J.-F., Liu, J., McKain, K., McLaughlin, R. J., Meinardi, S., Miller, D. O., Montzka, S. A., Moore, F. L., Morgan, E. J., Murphy, D. M., Murray, L. T., Nault, B. A., Neuman, J. A., Newman, P. A., Nicely, J. M., Pan, X., Paplawsky, W., Peischl, J., Prather, M. J., Price, D. J., Ray, E., Reeves, J. M., Richardson, M., Rollins, A. W., Rosenlof, K. H., Ryerson, T. B., Scheuer, E., Schill, G. P., Schroder, J. C., Schwarz, J. P., St. Clair, J. M., Steenrod, S. D., Stephens, B. B., Strode, S. A., Sweeney, C., Tanner, D., Teng, A. P., Thames, A. B., Thompson, C. R., Ullmann, K., Veres, P. R., Vieznor, N., Wagner, N. L., Watt, A., Weber, R., Weinzierl, B., Wennberg, P. O., Williamson, C. J., Wilson, J. C., Wolfe, G. M., Woods, C. T., and Zeng, L. H.: ATom: Merged Atmospheric Chemistry, Trace Gases, and Aerosols, Version 1.5, 2840.233496 MB, https://doi.org/10.3334/ORNLDAAC/1581, 2018.
Wolfe, G. M., Nicely, J. M., St. Clair, J. M., Hanisco, T. F., Liao, J., Oman, L. D., Brune, W. B., Miller, D., Thames, A., Abad, G. G., Ryerson, T. B., Thompson, C. R., Peischl, J., McKain, K., Sweeney, C., Wennberg, P. O., Kim, M., Crounse, J. D., Hall, S. R., Ullmann, K., Diskin, G., Bui, P., Chang, C., and Dean-Day, J.: Mapping hydroxyl variability throughout the global remote troposphere via synthesis of airborne and satellite formaldehyde observations, Proc. Natl. Acad. Sci., 116, 11171–11180, https://doi.org/10.1073/pnas.1821661116, 2019.
Xu, X., Wang, J., Henze, D. K., Qu, W., and Kopacz, M.: Constraints on aerosol sources using GEOS-Chem adjoint and MODIS radiances, and evaluation with multisensor (OMI, MISR) data, J. Geophys. Res.-Atmos., 118, 6396–6413, https://doi.org/10.1002/jgrd.50515, 2013.
Yokelson, R. J., Christian, T. J., Karl, T. G., and Guenther, A.: The tropical forest and fire emissions experiment: laboratory fire measurements and synthesis of campaign data, Atmos. Chem. Phys., 8, 3509–3527, https://doi.org/10.5194/acp-8-3509-2008, 2008.
Zhao, T.: Reprocessed data used in “Source and variability of formaldehyde (HCHO) at northern high latitude: an integrated satellite, aircraft, and model study”, figshare [data set], 10.6084/m9.figshare.19883254.v1, 2022.
Zhou, L., Tucker, C. J., Kaufmann, R. K., Slayback, D., Shabanov, N. V., and Myneni, R. B.: Variations in northern vegetation activity inferred from satellite data of vegetation index during 1981 to 1999, J. Geophys. Res.-Atmos., 106, 20069–20083, https://doi.org/10.1029/2000JD000115, 2001.
Zhou, P., Ganzeveld, L., Taipale, D., Rannik, Ü., Rantala, P., Rissanen, M. P., Chen, D., and Boy, M.: Boreal forest BVOC exchange: emissions versus in-canopy sinks, Atmos. Chem. Phys., 17, 14309–14332, https://doi.org/10.5194/acp-17-14309-2017, 2017.
Zhu, L., Jacob, D. J., Kim, P. S., Fisher, J. A., Yu, K., Travis, K. R., Mickley, L. J., Yantosca, R. M., Sulprizio, M. P., De Smedt, I., González Abad, G., Chance, K., Li, C., Ferrare, R., Fried, A., Hair, J. W., Hanisco, T. F., Richter, D., Jo Scarino, A., Walega, J., Weibring, P., and Wolfe, G. M.: Observing atmospheric formaldehyde (HCHO) from space: validation and intercomparison of six retrievals from four satellites (OMI, GOME2A, GOME2B, OMPS) with SEAC4RS aircraft observations over the southeast US, Atmos. Chem. Phys., 16, 13477–13490, https://doi.org/10.5194/acp-16-13477-2016, 2016.
Zhu, L., Mickley, L. J., Jacob, D. J., Marais, E. A., Sheng, J., Hu, L., Abad, G. G., and Chance, K.: Long-term (2005–2014) trends in formaldehyde (HCHO) columns across North America as seen by the OMI satellite instrument: Evidence of changing emissions of volatile organic compounds, Geophys. Res. Lett., 44, 7079–7086, https://doi.org/10.1002/2017GL073859, 2017.
Zhu, L., González Abad, G., Nowlan, C. R., Chan Miller, C., Chance, K., Apel, E. C., DiGangi, J. P., Fried, A., Hanisco, T. F., Hornbrook, R. S., Hu, L., Kaiser, J., Keutsch, F. N., Permar, W., St. Clair, J. M., and Wolfe, G. M.: Validation of satellite formaldehyde (HCHO) retrievals using observations from 12 aircraft campaigns, Atmos. Chem. Phys., 20, 12329–12345, https://doi.org/10.5194/acp-20-12329-2020, 2020.