the Creative Commons Attribution 4.0 License.
the Creative Commons Attribution 4.0 License.
 | 01 Jun 2022
Fate of the nitrate radical at the summit of a semi-rural mountain site in Germany assessed with direct reactivity measurements
Patrick Dewald
Clara M. Nussbaumer
Jan Schuladen
Akima Ringsdorf
Achim Edtbauer
Horst Fischer
Jonathan Williams
Jos Lelieveld
The reactivity of NO3 plays an important role in modifying the fate of reactive nitrogen species at nighttime. High reactivity (e.g. towards unsaturated volatile organic compounds – VOCs) can lead to formation of organic nitrates and secondary organic aerosol, whereas low reactivity opens the possibility of heterogeneous NOx losses via the formation and uptake of N2O5 to particles.
We present direct NO3 reactivity measurements () that quantify the VOC-induced losses of NO3 during the TO2021 campaign at the summit of the Kleiner Feldberg mountain (825 m, Germany) in July 2021. was on average ∼0.035 s−1 during the daytime, ∼0.015 s−1 for almost half of the nights and below the detection limit of 0.006 s−1 for the other half, which may be linked to sampling from above the nocturnal surface layer. NO3 reactivities derived from VOC measurements and the corresponding rate coefficient were in good agreement with , with monoterpenes representing 84 % of the total reactivity. The fractional contribution F of to the overall NO3 loss rate (which includes an additional reaction of NO3 with NO and photolysis) were on average ∼16 % during the daytime and ∼50 %–60 % during the nighttime. The relatively low nighttime value of F is related to the presence of several tens of parts per trillion by volume (pptv) of NO on several nights. NO3 mixing ratios were not measured, but steady-state calculations resulted in nighttime values between <1 and 12 pptv. A comparison of results from TO2021 with direct measurements of NO3 during previous campaigns between 2008 and 2015 at this site revealed that NO3 loss rates were remarkably high during TO2021, while NO3 production rates were low.
We observed NO mixing ratios of up to 80 pptv at night, which has implications for the cycling of reactive nitrogen at this site. With O3 present at levels of mostly 25 to 60 ppbv (parts per billion by volume), NO is oxidized to NO2 on a timescale of a few minutes. We find that maintaining NO mixing ratios of, e.g., 40 pptv requires a ground-level NO emission rate of 0.33 pptv s−1 (into a shallow surface layer of 10 m depth). This in turn requires a rapid deposition of NO2 to the surface (vd cm s−1) to reduce nocturnal NO2 levels to match the observations.
- Article
(8945 KB) - Full-text XML
-
Supplement
(2335 KB) - BibTeX
- EndNote


Nitric oxide (NO) and nitrogen dioxide (NO2) are atmospheric pollutants, which exert a great impact on climate and air quality (Pozzer et al., 2012; Lelieveld et al., 2020). Via its dissociation, NO2 is the direct photochemical precursor of boundary layer ozone (O3, a phytotoxin and cause of respiratory illness), and understanding the processes that remove NOx () is of great importance (Crutzen and Lelieveld, 2001; Lelieveld et al., 2016; Edwards et al., 2017). The formation of long-lived or soluble organic nitrates during the oxidation of volatile organic compounds (VOCs) provides a mechanism to convert NOx to NOz (where NOz includes both organic and inorganic nitrates in the gas and particle phase), which may be transported away from the source region or removed via dry or wet deposition, respectively (Rollins et al., 2012; Romer Present et al., 2020).
The major initiators of VOC oxidation are hydroxyl (OH) radicals, ozone (O3), and the nitrate radical (NO3; Ng et al., 2017; Wennberg et al., 2018), with OH reactions being most important during the daytime (Lelieveld et al., 2008). The NO3 radical is generally considered to be important only at nighttime (Brown and Stutz, 2012), although, in some environments, it can also contribute substantially to the oxidation of unsaturated VOC during the day (J. Liebmann et al., 2018; J. M. Liebmann et al., 2018). NO3 is formed almost exclusively in the sequential oxidation of NO by O3 (Reactions R1 and R2). During the daytime, NO3 is lost via rapid photolysis (Reactions R5 and R6, with a lifetime of seconds) and an efficient reaction with NO ( cm3 molecule−1 s−1 at 298 K; IUPAC, 2022), which result in low mixing ratios (Wayne et al., 1991). NO3 also reacts with NO2 to form dinitrogen pentoxide (N2O5), which is in thermal equilibrium with NO3 and NO2 (Reactions R3, R4).
Reactions (R1)–(R4) can result in the permanent loss of NOx from the gas phase through deposition or uptake to particles of, e.g., NO3 or N2O5 (Reactions R8, R9; Crowley et al., 2011; Phillips et al., 2016).
In forested regions during the night, NO3 reacts predominantly with unsaturated volatile organic compounds (VOCs), often of biogenic origin such as isoprene or monoterpenes, which results in the formation of alkyl nitrates (RONO2; Reaction R10; Hallquist et al., 1999; Fry et al., 2014; Wu et al., 2021). Depending on the biogenic VOC (BVOC) involved, the RONO2 formed may have low volatility and may deposit to surfaces or transfer to the particle phase to form secondary organic aerosols (SOAs; Reaction R11; Place et al., 2022). The reaction between NO3 and BVOC consequently represents a loss of NOx from the gas phase and thus has an impact on air quality via suppression of ozone formation and increases in SOA levels (Fry et al., 2011; Romer Present et al., 2020).
The nocturnal NO3 lifetime close to the surface is generally short (typically in the range of minutes) owing to the buildup of the concentration of reactive gases emitted from the biosphere into a shallow nocturnal boundary layer (J. Liebmann et al., 2018; J. M. Liebmann et al., 2018). Longer NO3 lifetimes (sometimes exceeding 1 h) have been derived from NO3 measurements in very clean regions (Allan et al., 2000; Martinez et al., 2000), from measurements in the overlying residual layer using towers and aircraft platforms (Stutz et al, 2004; Brown et al., 2007a, b), and at mountain sites where the meteorological situation results in the measurement location being above the nocturnal surface layer (Carslaw et al., 1997; Brown et al., 2016; Sobanski et al., 2016).
The lifetime of NO3 has often been derived using a stationary-state approximation, which relies on direct measurements of NO3, NO2, and O3 (Heintz et al., 1996; Allan et al., 1999; Geyer et al., 2001; Brown et al., 2004, 2009; Stutz et al., 2010; Sobanski et al., 2016). This method is limited to periods when NO3 mixing ratios are above the instrumental detection limit, which (depending on instrument performance) may restrict the method to periods when NO3 production rates are high and NO3 reactivities (i.e. the inverse of NO3 lifetimes) are low. This is usually not the case during the daytime or even during the nighttime in areas with high BVOC emissions (J. Liebmann et al., 2018). Direct NO3 reactivity measurements not only extends the accessibility to daytime reactivities but also, together with measurements of NO, NO3, photolysis rates (), and VOCs, enables the determination of the fate of the NO3 radical throughout the diel cycle. Recent direct NO3 reactivity measurements and model calculations (Liebmann et al., 2019; Foulds et al., 2021) suggest that NO3 also contributes to daytime alkyl nitrate formation, which typically occurs through the OH-initiated oxidation of BVOC in the presence of NO (Wennberg et al., 2018). Quantifying the contribution of NO3+VOC reactions to the NO3 reactivity is thus central in understanding the role of NO3, in, e.g., SOA formation and NOx lifetimes.
In this study, the fate of the NO3 radical in the semi-rural Kleiner Feldberg (KF) mountain (in the southwest of Germany) in July and August 2021 (TO2021 campaign), during both day- and nighttime, is analysed by direct measurements of NO, photolysis rates (), and the first-order NO3 loss constant resulting from reaction with VOCs (). Measurements of VOCs that are reactive towards NO3 enable us to calculate their fractional contribution to . With the help of NO3, NO2, NO, and O3 measurements, we derive NO3 loss terms via the steady-state assumption () for previous campaigns at this site to assess the impact of differing meteorological and chemical conditions.
The TO2021 campaign took place in July and August 2021 at the Taunus Observatory (TO) at the summit of the Kleiner Feldberg mountain (825 m a.s.l. – above sea level). A detailed description of the location has been given elsewhere (Crowley et al., 2010), and only a brief summary is given here. The Kleiner Feldberg is mostly surrounded by coniferous forest, but an area at the summit (∼100 m2) is cleared of trees and hosts the meteorological measurements of the German Meteorological Service (Deutscher Wetterdienst, DWD) and permanent measurement containers of the University of Frankfurt and the Hessian Agency for Nature Conservation, Environment and Geology (Hessisches Landesamt für Naturschutz, Umwelt, und Geologie, HLNUG). The summit itself is covered with bushes and, especially to the north, with blueberry shrubs. The mountaintops of Altkönig (798 m a.s.l.) and Großer Feldberg (878 m a.s.l.) are in the direct vicinity (<3 km). Air arriving from the southwest and southeast is impacted by anthropogenic emissions from the densely populated cities of Frankfurt, Wiesbaden, and Mainz (20–30 km), whereas air from the northwest, north, and northeast is cleaner, with no major cities for 50–70 km.
2.1 Instrumentation
For the duration of the TO2021 campaign, two (stacked) containers, including the instruments operated by the Max Planck Institute for Chemistry (MPIC), were set up on the site. If not stated otherwise, the instruments sampled from a high volume flow stainless-steel tube (10 m3 min−1; 0.2 s residence time) sucking air from ca. 10 m above the ground. Each instrument with measurements used in the analysis is described below.
2.1.1 NO3 reactivity
The flow tube cavity ring-down spectrometer (FT-CRDS) set-up used to quantify VOC-induced NO3 reactivity (Liebmann et al., 2017) consists of a Teflon-coated (FEPD 121; Chemours) glass flow tube reactor, in which a flow of ambient air is mixed with 30–60 parts per trillion by volume (pptv) of synthetically generated NO3.
NO3 is generated by the sequential oxidation of NO and NO2 (3.5 standard (STP) cubic centimetres per minute (sccm) of 1 part per million by volume (ppmv) in N2; Air Liquide) by O3 (generated by passing synthetic air over a Hg lamp) in an upstream Teflon-coated glass reactor (thermostated to 30 ∘C at a pressure of 1.3 bar) in 400 sccm synthetic air. The flow exiting the NO3 source is passed through ca. 15 cm of in (0.635 cm) outer diameter (OD) PFA (perfluoroalkoxy) tubing that is heated to 140 ∘C so that N2O5 is quantitatively decomposed to NO3 and NO2 (Reaction R4). The flow from the NO3 source is then mixed with either 2800 sccm synthetic or ambient air and passed through the flow tube reactor where it resides for time t. The synthetic air used to measure zero reactivities was provided by a commercial zero-air generator (CAP 120; Fuhr GmbH) and humidified to ambient level with a permeation tube (Perma Pure LLC; MH-070-24F-4) immersed in deionized water. The ambient air was sampled from the high-flow inlet through in. (15 cm; OD) PFA tubing equipped with a Teflon membrane filter (2 µm pore, 47 mm diameter; Pall Corp.).
NO3 surviving the flow tube was detected by CRDS at 662 nm. The ring-down time in the absence of NO3 was determined every ca. 5 min by adding an excess of NO (3 sccm of 100 ppmv in N2). NO3 reactivities are deduced from the relative change in NO3 mixing ratio in ambient air compared to synthetic air. Dynamic dilution of the ambient air with synthetic air was used to keep the NO3 reactivity in a measurable range when sampling highly reactive air masses.
Since the NO3 mixing ratio is affected by Reactions (R1)–(R4), (R7), and (R9), in addition to the reaction of interest Reaction (R10), a numerical simulation procedure that corrects for the impact of NO and NO2 is necessary to extract the NO3 reactivity towards VOCs (). The validity of this correction procedure was checked by adding a known amount of NO (1–6 sccm of 245 parts per billion by volume (ppbv) NO in N2; Air Liquide) every 2 h during the zeroing periods throughout the campaign. As shown in Fig. S1a in the Supplement, the model was able to reproduce the observed NO3 mixing ratios reliably. A further calibration sequence during the campaign, in which five different amounts of NO were added, is displayed in Fig. S1b. The flow tube predominantly used during TO2021 features a residence time of t=9.5 s and an NO3 wall loss rate of 0.001 s−1. The limit of detection (LOD) is mainly defined by the stability of the NO3 source and baseline, which were improved by thermostating both the NO3 source and the flow tube and insulating the cavity from thermal gradients in the container so that a signal-stability related uncertainty of 16 % was achieved. For the numerical simulation procedure, ambient O3, NO, and NO2 mixing ratios and rate coefficients for Reactions (R1–R4) and (R7) were deployed. Liebmann et al. (2017) showed, with the help of Monte Carlo simulations, that the uncertainty associated with this simulation is dependent on the ratio between ambient NO2 and . Assuming a typical daytime situation for TO2021 ( s−1, [NO2] = 2 ppbv NO2) the numerical simulation introduces an uncertainty of 15 %, resulting in an overall uncertainty of 22 %. However, if, for example, is 0.006 s−1 in the presence of 1 ppbv NO2 (as occasionally detected during the nighttime), then the uncertainty caused by the simulation increases to ca. 50 %. During TO2021, the instrument's LOD was 0.006 s−1 for this flow tube.
Between 23 and 25 July, a larger flow tube was tested with the intention of extending the LOD to lower reactivities. The residence time (20 s during the day or 32 s during the night according to position of a moveable injector) and wall loss rates were characterized during the campaign, as detailed by Liebmann et al. (2017). The factor ∼3 longer residence time at night, compared to the smaller flow tube, should have extended the LOD to 0.003 s−1. However, the larger flow tube suffered from a greater NO3 wall loss rate (>0.04 s−1), which effectively worsened the LOD. For this reason, the deployment of this flow tube was stopped after 2 d.
During the nighttime, before being mixed with 30–60 pptv synthetic NO3, the air was sampled through a 2 L uncoated glass flask (40 s residence time) that was heated to 35 ∘C. This ensures that ambient NO3 and N2O5 (at mixing ratios up to several tens of pptv, according to previous measurements; see below) does not reach the flow tube to bias the measurement. The NO mixing ratios that were used in the numerical simulations were corrected (typically by a factor of 0.6) for the reaction with ambient O3 during residence in the flask.
2.1.2 NO2, NO, O3, and actinic flux
Owing to the importance of co-located NO2 measurements for interpretation of the data, the FT-CRDS set-up has a second inlet and cavity to measure NO2 (J. M. Liebmann et al., 2018), with a total measurement uncertainty (defined by noise and baseline stability) of 8 % and a LOD of 168 pptv (4 s). A further CRDS-based measurement of NO2 was made using a thermal dissociation cavity ring-down spectrometer (TD-CRDS; Friedrich et al., 2020) for measuring NOx and NOy. At nighttime, when NO was generally <80 pptv, the NOx channel of this instrument essentially measures NO2. The inlet of the instrument was located on the container roof, ∼2 m to the north and 2 m lower than the top of the high-flow inlet.
In addition, NO2 was measured with a chemiluminescence (CLD) set-up (ECO PHYSICS; CLD 790 SR) equipped with a photolytic converter to convert NO2 to NO (Tadic et al., 2020; Nussbaumer et al., 2021). This instrument also provided the campaign NO data set. Calibration (using a dynamically diluted, secondary 5 ppm NO standard) was carried out every 2 h, together with the zero measurement using synthetic air (Westfalen). The LODs for NO and NO2 were derived from the standard deviation (1σ) of consecutive zeros and were 7 and 10 pptv, respectively, and the total measurement uncertainties were 9 % and 19 % for NO and NO2.
The three sets of NO2 measurements are compared in the Supplement (Fig. S2). A bivariate linear regression (York, 1966) of the data sets yields offsets below the LOD of the FT-CRDS NO2 cavity in both cases. An excellent agreement with the TD-CRDS measurement is observed (slope of 0.99), while a fair agreement (slope of 1.09) within the associated uncertainties is achieved for the intercomparison with the CLD measurement. Note that post-campaign quantification of the NO standard with the CLD and the TD-CRDS set-up yielded satisfactorily agreeing values of (4.7 ± 0.3) ppmv and (4.9 ± 0.2) ppmv. O3 was measured via UV absorption with two identical commercial ozone monitors (2B Technologies; model 205) that were cross-calibrated after the campaign. The instrument background was estimated approximately every 2 d with synthetic air from the zero-air generator. The uncertainty associated with this measurement is 5 %, and the LOD is 2 ppbv.
Actinic flux measurements were made by a spectral radiometer (METCON GmbH) installed on top of the upper container and converted to photolysis frequencies for NO3 (), using evaluated absorption cross sections and quantum yields (Burkholder et al., 2016) with an overall uncertainty of ca. 15 % (Friedrich et al., 2021).
2.1.3 VOC measurements
VOCs were measured from 15 to 31 July with a proton transfer reaction time-of-flight mass spectrometer (PTR-ToF-MS; PTR8000; IONICON Analytik GmbH; Jordan et al., 2009; Bekö et al., 2020) with a time resolution of 20 s, operated with hydronium ions (H3O+) at a pressure of 2.2 mbar and an of 137 Td. Mixing ratios of isoprene, monoterpenes, and sesquiterpenes are derived from calibrating to a gas standard containing isoprene, α-pinene, and β-caryophyllene (Apel-Riemer Environmental, Inc., Colorado, USA), respectively. The limit of detection lies in the range of tens of pptv, and the uncertainty is defined to be below 20 %.
A second PTR-ToF-MS (Vocus; TOFWERK AG) provided uncalibrated VOC data for the period between 20 July and 6 August (Krechmer et al., 2018). Fragmentation patterns in the Vocus PTR-MS are not yet completely characterized, and the first results (using the same gas standard as for the IONICON PTR8000) suggest that different monoterpenes fragment differently on several masses in the VOCUS instrument, which impedes calibration of the monoterpene data based on the α-pinene standard. In order to extend the data availability, the VOCUS data for isoprene, monoterpenes, and sesquiterpenes were therefore scaled to that of the PTR8000 data set (which suffered from less fragmentation and is thus associated with less uncertainty) by applying constant factors during the common time period (see Fig. S4b in the Supplement).
Both PTR-ToF-MS were located in a permanent container of the TO, ca. 8 m distance from the MPIC container. Air was sampled from the roof of the container (ca. 8 m) through a heated inlet line equipped with a polytetrafluoroethylene (PTFE) filter.
2.1.4 Temperature and relative humidity profiles
Deployment of a drone (EVO-X12; Multikopter) equipped with a commercial gas sensor (BME680; Bosch Sensortec GmbH) enabled the measurement of vertical profiles of pressure, temperature, and relative humidity (time resolution of 1 s) to a height of 100 m a.g.l. (above ground level).
An overview of the key meteorological and trace gas measurements used in the analysis for the TO2021 campaign period from July to August 2021 is given in Fig. 1. Grey shaded areas mark the nighttime periods; sunrise during the measurement period was at ∼ 03:30 and sunset at ∼ 19:30 UTC. shows a distinct daytime to nighttime variability and generally follows the summed mixing ratio of monoterpenes (ΣMTs) which were present at maximum mixing ratios (during the day) typically between 150 and 400 pptv.
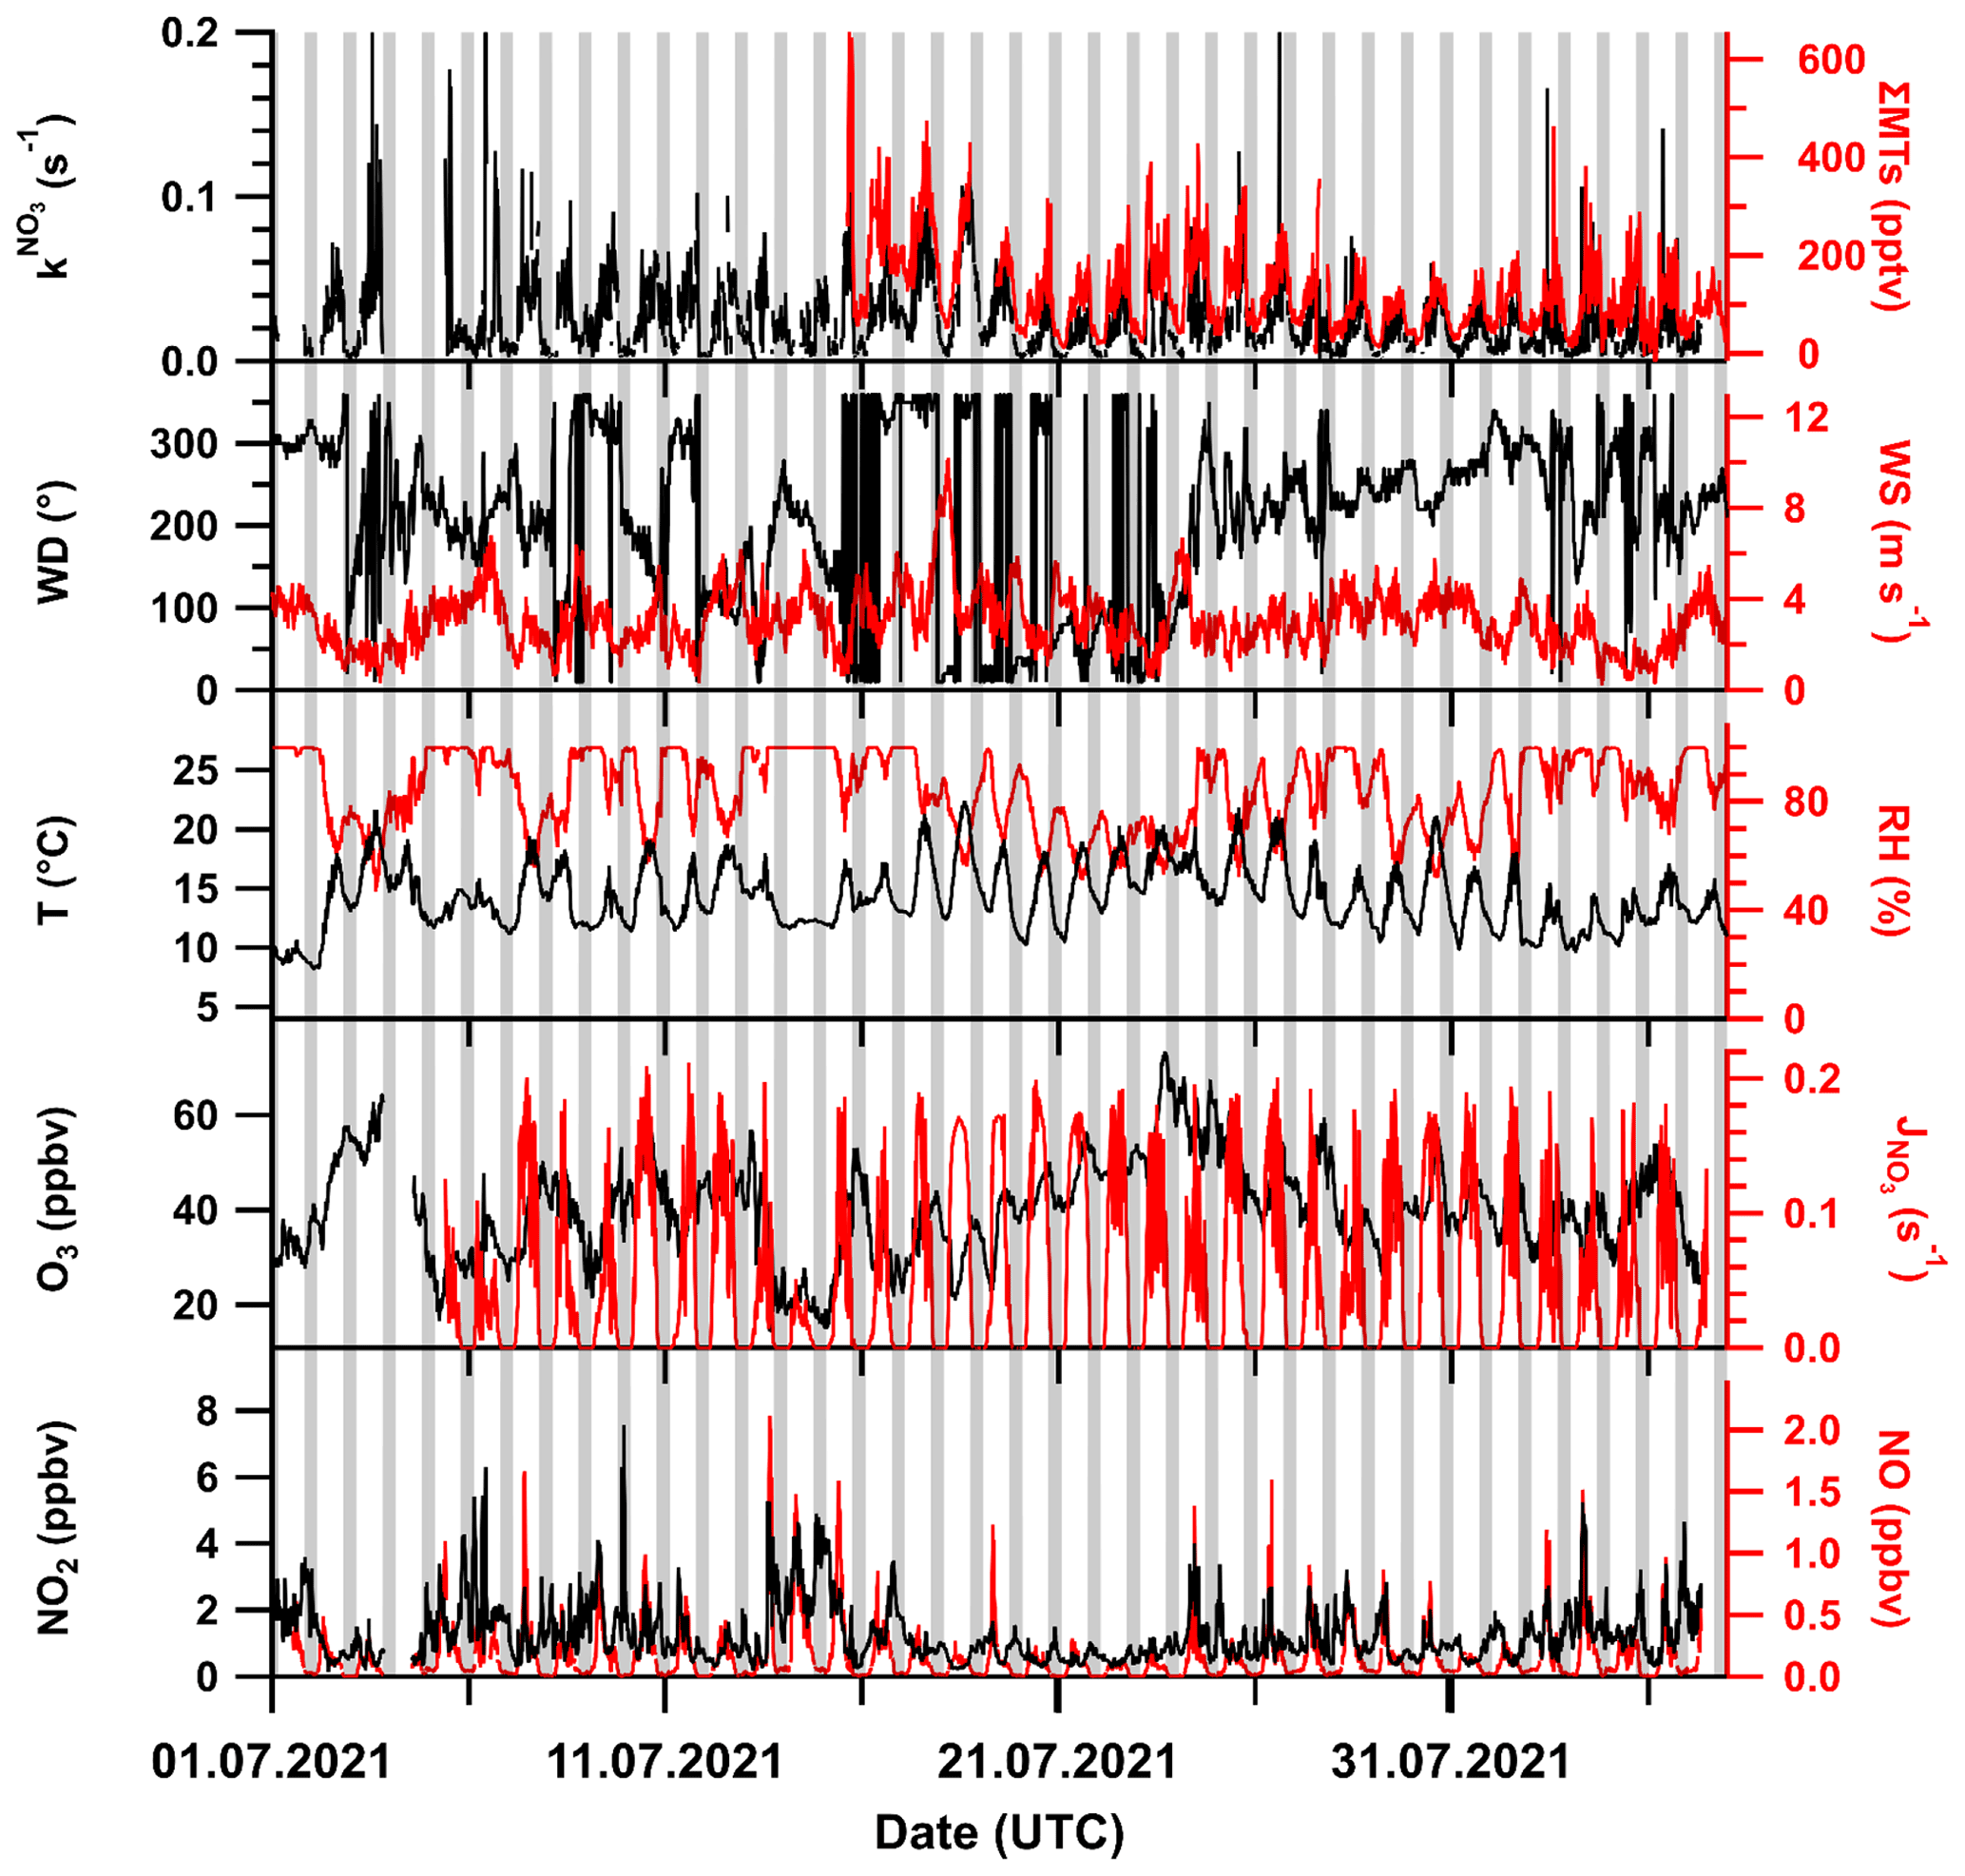
Figure 1Overview of key measurements during the TO2021 campaign with wind direction (WD), temperature (T), sum of monoterpenes (ΣMT, PTR8000 and scaled VOCUS), wind speed (WS), relative humidity (RH), and NO3 photolysis rate coefficient (). Meteorological data were provided by the German Meteorological Service (DWD). Nighttime periods are shaded grey. The x-axis ticks are at 00:00 UTC.
Wind speeds were predominantly between 2 and 4 m s−1, with most wind sectors represented, although wind from the east and southeast, originating from the Frankfurt area (SE), was rarely encountered. The local wind directions and speeds during TO2021 are displayed as a wind rose in Fig. S3a in the Supplement.
There were several periods of rain and fog during TO2021, which is reflected by high relative humidities (RHs) mostly between 75 % and 100 % at moderate temperatures between 12 and 20 ∘C. Ozone mixing ratios varied between 20 and 60 ppbv. The CLD set-up observed NO mixing ratios close to (10 to 20 pptv) or below the LOD of 7 pptv on about half of the nights but also returned values of between 20 to 80 pptv for prolonged periods on some nights. Daytime NO mixing ratios were between 0.5 and 2 ppbv, with maximum values around midday. Spikes in NO mixing ratios caused by vehicles at the site were removed from the dataset. NO2 mixing ratios (as measured with the FT-CRDS set-up) were generally between 1 and 2 ppbv, with occasional values of up to 6 ppbv. Photolysis rates of NO3 () of ca. 0.15 s−1 were detected at noon. The data gap between 3 and 5 July was caused by a power failure.
3.1 NO3 reactivity
As is evident from Fig. 1, followed the trend in monoterpene mixing ratios and was generally higher during the daytime compared to the night. As illustrated in a wind rose in the Supplement (Fig. S3b), displayed no clear dependence on wind direction. A closer examination of the data reveals that the nights can be divided into the following two types: on 15 of the 34 nights, NO3 reactivities remained well above the instrument's LOD of 0.006 s−1 (from now on defined as Type 1 nights), whereas during 14 nights, was predominantly lower than 0.006 s−1 (Type 2). The other 5 nights showed a transitional behaviour between those two types.
An example of a Type 1 night is shown in Fig. 2a. Following a late evening value of s−1, the NO3 reactivity decreased during darkness from 0.08 s−1 at 20:00 UTC to 0.02 s−1 at 03:00 UTC. During this period, northerly winds with speeds around 4 m s−1 prevailed, and the decrease in reactivity cannot be related to a change in air mass origin. At the same time, we observed a decrease in temperature (∼17 to ∼13 ∘C) that was accompanied by an increase in the relative humidity (78 % to 98 %) and a quasi-continuous reduction in O3 mixing ratios from ∼35 to ∼25 ppbv. Note that ca. 20–30 pptv of NO were detected during this night, implying that Reaction (R7) would represent a significant loss process for NO3. A detailed discussion of this aspect follows in Sect. 3.4.
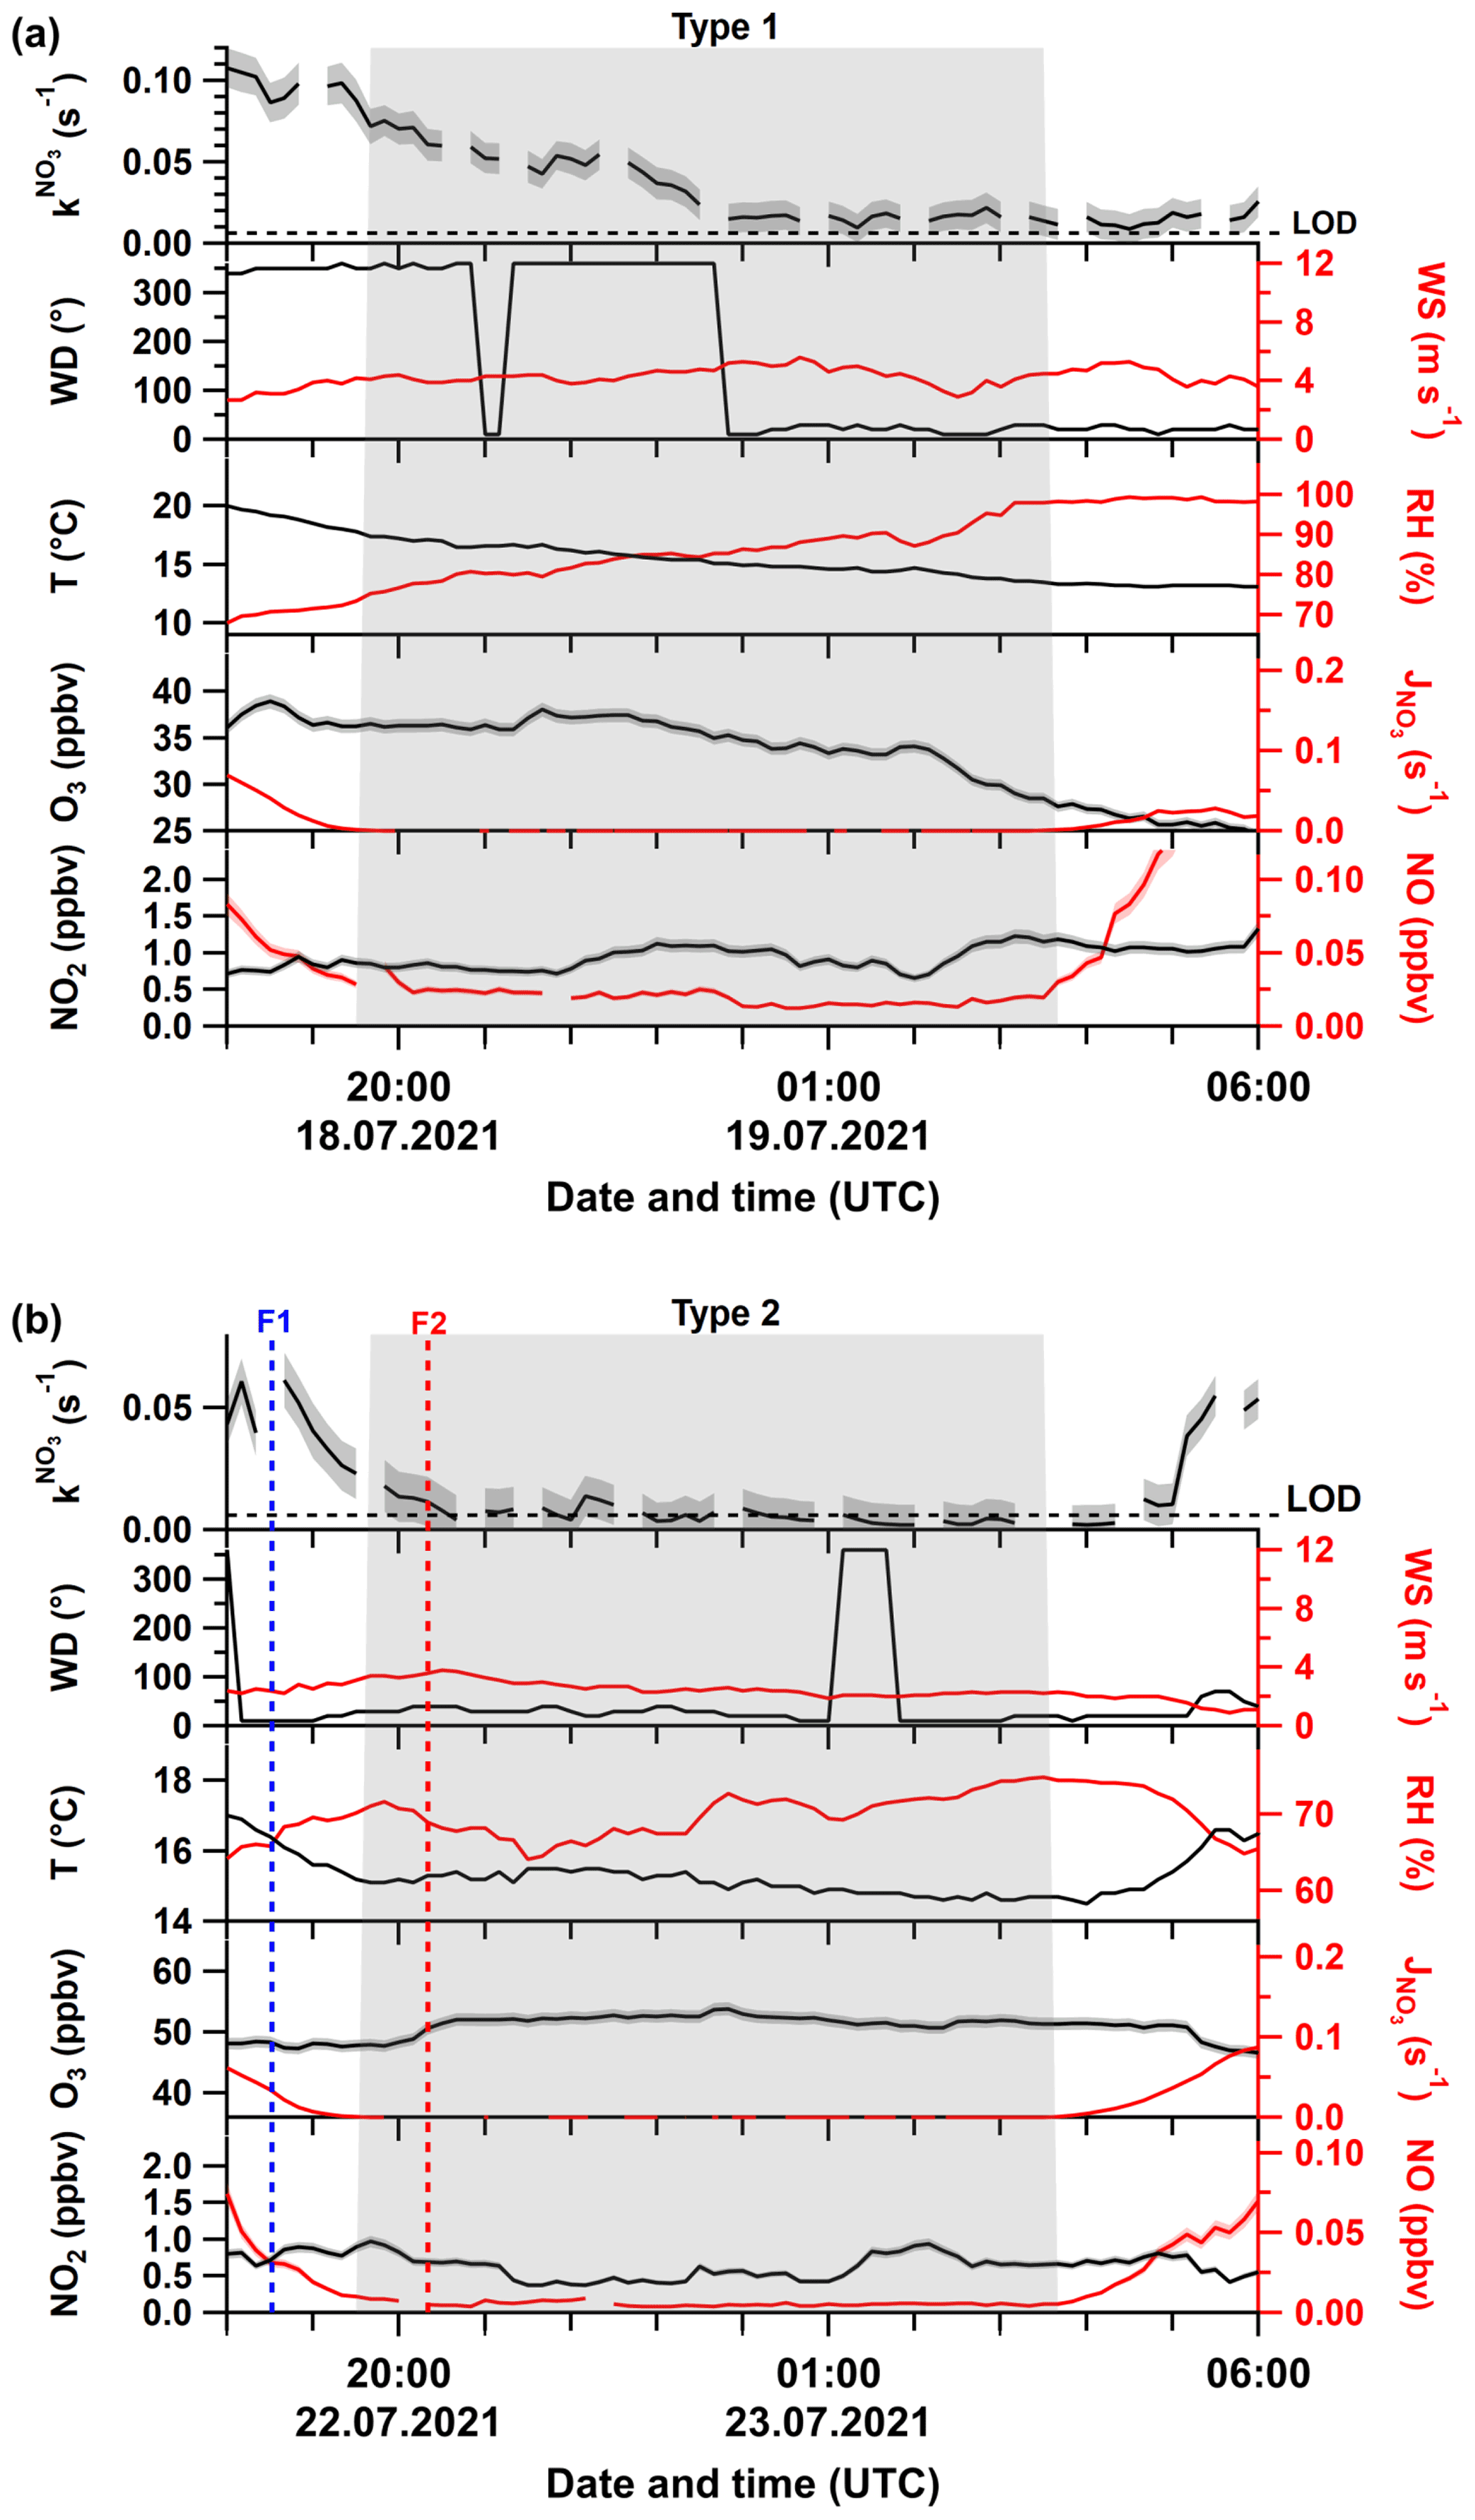
Figure 2Time series of directly measured NO3 reactivity (), together with auxiliary measurements during Type 1 (a) and Type 2 nights (b). F1 and F2 mark times at which drone-assisted temperature and relative humidity profiles were measured. The grey shaded area represents nighttime. Abbreviations are defined in the caption of Fig. 1. The shaded areas in the colour of the lines denote the corresponding uncertainty of the measured parameter.
Figure 2b shows an example of a Type 2 night with a sharp decrease in from ∼0.02 s−1 just before sunset to below the LOD (0.006 s−1) within the first hour after sunset. As for Type 1, there is no significant change in the wind direction. However, in contrast to the Type 1 example, after a slight increase just after sunset, O3 was roughly constant and significantly higher throughout the night, with NO below the detection limit during the entire night. In addition, the temperature (14 ± 1 ∘C) and relative humidity (70 % ± 5 %) were roughly constant, with the latter significantly lower than for the Type 1 example.
Low NO3 reactivities at nighttime (i.e. Type 2 nights) can result from a low rate of emission of biogenic VOCs (e.g. owing to low temperatures) but can also be associated with strong vertical gradients, which effectively decouple ground-level emissions from the air above. For the latter case, we are dealing with a shallow surface layer with its top below the inlet so that the air is sampled from the nocturnal boundary or residual layer (Brown and Stutz, 2012) in which the NO3 lifetimes can be very long. This phenomenon has been reported for this and other mountain sites (Carslaw et al., 1997; Brown et al., 2016; Sobanski et al., 2016; Liebmann et al., 2017; J. M. Liebmann et al., 2018). Slow exchange between the surface layer and the residual layer can result in strong gradients in trace gases such as O3, which undergoes dry deposition in the surface layer but is long-lived in, e.g., the residual layer. The situation for NO2 is more complex as it may be formed from the O3-induced oxidation of near-surface emissions of NO and also lost via (slow) reaction with O3 and dry deposition (Brown et al., 2003b, 2007a; Stutz et al., 2004).
Figure 3 displays the campaign-averaged diel cycles of (along with O3, RH, T, NO, and MTs) classified according to Type 1 or Type 2 nights. was on average around 0.015 s−1, during Type 1 nights, with a daytime reactivity of 0.04 s−1 (Fig. 3a). The observed orders of magnitude for are consistent with the directly measured nighttime NO3 reactivities ranging between <0.005 and up to 0.06 s−1 during 3 nights in July 2015 (NOTOMO campaign) with the same instrument (Liebmann et al., 2017).

Figure 3Median diel profiles of (a) directly measured NO3 reactivities, (b) O3 mixing ratios, (c) monoterpenes, (d) temperature, (e) relative humidity, and (f) NO mixing ratios classified by night types (Type 1 in black; Type 2 in red). The grey shaded area represents the nighttime period. The shaded areas in line colour represent the 25th and 75th percentiles. The blue lines denote the LODs of the instruments used to measure NO3 reactivity and NO.
By definition, the median nighttime reactivity for Type 2 nights is at the instrument's LOD, while the median daytime reactivities prior to Type 2 nights are very similar to those observed prior to Type 1 nights. The median diel cycles for O3 (Fig. 3b) differ significantly for the two types. During Type 1 nights, O3 decreases continuously (consistent with previous observations at this site; Handisides, 2001), while during Type 2 nights, O3 mixing ratios remain fairly constant and higher. There are also significant differences in the median NO mixing ratio, with nighttime values (Fig. 3f) mostly below or close (10–12 pptv) to the LOD during Type 2 nights and values of 30–40 pptv during Type 1 nights.
The lower nighttime values observed during Type 2 nights compared to Type 1 nights is accompanied by lower (factor ∼2.5) monoterpene mixing ratios (Fig. 3c). The median temperature during Type 2 nights is up to 1 K colder than compared to Type 1 nights (Fig. 3d), which, based on the expression () with β=0.1 K−1; Guenther et al., 1993), results in a change of only 10 % and is thus insufficient to explain the differences observed in ΣMT on these nights.
With values of 85 %–95 %, the median relative humidity (Fig. 3e) was higher by around 5 % (and increased continuously) during Type 1 nights than for Type 2, for which a much smaller increase from 82 % to 87 % was observed.
In summary, in addition to very low NO3 reactivity, Type 2 nights are characterized by (1) larger and constant O3 mixing ratios, (2) lower but constant RH, and (3) low concentrations of reactive trace gases like NO and monoterpenes. These observations support the presence of a very shallow surface layer with its top located below the tip of the inlet and decoupling of the sampled air from ground-level emissions (i.e. of NO and VOCs). The top of the bush and shrub-like vegetation adjacent to the inlet (within a 20 m radius) was several metres below the top of the inlet. Previous observations of strong gradients in NO3 mixing ratios and low reactivities have showed that decoupling of the air mass from ground-level emissions can lead to NO3 lifetimes of up to hours (Allan et al., 2002; Brown et al., 2016; Sobanski et al., 2016). In order to test the hypothesis that low NO3 reactivities observed during Type 2 nights are the result of sampling from the nocturnal boundary layer (NBL), we mounted temperature and relative humidity sensors on a multi-copter drone to measure gradients in these parameters on the night of 22–23 July, which is the night depicted in Fig. 2b.
The drone was located ∼20 m to the NE of the inlet, and the starting height (ground level) was about 12 m lower than the top of the inlet. The drone flew a vertical profile with the first ascent/descent starting before sunset at 18:30 UTC (blue dotted line; F1 in Fig. 2b) and a second after sunset at 20:20 UTC (red dotted line; F2 in Fig. 2b). The flights were restricted to heights of ∼100 m a.g.l., owing to operational restrictions in the vicinity of Frankfurt airport.
The gradients in potential temperature θ for the two flights are shown in Fig. 4a. At 18:30 UTC (blue curve), the potential temperature increases gradually with altitude (positive stratification) as expected for a well-mixed boundary layer (Stull, 1988; Brown et al., 2007b). In contrast, the potential temperature gradient measured at 20:20 UTC reveals a strong increase in the first 3 m, which represents the nocturnal surface layer. Above this, the potential temperature increases more slowly until ca. 20 m a.g.l. This zone (shaded in red) represents the stable NBL above which the potential temperature is almost independent of height (neutral stratification), which is the typical behaviour of the residual layer (Stull, 1988; Brown et al., 2007b). The gradient in relative humidity (Fig. 4b) after sunset indicates a similar vertical structure, with the top of the NBL characterized by a minimum in the relative humidity (Brown et al., 2007b), also explaining why RH was, on average, lower during Type 2 compared to Type 1 nights (Fig. 3e). The approximate height of our inlet was situated ca. 10 m a.g.l., and the profile of θ implies that the air we sampled was from a NBL decoupled from ground-level emissions and in which vertical mixing is weak (Brown and Stutz, 2012). Under this scenario, NO originating from soil emissions and VOCs from plant emissions are trapped in the surface layer and only inefficiently entrained into the NBL. Unfortunately, owing to delays in obtaining permission to fly the drone, unfavourable weather conditions, and other logistical considerations, these two flights on this 1 night are the only ones in which vertical profiles of temperature and RH were obtained. Nonetheless, these observations provide important clues as to how the meteorological situation can influence NO3 reactivity and NO levels at inlet height.

Figure 4Vertical profiles of potential temperature (a) and relative humidity (b) at the summit of the Kleiner Feldberg at 18:30 UTC (blue) and 20:20 UTC (red). The nocturnal boundary layer (NBL) at 20:20 UTC is shaded red. The inlet height is indicated by a black dashed line.
3.2 Contribution of VOCs to
As described above, includes the contribution of VOCs only, and it is thus expected to correlate with the summed first-order loss rates, Σki[VOC]i derived from the concentration [VOC]i of each VOC and the corresponding rate constant (ki) for its reaction with NO3, provided that all VOCs with a significant contribution were measured.
Unsaturated organic compounds (often of biogenic origin such as isoprene or terpenes) are generally the dominant reaction partners for NO3 in forested environments (Ng et al., 2017). During TO2021, several hundreds of pptv of isoprene, monoterpenes, and sesquiterpenes were detected during the second half of the campaign when VOC measurements became available (see Figs. 1 and S4). Owing to their low rate coefficients (IUPAC, 2022), alkanes, aromatics, and saturated oxygenated species such as acetaldehyde, acetone, and methanol were found to contribute negligibly to . Consequently, only isoprene and the sum of mono- and sesquiterpenes are relevant for analysis. GC-MS measurements from a previous summer campaign at this site (Sobanski et al., 2017) derived fractional contributions to ΣMT of 50.5 %, 28.9 % and 20.6 % for α-pinene, limonene, and myrcene, respectively. Using an accordingly weighted average of evaluated kinetic data (IUPAC, 2022), we derived an effective rate constant of cm3 molec.−1 s−1 for NO3+ monoterpenes reactions at this site. As speciated measurements of sesquiterpenes are not available, in order to calculate NO3 loss rates resulting from its reaction with all sesquiterpenes, we used the IUPAC-recommended rate coefficient for NO3+β-caryophyllene. This is often the dominant sesquiterpene measured in air and is also the sesquiterpene used to calibrate the PTR8000. Neglecting the uncertainty associated with the assumption that the MT mixture was the same in both campaigns and that combining the uncertainty in the measured VOC mixing ratios (20 %) and in the effective rate coefficient (25 %) leads to an overall fractional uncertainty of 33 % in each term of Σki[VOC]i.
In Fig. 5a, we present a time series of and Σki[VOC]i. Clearly, and Σki[VOC]i agree within associated uncertainties most of the time. The poorer agreement observed around the 16 July may have been related to the presence of fog and droplets in the sampling line, and the poor agreement around the 24 July was most probably caused by conditioning effects when switching between flow tubes. As indicated by the area in purple, the NO3 reactivity was almost entirely determined by the reaction with monoterpenes. Figure 5b focusses on the Type 2 night previously shown in Fig. 2b (but all LOD set to 0.006 s−1) suspected to be impacted by a boundary layer effect. Within associated uncertainties, the VOC measurements confirm that VOC-induced NO3 reactivities are close to or below 0.006 s−1 for this period. The average contribution of the VOCs to Σki[VOC]i is depicted in Fig. 5c and shows that 84 % of the overall reactivity is caused by monoterpenes, while isoprene and sesquiterpenes contribute 7 % and 9 %, respectively.
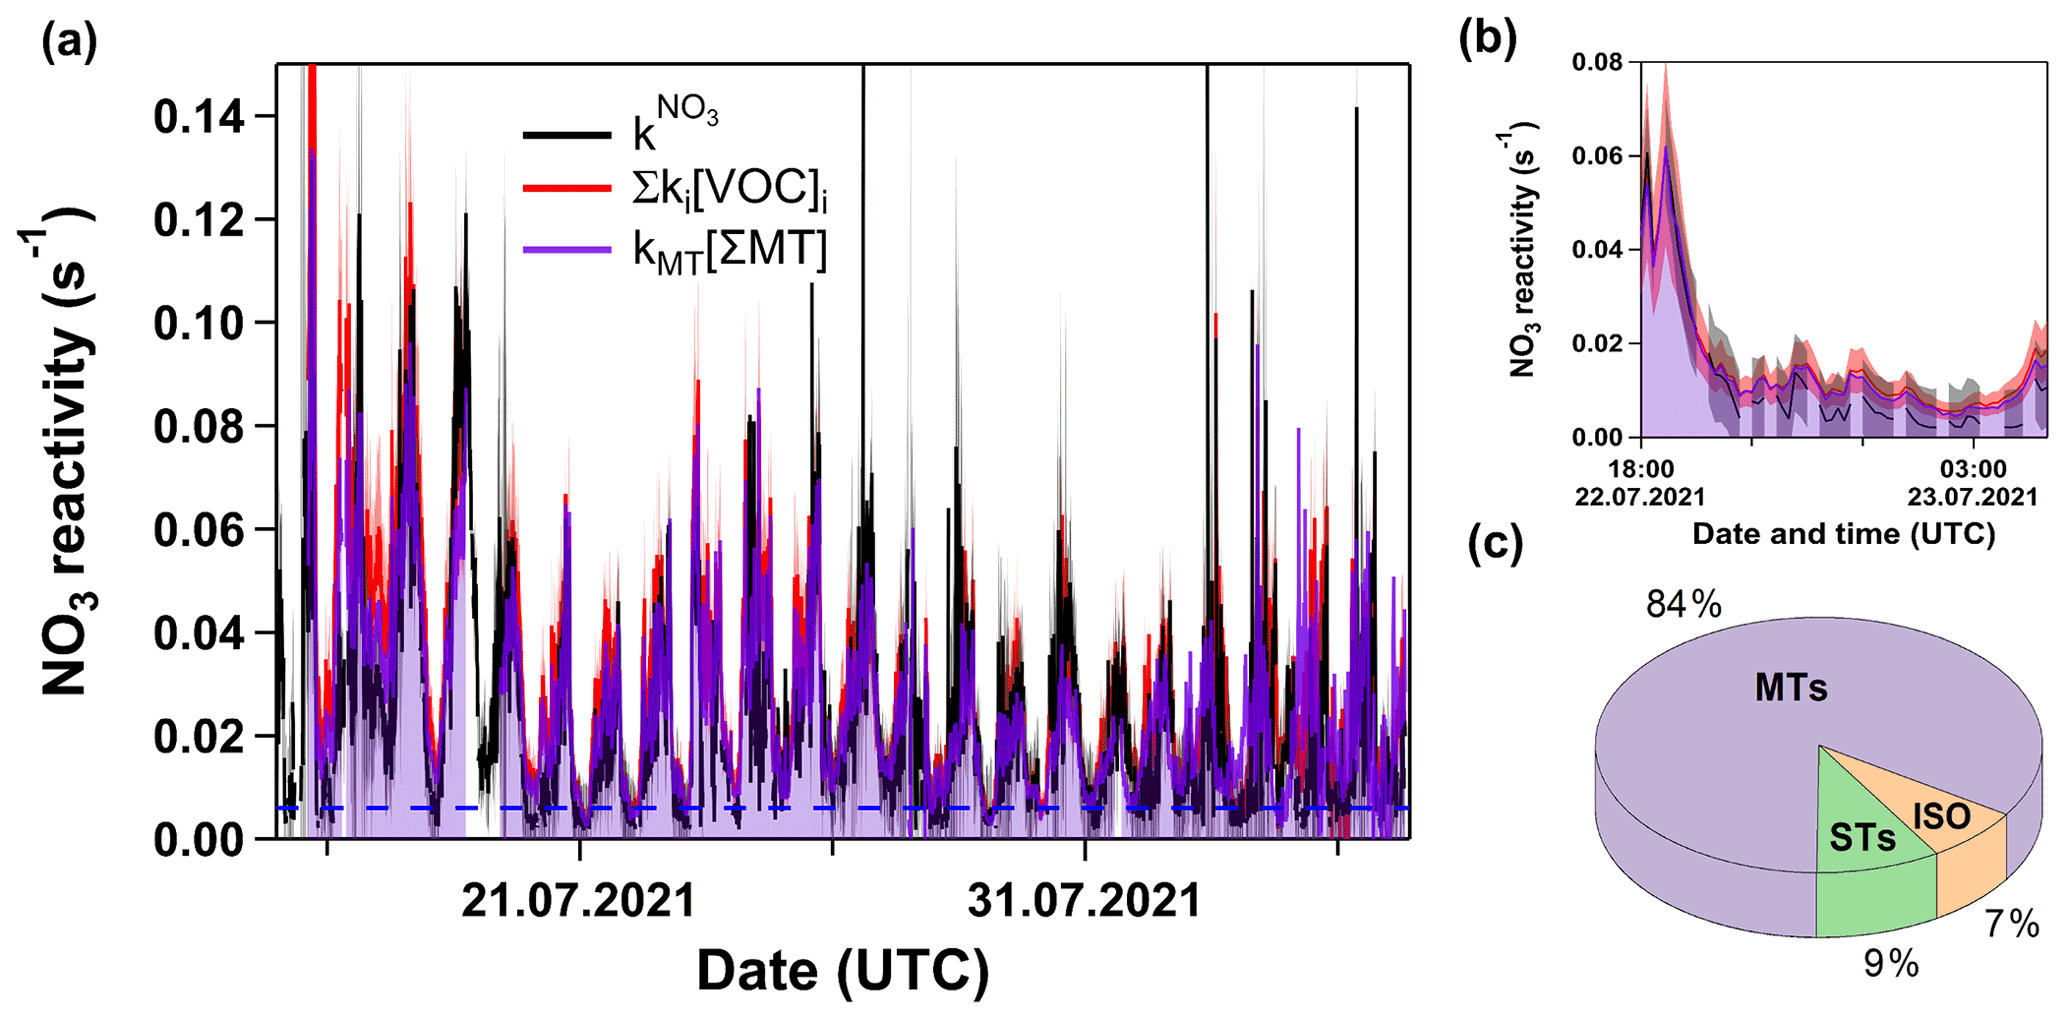
Figure 5(a) Time series of and Σki[VOC]i. Dashed blue line marks the LOD of the measurement. The purple line, together with the same-coloured shade, represents the contribution of monoterpenes. The red and grey shaded areas represent the uncertainty associated with and Σki[VOC]i, respectively. (b) Same as panel (a) but with a detailed view of the night between 22 and 23 July presented in Fig. 2b. (c) Pie chart of fractional contributions of isoprene, monoterpenes, and sesquiterpenes to Σki[VOC]i over this time period.
Figure 6 plots Σki[VOC]i versus for which a bivariate regression yields a slope of 1.04 ± 0.03 (2σ; Boggs et al., 1989) and an intercept of (6.6 ± 0.4) s−1. A slope close to unity suggests near-closure for the NO3 reactivity budget, while the intercept is the equivalent to the reactivity caused, for example, by 27 pptv of β-caryophyllene or an overestimation of NO by just 18 pptv. We recall, however, that speciated monoterpenes were not measured in TO2021, and the effective rate constant was based on the (non-testable) assumption that the summertime monoterpene composition at this site is the same as in 2011. Seasonal and meteorological variations and changes in vegetation over the years mean that this assumption (and the slope of 1.04) is associated with significant uncertainty. The correlation coefficient of 0.8 indicates a reasonable quality of fit. This is also seen (Fig. S4c in the Supplement) in a time series showing the difference between and Σki[VOC]i. The scatter in both plots is likely to be caused by changes in the monoterpene composition or the different location of the instruments' inlets. The true uncertainty associated with the slope is expected to be close to 30 %, suggesting that the very good agreement may be partially fortuitous. Nonetheless, we can conclude that the vast majority of the reactivity measured directly results from NO3+ monoterpene interactions.
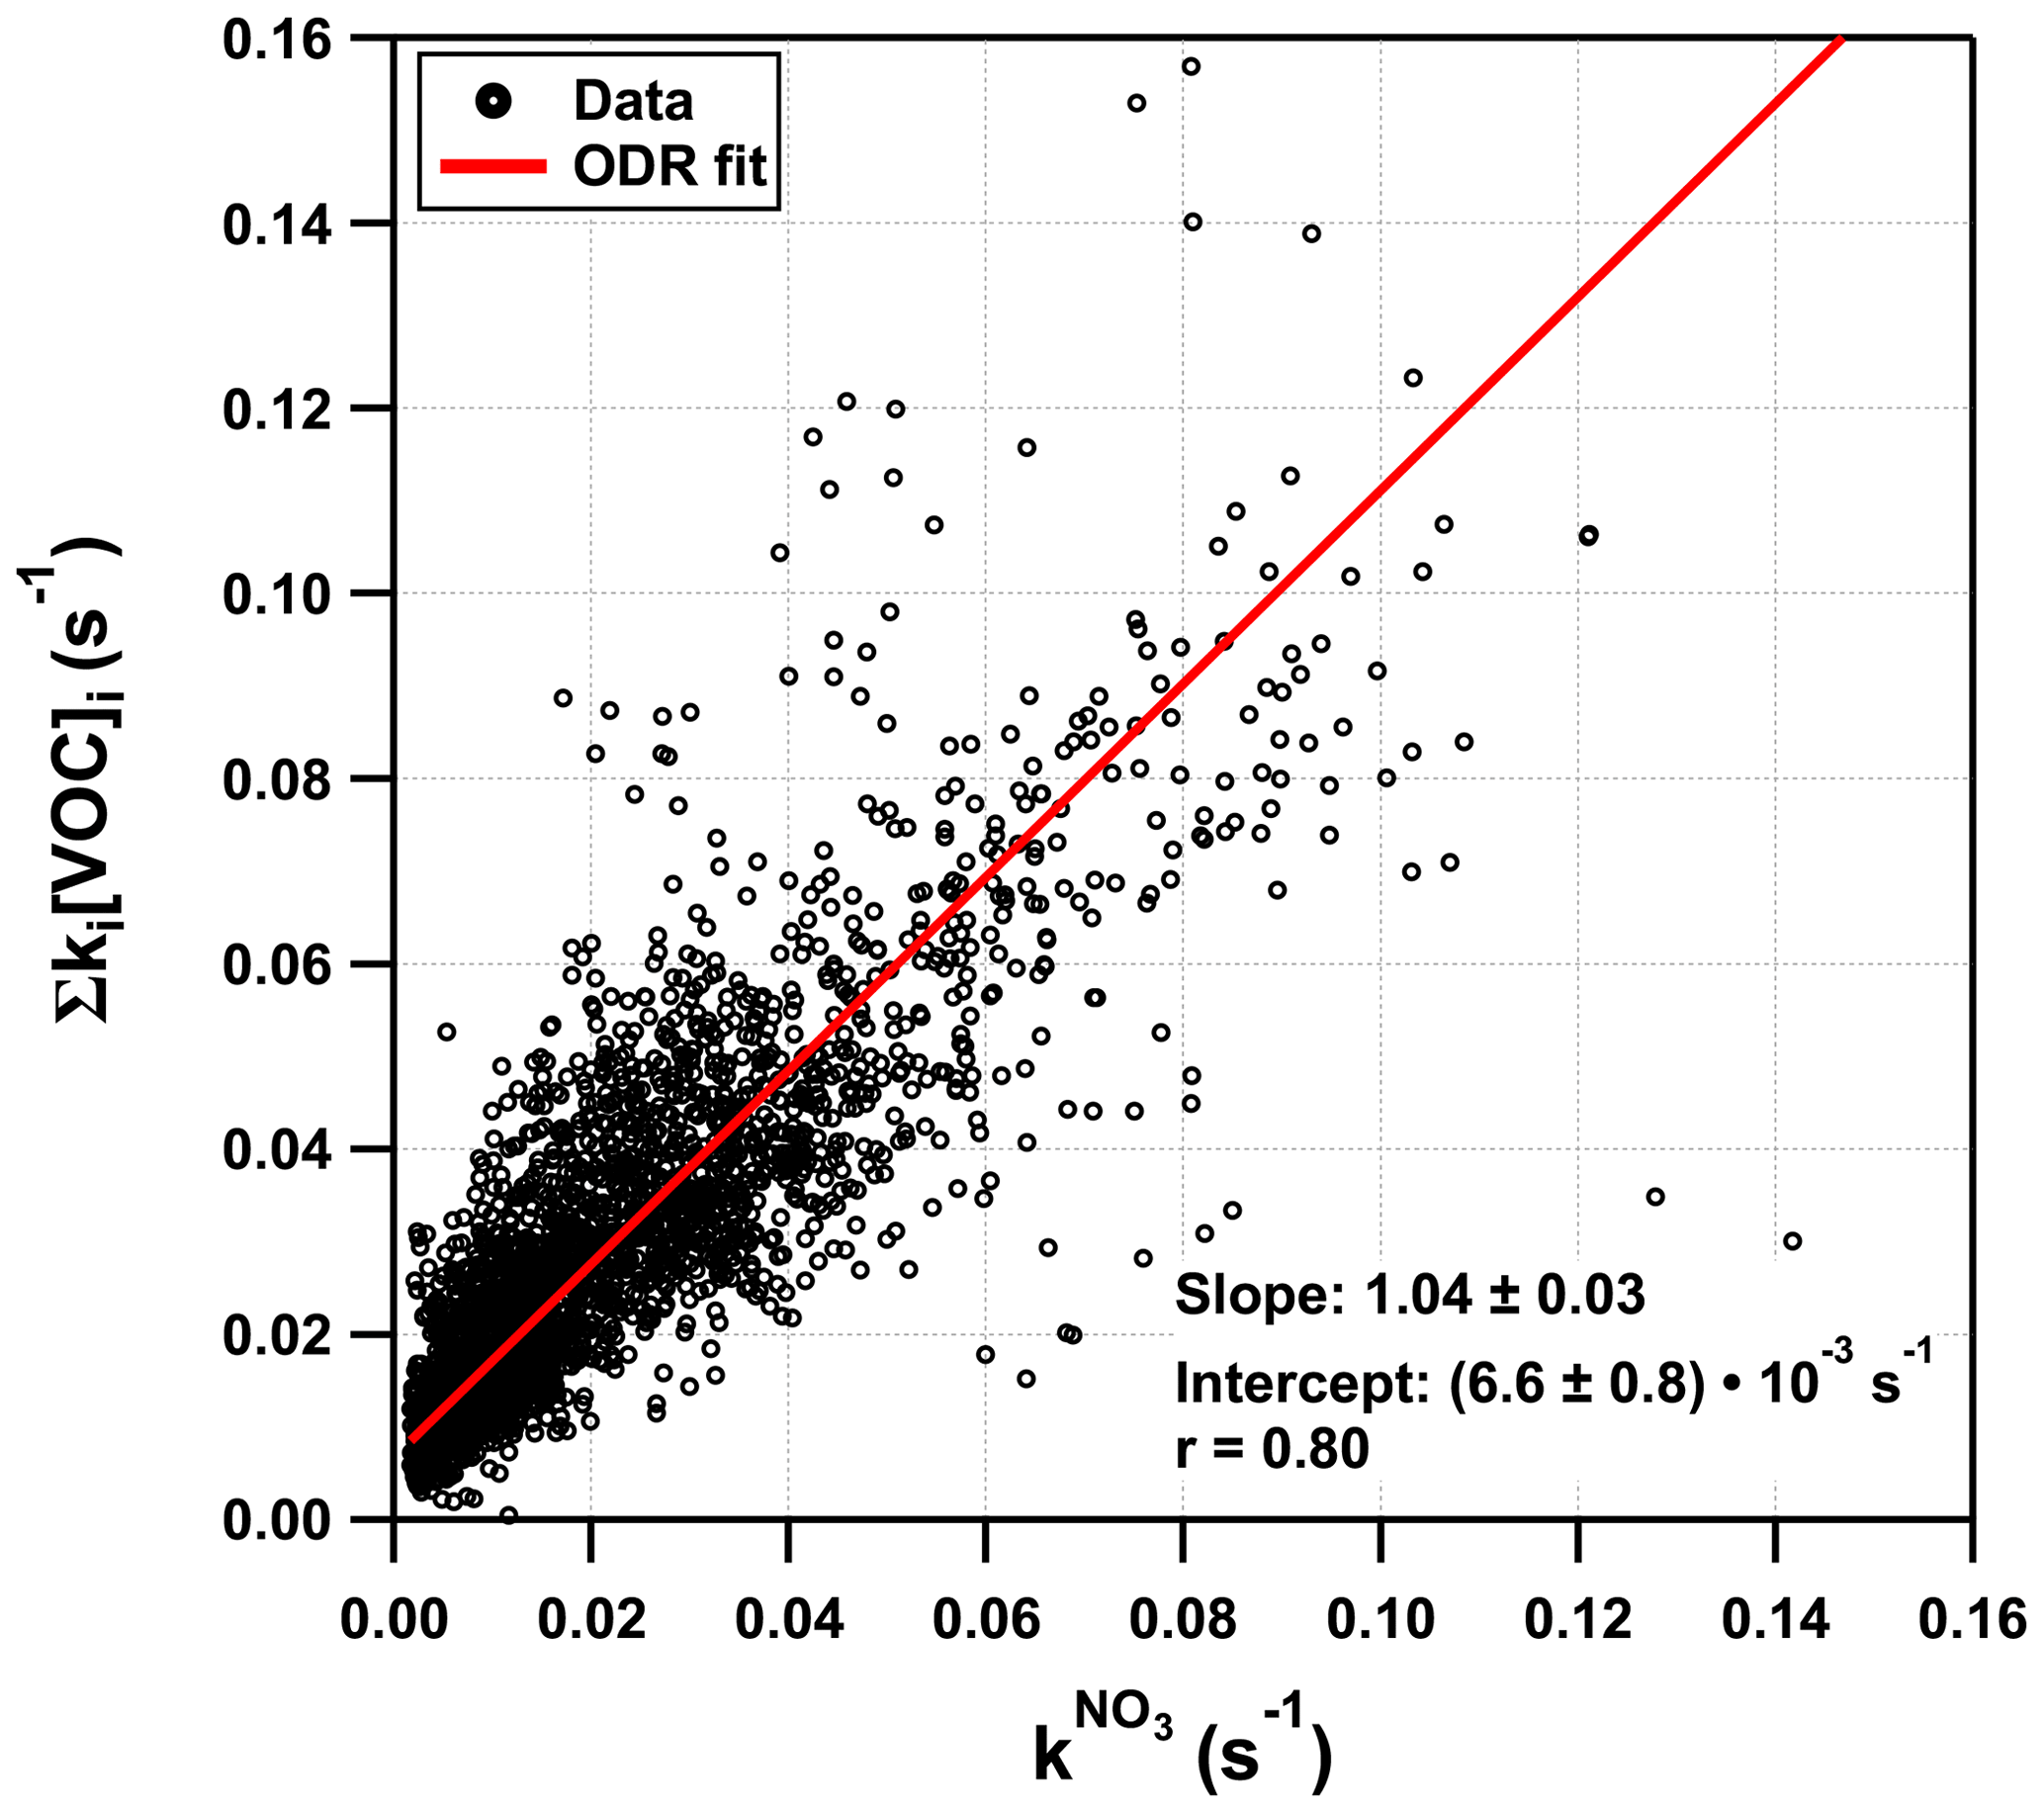
Figure 6Plot of versus Σki[VOC]i. The red solid line represents an orthogonal distance regression (ODR) with a slope of 1.04 and an intercept of s−1. For the sake of better clarity, error bars were omitted.
3.3 Fractional contribution of VOCs to NO3 losses throughout the diel cycle
The dominant direct gas-phase loss of NO3 occurs via photolysis (), reaction with NO (k7[NO]), and reaction with VOCs ( ). Neglecting depositional losses of NO3, the fractional contribution F of to the overall NO3 loss rate constant, , is thus given by the following:
Based on measured , [NO], and (calculated from actinic flux measurements), we calculated the time-dependent values of each loss process throughout the campaign. Losses due to reaction with RO2 radicals on this site are expected to be insignificant. Taking the average maximum ROx mixing ratio of 20 pptv, as measured by Handisides (2001), and the corresponding rate coefficient (IUPAC, 2022) results in an NO3 loss rate of 0.001 s−1, which is insignificant compared to the other loss rates mentioned above. The resulting mean diel cycle of F is depicted in Fig. 7.
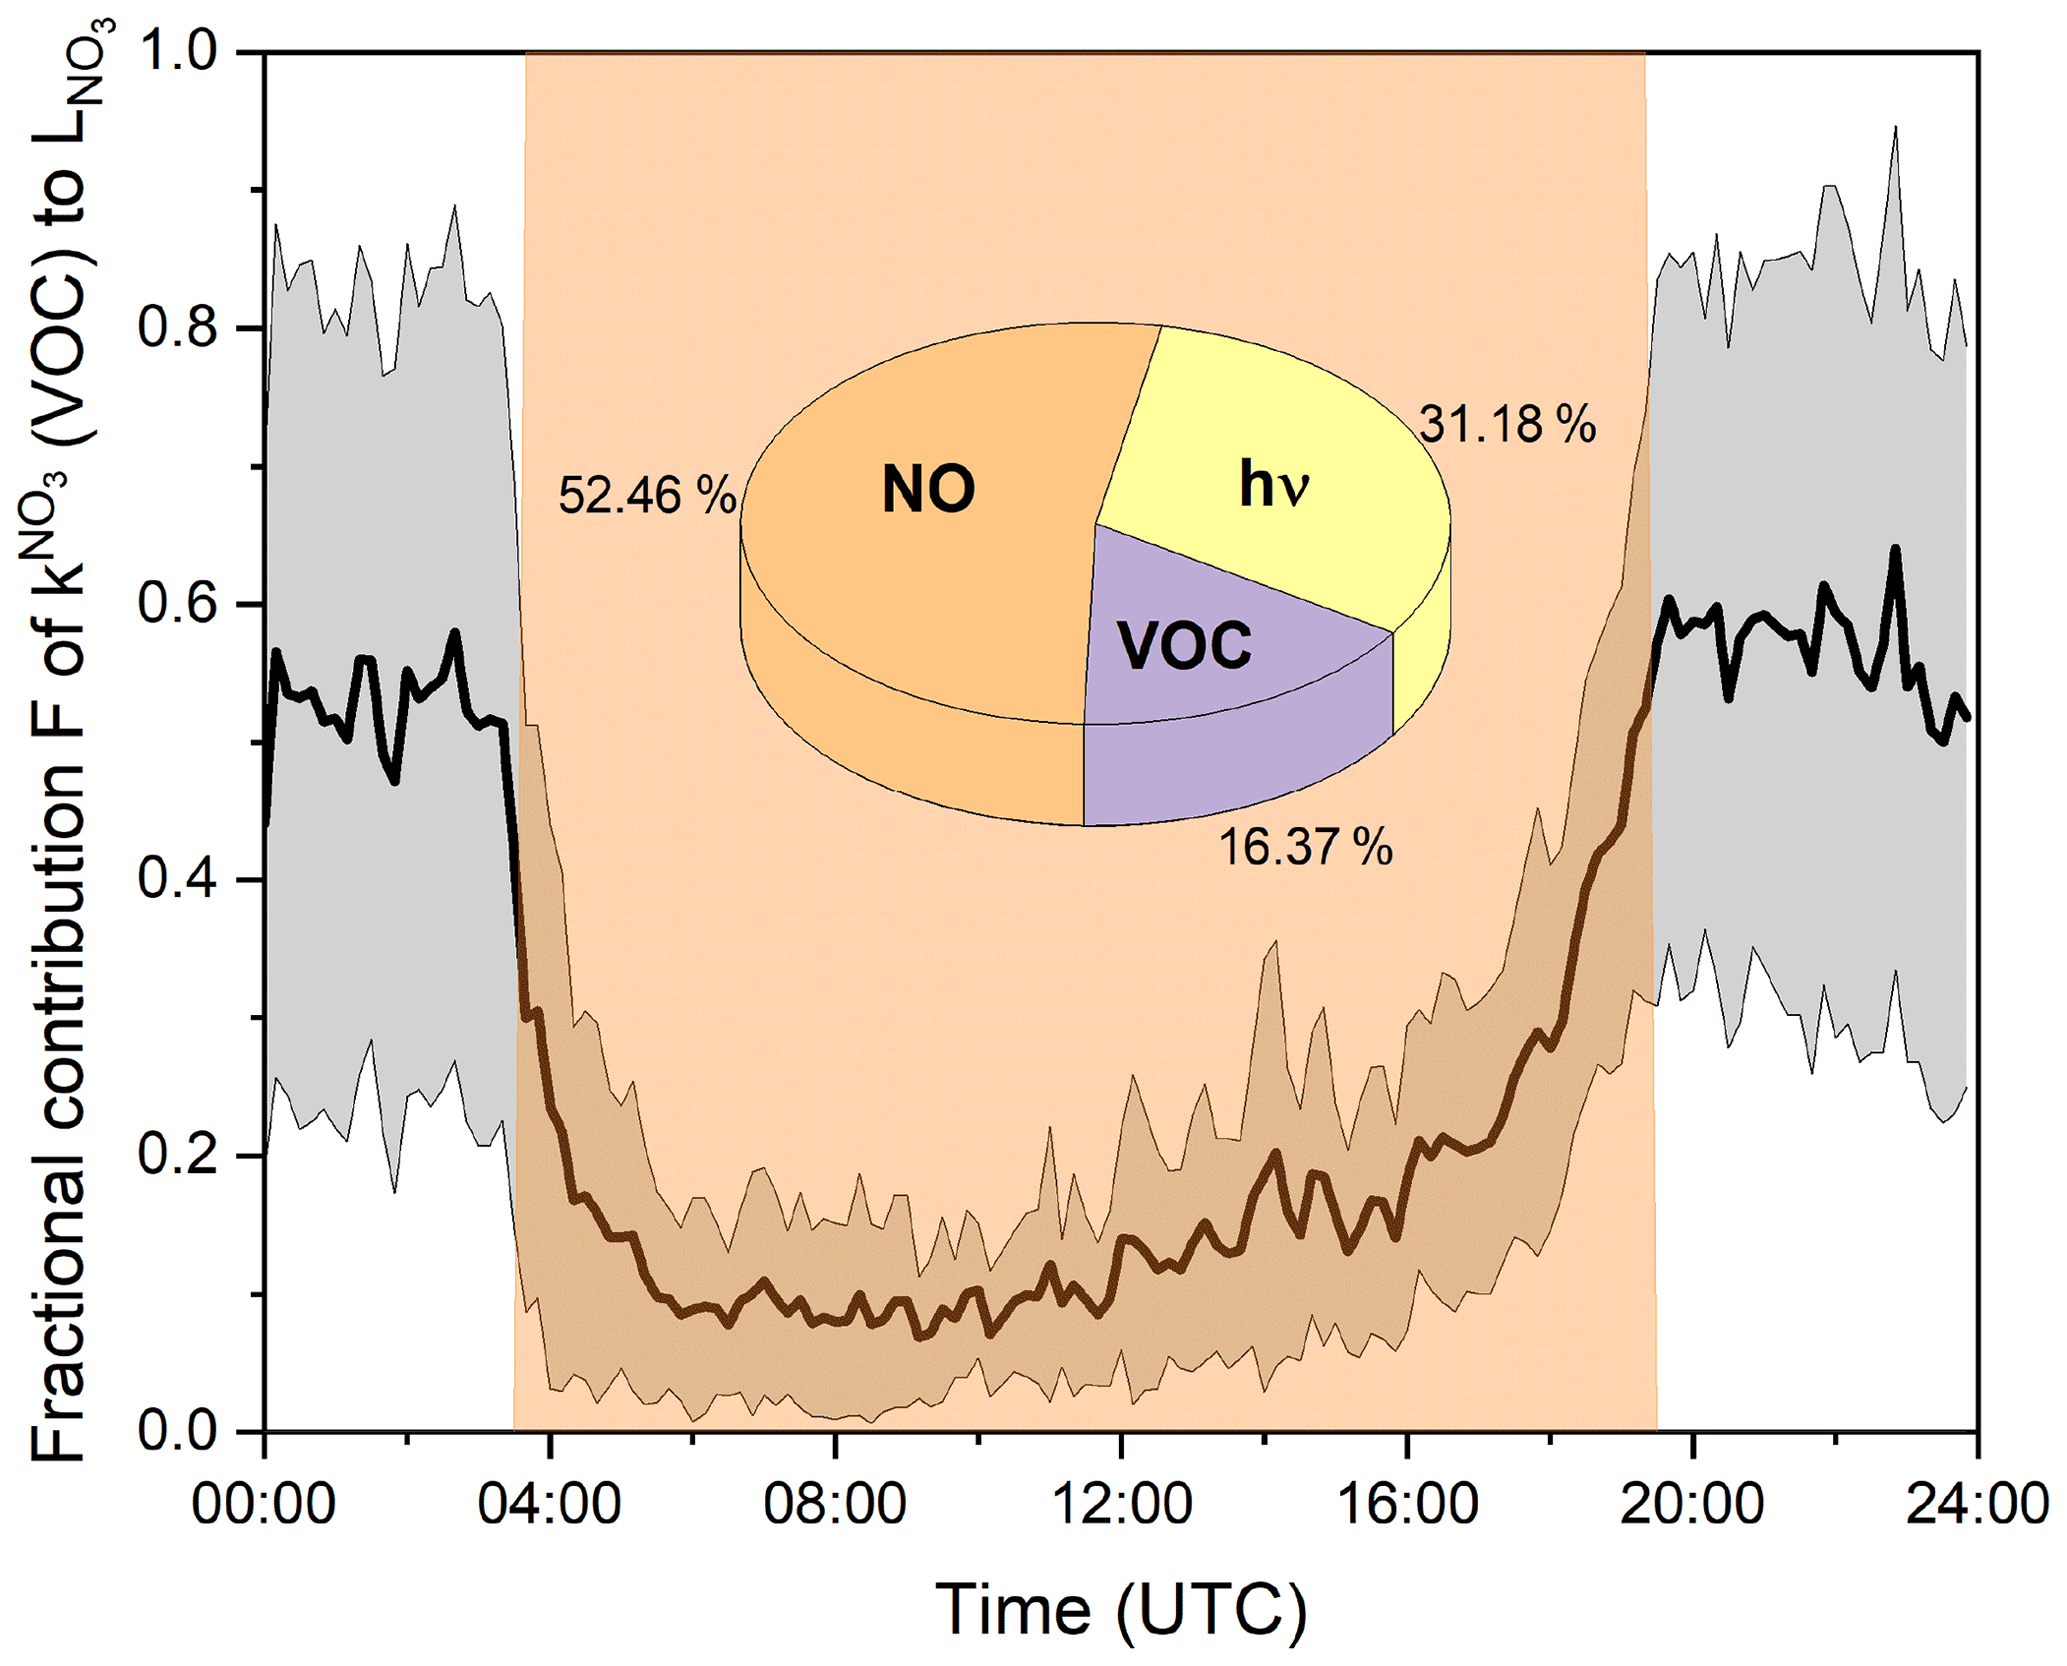
Figure 7Mean fractional contribution (F) of (i.e. VOC contribution) to the overall NO3 loss rate over the diel cycle. The grey shaded area represents the standard deviation (1σ) of the mean values. Orange shaded area indicates daytime. The pie chart shows the mean fractional contribution to the NO3 loss in the reaction with NO, photolysis, and the reaction with VOCs during the daytime.
During the daytime, photolysis and the reaction with NO were the dominant loss processes for NO3, as expected. The fractional contribution of VOC-induced losses is low at noon (∼9 %) but increases to ∼30 % in the afternoon at 18:00 UTC due to the decrease in NO levels between 08:00 and 16:00 UTC (Fig. 3f) and decreasing actinic flux and the associated slowing of both NO3 and NO2 photolysis to NO beginning at 16:00 UTC. The NOx levels at this site are such that, between sunrise and sunset, reaction with NO is on average ( ± 1σ) the dominant loss process for NO3 (53 % ± 20 %), followed by photolysis (31 % ± 19 %) and the reaction with VOCs (16 % ± 15 %). This non-negligible contribution of VOCs to the daytime losses of NO3 is in broad agreement with field measurements in a boreal forest in Finland and on top of the Hohenpeißenberg mountain, where values of ∼20 % were reported (J. Liebmann et al., 2018; J. M. Liebmann et al., 2018). Assuming noon mixing ratios of 0.1 pptv NO3 (see Fig. 9), 42 ppbv O3 (see Fig. 3), and 106 molec. cm−3 OH (Lelieveld et al., 2016) and taking evaluated rate coefficients (IUPAC, 2022), the lifetime of limonene towards these three oxidants would be , s−1 and s−1. NO3 would thus contribute ca. 7 % to the daytime oxidation of limonene. This underlines that NO3, often considered to be important only at night, also contributes to the oxidation of BVOC during the day and thus potentially to the formation of organic nitrates (in competition with OH- and O3-initiated oxidation) throughout the diel cycle, for example (Liebmann et al., 2019; Foulds et al., 2021).
At nighttime, in the absence of actinic radiation (to convert NO2 to NO) and less local anthropogenic NO emissions due to reduced traffic, NO levels are generally suppressed by reaction with O3. Figure 7 reveals that 50 %–60 % of NO3 was lost via reaction with VOCs at nighttime during TO2021, the remaining fraction reacting with NO (Reaction R7). The contribution of NO to the nighttime NO3 reactivity is larger than previously observed with the -FT-CRDS instrument, where reaction with VOCs was identified as the only significant loss process (J. Liebmann et al., 2018; J. M Liebmann et al., 2018). A significant average contribution from NO is readily understood when one considers the large rate coefficient for reaction with NO3 ( cm3 molec.−1 s−1 at 298 K; IUPAC, 2022) and NO mixing ratios well above the detection limit on many nights.
3.4 Effect of nighttime NO on NOx budget
Figure 8 reveals a large night-to-night variability in the NO mixing ratio, with minimum values close to the detection limit and maxima >80 pptv in the presence of several tens of ppbv of O3. The presence of NO and O3 at the mixing ratios observed implies a significant source of NO2. In the following, we derive the NO emission and NO2 deposition rates required to explain the observed NO, NO2, and O3 mixing ratios. In the absence of local anthropogenic sources, soil emissions constitute the most likely source of NO at this site. Assuming that a reaction with O3 represents the only NO loss process and that the stationary state as in Eq. (2) is achieved (a valid assumption as the lifetime of NO is only a few minutes in the presence of 20–40 ppbv of O3), NO emission rates (ENO) of 0.18 to 0.47 pptv s−1 are necessary to reproduce the observed nighttime NO mixing ratio within a surface layer of 10 m height.
In the absence of measurements of NO soil emission fluxes at the site, and recognizing that these are highly dependent on temperature, season, soil humidity, and degree of fertilization (Pilegaard, 2013), we take an annual mean NO emission flux of 1 kg ha−1 yr−1 for temperate, uncultivated grassland (Ludwig et al., 2001) to derive (assuming the same layer height of 10 m) an NO emission rate of 0.27 pptv s−1, which lies within the range quoted above. Note, however, that this estimation assumes a mixed layer. Assuming a linear gradient in NO mixing ratios with height, the NO emission rates at ground level would be a factor of 2 higher (Shepson et al., 1992; Fischer et al., 2019). As the summit of the Kleiner Feldberg is covered with blueberry bushes and surrounded by coniferous forest and that soils impacted from blueberry plants or spruce can support higher NO net fluxes than grass-covered soils (Bargsten et al., 2010), significant NO soil emissions at the summit of the Kleiner Feldberg appear to be plausible. Figure 8 also reveals that the highest levels of NO observed at 10 m height occur when O3 values are lowest. Anti-correlated NO and O3 mixing ratios are often observed when plumes of freshly emitted NO is mixed into aged air masses containing O3 and is a result of Reaction (R1) which converts NO to NO2. For our observations at 10 m height, chemistry (temperature-dependent kinetics), boundary layer dynamics (extent of mixing/decoupling of surface layer and NBL) and plant physiology (emission rates of NO) may all contribute to the extent to which NO and O3 react. As the large night-to-night variability in the NO mixing ratios cannot be explained by temperature-dependent changes in the rate coefficient k1 or in the emission rate of NO, we conclude that boundary layer effects dominate and that the height of the surface layer and the degree to which NO is entrained from the surface layer into the NBL are the main controlling factors. We consider the following two limiting cases: (1) When the top of the nocturnal surface layer is above the inlet, and mixing is sufficient to homogenize the air within the first 10 m a.g.l., NO originating from the soil can react with O3 via Reaction (R1) (Aneja et al., 2000). This would correspond to observations during Type 1 nights. (2) When the surface layer is less than 10 m deep and is decoupled from the NBL, soil-emitted NO is not sampled by the inlet (ca. 10 m a.g.l.), and the measured NO mixing ratios are at the instrument's LOD. In this case, levels of O3 in the NBL remain high, as, e.g., observed around 21 July. In reality, trace-gas gradients within the lowest layers will control the extent of mixing, and case (1) will only operate when high wind speeds induce turbulent mixing close to the surface. We conclude that the variability in nighttime NO and the anti-correlation with O3 (see Fig. S5a) reflect rapid changes in boundary layer dynamics and vertical mixing within the lowest layers. Similarly, high variability in NO3 mixing ratios has been attributed to a related phenomenon (Crowley et al., 2011). We note that if the timescales over which boundary layer dynamic change is less than the lifetime of NO, our steady-state assumption breaks down. Nonetheless, the presence of up to 80 pptv of NO at nighttime in the presence of 20–40 ppbv of O3 implies significant production of NO2.

Figure 8Nighttime NO mixing ratios (colour-coded by O3 mixing ratios) during TO2021. The x-axis ticks represent 00:00 UTC.
We examined the nighttime generation of NO2 using box model calculations (Facsimile/Chemcat; Curtis and Sweetenham, 1987) employing Reactions (R1) to (R4) and (R7) with IUPAC-recommended, temperature-dependent rate coefficients (Table S5 in the Supplement) and constrained by measurements of NO, O3, ambient temperature, and pressure. Known loss processes for NO2 at night are the slow reaction with O3 (to form NO3) and with NO3 to form N2O5 (Reaction R2–R4) and deposition to surfaces (e.g. foiliage and soil). Note that this simulation considers Reaction (R1) as being the only NO2 source and that it is only valid if chemistry and transport happen on a similar timescale. Heterogeneous losses of NO3 and N2O5 were not considered since these were found to be insignificant compared to gas-phase losses (of NO3) during previous campaigns on the KF (see below; Table 1). Furthermore, note that vertical gradients are not considered in this simulation, which aims to provide a ballpark value for the NO2 loss term needed to explain its mixing ratios in the presence of a known production rate.
Figure 9 plots the measured nighttime NO2 mixing ratios (black symbols) together with the model output using the NO2 deposition velocity (vd) cm s−1 (which is based on a mean nighttime NO2 deposition for foliar surfaces; Delaria et al., 2018) and a value that is a factor of 10 larger (vd cm s−1) in both cases, assuming a surface layer height of 10 m to derive loss rate constants of and s−1, respectively. Clearly, the larger deposition velocity is necessary to roughly align measured and simulated NO2 mixing ratios. Such large NO2 deposition velocities have previously been evoked in order to bring observed NO2 levels and NO emission rates into agreement (Jacob and Wofsy, 1990), and our average, nighttime deposition velocity of 0.15 cm s−1 is comparable to values of 0.1–0.57 cm s−1 determined in boreal coniferous forests (Rondon et al., 1993) at night and 0.096 cm s−1 obtained in a temperate coniferous forest (Breuninger et al., 2013).
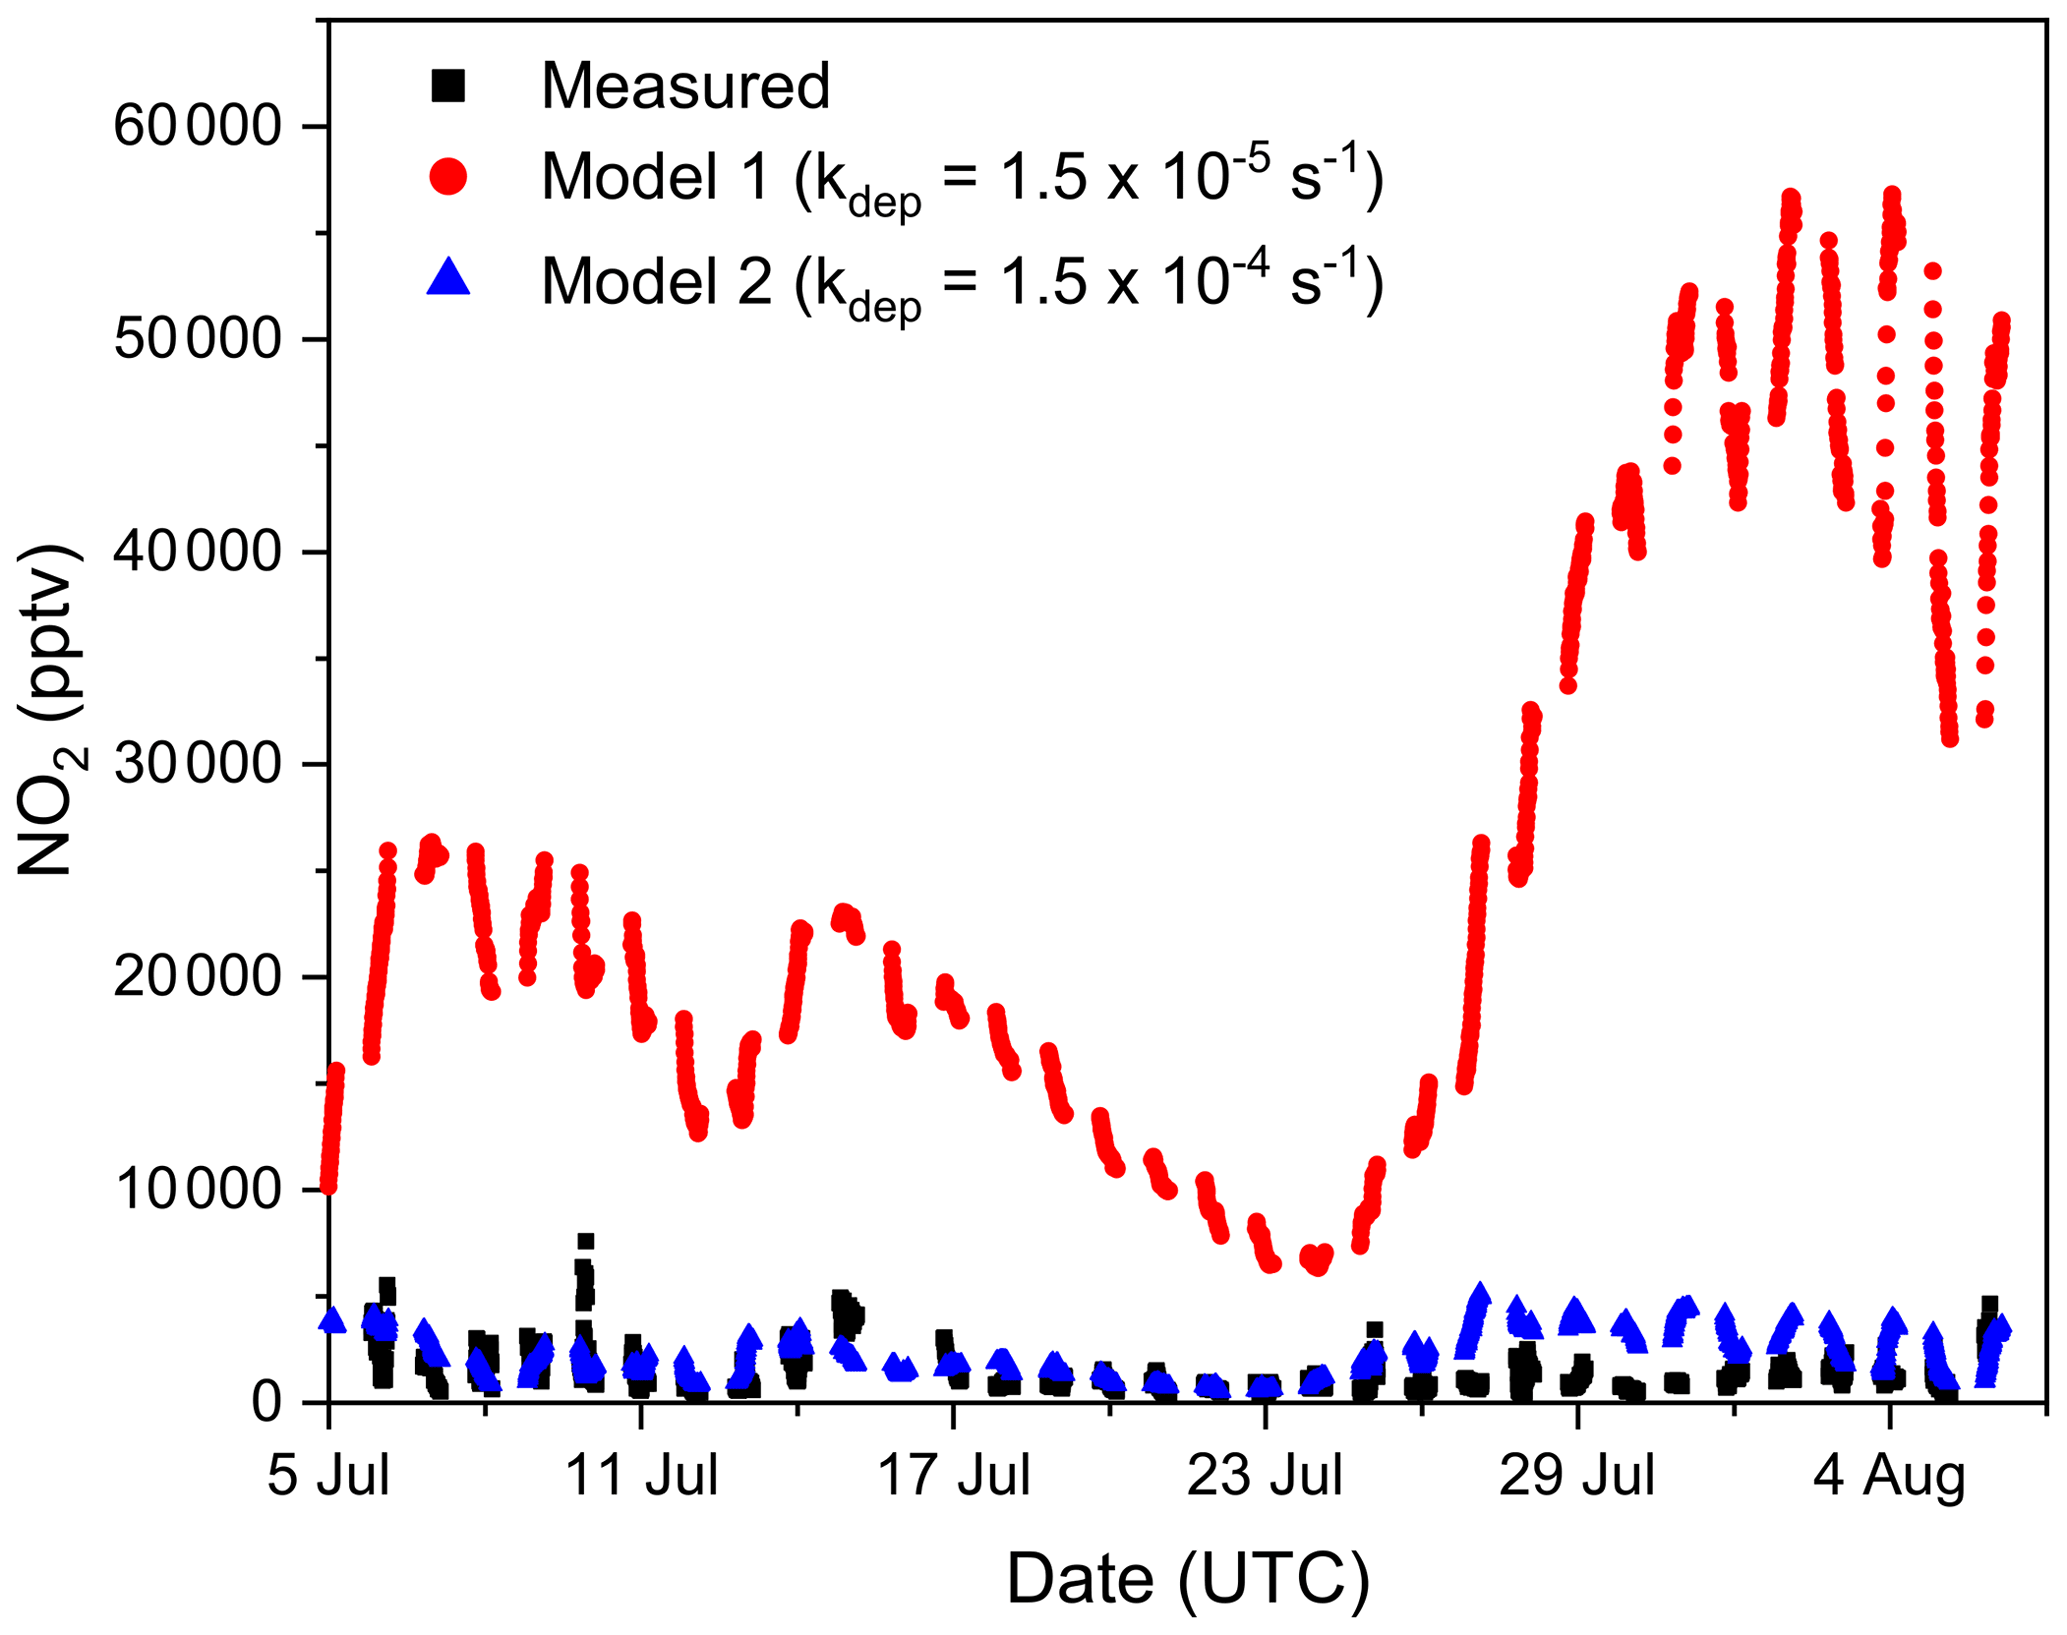
Figure 9Time series of measured nighttime NO2 mixing ratios during TO2021 (black squares) and modelled NO2 mixing ratios using deposition loss constants of s−1 (model 1; red circles) and s−1 (model 2; blue triangles).
The interaction of NO2 with foliar surfaces, which can serve as both a source and sink of NO2, is complex (Breuninger et al., 2013; Delaria et al., 2018), and a scenario in which the high (but variable) nighttime NO mixing ratios result from soil emissions while NO2 is simultaneously deposited on foliar surfaces is conceivable. Given that the stratification of the lowermost atmosphere at TO2021 was only examined on 1 night, and considering the likely variability in NO emission rates and NO2 deposition velocities (Ludwig et al., 2001; Ganzeveld et al., 2002), our interpretation of the nighttime NO and NO2 data remains speculative. Considering the lack of correlation between wind direction and abundance of nighttime NO (Fig. S5b), an alternative point source of NO (e.g. an NO bottle, or exhaust line) seems unlikely. Interferences by other trace gases or reasons for bias of the CLD instrument could not be identified as causes for the high nocturnal levels of NO.
3.5 NO3 mixing ratios
During the TO2021 intensive, ambient NO3 mixing ratios were not monitored. However, as both the total loss term and the production term are known, we can derive NO3 mixing ratios by assuming that NO3 is in the steady state, i.e. that loss and production are balanced and that the derivative of the NO3 mixing ratios is independent of time. Steady-state calculations of NO3 lifetimes or NO3 mixing ratios have been carried out in numerous studies (Platt et al., 1984; Geyer and Platt, 2002; Brown et al., 2011; Crowley et al., 2011; J. Liebmann et al., 2018; J. M. Liebmann et al., 2018) and have shown to be valid when NO3 reactivities are high enough and the chemical equilibrium to N2O5 (Reactions R3 and R4) is not perturbed by sudden changes in NO2 mixing ratios (Brown et al., 2003a; Dewald et al., 2020). Steady-state NO3 mixing ratios can be calculated with Eq. (3), as follows:
which neglects both direct and indirect heterogeneous loss of NO3 (Reactions R8 and R9). Previous estimates of the NO3 loss by aerosol uptake on the Kleiner Feldberg returned values of ≈ 0.001 s−1 or lower (Crowley et al., 2010; Phillips et al., 2016; Sobanski et al., 2016) and are consequently insignificant compared to the average nighttime overall NO3 loss rate of ≈ 0.03 s−1.
Figure 10 displays a time series of the calculated overall NO3 loss constant, production rate, and steady-state mixing ratios for TO2021. Nighttime NO3 losses vary typically between <0.006 and 0.03 s−1, while the daytime losses were as large as 0.3 s−1. The NO3 production rate was, on average, close to ∼0.02 pptv s−1 at nighttime, increasing to 0.1 pptv s−1 during the day when NO2 and/or O3 mixing ratios were large. NO3 mixing ratios thus calculated are lower than about 6 pptv for all nights (with one exception of 12 pptv on the 10 July) and well below 2 pptv for most of the nights.
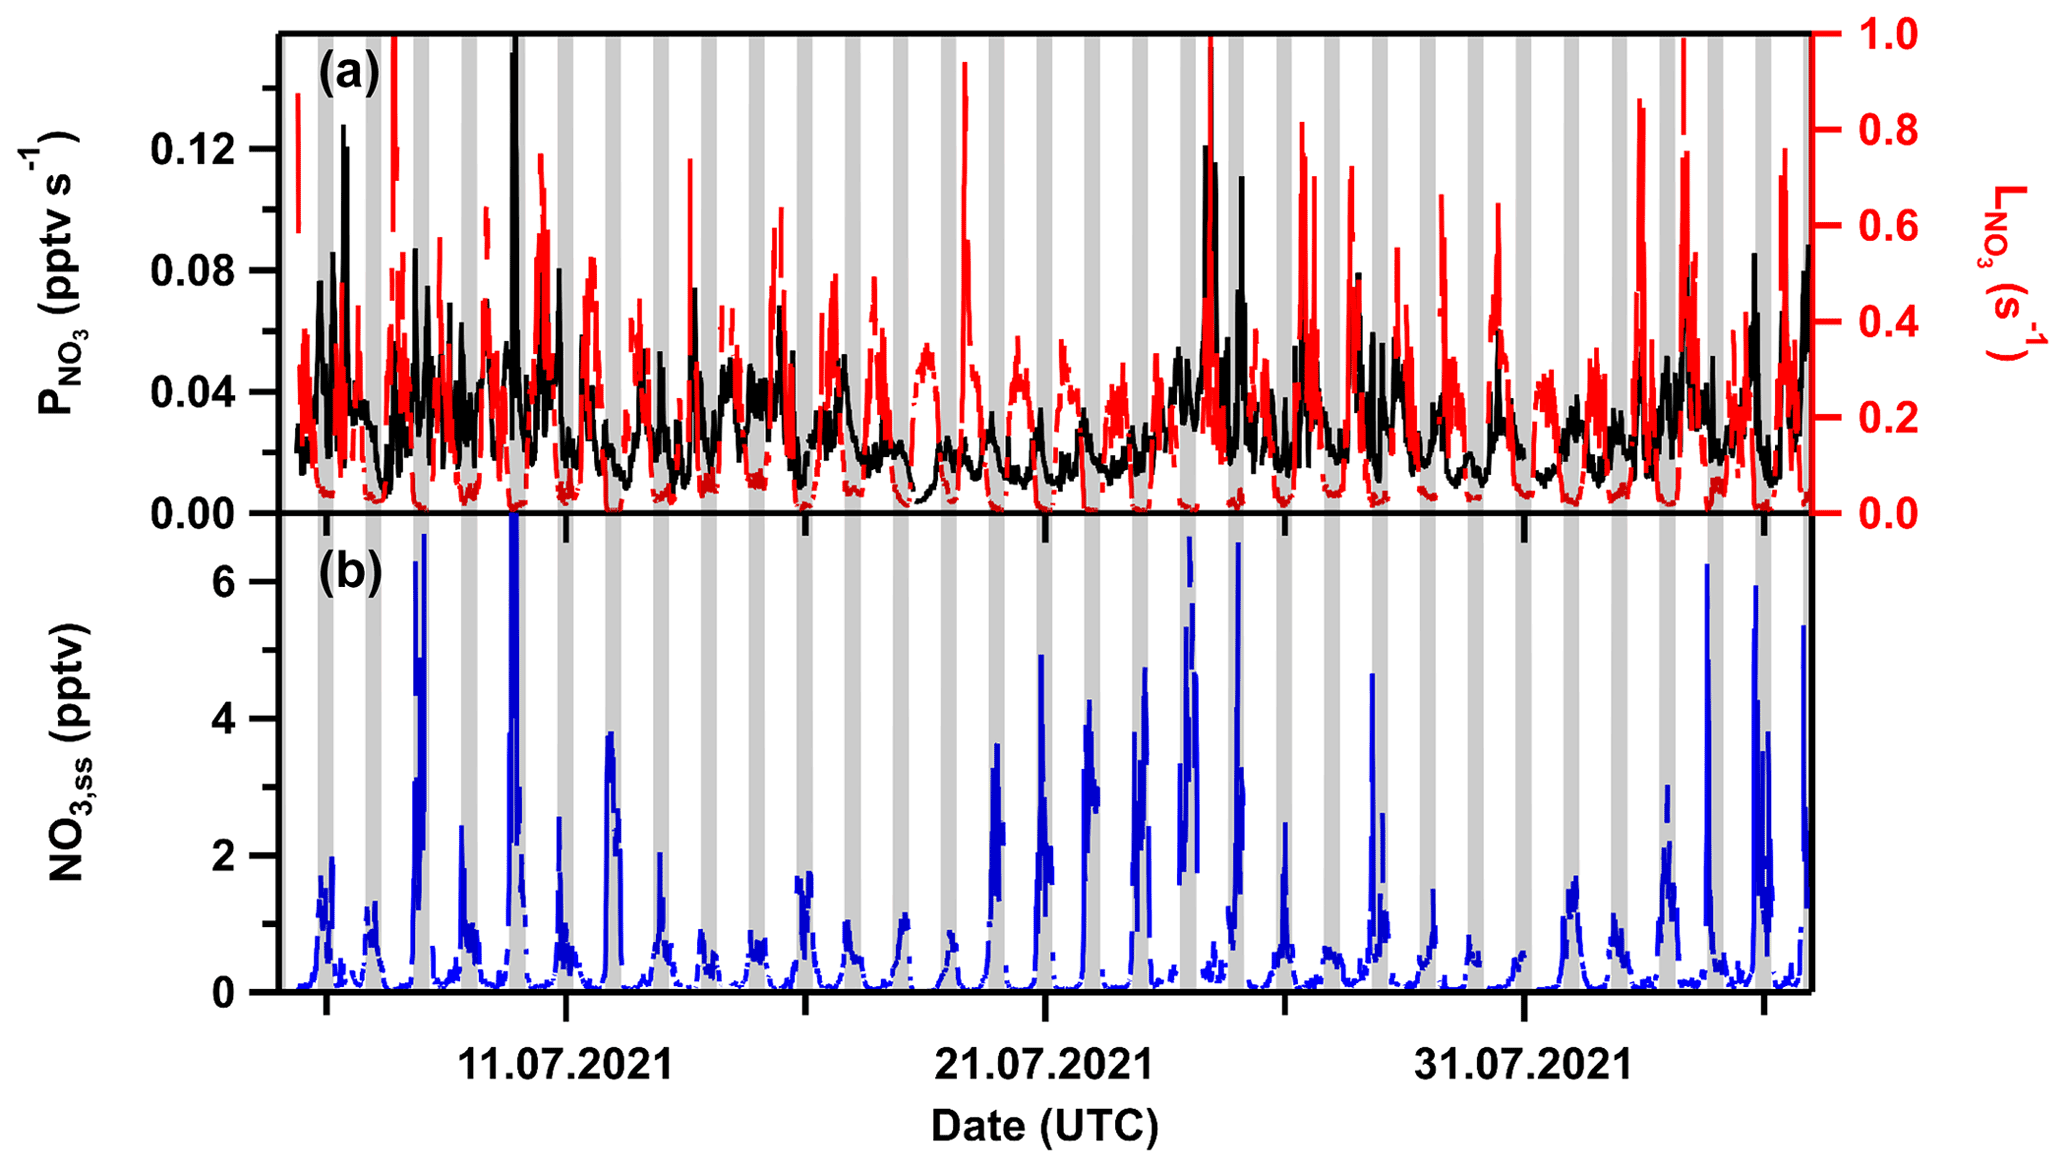
Figure 10(a) NO3 production (left) and loss rates (right) during TO2021. (b) Steady-state NO3 mixing ratios. Ticks represent 00:00 UTC. Grey shaded areas denote nighttime.
3.6 Comparison with previous NO3 measurements at the Kleiner Feldberg
NO3 measurements with which to compare the present data set have been recorded at the Kleiner Feldberg during campaigns in 2008, 2011, 2012, and 2015, for which key details (including names and acronyms) are summarized in Table 1.
Table 1Nighttime NO3 and NO mixing ratios, median NO3 production rates, and median nighttime NO3 loss rates at the top of the Kleiner Feldberg.
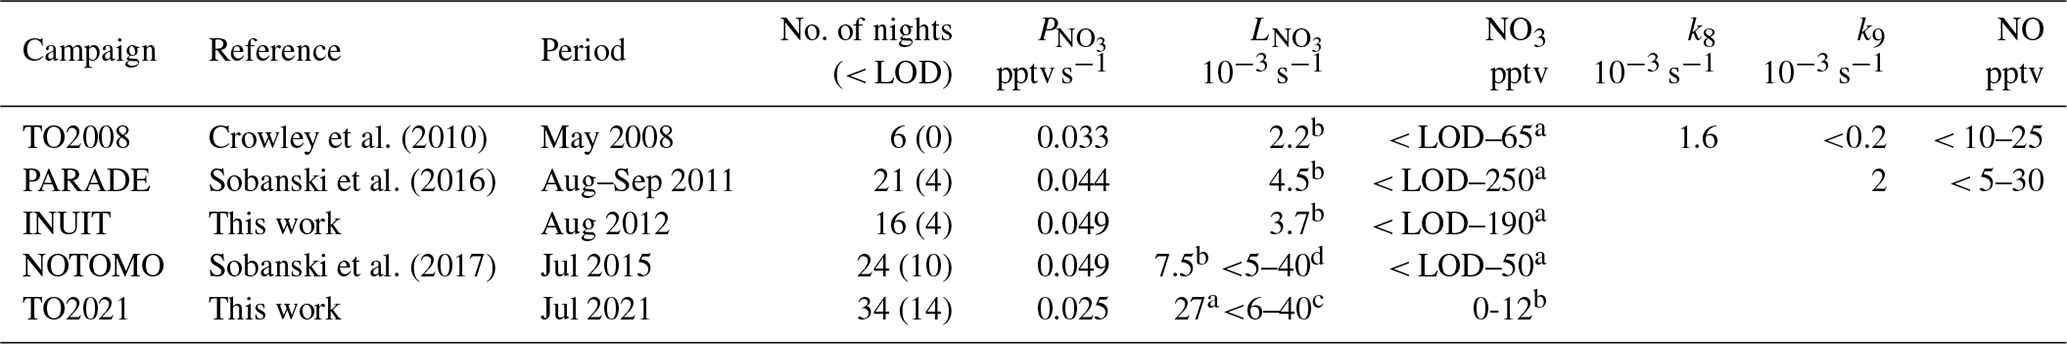
Notes: No. of nights is the number of nights with measurements, and the number in parentheses represents the number of nights where either the NO3 mixing ratio or the directly measured value of was below the LOD. Direct (k8) and indirect (k9) loss rates of NO3 by the heterogeneous uptake of NO3 and N2O5 were calculated only for TO2008 and PARADE. a is directly measured, b is steady-state calculation, c is directly measured with VOC contribution only, d is directly measured for three nights, where no NO measurements were available (Liebmann et al., 2017). TO2008 is a mini (unnamed) campaign with only NO3, NO, O3, and NO2 measurements. PARADE is for PArticles and RAdicals and refers to Diel observations of the impact of urban and biogenic Emissions. INUIT is the Ice NUclei research UnIT. NOTOMO is the NOcturnal chemistry at the Taunus Observatory, which offers insights into Mechanisms and Oxidation.
The first measurements of NO3 (and N2O5) at the Kleiner Feldberg were performed on 6 nights in May 2008 (Crowley et al., 2010; this data set is referred to as TO2008), on 21 nights in July 2011 (PARADE campaign; Sobanski et al., 2016), and on 16 nights in August 2012 (INUIT campaign) and in September 2015 during the NOTOMO campaign (Liebmann et al., 2017; Sobanski et al., 2017). All previous NO3 data sets, except for INUIT, have been published. The time series of the NO3, NO2, O3 mixing ratios (and resulting and according to Eq. 3) from each of the campaigns used for this analysis are reproduced in the Supplement (Figs. S6–S9) together with key features of the instruments used (Table S1).
The presence of nearby industrial centres imparts a strong wind direction dependence on the composition of the air (and especially NOx) at the Kleiner Feldberg, with densely populated cities (and thus anthropogenic sources of NOx) located in the SE and SW sectors. An overview of the prevailing wind directions and NO2 mixing ratios during each campaign are summarized in Fig. 11. The lowest average NO2 mixing ratios were encountered during TO2008 (air arriving mainly from the east) and TO2021, which had a large contribution of air masses arriving from the north and west but almost none from the Frankfurt area (SE-SSE). TO2021 is the only campaign with a significant contribution of air masses arriving from the clean northern sector, and the generally lower NOx levels during TO2021 may also have been a result of changes in vehicle usage in the region as a higher fraction of locally employed people worked from home as a result of the COVID-19 pandemic (Reifenberg et al., 2021).
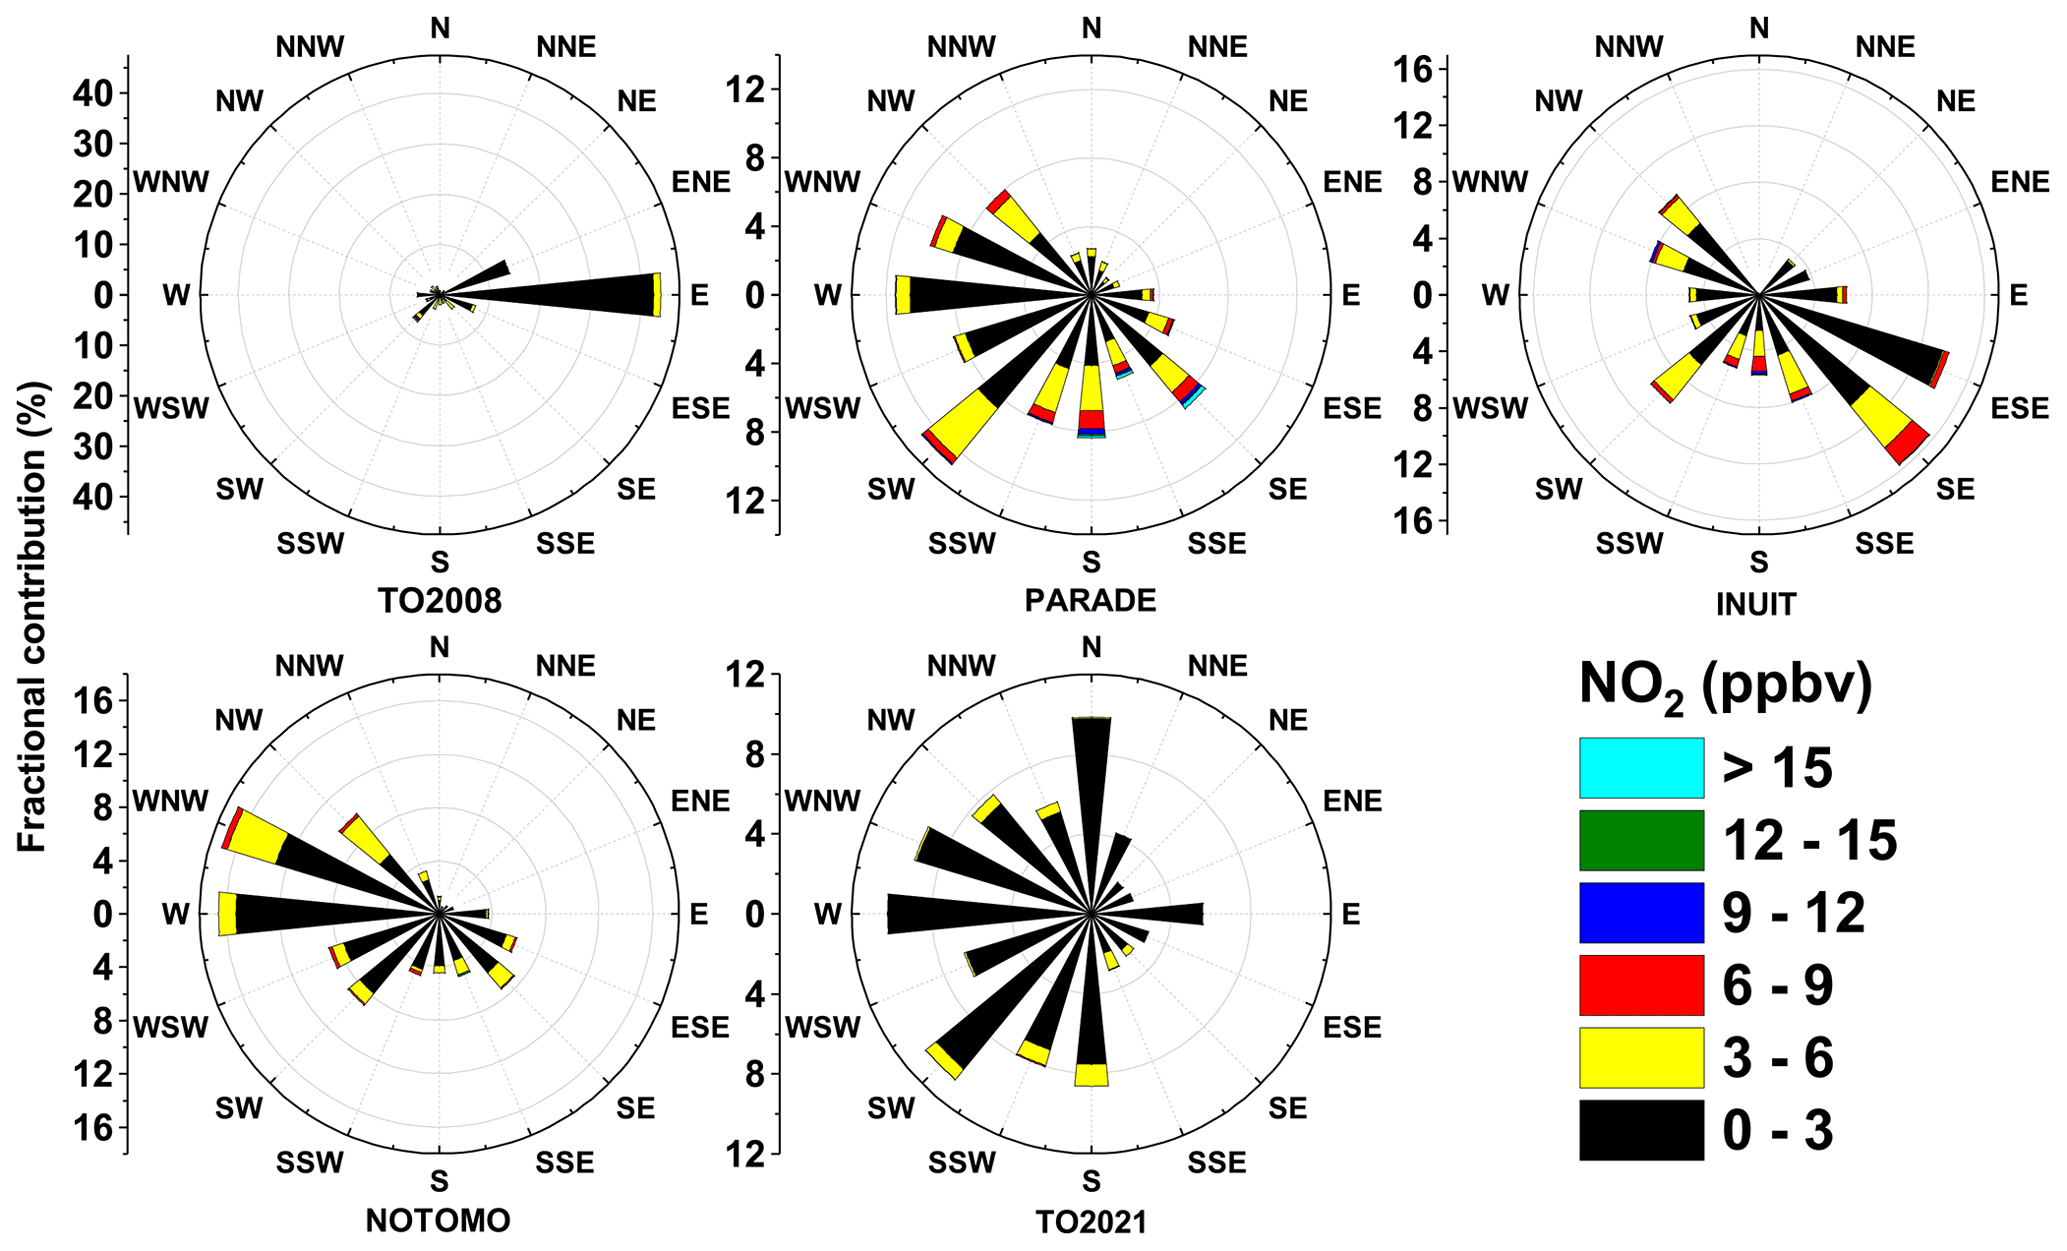
Figure 11Wind roses indicating the dependence of NO2 mixing ratio on the wind direction during TO2008, PARADE, INUIT, NOTOMO, and TO2021. Wind directions were provided by HLNUG for TO2008 and NOTOMO, by a weather station for PARADE and INUIT (Drewnick et al., 2012), and by the German Meteorological Service (DWD) for TO2021.
Figure 12 indicates that, in comparison to the previous summer campaigns (PARADE, INUIT, and NOTOMO) the temperatures were lower during TO2021, with the maximum value of 22 ∘C being ∼10 ∘C lower than the maximum value during NOTOMO. TO2021 and PARADE had the highest incidence of very humid days, with a median RH of >80 % for TO2021 and >75 % for PARADE, while for TO2008 the median relative humidity (∼51 %) was the lowest.
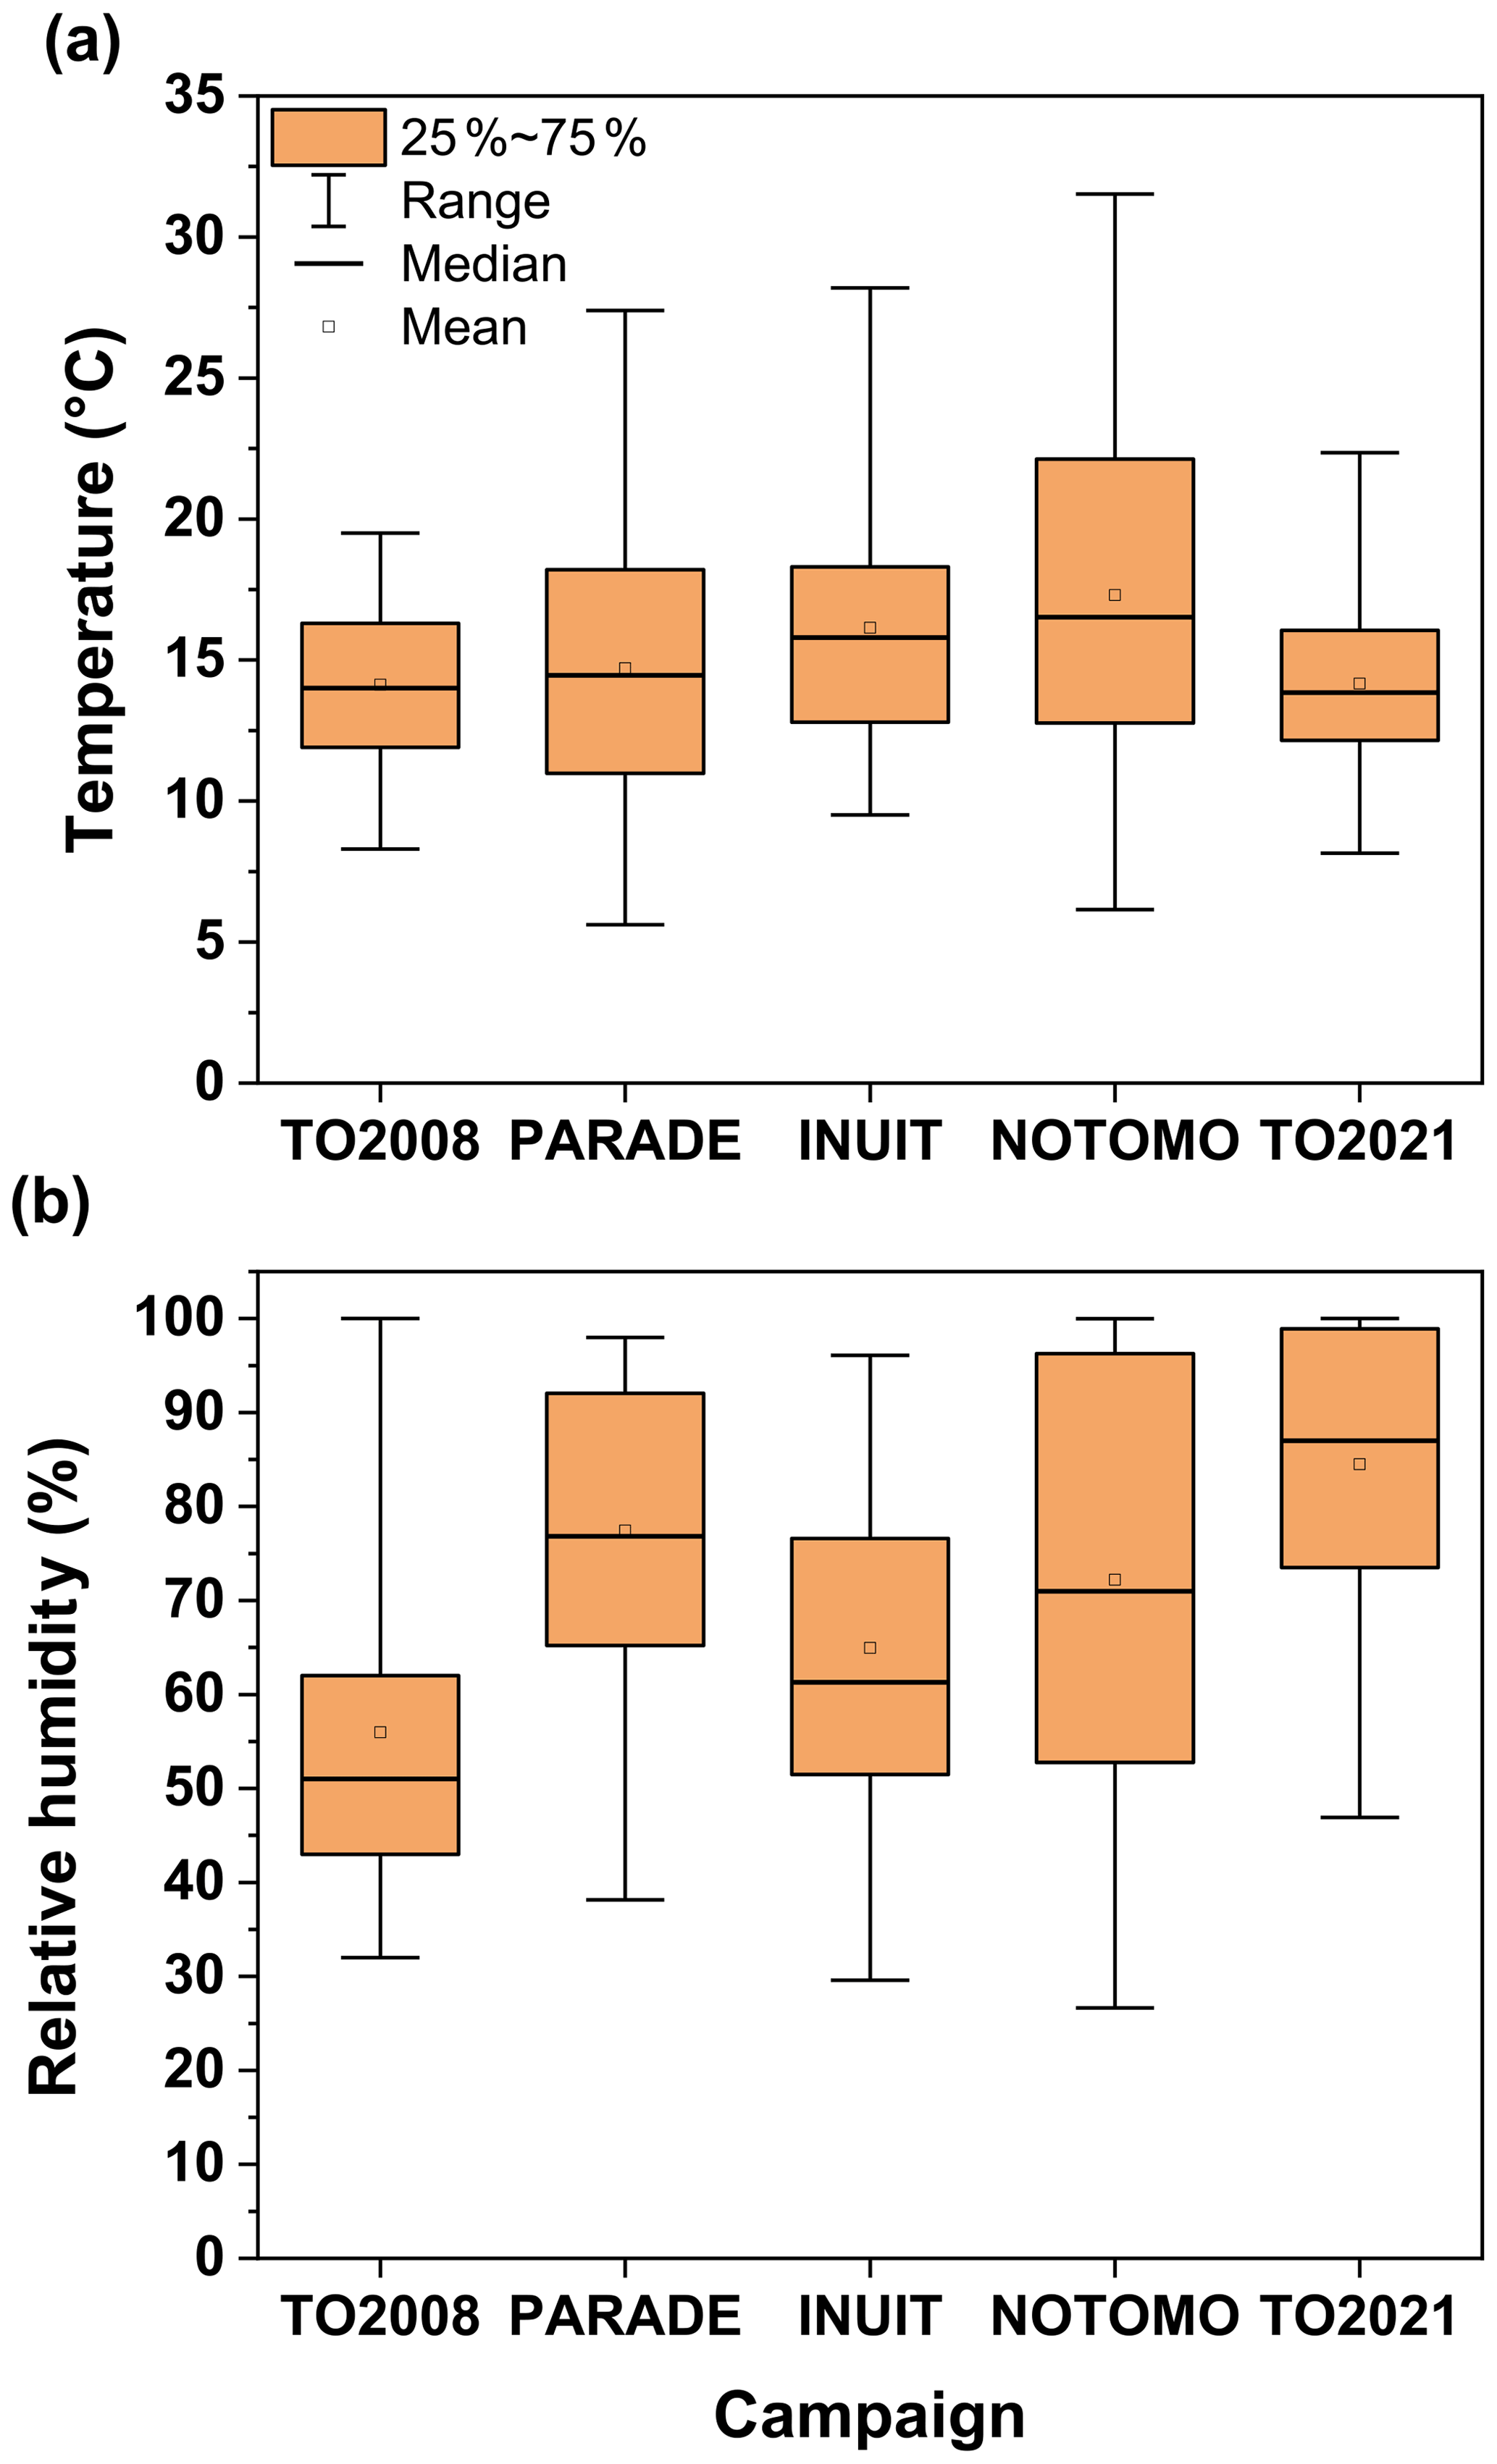
Figure 12Distributions of (a) temperature and (b) relative humidity during five campaigns at the Kleiner Feldberg between 2008 and 2021. Boxes represent the range between the first and third quartiles, and whiskers denote the full range of values.
For comparison of the nighttime NO3 mixing ratios, periods of daytime–nighttime transitions (when NO3 mixing ratios strongly change at sunrise or sunset) were excluded. The NO3 mixing ratios (lower panel), loss rates (middle panel), and production rates (upper panel) for each campaign are depicted in Fig. 13 as a box-and-whisker plot. Note that nights on which the NO3 mixing ratios were >0 but below the instrument's LOD, were taken into account, whereas for the calculation of in the campaigns prior to TO2021, reactivities derived from NO3 mixing ratios below the LOD (i.e. <1.5 pptv) were excluded from the analysis so that is not biased by values associated with high uncertainties.
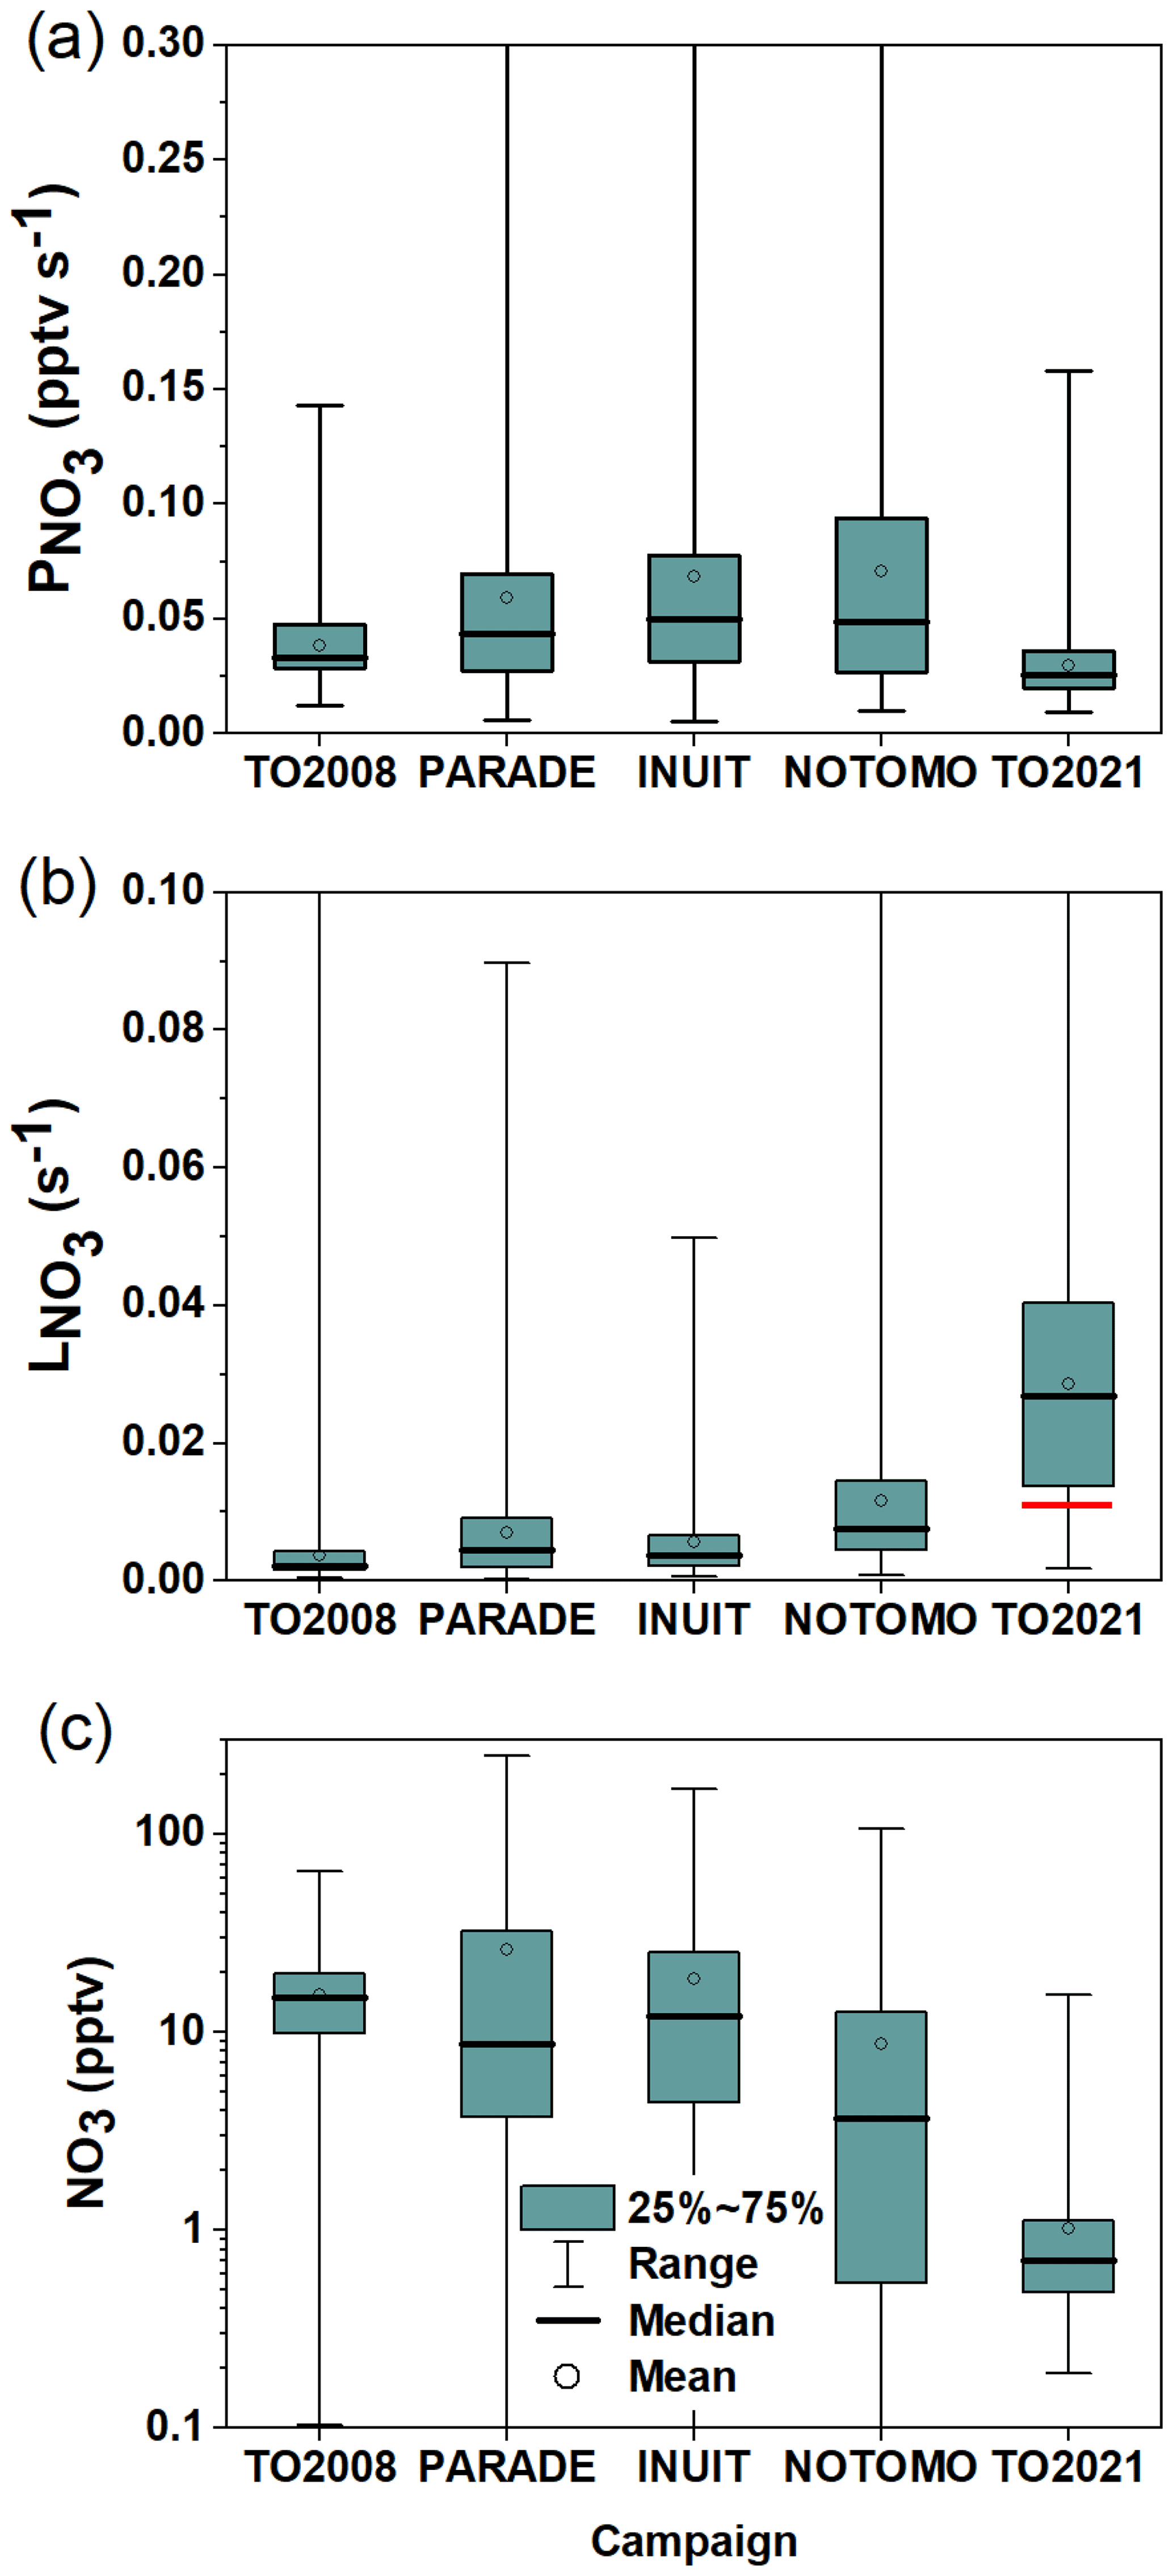
Figure 13NO3 production rates (a), loss rates (b), and mixing ratios (c) measured during five campaigns on the summit of Kleiner Feldberg between 2008 and 2021. Boxes represent the range between the first and third quartiles, and whiskers denote the full range of values. The red line represents the median of directly measured during TO2021 at nighttime.
Figure 13a shows that, during PARADE, INUIT, and NOTOMO, the nighttime NO3 production rates were similar in terms of both median values (∼0.05 pptv s−1) and range. Throughout these three campaigns, high production rates (above 0.3 pptv s−1) were occasionally observed, which for PARADE (Sobanski et al., 2016) were linked to winds originating from urban regions. Figure 13a also reveals that the median nighttime NO3 production rates during PARADE, INUIT, and NOTOMO were higher than during TO2008 and TO2021 (0.033 and 0.025 pptv s−1), which was driven by the lower NO2 mixing ratios in TO2008 and TO2021 for which air from the cleaner easterly and northerly sectors was encountered more frequently. Campaign-averaged diel cycles of O3 in the Supplement (Fig. S10) indicate that O3 during TO2008 and TO2021 was not substantially lower (it was even higher in the case of TO2008) than during PARADE, INUIT, and NOTOMO.
Figure 13b shows clearly that, with a median value of 0.028 s−1, the nighttime NO3 loss rates () during TO2021 were significantly higher than for all other campaigns, which were 0.0075 s−1 for NOTOMO, 0.0045 s−1 for PARADE, 0.0037 s−1 for INUIT, and 0.0022 s−1 for TO2008. A partial explanation for the greater NO3 loss term during TO2021 is found in the nighttime NO mixing ratios, which were significantly larger than those measured in, e.g., TO2008 or PARADE. The effect of removing the contribution of NO reaction to during PARADE (and TO2008) is minimal, as NO was close to or below the LOD (4–10 pptv) on most nights (Crowley et al., 2010; Sobanski et al., 2016), which is confirmed by the corresponding campaign-averaged diel cycles of NO mixing ratios (Fig. S11). In contrast, the subtraction of the contribution to NO3 reactivity of the high nighttime levels of NO observed during TO2021 would reduce to ∼0.011 s−1 (red horizontal line in Fig. 13b), which is more comparable to that observed during, e.g., NOTOMO and PARADE. As shown in Table 1, nighttime NO mixing during TO2008 and PARADE usually did not exceed 30 pptv. Several parameters impact the NO emission rate of soils (Pilegaard, 2013), and since TO2021 was exceptionally wet compared to previous campaigns, a greater soil water content may have favoured high NO emissions in TO2021.
We note that, in general, the comparison of NO3 loss rates derived via the steady-state method and direct reactivity may be complicated by the fact that the steady-state method only works when NO3 is above the detection limit (often a result of low reactivity), whereas the direct measurement of NO3 losses performs best when reactivities are high. However, Σki[VOC]i suggests that was never below 0.002 s−1 on Type 2 nights. As shown in the Supplement, setting values of s−1 to 0.002 s−1 would only occasionally lead to [NO3]ss>10 pptv (Fig. S12a), and thus only have a small impact on the distribution of NO3 mixing ratios (Fig. S12b), so that this bias cannot be fully responsible for the observed difference.
Nonetheless, Fig. 13a and b indicate that TO2021 was exceptional in that was the lowest of all campaigns at the Kleiner Feldberg while was the highest, which results in a calculated median NO3 mixing ratio of just 0.7 pptv. This contrasts greatly with median NO3 mixing ratios of 15, 10, 11, and 4 pptv observed during TO2008, PARADE, INUIT, and NOTOMO (Fig. 13c) on the Kleiner Feldberg.
As alluded to above, this difference is partially caused by unusually high nighttime NO levels but also results from the low NO3 production rate during TO2021. During PARADE, INUIT, and NOTOMO, NO3 mixing ratios above 100 pptv were measured and linked to nights with exceptionally long NO3 lifetimes. For PARADE, this was suggested to be a result of sampling from above the surface layer, where NO3 lifetimes can be large owing to the decoupling from ground-level emissions (Brown et al., 2003b; Sobanski et al., 2016). While there is evidence for a similar situation for TO2021 on 21 July (Fig. 4), in the absence of vertically resolved meteorological data on the other nights, it is not clear whether purely meteorological effects are responsible for the observed low reactivities on 14 nights or whether reduced emission rates of reactive trace gases additionally play a role. We are presently developing a drone-borne NO3 instrument to provide vertical gradients in NO3 (and T and RH) in order to help resolve this issue.
The fate of the NO3 radical at the summit of the Kleiner Feldberg during the TO2021 intensive in July 2021 was assessed with the help of direct NO3 reactivity and VOC measurements. Directly measured NO3 reactivities towards VOCs () were on average ∼0.011 s−1 at night and as large as ∼0.04 s−1 during the day. NO3 reactivities derived from VOC measurements showed an excellent agreement with throughout the diel cycle, with VOC-induced NO3 losses by monoterpenes dominating with a contribution of >80 %. Sesquiterpenes and isoprene contributed 9 % ± 5 % and 7 % ± 4 %, respectively.
During the daytime, NO removed on average 53 % ± 20 % of the NO3, and photolysis and reaction with VOCs contributed ∼31 % ± 19 % and ∼16 % ± 15 %, respectively. The daytime contribution of VOC-induced reactivity was highly variable and ranged from ca. 10 % at noon to 30 % in the afternoon, implying that NO3 can contribute significantly, e.g. to alkyl nitrate formation during daytime.
was mostly below the LOD of 0.006 s−1 on 14 of the 34 nights. On 1 night, for which a vertical temperature and RH gradient were measured, the low NO3 reactivity was associated with reduced vertical mixing and the decoupling of a shallow surface layer from the layer above in which the trace gas inlet was situated.
In the absence of direct measurements, NO3 mixing ratios during TO2021 were calculated from the total loss rate constant (VOCs, photolysis, and NO) and the NO3 production rate to enable comparison with directly measured NO3 mixing ratios during four previous campaigns between 2008 and 2015 at the Kleiner Feldberg. For TO2021, NO3 loss rates were about a factor of 3–5 higher than during previous campaigns, while NO3 production rates were the lowest. Consequently, the calculated steady-state mixing ratios of NO3 are much lower than those directly measured during TO2008, PARADE, INUIT, and NOTOMO. The exceptionally high nighttime NO3 loss rates during TO2021 are partially related to the presence of several tens of pptv of NO, so that VOC-induced losses were 50 %–60 % of the overall loss term. This is in stark contrast to previous observations in forested environments, where reactions with VOCs were the only relevant nighttime loss path of NO3. The observation of NO at levels of 20–80 pptv at nighttime in the presence of 30–40 ppbv of O3 imply large rates of NO2 formation. Constrained box model calculations suggest that rapid losses of NO2 via, e.g., deposition would be necessary in order to reproduce the observed nighttime NO2 mixing ratios. In order to confirm this hypothesis, measurements of NO emission and NO2 deposition rates on the Kleiner Feldberg under similar meteorological conditions are necessary.
Overall, the intercomparison of the NO3 mixing ratios and NO3 reactivity revealed high variability in the data obtained over a long period on the same site and emphasizes that not only chemical effects but also boundary layer dynamics and plant physiological processes may have a great impact on observations.
Data of the TO2021 campaign are available upon request to all scientists agreeing to the data protocol at https://keeper.mpdl.mpg.de/d/f12c1d71d4734a89a6ef/ (Crowley et al., 2022). The data of all other campaigns are available upon request from the corresponding author. The Facsimile code used for the box model can be found in the Supplement (Table S5).
The supplement related to this article is available online at: https://doi.org/10.5194/acp-22-7051-2022-supplement.
PD measured the NO3 reactivity and NO2 mixing ratios during TO2021, analysed the data, and wrote the paper. JNC organized the TO2021 campaign, measured NOx, and helped to revise the paper. CMN and HF provided the NO and NO2 data. AR, AE, and JW provided the VOC data. JNC and CMN provided the O3 data. JS measured actinic fluxes and performed vertical profile measurements of temperature, relative humidity, and pressure with the drone. PD, CMN, JS, AR, AE, HF, JW, JL, and JNC contributed to and commented on the paper.
The contact author has declared that neither they nor their co-authors have any competing interests.
Publisher’s note: Copernicus Publications remains neutral with regard to jurisdictional claims in published maps and institutional affiliations.
We thank Andreas Kürten and Joachim Curtius (Institute for Atmospheric and Environmental Sciences, Goethe University, Frankfurt am Main), for the logistical support and access to the facilities at the Taunus Observatory. We thank the DWD, for the provision of meteorological data, and Chemours, for the FEP sample used to coat the flow tube reactors.
The article processing charges for this open-access publication were covered by the Max Planck Society.
This paper was edited by Steven Brown and reviewed by two anonymous referees.
Allan, B. J., Carslaw, N., Coe, H., Burgess, R. A., and Plane, J. M. C.: Observations of the nitrate radical in the marine boundary layer, J. Atmos. Chem., 33, 129–154, https://doi.org/10.1023/A:1005917203307, 1999.
Allan, B. J., McFiggans, G., Plane, J. M. C., Coe, H., and McFadyen, G. G.: The nitrate radical in the remote marine boundary layer, J. Geophys. Res.-Atmos., 105, 24191–24204, https://doi.org/10.1029/2000JD900314, 2000.
Allan, B. J., Plane, J. M. C., Coe, H., and Shillito, J.: Observations of NO3 concentration profiles in the troposphere, J. Geophys. Res.-Atmos., 107, 4588, https://doi.org/10.1029/2002jd002112, 2002.
Aneja, V. P., Mathur, R., Arya, S. P., Li, Y., Murray, G. C., and Manuszak, T. L.: Coupling the Vertical Distribution of Ozone in the Atmospheric Boundary Layer, Environ. Sci. Technol., 34, 2324–2329, https://doi.org/10.1021/es990997+, 2000.
Bargsten, A., Falge, E., Pritsch, K., Huwe, B., and Meixner, F. X.: Laboratory measurements of nitric oxide release from forest soil with a thick organic layer under different understory types, Biogeosciences, 7, 1425–1441, https://doi.org/10.5194/bg-7-1425-2010, 2010.
Bekö, G., Wargocki, P., Wang, N. J., Li, M. Z., Weschler, C. J., Morrison, G., Langer, S., Ernle, L., Licina, D., Yang, S., Zannoni, N., and Williams, J.: The Indoor Chemical Human Emissions and Reactivity (ICHEAR) project: Overview of experimental methodology and preliminary results, Indoor Air, 30, 1213–1228, https://doi.org/10.1111/ina.12687, 2020.
Boggs, P. T., Donaldson, J. R., Byrd, R. H., and Schnabel, R. B.: ODRPACK – Software for Weighted Orthogonal Distance Regression, ACM Trans. Math. Softw., 15, 348–364, https://doi.org/10.1145/76909.76913, 1989.
Breuninger, C., Meixner, F. X., and Kesselmeier, J.: Field investigations of nitrogen dioxide (NO2) exchange between plants and the atmosphere, Atmos. Chem. Phys., 13, 773–790, https://doi.org/10.5194/acp-13-773-2013, 2013.
Brown, S. S., Stark, H., and Ravishankara, A. R.: Applicability of the steady state approximation to the interpretation of atmospheric observations of NO3 and N2O5, J. Geophys. Res.-Atmos., 108, 4539, https://doi.org/10.1029/2003JD003407, 2003a.
Brown, S. S., Stark, H., Ryerson, T. B., Williams, E. J., Nicks, D. K., Trainer, M., Fehsenfeld, F. C., and Ravishankara, A. R.: Nitrogen oxides in the nocturnal boundary layer: Simultaneous in situ measurements of NO3, N2O5, NO2, NO, and O3, J. Geophys. Res.-Atmos., 108, 4299, https://doi.org/10.1029/2002JD002917, 2003b.
Brown, S. S., Dibb, J. E., Stark, H., Aldener, M., Vozella, M., Whitlow, S., Williams, E. J., Lerner, B. M., Jakoubek, R., Middlebrook, A. M., DeGouw, J. A., Warneke, C., Goldan, P. D., Kuster, W. C., Angevine, W. M., Sueper, D. T., Quinn, P. K., Bates, T. S., Meagher, J. F., Fehsenfeld, F. C., and Ravishankara, A. R.: Nighttime removal of NOx in the summer marine boundary layer, Geophys. Res. Lett., 31, L07108, https://doi.org/10.1029/2004GL019412, 2004.
Brown, S. S., Dube, W. P., Osthoff, H. D., Stutz, J., Ryerson, T. B., Wollny, A. G., Brock, C. A., Warneke, C., De Gouw, J. A., Atlas, E., Neuman, J. A., Holloway, J. S., Lerner, B. M., Williams, E. J., Kuster, W. C., Goldan, P. D., Angevine, W. M., Trainer, M., Fehsenfeld, F. C., and Ravishankara, A. R.: Vertical profiles in NO3 and N2O5 measured from an aircraft: Results from the NOAA P-3 and surface platforms during the New England Air Quality Study 2004, J. Geophys. Res.-Atmos., 112, D22304, https://doi.org/10.1029/2007JD008883, 2007a.
Brown, S. S., Dubé, W. P., Osthoff, H. D., Wolfe, D. E., Angevine, W. M., and Ravishankara, A. R.: High resolution vertical distributions of NO3 and N2O5 through the nocturnal boundary layer, Atmos. Chem. Phys., 7, 139–149, https://doi.org/10.5194/acp-7-139-2007, 2007b.
Brown, S. S., deGouw, J. A., Warneke, C., Ryerson, T. B., Dubé, W. P., Atlas, E., Weber, R. J., Peltier, R. E., Neuman, J. A., Roberts, J. M., Swanson, A., Flocke, F., McKeen, S. A., Brioude, J., Sommariva, R., Trainer, M., Fehsenfeld, F. C., and Ravishankara, A. R.: Nocturnal isoprene oxidation over the Northeast United States in summer and its impact on reactive nitrogen partitioning and secondary organic aerosol, Atmos. Chem. Phys., 9, 3027–3042, https://doi.org/10.5194/acp-9-3027-2009, 2009.
Brown, S. S., Dube, W. P., Peischl, J., Ryerson, T. B., Atlas, E., Warneke, C., de Gouw, J. A., te Lintel Hekkert, S., Brock, C. A., Flocke, F., Trainer, M., Parrish, D. D., Feshenfeld, F. C., and Ravishankara, A. R.: Budgets for nocturnal VOC oxidation by nitrate radicals aloft during the 2006 Texas Air Quality Study, J. Geophys. Res.-Atmos., 116, D24305, https://doi.org/10.1029/2011jd016544, 2011.
Brown, S. S. and Stutz, J.: Nighttime radical observations and chemistry, Chem. Soc. Rev., 41, 6405–6447, https://doi.org/10.1039/C2CS35181A, 2012.
Brown, S. S., Dube, W. P., Tham, Y. J., Zha, Q. Z., Xue, L. K., Poon, S., Wang, Z., Blake, D. R., Tsui, W., Parrish, D. D., and Wang, T.: Nighttime chemistry at a high altitude site above Hong Kong, J. Geophys. Res.-Atmos., 121, 2457–2475, https://doi.org/10.1002/2015jd024566, 2016.
Burkholder, J. B., Sander, S. P., Abbatt, J., Barker, J. R., Huie, R. E., Kolb, C. E., Kurylo, M. J., Orkin, V. L., Wilmouth, D. M., and Wine, P. H.: Chemical Kinetics and Photochemical Data for Use in Atmospheric Studies, Evaluation No. 18, JPL Publication 15–10, Jet Propulsion Laboratory, Pasadena, http://jpldataeval.jpl.nasa.gov (last access: 4 January 2022), 2016.
Carslaw, N., Plane, J. M. C., Coe, H., and Cuevas, E.: Observations of the nitrate radical in the free troposphere at Izana de Tenerife, J. Geophys. Res.-Atmos., 102, 10613–10622, https://doi.org/10.1029/96JD03512, 1997.
Crowley, J. N., Schuster, G., Pouvesle, N., Parchatka, U., Fischer, H., Bonn, B., Bingemer, H., and Lelieveld, J.: Nocturnal nitrogen oxides at a rural mountain-site in south-western Germany, Atmos. Chem. Phys., 10, 2795–2812, https://doi.org/10.5194/acp-10-2795-2010, 2010.
Crowley, J. N., Thieser, J., Tang, M. J., Schuster, G., Bozem, H., Beygi, Z. H., Fischer, H., Diesch, J.-M., Drewnick, F., Borrmann, S., Song, W., Yassaa, N., Williams, J., Pöhler, D., Platt, U., and Lelieveld, J.: Variable lifetimes and loss mechanisms for NO3 and N2O5 during the DOMINO campaign: contrasts between marine, urban and continental air, Atmos. Chem. Phys., 11, 10853–10870, https://doi.org/10.5194/acp-11-10853-2011, 2011.
Crowley, J. N., Dewald, P., Nussbaumer, C. M., Ringsdorf, A., Edtbauer, A., Schuladen, J., Fischer, H., Williams, J., Röder, L., and Hamryszczak, Z.: Data from TO2021 campaign, Keeper [data set], https://keeper.mpdl.mpg.de/d/f12c1d71d4734a89a6ef/, last access: 24 May 2022.
Crutzen, P. J. and Lelieveld, J.: Human impacts on atmospheric chemisty, Annu. Rev. Earth Planet. Sci., 29, 17–45, https://doi.org/10.1146/annurev.earth.29.1.17, 2001.
Curtis, A. R. and Sweetenham, W. P.: Facsimile, Atomic Energy Research Establishment, Report R-12805, Harwell Laboratory, Oxfordshire, UK, ISBN: 0705813177, 1987.
Delaria, E. R., Vieira, M., Cremieux, J., and Cohen, R. C.: Measurements of NO and NO2 exchange between the atmosphere and Quercus agrifolia, Atmos. Chem. Phys., 18, 14161–14173, https://doi.org/10.5194/acp-18-14161-2018, 2018.
Dewald, P., Liebmann, J. M., Friedrich, N., Shenolikar, J., Schuladen, J., Rohrer, F., Reimer, D., Tillmann, R., Novelli, A., Cho, C., Xu, K., Holzinger, R., Bernard, F., Zhou, L., Mellouki, W., Brown, S. S., Fuchs, H., Lelieveld, J., and Crowley, J. N.: Evolution of NO3 reactivity during the oxidation of isoprene, Atmos. Chem. Phys., 20, 10459–10475, https://doi.org/10.5194/acp-20-10459-2020, 2020.
Drewnick, F., Böttger, T., von der Weiden-Reinmüller, S.-L., Zorn, S. R., Klimach, T., Schneider, J., and Borrmann, S.: Design of a mobile aerosol research laboratory and data processing tools for effective stationary and mobile field measurements, Atmos. Meas. Tech., 5, 1443–1457, https://doi.org/10.5194/amt-5-1443-2012, 2012.
Edwards, P. M., Aikin, K. C., Dube, W. P., Fry, J. L., Gilman, J. B., de Gouw, J. A., Graus, M. G., Hanisco, T. F., Holloway, J., Huber, G., Kaiser, J., Keutsch, F. N., Lerner, B. M., Neuman, J. A., Parrish, D. D., Peischl, J., Pollack, I. B., Ravishankara, A. R., Roberts, J. M., Ryerson, T. B., Trainer, M., Veres, P. R., Wolfe, G. M., Warneke, C., and Brown, S. S.: Transition from high- to low-NOx control of night-time oxidation in the southeastern US, Nat. Geosci., 10, 490–495, https://doi.org/10.1038/Ngeo2976, 2017.
Fischer, H., Axinte, R., Bozem, H., Crowley, J. N., Ernest, C., Gilge, S., Hafermann, S., Harder, H., Hens, K., Janssen, R. H. H., Königstedt, R., Kubistin, D., Mallik, C., Martinez, M., Novelli, A., Parchatka, U., Plass-Dülmer, C., Pozzer, A., Regelin, E., Reiffs, A., Schmidt, T., Schuladen, J., and Lelieveld, J.: Diurnal variability, photochemical production and loss processes of hydrogen peroxide in the boundary layer over Europe, Atmos. Chem. Phys., 19, 11953–11968, https://doi.org/10.5194/acp-19-11953-2019, 2019.
Foulds, A., Khan, M. A. H., Bannan, T. J., Percival, C. J., Lowenberg, M. H., and Shallcross, D. E.: Abundance of NO3 Derived Organo-Nitrates and Their Importance in the Atmosphere, Atmosphere, 12, 1381, https://doi.org/10.3390/atmos12111381, 2021.
Friedrich, N., Tadic, I., Schuladen, J., Brooks, J., Darbyshire, E., Drewnick, F., Fischer, H., Lelieveld, J., and Crowley, J. N.: Measurement of NOx and NOy with a thermal dissociation cavity ring-down spectrometer (TD-CRDS): instrument characterisation and first deployment, Atmos. Meas. Tech., 13, 5739–5761, https://doi.org/10.5194/amt-13-5739-2020, 2020.
Friedrich, N., Eger, P., Shenolikar, J., Sobanski, N., Schuladen, J., Dienhart, D., Hottmann, B., Tadic, I., Fischer, H., Martinez, M., Rohloff, R., Tauer, S., Harder, H., Pfannerstill, E. Y., Wang, N., Williams, J., Brooks, J., Drewnick, F., Su, H., Li, G., Cheng, Y., Lelieveld, J., and Crowley, J. N.: Reactive nitrogen around the Arabian Peninsula and in the Mediterranean Sea during the 2017 AQABA ship campaign, Atmos. Chem. Phys., 21, 7473–7498, https://doi.org/10.5194/acp-21-7473-2021, 2021.
Fry, J. L., Kiendler-Scharr, A., Rollins, A. W., Brauers, T., Brown, S. S., Dorn, H.-P., Dubé, W. P., Fuchs, H., Mensah, A., Rohrer, F., Tillmann, R., Wahner, A., Wooldridge, P. J., and Cohen, R. C.: SOA from limonene: role of NO3 in its generation and degradation, Atmos. Chem. Phys., 11, 3879–3894, https://doi.org/10.5194/acp-11-3879-2011, 2011.
Fry, J. L., Draper, D. C., Barsanti, K. C., Smith, J. N., Ortega, J., Winkle, P. M., Lawler, M. J., Brown, S. S., Edwards, P. M., Cohen, R. C., and Lee, L.: Secondary Organic Aerosol Formation and Organic Nitrate Yield from NO3 Oxidation of Biogenic Hydrocarbons, Environ. Sci. Technol., 48, 11944–11953, https://doi.org/10.1021/es502204x, 2014.
Ganzeveld, L. N., Lelieveld, J., Dentener, F. J., Krol, M. C., Bouwman, A. J., and Roelofs, G. J.: Global soil-biogenic NOx emissions and the role of canopy processes, J. Geophys. Res.-Atmos., 107, ACH8-1-CH8-21, https://doi.org/10.1029/2001jd001289, 2002.
Geyer, A. and Platt, U.: Temperature dependence of the NO3 loss frequency: A new indicator for the contribution of NO3 to the oxidation of monoterpenes and NOx removal in the atmosphere, J. Geophys. Res.-Atmos., 107, 4431, https://doi.org/10.1029/2001JD001215, 2002.
Geyer, A., Alicke, B., Konrad, S., Schmitz, T., Stutz, J., and Platt, U.: Chemistry and oxidation capacity of the nitrate radical in the continental boundary layer near Berlin, J. Geophys. Res.-Atmos., 106, 8013–8025, https://doi.org/10.1029/2000JD900681, 2001.
Guenther, A. B., Zimmerman, P. R., Harley, P. C., Monson, R. K., and Fall, R.: Isoprene and Monoterpene Emission Rate Variability – Model Evaluations and Sensitivity Analyses, J. Geophys. Res.-Atmos., 98, 12609–12617, https://doi.org/10.1029/93jd00527, 1993.
Hallquist, M., Wangberg, I., Ljungstrom, E., Barnes, I., and Becker, K. H.: Aerosol and product yields from NO3 radical-initiated oxidation of selected monoterpenes, Environ. Sci. Technol., 33, 553–559, https://doi.org/10.1021/es980292s, 1999.
Handisides, G. M.: The influence of peroxy radicals on ozone production, PhD thesis, Fachbereich Geowissenschaften, Johann Wolfgang Goethe Universität, Frankfurt am Main, http://publikationen.ub.uni-frankfurt.de/frontdoor/index/index/docId/5485 (last access: 24 May 2022), 2001.
Heintz, F., Platt, U., Flentje, H., and Dubois, R.: Long-term observation of nitrate radicals at the tor station, Kap Arkona (Rugen), J. Geophys. Res.-Atmos., 101, 22891–22910, https://doi.org/10.1029/96JD01549, 1996.
IUPAC: Task Group on Atmospheric Chemical Kinetic Data Evaluation, edited by: Ammann, M., Cox, R. A., Crowley, J. N., Herrmann, H., Jenkin, M. E., McNeill, V. F., Mellouki, A., Rossi, M. J., Troe, J., and Wallington, T. J., http://iupac.pole-ether.fr/index.html, last access: 4 January 2022.
Jacob, D. J. and Wofsy, S. C.: Budgets of Reactive Nitrogen, Hydrocarbons, and Ozone over the Amazon-Forest during the Wet Season, J. Geophys. Res.-Atmos., 95, 16737–16754, https://doi.org/10.1029/JD095iD10p16737, 1990.
Jordan, A., Haidacher, S., Hanel, G., Hartungen, E., Mark, L., Seehauser, H., Schottkowsky, R., Sulzer, P., and Mark, T. D.: A high resolution and high sensitivity proton-transfer-reaction time-of-flight mass spectrometer (PTR-TOF-MS), Int. J. Mass spectrom., 286, 122–128, https://doi.org/10.1016/j.ijms.2009.07.005, 2009.
Krechmer, J., Lopez-Hilfiker, F., Koss, A., Hutterli, M., Stoermer, C., Deming, B., Kimmel, J., Warneke, C., Holzinger, R., Jayne, J., Worsnop, D., Fuhrer, K., Gonin, M., and de Gouw, J.: Evaluation of a New Reagent-Ion Source and Focusing Ion-Molecule Reactor for Use in Proton-Transfer-Reaction Mass Spectrometry, Anal. Chem., 90, 12011–12018, https://doi.org/10.1021/acs.analchem.8b02641, 2018.
Lelieveld, J., Butler, T. M., Crowley, J. N., Dillon, T. J., Fischer, H., Ganzeveld, L., Harder, H., Lawrence, M. G., Martinez, M., Taraborrelli, D., and Williams, J.: Atmospheric oxidation capacity sustained by a tropical forest, Nature, 452, 737–740, https://doi.org/10.1038/nature06870, 2008.
Lelieveld, J., Gromov, S., Pozzer, A., and Taraborrelli, D.: Global tropospheric hydroxyl distribution, budget and reactivity, Atmos. Chem. Phys., 16, 12477–12493, https://doi.org/10.5194/acp-16-12477-2016, 2016.
Lelieveld, J., Pozzer, A., Poschl, U., Fnais, M., Haines, A., and Munzel, T.: Loss of life expectancy from air pollution compared to other risk factors: a worldwide perspective, Cardiovasc. Res., 116, 1334–1334, https://doi.org/10.1093/cvr/cvaa073, 2020.
Liebmann, J., Karu, E., Sobanski, N., Schuladen, J., Ehn, M., Schallhart, S., Quéléver, L., Hellen, H., Hakola, H., Hoffmann, T., Williams, J., Fischer, H., Lelieveld, J., and Crowley, J. N.: Direct measurement of NO3 radical reactivity in a boreal forest, Atmos. Chem. Phys., 18, 3799–3815, https://doi.org/10.5194/acp-18-3799-2018, 2018.
Liebmann, J. M., Schuster, G., Schuladen, J. B., Sobanski, N., Lelieveld, J., and Crowley, J. N.: Measurement of ambient NO3 reactivity: design, characterization and first deployment of a new instrument, Atmos. Meas. Tech., 10, 1241–1258, https://doi.org/10.5194/amt-10-1241-2017, 2017.
Liebmann, J. M., Muller, J. B. A., Kubistin, D., Claude, A., Holla, R., Plass-Dülmer, C., Lelieveld, J., and Crowley, J. N.: Direct measurements of NO3 reactivity in and above the boundary layer of a mountaintop site: identification of reactive trace gases and comparison with OH reactivity, Atmos. Chem. Phys., 18, 12045–12059, https://doi.org/10.5194/acp-18-12045-2018, 2018.
Liebmann, J., Sobanski, N., Schuladen, J., Karu, E., Hellén, H., Hakola, H., Zha, Q., Ehn, M., Riva, M., Heikkinen, L., Williams, J., Fischer, H., Lelieveld, J., and Crowley, J. N.: Alkyl nitrates in the boreal forest: formation via the NO3-, OH- and O3-induced oxidation of biogenic volatile organic compounds and ambient lifetimes, Atmos. Chem. Phys., 19, 10391–10403, https://doi.org/10.5194/acp-19-10391-2019, 2019.
Ludwig, J., Meixner, F. X., Vogel, B., and Förstner, J.: Soil-air exchange of nitric oxide: An overview of processes, environmental factors and modeling studies, Biogeochemistry, 52, 225–257, https://doi.org/10.1023/A:1006424330555, 2001.
Martinez, M., Perner, D., Hackenthal, E. M., Kulzer, S., and Schutz, L.: NO3 at Helgoland during the NORDEX campaign in October 1996, J. Geophys. Res.-Atmos., 105, 22685–22695, https://doi.org/10.1029/2000JD900255, 2000.
Ng, N. L., Brown, S. S., Archibald, A. T., Atlas, E., Cohen, R. C., Crowley, J. N., Day, D. A., Donahue, N. M., Fry, J. L., Fuchs, H., Griffin, R. J., Guzman, M. I., Herrmann, H., Hodzic, A., Iinuma, Y., Jimenez, J. L., Kiendler-Scharr, A., Lee, B. H., Luecken, D. J., Mao, J., McLaren, R., Mutzel, A., Osthoff, H. D., Ouyang, B., Picquet-Varrault, B., Platt, U., Pye, H. O. T., Rudich, Y., Schwantes, R. H., Shiraiwa, M., Stutz, J., Thornton, J. A., Tilgner, A., Williams, B. J., and Zaveri, R. A.: Nitrate radicals and biogenic volatile organic compounds: oxidation, mechanisms, and organic aerosol, Atmos. Chem. Phys., 17, 2103–2162, https://doi.org/10.5194/acp-17-2103-2017, 2017.
Nussbaumer, C. M., Parchatka, U., Tadic, I., Bohn, B., Marno, D., Martinez, M., Rohloff, R., Harder, H., Kluge, F., Pfeilsticker, K., Obersteiner, F., Zöger, M., Doerich, R., Crowley, J. N., Lelieveld, J., and Fischer, H.: Modification of a conventional photolytic converter for improving aircraft measurements of NO2 via chemiluminescence, Atmos. Meas. Tech., 14, 6759–6776, https://doi.org/10.5194/amt-14-6759-2021, 2021.
Phillips, G. J., Thieser, J., Tang, M., Sobanski, N., Schuster, G., Fachinger, J., Drewnick, F., Borrmann, S., Bingemer, H., Lelieveld, J., and Crowley, J. N.: Estimating N2O5 uptake coefficients using ambient measurements of NO3, N2O5, ClNO2 and particle-phase nitrate, Atmos. Chem. Phys., 16, 13231–13249, https://doi.org/10.5194/acp-16-13231-2016, 2016.
Pilegaard, K.: Processes regulating nitric oxide emissions from soils, Philos. Trans. R. Soc., B, 368, 1–8, https://doi.org/10.1098/rstb.2013.0126, 2013.
Place, B. K., Delaria, E. R., and Cohen, R. C.: Leaf Stomatal Uptake of Alkyl Nitrates, Environ. Sci. Technol. Lett., 9, 186–190, https://doi.org/10.1021/acs.estlett.1c00793, 2022.
Platt, U. F., Winer, A. M., Biermann, H. W., Atkinson, R., and Pitts, J. N.: Measurement of Nitrate Radical Concentrations in Continental Air, Environ. Sci. Technol., 18, 365–369, https://doi.org/10.1021/es00123a015, 1984.
Pozzer, A., Zimmermann, P., Doering, U. M., van Aardenne, J., Tost, H., Dentener, F., Janssens-Maenhout, G., and Lelieveld, J.: Effects of business-as-usual anthropogenic emissions on air quality, Atmos. Chem. Phys., 12, 6915–6937, https://doi.org/10.5194/acp-12-6915-2012, 2012.
Reifenberg, S. F., Martin, A., Kohl, M., Hamryszczak, Z., Tadic, I., Röder, L., Crowley, D. J., Fischer, H., Kaiser, K., Schneider, J., Dörich, R., Crowley, J. N., Tomsche, L., Marsing, A., Voigt, C., Zahn, A., Pöhlker, C., Holanda, B., Krüger, O. O., Pöschl, U., Pöhlker, M., Jöckel, P., Dorf, M., Schumann, U., Williams, J., Curtius, J., Harder, H., Schlager, H., Lelieveld, J., and Pozzer, A.: Impact of reduced emissions on direct and indirect aerosol radiative forcing during COVID–19 lockdown in Europe, Atmos. Chem. Phys. Discuss. [preprint], https://doi.org/10.5194/acp-2021-1005, in review, 2021.
Rollins, A. W., Browne, E. C., Min, K.-E., Pusede, S. E., Wooldridge, P. J., Gentner, D. R., Goldstein, A. H., Liu, S., Day, D. A., Russell, L. M., and Cohen, R. C.: Evidence for NOx Control over Nighttime SOA Formation, Science, 337, 1210–1212, https://doi.org/10.1126/science.1221520, 2012.
Romer Present, P. S., Zare, A., and Cohen, R. C.: The changing role of organic nitrates in the removal and transport of NOx, Atmos. Chem. Phys., 20, 267–279, https://doi.org/10.5194/acp-20-267-2020, 2020.
Rondon, A., Johansson, C., and Granat, L.: Dry Deposition of Nitrogen-Dioxide and Ozone to Coniferous Forests, J. Geophys. Res.-Atmos., 98, 5159–5172, https://doi.org/10.1029/92jd02335, 1993.
Shepson, P. B., Bottenheim, J. W., Hastie, D. R., and Venkatram, A.: Determination of the relative ozone and PAN deposition velocities at night, Geophys. Res. Lett., 19, 1121–1124, https://doi.org/10.1029/92gl01118, 1992.
Sobanski, N., Tang, M. J., Thieser, J., Schuster, G., Pöhler, D., Fischer, H., Song, W., Sauvage, C., Williams, J., Fachinger, J., Berkes, F., Hoor, P., Platt, U., Lelieveld, J., and Crowley, J. N.: Chemical and meteorological influences on the lifetime of NO3 at a semi-rural mountain site during PARADE, Atmos. Chem. Phys., 16, 4867–4883, https://doi.org/10.5194/acp-16-4867-2016, 2016.
Sobanski, N., Thieser, J., Schuladen, J., Sauvage, C., Song, W., Williams, J., Lelieveld, J., and Crowley, J. N.: Day and night-time formation of organic nitrates at a forested mountain site in south-west Germany, Atmos. Chem. Phys., 17, 4115–4130, https://doi.org/10.5194/acp-17-4115-2017, 2017.
Stull, R. B.: Stable Boundary Layer: An Introduction to Boundary Layer Meteorology, edited by: Stull, R. B., Springer Netherlands, Dordrecht, 499–543, ISBN: 978-94-009-3027-8, 1988.
Stutz, J., Alicke, B., Ackermann, R., Geyer, A., White, A., and Williams, E.: Vertical profiles of NO3, N2O5, O3, and NOx in the nocturnal boundary layer: 1. Observations during the Texas Air Quality Study 2000, J. Geophys. Res.-Atmos., 109, D12306, https://doi.org/10.1029/2003JD004209, 2004.
Stutz, J., Wong, K. W., Lawrence, L., Ziemba, L., Flynn, J. H., Rappenglueck, B., and Lefer, B.: Nocturnal NO3 radical chemistry in Houston, TX, Atmos. Environ., 44, 4099–4106, https://doi.org/10.1016/j.atmosenv.2009.03.004, 2010.
Tadic, I., Crowley, J. N., Dienhart, D., Eger, P., Harder, H., Hottmann, B., Martinez, M., Parchatka, U., Paris, J.-D., Pozzer, A., Rohloff, R., Schuladen, J., Shenolikar, J., Tauer, S., Lelieveld, J., and Fischer, H.: Net ozone production and its relationship to nitrogen oxides and volatile organic compounds in the marine boundary layer around the Arabian Peninsula, Atmos. Chem. Phys., 20, 6769–6787, https://doi.org/10.5194/acp-20-6769-2020, 2020.
Wayne, R. P., Barnes, I., Biggs, P., Burrows, J. P., Canosa-Mas, C. E., Hjorth, J., Le Bras, G., Moortgat, G. K., Perner, D., Poulet, G., Restelli, G., and Sidebottom, H.: The nitrate radical: Physics, chemistry, and the atmosphere, Atmos. Environ., 25, 1–206, https://doi.org/10.1016/0960-1686(91)90192-A, 1991.
Wennberg, P. O., Bates, K. H., Crounse, J. D., Dodson, L. G., McVay, R. C., Mertens, L. A., Nguyen, T. B., Praske, E., Schwantes, R. H., Smarte, M. D., St Clair, J. M., Teng, A. P., Zhang, X., and Seinfeld, J. H.: Gas-Phase Reactions of Isoprene and Its Major Oxidation Products, Chem. Rev., 118, 3337–3390, https://doi.org/10.1021/acs.chemrev.7b00439, 2018.
Wu, R., Vereecken, L., Tsiligiannis, E., Kang, S., Albrecht, S. R., Hantschke, L., Zhao, D., Novelli, A., Fuchs, H., Tillmann, R., Hohaus, T., Carlsson, P. T. M., Shenolikar, J., Bernard, F., Crowley, J. N., Fry, J. L., Brownwood, B., Thornton, J. A., Brown, S. S., Kiendler-Scharr, A., Wahner, A., Hallquist, M., and Mentel, T. F.: Molecular composition and volatility of multi-generation products formed from isoprene oxidation by nitrate radical, Atmos. Chem. Phys., 21, 10799–10824, https://doi.org/10.5194/acp-21-10799-2021, 2021.
York, D.: Least-Squares Fitting of a Straight Line, Can. J. Phys., 44, 1079–1086, https://doi.org/10.1139/p66-090, 1966.