the Creative Commons Attribution 4.0 License.
the Creative Commons Attribution 4.0 License.
 | 01 Jun 2022
Linking Switzerland's PM10 and PM2.5 oxidative potential (OP) with emission sources
Samuël Weber
Jean-Luc Jaffrezo
Christoph Hueglin
Particulate matter (PM) is the air pollutant that causes the greatest deleterious health effects across the world, so PM is routinely monitored within air quality networks, usually in respect to PM mass or number in different size fractions. However, such measurements do not provide information on the biological toxicity of PM. Oxidative potential (OP) is a complementary metric that aims to classify PM in respect to its oxidising ability in the lungs and is being increasingly reported due to its assumed relevance concerning human health. Between June 2018 and May 2019, an intensive filter-based PM sampling campaign was conducted across Switzerland in five locations, which involved the quantification of a large number of PM constituents and the OP for both PM10 and PM2.5. OP was quantified by three assays: ascorbic acid (AA), dithiothreitol (DTT), and dichlorofluorescein (DCFH). OPv (OP by air volume) was found to be variable over time and space: Bern-Bollwerk, an urban-traffic sampling site, had the greatest levels of OPv among the Swiss sites (especially when considering ), with more rural locations such as Payerne experiencing a lower OPv. However, urban-background and suburban sites experienced a significant OPv enhancement, as did the rural Magadino-Cadenazzo site during wintertime because of high levels of wood smoke. The mean OP ranges for the sampling period were 0.4–4.1 , 0.6–3.0 , and 0.3–0.7 nmol H2O2 m−3 for , , and , respectively. A source allocation method using positive matrix factorisation (PMF) models indicated that although all PM10 and PM2.5 sources that were identified contributed to OPv, the anthropogenic road traffic and wood combustion sources had the greatest OPm potency (OP per PM mass) on average. A dimensionality reduction procedure coupled to multiple linear regression modelling consistently identified a handful of metals usually associated with non-exhaust emissions, namely copper, zinc, iron, tin, antimony, manganese, and cadmium, as well as three specific wood-burning-sourced organic tracers – levoglucosan, mannosan, and galactosan (or their metal substitutes: rubidium and potassium), as the most important PM components to explain and predict OPv. The combination of a metal and a wood-burning-specific tracer led to the best-performing linear models to explain OPv. Interestingly, within the non-exhaust and wood combustion emission groups, the exact choice of component was not critical; the models simply required a variable representing the emission source or process to be present. This analysis strongly suggests that anthropogenic and locally emitting road traffic and wood burning sources should be prioritised, targeted, and controlled to gain the most efficacious decrease in OPv and presumably biological harm reductions in Switzerland.
- Article
(4200 KB) - Full-text XML
-
Supplement
(317 KB) - BibTeX
- EndNote


1.1 Background
Particulate matter (PM) is a major atmospheric pollutant that is very diverse in terms of size, composition, solubility, and surface area. PM has deleterious effects on human health, reduces visibility, can negatively affect vegetation, and has significant climate effects (Harrison, 2020). With the resolution of the United Nations Human Rights Council stating that access to a clean, healthy, and sustainable environment is a human right (United Nations Human Rights Council, 2021), further understanding of PM and its negative health effects are required. These factors make PM a priority pollutant for management and control and thus it is widely monitored worldwide (World Health Organization, 2021). However, widespread routine PM monitoring is based primarily on the masses within certain size fractions (and, to a lesser extent, the particle number) and contains no intrinsic information on sources or the potential for biological harm. There is evidence that carbonaceous species and transition metals are more toxic to biological systems than inorganic ions (Fang et al., 2017; Daellenbach et al., 2020; Leni et al., 2020). This gives rise to the motivation to define PM in terms of its biological reactivity and toxicity (Zhang et al., 2021).
The quantification of oxidative potential (OP) has the objective of being a “health-relevant” metric of ambient PM by conducting biological toxicological characterisation (Saffari et al., 2014; Borlaza et al., 2018; Bates et al., 2019). OP aims to complement PM mass and number monitoring data and is measured by quantifying the capacity of inhaled PM to drive oxidative stress in target molecules, generally through the production of reactive oxygen species (ROS) (Delfino et al., 2013; Fang et al., 2016; Yadav and Phuleria, 2020). ROS are free radicals that are formed with molecular oxygen, and such compounds can elicit inflammation responses and apoptosis (cell death) via complex triggers and cascades after inhalation, therefore presenting a mechanism of biological toxicity caused by ambient PM (Bates et al., 2019). PM toxicity may result in inflammation, respiratory and cardiovascular diseases, cancer, and impediments to neural function (Raaschou-Nielsen et al., 2016; Liu et al., 2018a).
A number of toxicological assays have emerged that measure and quantify PM OP, but to date, no standard definition has been decided on by consensus (Weber et al., 2018; Calas et al., 2019; Weber et al., 2021). The ascorbic acid (AA) and dithiothreitol (DTT) assays have emerged as potential standards to evaluate ROS and OP because of their relatively widespread use (Calas et al., 2017; Shirmohammadi et al., 2017; Yadav and Phuleria, 2020). However, due to the lack of standard operating procedures and calibrations, comparisons of OP measurements conducted by different laboratories are not advised, or at least should be done very cautiously (Janssen et al., 2014; Calas et al., 2018; Molina et al., 2020). OP is usually expressed in one of two ways: OP per volume of air (OPv) or OP per PM mass (OPm). OPv is usually used for exposure studies because it is a metric that indicates the amount of OP a given population is exposed to. Contrasting this is OPm, which is a measure of the PM's potency to cause OP per given PM mass unit.
Previous research has indicated that the intrinsic OPm of PM is highly variable and depends heavily on the constituents that make up the PM (Daellenbach et al., 2020). Such conclusions indicate that PM from some emission or generation sources has a greater capacity to drive OPm (OP per µg). Transition metals (for example, iron, copper, and zinc) in particular have been repeatedly identified in correlation analyses as being very potent OPm drivers that are generally sourced from road traffic, specifically non-exhaust emissions from tyre, brake, and road wear (Fang et al., 2016; Liu et al., 2018a; Bates et al., 2019; Taghvaee et al., 2019; Gao et al., 2020). Primary and secondary organic aerosols have also been identified as potent drivers of OPm by some (Samake et al., 2017; Samaké et al., 2020), but because of the vast range of organics that can exist in the atmosphere, specific compounds have yet to be identified as the primary cause. Conversely, inorganic PM sources such as nitrate- and sulfate-rich sources as well as mineral dust have generally been found to have low OPm (Daellenbach et al., 2020; Weber et al., 2021). This gives rise to a situation when investigating PM at a regional scale where the total mass distribution can be rather uniform but OP is spatially highly heterogeneous (Yang et al., 2015; Liu et al., 2018b; Yu et al., 2021). This is because of the large contributions of inorganic compounds to the mass and the importance of very potent but irregularly emitted constituents, such as some metals near transport corridors and organics sourced from wood burning activities in specific communities.
1.2 PM in Switzerland
Switzerland's ambient PM10 and PM2.5 concentrations have progressively decreased since the mid-1990s, when widespread monitoring began (Barmpadimos et al., 2011; Gianini et al., 2012; Grange et al., 2018; Hüglin and Grange, 2021). There is a strong site-type gradient in Switzerland, where rural locations are less polluted with PM when compared to roadside locations. However, wood burning remains popular in some locations, especially south of the Alps, and this can significantly elevate wintertime PM concentrations in these environments (Sandradewi et al., 2008b; Grange et al., 2020). Based on recent intensive measurements, non-exhaust emissions from road vehicles are an emerging issue in Switzerland's urban areas. Brake wear, tyre wear, road wear, and resuspension of road dust have been shown to be important components of Switzerland's urban PM load (Hüglin and Grange, 2021; Grange et al., 2021; Rausch et al., 2022). Such emissions are generated by abrasive processes and although there is a tendency of such PM to be in the coarse mode, these emissions can also significantly enhance fine PM concentrations. This is a result of the non-exhaust emission pathways that generate PM with median diameters of approximately 3 µm and thus straddle the boundary between coarse and fine PM (Harrison et al., 2021). Non-exhaust PM is relevant in respect to OP because such particles are usually metal rich and metals are thought to be very potent constituents for driving OP. Indeed, previous reports of OP in Switzerland demonstrated the importance of metals in the PM mix for enhancing OP (Yue et al., 2018; Daellenbach et al., 2020).
1.3 Objectives
The primary objective of this study is to describe Switzerland's ambient OP using observations from five sampling sites between 2018 and 2019. Additionally, two sub-objectives are identified: (i) to compare Switzerland's OPv values with other locations where observations that can be robustly compared are available and (ii) to use dimensionality reduction techniques – explicitly: positive matrix factorisation (PMF) receptor models, random forest, and multiple linear regression models – to identify the PM emission sources and components that are most likely responsible for elevated OP (OPv and OPm). The implications of Switzerland's OPv patterns and the identification of PM sources and constituents will be discussed with respect to PM and OPv management.
2.1 Sampling sites
Daily PM filter samples were taken at five sampling sites across Switzerland (Table 1; Fig. 1) between June 2018 and May 2019. The five monitoring sites used for the PM sampling are included in Switzerland's national air quality monitoring network, NABEL (Federal Office for the Environment, 2021). These established sites are used for compliance or regulatory monitoring and have long-term time series available for the most common pollutants (Bundesamt für Umwelt, 2021). The sampling sites are located in different environments, ranging from rural to urban-traffic surroundings. One site, Magadino-Cadenazzo, is located south of the Alps, while the other four are located on the Swiss Plateau.
Table 1Basic information for the five monitoring sites in Switzerland that were used for PM oxidative potential measurements.

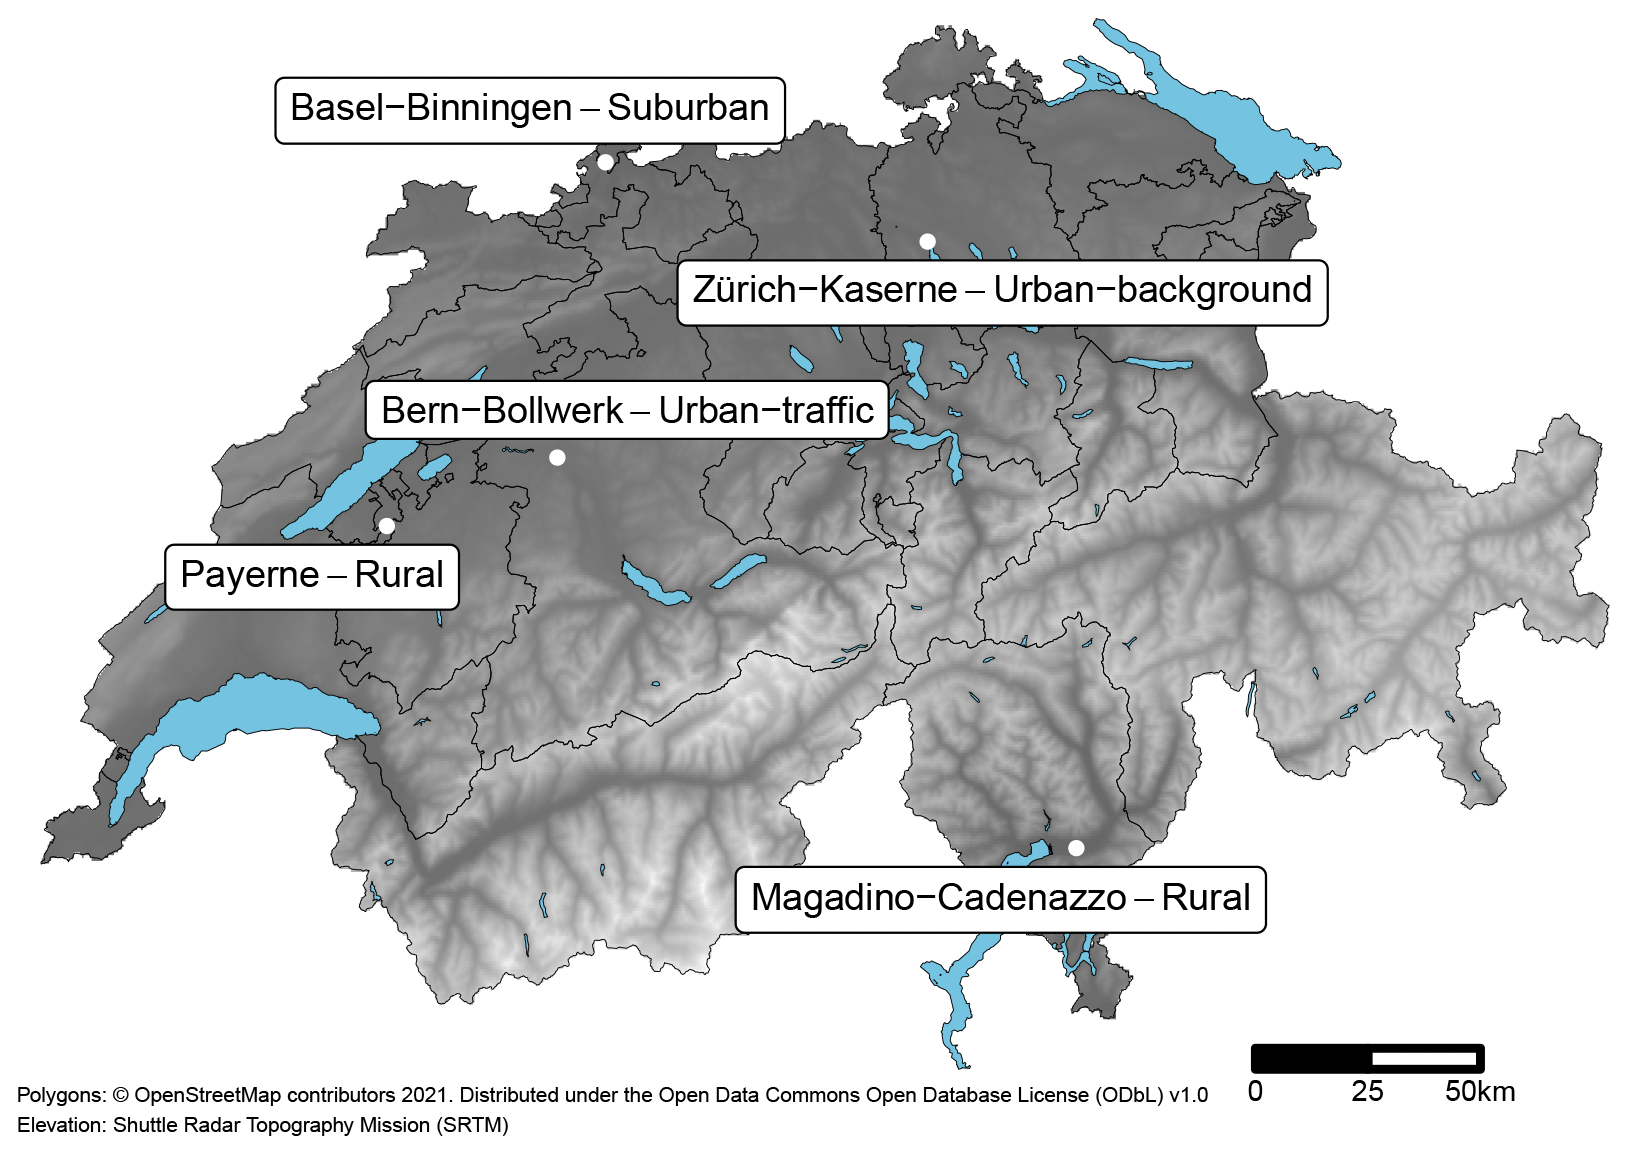
Figure 1The five sampling sites in Switzerland that were used for PM oxidative potential measurements. The shading indicates the elevation of the terrain and the blue areas show larger lakes and reservoirs. The cantonal boundaries are displayed as lines.
2.2 Data
High-volume PM10 and PM2.5 quartz filter (Pallflex Tissuquartz 2500QAT-UP) samples were collected using Digitel DA-80H samplers with flow rates of 30 m3 h−1. Daily sampling ran continuously from midnight to midnight for a 12-month period between 1 June 2018 and 31 May 2019. However, for the quantification of constituents beyond measurements of simple PM mass, punches from every fourth day's filters were taken and analysed. Because the sites form part of the NABEL network, routine flow checks and various tests were regularly conducted in accordance with standard operating procedures.
In total, 908 filters were analysed with three OP assays. Eight hundred and ninety-nine valid samples were reported; the missing samples were due to sampling or laboratory issues. Additional filter punches were used for a collection of other laboratory analyses to quantify other PM constituents such as elemental components (with inductively coupled plasma atomic emission spectrometry (ICP-AES) and inductively coupled plasma mass spectroscopy (ICP-MS)), ions (ion chromatography (IC)), elemental and organic carbon (thermal optical transmission (TOT) via the EN16909 method, using the EUSAAR2 temperature protocol; European Committee for Standardization (CEN), 2017), and a collection of additional organics (a high-performance liquid chromatographic method followed by pulsed amperometric detection (HPLC-PAD)). The details of these additional methods have been reported previously by Hüglin and Grange (2021); Grange et al. (2021), and the latter publication can be considered a companion to this paper. Grange et al. (2021) contains further descriptions of the five sampling sites and a more comprehensive overview of the chemical species that were quantified.
2.3 Oxidative potential assays
OP was analysed with three different assays: ascorbic acid (AA), dithiothreitol (DTT), and dichlorofluorescein (DCFH). These analyses were conducted at the Institute of Environmental Geosciences, University of Grenoble Alpes, Grenoble, France. The three different protocols are described in detail in Kelly and Mudway (2003); Cho et al. (2005); Calas et al. (2018, 2019).
PM samples were extracted using a simulated lung fluid (SLF) solution composed of a mixture of Gamble's solution and DPPC (dipalmitoylphosphatidylcholine). Gamble's solution represents the interstitial fluid deep within the lungs and is a mixture of salts with a pH of 7.4. In order to maintain a constant amount of extracted PM, filter punches were adjusted by area to obtain an iso-mass of 25 µg mL−1 to ensure intercomparison among the samples (Charrier and Anastasio, 2012; Calas et al., 2018). Concentrations of 25 µg mL−1 were used rather than 10 µg mL−1 (as reported by Calas et al. (2018)) to enable the three assays to be conducted in parallel and to compensate for the DCFH assay's lower levels of sensitivity (Daellenbach et al., 2020). No filtration was done in order to include both water-soluble and insoluble particles. Such an extraction method has previously been adopted to facilitate the extraction of PM in conditions closer to lung physiology (Calas et al., 2017).
The consumption of DTT in the assay was inferred as a measure of the ability of the PM to transfer electrons from DTT to oxygen, thereby producing reactive oxygen species (ROS). The PM extracts were reacted with DTT, resulting in the consumption of DTT in the solution. The remaining DTT was then titrated with 5,5-dithiobis-(2-nitrobenzoic acid) (DTNB) to produce a yellow chromophore (5-mercapto-2-nitrobenzoic acid or TNB), which was produced in direct proportion to the amount of reduced DTT remaining in solution after the reaction with the PM extract. The consumption of DTT (nmol min−1) was determined by following the TNB absorbance at 412 nm wavelength at 10 min intervals for a total of 30 min of analysis time.
The AA assay relies on one of the main lung antioxidants, ascorbic acid. The consumption of AA (nmol min−1) in the assay is inferred as the OP of PM quantified by the transfer of electrons from AA to oxygen, or the direct reaction between PM components and AA. Similar to the DTT assay, the PM extracts were reacted with AA in a UV-transparent well plate (CELLSTAR, Greiner-Bio). The absorbance was measured at 265 nm using a plate reader (TECAN spectrophotometer Infinite M200 Pro) at 4 min intervals for a total of 30 min of analysis time.
The 2,7-dichlorofluorescin (DCFH) assay is commonly used for detecting intracellular H2O2 and oxidative stress using a non-fluorescent probe through the formation of a fluorescent product (dichlorofluorescein or DCF) in the presence of ROS and horseradish peroxidase (HRP). DCF was measured by fluorescence at excitation and emission wavelengths of 485 and 530 nm, respectively, every 2 min for a total of 30 min of analysis time. The ROS concentration in the sample is calculated in terms of the H2O2 equivalent based on a H2O2 calibration (100, 200, 300, 400, 500, 1000, and 2000 nmol).
For all assays, the mixtures were injected into a 96-well plates and the absorbance was read from the microplate reader (TECAN spectrophotometer Infinite M200 Pro). The well plates were shaken for 3 s before each measurement and kept at 37 ∘C. Three laboratory blanks (in Gamble's solution + DPPC) and three positive controls (1,4-naphthoquinone at 24.7 µmol L−1) were included in each plate. The average values of these blanks were subtracted from the sample measurements of the given plate. Detection limits (DL) were defined as three times the standard deviation of laboratory blank measurements. Uncertainties were estimated thanks to triplicate measurement of the same well.
The three assays have the same objective: to determine the amount of oxidative stress an analyte can elicit, but the three assays also have differing sensitivities to various components that form the PM mix and the specific antioxidants within the lung. The three assays have these general characteristics: AA is primarily sensitive to transition metals (Janssen et al., 2014); DTT is the most reported OP assay and is sensitive to organics and, to a lesser extent, metals (Janssen et al., 2014; Calas et al., 2019); and DCFH shows preferential sensitivity to a number of compounds that are often associated with secondary aerosols (Perrone et al., 2016; Pietrogrande et al., 2019). Therefore, the three assays give different perspectives on similar biological processes.
Units used
OP can be represented in two forms: OP per PM mass (OPm) or OP per volume of air (OPv). OP per volume of air is a superior unit when representing population exposure and therefore this unit is mostly used in this analysis. Three OP assays are reported and a superscript notation is used to differentiate these assays, i.e. , , and . For and , the unit used is , while for , the unit is nmol H2O2 m−3.
2.4 Source apportionment
Source apportionment for PM10 and PM2.5 for the five monitoring sites was conducted with the positive matrix factorisation (PMF) receptor model and the multilinear engine (ME-2) algorithm (Paatero and Tapper, 1994; Paatero, 1999). The PMF approach employed is informally known as “extended PMF” and was a result of the SOURCES research programme that involved the development of harmonised PMF methodology across several sites in France (Favez et al., 2017; Weber et al., 2019, 2021). The EPA PMF 5.0 software tool was used to apply PMF (Norris et al., 2014). Eight distinct factors/sources were identified for PM10, while five sources were identified for PM2.5. The PM10 sources were labelled as sulfate rich, nitrate rich, road traffic, wood combustion, primary biogenic, secondary biogenic, mineral dust, and aged sea salt. For PM2.5, the primary biogenic, mineral dust, and aged sea salt sources were not identified. Details on the specific settings, constraints, and process of the extended PMF modelling can be found in the accompanying Grange et al. (2021) publication. The PMF input and output data are also available in a persistent data repository for convenience (Grange, 2021a).
The PMF analysis for this particular dataset was challenging because of the existence of fewer than the recommended number of available samples (91 compared to the recommended at least 100; Norris et al., 2014), low signal-to-noise ratios for many variables because of low ambient concentrations, and the inclusion of extra organic species in the PMF models. Despite the many validation steps conducted, the models had a number of limitations, which are discussed fully in the companion paper Grange et al. (2021) and were considered in the current work.
2.5 Linking PM sources to OP
The OP measurements were not included in the PMF modelling process, but these observations required linking to the PMF-identified sources. To estimate the source contributions to the three OP assays, weighted robust multiple linear regression (MLR) with an iterative M-estimator was used. Conceptually, the OP observations were explained by the PMF-identified sources, and because linear regression models return coefficients in the dependent variable's response scale, the estimates of the PMF-identified sources for OP are readily interpreted by investigating the models' slope coefficients (β). The equation expressing this process can be found elsewhere (Weber et al., 2021, Eq. 4). To allow evaluation of the uncertainty in the models' coefficients, the data were bootstrapped 500 times and modelled. Additionally, the OP's analytical uncertainties were included in the models as weights. The MASS R package was used as the interface to the robust linear regression function (Venables and Ripley, 2002). An example of how this process was conducted can be found in a public repository (Grange, 2021c).
2.6 OP modelling
The filter-based measurement campaign resulted in the quantification of a large number of elements, ions, and organics that constitute Switzerland's PM. To extract the constituents that were the most important for OP, a multiple-step process was conducted to firstly identify the most important constituents that explain the OP and secondly to determine the combination of these constituents that results in the best statistical models for explaining the OP values in Switzerland.
The identification of the most important PM constituents to explain OP was conducted with random forest, an ensemble decision-tree machine-learning algorithm (Breiman, 2001; Wright and Ziegler, 2017). The entire set of variables available was used to model OP. The importances of the random forests for the included variables were extracted and analysed to reduce the feature space (Abdulhammed et al., 2019; Reddy et al., 2020). Variable importance is a metric that represents the improvement of information gain at each split in the decision tree for a particular independent variable. Therefore, variable importance aids the determination of a subset of useful variables. The permutation variable importance approach was the specific algorithm used; this approach evaluates the prediction accuracy with the sampled (out of bag, OOB) observations and permutes each variable's values to determine the effect on prediction performance (Wright et al., 2016).
The variables that were consistently identified by random forest as the top 12 most important for explaining and were used in further linear modelling work. This dimensionality reduction pre-processing step allowed the dataset to be reduced from over 50 variables to the most important ≈15 for two OP assays. The top 12 variables differed slightly between different sites, PM size fractions, and OP assays, hence the identified variables were not identical across all groups.
The most important variables identified by random forest were used to model OP with robust multiple linear regression (Venables and Ripley, 2002). Individual models using all combinations of the ≈15 variables with a maximum of five predictors were created to explain OPv. The intercept term was excluded from the model formulation and over 100 000 models were calculated. An example of how this was achieved is accessible via a public repository (Grange, 2021b). To identify models that were suitable for further use, three filters were applied to the models. Models with a maximum pairwise variance inflation factor (VIF) for independent variables of greater than 2.5 were removed because this suggests multicollinearity among the independent variables (Jackson et al., 2009). Models which contained negative term estimates were also dropped, as were models with R2 values less than 75 %. These filters resulted in the retention of 371 models for further analysis, and the majority (77 %) of those models had two independent variables.
3.1 Spatial-temporal variation of OP
OP measurements between June 2018 and May 2019 at five sampling locations throughout Switzerland demonstrated that OPv was variable in both time and space. Mean OPv almost always increased as the sampling location became increasingly urban: Bern-Bollwerk, an urban-traffic site, had the highest levels of OPv during the sampling period, while Payerne, a rural location, had the lowest mean OPv (Fig. 2; Table 2). For , the PM10 means ranged from 0.7 to 4.1 , and for PM2.5, the corresponding range was 0.4 to 1.6 . means ranged from 0.8 to 3.0 and from 0.6 to 1.1 for PM10 and PM2.5, respectively. did not show the same progressive increase across the rural to urban roadside gradient, with another rural site, Magadino-Cadenazzo, having the highest means (0.7 nmol H2O2 m−3 for both PM10 and PM2.5), while the other four sites were inconsistently ranked for the different PM size fractions and considering the different types of averages (Table 2). The rural–urban-roadside gradient observed for and was also demonstrated by PM mass and most other individual constituents (secondary components such as nitrate, sulfate, and ammonium were exceptions) that form the Swiss PM mix, as was reported previously in a companion paper (Grange et al., 2021).
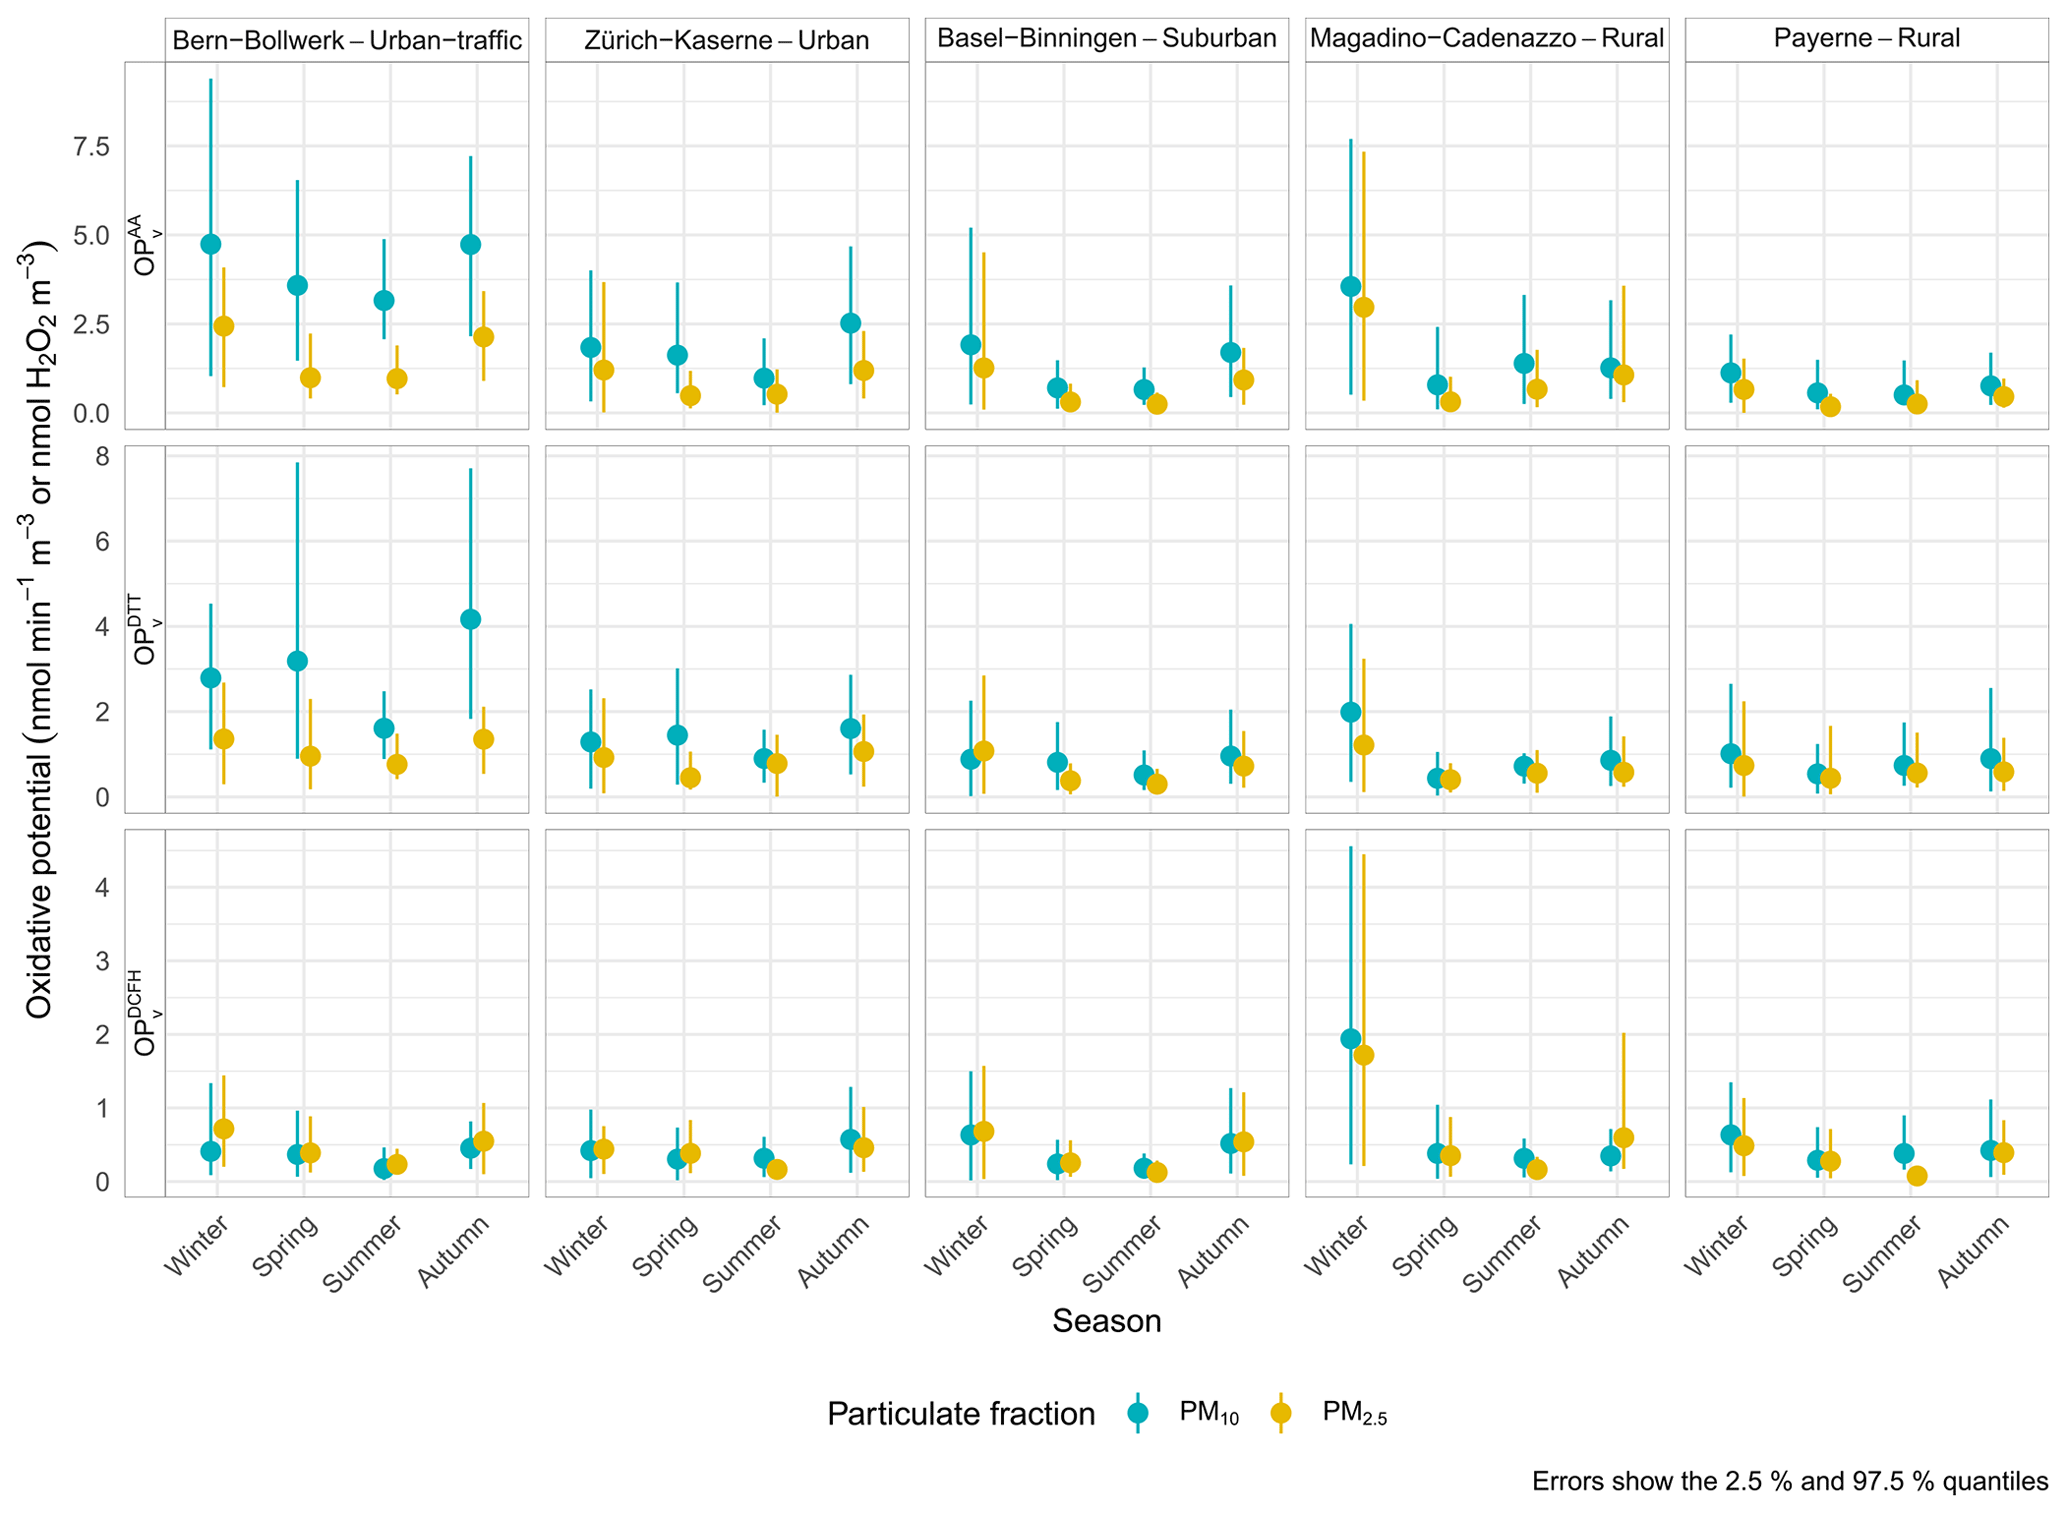
Figure 2Seasonal means of three OPv assays, two PM size fractions, and five sampling sites in Switzerland between June 2018 and May 2019.
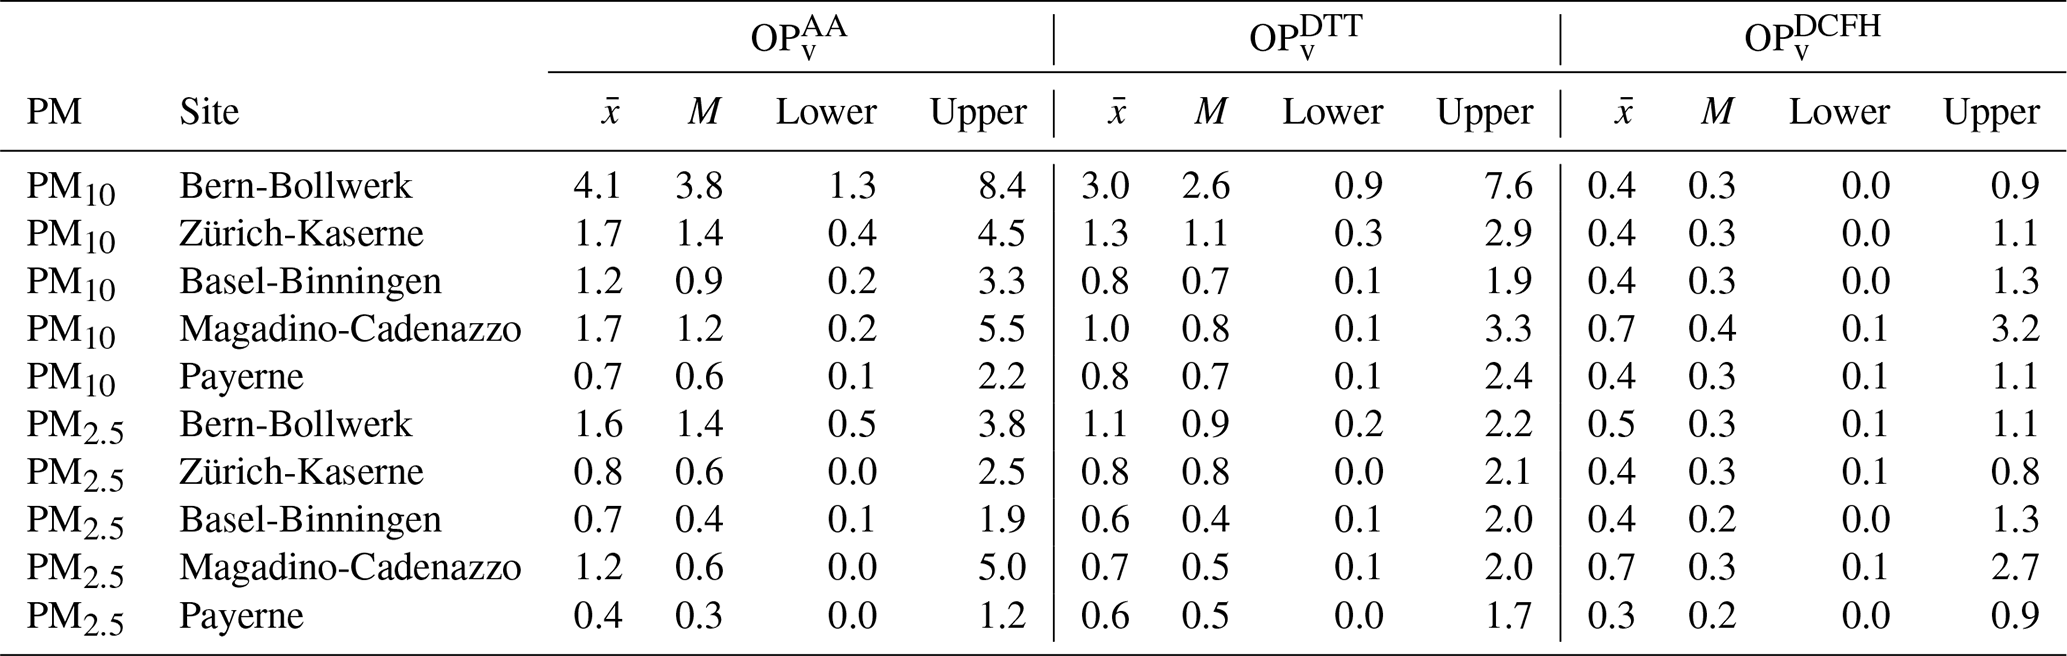
Table 2Simple summary statistics for three OPv assays, two PM size fractions, and five sampling sites in Switzerland between June 2018 and May 2019. and M represent the mean and median, respectively, while “lower” and “upper” refer to the 2.5 % and 97.5 % quantiles (which contain 95 % of the observations). The summaries have been rounded to one decimal place and the units are for and and nmol H2O2 m−3 for .
Winter and autumn had the highest average OP, which is consistent with the common winter situation where primary atmospheric pollutant emissions are higher and the atmospheric state is less conducive to pollutant transportation and dispersion (Beyrich, 1997; Emeis and Schäfer, 2006). The wintertime OP enhancement was especially clear at Magadino-Cadenazzo, a site known to be heavily burdened by wood smoke during the winter months (Grange et al., 2020). Notably, at Magadino-Cadenazzo, wintertime PM2.5 OPv was enhanced to nearly the same extent as PM10 because wood-burning-sourced PM is almost completely contained in the fine-mode (Kleeman et al., 1999). Bern-Bollwerk was clearly the most polluted site with respect to OPv, with the two AA and DTT assays remaining elevated in all seasons, but mean was significantly lower during the summer than in the other seasons. Another key observation from these aggregations was that PMcoarse, defined as the mass concentration of PM with a size between 2.5 and 10 µm, contained 50 % and 45 % of the and signals, respectively. This was only able to be highlighted because the sampling design included both PM10 and PM2.5. This point implies that PMcoarse is potentially relevant for human health and for regulatory purposes. Therefore, it is important to continue PM10 monitoring in addition to the measurement of PM2.5.
Figure 2 and Table 2 show large differences among the three assays used to quantify OPv in this work. The DCFH assay based on a fluorescence method showed much lower levels of spatial and seasonal variation when compared to the other two, more established, assays: the AA and DTT assays, where the means ranged between 0.3 and 0.7 (Fig. A1). The DCFH assay has a lower level of sensitivity when compared to the AA and DTT assays; nevertheless, the sensitivity of DCFH to organic-rich PM was observed at the southern Magadino-Cadenazzo sampling location, where OPv enhancement was clear during the winter because of high concentrations of wood burning emissions. The AA assay is primarily sensitive to metals (Janssen et al., 2014), and the Bern-Bollwerk site, which is known to experience significant non-exhaust emissions from road traffic, observed high levels of during the sampling period, and the mean was 4.1 . Less severe enhancements were also observed for the urban and suburban Zürich-Kaserne and Basel-Binningen sites, with the AA assay suggesting some metal contamination of these atmospheres too. These observations are consistent with work exploring the urban and roadside increments in Switzerland, and the importance of non-exhaust emissions to these increments (Grange et al., 2021).
OP comparison with other locations
The comparison of OP metrics among different locations and sampling durations is problematic due to the lack of standardised OP laboratory procedures (Calas et al., 2019). Here, however, comparisons can be made with many French sites, where OPv has been quantified by the same laboratory with identical analytical approaches. The OPv of PM2.5 has been only rarely reported in Europe, and therefore only the OPv of PM10 will be discussed here. Additionally, comparisons of the DCFH assay were unable to be conducted due to a lack of available data for the French sites.
Based on Weber et al. (2021), which consolidated annual OPv data for 14 sampling sites across France between 2013 and 2018, Bern-Bollwerk's atmosphere had high levels of OPv – especially when considering (Table A1). Bern-Bollwerk's PM10 mean of 4.1 was substantially higher than those at all other French sampling locations, with the second most polluted location being in Chamonix (site code CHAM), a town in an alpine valley that is topographically confined and where the annual mean was reported to be 2.6 (between November 2013 and October 2014). The four other Swiss sites were within the same range of reported values for the French locations; however, both Zürich-Kaserne and Magadino-Cadenazzo were ranked in the upper half of the mean values when comparing the 19 sites (14 in France and 5 in Switzerland). A map of seasonal and annual and OPDTT means for the closest French sites to Switzerland and the five Swiss sites included in this analysis is shown in Fig. 3.
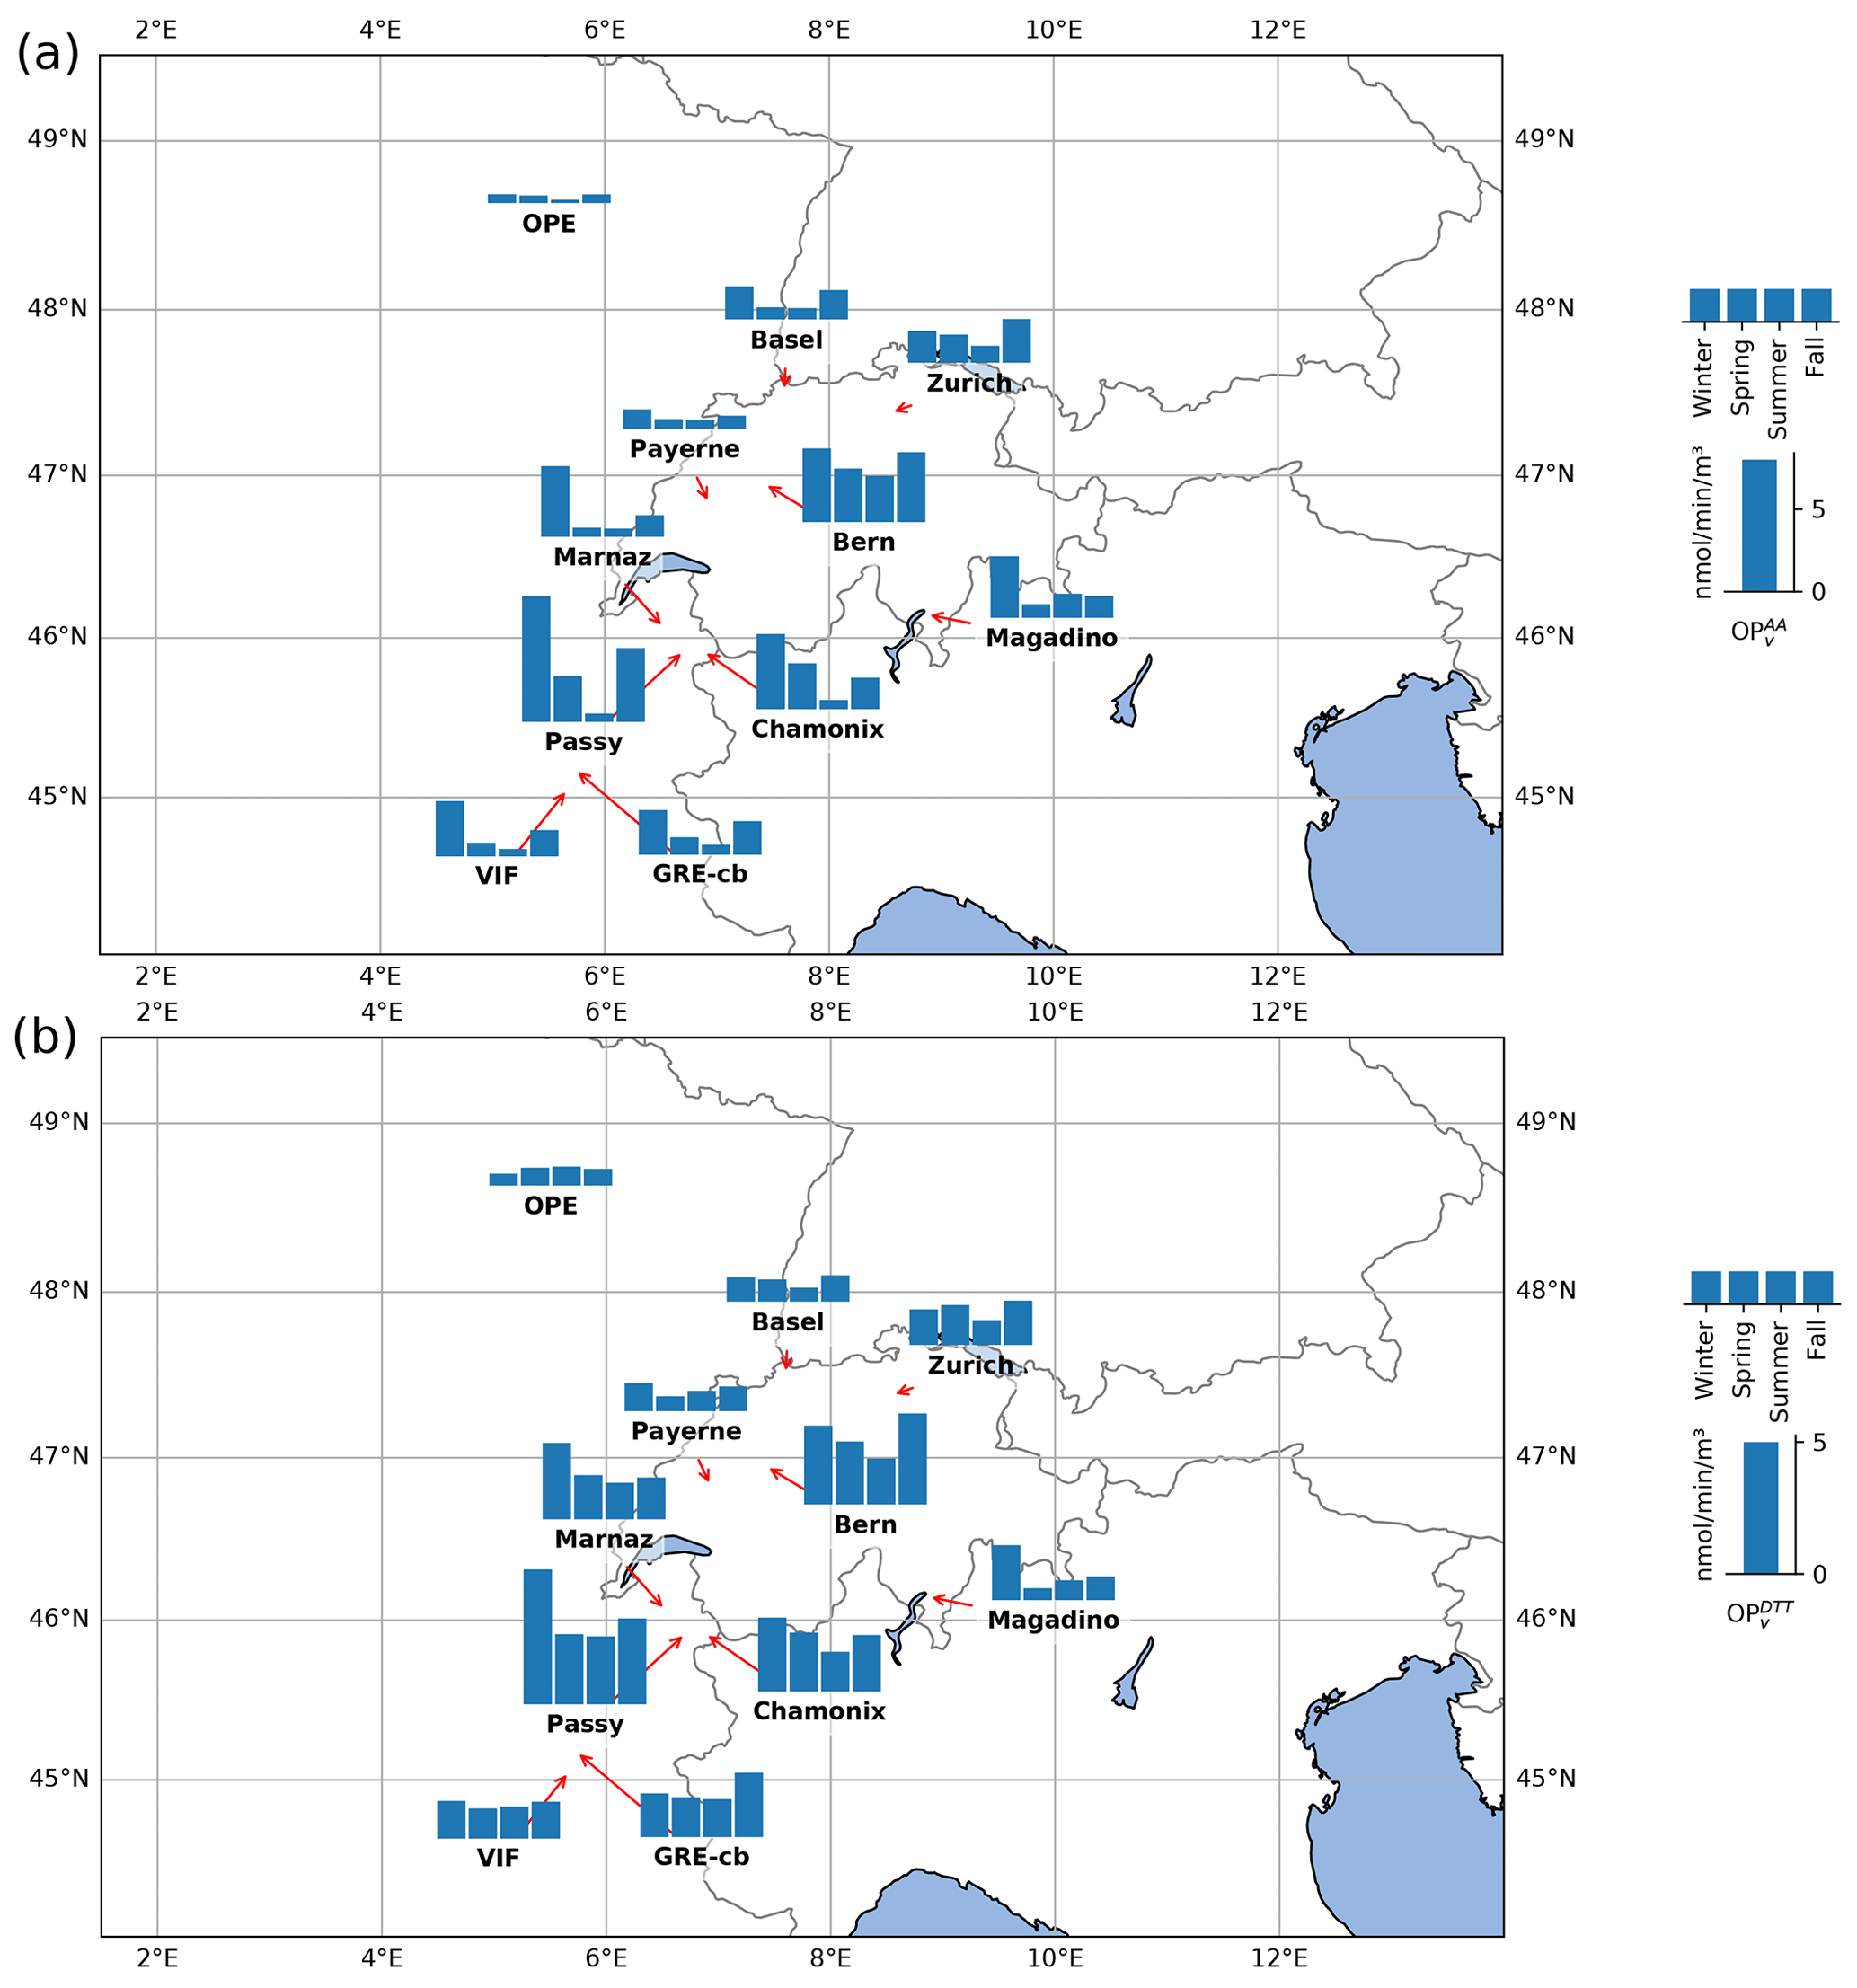
Figure 3Seasonal (a) and (b) PM10 means for the five Swiss sites included in this analysis and the closest six French sites surrounding Switzerland. Data from the French sampling sites are from Weber et al. (2021).
Bern-Bollwerk also demonstrated high levels of when compared to the other sampling locations, but for this metric, Chamonix was more polluted than Bern-Bollwerk, with means of 4.4 and 2.9 , respectively (Table A1; Fig. 3). The Basel-Binningen, Payerne, and Magadino-Cadenazzo Swiss sites had the lowest means when considering the 19 sites, which suggests that Switzerland has generally lower levels of than France, which can be contrasted with , where concentrations experienced in Switzerland were similar to those reported across France.
3.2 Linking OP to PM sources
The PMF source apportionment analysis identified eight PM sources in Switzerland: sulfate-rich, nitrate-rich, road traffic, wood combustion, primary biogenic, secondary biogenic, mineral dust, and aged sea salt. All eight sources were detected for PM10, while the primary biogenic, mineral dust, and aged sea salt sources were not identified in the PM2.5 fraction, indicating that these sources were mostly in the coarse mode. A full discussion of the PMF results, the limitations, and the sources' characteristics can be found in the companion paper, Grange et al. (2021); however, an outline of the PMF results is briefly given below.
The PMF results indicated that about 50 % of the PM10 and PM2.5 load in Switzerland was from the three predominantly secondary nitrate-rich, sulfate-rich, and aged sea salt sources. Based on the models' factor/source profiles, the first two of those sources contained a significant amount of organic mass. Generally, the primary and secondary biogenic sources were rather low contributors to average PM10 mass concentrations (8.9 % to 15.8 %), but they were highly seasonal sources, and the secondary biogenic source was more important for PM2.5 (13.8 % to 23.0 %) than for PM10. The wood burning, mineral dust, and road traffic sources were more enhanced in urban areas, but their enhancement was highly dependent on the sites' immediate environmental surrounds. Bern-Bollwerk's road traffic source contributed more than a third to both PM10 and PM2.5, while the wood burning source contributed over 20 % to both PM fractions at Magadino-Cadenazzo, despite being a source that was inactive for about half of the sampling period.
To investigate the relationship between the activities of the identified main sources of PM in Switzerland and its OP, the PMF sources were used in conjunction with OPv observations. OPv was explained using MLR models for each of the five sites, with the identified PMF source contributions included as independent variables (in µg m−3). The units of the estimated model coefficients for the PM sources were then in and interpreted as the intrinsic OPm. This process has been called an “inversion” by others (Weber et al., 2021; Borlaza et al., 2021), and was conducted 500 times with bootstrapped inputs for each site, assay, and PM size fraction to allow for robust estimates of the models' terms. The sets' model residuals were normally distributed and the mean R2 for the OPAA and OPDTT models was 87 % and 80 %, respectively. The lack of structure in the DCFH observations (Fig. A1) resulted in poorly performing models, and therefore this assay was not included in further analyses.
When the explanatory multiple linear regression models were exposed to the PMF-identified sources, it was clear that the anthropogenic road traffic and wood combustion sources had the greatest intrinsic OPm (Fig. 4). When combining the five sites' results, the road traffic and wood combustion sources were always the highest ranked OPm sources with the exception of DTT for PM2.5, where wood combustion was ranked first but road traffic fell to fourth place and the nitrate-rich source was placed second. The metal-sensitive AA assay showed that the coarse-mode road traffic source was the most potent PM source in Switzerland, giving additional evidence that coarse non-exhaust emissions drove this assay's OPm results. The mostly fine and carbonaceous wood combustion source was always important for the two OPm assays and was clearly the most potent source of PM2.5. The other six sources provided, on average, positive contributions to OPm, but were far less important for OPm when compared to the road traffic and wood combustion sources based on this analysis. Notably, the nitrate- and sulfate-rich sources generally showed low levels of OPm, which outlines a disconnect between average PM mass concentrations and OPm potency. This suggests that all PM has the ability to contribute to OP, but the road traffic and wood combustion sources are the two sources that should be prioritised for control and management to efficiently reduce OPv in Switzerland. Unlike Samake et al. (2017); Weber et al. (2021), these results do not suggest that biogenic-sourced PM is particularly important for OPm in Switzerland, perhaps because different environments show differences in fungal and plant species or due to the differing intensities of agriculture and cultivation in the two countries (Samaké et al., 2019; Samake et al., 2017).

Figure 4Densities of the intrinsic (a) and (b) estimates for the eight PM10 and five PM2.5 PMF-identified sources. The estimates for all five sites included in the analysis have been aggregated.
3.3 Identifying important PM constituents with random forest
Within the PMF-identified sources shown in Fig. 4, there are a large number of constituents that give the sources their characteristics. To better identify the specific components of the PM sources identified in Switzerland that were important and potent drivers of OPv, and presumably mostly derived from the road traffic and wood combustion sources, a multi-step modelling process was conducted. The random forest algorithm was used to calculate variable importance, and all variables included in the data set were ranked (Breiman, 2001). A high importance ranking indicates that an independent variable (predictor) is more important for the dependent variable's explanation, and the utilisation of the random forest algorithm for this sort of application has gained traction in many fields (Behnamian et al., 2019). The motivation for this process was to simplify and resolve the lower-level linkages between PM components and OPv when the PMF sources were potentially heterogeneous among the sampling sites and PM size fractions.
When the random forest importances were calculated for each site, PM fraction, and OPv assay, it was clear that a collection of organics and metals were commonly identified as the most important variables that explain the OPv. Elements and organic compounds associated with wood combustion – rubidium (Kleeman et al., 1999; Reid et al., 2005; Svane et al., 2005), potassium, levoglucosan, mannosan, and galactosan (Urban et al., 2012) – were constantly ranked highly in terms of importance (Fig. 5). The other group of components that were identified were metals such as copper, zinc, iron, tin, antimony, and to some extent manganese and cadmium. This collection of metals are usually associated with vehicular non-exhaust emissions and are generated by abrasive or wear processes (Charron et al., 2019; Harrison et al., 2021). EC and OC were also commonly identified, and these variables are associated with both wood burning and vehicle exhaust emissions. Along with these two groups of PM constituents, both the mass and ions (especially nitrate) were also among the most important variables identified by random forest. We interpret the presence of these variables as being proxies for the total PM mass, indicating that although OPv may vary for a given PM mass depending on the make-up of the PM, the total PM mass is still an important and related metric. Therefore, the importance analysis was consistent with the PMF inversion process discussed in Sect. 3.2.

Figure 5Random forest importance plots of the top independent variables for two OPv assays, two particulate size fractions, and five sampling sites. The large open diamonds represent the variables' medians, and the variables are ordered by median ranking.
Figure 5 also shows some site-specific variation due to the sites' different local emissions. For example, in Bern-Bollwerk, the non-exhaust-sourced metals such as copper, iron, and zinc were ranked higher than the mean importance rank across the five sites. This feature was present in both assays and was somewhat clearer in PM10 due to the tendency of abrasive processes to emit PM larger than 2.5 µm (Harrison et al., 2021). Magadino-Cadenazzo, on the other hand, demonstrated a tendency of rubidium, potassium, mannosan, and levoglucosan to be more important than the site's mean ranking, which was consistent with what is known about this site's exposure to local emissions, because it experiences a heavy wood smoke load (Sandradewi et al., 2008a; Chen et al., 2021). When comparing the two PM size fractions, there was no clear dominating source, and the differences between PM10 and PM2.5 were overshadowed by site-specific differences. This supports the conclusions made in a companion paper (Grange et al., 2021), where non-exhaust PM2.5 emissions were found to be considerable and are important to consider across the Swiss sampling sites. When exposing the PMF sources (eight for PM10 and five for PM2.5) to the same random forest importance analysis, the road traffic and wood combustion sources were clearly the most important sources explaining the OP, as shown in Fig. 4.
A slightly different representation of the random forest importance rankings is provided in Fig. 6, where the presence of highly important variables in the group was counted for the five sites, two OPv assays, and two PM fractions. In this case, highly important variables were defined as the top 12 variables. It is noticeable that rubidium and copper, two tracers for wood burning and non-exhaust emissions, were ranked as the most important variables for PM10 at all five sites and for both OPv assays. For PM2.5, where concentrations of many metals were lower than in PM10, only a wood burning tracer (either potassium or rubidium) together with PM mass were identified across all five sites and both OPv assays. All variables that were identified more than once for each OPv assay and PM size fraction (the variables shown in the y axes of Fig. 6) were used in the next step of linear modelling to identify the variables that are best to use when forming predictive models to explain OPv.
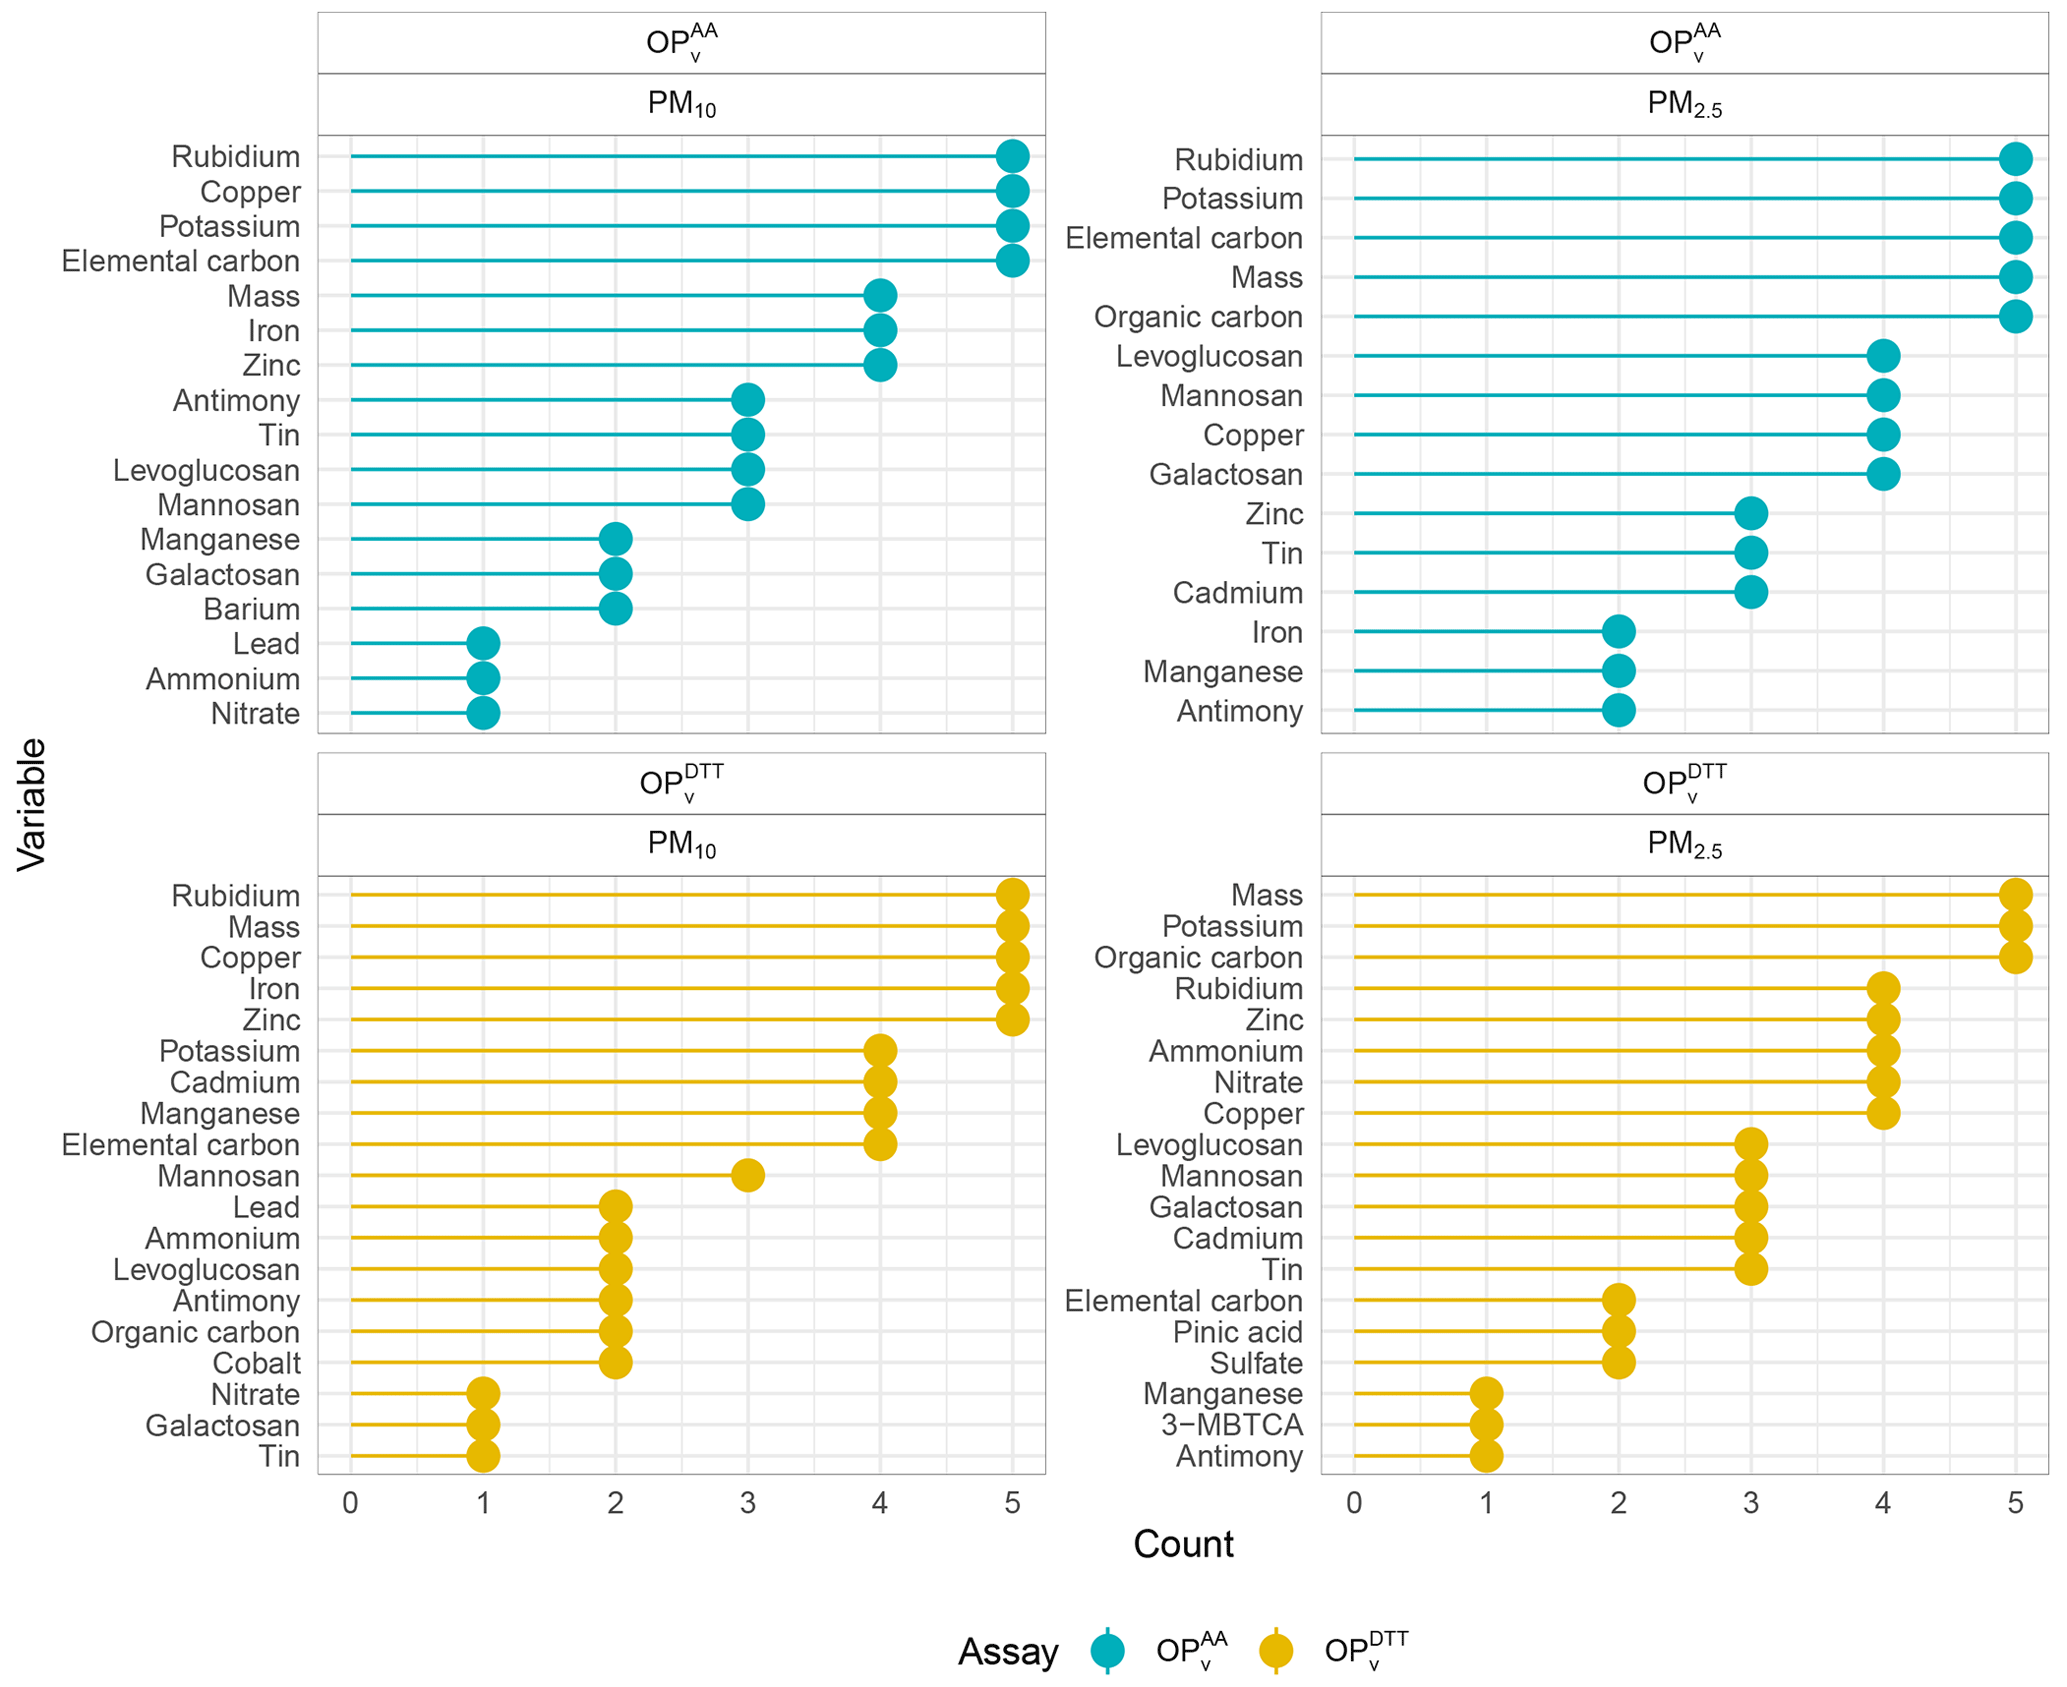
Figure 6Counts of how many times an independent variable was ranked highly (within the top 12) in terms of random forest importance for two OPv assays, two particulate size fractions, and five sampling sites. A count of five for a variable shows that, for every site included in the analysis, this variable was identified as important for explaining OPv.
3.4 Modelling OP
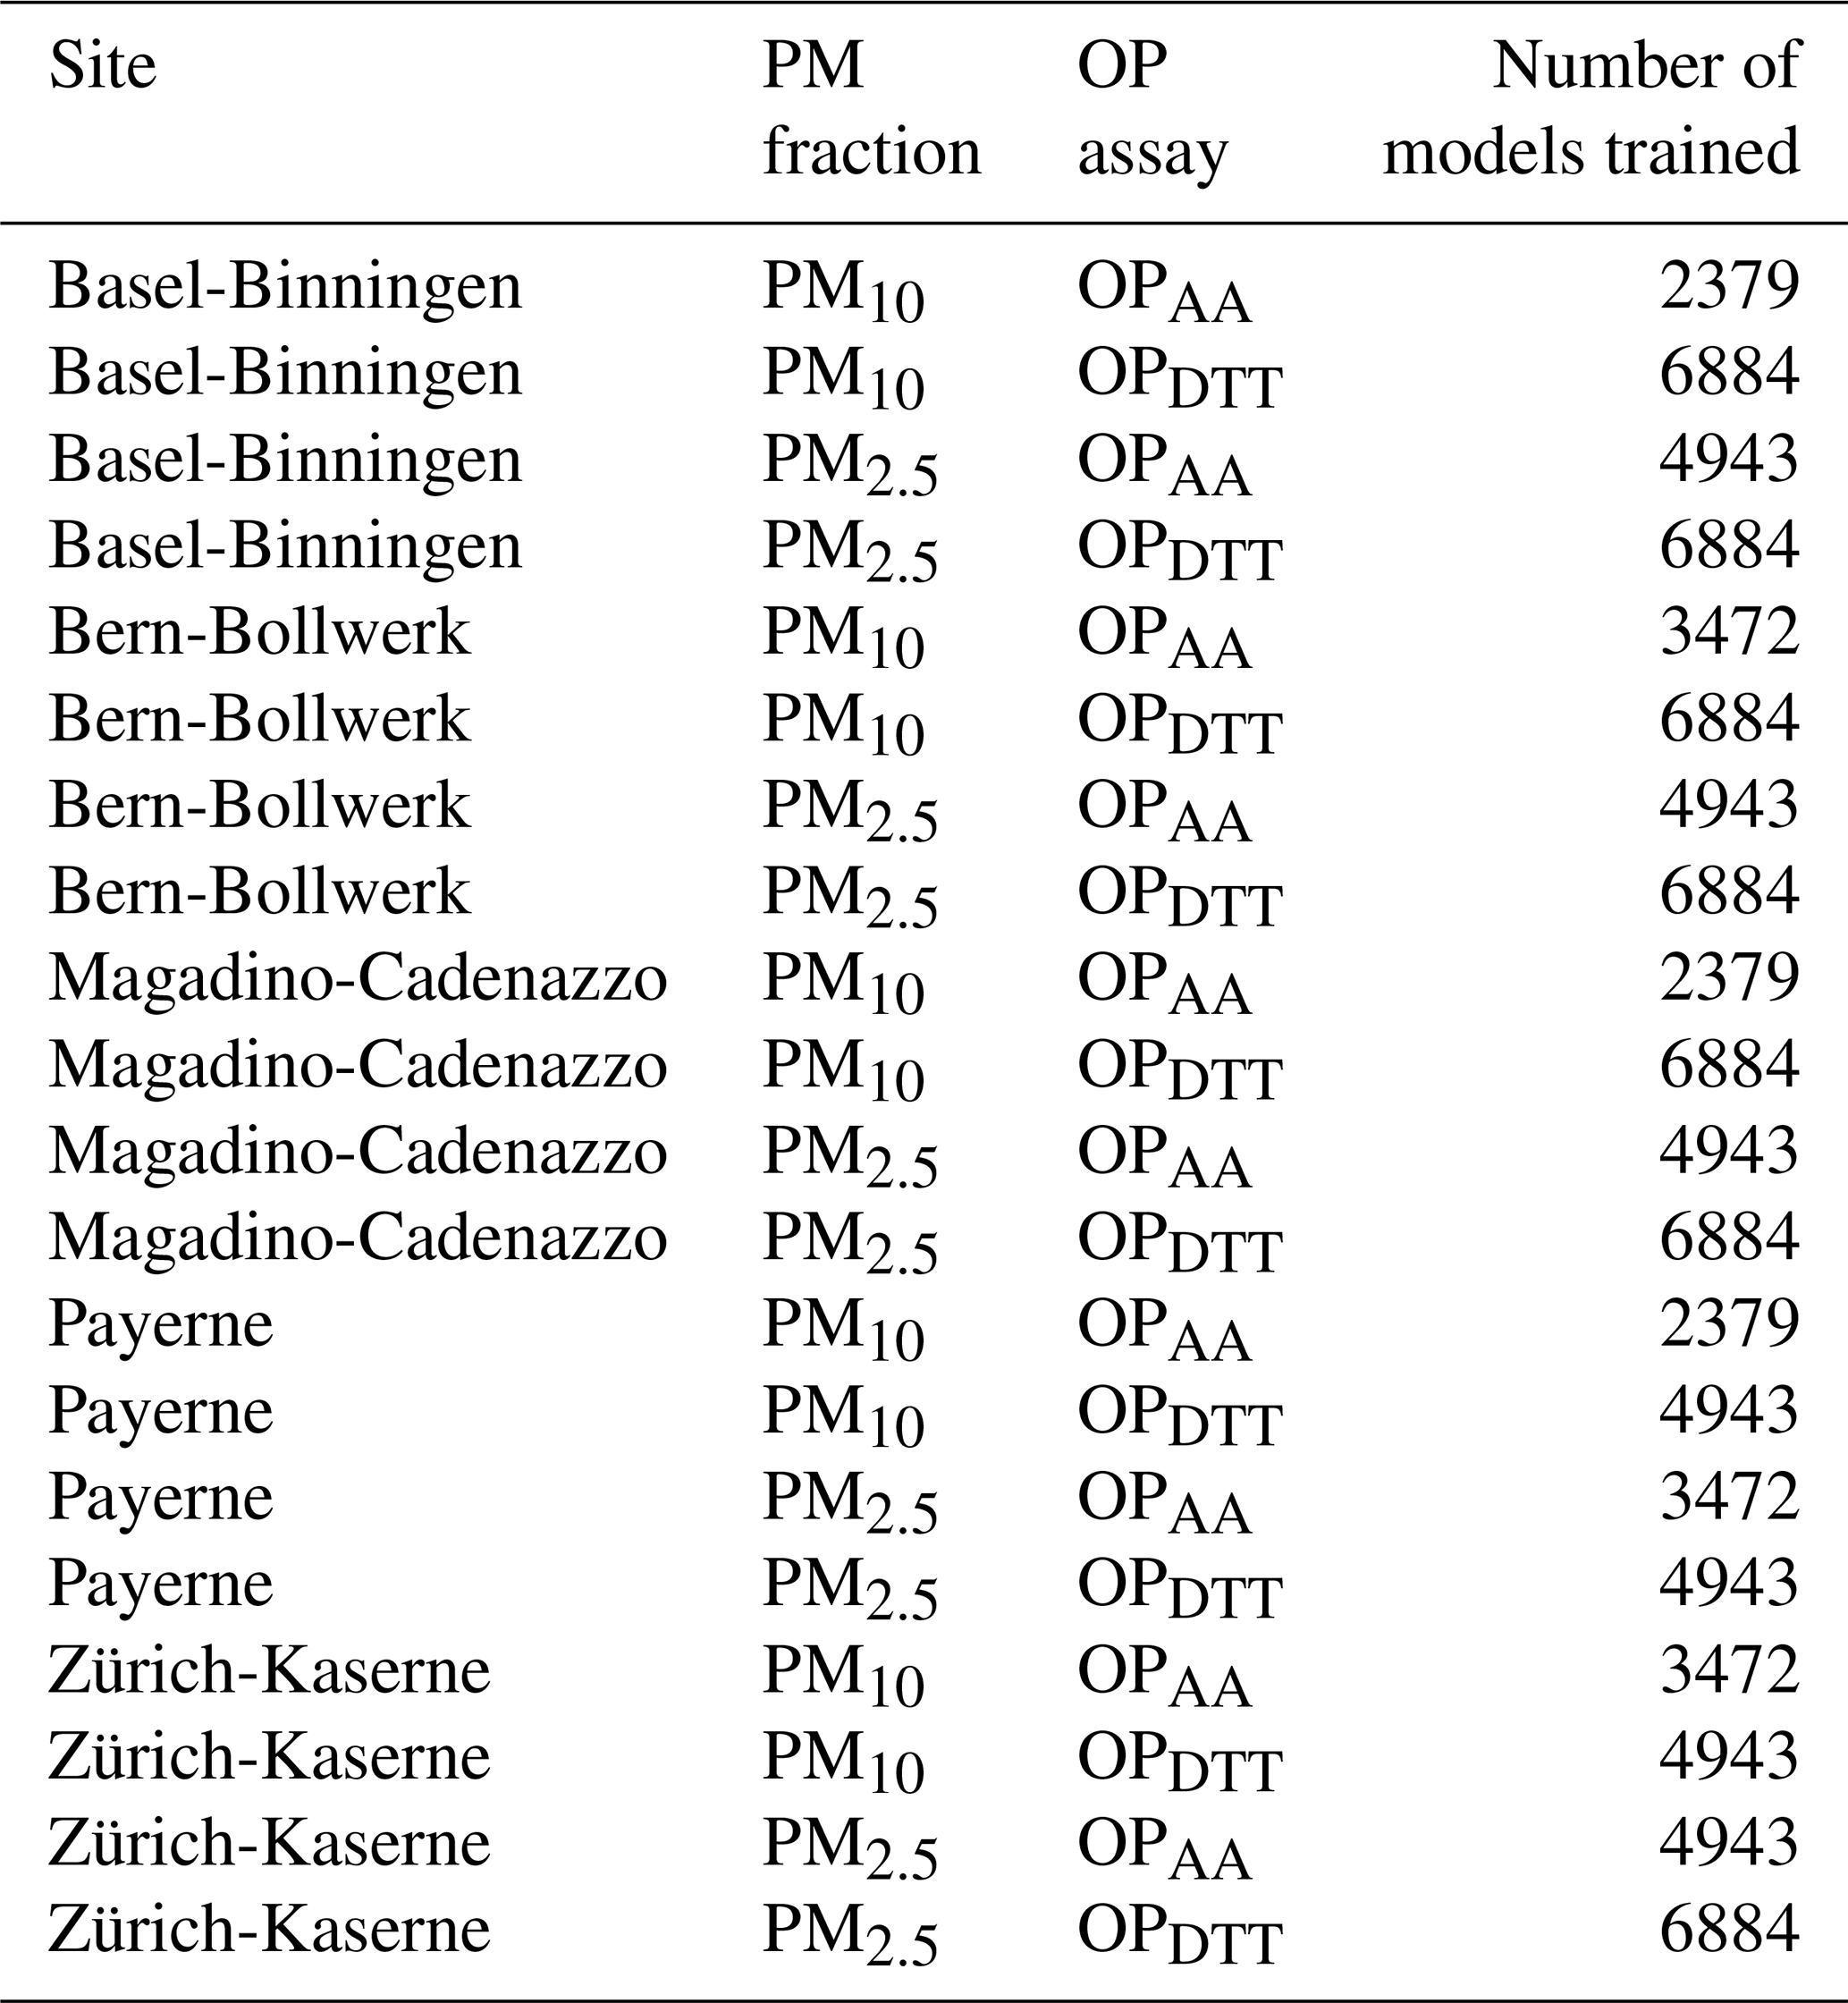
The most important variables at each site, identified by rank of random forest importance (Fig. 6), were used to build multiple linear regression models to explain OPv. Every combination of variables was used to calculate linear regression models (with a maximum of five independent variables and the intercept terms omitted). After training, only the models that had positive slope estimates, a maximum pairwise variance inflation factor (VIF) of less than 2.5, and an R2 of greater than 75 % were kept. These three filters ensured that the models selected did not suffer from undesirable levels of multicollinearity among their independent variables (Jackson et al., 2009; Barmpadimos et al., 2011) and performed adequately on their training set. The VIF filter removed all models with more than four independent variables due to the increased probability of multicollinearity when including additional independent variables in the same model. A total of 100 342 models were trained and 371 models passed the filters. The number of models trained for each site, PM fraction, and OP assay is shown in Table A2.
When analysing the models with the best performance based on their R2 values, 77 % had two independent variables, while models with one or three independent variables comprised only 13 % and 10 %, respectively, of the total set. Almost without exception, the best models' independent variables included a metal and an organic compound. The metals contained in the models were the same as those identified and discussed previously (Figs. 5 and 6), and are generally emitted from abrasive processes related to road vehicles (iron, zinc, copper, antimony, but also cadmium), while the organics were the specific biomass-burning markers of levoglucosan, mannosan, and galactosan. Table 3 shows equations of the best-performing models based on their R2 values for each sampling site, the two PM size fractions, and the two OPv assays. However, all models fulfilling the applied filter criteria can be considered appropriate and were considered suitable models for explaining the observed OPv. The full list of these suitable models is provided in the Supplement, while the counts of all pairwise combinations of variables in the suitable models with two or more independent variables are shown in Fig. 7.
Table 3The best-performing robust multiple linear regression model equations for each site, two PM fractions, and two OPv assays. The units used for the independent variables are µg m−3.


Figure 7Number of times that a combination of two independent variables for the filtered models was present for PM10 and PM2.5 and two OPv assays for five sampling sites.
The best-performing models demonstrated that the combination of vehicular non-exhaust emission and wood burning tracers was required to generate the best models to explain OPv. Interestingly, the exact tracers or markers used for the modelling were not critical. For example, using antimony, copper, or iron as the representative non-exhaust emission species resulted in models that performed very similarly and showed that these three metals were effectively interchangeable with one another. Cadmium, manganese, and zinc could also be added to this group, but the use of these metals resulted in models that performed slightly worse on average, and such patterns may be related to the different elements' analytical detection limits or the multiple emission sources these metals have. The same phenomenon was present for the wood burning tracers of levoglucosan, mannosan, and galactosan, where the selection of one of these organics over the other was not critical for the explanation of OPv.
Figure 7 shows that the models that are suitable for explaining include different combinations of independent variables from those used in the models that are suitable for explaining . There are clearly a larger number of combinations of independent variables in the models for compared to the models for . The combinations of selected variables in models for are, for both PM size fractions, predominantly the above-mentioned pairs of tracers for vehicular non-exhaust and wood burning emissions. It is interesting to note that although rubidium and potassium had higher ranks in the random forest importance, the suitable explanatory models mostly included an organic tracer for wood burning emissions (levoglucosan, mannosan, or galactosan). This could be explained by noting that rubidium and potassium had multiple emission sources and therefore were removed by the multicollinearity filter used for model selection.
We interpret the presence of levoglucosan, mannosan, and galactosan in this analysis simply as indicators of biomass-burning emission sources. This is because these particular organic compounds are not redox active and therefore they cannot be the components of PM that drove OP. Quinones, rubidium, and/or other co-emitted products from biomass burning are most likely the responsible components, and this is a clear example of how an observational study can suggest and highlight associations or correlations but not necessarily causality.
In contrast to , PM mass or ammonium and nitrate were present in the better-performing models for at times. It is unlikely that ammonium and nitrate are indeed strong drivers of OPv, since ammonium sulfate and nitrate ((NH4)2SO4 and NH4NO3) have been shown to have negligible OP (Daellenbach et al., 2020). The presence of these inorganic ions might be acting as a proxy for total ambient PM concentrations or perhaps seasonal emission cycles due to its shift between gas and aerosol phases in the different seasons because of changes in ambient air temperature. For the of PM2.5, OC as well as pinic acid (a tracer for biogenic secondary organic aerosol) were frequently found in the 371 models that passed the model selection criteria. OC and pinic acid might also be understood as proxies for total PM concentrations or specific conditions leading to elevated PM levels. These mentioned proxies were in the models explaining , mostly in combination with an organic wood-burning emission tracer and, for PM2.5, also with copper and tin.
An alternative or supplementary interpretation of the above observations is that atmospheric ageing of PM and the changes that such processes induce modify the OP character of PM. Indeed, the importance of secondary PM ageing for OP has been shown by other work (Antiñolo et al., 2015; Wong et al., 2019; Zhu et al., 2020). Future studies will need to be conducted to further fully understand these processes, however. This analysis is limited by the PM sampling campaign and associated PMF models that were able to be produced in this analysis. A greater understanding of secondary PM sources and OP would be very useful to fully understand OP dynamics across Switzerland.
The combinations of pairs of independent variables in suitable models for explaining OPv in PM10 and PM2.5, as shown in Fig. 7, indicate that the assay provided a response that was more specific to the chemical composition of PM than the assay. It is also noticeable that for both OPv assays, there are more pairwise combinations of independent variables in the suitable models for PM2.5 than for PM10 (for : 74 vs. 111; for : 74 vs. 106). The reason for this observation is currently unclear, and further research will be required to fully elucidate these features.
An intensive PM and OP sampling campaign conducted across Switzerland between 2018 and 2019 demonstrated that OPv was variable in time and space. OPv patterns followed the familiar pattern of atmospheric pollutants, where urban locations were more polluted than their rural counterparts and wintertime saw enhanced OPv. Although the differences between rural and urban locations were important for mass, the OP metrics constantly showed a greater difference, indicating OP was more heterogeneous than PM mass across Switzerland. When comparing Switzerland's OPv with 14 sites in France where data exist and were produced by the same sampling and laboratory procedures, Switzerland's OPv was comparable to that observed in France, but Bern-Bollwerk, a semi-canyonised urban-traffic sampling location, had the highest mean (4.1 ) in the dataset. The lack of current standardisation for OP measurement, quantification, and calibration is an issue that the air quality community should address and would allow for reliable comparisons among different locations and times in the future. The AA and DTT assays showed much more seasonal structure than the third DCFH assay, which made the former approaches more useful for data analysis than the latter.
An analysis of Switzerland's PM10 and PM2.5 sources identified by PMF models suggested that two major anthropogenic emission sources, namely road traffic and wood combustion, were the most important drivers of OPv in Switzerland. The importance of these two sources for OP has been reported elsewhere too (Simonetti et al., 2018). Contrasting this were the inorganic nitrate- and sulfate-rich sources, which generally had low levels of intrinsic OPm across Switzerland, as did the two biogenic sources (primary and secondary). This outlines the potential disconnect between total PM mass concentration and OPm, which has been noted by others, for example, Daellenbach et al. (2020), and this observation may update the management priorities for PM sources, with a focus placed on health impacts rather than total mass.
Further investigation into the components of PM using a random forest dimensionality reduction technique and multiple linear regression models demonstrated that a collection of metals associated with non-exhaust emissions such as copper, zinc, antimony, iron, tin, manganese, and cadmium as well as the specific wood combustion tracers of levoglucosan, mannosan, and galactosan (or associated elements such as rubidium and potassium) were consistently important for the explanation of OPv. The combination of a non-exhaust-sourced metal and a biomass-burning tracer provided very good models that could explain OPv well when considering their training sets.
The results above point toward the need to control wood-burning-sourced PM and non-exhaust emissions to reduce the OPv of Switzerland's atmospheres. Such conclusions are not out of step with current air quality management practices and priorities, but they reinforce the importance of these sources and their respective chemistry with respect to OPv – potentially a health-relevant metric for PM. Therefore, a renewed focus on wood burning and non-exhaust emissions is encouraged to reduce the deleterious health effects of PM. Because non-exhaust emissions and wood burning emissions can be effectively controlled at a local level, it is likely that significant reductions of OPv could be achieved without the need for regional and transboundary management collaboration.
The causality of the identified sources (and PM constituents) in driving OPv could always be questioned because the biological mechanisms that result in pathology were not investigated in this observational study. However, the results are consistent with those found in the literature and give very clear suggestions on where to focus future efforts to identify the linkage between biological mechanisms and OPv. It is also clear that the PM10 and PM2.5 size fractions have different OPv characteristics and the OPv is not simply additive. Furthermore, considering the importance of non-exhaust emissions for the coarse mode, the importance of continued PM10 monitoring is outlined.
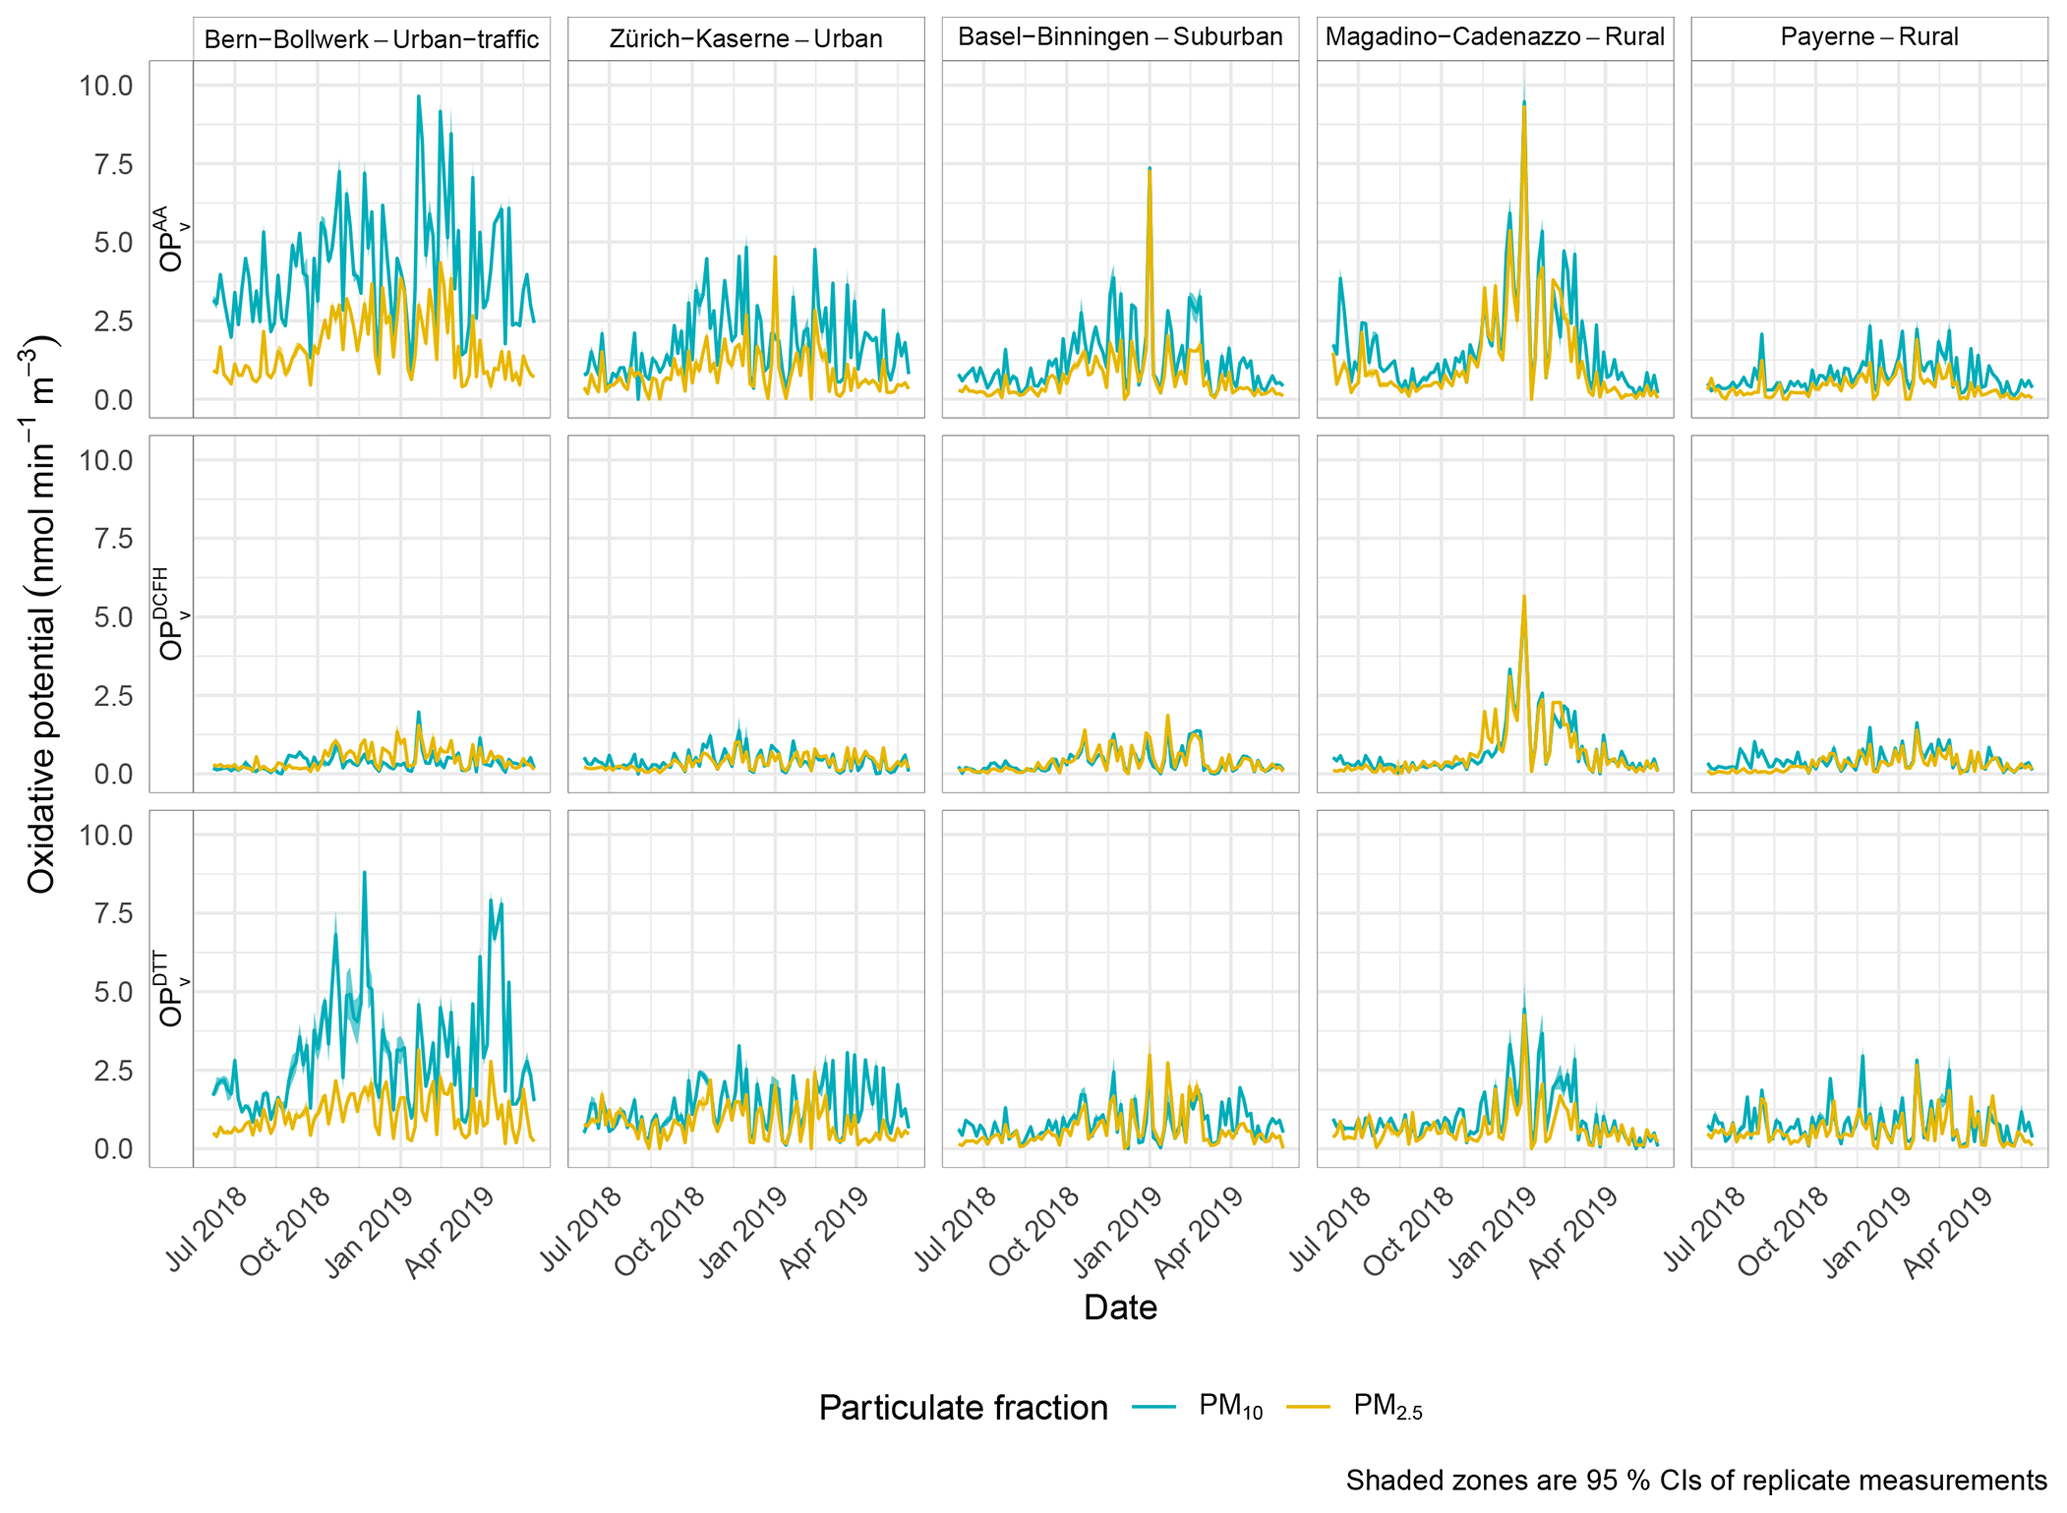
Figure A1Time series of the three OPv assays for PM10 and PM2.5 at five sampling sites in Switzerland between June 2018 and May 2019.
Table A1Annual means of PM10 and for sampling sites in France and Switzerland where identical methods to quantify OPv were conducted. The units used for the means are and the data from 14 sites in France are from Weber (2021) and Weber et al. (2021).
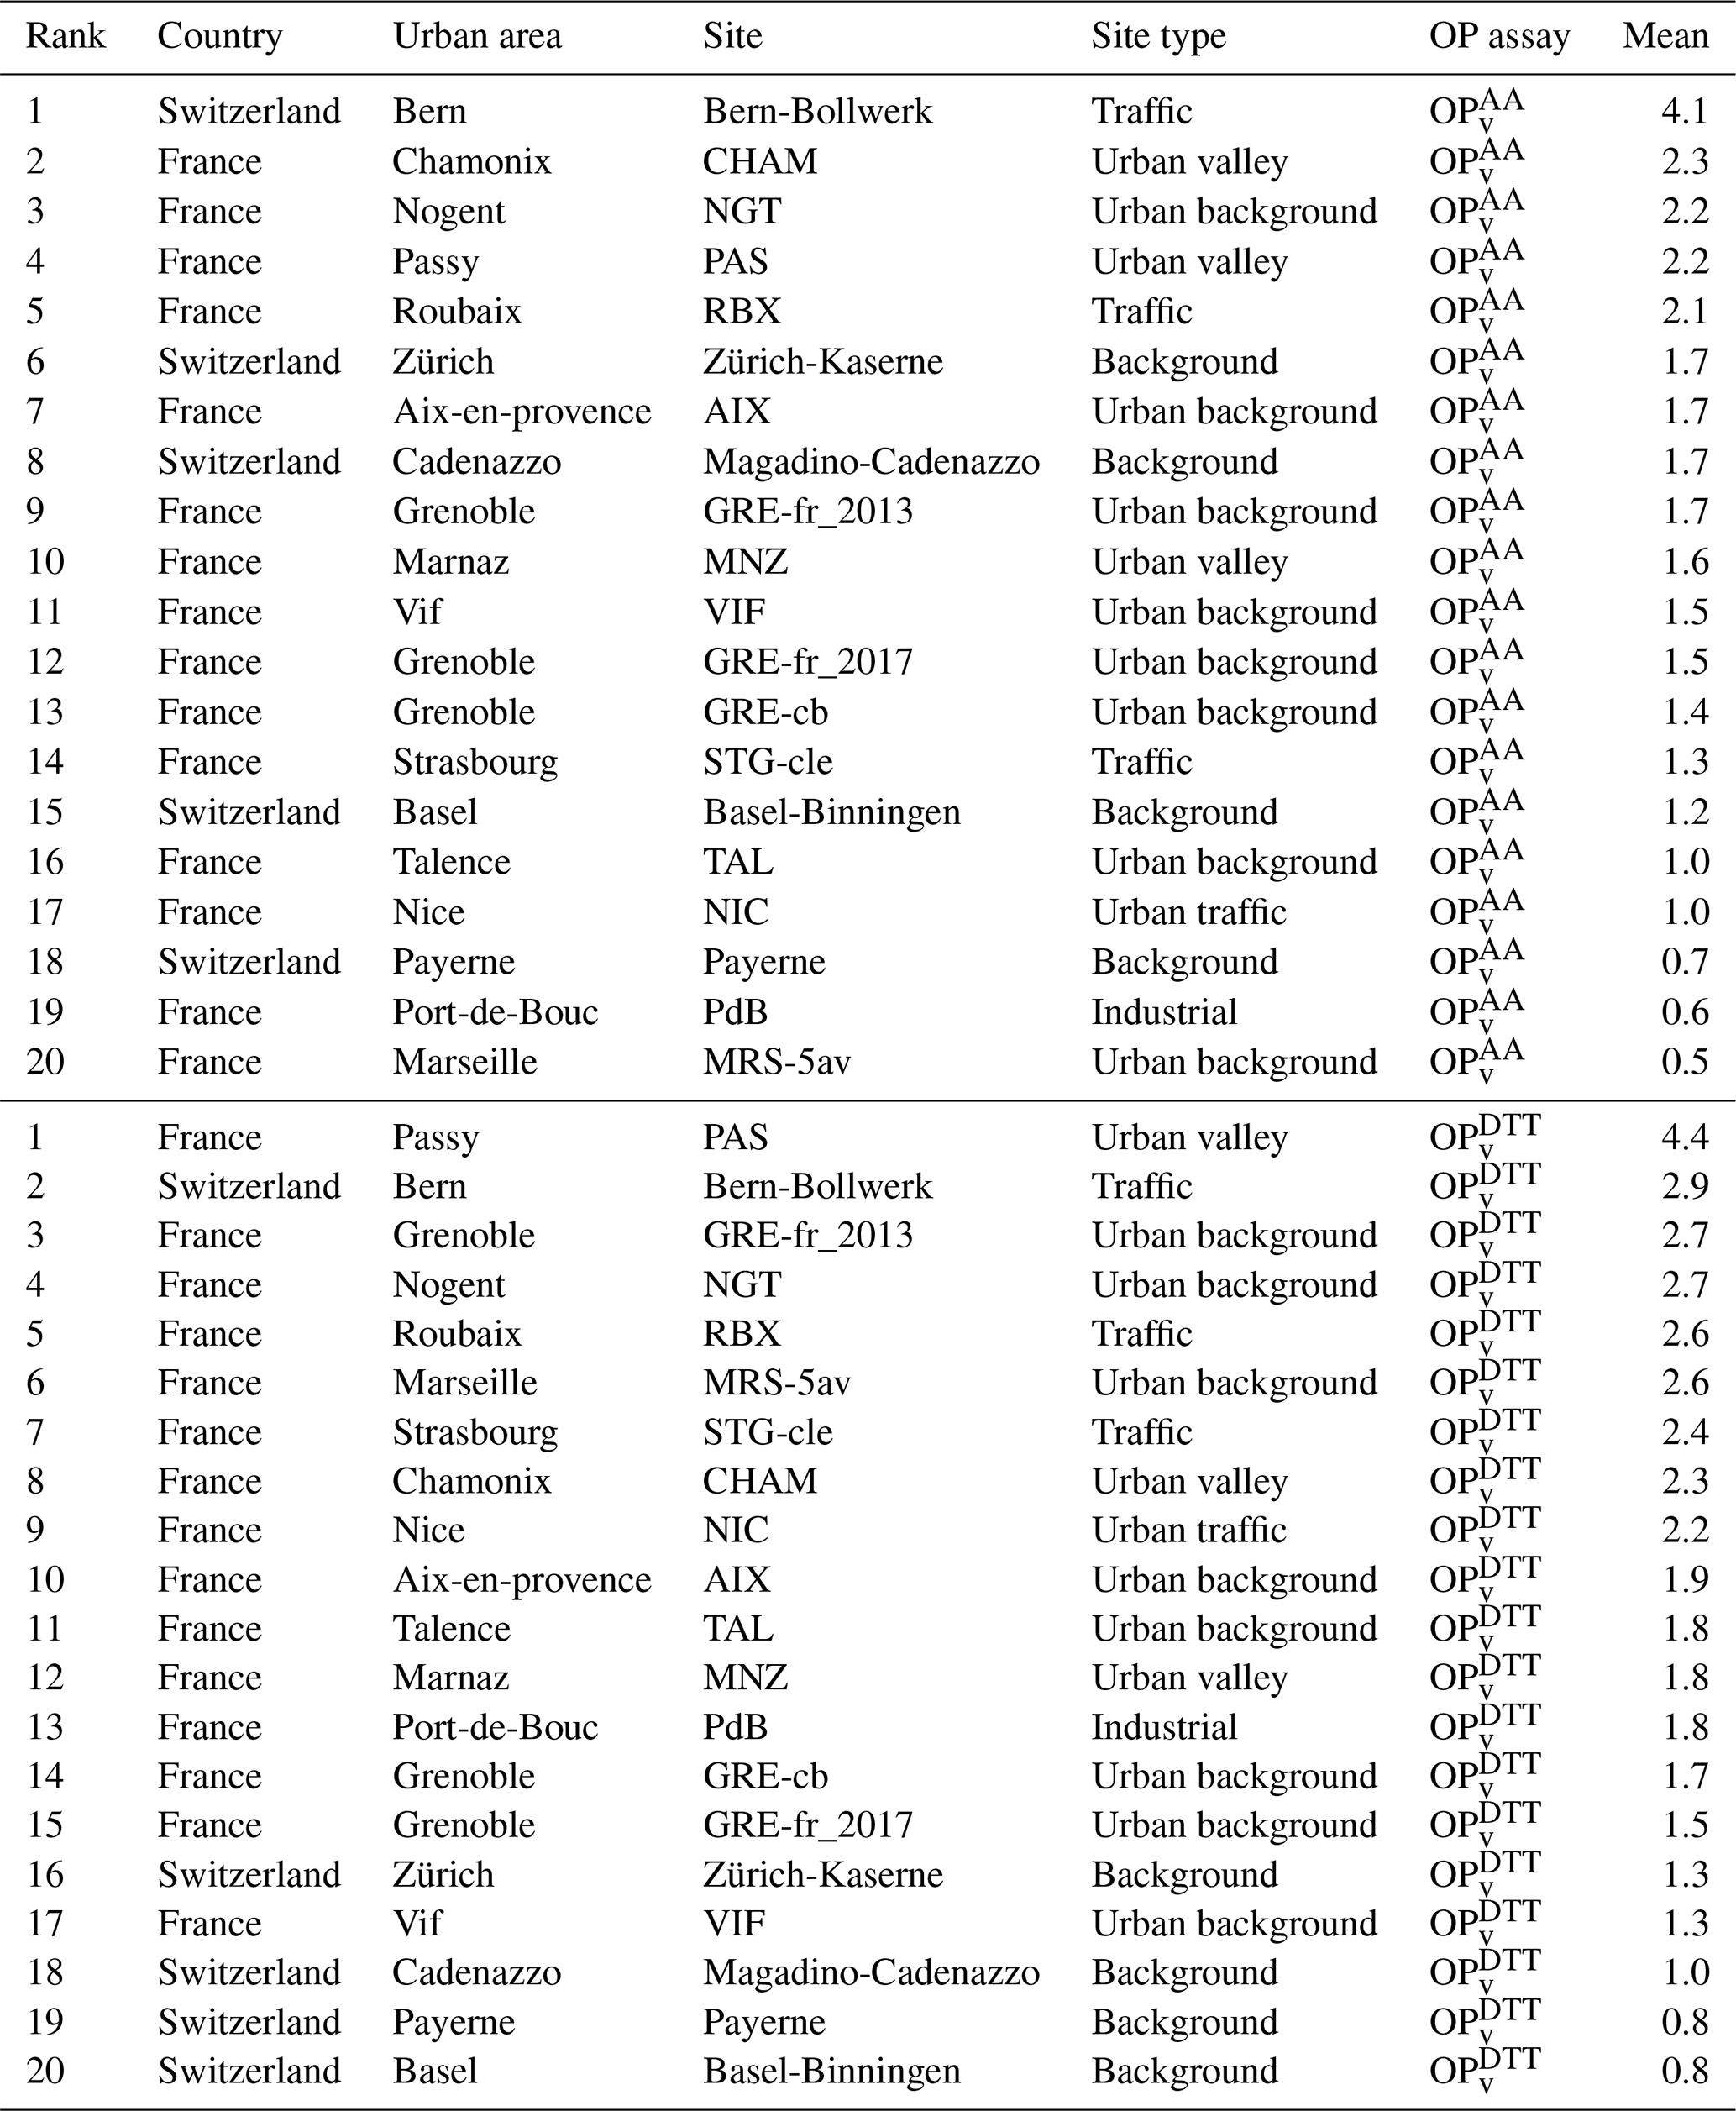
Table A2The number of multiple linear regression (MLR) models trained for each site, PM size fraction, and OP assay. The total number of models was 100 342.
The data sources used in this work are described and some datasets are publicly accessible in a persistent data repository (Grange, 2021a, https://doi.org/10.5281/zenodo.4668158). Additional data and information are available from the authors on reasonable request.
A file (op_model_collection_which_ passed_the_filters.csv) containing all linear regression model formulations along with their estimates and model statistics is attached. The supplement related to this article is available online at: https://doi.org/10.5194/acp-22-7029-2022-supplement.
SKG and CH conceived the research questions and wrote the manuscript. SKG conducted the data analysis and GU managed the OP laboratory analyses. GU, SW, and JLJ helped with revising and improving the manuscript.
The contact author has declared that neither they nor their co-authors have any competing interests.
Publisher's note: Copernicus Publications remains neutral with regard to jurisdictional claims in published maps and institutional affiliations.
The authors thank the wider Projekte Quellenzuordnung Feinstaub team for their contributions. SKG is also supported by the Natural Environment Research Council (NERC) and holds associate status at the University of York. Andrés Alastuey and Xavier Querol from the Institute of Environmental Assessment and Water Research, Consejo Superior de Investigaciones Científicas are thanked for their help with the elemental ICP analysis. Gaëlle Uzu and Jean-Luc Jaffrezo thank the ANR-15-IDEX-02, ANR-19-CE34-0002-01, and the Foundation of the University of Grenoble Alpes for the funding of the instruments on the AirOSol analytical plateau at IGE.
This research has been supported by the Bundesamt für Umwelt (grant no. 16.0096.PJ/R152-0739).
This paper was edited by Nga Lee Ng and reviewed by three anonymous referees.
Abdulhammed, R., Musafer, H., Alessa, A., Faezipour, M., and Abuzneid, A.: Features Dimensionality Reduction Approaches for Machine Learning Based Network Intrusion Detection, Electronics, 8, 79–83, https://doi.org/10.3390/electronics8030322, 2019. a
Antiñolo, M., Willis, M. D., Zhou, S., and Abbatt, J. P. D.: Connecting the oxidation of soot to its redox cycling abilities, Nat. Commun., 6, 6812, https://doi.org/10.1038/ncomms7812, 2015. a
Barmpadimos, I., Hueglin, C., Keller, J., Henne, S., and Prévôt, A. S. H.: Influence of meteorology on PM10 trends and variability in Switzerland from 1991 to 2008, Atmos. Chem. Phys., 11, 1813–1835, https://doi.org/10.5194/acp-11-1813-2011, 2011. a, b
Bates, J., Fang, T., Verma, V., Zeng, L., Weber, R. J., Tolbert, P. E., Abrams, J. Y., Sarnat, S. E., Klein, M., Mulholland, J. A., and Russell, A. G.: Review of Acellular Assays of Ambient Particulate Matter Oxidative Potential: Methods and Relationships with Composition, Sources, and Health Effects, Environ. Sci. Technol., 53, 4003–4019, https://doi.org/10.1021/acs.est.8b03430, 2019. a, b, c
Behnamian, A., Banks, S., White, L., Millard, K., Pouliot, D., Pasher, J., and Duffe, J.: Dimensionality Reduction in The Presence of Highly Correlated Variables for Random Forests: Wetland Case Study, in: IGARSS 2019 - 2019 IEEE International Geoscience and Remote Sensing Symposium, 9839–9842, https://doi.org/10.1109/IGARSS.2019.8898308, 2019. a
Beyrich, F.: Mixing height estimation from sodar data – A critical discussion, Atmos. Environ., 31, 3941–3953, https://doi.org/10.1016/S1352-2310(97)00231-8, 1997. a
Borlaza, L. J. S., Cosep, E. M. R., Kim, S., Lee, K., Joo, H., Park, M., Bate, D., Cayetano, M. G., and Park, K.: Oxidative potential of fine ambient particles in various environments, Environ. Pollut., 243, 1679–1688, 2018. a
Borlaza, L. J. S., Weber, S., Jaffrezo, J.-L., Houdier, S., Slama, R., Rieux, C., Albinet, A., Micallef, S., Trébluchon, C., and Uzu, G.: Disparities in particulate matter (PM10) origins and oxidative potential at a city scale (Grenoble, France) – Part 2: Sources of PM10 oxidative potential using multiple linear regression analysis and the predictive applicability of multilayer perceptron neural network analysis, Atmos. Chem. Phys., 21, 9719–9739, https://doi.org/10.5194/acp-21-9719-2021, 2021. a
Breiman, L.: Random Forests, Mach. Learn., 45, 5–32, https://doi.org/10.1023/A:1010933404324, 2001. a, b
Bundesamt für Umwelt: Luftqualität 2020 – Messresultate des Nationalen Beobachtungsnetzes für Luftfremdstoffe (NABEL), https://www.bafu.admin.ch/dam/bafu/de/dokumente/luft/uz-umwelt-zustand/nabel-luftqualitaet-2020.pdf.download.pdf/UZ-2114-D_Jahrbuch_NABEL2020.pdf (last access: 20 April 2022), Umwelt-Zustand Nr. 2114: 28 S, 2021. a
Calas, A., Uzu, G., Martins, J. M. F., Voisin, D., Spadini, L., Lacroix, T., and Jaffrezo, J.-L.: The importance of simulated lung fluid (SLF) extractions for a more relevant evaluation of the oxidative potential of particulate matter, Sci. Rep.-UK, 7, 11617, https://doi.org/10.1038/s41598-017-11979-3, 2017. a, b
Calas, A., Uzu, G., Kelly, F. J., Houdier, S., Martins, J. M. F., Thomas, F., Molton, F., Charron, A., Dunster, C., Oliete, A., Jacob, V., Besombes, J.-L., Chevrier, F., and Jaffrezo, J.-L.: Comparison between five acellular oxidative potential measurement assays performed with detailed chemistry on PM10 samples from the city of Chamonix (France), Atmos. Chem. Phys., 18, 7863–7875, https://doi.org/10.5194/acp-18-7863-2018, 2018. a, b, c, d
Calas, A., Uzu, G., Besombes, J.-L., Martins, J. M. F., Redaelli, M., Weber, S., Charron, A., Albinet, A., Chevrier, F., Brulfert, G., Mesbah, B., Favez, O., and Jaffrezo, J.-L.: Seasonal Variations and Chemical Predictors of Oxidative Potential (OP) of Particulate Matter (PM), for Seven Urban French Sites, Atmosphere, 10, 698, https://doi.org/10.3390/atmos10110698, 2019. a, b, c, d
Charrier, J. G. and Anastasio, C.: On dithiothreitol (DTT) as a measure of oxidative potential for ambient particles: evidence for the importance of soluble transition metals, Atmos. Chem. Phys., 12, 9321–9333, https://doi.org/10.5194/acp-12-9321-2012, 2012. a
Charron, A., Polo-Rehn, L., Besombes, J.-L., Golly, B., Buisson, C., Chanut, H., Marchand, N., Guillaud, G., and Jaffrezo, J.-L.: Identification and quantification of particulate tracers of exhaust and non-exhaust vehicle emissions, Atmos. Chem. Phys., 19, 5187–5207, https://doi.org/10.5194/acp-19-5187-2019, 2019. a
Chen, G., Sosedova, Y., Canonaco, F., Fröhlich, R., Tobler, A., Vlachou, A., Daellenbach, K. R., Bozzetti, C., Hueglin, C., Graf, P., Baltensperger, U., Slowik, J. G., El Haddad, I., and Prévôt, A. S. H.: Time-dependent source apportionment of submicron organic aerosol for a rural site in an alpine valley using a rolling positive matrix factorisation (PMF) window, Atmos. Chem. Phys., 21, 15081–15101, https://doi.org/10.5194/acp-21-15081-2021, 2021. a
Cho, A. K., Sioutas, C., Miguel, A. H., Kumagai, Y., Schmitz, D. A., Singh, M., Eiguren-Fernandez, A., and Froines, J. R.: Redox Activity of Airborne Particulate Matter at Different Sites in the Los Angeles Basin, Environ. Res., 99, 40–47, https://doi.org/10.1016/j.envres.2005.01.003, 2005. a
Daellenbach, K. R., Uzu, G., Jiang, J., Cassagnes, L.-E., Leni, Z., Vlachou, A., Stefenelli, G., Canonaco, F., Weber, S., Segers, A., Kuenen, J. J. P., Schaap, M., Favez, O., Albinet, A., Aksoyoglu, S., Dommen, J., Baltensperger, U., Geiser, M., El Haddad, I., Jaffrezo, J.-L., and Prévôt, A. S. H.: Sources of particulate-matter air pollution and its oxidative potential in Europe, Nature, 587, 414–419, https://doi.org/10.1038/s41586-020-2902-8, 2020. a, b, c, d, e, f, g
Delfino, R. J., Staimer, N., Tjoa, T., Gillen, D. L., Schauer, J. J., and Shafer, M. M.: Airway inflammation and oxidative potential of air pollutant particles in a pediatric asthma panel, J. Expo. Sci. Env. Epid., 23, 466–473, https://doi.org/10.1038/jes.2013.25, 2013. a
Emeis, S. and Schäfer, K.: Remote Sensing Methods to Investigate Boundary-layer Structures relevant to Air Pollution in Cities, Bound.-Lay. Meteorol., 121, 377–385, https://doi.org/10.1007/s10546-006-9068-2, 2006. a
European Committee for Standardization (CEN): CEN EN 16909: Ambient air – Measurement of elemental carbon (EC) and organic carbon (OC) collected on filters, Technical Committee: CEN/TC 264 – Air quality, 2017. a
Fang, T., Verma, V., Bates, J. T., Abrams, J., Klein, M., Strickland, M. J., Sarnat, S. E., Chang, H. H., Mulholland, J. A., Tolbert, P. E., Russell, A. G., and Weber, R. J.: Oxidative potential of ambient water-soluble PM2.5 in the southeastern United States: contrasts in sources and health associations between ascorbic acid (AA) and dithiothreitol (DTT) assays, Atmos. Chem. Phys., 16, 3865–3879, https://doi.org/10.5194/acp-16-3865-2016, 2016. a, b
Fang, T., Zeng, L., Gao, D., Verma, V., Stefaniak, A. B., and Weber, R. J.: Ambient Size Distributions and Lung Deposition of Aerosol Dithiothreitol-Measured Oxidative Potential: Contrast between Soluble and Insoluble Particles, Environ. Sci. Technol., 51, 6802–6811, https://doi.org/10.1021/acs.est.7b01536, 2017. a
Favez, O., Salameh, D., and Jaffrezo, J.-L.: Traitement harmonisé de jeux de données multi-sites pour l'étude de sources de PM par Positive Matrix Factorization, https://bit.ly/2R3m1Cr (last access: 20 April 2022), Laboratoire Central de Surveillance de la Qualité de l'Air. Ref. INERIS: DRC-16-152341-07444A, 2017. a
Federal Office for the Environment: UNECE-CLRTAP Submission of air pollutant emissions for Switzerland 1980–2019, deliveries for LRTAP Convention – National emission inventories, https://www.ceip.at/status-of-reporting-and-review-results/2021-submission, last access: 12 February 2021. a
Gao, D., Ripley, S., Weichenthal, S., and Godri Pollitt, K. J.: Ambient particulate matter oxidative potential: Chemical determinants, associated health effects, and strategies for risk management, Free Radical Biology and Medicine, 151, 7–25, https://doi.org/10.1016/j.freeradbiomed.2020.04.028, 2020. a
Gianini, M. F. D., Gehrig, R., Fischer, A., Ulrich, A., Wichser, A., and Hueglin, C.: Chemical composition of PM10 in Switzerland: An analysis for 2008/2009 and changes since 1998/1999, Atmos. Environ., 54, 97–106, 2012. a
Grange, S. K.: Data for publication “Switzerland's PM10 and PM2.5 environmental increments show the importance of non-exhaust emissions”, Zenodo [data set], https://doi.org/10.5281/zenodo.4668158, 2021a. a, b
Grange, S. K.: Example of training multiple linear regression (MLR) models to predict oxidative potential (OP) with other particulate matter (PM) constituents with simulated observations, GitHub Gist, https://gist.github.com/skgrange/1d5b2a51f478317bd0ccd9491eeb17c1, 2021b. a
Grange, S. K.: Example of training multiple linear regression (MLR) models to explain/predict oxidative potential (OP) by particulate matter (PM) sources as identified by positive matrix factorisation (PMF) using simulated observations, GitHub Gist, https://gist.github.com/skgrange/60923587d3a39fc9dd440d053b3b7388, 2021c. a
Grange, S. K., Carslaw, D. C., Lewis, A. C., Boleti, E., and Hueglin, C.: Random forest meteorological normalisation models for Swiss PM10 trend analysis, Atmos. Chem. Phys., 18, 6223–6239, https://doi.org/10.5194/acp-18-6223-2018, 2018. a
Grange, S. K., Lötscher, H., Fischer, A., Emmenegger, L., and Hueglin, C.: Evaluation of equivalent black carbon source apportionment using observations from Switzerland between 2008 and 2018, Atmos. Meas. Tech., 13, 1867–1885, https://doi.org/10.5194/amt-13-1867-2020, 2020. a, b
Grange, S. K., Fischer, A., Zellweger, C., Alastuey, A., Quero, X., Jaffrezo, J.-l., Weber, S., Uzu, G., and Hueglin, C.: Switzerland's PM10 and PM2.5 environmental increments show the importance of non-exhaust emissions, Atmos. Environ., 12, 100145, https://doi.org/10.1016/j.aeaoa.2021.100145, 2021. a, b, c, d, e, f, g, h, i
Harrison, R. M.: Airborne particulate matter, Philos. T. Roy. Soc. A, 378, 20190319, https://doi.org/10.1098/rsta.2019.0319, 2020. a
Harrison, R. M., Allan, J., Carruthers, D., Heal, M. R., Lewis, A. C., Marner, B., Murrells, T., and Williams, A.: Non-Exhaust Vehicle Emissions of Particulate Matter and VOC from Road Traffic: A Review, Atmos. Environ., 262, 118592, https://doi.org/10.1016/j.atmosenv.2021.118592, 2021. a, b, c
Hüglin, C. and Grange, S. K.: Chemical characterisation and source identification of PM10 and PM2.5 in Switzerland, Project report, Empa, Swiss Federal Laboratories for Materials Science and Technology. Commissioned by the Federal Office for the Environment (FOEN), https://www.bafu.admin.ch/dam/bafu/de/dokumente/luft/externe-studien-berichte/chemical-characterisation-and-source-identification-of-pm-in-switzerland.pdf.download.pdf/Characterisation-source-identification-PM.pdf (last access: 20 April 2022), 2021. a, b, c
Jackson, L. S., Carslaw, N., Carslaw, D. C., and Emmerson, K. M.: Modelling trends in OH radical concentrations using generalized additive models, Atmos. Chem. Phys., 9, 2021–2033, https://doi.org/10.5194/acp-9-2021-2009, 2009. a, b
Janssen, N. A. H., Yang, A., Strak, M., Steenhof, M., Hellack, B., Gerlofs-Nijland, M. E., Kuhlbusch, T., Kelly, F., Harrison, R., Brunekreef, B., Hoek, G., and Cassee, F.: Oxidative potential of particulate matter collected at sites with different source characteristics, Sci. Total Environ., 472, 572–581, 2014. a, b, c, d
Kelly, F. J. and Mudway, I. S.: Protein Oxidation at the Air-Lung Interface, Amino Acids, 25, 375–396, https://doi.org/10.1007/s00726-003-0024-x, 2003. a
Kleeman, M. J., Schauer, J. J., and Cass, G. R.: Size and Composition Distribution of Fine Particulate Matter Emitted from Wood Burning, Meat Charbroiling, and Cigarettes, Environ. Sci. Technol., 33, 3516–3523, https://doi.org/10.1021/es981277q, 1999. a, b
Leni, Z., Cassagnes, L. E., Daellenbach, K. R., Haddad, I. E., Vlachou, A., Uzu, G., Prévôt, A. S. H., Jaffrezo, J.-L., Baumlin, N., Salathe, M., Baltensperger, U., Dommen, J., and Geiser, M.: Oxidative stress-induced inflammation in susceptible airways by anthropogenic aerosol, PLoS ONE, 15, e0233425, https://doi.org/10.1371/journal.pone.0233425, 2020. a
Liu, L., Urch, B., Szyszkowicz, M., Evans, G., Speck, M., Van Huang, A., Leingartner, K., Shutt, R. H., Pelletier, G., Gold, D. R., Brook, J. R., Godri Pollitt, K., and Silverman, F. S.: Metals and oxidative potential in urban particulate matter influence systemic inflammatory and neural biomarkers: A controlled exposure study, Environ. Int., 121, 1331–1340, https://doi.org/10.1016/j.envint.2018.10.055, 2018a. a, b
Liu, W., Xu, Y., Liu, W., Liu, Q., Yu, S., Liu, Y., Wang, X., and Tao, S.: Oxidative potential of ambient PM2.5 in the coastal cities of the Bohai Sea, northern China: Seasonal variation and source apportionment, Environ. Pollut., 236, 514–528, https://doi.org/10.1016/j.envpol.2018.01.116, 2018b. a
Molina, C., Andrade, C., Manzano, C. A., Richard Toro, A., Verma, V., and Leiva-Guzmán, M. A.: Dithiothreitol-based oxidative potential for airborne particulate matter: an estimation of the associated uncertainty, Environ. Sci. Pollut. Res., 27, 29672–29680, https://doi.org/10.1007/s11356-020-09508-3, 2020. a
Norris, G., Duvall, R., Brown, S., and Bai, S.: EPA Positive Matrix Factorization (PMF) 5.0 Fundamentals and User Guide, U.S. Environmental Protection Agency, EPA/600/R-14/108, https://www.epa.gov/air-research/epa-positive-matrix-factorization-50-fundamentals-and-user-guide, last access: April 2014. a, b
Paatero, P.: The Multilinear Engine – A Table-Driven, Least Squares Program for Solving Multilinear Problems, Including the n-Way Parallel Factor Analysis Model, J. Comput. Graph. Stat., 8, 854–888, https://doi.org/10.1080/10618600.1999.10474853, 1999. a
Paatero, P. and Tapper, U.: Positive matrix factorization: A non-negative factor model with optimal utilization of error estimates of data values, Environmetrics, 5, 111–126, https://doi.org/10.1002/env.3170050203, 1994. a
Perrone, M. G., Zhou, J., Malandrino, M., Sangiorgi, G., Rizzi, C., Ferrero, L., Dommen, J., and Bolzacchini, E.: PM chemical composition and oxidative potential of the soluble fraction of particles at two sites in the urban area of Milan, Northern Italy, Atmos. Environ., 128, 104–113, https://doi.org/10.1016/j.atmosenv.2015.12.040, 2016. a
Pietrogrande, M. C., Russo, M., and Zagatti, E.: Review of PM Oxidative Potential Measured with Acellular Assays in Urban and Rural Sites across Italy, Atmosphere, 10, 10, https://doi.org/10.3390/atmos10100626, 2019. a
Raaschou-Nielsen, O., Beelen, R., Wang, M., Hoek, G., Andersen, Z., Hoffmann, B., Stafoggia, M., Samoli, E., Weinmayr, G., Dimakopoulou, K., Nieuwenhuijsen, M., Xun, W., Fischer, P., Eriksen, K., Sørensen, M., Tjønneland, A., Ricceri, F., de Hoogh, K., Key, T., Eeftens, M., Peeters, P., de Mesquita, H. B., Meliefste, K., Oftedal, B., Schwarze, P., Nafstad, P., Galassi, C., Migliore, E., Ranzi, A., Cesaroni, G., Badaloni, C., Forastiere, F., Penell, J., De Faire, U., Korek, M., Pedersen, N., Östenson, C.-G., Pershagen, G., Fratiglioni, L., Concin, H., Nagel, G., Jaensch, A., Ineichen, A., Naccarati, A., Katsoulis, M., Trichpoulou, A., Keuken, M., Jedynska, A., Kooter, I., Kukkonen, J., Brunekreef, B., Sokhi, R., Katsouyanni, K., and Vineis, P.: Particulate matter air pollution components and risk for lung cancer, Environ. Int., 87, 66–73, https://doi.org/10.1016/j.envint.2015.11.007, 2016. a
Rausch, J., Jaramillo-Vogel, D., Perseguers, S., Schnidrig, N., Grobéty, B., and Yajan, P.: Automated identification and quantification of tire wear particles (TWP) in airborne dust: SEM/EDX single particle analysis coupled to a machine learning classifier, Sci. Total Environ., 803, 149832, https://doi.org/10.1016/j.scitotenv.2021.149832, 2022. a
Reddy, G. T., Reddy, M. P. K., Lakshmanna, K., Kaluri, R., Rajput, D. S., Srivastava, G., and Baker, T.: Analysis of Dimensionality Reduction Techniques on Big Data, IEEE Access, 8, 54776–54788, https://doi.org/10.1109/ACCESS.2020.2980942, 2020. a
Reid, J. S., Koppmann, R., Eck, T. F., and Eleuterio, D. P.: A review of biomass burning emissions part II: intensive physical properties of biomass burning particles, Atmos. Chem. Phys., 5, 799–825, https://doi.org/10.5194/acp-5-799-2005, 2005. a
Saffari, A., Daher, N., Shafer, M. M., Schauer, J. J., and Sioutas, C.: Global Perspective on the Oxidative Potential of Airborne Particulate Matter: A Synthesis of Research Findings, Environ. Sci. Technol., 48, 7576–7583, https://doi.org/10.1021/es500937x, 2014. a
Samake, A., Uzu, G., Martins, J. M. F., Calas, A., Vince, E., Parat, S., and Jaffrezo, J. L.: The unexpected role of bioaerosols in the Oxidative Potential of PM, Sci. Rep.-UK, 7, 10978, https://doi.org/10.1038/s41598-017-11178-0, 2017. a, b, c
Samaké, A., Jaffrezo, J.-L., Favez, O., Weber, S., Jacob, V., Albinet, A., Riffault, V., Perdrix, E., Waked, A., Golly, B., Salameh, D., Chevrier, F., Oliveira, D. M., Bonnaire, N., Besombes, J.-L., Martins, J. M. F., Conil, S., Guillaud, G., Mesbah, B., Rocq, B., Robic, P.-Y., Hulin, A., Le Meur, S., Descheemaecker, M., Chretien, E., Marchand, N., and Uzu, G.: Polyols and glucose particulate species as tracers of primary biogenic organic aerosols at 28 French sites, Atmos. Chem. Phys., 19, 3357–3374, https://doi.org/10.5194/acp-19-3357-2019, 2019. a
Samaké, A., Bonin, A., Jaffrezo, J.-L., Taberlet, P., Weber, S., Uzu, G., Jacob, V., Conil, S., and Martins, J. M. F.: High levels of primary biogenic organic aerosols are driven by only a few plant-associated microbial taxa, Atmos. Chem. Phys., 20, 5609–5628, https://doi.org/10.5194/acp-20-5609-2020, 2020. a
Sandradewi, J., Prévôt, A. S. H., Szidat, S., Perron, N., Alfarra, M. R., Lanz, V. A., Weingartner, E., and Baltensperger, U.: Using Aerosol Light Absorption Measurements for the Quantitative Determination of Wood Burning and Traffic Emission Contributions to Particulate Matter, Environ. Sci. Technol., 42, 3316–3323, https://doi.org/10.1021/es702253m, 2008a. a
Sandradewi, J., Prévôt, A., Weingartner, E., Schmidhauser, R., Gysel, M., and Baltensperger, U.: A study of wood burning and traffic aerosols in an Alpine valley using a multi-wavelength Aethalometer, Atmos. Environ., 42, 101–112, https://doi.org/10.1016/j.atmosenv.2007.09.034, 2008b. a
Shirmohammadi, F., Wang, D., Hasheminassab, S., Verma, V., Schauer, J. J., Shafer, M. M., and Sioutas, C.: Oxidative potential of on-road fine particulate matter (PM2.5) measured on major freeways of Los Angeles, CA, and a 10-year comparison with earlier roadside studies, Atmos. Environ., 148, 102–114, https://doi.org/10.1016/j.atmosenv.2016.10.042, 2017. a
Simonetti, G., Conte, E., Perrino, C., and Canepari, S.: Oxidative potential of size-segregated PM in an urban and an industrial area of Italy, Atmos. Environ., 187, 292–300, https://doi.org/10.1016/j.atmosenv.2018.05.051, 2018. a
Svane, M., Hagström, M., and Pettersson, J. B. C.: Online Measurements of Individual Alkali-Containing Particles Formed in Biomass and Coal Combustion: Demonstration of an Instrument Based on Surface Ionization Technique, Energy Fuels, 19, 411–417, https://doi.org/10.1021/ef049925g, 2005. a
Taghvaee, S., Sowlat, M. H., Diapouli, E., Manousakas, M. I., Vasilatou, V., Eleftheriadis, K., and Sioutas, C.: Source apportionment of the oxidative potential of fine ambient particulate matter (PM2.5) in Athens, Greece, Sci. Total Environ., 653, 1407–1416, https://doi.org/10.1016/j.scitotenv.2018.11.016, 2019. a
United Nations Human Rights Council: 48/13. The human right to a clean, healthy and sustainable environment, forty-eighth session. 13 September–11 October 2021, Agenda item 3. Resolution adopted by the Human Rights Councilon, A/HRC/RES/48/13, https://undocs.org/A/HRC/RES/48/13, last access: 8 October 2021. a
Urban, R. C., Lima-Souza, M., Caetano-Silva, L., Queiroz, M. E. C., Nogueira, R. F., Allen, A. G., Cardoso, A. A., Held, G., and Campos, M. L. A.: Use of levoglucosan, potassium, and water-soluble organic carbon to characterize the origins of biomass-burning aerosols, Atmos. Environ., 61, 562–569, https://doi.org/10.1016/j.atmosenv.2012.07.082, 2012. a
Venables, W. N. and Ripley, B. D.: Modern Applied Statistics with S, Springer, New York, 4th edn., http://www.stats.ox.ac.uk/pub/MASS4 (last access: 20 April 2022), ISBN 0-387-95457-0, 2002. a, b
Weber, S.: Source apportionment of the Oxidative Potential of aerosols, A visualisation tool and supplementary information, http://getopstandop.u-ga.fr/ (last access: 20 April 2022), 2021. a
Weber, S., Uzu, G., Calas, A., Chevrier, F., Besombes, J.-L., Charron, A., Salameh, D., Ježek, I., Močnik, G., and Jaffrezo, J.-L.: An apportionment method for the oxidative potential of atmospheric particulate matter sources: application to a one-year study in Chamonix, France, Atmos. Chem. Phys., 18, 9617–9629, https://doi.org/10.5194/acp-18-9617-2018, 2018. a
Weber, S., Salameh, D., Albinet, A., Alleman, L. Y., Waked, A., Besombes, J.-L., Jacob, V., Guillaud, G., Meshbah, B., Rocq, B., Hulin, A., Chrétien, M. D.-S. E., Jaffrezo, J.-L., and Favez, O.: Comparison of PM10 Sources Profiles at 15 French Sites Using a Harmonized Constrained Positive Matrix Factorization Approach, Atmosphere, 10, 310, https://doi.org/10.3390/atmos10060310, 2019. a
Weber, S., Uzu, G., Favez, O., Borlaza, L. J. S., Calas, A., Salameh, D., Chevrier, F., Allard, J., Besombes, J.-L., Albinet, A., Pontet, S., Mesbah, B., Gille, G., Zhang, S., Pallares, C., Leoz-Garziandia, E., and Jaffrezo, J.-L.: Source apportionment of atmospheric PM10 oxidative potential: synthesis of 15 year-round urban datasets in France, Atmos. Chem. Phys., 21, 11353–11378, https://doi.org/10.5194/acp-21-11353-2021, 2021. a, b, c, d, e, f, g, h, i
Wong, J. P. S., Tsagkaraki, M., Tsiodra, I., Mihalopoulos, N., Violaki, K., Kanakidou, M., Sciare, J., Nenes, A., and Weber, R. J.: Effects of Atmospheric Processing on the Oxidative Potential of Biomass Burning Organic Aerosols, Environ. Sci. Technol., 53, 6747–6756, https://doi.org/10.1021/acs.est.9b01034, 2019. a
World Health Organization: WHO global air quality guidelines: particulate matter (PM2.5 and PM10), ozone, nitrogen dioxide, sulfur dioxide and carbon monoxide, World Health Organization, https://apps.who.int/iris/rest/bitstreams/1371692/retrieve (last access: 20 April 2022), 2021. a
Wright, M. N. and Ziegler, A.: ranger: A Fast Implementation of Random Forests for High Dimensional Data in C++ and R, J. Stat. Softw., 77, 1–17, https://doi.org/10.18637/jss.v077.i01, 2017. a
Wright, M. N., Ziegler, A., and König, I. R.: Do little interactions get lost in dark random forests?, BMC Bioinformatics, 17, 145, https://doi.org/10.1186/s12859-016-0995-8, 2016. a
Yadav, S. and Phuleria, H. C.: Oxidative Potential of Particulate Matter: A Prospective Measure to Assess PM Toxicity, Springer Singapore, Singapore, 333–356, https://doi.org/10.1007/978-981-15-0540-9_16, 2020. a, b
Yang, A., Hellack, B., Leseman, D., Brunekreef, B., Kuhlbusch, T. A., Cassee, F. R., Hoek, G., and Janssen, N. A.: Temporal and spatial variation of the metal-related oxidative potential of PM2.5 and its relation to PM2.5 mass and elemental composition, Atmos. Environ., 102, 62–69, https://doi.org/10.1016/j.atmosenv.2014.11.053, 2015. a
Yu, H., Puthussery, J. V., Wang, Y., and Verma, V.: Spatiotemporal variability in the oxidative potential of ambient fine particulate matter in the Midwestern United States, Atmos. Chem. Phys., 21, 16363–16386, https://doi.org/10.5194/acp-21-16363-2021, 2021. a
Yue, Y., Chen, H., Setyan, A., Elser, M., Dietrich, M., Li, J., Zhang, T., Zhang, X., Zheng, Y., Wang, J., and Yao, M.: Size-Resolved Endotoxin and Oxidative Potential of Ambient Particles in Beijing and Zürich, Environ. Sci. Technol., 52, 6816–6824, https://doi.org/10.1021/acs.est.8b01167, 2018. a
Zhang, Z., Weichenthal, S., Kwong, J. C., Burnett, R. T., Hatzopoulou, M., Jerrett, M., van Donkelaar, A., Bai, L., Martin, R. V., Copes, R., Lu, H., Lakey, P., Shiraiwa, M., and Chen, H.: A Population-Based Cohort Study of Respiratory Disease and Long-Term Exposure to Iron and Copper in Fine Particulate Air Pollution and Their Combined Impact on Reactive Oxygen Species Generation in Human Lungs, Environ. Sci. Technol., 55, 3807–3818, https://doi.org/10.1021/acs.est.0c05931, 2021. a
Zhu, J., Shang, J., Chen, Y., Kuang, Y., and Zhu, T.: Reactive Oxygen Species-Related Inside-to-Outside Oxidation of Soot Particles Triggered by Visible-Light Irradiation: Physicochemical Property Changes and Oxidative Potential Enhancement, Environ. Sci. Technol., 54, 8558–8567, https://doi.org/10.1021/acs.est.0c01150, 2020. a