the Creative Commons Attribution 4.0 License.
the Creative Commons Attribution 4.0 License.
 | 30 May 2022
Evolution of source attributed organic aerosols and gases in a megacity of central China
Siyuan Li
Shaofei Kong
Yangzhou Wu
Kang Hu
Huang Zheng
Yi Cheng
Shurui Zheng
Xiaotong Jiang
Shuo Ding
Dawei Hu
Ping Tian
Delong Zhao
Jiujiang Sheng
The secondary production of oxygenated organic aerosol (OOA) impacts air quality, climate, and human health. The importance of various sources in contributing to the OOA loading and associated different ageing mechanisms remains to be elucidated. Here we present a concurrent observation and factorization analysis on the mass spectra of organic aerosol (OA) by a high-resolution aerosol mass spectrometer and volatile organic compounds (VOCs) by a proton transfer reaction mass spectrometer in Wuhan, a megacity in central China, during autumn. The full mass spectra of organics with two principle anthropogenic sources were identified as the traffic and cooking sources, for their primary emission profiles in aerosol and gas phases, the evolutions, and their respective roles in producing OOA and secondary VOCs. Primary emissions in gas and aerosol phases both contributed to the production of OOA. The photooxidation of traffic sources from the morning rush hour caused a 2.5 fold increase in OOA mass in a higher oxidation state (oxygen-to-carbon ratio as =0.72), co-producing gas phase carboxylic acids, while, at night, cooking aerosols and VOCs (particularly acrolein and hexanal) importantly caused the nocturnal formation of oxygenated intermediate VOCs, increasing OOA mass by a factor of 1.7 (OC =0.42). The daytime and nighttime formation of secondary aerosols, as contributed by different sources, was found to be modulated by solar radiation and air moisture, respectively. The environmental policy should, therefore, consider the primary emissions and their respective ageing mechanisms influenced by meteorological conditions.
- Article
(4383 KB) - Full-text XML
-
Supplement
(1088 KB) - BibTeX
- EndNote


The transformation between the gas and aerosol phase of organic species produces secondary organic aerosols (SOAs; Kroll and Seinfeld, 2008; Hallquist et al., 2009; Slowik et al., 2010), which form an important part of the global budget of aerosol loadings (Heald et al., 2005; Zhang et al., 2007), exerting climate (Poschl, 2005; Seinfeld et al., 2016) and environmental impacts (von Schneidemesser et al., 2011; Huang et al., 2014). Given the large complexities of organic species, the yields (Goldstein and Galbally, 2007; Ortiz-Montalvo et al., 2014) and production rates (Sareen et al., 2013; Jokinen et al., 2015) of SOAs from gas precursors are influenced by the diversities of source profiles (emission mass percentages among species; Lin et al., 2012; Shrivastava et al., 2015) and environmental factors (such as radiation, air moisture, and ambient temperature; Clark et al., 2016; S. Li et al., 2021; Wang et al., 2021). This raises challenges for source-oriented environmental policy-making, until an explicit understanding of the formation mechanism of SOAs from different sources is reached.
The application of detailed mass spectra of organic aerosols allows the online source attribution of organic aerosol (OA; Canagaratna et al., 2007; Ng et al., 2011a), based on the factorization analysis on the mass spectra of OA, which groups the covaried species from certain sources (Ulbrich et al., 2009). This factorization technique allows the identification of primary sources and aged secondary sources at a receptor measurement site. The complex aerosol sources in an urban environment have been commonly recognized as traffic sources, mainly from vehicles on road (Zhu et al., 2021), biomass burning from open or closed combustion (Adler et al., 2011), coal combustion, normally in cold season for heating (Xu et al., 2019), and more localized cooking sources (Allan et al., 2010; Zhang et al., 2020). The secondary sources are oxygenated OA, which may be from oxidizing volatile organic compounds (VOCs), following condensation (Donahue et al., 2006), or heterogenous oxidation occurring during the particle phase (Claeys et al., 2004). Among these sources, SOA has been found to be the main contributor of OA mass loading (41 %–69 %) in an urban environment of East Asia (Sun et al., 2014; Hu et al., 2017), especially in warm season, when primary emissions were low, along with high ambient temperature and more intensive chemical reactions (Hu et al., 2016). The formation of SOAs from VOCs may experience a few reaction generations (Kroll and Seinfeld, 2008) and could interact with other sources of species during the process (Shrivastava et al., 2017), thereby complicating the goal of identifying the key precursors in contributing to the consequent SOAs. In addition, some primary gases somehow already have low volatility and may not require a long reaction chain to become condensable; for example, some primarily emitted intermediate volatility organic compounds (IVOCs) may substantially contribute to the SOAs (Robinson et al., 2007; Huang et al., 2021). An understanding of the source profiles of primary emissions in both gas and aerosol phases is therefore important for ruling out the source-dependent production of SOAs. The above necessitates a concurrent investigation on the compositions of gases and aerosols at a receptor site, along with their evolution and interaction, in order to elucidate the role of each source in contributing to SOAs.
In this study, we performed online continuous measurements on the detailed mass spectra of organics, concurrently on aerosol and gas phases, in a typical anthropogenically polluted region in central China, where such data had rarely been reported. Factorization analysis is performed on the mass spectra of organics in both aerosol and gas phases to investigate the source-oriented gas–aerosol evolution and SOA formation in this region.
2.1 Sampling site
The field experiment was performed at the campus of the China University of Geosciences (Wuhan; 114.40∘ E, 30.52∘ N) during October–November 2019 (Hu et al., 2021). The site represents a typical region of mixed residential/traffic sources (Fig. S1 in the Supplement). Due to the preparation and hosting of the 7th CISM Military World Games during the experimental period, the government implemented strict emission reduction measures, particularly for the industrial sources and heavy vehicle emissions in the main roads. The more localized pollution sources, such as traffic emission from smaller-sized vehicles and cooking sources dominated the pollution in this study, besides those transported from surrounding regions during some heavy pollution events (Zheng et al., 2019, 2020). The Hybrid Single-Particle Lagrangian Integrated Trajectory model (HYSPLIT; Draxler and Hess, 1997), with a 3 h wind field from the Global Data Assimilation System (GDAS) reanalysis products, was used to obtain the 36 h backward trajectories initializing from the location of the experiment site. A cluster analysis was performed to categorize the trajectories into three groups by minimizing the differences in each group and maximizing the differences among groups (Moody and Galloway, 1988).
2.2 Instrumentation
2.2.1 Measurements of mass spectra of aerosols and gases
The mass concentration and chemical composition of NR-PM1 were measured by a high-resolution time-of-flight aerosol mass spectrometric (HR-ToF-AMS; Aerodyne Research Inc., USA), including organics, nitrate (NO), sulfate (SO), chloride (Chl−), and ammonium (NH). The details can be found elsewhere (Decarlo et al., 2006). Briefly, the aerosols are dried using a diffusion dryer before entering the AMS and moving through a critical orifice into a narrow beam via an aerodynamic lens. The aerosol size is determined using the flight time of particles to the thermal vaporization and ionization chamber. Then the aerosols are successively vaporized by a heated surface (∼600 ∘C), ionized by electron ionization (EI;, 70 eV), and detected by a mass spectrometer detector. During this field observation, the HR-ToF-AMS was operated under V mode with high sensitivity. The composition-dependent collection efficiencies were applied (Middlebrook et al., 2012), and the ionization efficiency was calibrated using 300 nm pure ammonium nitrate (Jayne et al., 2000). Elemental analysis (EA) was also executed, using the improved ambient method (Canagaratna et al., 2015), to obtain the hydrogen-to-carbon ratio (HC), oxygen-to-carbon ratio (OC), and nitrogen-to-carbon ratio (NC).
The proton transfer reactor time-of-flight mass spectrometer (PTR-ToF-MS 8000; IONICON Analytik GmbH, Innsbruck, Austria) was deployed to quantify VOCs in this research. The operating and calibration of the PTR followed the routine described previously (Cappellin et al., 2012; Bruns et al., 2016). Briefly, the PTR was operated with hydronium ions (H3O+) as the reagent and with a drift tube pressure of 2.2 mbar, voltage of 600 V, and temperature of 60 ∘C. The ratio of the electric field (E) and the density of the buffer gas (N) in the drift tube, which dictates the ion drift velocity in the drift tube, is 135 Td. MS transmission function was performed using a mixture of VOCs (formaldehyde, methanol, acetonitrile, acetaldehyde, acetone, isoprene, methyl ethyl ketone, benzene, toluene, styrene, benzaldehyde, ethylbenzene, and 1,3,5-trimethylbenzene). Mass calibration was done using H3O+ ( 21.0226), CH3COCH ( 59.0490), and monoterpenes ( 137.1290). The shift in is minor, which ensures that the mass calibration was sufficient for all compounds. The background measurements were performed using a dry zero air cylinder. The measurement error is described in Text S2. A separate reaction rate constant is applied to convert the ion signal into concentration (Bruns et al., 2016), or the default reaction rate constant cm3 s−1 can be applied to all other ions (L. Wang et al., 2020). The vapour saturation concentration (equilibrium vapour pressures; C∗) of each VOC compound at 25 ∘C is estimated using the parameterization based on the elemental ratio and molecular weight (Fig. S2; Li et al., 2016). A logC∗ (in µg m−3) lower than 6.5 is deemed to be an intermediate VOC (IVOC). According to Fig. S2, VOC species (with ) are mainly identified to be IVOCs in this study; thus the fraction of these larger molecular weight (MW) VOCs () is used to evaluate the potential influence of IVOCs.
2.2.2 PMF analysis on the mass spectra of OA and VOCs
Positive matrix factorization (PMF; Paatero and Tapper, 1994) was performed on the high-resolution organic mass spectral matrix of OA (Ulbrich et al., 2009; Decarlo et al., 2010). In this work, and isotopic ions were excluded in PMF analysis due to the limited mass resolution and low contributions to OA loading (∼5 %). After a careful evaluation of the mass spectral profiles and correlations with time series of tracers and diurnal variations, four OA factors from total OA were identified with fpeak =0, including hydrocarbon-related OA (HOA), cooking OA (COA), low-oxidized oxygenated OA (LO-OOA; OOA1), and more-oxidized oxygenated OA (MO-OOA; OOA2). The detail of the PMF diagnostic is summarized in Text S1 and Fig. S3.
The U.S. EPA (United States Environmental Protection Agency) PMF 5.0 model (Paatero and Tapper, 1994) was used for the source apportionment of VOC species. The 109 VOCs were used for the PMF analysis. The uncertainties from each sample were determined according to the method detection limit (MDL) and the error fraction (%). The detail of the PMF diagnostic is summarized in Text S2 and Fig. S4. In total, five factors were ultimately selected, and the ratio was 0.96 on average (Fig. S4). The rotation ambiguity was explored by varying the fpeak values from −3 to +3, and the results with fpeak =0 were selected for the lowest dQ (robust), indicating the stability of the PMF solution (Zhou et al., 2019). Most of the residuals are distributed normally, ranging from −3 and +3, suggesting that the model fits the data well.
2.2.3 Other measurements
The concentration of the BC (black carbon) particles was measured by a single particle soot photometer (SP2; DMT Inc.). The operation and data analysis procedures of the SP2 have been described elsewhere (Schwarz et al., 2008; Liu et al., 2010). The SP2 incandescence signal was calibrated for the refractory BC (rBC) mass using the Aquadag black carbon particle standards (Acheson Inc., USA) and corrected for ambient rBC with a factor of 0.75 (Laborde et al., 2012).
The size distribution and number concentration of aerosols with an electrical mobility diameter from 12 to 552 nm were also measured by a scanning mobility particle sizer (SMPS; model 3081, impactor 50 % cut off at 0.677 µm; condensation particle counter (CPC) model 3775 at a flow rate of 0.3 L min−1). PM1 mass concentration calculated based on the volume concentration measured by the SMPS agreed well with that from the sum of compositions by the HR-ToF-AMS and SP2 (r=0.71; slope =0.90).
The gas-phase species, including NOx, O3, and CO were measured in real time by a series of Wuhan Tianhong Instruments Co., Ltd. analysers (TH-2001H, TH-2003H, and TH-2004H, respectively). These instruments were calibrated periodically with the corresponding standard gas to ensure the accuracy of the observation data. In addition, the meteorological parameters including temperature (T), relative humidity (RH), and wind speed and direction were recorded by an automatic weather station.
3.1 Chemical compositions of PM1
The time series of mass concentrations of BC, non-refractory PM1 (NR-PM1) species (i.e., OA, SO, NO, NH, and Cl−) and their relative contributions are summarized in Fig. 1. During this field observation, the mass concentrations of NR-PM1 were in the range of 2.5–44.8 µg m−3, with an average of 12.7±5.7 µg m−3, which is close to those observed in the North China Plain in autumn 2019 (15.1 µg m−3; J. Li et al., 2021), and were much lower than those (41.3±42.7 µg m−3) observed in Beijing in autumn 2012 (Hu et al., 2017). The mean mass concentration of BC was 0.29±0.17 µg m−3, with the range of 0.1–1.0 µg m−3. Among all species in NR-PM1, OA contributed the major (49.2 %), indicating the dominant role of OA in autumn of PM1 pollution in this region. Inorganic aerosol accounted for 50.8 % of NR-PM1 in which sulfate was the largest contributor (21.5 %), followed by nitrate (18.5 %), ammonium (10.7 %), and chloride (0.1 %), which has similar relative contributions to those observed in the field (Chen et al., 2021). The number concentration of all particles peaked at 95±38 nm, with regular growth during every field day. Figure 1 also presents the temporal evolution variation in meteorological parameters. During the field observation period, the average temperature and relative humidity (RH) were 19.3±3.6∘ (11.2–29.4∘) and 75.0 % ± 17.5 % (25.0 %–99.0 %), respectively. The O3 concentration, with an average of 30.7 ± 13.0 ppb (parts per billion), was the highest with 54.5 ppb at 15:00 LT, likely due to the high temperature and enhanced photochemical processing (Zheng et al., 2021).

Figure 1Time series of (a) mass concentrations of O3 and NOx, (b) ambient temperature (T) and relative humidity (RH), and (c) the number size distribution measured by the SMPS. (d) Mass concentrations of key aerosol species (the green left y axis represents OA, and the right y axis represents other aerosol species). (e) Mass fractions of chemical species in non-refractory PM1. (f) Spatial distribution of mean aerosol optical depth (AOD) during the experiment and the clustered 36 h backward trajectories. (g) Diurnal profiles of direct solar radiation and RH.
Figure 1f shows the spatial distribution of the aerosol optical depth (AOD) and 36 h backward trajectories during the campaign. Cluster 1 (C1) shows the circulated air mass with the shortest transport distance for the past 36 h (36 % fraction), C2 is the northerly transported air mass (55 % fraction) over regions with higher AOD, and C3 is the most rapid transport through northeastern China and some coastal areas. It, therefore, separates the periods with more local air mass or influences from regional transport. Figure 1g shows the diurnal variations in the solar radiation and RH, peaking in the day and night, respectively.
3.2 Source attributed organic aerosol
The resolved OA factors by the PMF analysis on the AMS measurements are shown in Figure 2. The first factor is characterized by a prominent hydrocarbon ion series of and (Fig. 2a), with a low OC ratio (0.24), which is generally considered to be related to the emissions of fossil fuel combustion and vehicle emissions (Huang et al., 2010; Morgan et al., 2010; Ng et al., 2011b). The time series of the factor correlated well with NOx (r=0.71) and BC (r=0.83; Fig. 2e and Table S1). The diurnal pattern of this factor showed peaks in the morning and afternoon rush hour (Fig. 2i), with a major increase from 05:30 LT, reaching a peak value of 1.5 µg m−3 at 08:30 LT. The concentration gradually decreased around noontime due to the boundary layer dilution until 15:00 LT, and reached a minimum of 0.6 µg m−3. This spectrum also contained some fragment markers for possible coal combustion OA (CCOA), i.e. C9H ( 115; r=0.73; Hu et al., 2013). This factor was not distinctly resolved in this dataset, perhaps due to the urban nature of the site, where the traffic sources may have overwhelmed other values, due to the less significant coal combustion pollutants during the sampling period.
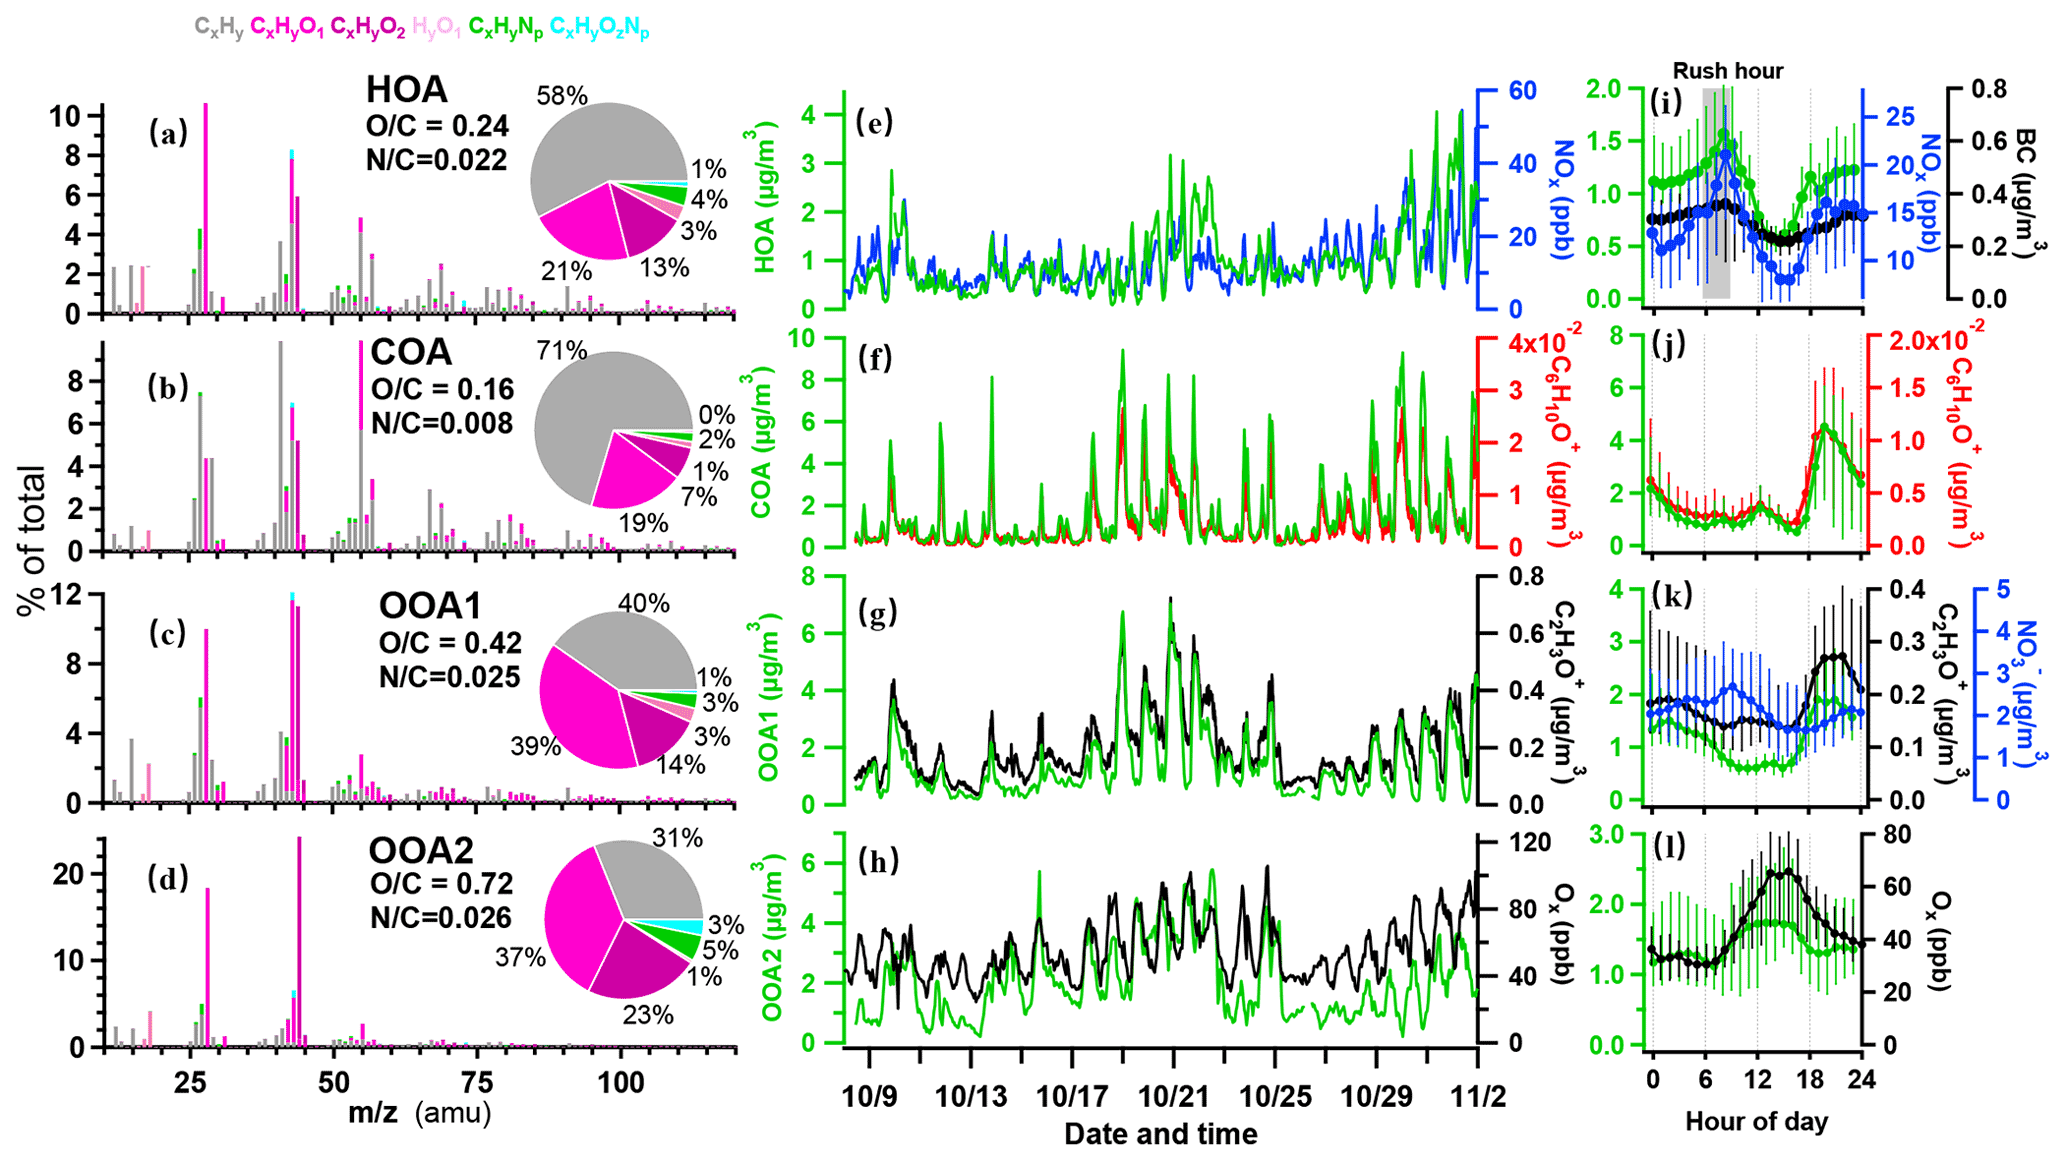
Figure 2Results of source-attributed organic aerosols by the PMF analysis on the OA mass spectra measured by the HR-ToF-AMS. Mass spectra of PMF factors for (a) hydrocarbon-like OA (HOA), (b) cooking OA (COA), (c) oxygenated OA1 (OOA1), and (d) oxygenated OA2 (OOA2). The pie charts show the relative contributions of the six ion categories to each factor. (e–h) Temporal variations in four OA factors (HOA, COA, OOA1, and OOA2), with each correlated species as NOx, C6H10O+, C2H3O+, and Ox. (i–l) Diurnal profiles of NOx, BC, C6H10O+, C2H3O+, NO, and Ox. The lines and whiskers denote the median, the 25th, and the 75th percentiles at each hour, respectively.
The second factor was characterized by 55 (C4H; C3H3O+) and 57 (C4H; C3H5O+), accounting for 10 % and 3.5 % of the total spectrum, respectively (Fig. 2b), with the lowest OC ratio among factors (0.16). This factor has a C3H3OC3H5O+ of 3.0 and C4HC4H of 2.0 (1.0 is usually for HOA), indicating that it is a cooking source rather than HOA (Mohr et al., 2012). The correlation coefficient of the COA factor and marker fragment C6H10O+ was 0.91, which is also similar to a previous study (Sun et al., 2011). The diurnal pattern of this factor showed a major peak during 18:00–20:00 LT, reaching up to 4.0 µg m−3 on average, in addition to a smaller peak at lunchtime, which corroborated the diurnal cooking activities. Previous studies reported that COA accounted for 6.5 %–30 % of the total OA in urban areas (Rogge et al., 1991; Lanz et al., 2008; Allan et al., 2010; Xu et al., 2014). Here the concentrations of COA in OA were in the range of 0.5–4.5 µg m−3 and accounted for 23 % of OA mass fraction on average. The cooking emission in the studying region was likely from charcoal-based grilling activities, which was popular in the surrounding areas.
Besides the two primary OA, two additional oxygenated OA (OOA) factors are identified. According to the oxidation state, OOA was separated into lower (OOA1) and more oxidized (OOA2) factors. The OOA1 factor contained abundant oxygen-containing fragments, accounting for more than 50 % of the total mass spectrum, with an OC ratio of 0.42. In particular, the oxygenated fragment containing one oxygen accounted for 39 %. The C2H3O+ ion ( 43) is an important component of less oxidized SOA (J. Wang et al., 2020), which was highly correlated with OOA1 (r=0.94). OOA1 showed lower concentration during daytime but higher concentration during nighttime (Fig. 2k). Such diurnal variation was similar to that of RH (r=0.45) but opposite to that of solar radiation, which was similar to a previous report (Sun et al., 2014). OOA1 may thus be associated with aqueous reactions when high RH is present. The co-occurrence of a nighttime peak of OOA1 and COA suggested the primary source of cooking emission may have contributed considerably to the production of OOA1.
The factor OOA2 had the highest OC of 0.72 and contained 61 % oxygen-containing fragments (Fig. 2d), which is very similar to the spectra of OOA factors resolved in other cities (0.60 % and 67 % in Mexico City and 0.80 % and 66 % in Pasadena; Aiken et al., 2009; Hayes et al., 2013). This factor was correlated strongly with the fragment of CO (r=0.79). Compared to OOA1, this factor showed obvious diurnal variations with a major enhancement at around noontime (10:00–15:00 LT), up to 2.9 µg m−3, indicating the photochemical production of SOAs during daytime. The variation in OOA2 correlated with odd oxygen (Ox = O3+ NO2; r=0.70), agreeing with previous observations that oxidized OA had strong correlation with Ox (Wood et al., 2010; Hu et al., 2016). Considering the high RH during the experiment (>60 %; Fig. 1g), the OOA2 factor may have also experienced aqueous chemistry and showed a good correlation with sulfate (r=0.82).
3.3 Source-attributed VOCs
Figures 3 and S5 summarize the source attributed of VOCs and key indicators. In total, two primary and three secondary VOC factors were identified. Here, 109 species of VOCs from the PTR-ToF-MS were used, which are mostly oxygenated or contain cyclic functional groups, in contrast with the gas chromatography–mass spectrometry (GC-MS) measurement, which contains many aliphatic hydrocarbon compounds, and usually only decades of species were used for the PMF analysis (Zheng et al., 2021). These may lead to some unsolved primary VOC sources for the current analysis using the PTR-measured VOCs, if the source contained crucial markers of aliphatic species, but this method may have a great advantage in comprehensively resolving factors of secondary VOCs. This may explain the less primary but more secondary VOC factors compared to conventional PMF-resolved VOC sources (Cai et al., 2010).
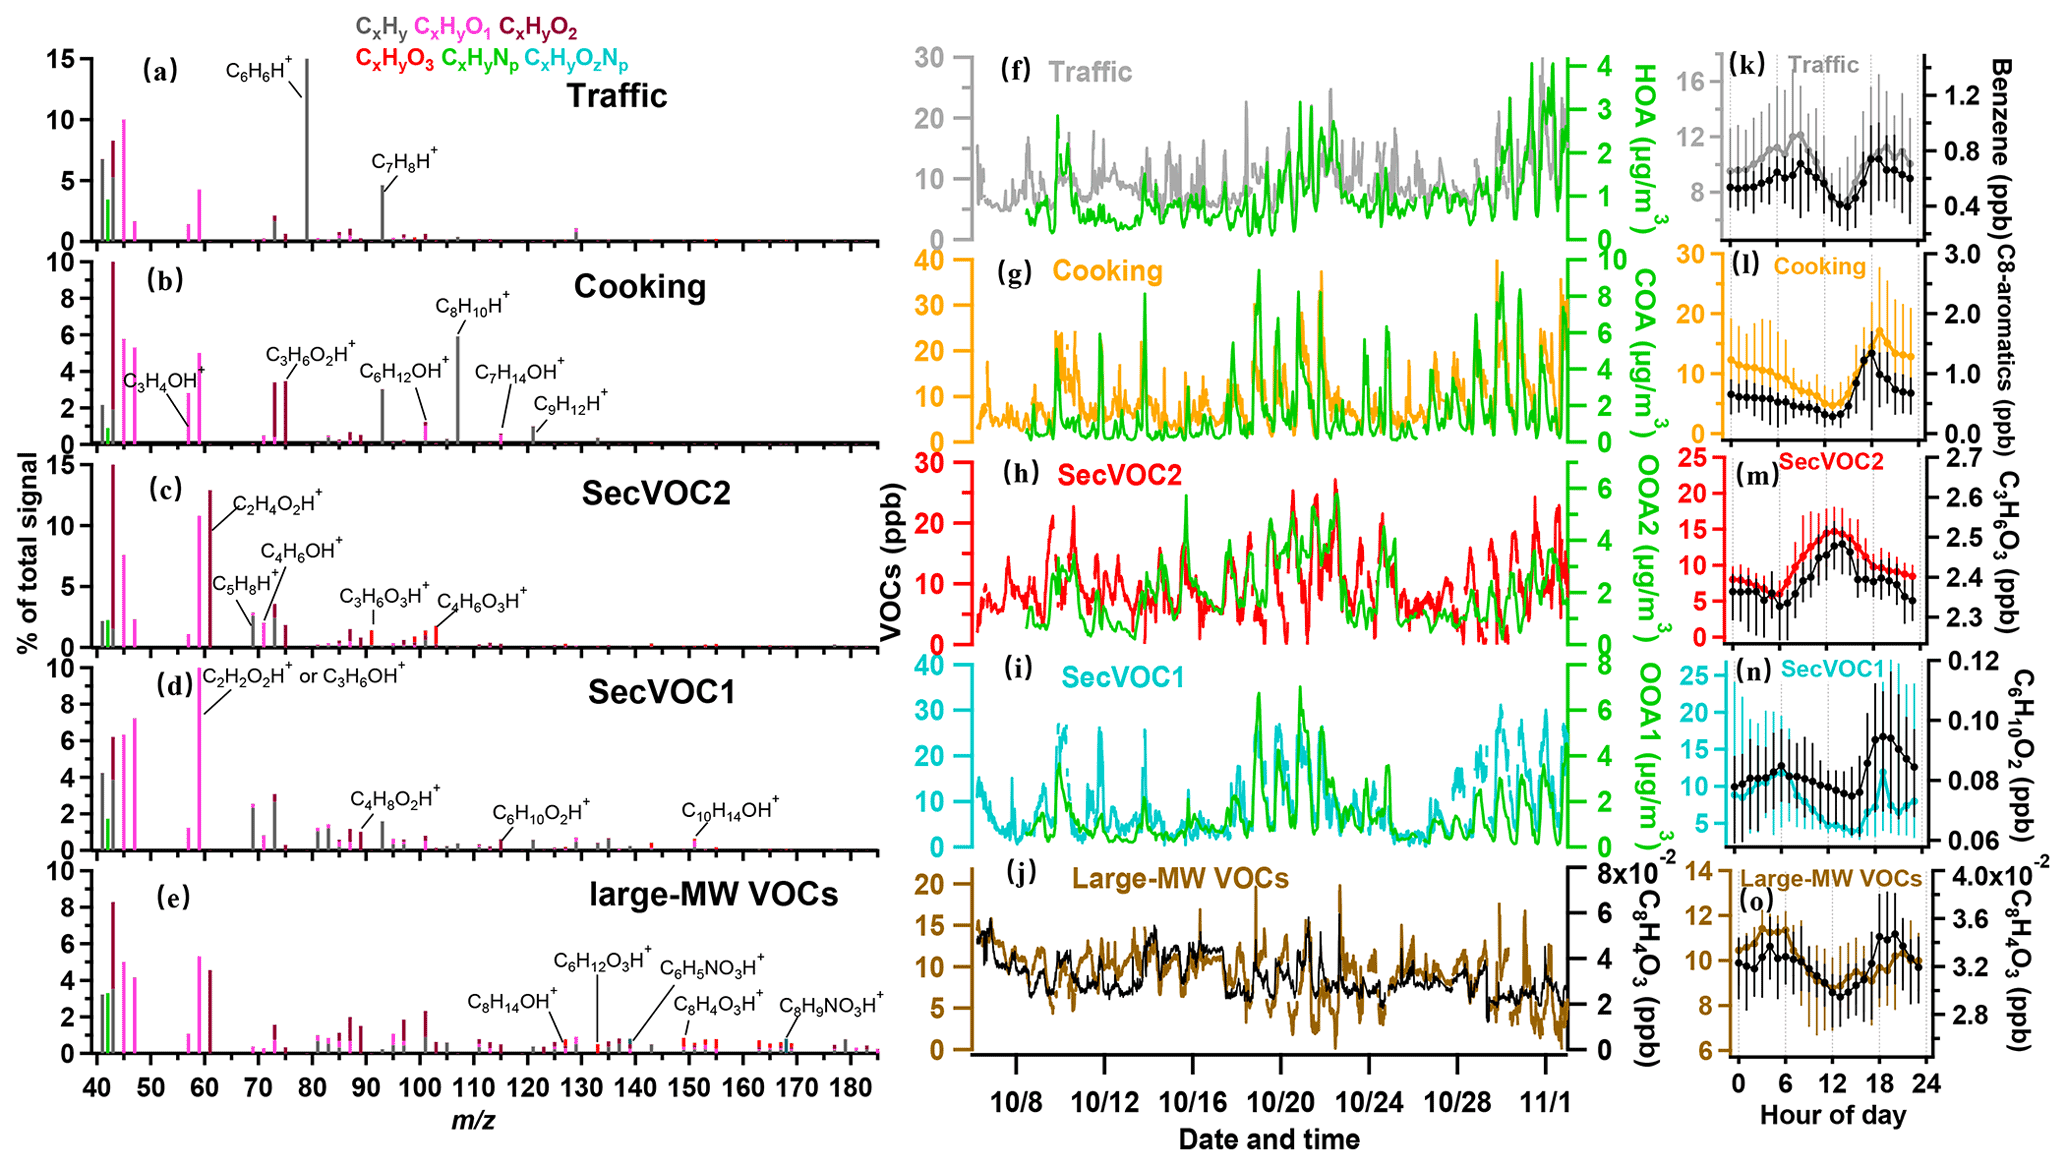
Figure 3Source-attributed VOCs by the PMF analysis measured by the PTR-ToF-MS. (a–e) Mass spectra of the five factors (traffic VOCs, cooking VOCs, and secondary VOCs of SecVOC2 and SecVOC1) and large molecular weight (MW) VOCs (large-MW VOCs), with major fingerprint peaks labelled in the mass spectra. (f–j) Temporal variations in the five VOCs factors and their respective correlated OA species. (k–o) Diurnal profiles of the VOC factors and their respective signature species. The lines and whiskers denote the median, the 25th, and the 75th percentiles at each hour, respectively.
The first factor was dominated by aromatic compounds, such as C6H6 ( 79.054) and C7H8 ( 93.070), as seen in Fig. 3a. They were well-established markers for vehicle emissions (Gkatzelis et al., 2021) and had a good correlation with this factor (r=0.97 and 0.63, respectively; Fig. S6). This factor showed peaks in the morning and afternoon rush hour (Fig. 3k) and was well correlated with HOA and NOx (r=0.63 and 0.53 Table S1). The concentration of this factor had a major increase during the early morning, reaching a peak value of 12.1 ± 1.3 ppb at 08:30 LT, further corroborating the traffic source of this factor. The concentration decreased around noontime until 15:00 LT because of the dilution by the well-developed boundary layer and, in addition, its consumption through photochemical reaction due to intense solar radiation. The diurnal pattern was also high at night; although the peak was lower than early morning, the average concentration was higher by a factor of 2 than during the daytime. This suggests that traffic VOCs are more likely to participate in photochemical reactions, and other primary emissions may be precursors for nocturnal chemistry.
The second factor contained abundant aldehydes such as C3H4O (acrolein), C3H6O2 (hydroxyacetone), C6H12O (hexanal), and C7H14O (heptanal) at 57.069, 75.044, 101.096, and 115.112, respectively, as well as C8H10 (C8 aromatics) and C9H12 (C9 aromatics) at 107.086 and 121.101 in VOC mass spectra (Fig. 3b), which are footprint VOCs identified from primary cooking emissions during charbroiling and frying (Klein et al., 2016). This factor had a similar time series (Fig. 3g) to that of COA and had a high correlation (r=0.67; Table S1). The concentration of this factor decreased during the daytime and increased after 18:00 LT with a peak value at 19:00 LT (17.2 ± 3.0 ppb). As shown in Fig. 3l, the diurnal concentration decreased strongly after the emission and continued to decline throughout the night, suggesting that cooking VOCs may be major precursors and were consumed during the night. Besides the two primary VOCs, three secondary oxygenated VOC (SecVOC) factors are identified. These three factors are not well correlated with any primary factors attributed by the OA and are thus considered to be mainly contributed by secondary production. The daytime biogenic emission, e.g. isoprene, may also contribute to the SecVOC2 formation by interacting with OH in the presence of NOx (Lin et al., 2013), producing methacrylic acid epoxide (MAE) and methacrolein (MACR), as it is intermediately involved in SOA formation (Gu et al., 2021). This factor was thus also contributed by this primary source. SecVOC2 contributed a large fraction of C2H4O2, C3H6O3, and C4H6O3 (Fig. 3c), which were gas phase carboxylic acids, i.e. the oxidation products from photochemical processes (Hartikainen et al., 2018; S. Li et al., 2021). SecVOC2 had one clear peak at 13:00 LT (14.7 ± 2.8 ppb; Fig. 3m). The time series of SecVOC2 correlated well with OOA2 (r=0.67), following the variation of solar radiation. It had a rapid enhancement starting from 07:00 to 12:00 LT and declined continuously after 13:00 LT. This indicated that many of these species can be formed rapidly during the daytime and may have a short lifetime owing to the partitioning to the condensed phase and formation of SOAs.
SecVOC1 factors featured with some less-oxygenated VOCs, e.g. C2H2O2, C6H10O2, and C10H14O (Fig. 3d). This factor had a peak at 19:00 LT, which was consistent with the primary cooking VOCs factor, but also increased throughout the night, peaking at midnight. This factor had a similar temporal trend with OOA1 (r=0.76; Fig. 3i), which was less oxygenated than the photochemistry-dominated OOA2. Combining the features above, SecVOC1 tended to be contributed by some species that reacted immediately from emissions in the late afternoon and evening. A particular factor (Fig. 3e) is significantly composed of large molecular weight (large-MW) oxidized VOCs, i.e. the mean contribution of ionic compounds with >120 was above 50 % in this factor (Fig. S5e), which was much higher than that in SecVOC2 (Fig. S5c). Figure 3e shows its signature compounds of C8H14O, C6H12O3, and C8H4O3, and some are nitrogen-containing VOCs, such as C6H5NO3 and C8H9NO3. These VOCs with >120 tend to be intermediate volatility organic compounds (IVOCs), as the estimated vapour saturation concentration (log10C∗, 298 K) is less than 6.5 µg m−3 (Fig. S2). This factor is hereby termed the large-MW VOCs to indicate the fraction of IVOCs, which only require few oxidation steps to become semi-volatile (Robinson et al., 2007). Figure 3o shows an increase in this factor at midnight, later than the peak of SecVOC1, which may imply the ageing process in producing these VOCs.
3.4 Oxidation process of organics in the day and night
After the source attribution of organics in aerosol and gas phase, we are able to identify the emission structure of primary sources and the consequent evolution. Given that the identified primary traffic and cooking sources were emitted in the morning and late afternoon, respectively, this provides the potential opportunity to study the evolution of different primary sources in the potentially contrasting ageing mechanisms in the day and night.
Figure 4a–d show the temporal evolution of the key factors in a week to reflect the day and night ageing. The OC ratio in the day was higher than that at night by 0.2 (Fig. 4a), corresponding to the increase in highly oxygenated fragments of AMS f44 (CO) in the day (Fig. 4b). During the night, the OC ratio increased, with the increase in the moderately oxygenated fragment f43 (C2H3O+). The diurnal variation in the atomic ratio OC of OA (Fig. 4e) showed a slight decrease during the morning rush hour and a sharp drop at 18:00 LT (by 0.2) due to the significant contribution of the traffic and cooking sources, respectively, corresponding to the two steps in the increase at each time. This variation in OC clearly showed the daytime and nighttime ageing processes of OA for different primary sources. Notably, the OC showed a peak value of 0.54 at 15:00 LT, implying the importance of photooxidation in producing highly oxygenated OA.
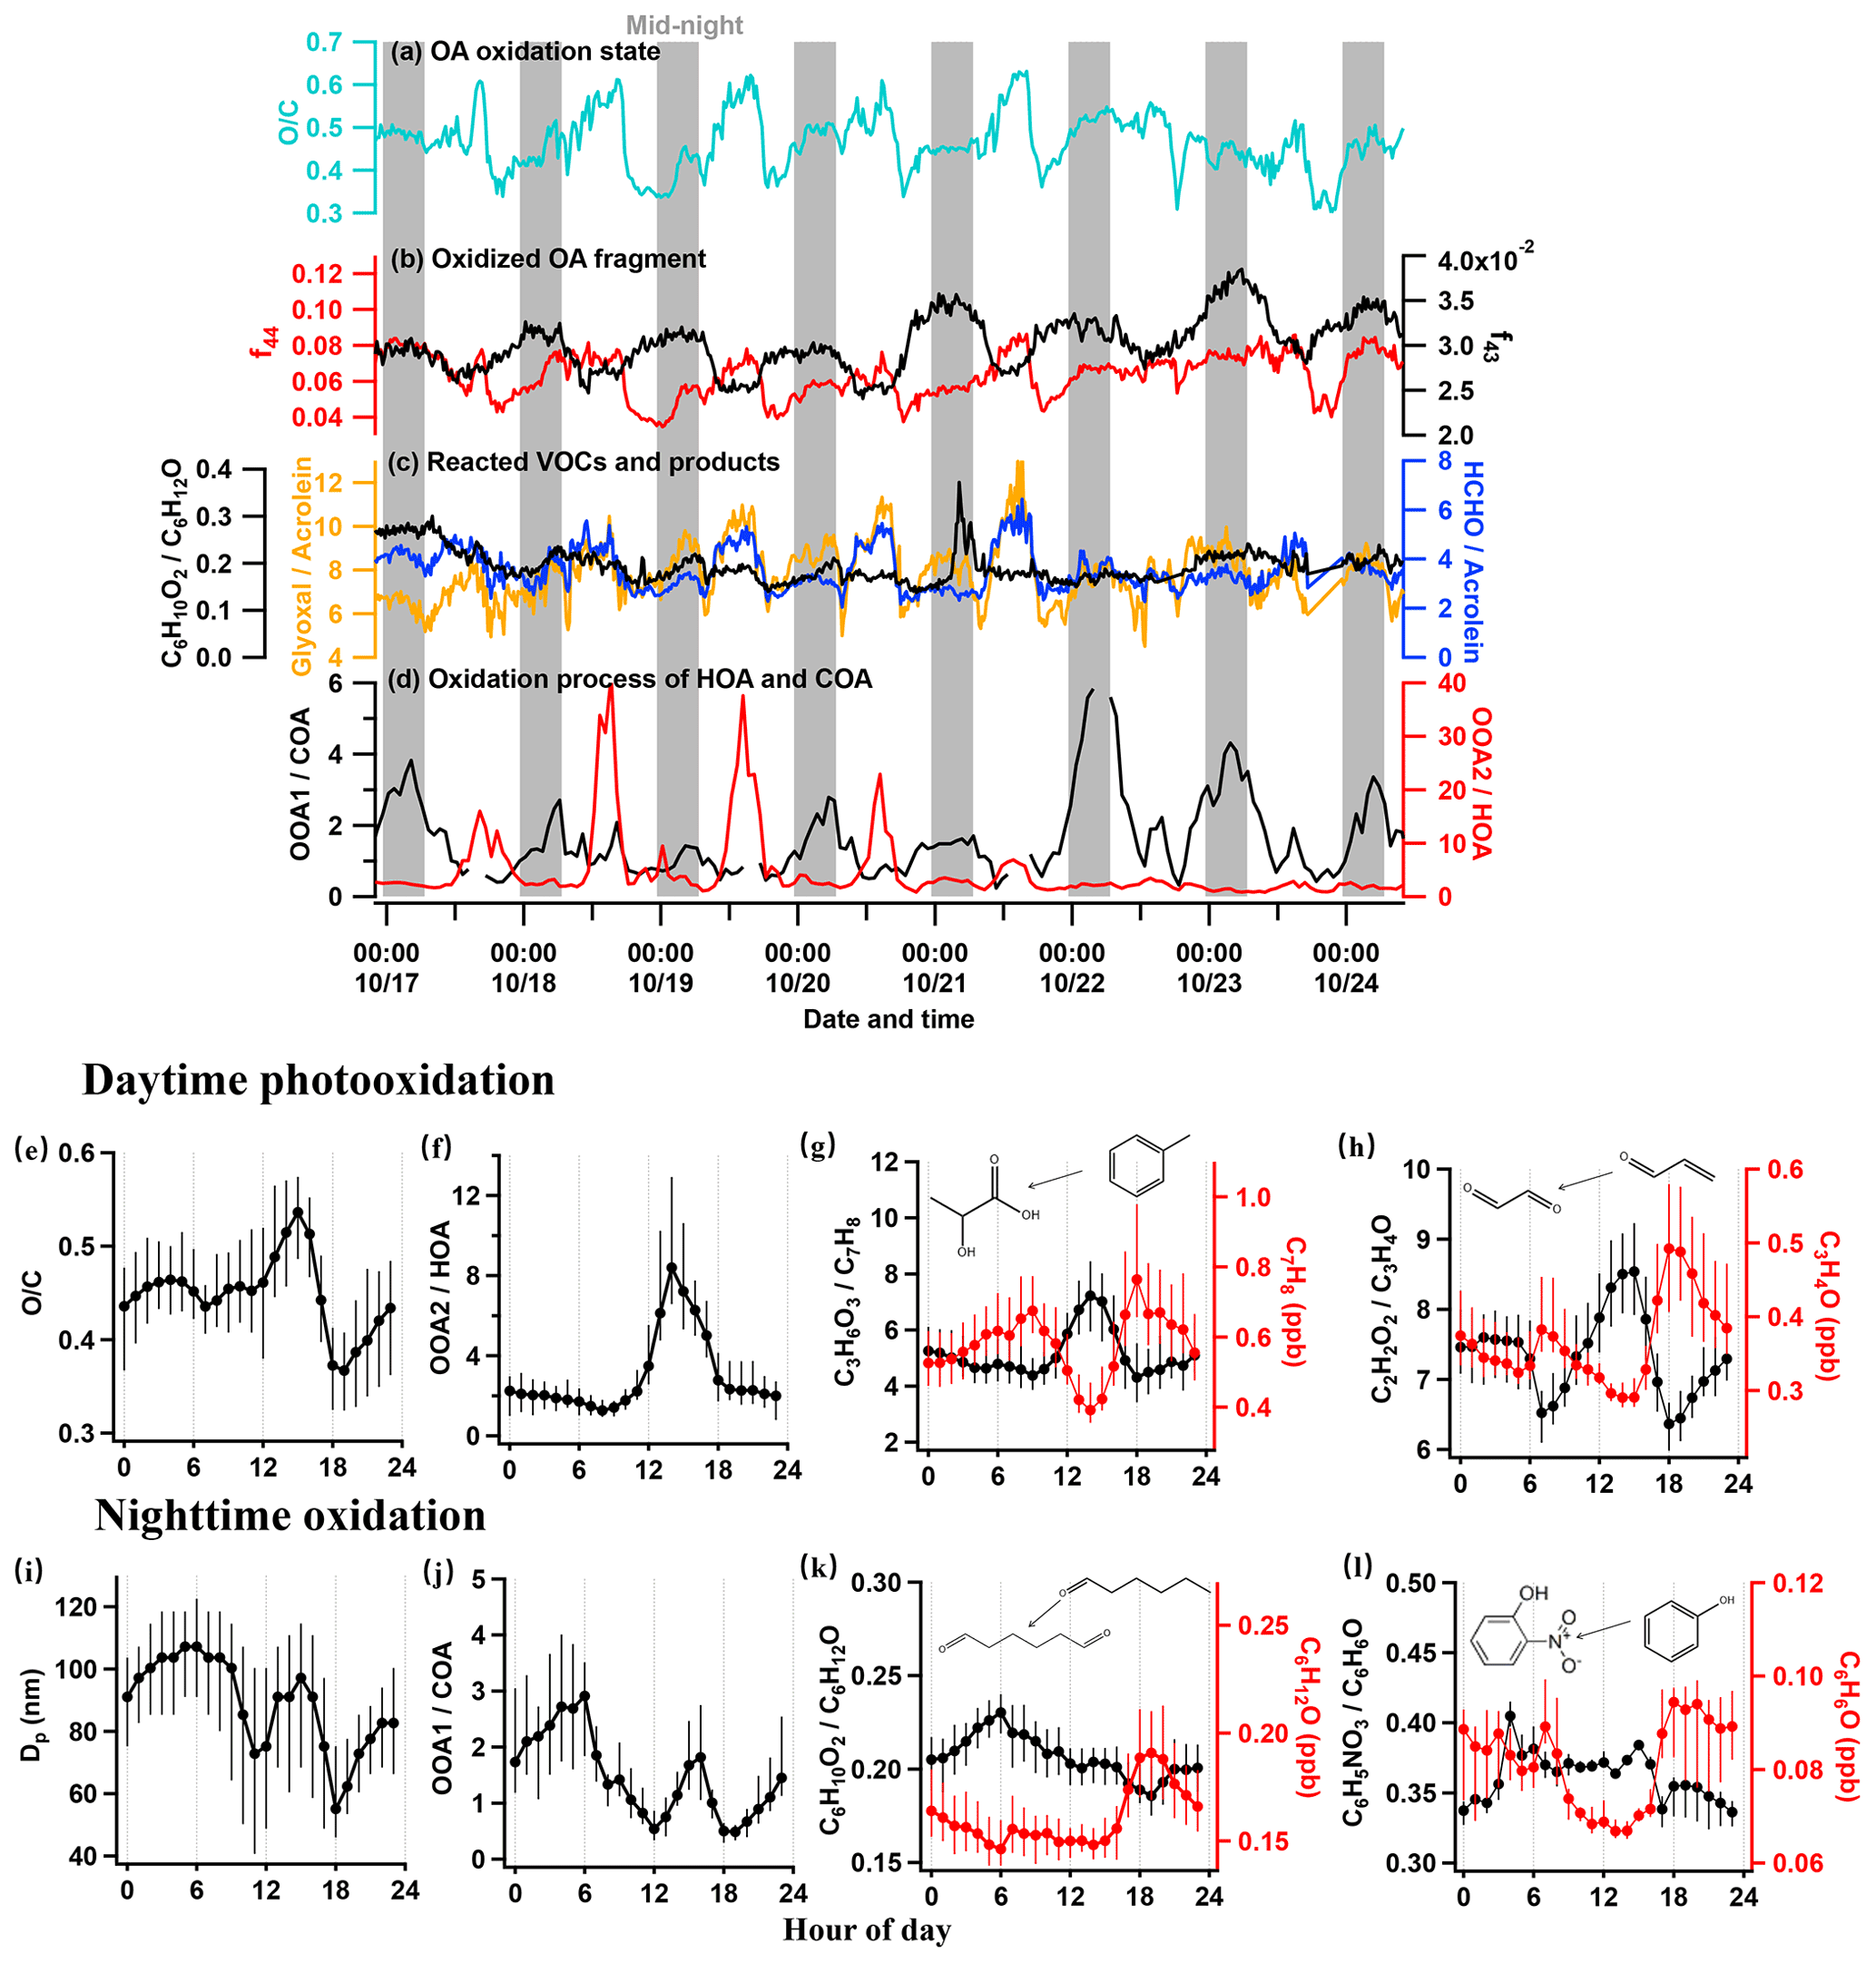
Figure 4Time series showing the ageing of aerosols and gases, with grey vertical bars denoting nighttime (00:00–06:00 LT), (a) the oxygen-to-carbon ratio (OC), (b) the fragment fraction at 44 (f44), 43 (f43), (c) concentration ratio of C6H10O2 to C6H12O (hexanedione to hexanal), glyoxal to acrolein, and formaldehyde to acrolein, and (d) concentration ratio of OOA1 to COA and OOA2 to HOA. Diurnal variations in key species showing the daytime photooxidation and nighttime oxidation, (e) the ratio of OC, (f) the ratio of OOA2 to HOA, (g) the concentration of C7H8 and the ratio of C3H6O3 to C7H8 (hydroxypropionic acid to toluene), (h) the concentration of C3H4O and ratio of C2H2O2 to C3H4O (glyoxal to acrolein), (i) the particle diameter (Dp), (j) the ratio of OOA1 to COA, (k) the concentration of C6H12O and ratio of C6H10O2 to C6H12O (hexanedione to hexanal), and (l) the concentration of C6H6O and ratio of C6H5NO3 to C6H6O (nitrophenol to phenol).
Considering the diurnal pattern of anthropogenic activities, the traffic emission at rush hour is deemed to be the major source contributing to the daytime production of OOA. The ratio OOA2HOA is thus used to indicate the daytime oxidation of OOA. As Fig. 4d and f show that OOA2HOA had a clear peak during the daytime, increased after 08:00 LT, and peaked at 14:00 LT. After 15:00 LT, the ratio gradually decreased to its minimum at 20:00 LT and maintained low levels throughout the night. This clearly demonstrated the photooxidation in producing OOA2 from oxidizing HOA. Figure 4c and g give a few examples of photooxidation in gas phase. The toluene showed the production of C3H6O3 (hydroxypropionic acid) and C4H6O3 (acetic anhydride) by a factor of 2 in 3 h (Fig. S7c), and the C3H4O (acrolein) produced the oxidized product C2H2O2 (glyoxal) by a factor of 1.3 (Fig. 4h). All of these reacted species are from traffic VOCs, and the corresponding products are from SecVOC2. The daytime biogenic emission, e.g. isoprene, may also contribute to the SecVOC2 formation by interacting with OH in the presence of NOx (Lin et al., 2013), producing methacrylic acid epoxide (MAE) as intermediately involved in SOA formation, where a considerable nitrogen content was also found in the OOA2 factor (NC =0.026). Overall, the highly oxidized OOA2 (OC =0.72) is considered to be contributed mainly by the traffic sources via the oxidation of VOCs and partitioning to condensed phase, direct oxidation on HOA through heterogenous oxidation (Guo et al., 2020), or VOCs that have evaporated from HOA and further condensation after oxidation (Zhao et al., 2015). All factors may have contributed to the daytime production of OOA2.
The nocturnal oxidation is mainly contributed by the sources emitting from late afternoon throughout the night. Both traffic and cooking sources had contributed to the emission since late afternoon, with cooking sources being the predominant contributor in both aerosol (Fig. 2j) and gas (Fig. 3l) phases. The ratio between the nighttime OOA1 and cooking aerosol (OOA1COA) is therefore used to indicate the nocturnal oxidation of SOA (Fig. 4d and j). There was a sudden increase in OOA1COA during the daytime because COA was consumed rapidly in the afternoon after a small number of emissions at noon (Fig. 2j). The lowest OOA1COA at 0.5 corresponded with the fresh cooking emissions at 18:00 LT, and it kept increasing until peaking in the early morning at 06:00 LT up to 3, which was an increase by a factor of 6 compared to the minima (Fig. 4j). In addition to evidence for daytime reaction, Figs. 4h and S7d also gave evidence for certain reacted species during the ageing at nighttime. The first-generation oxidation products from acrolein (ACR; C3H4OH+; 57.033) are glyoxal (C2H2O2, 59.036) and formaldehyde (HCHOH+; 31.018) according to the database in the Master Chemical Mechanism (MCM). This night oxidation is also evidenced by the formation of some nitrated organic compounds and ketone compounds, such as C6H5NO3 (nitrophenol – NP; Fig. 4l) and C6H10O2 (hexanedione; Fig. 4k) produced from phenol (C6H6O) and hexanal (C6H12O), respectively. Notably, an important fraction of large molecular weight VOCs (which are mostly intermediate VOCs; Fig. S2) peaked between 03:00 and 04:00 LT (Fig. 3o), consistent with the variation in OOA1COA during night. Some of these nitrated and oxygenated IVOCs may have been further oxidized and partitioned to the aerosol phase, contributing to the OOA1. Given that the larger molecule usually has a lower OC ratio (Hatch et al., 2017; because of a higher content of carbon), this may explain the lower OC observed for nighttime-formed OOA1 (OC =0.42) than OOA2 produced by daytime photooxidation (OC =0.72). Notably, nighttime SOA had a high NC (0.025), implying the NO3⋅ initiated from cooking emissions oxidation, which was different to the organic nitrate formation mechanism during the daytime.
Figure 5 summarizes the key indicators for the contrasting daytime and nighttime oxidation process. The concentrations are normalized by ΔCO, where ΔCO is the total CO concentration subtracted from the background concentration (first percentile of the dataset), to indicate the variation in species regardless of the boundary layer evolution, wind speed, wind direction, and temperature (Gouw and Jimenez, 2009). The odd oxygen Ox (O3+ NO2) has been widely used to generally indicate the activity of daytime photochemistry (Hu et al., 2017), and the enhanced moisture is the main driving factor for nighttime chemistry. The Ox concentration and RH are therefore used as references with which the variations in species were correlated in the day and night, respectively. As Fig. 5a shows, the traffic primary emissions in both gas (traffic VOCs) and aerosol phase (HOA) declined with increased Ox by 60 % and 40 %, respectively, suggesting their roles as precursors in the daytime reaction. The produced species are oxygenated SecVOC2 and OOA2, showing enhancement with Ox, peaking at midday to the afternoon. This process was rapid, as the SOA production increased by a factor of 2.5 and the oxygenated VOCs production increased by a factor of 1.7 within 6 h. The traffic VOCs are widely observed to contribute to SOA production, with aromatic compounds serving as key precursors (Fang et al., 2021). The semi-volatile nature of HOA means it could be evaporated to the gas phase and further oxidized to recondense as SOA (Robinson et al., 2007). The decrease rate of HOA with increased photochemical age was also found in the urban environment (Zhu et al., 2021), generally consistent with the reaction rate in this study. Here we linked the declining rate as a function of photochemical activities for both reacted aerosol and gas phases for traffic sources. The gases evaporated from aerosol phase (especially under higher temperatures when the saturation pressure for semi-volatile or intermediate volatile species increased), and primary VOCs may be simultaneously involved in the photooxidation, further contributing to the SOA formation.
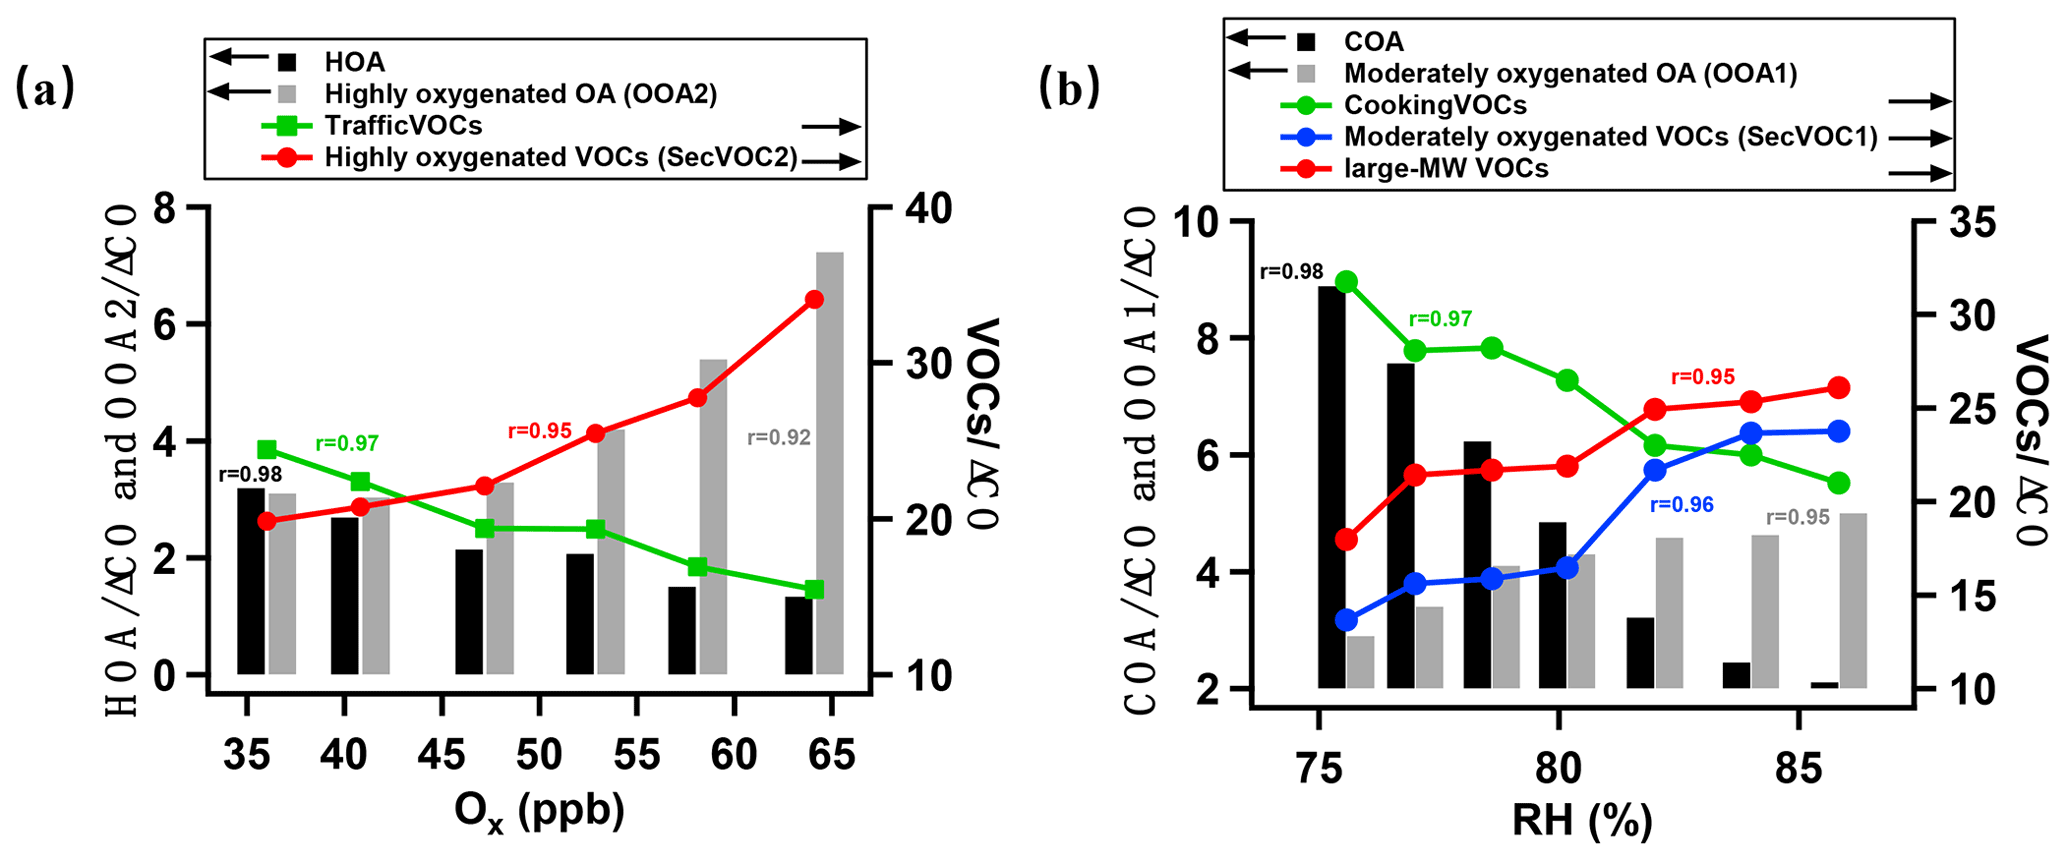
Figure 5Daytime and nighttime evolution of key species against Ox and RH, respectively. (a) Daytime oxidation showing the primary emissions of traffic source in gas and aerosol phases, including HOA, traffic VOCs, and secondary products, including SecVOC2 and OOA2, with concentrations all normalized by ΔCO. (b) Nighttime oxidation showing the primary emissions of cooking source in gas and aerosol phases, including COA and cooking VOCs and secondary products, including SecVOC1, large-MW VOC, and OOA1, with concentrations all normalized by ΔCO.
For the nocturnal oxidation shown in Fig. 5b, the reacted species are cooking VOCs and COA (decrease by 35 % and 77 %, respectively), producing SecVOC1 and large-MW oxygenated VOCs, with an increase in night SOA formation by a factor of 1.7. The nocturnal processes may have largely involved aqueous reactions because the variations in reacted or produced species were highly correlated with RH (r>0.95; Fig. 5b). The large-MW VOCs (mostly IVOCs) increased by 50 % and reached the maxima when RH was highest. This suggests that the moisture may have been involved in converting some primary VOCs to IVOCs, which further contribute to the SOA production during nighttime. Previous studies also found the oxidation of IVOCs from cooking sources can be an important source of SOA (Zhang et al., 2020). The evidence is given here that organic aerosols and gases from cooking emissions had reacted and contributed to SOA. An approximate production rate of 0.2 µg m−3 h−1 of OOA from cooking sources can be obtained by considering the ageing time of ∼10 h (from COA peak 18:00 LT to OOA1 peak 04:00 LT), which was generally consistent with previous laboratory work using gas precursors from cooking sources (0.07–0.5 µg m−3 h−1; Liu et al., 2017). Notably, daytime SOA had a higher oxidation state, implying the importance of photooxidation in producing highly oxidized OA. This may be because of the high temperature at daytime, and a species may require a lower volatility (hereby more oxygenated) to be in the condensed phase than at night.
In this study, organic gases and aerosols were concurrently characterized through online mass spectrometers at a megacity in central China. Through the factorization analysis on the organic mass spectra, two principal sources – traffic and cooking sources – were identified for both aerosol and gas phases; thus the reacted and produced species between phases were interlinked. We observed clear evidence of the daytime and nighttime oxidation of source-attributed OA and VOCs. Daytime photooxidation caused a 60 % decrease in primary aerosol and 40 % in the primary VOC reduction for traffic sources, producing oxygenated SecVOCs that increased by a factor of 1.7 and OOA by a factor of 2.5 in a 6 h photochemical ageing. Nocturnal ageing caused a reduction in primary OA (by 77 %) and primary VOCs (by 35 %) from cooking sources, producing oxygenated VOCs and OOA higher by a factor of 1.4 and 1.7, respectively. In particular, larger molecular IVOCs produced (by a factor of 1.7) at night may contribute to the OOA. This implies that primary species in aerosol and gas phases both contribute to the production of OOA. A higher oxidation state of OOA from daytime photooxidation was found than for nighttime, suggesting different compositions of produced OOA modulated by solar radiation and moisture, respectively. Vehicle and cooking emissions are the major contributors of organic aerosols in urban areas, especially in megacities. These results provide direct observations about the reaction rate for primary precursors and production rate for secondary aerosols, as influenced by primary sources and meteorological conditions. The environmental policy-making should therefore consider the respective primary sources and ageing mechanisms for local and regional atmospheric environmental problems. The particular regulation should be placed to avoid the formation of daytime highly oxidized species when there is high solar radiation, which may contribute to the reactive oxygen species and exert adverse health impacts (Tao et al., 2003; Verma et al., 2009).
The data in this study are available from the corresponding author upon request.
The supplement related to this article is available online at: https://doi.org/10.5194/acp-22-6937-2022-supplement.
DL, SK, and SL led and designed the study. SL, YW, HZ, YC, SZ, and DH set up and conducted the experiment. SL, DL, YW, KH, XJ, and SD contributed to the data analysis. QL, DZ, and JS provided technical support and assistance. SL and DL wrote the draft. All authors read and approved the final paper.
At least one of the (co-)authors is a member of the editorial board of Atmospheric Chemistry and Physics. The peer-review process was guided by an independent editor, and the authors also have no other competing interests to declare.
Publisher’s note: Copernicus Publications remains neutral with regard to jurisdictional claims in published maps and institutional affiliations.
This research has been supported by the National Key R&D Program of China (grant no. 2019YFC0214703) and the National Natural Science Foundation of China (grant nos. 42175116, 41875167 and 42077202).
This paper was edited by Dara Salcedo and reviewed by two anonymous referees.
Adler, G., Flores, J. M., Abo Riziq, A., Borrmann, S., and Rudich, Y.: Chemical, physical, and optical evolution of biomass burning aerosols: a case study, Atmos. Chem. Phys., 11, 1491–1503, https://doi.org/10.5194/acp-11-1491-2011, 2011.
Aiken, A. C., Salcedo, D., Cubison, M. J., Huffman, J. A., DeCarlo, P. F., Ulbrich, I. M., Docherty, K. S., Sueper, D., Kimmel, J. R., Worsnop, D. R., Trimborn, A., Northway, M., Stone, E. A., Schauer, J. J., Volkamer, R. M., Fortner, E., de Foy, B., Wang, J., Laskin, A., Shutthanandan, V., Zheng, J., Zhang, R., Gaffney, J., Marley, N. A., Paredes-Miranda, G., Arnott, W. P., Molina, L. T., Sosa, G., and Jimenez, J. L.: Mexico City aerosol analysis during MILAGRO using high resolution aerosol mass spectrometry at the urban supersite (T0) – Part 1: Fine particle composition and organic source apportionment, Atmos. Chem. Phys., 9, 6633–6653, https://doi.org/10.5194/acp-9-6633-2009, 2009.
Allan, J. D., Williams, P. I., Morgan, W. T., Martin, C. L., Flynn, M. J., Lee, J., Nemitz, E., Phillips, G. J., Gallagher, M. W., and Coe, H.: Contributions from transport, solid fuel burning and cooking to primary organic aerosols in two UK cities, Atmos. Chem. Phys., 10, 647–668, https://doi.org/10.5194/acp-10-647-2010, 2010.
Bruns, E. A., El Haddad, I., Slowik, J. G., Kilic, D., Klein, F., Baltensperger, U., and Prévôt, A. S. H.: Identification of significant precursor gases of secondary organic aerosols from residential wood combustion, Sci. Rep., 6, 1–9, https://doi.org/10.1038/srep27881, 2016.
Cai, C., Geng, F., Tie, X., Yu, Q., and An, J.: Characteristics and source apportionment of VOCs measured in Shanghai, China, Atmos. Environ., 44, 5005–5014, https://doi.org/10.1016/j.atmosenv.2010.07.059, 2010.
Canagaratna, M. R., Jayne, J. T., Jimenez, J. L., Allan, J. D., Alfarra, M. R., Zhang, Q., Onasch, T. B., Drewnick, F., Coe, H., Middlebrook, A., Delia, A., Williams, L. R., Trimborn, A. M., Northway, M. J., DeCarlo, P. F., Kolb, C. E., Davidovits, P., and Worsnop, D. R.: Chemical and microphysical characterization of ambient aerosols with the aerodyne aerosol mass spectrometer, Mass Spectrom. Rev., 26, 185–222, https://doi.org/10.1002/mas.20115, 2007.
Canagaratna, M. R., Jimenez, J. L., Kroll, J. H., Chen, Q., Kessler, S. H., Massoli, P., Hildebrandt Ruiz, L., Fortner, E., Williams, L. R., Wilson, K. R., Surratt, J. D., Donahue, N. M., Jayne, J. T., and Worsnop, D. R.: Elemental ratio measurements of organic compounds using aerosol mass spectrometry: characterization, improved calibration, and implications, Atmos. Chem. Phys., 15, 253–272, https://doi.org/10.5194/acp-15-253-2015, 2015.
Cappellin, L., Karl, T., Probst, M., Ismailova, O., Winkler, P. M., Soukoulis, C., Aprea, E., Mark, T. D., Gasperi, F., and Biasioli, F.: On quantitative determination of volatile organic compound concentrations using proton transfer reaction time-of-flight mass spectrometry, Environ. Sci. Technol., 46, 2283–2290, https://doi.org/10.1021/es203985t, 2012.
Chen, T., Liu, J., Ma, Q., Chu, B., Zhang, P., Ma, J., Liu, Y., Zhong, C., Liu, P., Wang, Y., Mu, Y., and He, H.: Measurement report: Effects of photochemical aging on the formation and evolution of summertime secondary aerosol in Beijing, Atmos. Chem. Phys., 21, 1341–1356, https://doi.org/10.5194/acp-21-1341-2021, 2021.
Claeys, M., Graham, B., Vas, G., Wu, W., Vermeylen, R., Pashynska, V., Cafmeyer, J., Cuyon, P., Andreae, M. O., and Artaxo, P.: Formation of secondary organic aerosols through photooxidation of isoprene, Science, 303, 1173–1176, https://doi.org/10.1126/science.1092805, 2004.
Clark, C. H., Kacarab, M., Nakao, S., Asa-Awuku, A., Sato, K., and Cocker III, D. R.: Temperature effects on secondary organic aerosol (SOA) from the dark ozonolysis and photo-oxidation of isoprene, Environ. Sci. Technol., 50, 5564–5571, https://doi.org/10.1021/acs.est.5b05524, 2016.
Decarlo, P. F., Kimmel, J. R., Trimborn, A., Northway, M. J., Jayne, J. T., Aiken, A. C., Gonin, M., Fuhrer, K., Horvath, T., and Docherty, K. S.: Field-deployable, high-resolution, time-of-flight aerosol mass spectrometer, Anal. Chem., 78, 8281–8289, https://doi.org/10.1021/ac061249n, 2006.
DeCarlo, P. F., Ulbrich, I. M., Crounse, J., de Foy, B., Dunlea, E. J., Aiken, A. C., Knapp, D., Weinheimer, A. J., Campos, T., Wennberg, P. O., and Jimenez, J. L.: Investigation of the sources and processing of organic aerosol over the Central Mexican Plateau from aircraft measurements during MILAGRO, Atmos. Chem. Phys., 10, 5257–5280, https://doi.org/10.5194/acp-10-5257-2010, 2010.
Donahue, N. M., Robinson, A. L., Stanier, C. O., and Pandis, S. N.: Coupled partitioning, dilution, and chemical aging of semivolatile organics, Environ. Sci. Technol., 40, 2635–2643, https://doi.org/10.1021/es052297c, 2006.
Draxler, R. and Hess, G.: Description of the HYSPLIT_4 modelling system, NOAA Technical Memo ERL ARL-224, National Oceanic and Atmospheric Administration, Tech. Rep., Silver Spring, Maryland, USA, 1997.
Fang, H., Huang, X., Zhang, Y., Pei, C., Huang, Z., Wang, Y., Chen, Y., Yan, J., Zeng, J., Xiao, S., Luo, S., Li, S., Wang, J., Zhu, M., Fu, X., Wu, Z., Zhang, R., Song, W., Zhang, G., Hu, W., Tang, M., Ding, X., Bi, X., and Wang, X.: Measurement report: Emissions of intermediate-volatility organic compounds from vehicles under real-world driving conditions in an urban tunnel, Atmos. Chem. Phys., 21, 10005–10013, https://doi.org/10.5194/acp-21-10005-2021, 2021.
Gkatzelis, G. I., Coggon, M. M., McDonald, B. C., Peischl, J., Gilman, J. B., Aikin, K. C., Robinson, M. A., Canonaco, F., Prevot, A. S. H., Trainer, M., and Warneke, C.: Observations confirm that volatile chemical products are a major source of petrochemical emissions in US cities, Environ. Sci. Technol., 55, 4332–4343, https://doi.org/10.1021/acs.est.0c05471, 2021.
Goldstein, A. H. and Galbally, I. E.: Known and Unexplored Organic Constituents in the Earth's Atmosphere, Environ. Sci. Technol., 41, 1514–1521, https://doi.org/10.1021/es072476p, 2007.
Gouw, J. D. and Jimenez, J. L.: Organic aerosols in the earth's atmosphere, Environ. Sci. Technol., 43, 7614–7618, https://doi.org/10.1021/es9006004, 2009.
Gu, C., Wang, S., Zhu, J., Wu, S., Duan, Y., Gao, S., and Zhou, B.: Investigation on the urban ambient isoprene and its oxidation processes, Atmos. Environ., 270, 118870, https://doi.org/10.1016/j.atmosenv.2021.118870, 2021.
Guo, J., Zhou, S., Cai, M., Zhao, J., Song, W., Zhao, W., Hu, W., Sun, Y., He, Y., Yang, C., Xu, X., Zhang, Z., Cheng, P., Fan, Q., Hang, J., Fan, S., Wang, X., and Wang, X.: Characterization of submicron particles by time-of-flight aerosol chemical speciation monitor (ToF-ACSM) during wintertime: aerosol composition, sources, and chemical processes in Guangzhou, China, Atmos. Chem. Phys., 20, 7595–7615, https://doi.org/10.5194/acp-20-7595-2020, 2020.
Hallquist, M., Wenger, J. C., Baltensperger, U., Rudich, Y., Simpson, D., Claeys, M., Dommen, J., Donahue, N. M., George, C., Goldstein, A. H., Hamilton, J. F., Herrmann, H., Hoffmann, T., Iinuma, Y., Jang, M., Jenkin, M. E., Jimenez, J. L., Kiendler-Scharr, A., Maenhaut, W., McFiggans, G., Mentel, Th. F., Monod, A., Prévôt, A. S. H., Seinfeld, J. H., Surratt, J. D., Szmigielski, R., and Wildt, J.: The formation, properties and impact of secondary organic aerosol: current and emerging issues, Atmos. Chem. Phys., 9, 5155–5236, https://doi.org/10.5194/acp-9-5155-2009, 2009.
Hartikainen, A., Yli-Pirilä, P., Tiitta, P., Leskinen, A., Kortelainen, M., Orasche, J., Schnelle-Kreis, J., Lehtinen, K., Zimmermann, R., Jokiniemi, J., and Sippula, O.: Volatile organic compounds from logwood combustion: Emissions and transformation under dark and photochemical aging conditions in a smog chamber, Environ. Sci. Technol., 52, 4979–4988, https://doi.org/10.1021/acs.est.7b06269, 2018.
Hatch, L. E., Yokelson, R. J., Stockwell, C. E., Veres, P. R., Simpson, I. J., Blake, D. R., Orlando, J. J., and Barsanti, K. C.: Multi-instrument comparison and compilation of non-methane organic gas emissions from biomass burning and implications for smoke-derived secondary organic aerosol precursors, Atmos. Chem. Phys., 17, 1471–1489, https://doi.org/10.5194/acp-17-1471-2017, 2017.
Hayes, P. L., Ortega, A. M., Cubison, M. J., Froyd, K. D., Zhao, Y., Cliff, S. S., Hu, W. W., Toohey, D. W., Flynn, J. H., Lefer, B. L., Grossberg, N., Alvarez, S., Rappenglück, B., Taylor, J. W., Allan, J. D., Holloway, J. S., Gilman, J. B., Kuster, W. C., de Gouw, J. A., Massoli, P., Zhang, X., Liu, J., Weber, R. J., Corrigan, A. L., Russell, L. M., Isaacman, G., Worton, D. R., Kreisberg, N. M., Goldstein, A. H., Thalman, R., Waxman, E. M., Volkamer, R., Lin, Y. H., Surratt, J. D., Kleindienst, T. E., Offenberg, J. H., Dusanter, S., Griffith, S., Stevens, P. S., Brioude, J., Angevine, W. M., and Jimenez, J. L.: Organic aerosol composition and sources in Pasadena, California, during the 2010 CalNex campaign, J. Geophys. Res.-Atmos., 118, 9233–9257, https://doi.org/10.1002/jgrd.50530, 2013.
Heald, C. L., Jacob, D. J., Park, R. J., Russell, L. M., Huebert, B. J., Seinfeld, J. H., Liao, H., and Weber, R. J.: A large organic aerosol source in the free troposphere missing from current models, Geophys. Res. Lett., 32, L18809, https://doi.org/10.1029/2005gl023831, 2005.
Hu, D., Liu, D., Kong, S., Zhao, D., Wu, Y., Li, S., Ding, S., Zheng, S., Cheng, Y., Hu, K., Deng, Z., Wu, Y., Tian, P., Liu, Q., Huang, M., and Ding, D.: Direct quantification of droplet activation of ambient black carbon under water supersaturation, J. Geophys. Res.-Atmos., 126, e2021JD034649, https://doi.org/10.1029/2021jd034649, 2021.
Hu, W., Hu, M., Hu, W., Jimenez, J., Yuan, B., Chen, W., Wang, M., Wu, Y., Chen, C., Wang, Z., Peng, J., Zeng, L., and Shao, M.: Chemical composition, sources, and aging process of submicron aerosols in Beijing: Contrast between summer and winter, Journal of Geophysical Research: Atmospheres, 121, 1955–1977, https://doi.org/10.1002/2015JD024020, 2016.
Hu, W., Hu, M., Hu, W.-W., Zheng, J., Chen, C., Wu, Y., and Guo, S.: Seasonal variations in high time-resolved chemical compositions, sources, and evolution of atmospheric submicron aerosols in the megacity Beijing, Atmos. Chem. Phys., 17, 9979–10000, https://doi.org/10.5194/acp-17-9979-2017, 2017.
Hu, W. W., Hu, M., Yuan, B., Jimenez, J. L., Tang, Q., Peng, J. F., Hu, W., Shao, M., Wang, M., Zeng, L. M., Wu, Y. S., Gong, Z. H., Huang, X. F., and He, L. Y.: Insights on organic aerosol aging and the influence of coal combustion at a regional receptor site of central eastern China, Atmos. Chem. Phys., 13, 10095–10112, https://doi.org/10.5194/acp-13-10095-2013, 2013.
Huang, L., Wang, Q., Wang, Y., Emery, C., Zhu, A., Zhu, Y., Yin, S., Yarwood, G., Zhang, K., and Li, L.: Simulation of secondary organic aerosol over the Yangtze River Delta region: The impacts from the emissions of intermediate volatility organic compounds and the SOA modeling framework, Atmos. Environ., 246, 118079, https://doi.org/10.1016/j.atmosenv.2020.118079, 2021.
Huang, R. J., Zhang, Y., Bozzetti, C., Ho, K. F., Cao, J. J., Han, Y., Daellenbach, K. R., Slowik, J. G., Platt, S. M., Canonaco, F., Zotter, P., Wolf, R., Pieber, S. M., Bruns, E. A., Crippa, M., Ciarelli, G., Piazzalunga, A., Schwikowski, M., Abbaszade, G., Schnelle-Kreis, J., Zimmermann, R., An, Z., Szidat, S., Baltensperger, U., El Haddad, I., and Prevot, A. S.: High secondary aerosol contribution to particulate pollution during haze events in China, Nature, 514, 218–222, https://doi.org/10.1038/nature13774, 2014.
Huang, X.-F., He, L.-Y., Hu, M., Canagaratna, M. R., Sun, Y., Zhang, Q., Zhu, T., Xue, L., Zeng, L.-W., Liu, X.-G., Zhang, Y.-H., Jayne, J. T., Ng, N. L., and Worsnop, D. R.: Highly time-resolved chemical characterization of atmospheric submicron particles during 2008 Beijing Olympic Games using an Aerodyne High-Resolution Aerosol Mass Spectrometer, Atmos. Chem. Phys., 10, 8933–8945, https://doi.org/10.5194/acp-10-8933-2010, 2010.
Jayne, J. T., Leard, D. C., Zhang, X., Davidovits, P., Smith, K. A., Kolb, C. E., and Worsnop, D. R.: Development of an aerosol mass spectrometer for size and composition analysis of submicron particles, Aerosol Sci. Tech., 33, 49–70, https://doi.org/10.1080/027868200410840, 2000.
Jokinen, T., Berndt, T., Makkonen, R., Kerminen, V. M., and Sipil, M.: Production of extremely low volatile organic compounds from biogenic emissions: Measured yields and atmospheric implications, P. Natl. Acad. Sci. USA, 112, 7123–7128, https://doi.org/10.1073/pnas.1423977112, 2015.
Klein, F., Platt, S. M., Farren, N. J., Detournay, A., Bruns, E. A., Bozzetti, C., Daellenbach, K. R., Kilic, D., Kumar, N. K., Pieber, S. M., Slowik, J. G., Temime-Roussel, B., Marchand, N., Hamilton, J. F., Baltensperger, U., Prevot, A. S., and El Haddad, I.: Characterization of gas-phase organics using proton transfer reaction time-of-flight mass spectrometry: cooking emissions, Environ. Sci. Technol., 50, 1243–1250, https://doi.org/10.1021/acs.est.5b04618, 2016.
Kroll, J. and Seinfeld, J.: Chemistry of secondary organic aerosol: Formation and evolution of low-volatility organics in the atmosphere, Atmos. Environ., 42, 3593–3624, https://doi.org/10.1016/j.atmosenv.2008.01.003, 2008.
Laborde, M., Schnaiter, M., Linke, C., Saathoff, H., Naumann, K.-H., Möhler, O., Berlenz, S., Wagner, U., Taylor, J. W., Liu, D., Flynn, M., Allan, J. D., Coe, H., Heimerl, K., Dahlkötter, F., Weinzierl, B., Wollny, A. G., Zanatta, M., Cozic, J., Laj, P., Hitzenberger, R., Schwarz, J. P., and Gysel, M.: Single Particle Soot Photometer intercomparison at the AIDA chamber, Atmos. Meas. Tech., 5, 3077–3097, https://doi.org/10.5194/amt-5-3077-2012, 2012.
Lanz, V. A., Alfarra, M. R., Baltensperger, U., Buchmann, B., Hueglin, C., Szidat, S., Wehrli, M. N., Wacker, L., Weimer, S., and Caseiro, A.: Source attribution of submicron organic aerosols during wintertime inversions by advanced factor analysis of aerosol mass spectra, Environ. Sci. Technol., 42, 214–220, https://doi.org/10.1021/es0707207, 2008.
Li, J., Cao, L., Gao, W., He, L., Yan, Y., He, Y., Pan, Y., Ji, D., Liu, Z., and Wang, Y.: Seasonal variations in the highly time-resolved aerosol composition, sources and chemical processes of background submicron particles in the North China Plain, Atmos. Chem. Phys., 21, 4521–4539, https://doi.org/10.5194/acp-21-4521-2021, 2021.
Li, S., Liu, D., Hu, D., Kong, S., Wu, Y., Ding, S., Cheng, Y., Qiu, H., Zheng, S., Yan, Q., Zheng, H., Hu, K., Zhang, J., Zhao, D., Liu, Q., Sheng, J., Ye, J., He, H., and Ding, D.: Evolution of organic aerosol from wood smoke influenced by burning phase and solar radiation, J. Geophys. Res.-Atmos., 126, e2021JD034534, https://doi.org/10.1029/2021JD034534, 2021.
Li, Y., Pöschl, U., and Shiraiwa, M.: Molecular corridors and parameterizations of volatility in the chemical evolution of organic aerosols, Atmos. Chem. Phys., 16, 3327–3344, https://doi.org/10.5194/acp-16-3327-2016, 2016.
Lin, G., Penner, J. E., Sillman, S., Taraborrelli, D., and Lelieveld, J.: Global modeling of SOA formation from dicarbonyls, epoxides, organic nitrates and peroxides, Atmos. Chem. Phys., 12, 4743–4774, https://doi.org/10.5194/acp-12-4743-2012, 2012.
Lin, Y. H., Zhang, H., Pye, H. O., Zhang, Z., Marth, W. J., Park, S., Arashiro, M., Cui, T., Budisulistiorini, S. H., Sexton, K. G., Vizuete, W., Xie, Y., Luecken, D. J., Piletic, I. R., Edney, E. O., Bartolotti, L. J., Gold, A., and Surratt, J. D.: Epoxide as a precursor to secondary organic aerosol formation from isoprene photooxidation in the presence of nitrogen oxides, P. Natl. Acad. Sci. USA, 110, 6718–6723, https://doi.org/10.1073/pnas.1221150110, 2013.
Liu, D., Flynn, M., Gysel, M., Targino, A., Crawford, I., Bower, K., Choularton, T., Jurányi, Z., Steinbacher, M., Hüglin, C., Curtius, J., Kampus, M., Petzold, A., Weingartner, E., Baltensperger, U., and Coe, H.: Single particle characterization of black carbon aerosols at a tropospheric alpine site in Switzerland, Atmos. Chem. Phys., 10, 7389–7407, https://doi.org/10.5194/acp-10-7389-2010, 2010.
Liu, T., Wang, Z., Huang, D. D., Wang, X., and Chan, C. K.: Significant production of secondary organic aerosol from emissions of heated cooking oils, Environ. Sci. Technol. Lett., 5, 32–37, https://doi.org/10.1021/acs.estlett.7b00530, 2017.
Middlebrook, A. M., Bahreini, R., Jimenez, J. L., and Canagaratna, M. R.: Evaluation of composition-dependent collection efficiencies for the aerodyne aerosol mass spectrometer using field data, Aerosol Sci. Tech., 46, 258–271, https://doi.org/10.1080/02786826.2011.620041, 2012.
Mohr, C., DeCarlo, P. F., Heringa, M. F., Chirico, R., Slowik, J. G., Richter, R., Reche, C., Alastuey, A., Querol, X., Seco, R., Peñuelas, J., Jiménez, J. L., Crippa, M., Zimmermann, R., Baltensperger, U., and Prévôt, A. S. H.: Identification and quantification of organic aerosol from cooking and other sources in Barcelona using aerosol mass spectrometer data, Atmos. Chem. Phys., 12, 1649–1665, https://doi.org/10.5194/acp-12-1649-2012, 2012.
Moody, J. L. and Galloway, J. N.: Quantifying the relationship between atmospheric transport and the chemical composition of precipitation on Bermuda, Tellus B, 40, 463–479, https://doi.org/10.1111/j.1600-0889.1988.tb00117.x, 1988.
Morgan, W. T., Allan, J. D., Bower, K. N., Highwood, E. J., Liu, D., McMeeking, G. R., Northway, M. J., Williams, P. I., Krejci, R., and Coe, H.: Airborne measurements of the spatial distribution of aerosol chemical composition across Europe and evolution of the organic fraction, Atmos. Chem. Phys., 10, 4065–4083, https://doi.org/10.5194/acp-10-4065-2010, 2010.
Ng, N. L., Canagaratna, M. R., Jimenez, J. L., Chhabra, P. S., Seinfeld, J. H., and Worsnop, D. R.: Changes in organic aerosol composition with aging inferred from aerosol mass spectra, Atmos. Chem. Phys., 11, 6465–6474, https://doi.org/10.5194/acp-11-6465-2011, 2011a.
Ng, N. L., Canagaratna, M. R., Jimenez, I. L., Zhang, Q., Ulbrich, I. M., and Worsnop, D. R.: Real-time methods for estimating organic component mass concentrations from aerosol mass spectrometer data, Environ. Sci. Technol., 45, 910–916, https://doi.org/10.1021/es102951k, 2011b.
Ortiz-Montalvo, D. L., Hakkinen, S. A., Schwier, A. N., Lim, Y. B., McNeill, V. F., and Turpin, B. J.: Ammonium addition (and aerosol pH) has a dramatic impact on the volatility and yield of glyoxal secondary organic aerosol, Environ. Sci. Technol., 48, 255–262, https://doi.org/10.1021/es4035667, 2014.
Paatero, P. and Tapper, U.: Positive matrix factorization: A non-negative factor model with optimal utilization of error estimates of data values, Environmetrics, 5, 111–126, https://doi.org/10.1002/env.3170050203, 1994.
Poschl, U.: Atmospheric aerosols: composition, transformation, climate and health effects, Angew. Chem. Int. Edit., 44, 7520–7540, https://doi.org/10.1002/anie.200501122, 2005.
Robinson, A. L., Donahue, N. M., Shrivastava, M. K., Weitkamp, E. A., Sage, A. M., Grieshop, A. P., Lane, T. E., Pierce, J. R., and Pandis, S. N.: Rethinking organic aerosols: semivolatile emissions and photochemical aging, Science, 315, 1259–1262, https://doi.org/10.1126/science.1133061, 2007.
Rogge, W. F., Hildemann, L. M., Mazurek, M. A., Cass, G. R., and Simoneit, B.: Sources of fine organic aerosol. 1. Charbroilers and meat cooking operations, Environ. Sci. Technol., 25, 1112–1125, https://doi.org/10.1021/es00018a015, 1991.
Sareen, N., Moussa, S. G., and McNeill, V. F.: Photochemical aging of light-absorbing secondary organic aerosol material, J. Phys. Chem. A., 117, 2987–2996, https://doi.org/10.1021/jp309413j, 2013.
Schwarz, J., Gao, R., Spackman, J. R., Watts, L., Thomson, D. S., Fahey, D., Ryerson, T., Peischl, J., Holloway, J., Trainer, M., Frost, G., Baynard, T., Lack, D., de Gouw, J., Warneke, C., and Del Negro, L.: Measurement of the mixing state, mass, and optical size of individual black carbon particles in urban and biomass burning emissions, Geophys. Res. Lett., 35, L13810, https://doi.org/10.1029/2008GL033968, 2008.
Seinfeld, J., Bretherton, C., Carslaw, K., Coe, H., DeMott, P., Dunlea, E., Feingold, G., Ghan, S., Guenther, A., Kahn, R., Kraucunas, I., Kreidenweis, S., Molina, M., Nenes, A., Penner, J., Prather, K., Ramanathan, V., Ramaswamy, V., Rasch, P., and Wood, R.: Improving our fundamental understanding of the role of aerosol-cloud interactions in the climate system, P. Natl. Acad. Sci. USA, 113, 5781–5790, https://doi.org/10.1073/pnas.1514043113, 2016.
Shrivastava, M., Easter, R. C., Liu, X., Zelenyuk, A., Singh, B., Zhang, K., Ma, P.-L., Chand, D., Ghan, S., Jimenez, J. L., Zhang, Q., Fast, J., Rasch, P. J., and Tiitta, P.: Global transformation and fate of SOA: Implications of low-volatility SOA and gas-phase fragmentation reactions, J. Geophys. Res.-Atmos., 120, 4169–4195, https://doi.org/10.1002/2014jd022563, 2015.
Shrivastava, M., Cappa, C. D., Fan, J., Goldstein, A. H., Guenther, A. B., Jimenez, J. L., Kuang, C., Laskin, A., Martin, S. T., Ng, N. L., Petaja, T., Pierce, J. R., Rasch, P. J., Roldin, P., Seinfeld, J. H., Shilling, J., Smith, J. N., Thornton, J. A., Volkamer, R., Wang, J., Worsnop, D. R., Zaveri, R. A., Zelenyuk, A., and Zhang, Q.: Recent advances in understanding secondary organic aerosol: Implications for global climate forcing, Rev. Geophy., 55, 509–559, https://doi.org/10.1002/2016rg000540, 2017.
Slowik, J. G., Vlasenko, A., McGuire, M., Evans, G. J., and Abbatt, J. P. D.: Simultaneous factor analysis of organic particle and gas mass spectra: AMS and PTR-MS measurements at an urban site, Atmos. Chem. Phys., 10, 1969–1988, https://doi.org/10.5194/acp-10-1969-2010, 2010.
Sun, Y., Jiang, Q., Wang, Z., Fu, P., Li, J., Yang, T., and Yin, Y.: Investigation of the sources and evolution processes of severe haze pollution in Beijing in January 2013, J. Geophys. Res.-Atmos., 119, 4380–4398, https://doi.org/10.1002/2014jd021641, 2014.
Sun, Y.-L., Zhang, Q., Schwab, J. J., Demerjian, K. L., Chen, W.-N., Bae, M.-S., Hung, H.-M., Hogrefe, O., Frank, B., Rattigan, O. V., and Lin, Y.-C.: Characterization of the sources and processes of organic and inorganic aerosols in New York city with a high-resolution time-of-flight aerosol mass apectrometer, Atmos. Chem. Phys., 11, 1581–1602, https://doi.org/10.5194/acp-11-1581-2011, 2011.
Tao, F., Gonzalez-Flecha, B., and Kobzik, L.: Reactive oxygen species in pulmonary inflammation by ambient particulates, Free Radical Bio. Med., 35, 327–340, https://doi.org/10.1016/S0891-5849(03)00280-6, 2003.
Ulbrich, I. M., Canagaratna, M. R., Zhang, Q., Worsnop, D. R., and Jimenez, J. L.: Interpretation of organic components from Positive Matrix Factorization of aerosol mass spectrometric data, Atmos. Chem. Phys., 9, 2891–2918, https://doi.org/10.5194/acp-9-2891-2009, 2009.
Verma, V., Ning, Z., Cho, A. K., Schauer, J. J., Shafer, M. M., and Sioutas, C.: Redox activity of urban quasi-ultrafine particles from primary and secondary sources, Atmos. Environ., 43, 6360–6368, https://doi.org/10.1016/j.atmosenv.2009.09.019, 2009.
von Schneidemesser, E., Monks, P. S., Gros, V., Gauduin, J., and Sanchez, O.: How important is biogenic isoprene in an urban environment? A study in London and Paris, Geophys. Res. Lett., 38, L19804, https://doi.org/10.1029/2011gl048647, 2011.
Wang, J., Ye, J., Liu, D., Wu, Y., Zhao, J., Xu, W., Xie, C., Shen, F., Zhang, J., Ohno, P. E., Qin, Y., Zhao, X., Martin, S. T., Lee, A. K. Y., Fu, P., Jacob, D. J., Zhang, Q., Sun, Y., Chen, M., and Ge, X.: Characterization of submicron organic particles in Beijing during summertime: comparison between SP-AMS and HR-AMS, Atmos. Chem. Phys., 20, 14091–14102, https://doi.org/10.5194/acp-20-14091-2020, 2020.
Wang, J., Ye, J., Zhang, Q., Zhao, J., Wu, Y., Li, J., Liu, D., Li, W., Zhang, Y., Wu, C., Xie, C., Qin, Y., Lei, Y., Huang, X., Guo, J., Liu, P., Fu, P., Li, Y., Lee, H. C., Choi, H., Zhang, J., Liao, H., Chen, M., Sun, Y., Ge, X., Martin, S. T., and Jacob, D. J.: Aqueous production of secondary organic aerosol from fossil-fuel emissions in winter Beijing haze, P. Natl. Acad. Sci. USA, 118, e2022179118, https://doi.org/10.1073/pnas.2022179118, 2021.
Wang, L., Slowik, J. G., Tripathi, N., Bhattu, D., Rai, P., Kumar, V., Vats, P., Satish, R., Baltensperger, U., Ganguly, D., Rastogi, N., Sahu, L. K., Tripathi, S. N., and Prévôt, A. S. H.: Source characterization of volatile organic compounds measured by proton-transfer-reaction time-of-flight mass spectrometers in Delhi, India, Atmos. Chem. Phys., 20, 9753–9770, https://doi.org/10.5194/acp-20-9753-2020, 2020.
Wood, E. C., Canagaratna, M. R., Herndon, S. C., Onasch, T. B., Kolb, C. E., Worsnop, D. R., Kroll, J. H., Knighton, W. B., Seila, R., Zavala, M., Molina, L. T., DeCarlo, P. F., Jimenez, J. L., Weinheimer, A. J., Knapp, D. J., Jobson, B. T., Stutz, J., Kuster, W. C., and Williams, E. J.: Investigation of the correlation between odd oxygen and secondary organic aerosol in Mexico City and Houston, Atmos. Chem. Phys., 10, 8947–8968, https://doi.org/10.5194/acp-10-8947-2010, 2010.
Xu, J., Zhang, Q., Chen, M., Ge, X., Ren, J., and Qin, D.: Chemical composition, sources, and processes of urban aerosols during summertime in northwest China: insights from high-resolution aerosol mass spectrometry, Atmos. Chem. Phys., 14, 12593–12611, https://doi.org/10.5194/acp-14-12593-2014, 2014.
Xu, W., Sun, Y., Wang, Q., Zhao, J., Wang, J., Ge, X., Xie, C., Zhou, W., Du, W., Li, J., Fu, P., Wang, Z., Worsnop, D. R., and Coe, H.: Changes in aerosol chemistry from 2014 to 2016 in winter in Beijing: Insights from high-resolution aerosol mass spectrometry, J. Geophys. Res.-Atmos., 124, 1132–1147, https://doi.org/10.1029/2018jd029245, 2019.
Zhang, Q., Jimenez, J. L., Canagaratna, M. R., Allan, J. D., Coe, H., Ulbrich, I., Alfarra, M. R., Takami, A., Middlebrook, A. M., Sun, Y. L., Dzepina, K., Dunlea, E., Docherty, K., DeCarlo, P. F., Salcedo, D., Onasch, T., Jayne, J. T., Miyoshi, T., Shimono, A., Hatakeyama, S., Takegawa, N., Kondo, Y., Schneider, J., Drewnick, F., Borrmann, S., Weimer, S., Demerjian, K., Williams, P., Bower, K., Bahreini, R., Cottrell, L., Griffin, R. J., Rautiainen, J., Sun, J. Y., Zhang, Y. M., and Worsnop, D. R.: Ubiquity and dominance of oxygenated species in organic aerosols in anthropogenically-influenced Northern Hemisphere midlatitudes, Geophys. Res. Lett., 34, L13801, https://doi.org/10.1029/2007gl029979, 2007.
Zhang, Z., Zhu, W., Hu, M., Wang, H., Chen, Z., Shen, R., Yu, Y., Tan, R., and Guo, S.: Secondary organic aerosol from typical Chinese domestic cooking emissions, Environ. Sci. Technol. Lett., 8, 24–31, https://doi.org/10.1021/acs.estlett.0c00754, 2020.
Zhao, Y., Nguyen, N. T., Presto, A. A., Hennigan, C. J., May, A. A., and Robinson, A. L.: Intermediate volatility organic compound emissions from on-road diesel vehicles: chemical composition, emission factors, and estimated secondary organic aerosol production, Environ. Sci. Technol., 49, 11516–11526, https://doi.org/10.1021/acs.est.5b02841, 2015.
Zheng, H., Kong, S., Yan, Q., Wu, F., Cheng, Y., Zheng, S., Wu, J., Yang, G., Zheng, M., Tang, L., Yin, Y., Chen, K., Zhao, T., Liu, D., Li, S., Qi, S., Zhao, D., Zhang, T., Ruan, J., and Huang, M.: The impacts of pollution control measures on PM2.5 reduction: Insights of chemical composition, source variation and health risk, Atmos. Environ., 197, 103–117, https://doi.org/10.1016/j.atmosenv.2018.10.023, 2019.
Zheng, H., Kong, S., Chen, N., Yan, Y., Liu, D., Zhu, B., Xu, K., Cao, W., Ding, Q., Lan, B., Zhang, Z., Zheng, M., Fan, Z., Cheng, Y., Zheng, S., Yao, L., Bai, Y., Zhao, T., and Qi, S.: Significant changes in the chemical compositions and sources of PM2.5 in Wuhan since the city lockdown as COVID-19, Sci. Total. Environ., 739, 140000, https://doi.org/10.1016/j.scitotenv.2020.140000, 2020.
Zheng, H., Kong, S., Chen, N., Niu, Z., Zhang, Y., Jiang, S., Yan, Y., and Qi, S.: Source apportionment of volatile organic compounds: Implications to reactivity, ozone formation, and secondary organic aerosol potential, Atmos. Res., 249, 105344, https://doi.org/10.1016/j.atmosres.2020.105344, 2021.
Zhou, X., Li, Z., Zhang, T., Wang, F., Wang, F., Tao, Y., Zhang, X., Wang, F., and Huang, J.: Volatile organic compounds in a typical petrochemical industrialized valley city of northwest China based on high-resolution PTR-MS measurements: Characterization, sources and chemical effects, Sci. Total. Environ., 671, 883–896, https://doi.org/10.1016/j.scitotenv.2019.03.283, 2019.
Zhu, W., Guo, S., Zhang, Z., Wang, H., Yu, Y., Chen, Z., Shen, R., Tan, R., Song, K., Liu, K., Tang, R., Liu, Y., Lou, S., Li, Y., Zhang, W., Zhang, Z., Shuai, S., Xu, H., Li, S., Chen, Y., Hu, M., Canonaco, F., and Prévôt, A. S. H.: Mass spectral characterization of secondary organic aerosol from urban cooking and vehicular sources, Atmos. Chem. Phys., 21, 15065–15079, https://doi.org/10.5194/acp-21-15065-2021, 2021.