the Creative Commons Attribution 4.0 License.
the Creative Commons Attribution 4.0 License.
 | 17 Jan 2022
Eight-year variations in atmospheric radiocesium in Fukushima city
Akira Watanabe
Kazuhiko Ninomiya
Yoshitaka Nagahashi
Atsushi Shinohara
After the Fukushima nuclear accident, atmospheric 134Cs and 137Cs measurements were taken in Fukushima city for 8 years, from March 2011 to March 2019. The airborne surface concentrations and deposition of radiocesium (radio-Cs) were high in winter and low in summer; these trends are the opposite of those observed in a contaminated forest area. The effective half-lives of 137Cs in the concentrations and deposition before 2015 (0.754 and 1.30 years, respectively) were significantly shorter than those after 2015 (2.07 and 4.69 years, respectively), which was likely because the dissolved radio-Cs was discharged from the local terrestrial ecosystems more rapidly than the particulate radio-Cs. In fact, the dissolved fractions of precipitation were larger than the particulate fractions before 2015, but the particulate fractions were larger after 2016. X-ray fluorescence analysis suggested that biotite may have played a key role in the environmental behavior of particulate forms of radio-Cs after 2014. However, the causal relationship between the seasonal variations in particle size distributions and the possible sources of particles is not yet fully understood. The current study also proposes an evaluation method of the consistency of a numerical model for radio-Cs resuspension and suggests that improvements to the model are necessary.
- Article
(6745 KB) - Full-text XML
-
Supplement
(366 KB) - BibTeX
- EndNote


We conducted measurements of atmospheric 134Cs and 137Cs in Fukushima city for 8 years following the Fukushima Daiichi Nuclear Power Plant (FDNPP) accident that occurred in March 2011 in order to understand the time variations in and emission sources of 134Cs and 137Cs and to propose effective ways to reduce atmospheric radioactivity. Among the various radionuclides released to the environment, radiocesium (radio-Cs) is particularly important due to its abundance in terrestrial ecosystems (the impacts of other nuclides were negligibly small 100 d after the accident; Yoshimura et al., 2020), long half-life (2.06 years for 134Cs and 30.17 years for 137Cs), and bioaccumulation (accumulation in muscle tissues, with a biological half-life of 30–150 d; WHO, 2001). Radio-Cs forms aerosols in the air and is, therefore, efficiently deposited onto the ground surface by precipitation (wet deposition) or under dry weather conditions (dry deposition). Approximately 30 % of the radio-Cs released in March 2011 was deposited onto the ground surface in Japan; the aircraft-measured deposition on the ground was 2.7 PBq for 137Cs (NRA, 2012), and the most updated estimate of 137Cs emissions by the Japan Atomic Energy Agency is 10 PBq (Terada et al., 2020). The activity of 134Cs in the environment was equivalent to that of 137Cs in March 2011. Once radio-Cs is deposited onto the ground surface, it circulates within local terrestrial ecosystems, so the discharge from the local environment to downstream or downwind regions is not expected to be significant: 0.02 % yr−1–0.3 % yr−1 to rivers (Iwagami et al., 2017) or approximately 1 % yr−1 to the atmosphere1. Thus, long-term monitoring of atmospheric radio-Cs at even one station may allow us to understand the mechanisms of its circulation in the local terrestrial ecosystems, to estimate the external and inhalation exposure risks to the local residents, to propose efficient ways to reduce health risks to the residents, and to assess the effectiveness of decontamination efforts.
To date, a great number of studies have focused on the circulation of radio-Cs in terrestrial ecosystems (Onda et al., 2020). In terms of the long-term monitoring of atmospheric radio-Cs with a focus on resuspension from the ground surface to the atmosphere, several papers have been published and are outlined in the following. Based on atmospheric measurements taken in the contaminated forest area of the Abukuma Highlands (30 km northwest of the FDNPP) from October 2012 to December 2014, Ochiai et al. (2016) reported that the airborne surface concentrations of 137Cs were higher in summer and lower in winter and that the time variations in the fine mode (<1.1 µm in diameter using an impactor) and coarse mode (>1.1 µm) behaved differently: the coarse-mode fractions were larger in summer, and the fine-mode fractions were larger in winter. Kinase et al. (2018) conducted concentration measurements at four locations in the forest area of the Abukuma Highlands from July 2011 to March 2014 and found that the concentrations of 134Cs and 137Cs were lower in winter and early spring and higher from late spring to autumn. Their size-resolved measurements with a six-stage cascade impactor showed that the backup filter (<0.39 µm) concentrations were high in winter, consistent with Ochiai et al. (2016). However, using scanning electron microscopy (SEM), Kinase et al. (2018) found that there were significant amounts of soil dust particles in the backup filter; these particles were larger but bounced off the upper impactor stages. Therefore, they concluded that the sizes of radioactive particles were not small but were actually large (coarse-mode particles). In late spring, the concentrations were positively correlated with the wind speed, so they concluded that the wind-blown soil particles carried radio-Cs in this season. In the summer and autumn, the concentrations were positively correlated with temperature but negatively correlated with wind speed, so they concluded that the resuspension mechanisms were different in the winter and summer. The SEM analysis revealed that there were more abundant bioaerosols in summer than in winter. Based on simulations, Kaijno et al. (2016) indicated that the summer peaks in concentrations in the Abukuma Highlands could be accounted for by bioaerosol emissions from forest ecosystems, even though the emission mechanism remains unknown. Igarashi et al. (2019a) further investigated the mechanisms of bioaerosol emissions in forests in summer using fluorescent optical microscopic observation and high-throughput DNA sequencing techniques. They suggested that the fungal spores that accumulate radio-Cs may be significantly involved in resuspension in the forest in summer. Kita et al. (2020) suggested that rain induced the emission of radio-Cs associated with fungal spores in the forest in summer. Minami et al. (2020) combined aerosol flux measurements and a multilayer atmosphere–soil–vegetation model and estimated that the bioaerosol emission flux was on the order of 10−2 , which could account for the concentrations of 137Cs in the forests in summer (Kajino et al., 2016; Kinase et al., 2018; Igarashi et al., 2019a). Kinase et al. (2018) also showed that there was no enhancement in the 137Cs concentration associated with forest fire events in the region. The concentration of 137Cs was not correlated with that of levoglucosan, which is often used as a marker of biomass burning. Certainly, it is not indicated that the forest fire did not reemit radio-Cs, as wildfire in fact played a key role in the migration of radio-Cs in the Chernobyl case (Ager et al., 2019; Igarashi et al., 2020). The contributions of additional 137Cs emissions from the nuclear reactor buildings of FDNPP to the concentrations in Japan were negligibly small compared with resuspension from the ground surface (Kajino et al., 2016). On the other hand, unintentional emissions on the premises of the FDNPP, such as debris removal operations, contributed to some observed sporadic peaks (Steinhauser et al., 2015; Kajino et al., 2016), although the impacts of such events might be small in terms of long-term averages and trends.
The current study is distinct from other studies, as it includes long-term comprehensive measurements (time-resolved and size-resolved measurements of airborne surface concentrations as well as measurements of dissolved and particulate forms of activity in precipitation) at an urban/rural location in the Fukushima Basin in the vicinity of contaminated forests in the Abukuma Highlands. The field observation and the simulation methods are described in Sect. 2. Section 3 presents the results for the concentrations (Sect. 3.1), deposition amounts (Sect. 3.2), size distribution (Sect. 3.3), chemical compositions (Sect. 3.4), comparison with simulations (Sect. 3.5), and comparison with measurements taken outside Fukushima Prefecture (Sect. 3.6). The seasonal variations and possible emission sources are discussed in Sect. 4.1, the impacts of decontamination and natural variations on the differences in trends before and after approximately 2015 are discussed in Sect. 4.2, the reasons for the substantial deposition amount in January in Fukushima city are discussed in Sect. 4.3, and major findings and future issues are summarized in Sect. 5. The observation data used in the study are provided as a Microsoft Excel file in the Supplement.
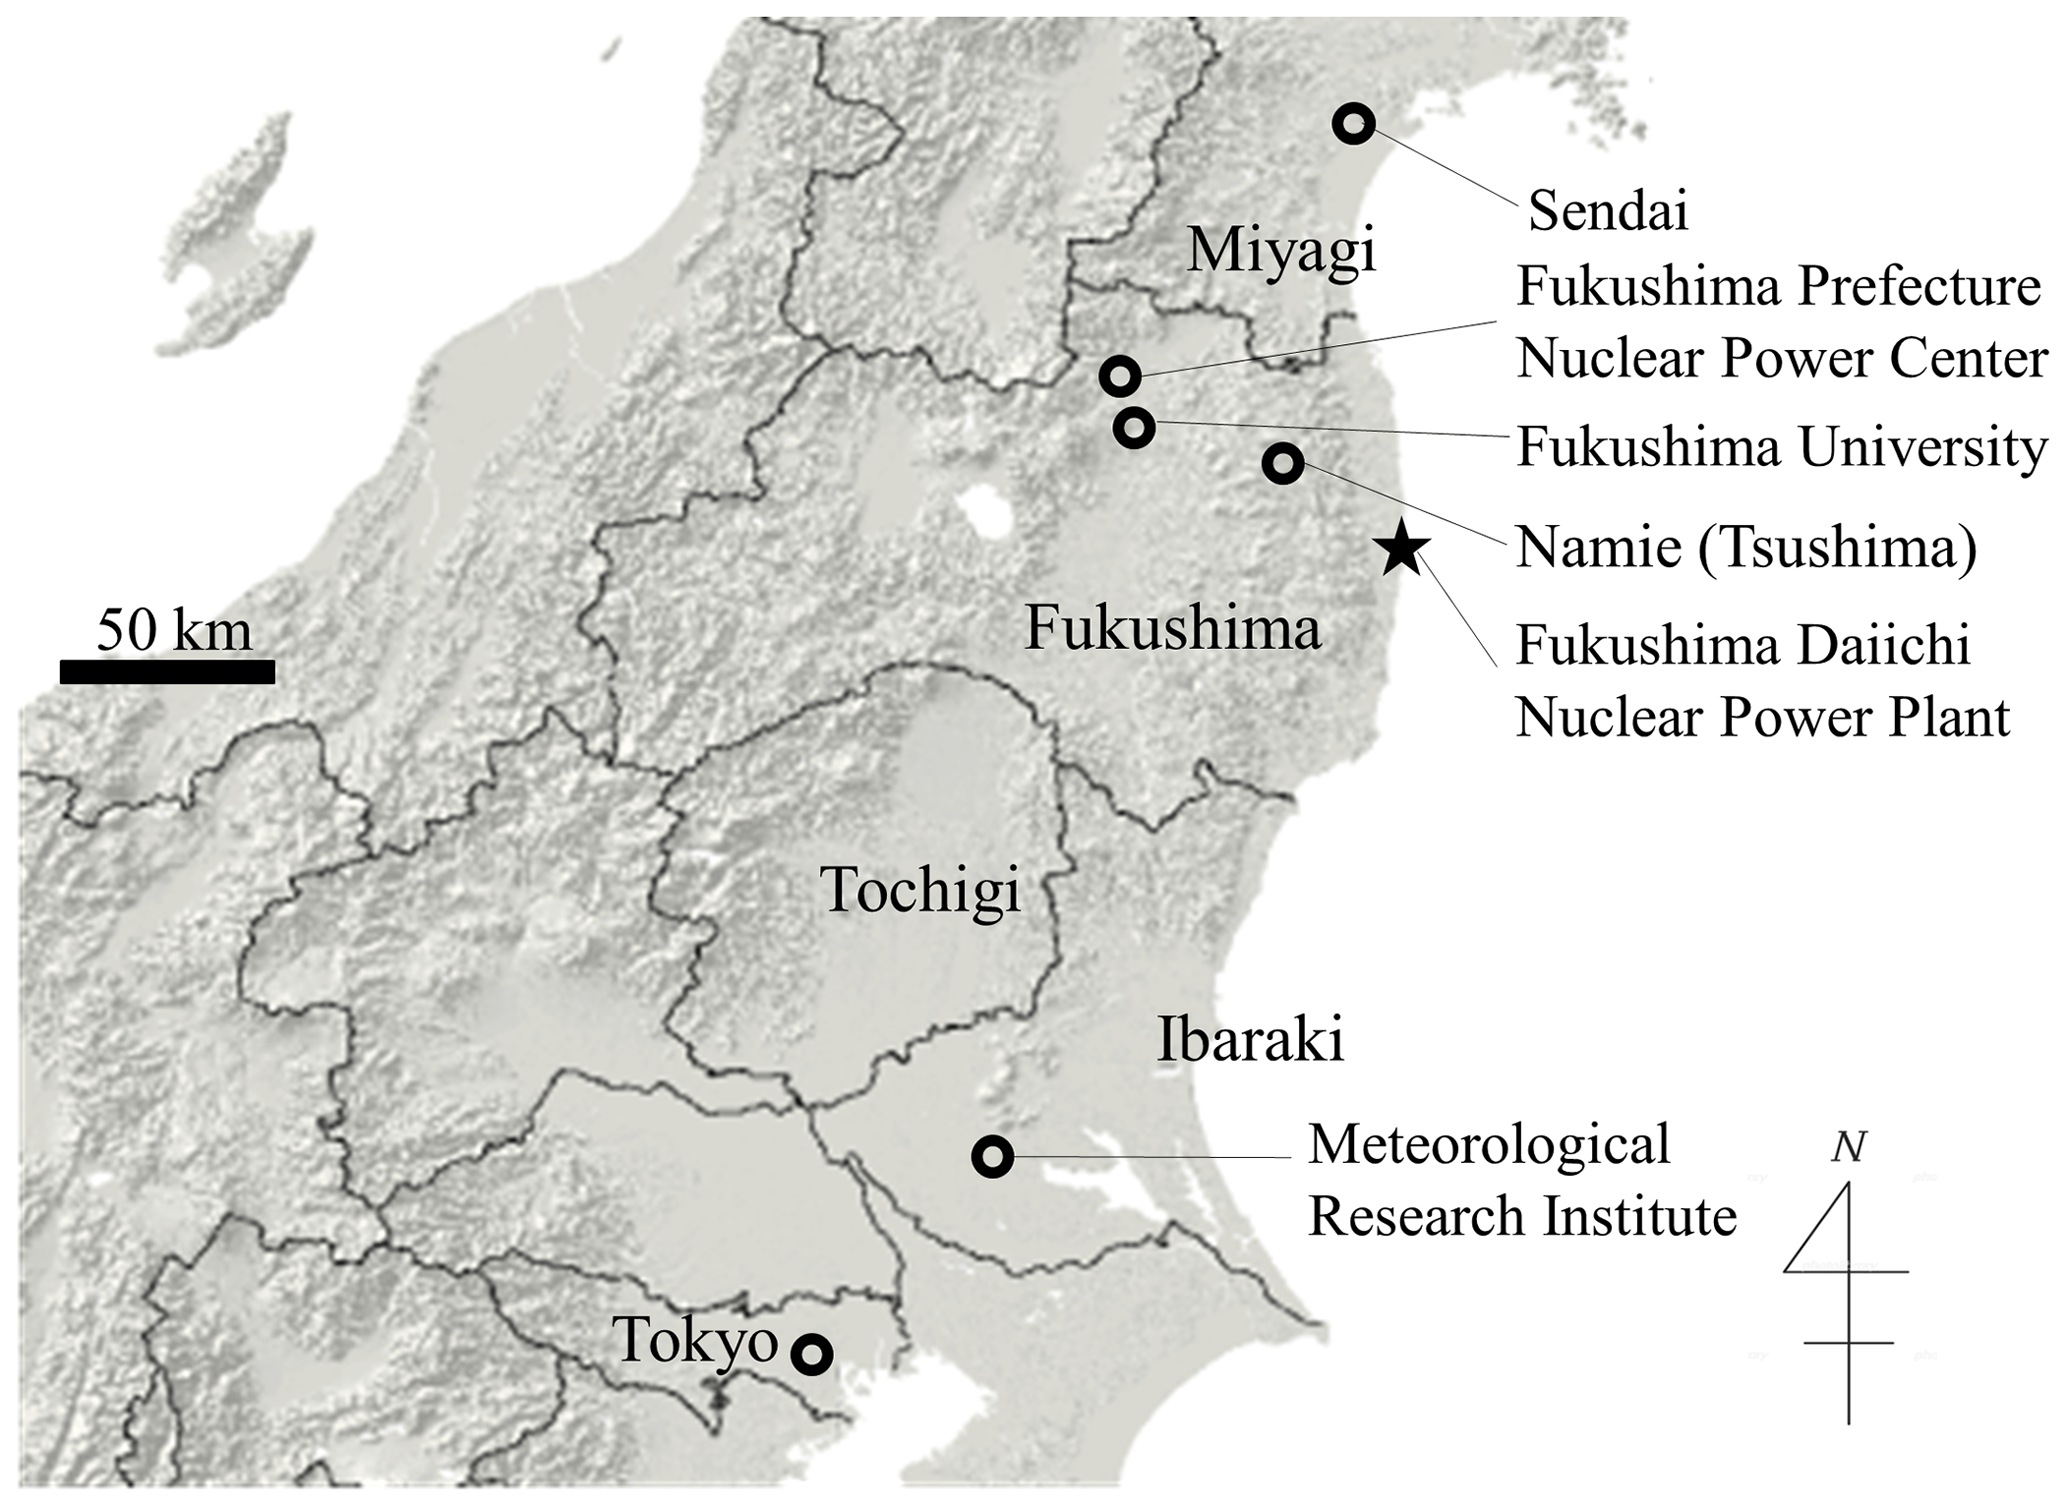
Figure 1Map of Fukushima Prefecture and the surrounding prefectures. The locations mentioned in this study and the terrestrial elevations are depicted on the map.
2.1 Sampling site
The observation site, Fukushima University, is located in Fukushima city, in the northernmost basin (Fukushima Basin) in the Nakadori Valley, surrounded by the Ou Mountains to the west and the Abukuma Highlands to the east (Fig. 1). The distance of the observation site from the FDNPP is approximately 60 km. The Nakadori Valley was formed by the Abukuma River, which starts in the mountains in Fukushima Prefecture near the border of Tochigi Prefecture and flows northeast through the central parts of Fukushima city to the Pacific Ocean in Miyagi Prefecture. The major radioactive plumes arrived twice in Fukushima city, on 15 and 20 March (plume no. 3 and no. 8, as identified by Nakajima et al., 2017, respectively). These plumes were transported over the Abukuma Highlands (where the summits are mostly lower than 1000 m) but were blocked by the higher Ou Mountains (summits are 1000–2000 m) and, thus, transported along the Nakadori Valley (Nakajima et al., 2017). The land surface of Fukushima city was contaminated mainly on the afternoon of 15 March by plume no. 3. The air dose rate in Fukushima city started to increase at 17:00 LT (local time), associated with the weak rain that started at 13:00 LT, and peaked at 19:30 LT at a value of 24.0 µSv h−1.
2.2 Airborne surface concentrations
2.2.1 High-volume air sampler, cascade impactor, and radioactivity measurement
The air samples were collected using high-volume air samplers (Model-120SL, Kimoto Electric Co., Ltd.) placed on the roof of the building at Fukushima University (37.68∘ N, 140.45∘ E) at a height of 25 m above ground level. In this study, we carried out two types of air sampling: time-resolved observations and aerosol size-resolved observations. In the former case, aerosol samples were collected on a quartz fiber filter (TE-QMA-100, Tisch Environmental, Inc.). The air suction rate of the sampler was 700 L min−1. The typical duration of each sample collection was 24 h, from 8 May to 2 September 2011. We then switched to 72 h of collection until 27 December 2017; after that, 1 week of continuous collection was performed until 28 March 2019. For the latter observations, a cascade impactor system (HV-RW, Sibata Scientific Technology Ltd.) was placed into a high-volume air sampler. The air suction rate was 566 L min−1. The aerosols were collected separately by diameter on six quartz filters (TE-236, Kimoto Electric Co., Ltd.). The 50 % cut of particle size ranges in this system was 0.39–0.69, 0.69–1.3, 1.3–2.1, 2.1–4.2, 4.2–10.2, and >10.2 µm. Fine particles with a size of <0.39 µm were captured on a backup filter (TE-230-QZ, Kimoto Electric Co., Ltd.). The typical sample collection time for the size-resolved observations was 3 weeks. In both types of observations, activated carbon fiber filters (KF-1700F 84 mmφ, Toyobo Co., Ltd.) were also placed at the exit of the high-volume air samplers to collect volatile or semi-volatile compounds.
The collected aerosol samples were sealed into polyethylene bags at Fukushima University. After being shaped into definite shapes, the gamma rays from the samples were measured by high-purity germanium detectors (coaxial with 15 %, 35 %, and 40 % relative efficiencies, SEIKO EG&G ORTEC, and coaxial with 40 % and 60 % relative efficiencies, CANBERRA) connected to a multichannel analyzer system (MCA7600, SEIKO EG&G) at the Radioisotope Research Center, Osaka University. The radioactivities of 134Cs and 137Cs were identified at gamma-ray intensities of 605 and 662 keV, respectively. The detection efficiencies of the respective detectors for each gamma ray were determined from the same-shape filter samples from standard 134Cs and 137Cs solutions obtained from the Japan Radioisotope Association. The typical measurement time of each sample was 1–3 d. Under these conditions, the detection limits of 134Cs and 137Cs were approximately Bq. The errors in the measured values are derived from the systematic error of geometrical configuration and the standard sample itself in addition to statistical error. All radioactivities determined by our measurements were corrected at mid-sampling times.
The radioactivities of both 134Cs and 137Cs were identified for most filter samples. The deviation in concentration between 134Cs and 137Cs became larger over time due to the relatively short half-life of 134Cs. According to the radioactive decay correction performed in March 2011, the activity ratios of were approximately 1. These ratios are consistent with those in other reports related to the FDNPP accident, so we concluded that the detected radio-Cs originated from the abovementioned event. During the measurement period, no radioactivity from 134Cs and 137Cs was detected from the carbon filters.
2.2.2 Impactor–cyclone system
As the filters for the high-volume air samples were quartz fiber filters, they could not be used for elemental analysis with X-ray fluorescence (XRF) spectrometry. For the XRF analysis, we used an impactor–cyclone system (no number, special order, 1100 L min−1, Tokyo Dylec Corp.) in which the aerosols were separated by size into <2.5 and >2.5 µm using an impactor; those <2.5 and >0.1 µm aerosols were sampled in glass bottles (2-4999-07, As One corp.) using a 0.1 µm cyclone with sampling intervals of 1 month from September 2014 to January 2018. Aerosols larger than 2.5 µm were collected on quartz fiber filters in the system; thus, only the fine-mode particles in the glass bottles were measured by XRF. Aerosol samples in glass bottles (0.1–2.5 µm) were defined as fine-mode PM (PMf), and those on quartz fiber filters (>2.5 µm) were defined as coarse-mode PM (PMc). The radioactivities of 134Cs and 137Cs in the samples were also measured in the same manner.
2.2.3 Possible artifacts of impactor measurements
Size separation by an impactor is associated with artifacts caused by bouncing effects. In fact, in cascade impactor measurements, Kinase et al. (2018) observed abundant coarse-mode particles such as mineral dust and bioaerosol particles in the backup filters due to bouncing effects. In the impactor–cyclone system, the glass fiber filters used as an impaction surface were immersed in silicone oil to prevent particles from bouncing (Okuda et al., 2015). In this study, silicone oil was not used for the cascade impactor but was used in the impactor–cyclone system. However, the long-duration measurements (such as the monthlong measurements) could be associated with larger particles that rebounded at the impactor and were collected in glass bottles (Okuda et al., 2015).
2.3 Deposition (dry plus wet deposition, dissolved and particulate fractions)
The total deposition (dry plus wet deposition or fallout) samples were collected with a precipitation sampler (RS-20, Miyamoto Riken Ind. Co., Ltd.) with a funnel diameter of 20 cm. As a heating device was not installed on the sampler, any snow in the funnel was manually melted in a water bath in winter. The accumulated snow in the funnel never reached the top of the funnel during the whole observation period. A filtration device was installed in the sampler using membrane filters (4-880-03, Advantec) with a pore size of 0.45 µm. The radioactivities of 134Cs and 137Cs in the filtered water stored in the polyethylene bottle and those on the filters were both measured using high-purity germanium detectors at Fukushima University and were defined as the dissolved and particulate fractions of the deposition, respectively. It should be noted here that this separation does not perfectly differentiate between water-soluble and insoluble radio-Cs. The clogging of the pores of the membrane filter can occur during filtration. The measured total (dissolved plus particulate) deposition amounts were compared with those measured using the official method of Japan (MEXT, 1976) at the Fukushima Prefecture Nuclear Power Center (Fig. 1), which is located 6.5 km north-northwest of Fukushima University. Our method was found to be consistent with their official method: the correlation coefficient R was 0.81, with a slope of 1.16 (the values from Fukushima University were 16 % larger). Differences in locations and sampling intervals (daily at the Fukushima Prefecture Nuclear Power Center and monthly at Fukushima University) could also have contributed to the differences in the measured values at the two sites.
2.4 X-ray fluorescence analysis (aerosols, deposition, and river sediments)
X-ray fluorescence (XRF) analysis was carried out using a RIX1000 (Rigaku Corp.) at Fukushima University. The measurement setup recommended by the manufacturer was used for the XRF. The major and trace element contents were analyzed by the fundamental parameter method and calibration curve method, respectively (Takase and Nagahashi, 2007). Measurements were conducted for PMf (see Sect. 2.2.2), the particulate fractions of precipitation (see Sect. 2.3), and the river sediments. River sediments that characterize the surface soils of the Nakadori Valley were also measured to assess the composition correlations with the airborne and deposition samples. River sediments were collected at 15 sites upstream and downstream of Fukushima city in the Abukuma River and its tributaries in 2010. Samples were taken from the gravel layer of the lower terrace at five sites, from alluvial fan deposits at one site, and from current riverbed sediments at nine sites. The dried sediment samples were sieved and divided into two grain size groups: particles smaller than 180 µm (defined as fine sediment particles) and particles 180 µm–2 mm (coarse sediment particles).
2.5 Numerical simulation and validation data
Kajino et al. (2016) used a Lagrangian model (LM) to simulate the atmospheric dispersion and deposition of 137Cs resuspended from bare soil and forest ecosystems from January to December 2013. As the resuspension fluxes and size distributions were unknown, they adjusted the flux from bare soil (forest ecosystems) so that the simulated airborne surface concentrations matched those measured in Namie (Tsushima; Namie High School, Tsushima Campus; 37.56∘ N, 140.77∘ E; 30 km northwest of the FDNPP) (Fig. 1) in the winter (summer) of 2013, and they adjusted the dry and wet deposition parameters (reflecting the size distributions and hygroscopicity) so that the simulated total (dry plus wet) deposition over land in March 2011 matched those measured by the aircraft measurements (NRA, 2012). Thus, note that the size distribution of the simulation was assumed to have submicron size ranges that were consistent with those of the primary emissions (the direct emissions associated with the FDNPP accident in March 2011) but that may not be applicable for resuspension events; the carrier aerosols are presumed to be soil dust or bioaerosols, which are usually in the supermicron size range. Kajino et al. (2016) concluded that their simulations are likely reliable because the simulated differences between the concentrations in the contaminated area (or emission source area) (i.e., Tsushima) and those in the downwind area (Meteorological Research Institute, MRI; Tsukuba city; 36.06∘ N, 140.13∘ E; 170 km southwest of the FDNPP) (Fig. 1) were consistent with the observed differences at the two locations.
However, Kajino et al. (2016) used only concentration measurements to validate the simulations. The current study also used concentration and deposition measurements from Fukushima University for model validation. The previous study compared only the two locations in the contaminated forest areas and in the downwind urban/rural regions; the current study includes an additional location in the urban/rural region near the contaminated forest of the Abukuma Highlands (60 km northwest of the FDNPP).
3.1 Airborne surface concentrations
Figure 2 shows the time variations in the airborne surface concentrations of 137Cs from May 2011 to March 2019. Just after the accident, the 137Cs concentrations were higher than 0.01 Bq m−3, and the maximum concentration of 0.0169 Bq m−3 was detected on 23 May 2011. The concentration quickly decreased to a level of 10−4 Bq m−3, and the minimum concentration of Bq m−3 was obtained on 5 December 2018.
It is remarkable that the decreasing tendencies in the earlier stage and the later stage were different. The regression lines of the raw data time intervals for the whole period (red; May 2011–March 2019), the earlier stage (blue; May 2011–December 2014), and the later stage (lime; January 2015–March 2019) are shown in Fig. 2, with the half-life (Th) in days and the decrease rate (Rd) in percent per year. The decreasing tendency (Th=0.753 years, Rd=92.0 % yr−1) of the earlier stage is approximately 3 times faster than that of the later stage (Th=2.07 years, Rd=33.5 % yr−1). This is shown later in Fig. 3 in Sect. 3.2 and discussed in Sect. 4.2, but it could be related to the relative abundance of the particulate and dissolved fractions of radio-Cs in the environment. The dissolved fractions of radio-Cs may discharge faster than the particulate fractions from contaminated environments, such as soils and plants. The relative abundance of the dissolved fractions was larger in the earlier stage than in the later stage such that the decreasing tendency in the concentration was faster than that in the later stage. In addition to the natural variability, decontamination work, which was completed by March 2018 in Fukushima city and the surrounding municipalities, may also have contributed to the difference in the decrease rates; this possibility is also discussed in Sect. 4.2.
The regression analysis is also performed over different time periods, but the results are not substantially different. The Th and Rd before December 2013, 2014, and 2015 are 0.670, 0.753, and 0.900 years, and 103 % yr−1, 92.0 % yr−1, and 77.0 % yr−1, respectively. The Th and Rd after January 2014, 2015, and 2016 are 2.05, 20.7, and 2.56 years, and 33.8 % yr−1, 33.5 % yr−1, and 27.1 % yr−1, respectively.
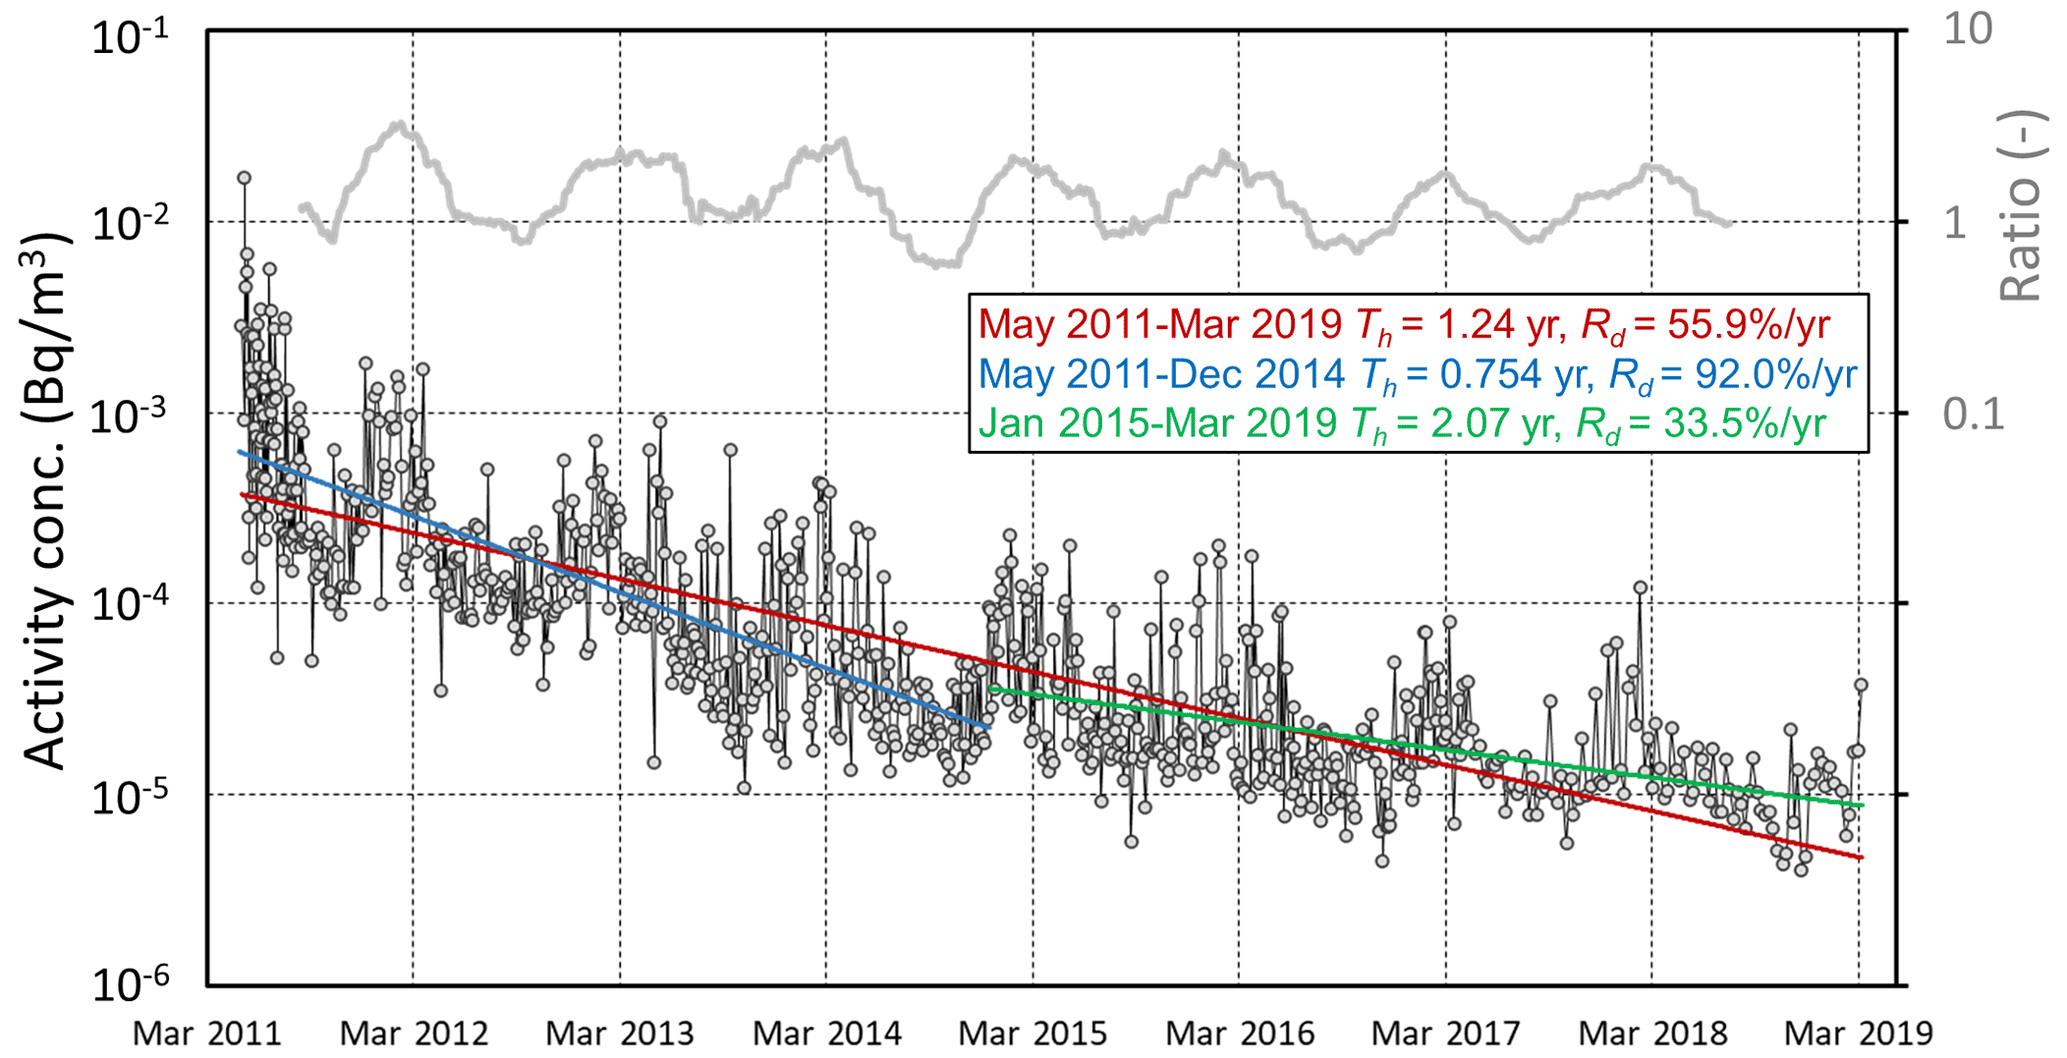
Figure 2Time series of airborne surface concentrations of 137Cs on the left axis. The red, blue, and lime lines indicate the regression lines of the whole period, before 2015, and after 2015, respectively. The half-lives (Th) and decay rates (Rd) are also depicted. The gray line indicates the ratio of the running mean of 20 data points (an approximate monthly cycle) to the running mean of 160 data points (an approximate annual cycle) on the right axis to show its seasonal variation.
It is also interesting that our data show different seasonal variations from those measured in Tsushima by Ochiai et al. (2016) and Kinase et al. (2018). The levels in their studies were high in summer and low in winter; however, as depicted by the gray line in Fig. 2, the concentration in this work rose starting in October, with maxima in the spring season around March and minima in the summer. The maxima in the spring are approximately 1 order of magnitude larger than the minima in the summer. The measurements of their studies were conducted in high-dose areas in the mountain forest (approximately 400 m a.s.l., above sea level), and the high-volume samplers were set near the ground surface. In contrast, the current air sampling was conducted in a relatively low-dose area (10 times lower than that in Tsushima) located in an urban/rural region on a hill (approximately 200 m a.s.l.) at the southern end of the Fukushima Basin. The heights of the samples were 25 m from the ground surface. Such geographical and altitude differences could have caused these differences.
3.2 Deposition amounts
Figure 3 shows the monthly cumulative deposition of 137Cs from March 2011 to March 2019. The monthly deposition amount peaked in March 2011 at 202.2×10³ Bq m−2, decreased to 1 % of the initial amount after 1 year, and decreased to an order of 1 Bq m−2 after 8 years. It also showed seasonal variation and was high from winter to spring. Nevertheless, the current level is 2–3 orders of magnitude larger than that before the Fukushima nuclear accident.
It should be noted here that the initial-stage data (i.e., March and April 2011) are excluded to obtain the decreasing rates to extract only the resuspension period and to exclude the influences of primary emissions. The decrease rates of deposition (Th=1.30–4.69 years) were generally slower than those of the concentrations (Th=0.753–2.07 years). It is tricky to identify the reason for this phenomenon. A perfect simulation could answer this question, but high uncertainties in atmospheric deposition modeling and land surface modeling inhibit a perfect understanding of these long-term circulations of radio-Cs in the environment. It is safe to presume here that the decreasing tendencies in deposition and concentrations are different because the contributions of major emission sources to deposition and concentrations are different. If the dominant source of the concentration is near (far from) the observation site and that for of deposition is far from (near) the site, the faster decrease rate in concentration is due to the faster (slower) reduction rate in the nearby sources of emissions than in the distant sources.
There is also a distinct difference in the decreasing tendencies before and after 2015. In addition to the effect of decontamination work, as previously discussed in Sect. 3.1, the relative abundances of the dissolved and particulate fractions of 137Cs could be a part of the reason. The particulate fraction made up 72.6 % of the deposition in March 2011 (Fig. 3), which is presumed to have been largely influenced by primary emissions. Here, it is interesting to note that most primary radio-Cs emissions are thought to be composed of water-soluble submicron aerosol particles (e.g., Kaneyasu et al., 2012, and almost all numerical simulations afterwards, such as Sato et al., 2020), while water-insoluble Cs-bearing microparticles (CsMP; Adachi et al., 2013; Igarashi et al., 2019b) may contribute somewhat to primary emissions (Ikehara et al., 2020; Kajino et al., 2021). If the primary radio-Cs species in aerosols were 100 % in water-soluble forms, the particulate fraction should have made up 0 % of the precipitation in March 2011 (although some of the water-soluble Cs could have been converted to a water-insoluble form through adsorption to soil particles accumulated on the membrane filter during filtration). After April 2011, as the contributions of resuspension were thought to be dominant, the dissolved fractions became larger. The ratio varied, but the dissolved fractions were generally higher before 2016, and the particulate fractions became dominant after 2016. There seemed to be a regime change in the physicochemical properties of radio-Cs circulating in the environment in the area around 2015, which could have changed the decreasing tendencies of both the concentrations and deposition before and after 2015. This result is consistent with the finding of Manaka et al. (2019), who reported that the exchangeable proportions of radio-Cs rapidly decreased in forest soils from 2 to 4 years after the accident (i.e., from 2013 to 2015).
The regression analysis is also applied over different time periods, and we found a remarkable change in 2015. The Th before December 2013, 2014, and 2015 is similar with values of 1.09, 1.30, and 1.56 years, respectively, but Th after January 2014, 2015, and 2016 is 3.98, 4.69, and 12.67 years, respectively. The ratios of half-lives (after to before) of the three periods are 3.64, 3.61, and 8.12, respectively, indicating that there could be a remarkable change in the tendency between January 2015 and January 2016. Time series of changes in the ratio before and after a particular date from 2014 to 2016 are illustrated in Fig. S1. Due to the lack of data, the half-lives after 2015 varied substantially depending on the start month (exceeding 100 years in some cases). However, it is obvious that the ratio is stable before January 2015 at a value of around 4.0, and it starts to increase from the spring to summer of 2015. We may be able to conclude that the regime change in the physicochemical properties of radio-Cs occurred during the year 2015.
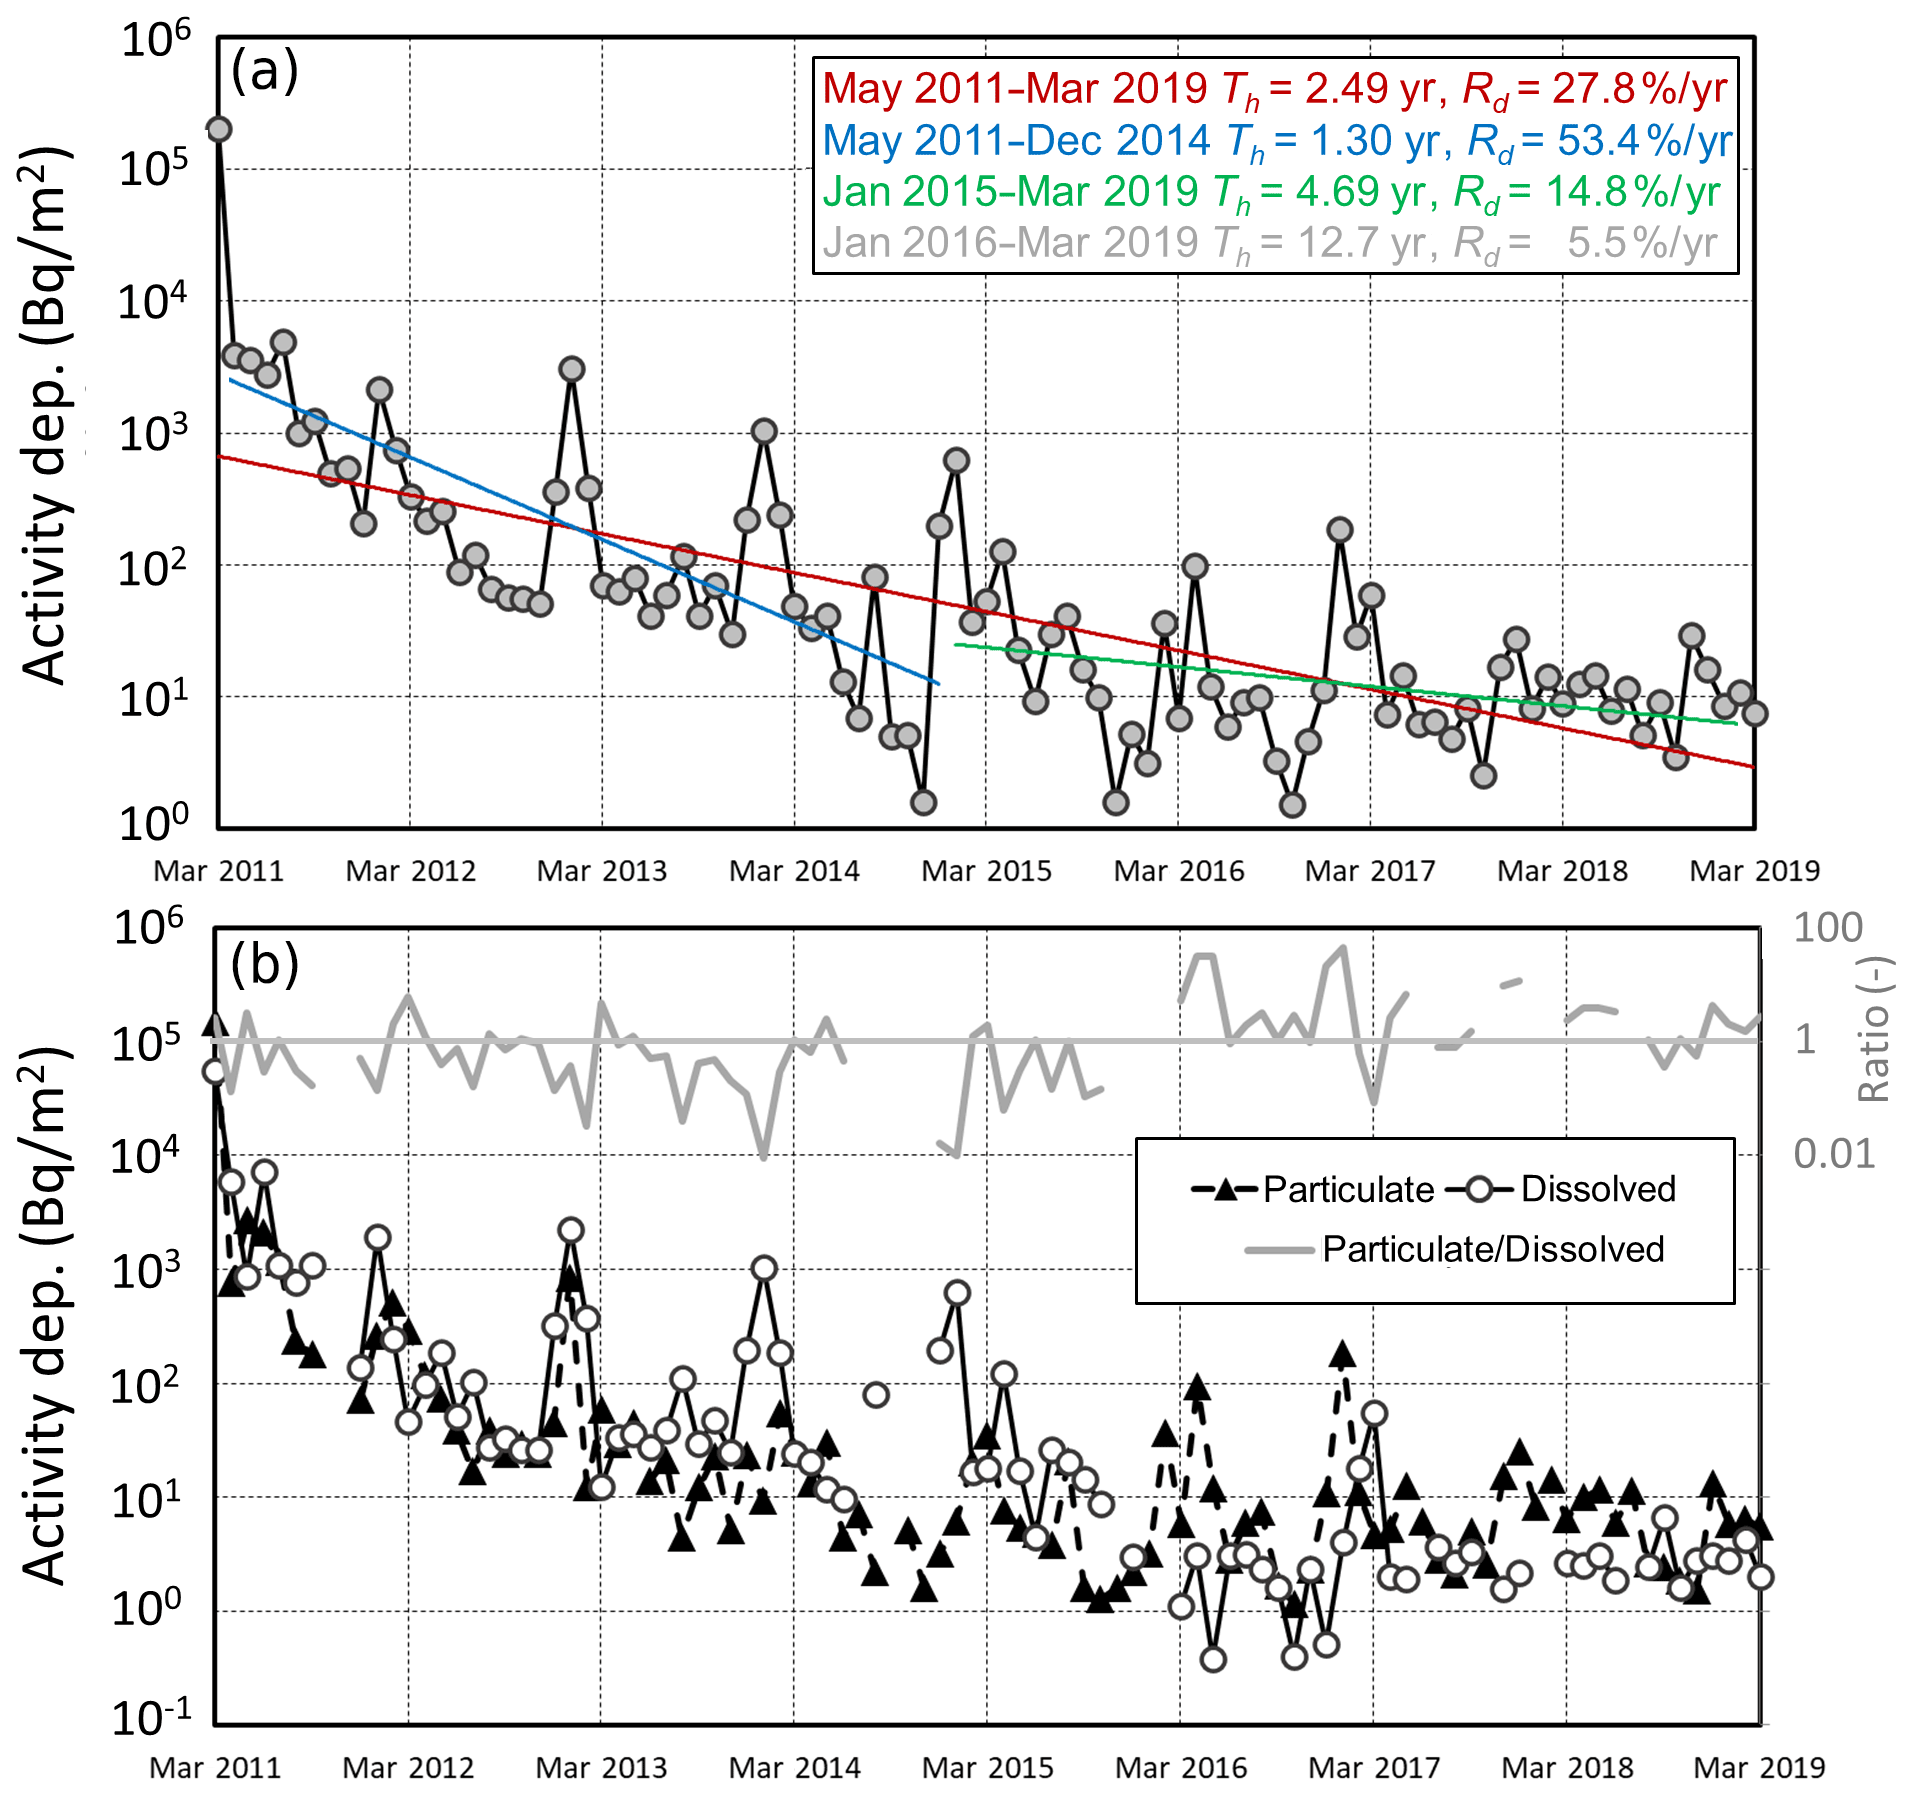
Figure 3(a) Time series of 137Cs activity deposition. The red, blue, and lime lines indicate the regression lines of the whole period, before 2015, and after 2015, respectively. The half-lives (Th) and decay rates (Rd) are also depicted. As Th and Rd values after 2016 are substantially different from those after 2015, the values are additionally depicted in gray. (b) Time series of the particulate and dissolved forms of 137Cs deposition on the left axis and the ratio of particulate to dissolved 137Cs on the right axis.
The seasonal variations in particulate and dissolved 137Cs were slightly different from each other and different from those of the concentration. The concentration peaked in March in almost all years, and the total deposition peaked in January. The peaks of the total deposition in January coincided with those of the dissolved 137Cs before 2016, but the peaks of the dissolved 137Cs became unclear afterwards. The peaks of particulate 137Cs occurred in March before 2016, which coincided with those of the concentrations. After 2016, there were no clear seasonal variations in particulate 137Cs. There are clear and different seasonal variations in the concentration and deposition. However, at the current stage, we have no knowledge of or numerical tools to reveal the hidden mechanisms underlying these variations.
3.3 Size distributions
Figure 4 shows the time series of the seasonal mean concentrations of 137Cs obtained from the cascade impactor measurements. The sampling interval for the cascade impactor measurements was 3 weeks. The seasonal means included a sampling period if any part of the sampling period was included in the season; for example, the raw data from the sampling period from February to March contributed to the averages of both DJF (December–January–February, i.e., winter) and MAM (March–April–May, i.e., spring). The seasonal mean total (all sizes) concentrations of cascade impactor measurements during the sampling period agreed well with those of the “all size” observations as presented in Fig. 2, with R2=0.93. The same seasonal variation discussed for the all size observations (Sect. 3.1) was also observed; the atmospheric 137Cs concentration was relatively high in DJF and MAM compared with that in JJA (June–July–August, i.e., summer) and SON (September–October–November, i.e., autumn).
The most dominant size range in activity was the backup filter (<0.39 µm, or rebounded particles such as soil dust and bioaerosols; Kinase et al., 2018), and its seasonal variation agreed well with that of the total particle concentration (high in DJF and MAM). On the other hand, the second largest contribution was made by the size range of 4.2–10.2 µm, which showed the opposite seasonal variation and was relatively high in JJA and SON. The seasonal variations in the largest particle fraction, larger than 10.2 µm, are interesting: high in DJF and May (same as the backup filter) but high in JJA in 2016 and 2017. The reason for the variations and differences is not yet clear, but the current measurement indicates that the dominant particles and their sizes may be distinct depending on the season. The decrease rates of each size were different before and after approximately 2015, as discussed in Sect. 3.1 and 3.2, but the size distribution of the concentration did not change substantially before and after approximately 2015.
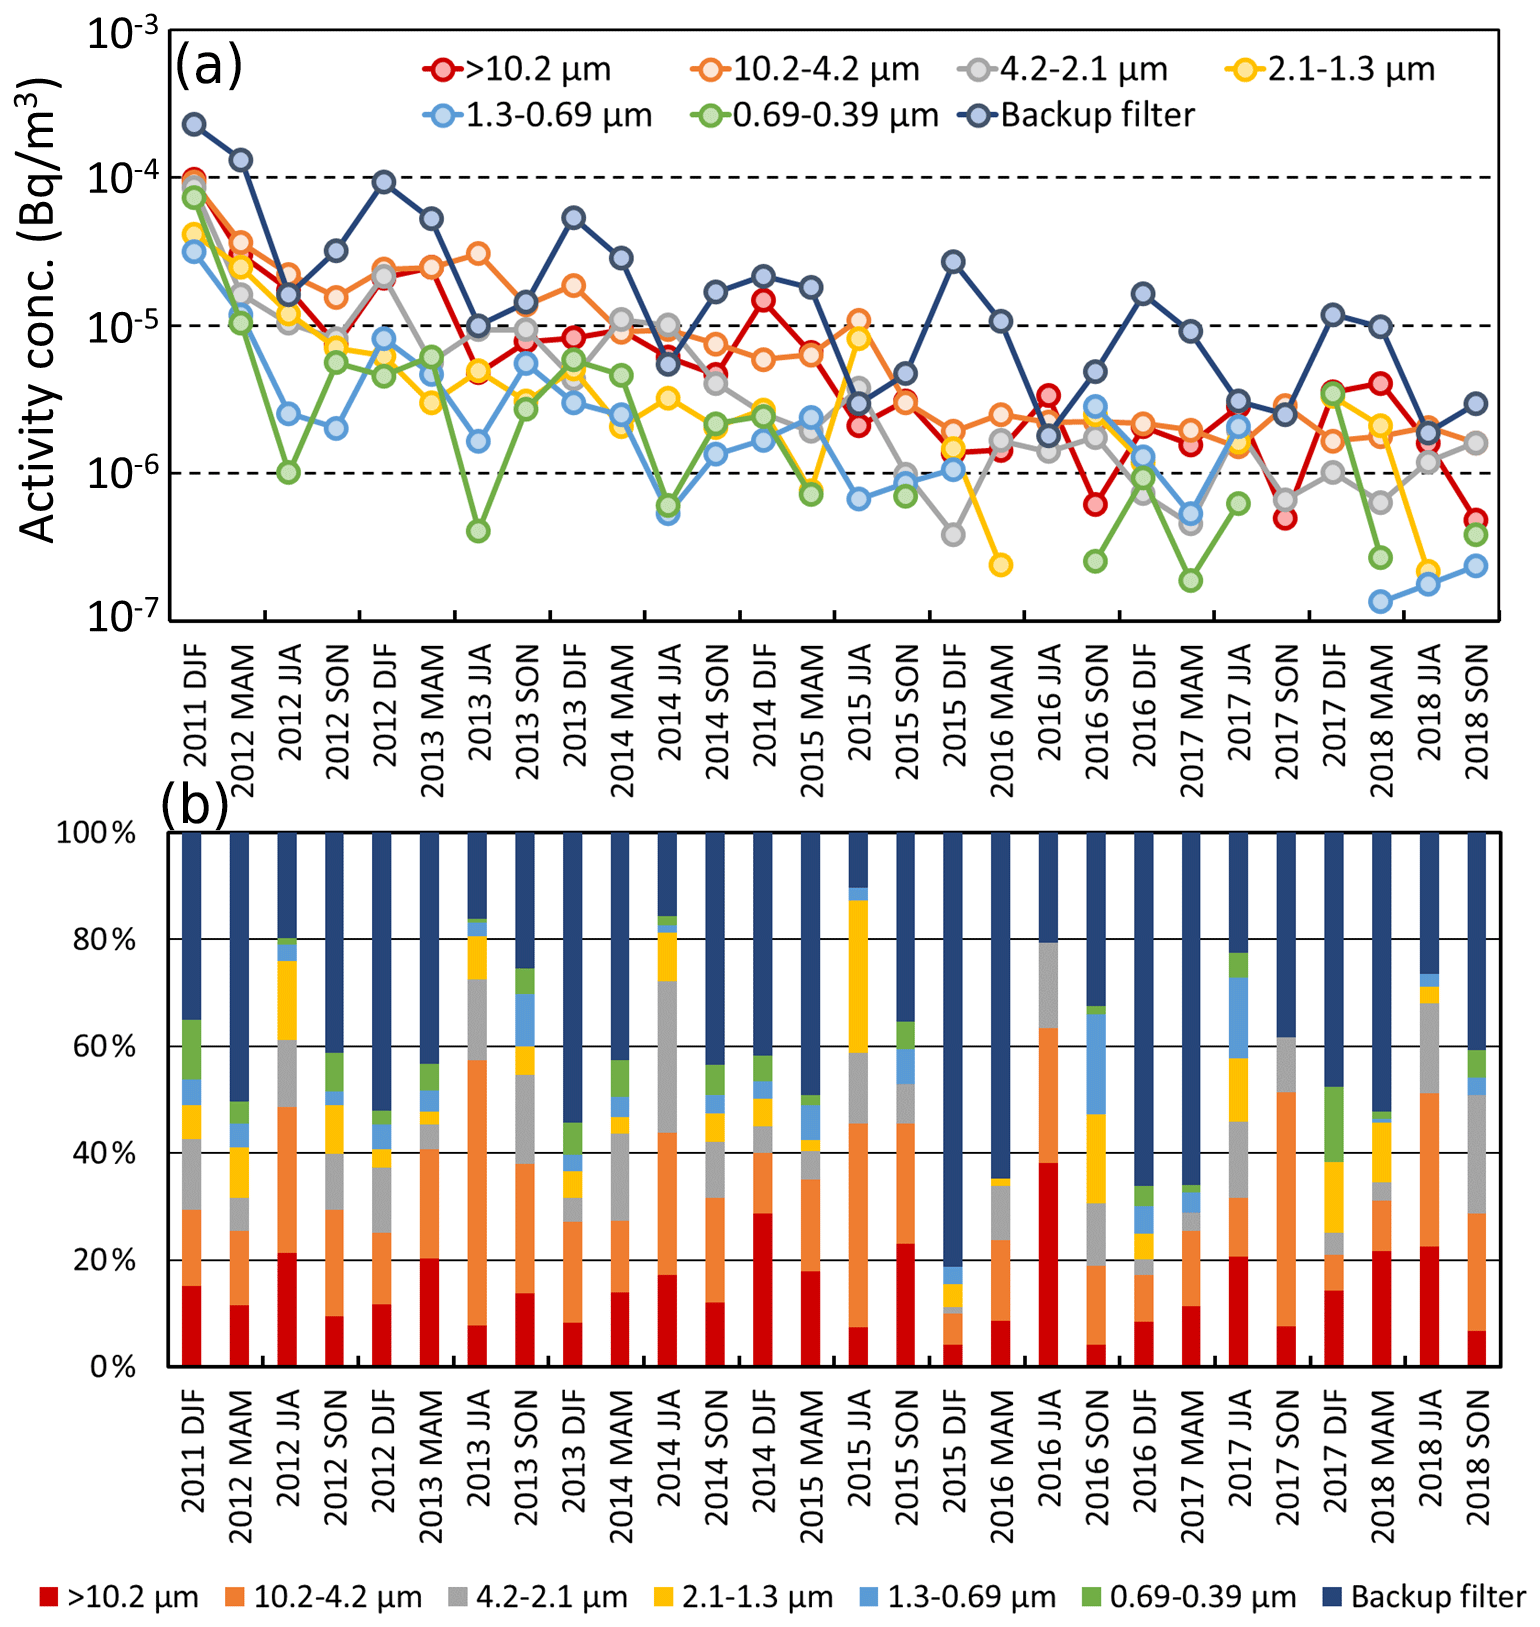
Figure 4(a) Time series of seasonal mean size-resolved airborne surface concentrations of 137Cs and (b) their relative fractions.
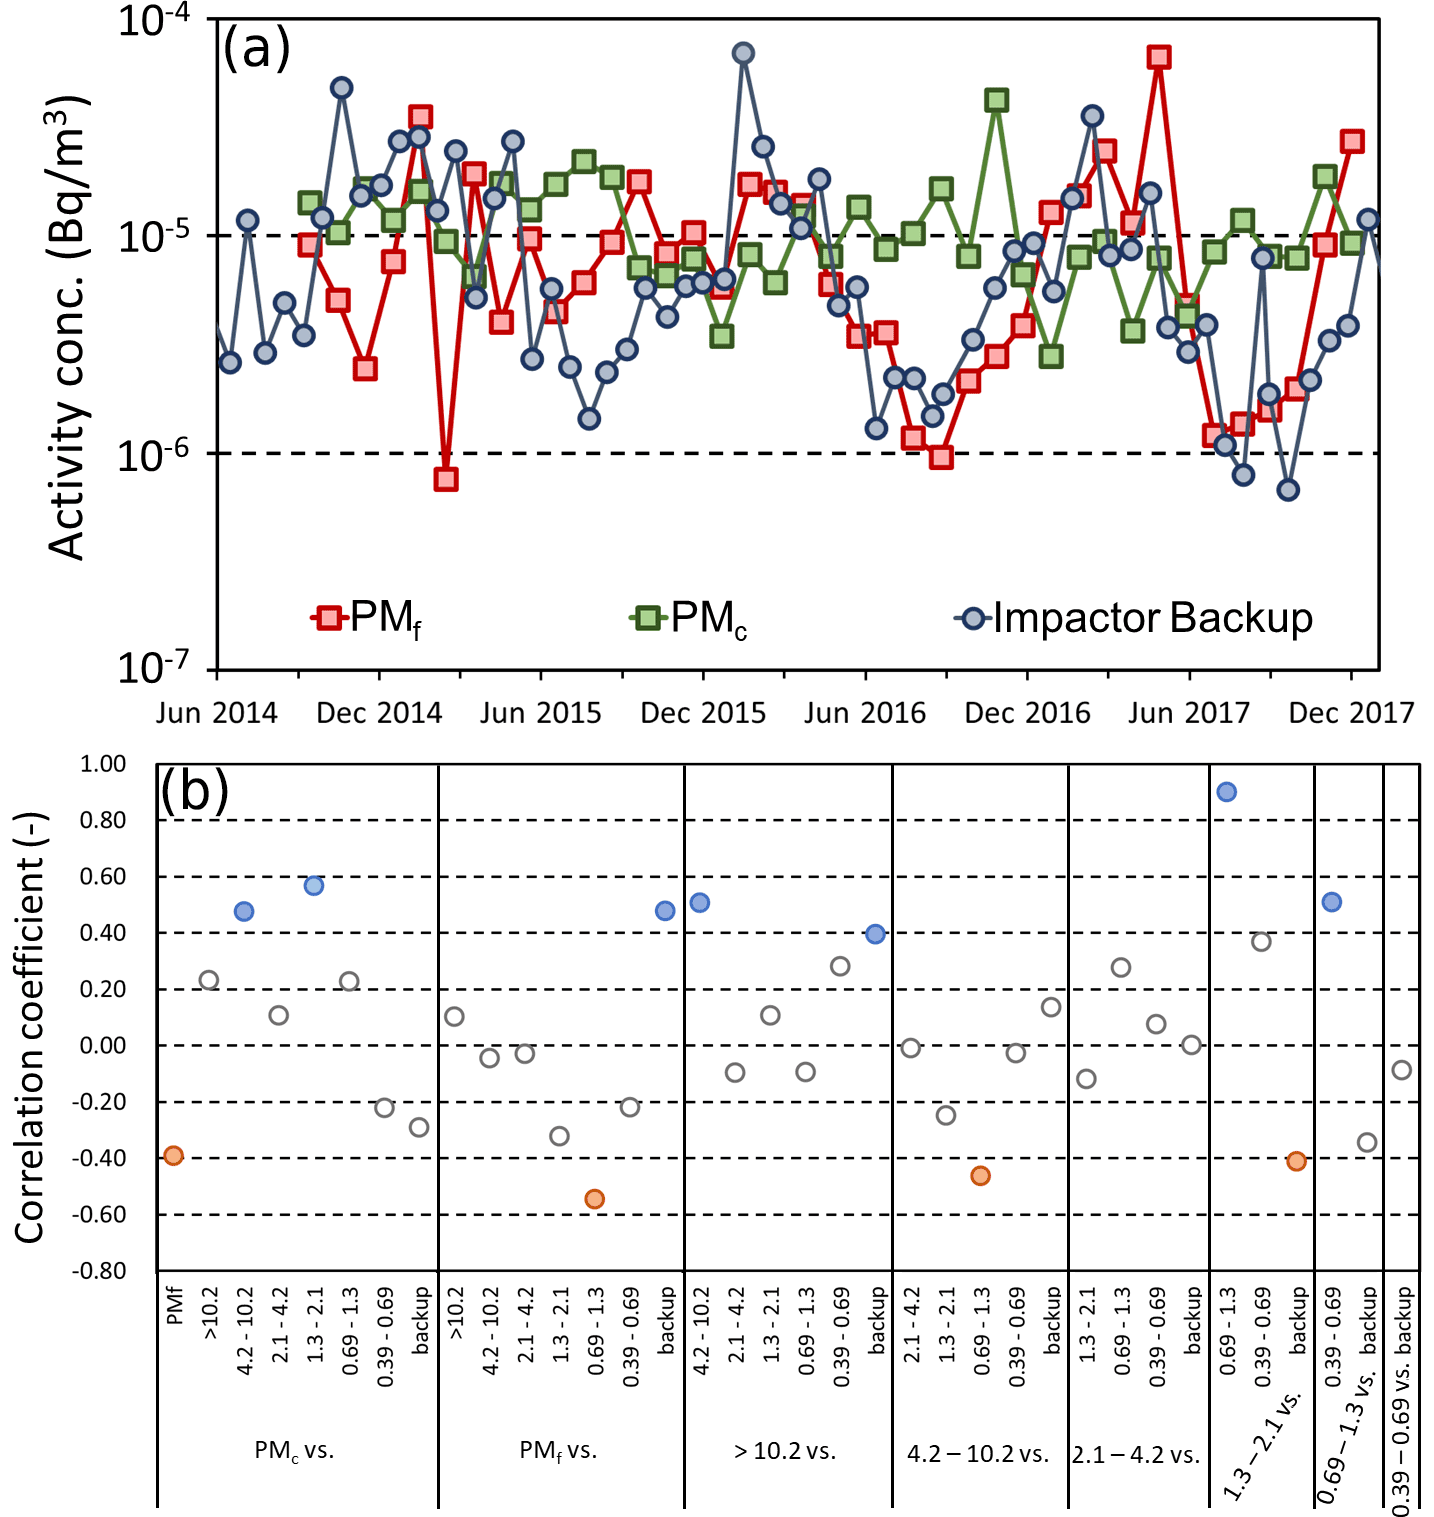
Figure 5(a) Time series of airborne surface concentrations of 137Cs in PMf (0.1–2.5 µm) and PMc (>2.5 µm) collected by the impactor–cyclone system and those of the backup filter of the cascade impactor. (b) Correlation coefficients of temporal variations among seasonal mean 137Cs concentrations of different sizes measured by the impactor–cyclone system and the cascade impactor. Correlation coefficients higher than approximately 0.4 and lower than approximately −0.4 are colored blue and orange, respectively.
Cascade impactor sampling is associated with the bouncing effect, whereas filters for the impactor–cyclone system were immersed in silicone oil to prevent the bouncing effect. Thus, the cascade impactor and the impactor–cyclone measurement data are compared in Fig. 5. Figure 5a shows the data with the same measurement time intervals (3 weeks for the cascade impactor data and 1 month for the impactor–cyclone data). The concentrations of 137Cs in the backup filters were well correlated with those of PMf. No remarkable seasonality was observed in PMc, but some enhancements were observed in JJA in 2015 and SON in 2016.
Figure 5b shows the correlation coefficients among the seasonal mean size-resolved data from the cascade impactor and impactor–cyclone measurements. If we assume that the bouncing effect on the impactor–cyclone measurements was negligible, the cascade impactor data and the impactor–cyclone data were consistent. There was a positive correlation between PMf and the backup filter data. There were also positive correlations between PMc and the 1.3–2.1 and 4.2–10.2 µm data. There was a negative correlation between PMc and PMf, which strongly indicates that fine-mode particles are the dominant carriers of 137Cs in winter and spring and that coarse-mode particles are the dominant carriers of 137Cs in summer and autumn. However, there was also a contradiction in the data. There were low or negative correlation coefficients between the backup filter data and the cascade impactor data at smaller size ranges, such as 0.39–0.69, 0.69–1.3, and 1.3–2.1 µm, but the backup filter data were positively correlated with the impactor data for >10.2 µm. It appears that bouncing effect might have occurred: particles larger than 10.2 µm bounced in the latter stages and were captured in the backup filter. However, as previously discussed, the behavior of the >10.2 µm particle data was not consistent in time, i.e., they were generally high in DJF and MAM and were high in JJA in 2016 and 2017 (Fig. 4). Kinase et al. (2018) and Igarashi et al. (2019a) considered that the dominant carriers of resuspended 137Cs were coarse-mode particles such as soil dust and bioaerosols. Ochiai et al. (2016) conducted two-stage impactor sampling and measured the airborne surface concentrations of 134Cs and 137Cs above and below 1.1 µm from 2012 to 2014. They showed that the contributions of coarse-mode particles (>1.1 µm) were dominant, with maxima in summer. The contributions of the fine-mode particles (<1.1 µm) were much smaller, and no significant seasonal variations were found. All of their measurement sites were surrounded by contaminated forests in the Abukuma Highlands (Tsushima and the nearby sites), so the sampling sites were different from those in our study. Such larger particles may have contributed to the backup filter data in the current measurements; however, based on the fact that the backup filter data were positively correlated with PMf and not with PMc, fine-mode particles (<2.5 µm) should also play a key role in determining the concentrations in Fukushima city.
On the other hand, if we assume that the bouncing effect is also significant in the impactor–cyclone system due to the long sampling duration, as suggested by Okuda et al. (2015), the positive correlation between the backup filter particles and PMf was simply due to the bouncing effects of the larger particles in both systems.
Even though the emission sources of the dominant particles collected by the size-resolved measurements could not be identified in this study, the possible aerosol sources that would explain the differences in size and seasonality of the two locations are discussed later, in Sect. 4.1.
3.4 Chemical characterizations of particles in the air, rainfall, and river sediments
Figure 6 shows the relative abundance of the XRF-measured atomic number concentrations of elements in the PMf monthly sample from September 2014 to January 2018. Among the 15 detected species, PMf was mainly composed of SiO2, Al2O3, and SO3. The fractions of SiO2 show clear seasonal variations and were higher around May. The seasonal variations in Al2O3 and SO3 are the opposite of that in SiO2. A positive temporal correlation was obtained between the 137Cs in PMf and SiO2 (R=0.30). Negative correlations were obtained for Al2O3 and SO3, with correlation coefficients of −0.36 and −0.35, respectively. Note that these results do not prove that the SiO2-bearing aerosols are the carriers of resuspended 137Cs, but we can safely conclude that the origins of SiO2 and 137Cs may be close to each other (i.e., that both come from the same source or the same area/direction).
Figure 7 shows comparisons of the relative abundance of the periodic mean XRF-measured atomic number concentrations in different samples, fine sediment particles, coarse sediment particles, PMf, and particulate fractions of precipitation. The PMf and precipitation data over the same period, from October 2014 and December 2012, were averaged. The sediment samples were collected in 2010. The 10 species that were common to all samples are shown in Fig. 7. The composition differences are not very remarkable, and correlation coefficients for the compositions among samples are above 0.9 s. The features of the PMf composition were distinct from the others. PMf included SO3 (17.8 %) and Cl (2.65 %), whereas the others did not.
Weathered biotite is abundant in the soil in Fukushima, and it absorbs radio-Cs efficiently (Kogure et al., 2019). The compositional correlation coefficients between the weathered biotite (Takase, 2020) and the four samples were high: 0.73–0.87. However, when the two major components SiO2 and Al2O3 were excluded, the compositional correlation coefficients changed significantly. The eight (the common 10 species shown in Fig. 7 minus SiO2 and Al2O3) compositional correlation coefficients between the fine and coarse sediment particles were 0.98, but those between the sediments and PMf were 0.01 and 0.19 for the fine and coarse sediment particles, respectively. The eight compositional correlation coefficients for the particulate fractions of precipitation were moderate: 0.36, 0.44, and 0.45 for fine sediment particles, coarse sediment particles, and PMf, respectively. The eight compositional correlation coefficients for weathered biotite were 0.76, 0.71, 0.50, and −0.14 for fine sediment particles, coarse sediment particles, particulate fractions of precipitation, and PMf, respectively.
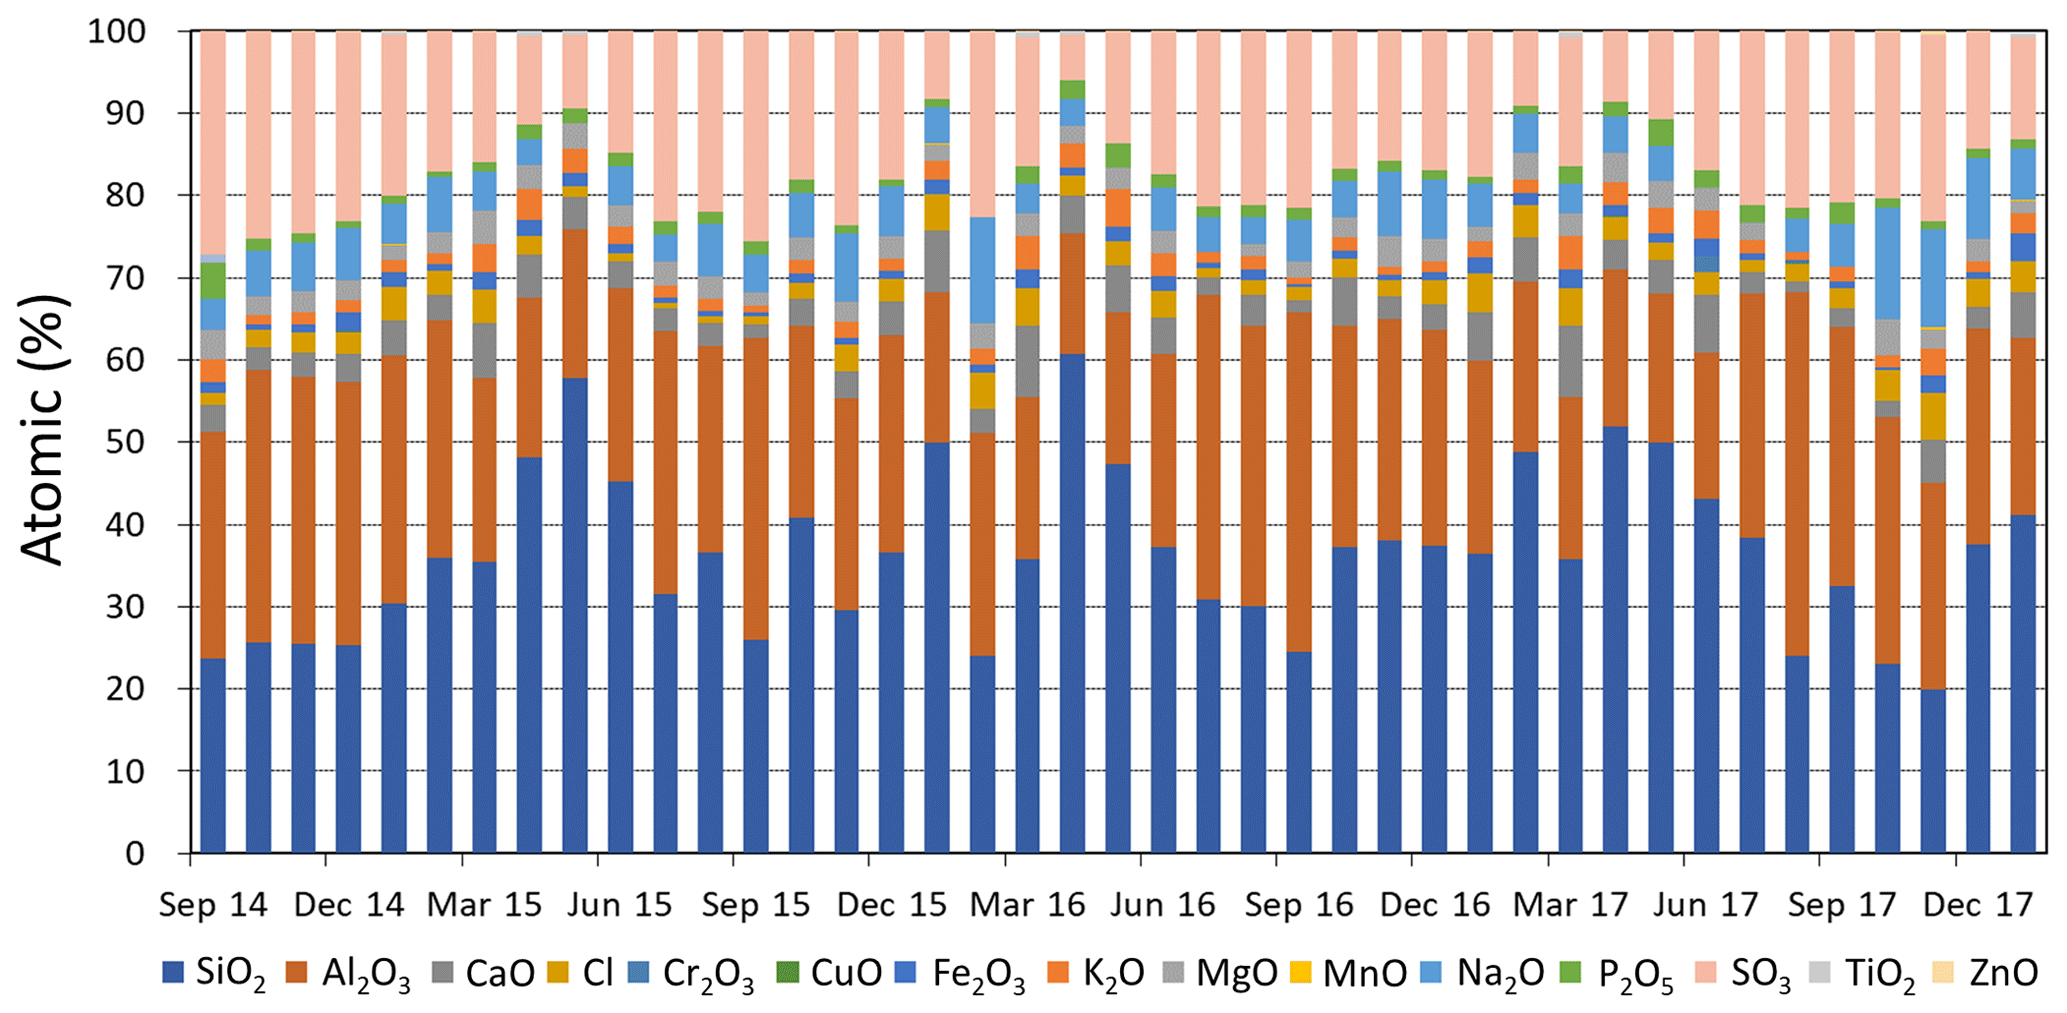
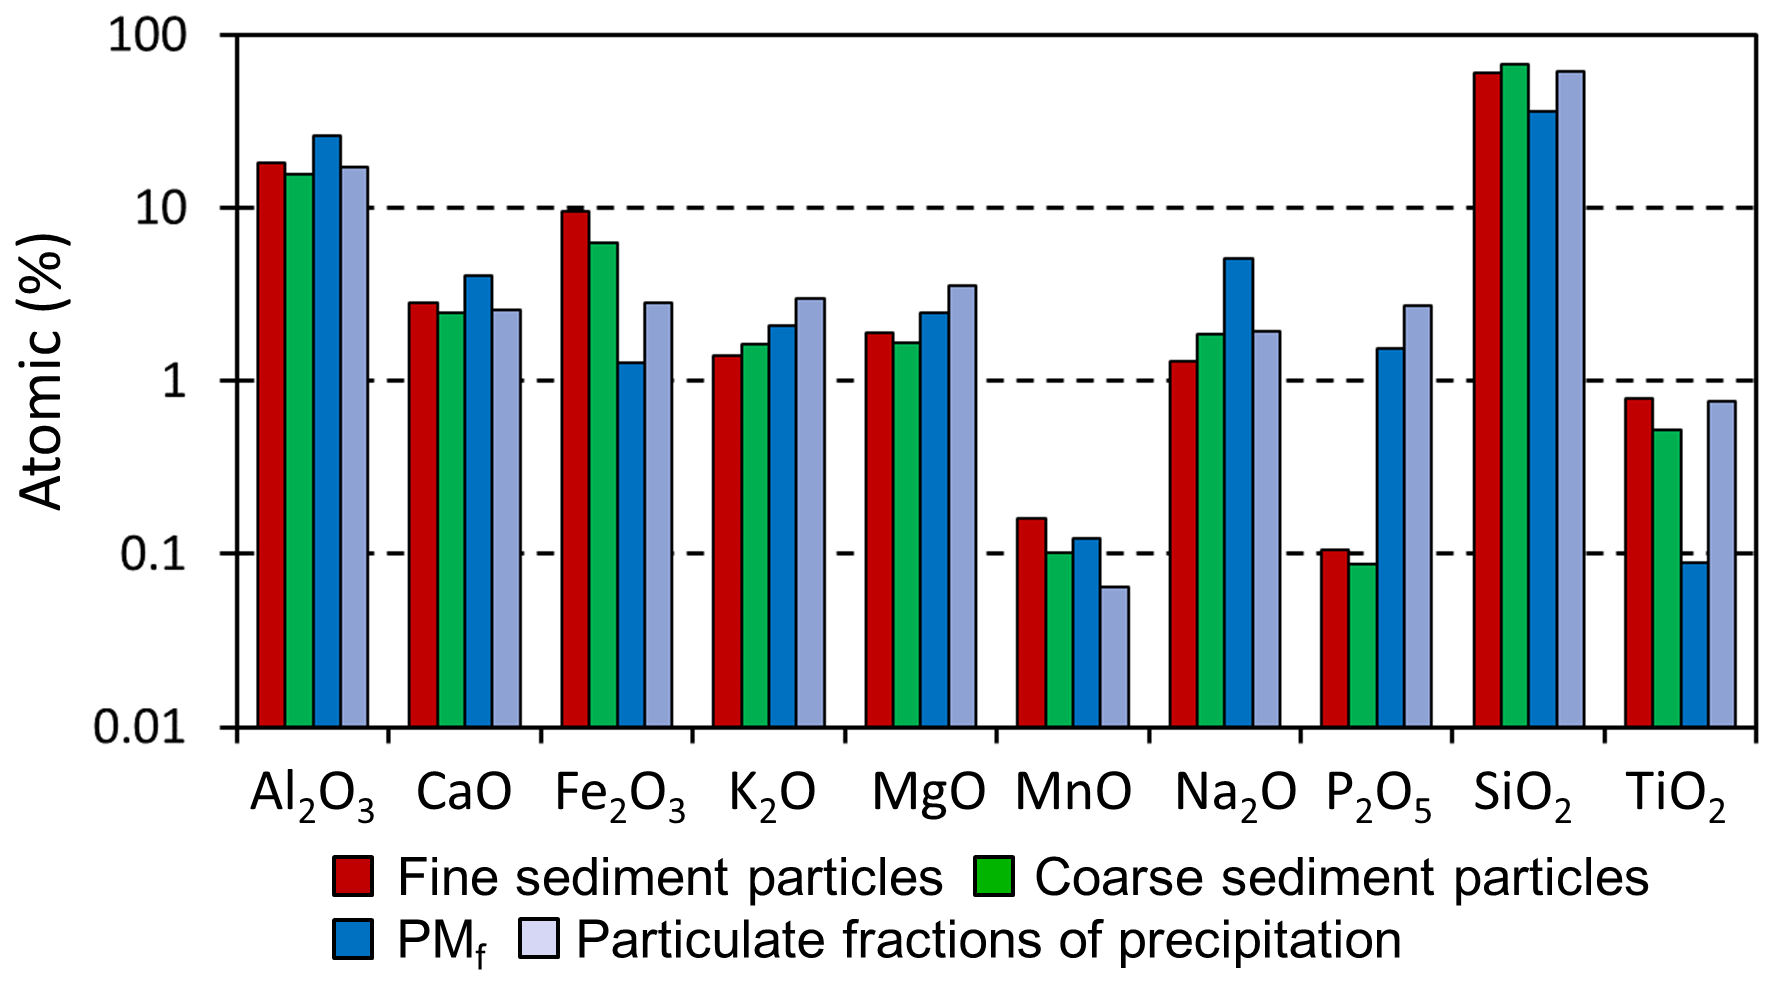
Figure 7Periodic mean chemical compositions of fine particles and coarse particles in sediments, PMf, and the precipitation filter (the particulate fraction of precipitation) measured by XRF.
The findings from the current section are summarized as follows. The mean compositions of both fine and coarse sediment particles are similar to those of biotite, which absorbs radio-Cs efficiently. A similar composition feature was observed for the particulate fractions of precipitation. The composition of PMf was slightly different from those of the other samples, but the 137Cs concentrations in PMf became larger when the relative fractions of SiO2, the major component of biotite, increased. Thus, biotite may have played a key role in the environmental behavior of radio-Cs in Fukushima city since September 2014. However, the major carriers of radio-Cs before September 2014 and those in the dissolved fractions in precipitation are still unknown.
3.5 Comparison with the simulation results and climatological deposition velocity analysis
In Fig. 8, the concentrations of 137Cs in 2013 simulated by Kajino et al. (2016) are compared with the time-resolved observation data (Fig. 2). Kajino et al. (2016) included 137Cs resuspended from bare soil, 137Cs resuspended from forest ecosystems, and additional 137Cs emissions from the FDNPP. The additional 137Cs emissions were negligibly small in East Japan, with concentrations that were 2–3 orders of magnitude smaller than those from the two abovementioned sources; therefore, the additional 137Cs emissions are not depicted in the figure. The simulation was successful in explaining the magnitude and seasonal variations in concentrations at Tsushima and Tsukuba, but the simulation in Fukushima city disagreed with the observations. The simulation showed an enhancement of 137Cs from forests in the summer, but this was not detected in the observations. The observed magnitude and seasonal trends are rather similar to those simulated for 137Cs from soil dust.
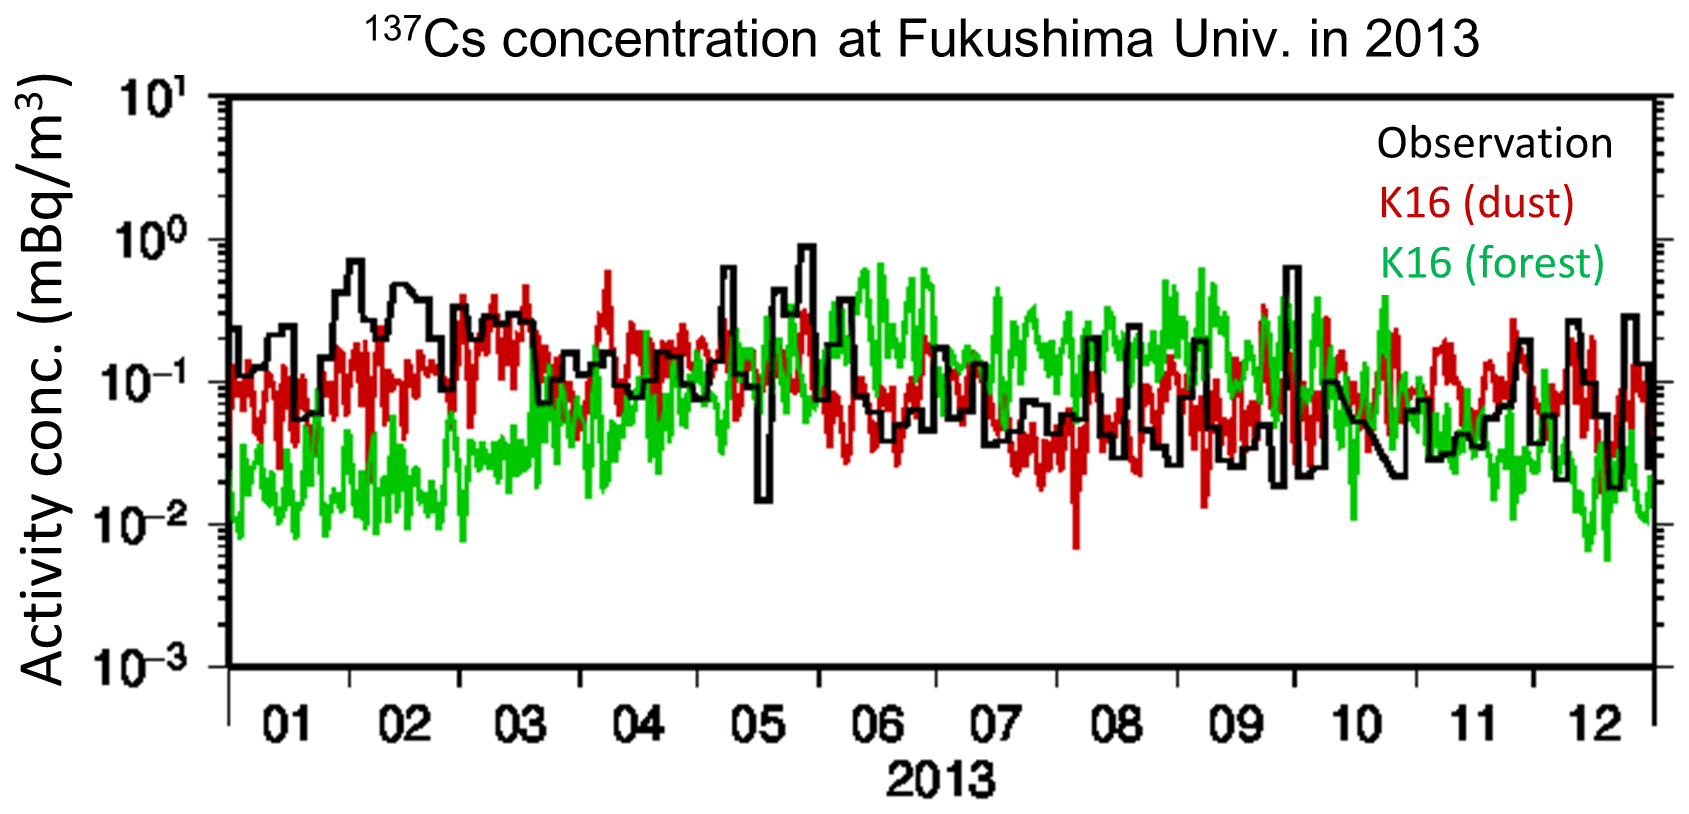
Figure 8Time series of (black) measured airborne surface concentrations of 137Cs and those simulated (by Kajino et al., 2016; K16) considering different emission sources, mineral dust from bare soil (red) and aerosols emitted from forest ecosystems (lime).
Kajino et al. (2016) used only the observed concentrations to estimate the regional budget of resuspended 137Cs in the air, but we used the observed deposition to evaluate the model, as shown in Fig. 9. Suppose there is a simple nonlinear relationship between the deposition (D) and airborne surface concentration (C):
where a represents a removal rate, and b represents nonlinearity, such as spatial and temporal variabilities. If one can take a long-term average of D and C, Eq. (1) may hold. Equation (1) is reformulated as
The log–log scatterplot between the monthly mean concentrations and monthly cumulative deposition of observed (purple) and simulated (orange) 137Cs is depicted in Fig. 9a. The coefficient of determination of the observation was 0.68, with a risk factor <0.1 %. Equation (1) holds for the monthly mean resuspended 137Cs at Fukushima University. As seen in Eq. (2), the intercept of the y axis indicates the removal rate a. log(a) is dimensionless, but if b is close to 1, the unit of a can be meters per second (m s−1). From Fig. 9, the value of b for observation is close to 1. Therefore, the ratios of the monthly deposition amounts to the monthly mean concentrations are referred to as the climatological deposition velocity (m s−1). Time series of the climatological deposition velocity are presented in Fig. 9b. Note that the concept of climatological deposition velocity differs from that of dry deposition velocity. The dry deposition velocity is defined as the ratio of the mass flux divided by the concentrations, but this climatological deposition velocity is only the ratio of total (dry plus wet) deposition amounts divided by concentrations without the concept of mass flux. To account for the wet deposition flux, both in-cloud and below-cloud concentrations are needed, but such vertical measurement data are not available.
Figure 9a clearly shows that the removal rate (a) used in Kajino et al. (2016) can be underestimated by 1–2 orders of magnitude. The deposition velocities used in Kajino et al. (2016) were estimated from the observation of 137Cs in March 2011, which was supposed to be mainly composed of submicron water-soluble particles. However, the current study and the series of previous studies regarding resuspended 137Cs indicated that the host particles of 137Cs could be substantially larger (e.g., soil and bioaerosols). This may be the reason for the overestimation of the simulated 137Cs concentration from forests during summer in Fukushima city. If the deposition velocities of the model increased by 1–2 orders of magnitude, the transport of 137Cs from the contaminated forest to Fukushima city in summer may decrease such that the simulated concentration in Fukushima city agrees with the observation. Certainly, their simulated regional budget needs to be reassessed using the realistic deposition velocities indicated in the current study.
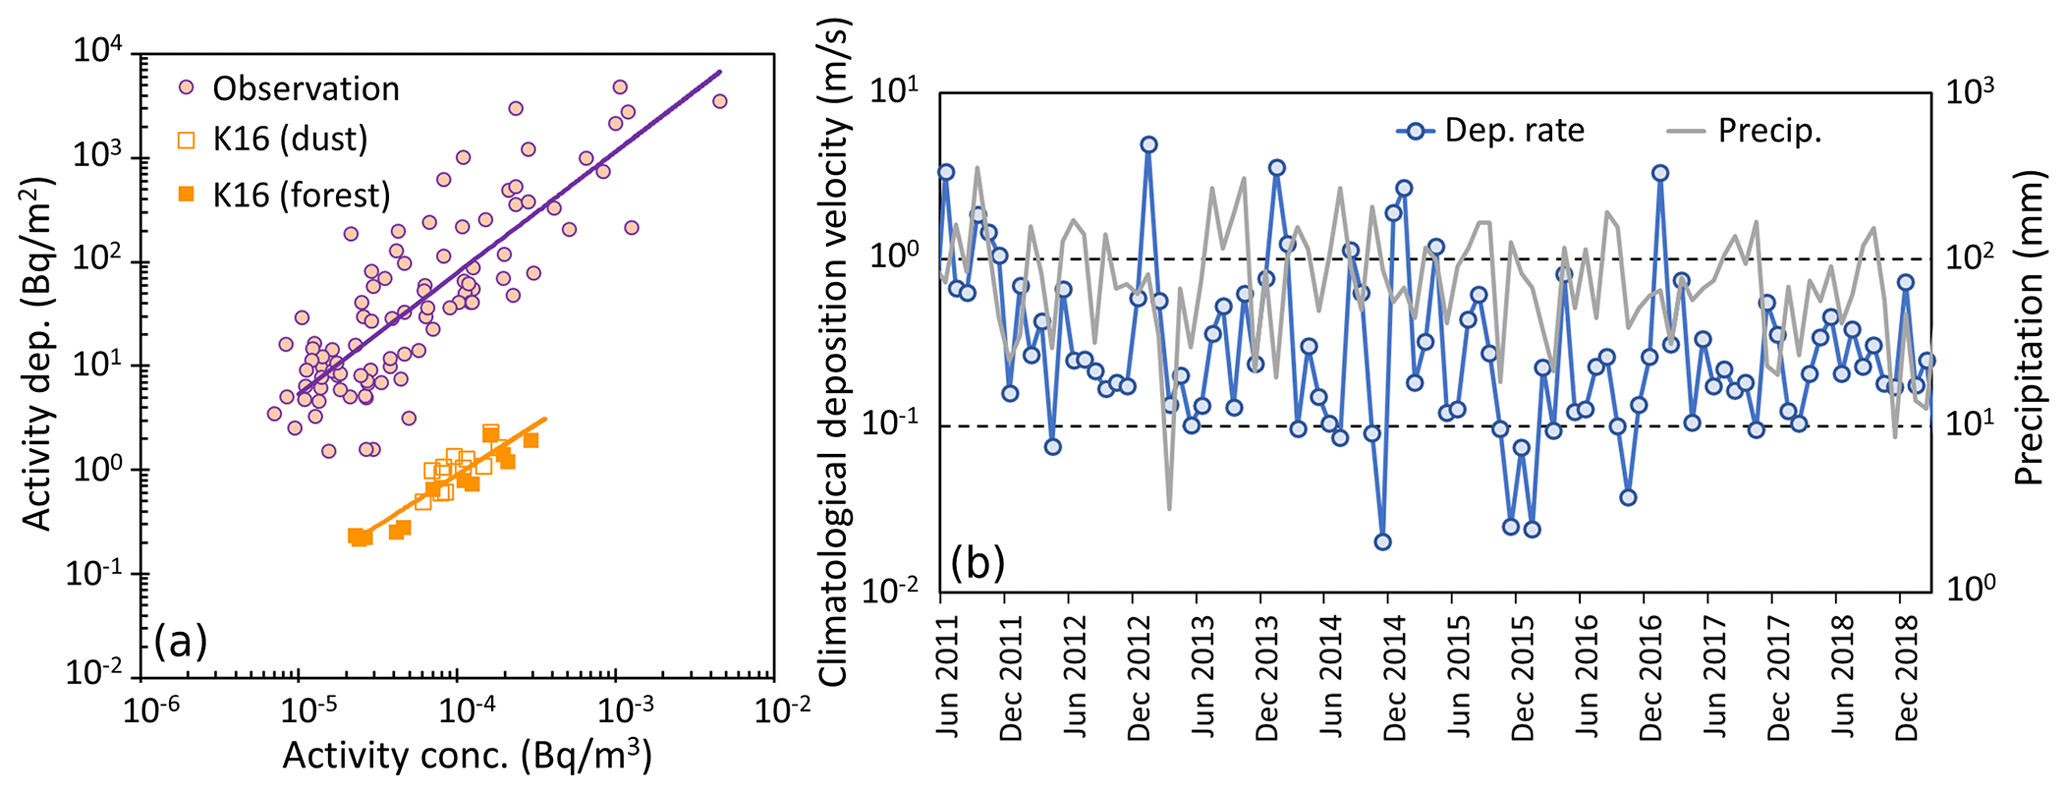
Figure 9(a) Scatterplot of (purple circles) observed airborne surface concentrations and deposition of 137Cs as well as those simulated (by Kajino et al., 2016; K16) considering different emission sources, mineral dust from bare soil (orange open squares) and aerosols emitted from forest ecosystems (orange solid squares). The purple and orange lines indicate the regression lines of the observed data and the simulated (both dust and forest) data, respectively. (b) Time series of (blue) climatological deposition velocity on the left axis and (gray) precipitation amounts on the right axis.
The observed climatological deposition velocity varied by more than 1 order of magnitude over time. There are two main deposition mechanisms: dry deposition and wet deposition. Wet deposition is associated with precipitation. The variations in the climatological deposition rate seem to agree with the observed precipitation, but almost no correlation was observed (R∼0.10). The mean climatological deposition velocity was m s−1, and the peak values occurred in January. The maximum value was 4.9 m s−1 in January 2013, when the monthly precipitation was not very high (81.2 mm). Possible reasons for these peaks in January are discussed later, in Sect. 4.3. The typical order of the dry deposition velocity of supermicron (1–10 µm in diameter) particles is approximately 10−3–10−2 m s−1 (e.g., Petroff and Zhang, 2010), which is substantially lower than the values in our climatological deposition velocity analysis. As mentioned above, the magnitudes of the instant deposition velocity and our climatological deposition velocity are not directly comparable, but it demonstrates the efficacy of wet deposition as compared with dry deposition. Wet deposition plays an important role in the removal of resuspended 137Cs-bearing particles from the air.
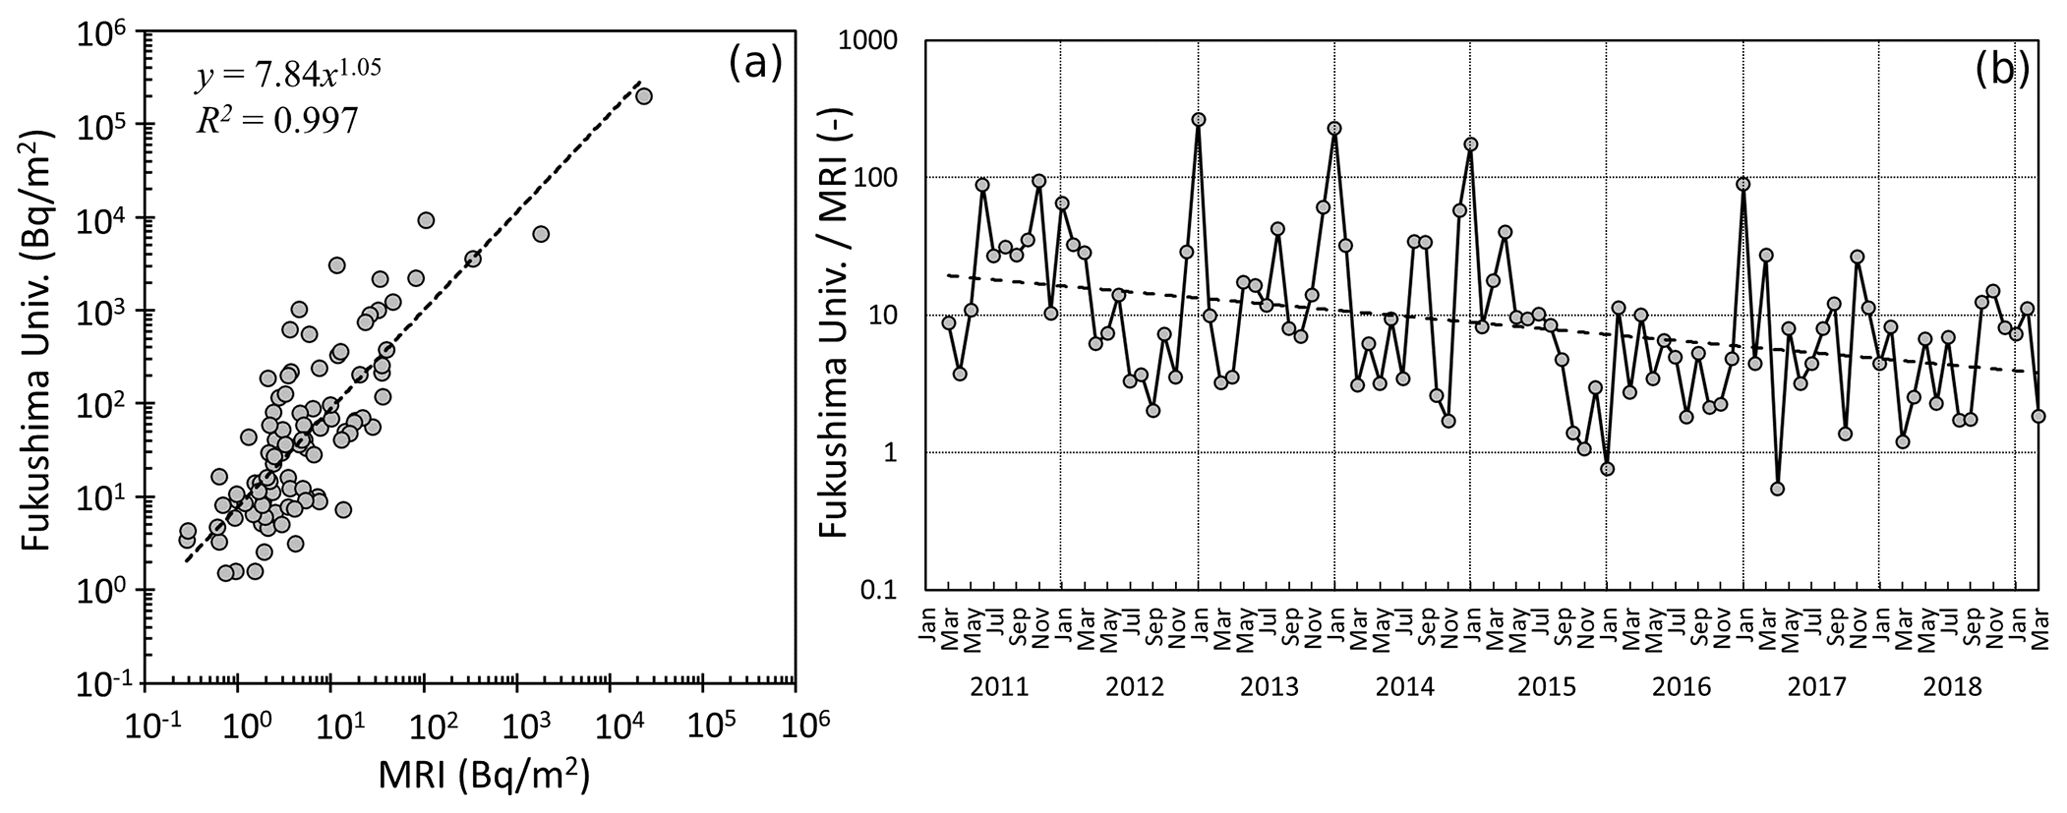
Figure 10(a) Scatterplot of the observed surface deposition of 137Cs at Fukushima University and the MRI from March 2011 to March 2019, with a regression line. (b) Time series of the ratio of deposition at Fukushima University to deposition at the MRI, with a regression line.
3.6 Comparison of deposition amounts at Fukushima University and the MRI
Figure 10 compares the deposition amounts of 137Cs at Fukushima University (60 km northwest of the FDNPP) and the MRI (170 km southwest of the FDNPP) from March 2011 to March 2019. The deposition data at the MRI are available from Environmental Radioactivity and Radiation in Japan (https://www.kankyo-hoshano.go.jp/data/database/, last access: 14 June 2021). There was a significant positive correlation between the deposition amounts of 137Cs at the two sites, but the ratios varied substantially over time. Figure 10b indicates that the deposition ratios at the two sites were approximately 10, which is almost the same level as the initial amounts (202×103 Bq m−2 at Fukushima University and 17.6×10³ Bq m−2 at the MRI), with a variation of more than 1 order of magnitude and peaks in winter (especially January) that decreased slightly over time. Figure 9b shows that the January peak is typical in Fukushima city and was not observed at the MRI. The possible reasons for the January peak in Fukushima city are discussed later, in Sect. 4.3. The slight decreasing tendency was probably due to decontamination, which was ongoing in Fukushima during the period until 2018, as shown later in Table 1. Certainly, natural variations could also have contributed to the decreasing tendency.
Even 8 years after the FDNPP accident, the airborne surface concentration of 137Cs has not fallen to the level prior to the accident, which was at an order of magnitude of 10−6 Bq m−3. In “difficult-to-return” zones, the concentrations sometimes still exceed 10−2 Bq m−3. Based on long-term measurements, this study tries to understand the characteristics of radio-Cs in the air and its deposition and to reveal its origins in order to identify effective ways to reduce radioactivity in contaminated terrestrial ecosystems.
4.1 Seasonal variation and possible sources
The current study clearly shows that the concentrations of 137Cs are high from winter to spring, with peaks in March, and low from summer to autumn in the urban/rural area of Fukushima city (60 km northwest of the FDNPP). It also shows that the deposition amounts of 137Cs are high in the winter, especially in January, and low from summer to autumn. This seasonal trend is the opposite of that observed in a forested area in the Abukuma Highlands (Tsushima, 30 km northwest of the FDNPP), which was high in the summer (Ochiai et al., 2016; Kinase et al., 2018). From winter to spring, northwesterly winds prevail over the region associated with migrating disturbances, while southeasterly winds prevail over the region associated with the Pacific high pressure system. The three simulated monthly mean surface wind fields for January to March and June to August are shown in Kajino et al. (2016).
In summer, Fukushima city is downwind of Tsushima. The concentrations of 137Cs at Tsushima are approximately 10 times greater than those in Fukushima city, but there is no enhancement of 137Cs in summer. The traveling distances of carrier aerosols depend on their aerodynamic diameters. The distance between the two sites is approximately 30 km. The traveling distances of aerosols below <10 µm are not very different and are larger than 100 km because their gravitational deposition velocities are negligibly small. On the other hand, the traveling distances rapidly decrease proportionally to a square of the diameter above 10 µm, and the traveling distance of an aerosol with a diameter of several tens of micrometers is on the order of 10 km (Kajino et al., 2021). Igarashi et al. (2019a) reported that the major proportions of bioaerosols in forests in summer are smaller than 5 µm in diameter and can travel a fairly long distance. Pollen is much larger than 10 µm, but pollen emission is limited in summer (Igarashi et al., 2019a). Consequently, there was a significant enhancement in concentrations in the forests in summer but no enhancement in the downwind urban/rural areas, probably because the carrier aerosols were efficiently deposited onto the ground surface by wet deposition in addition to dry deposition before significant amounts of atmospheric 137Cs reached the downwind areas. Consistent with our findings presented in Fig. 5, 137Cs in PMc was more abundant than that in PMf and the backup filter particles in summer. To obtain a quantitative understanding of the regional cycle of atmospheric 137Cs in the northern part of Fukushima Prefecture, accurate simulations are required in the future.
In winter and spring, the concentrations of 137Cs are probably enhanced due to local emissions from nearby sources because the location of the sampling site is upwind of the Abukuma Highlands and the ground surface in areas upwind of the sampling site in the season (northwest directions) is less contaminated than the site. In winter and spring, 137Cs in the backup filter particles and PMf is pronounced in Fukushima city. These characteristics are somewhat different from those reported in previous studies. Miyamoto et al. (2014) measured the size distributions of radio-Cs with a cascade impactor for two periods, from 17 March to 1 April and from 9 to 13 May 2011, at a site 120 km southwest of the FDNPP. They showed that the peak size ranges were 1.2–2.1 and 0.65–1.1 µm in the former and latter periods, respectively. Doi et al. (2013) reported that the peak diameters of the 137Cs concentration from 4 to 11 April were 1.0 and 1.5 µm at Tsukuba, 170 km southwest of the FDNPP. Kaneyasu et al. (2017) measured the size distributions of 137Cs and other chemical components six times at Tsukuba from April to September 2011. The peak diameter ranges were 0.49–0.7 µm in the earlier stages (before 9 June), but the contributions of coarse-mode particles (>1 µm) increased after 9 June, and the second modes appeared in the ranges of 3.5–5.2 and 7.8–11 µm in July and September, respectively. Judging from their measured mass size distributions of Ca, which is assumed to originate from mineral soil, Kaneyasu et al. (2017) concluded that soil particles could be the major carrier of resuspended radio-Cs in Tsukuba. Our XRF analysis indicated that radio-Cs is carried mainly by soil particles in Fukushima city, but the size distributions are greater in PMf (<2.5 µm) and in the backup filter particles. If radio-Cs is carried by soil particles, it is natural to presume that the fractions of radio-Cs in PMc would be large (e.g., Fig. 3 of Kaneyasu et al., 2012, or Fig. 4 of Kaneyasu et al., 2017). One could argue that the bounced coarse-mode soil particles are observed in the backup filters, but, in fact, the seasonal mean 137Cs concentrations in the backup filter are positively correlated with PMf and negatively correlated with PMc (Fig. 5). One could further argue that bounced large particles are also collected in PMf despite the special procedures employed to prevent rebound in the impactor–cyclone system.
There are four possible explanations for these results:
-
If the bouncing effect did not occur in either system, the major sources of radio-Cs in Fukushima city are probably related to combustion (a mass peak below 0.39 µm means that the number peak is approximately 100 nm).
-
If the bouncing effect occurred only in the cascade impactor, the size distributions of soil particles in Fukushima city are smaller, or radio-Cs in the soil exists more within finer particles.
-
If the bouncing effect occurred only in the cascade impactor, the coarse-mode fraction deposits to the ground surface faster than the fine-mode fraction, such that the proportion of radio-Cs in PMf is larger in Fukushima city.
-
The bouncing effect occurs in both systems, and the origin of radio-Cs is coarse-mode soil particles.
Point 1 is less likely because there is little chance of the artificial combustion of contaminated biomass. In fact, there were no temporal correlations between the 137Cs and levoglucosan (a biomass burning marker) concentrations at Tsushima during the forest fire event in the Abukuma Highlands that occurred in March 2013 (Kinase et al., 2018). Point 3 is also less likely because long-range transport (at least 100 km) is required for the major proportions of coarse-mode particles to deposit to the ground surface, whereas Fukushima city is characterized as the emission source region in that season. In terms of point 2, the latter sentence, “radio-Cs in the soil exists more with finer particles”, contradicts Kaneyasu et al. (2017), suggesting that radio-Cs is uniformly distributed on the surface of soil particles. Point 4 is possible, as Okuda et al. (2015) showed that a long-duration impactor–cyclone measurement could be associated with the bouncing effect despite the use of silicone oil. Further experiments are required to determine whether point 2 or point 4 is more likely and whether some sources are missing. As Kaneyasu et al. (2012) and (2017) reported, comparing the size distributions of 137Cs with those of other chemical components in Fukushima city would be an effective way to investigate the origin of resuspended radio-Cs from winter to spring. Alternatively, a PM2.5 cyclone or virtual impactor could be used to separate the fine-mode and coarse-mode particles and completely exclude the bouncing effect.
4.2 Differences in trends before and after approximately 2015 (natural variation and decontamination)
As described in Sect. 3.1 and 3.2, distinct decrease rates were observed before and after approximately 2015 in both the concentrations and the deposition. There may be two main reasons for this: natural variation and decontamination. Natural variation (the dissolved fractions of precipitation or the exchangeable proportions of forest soils discharging faster than other forms from the local ecosystems; Manaka et al., 2019) has been previously described, and the effect of decontamination is presented in some detail here.
Table 1Decontamination achievement ratios in Fukushima city and the surrounding municipalities (Nihonmatsu city, Kawamata towna, Date city, and Koori town).
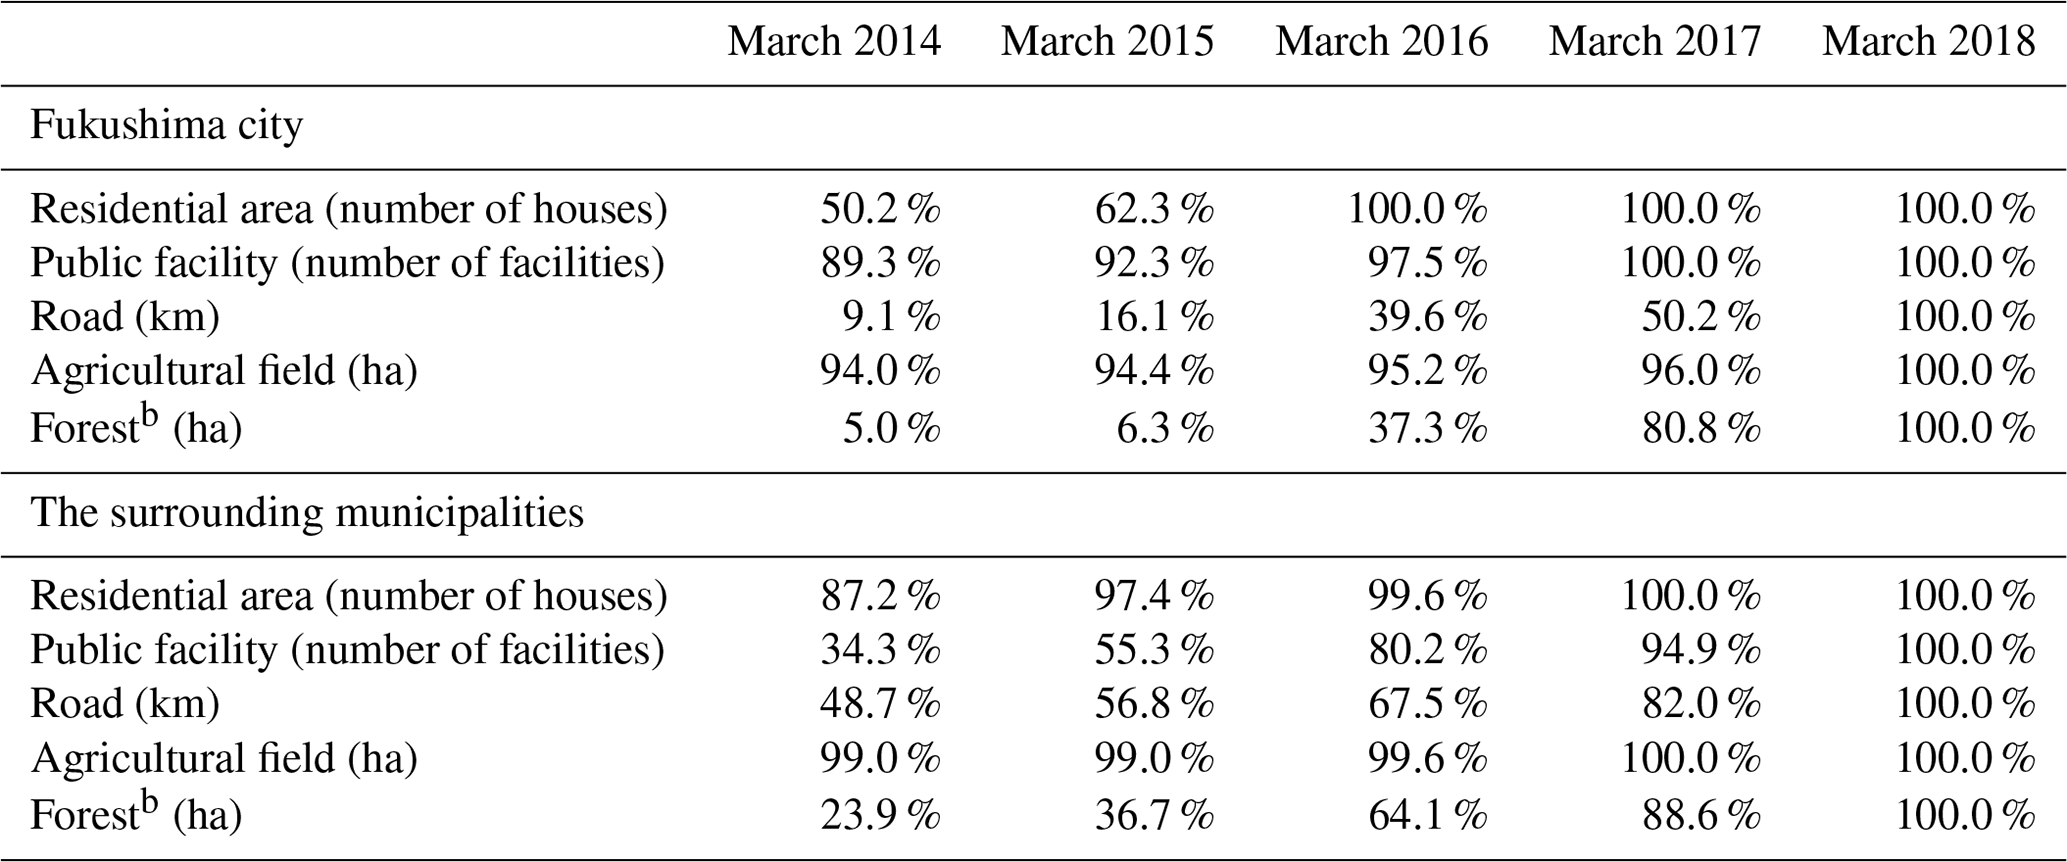
a Only the western part of Kawamata town. The decontamination of areas
with an annual cumulative dose exceeding 20 mSv was assigned to the central
government, and the decontamination in areas with a dose below 20 mSv was assigned to
municipal governments. The decontamination of the eastern part of Kawamata
town was conducted by the central government.
b Removal of the litter layer in forests within 20 m of the forest
edge.
Table 1 summarizes the achievement ratios of the scheduled decontamination of different land use types in Fukushima city and the surrounding municipalities (available at https://www.pref.fukushima.lg.jp/site/portal/progress.html, last access: 14 June 2021). The municipalities are in the northern part of Fukushima Prefecture, which comprises 55 % forest area, 15 % farmland area, 6 % residential area, and 23 % other areas (https://www.pref.fukushima.lg.jp/uploaded/attachment/42042.pdf, last access: 14 June 2021). More than 94 % decontamination was achieved for the farmland area by March 2014. For the residential and public facility areas, some parts were decontaminated by March 2014, but others were not fully decontaminated until March 2018. For the road and forest areas, decontamination was not completed in most areas by March 2014, but extensive decontamination was conducted from 2014 to 2018. Note that only a part of the forest (20 m from the forest edges) was decontaminated, which accounts for approximately 1 % of the whole forest area of the northern part of Fukushima Prefecture. Additionally, only the litter layer of the forest was removed, and the soil layer remained.
If one assumed that contamination occurred independently of the land use type, approximately 30 % (farmland and half of the residential and other land types) of northern Fukushima was decontaminated by 2014, and an additional 15 % (half of the residential and other land types) was continuously decontaminated by 2018. The difference between the decrease rate from May 2011 to December 2014 (93.1 % yr−1) and that afterwards (30.7 % yr−1) was higher than the decontamination rate (30 %–45 % every 3–7 years). If the concentration at Fukushima University was affected mainly by the emissions from nearby sources (i.e., within the northern part of Fukushima Prefecture), decontamination would not be the sole reason for the change in the decrease rates before approximately 2015 and after this period. Natural variation (i.e., regime changes in the chemical forms of radio-Cs) would likely have occurred during that period. As previously discussed, biotite may have played a key role in the environmental behaviors of radio-Cs in Fukushima city after approximately 2015, but the current study could not identify the key aerosol particles that carried dissolved (or exchangeable) radio-Cs and were abundant in Fukushima city before approximately 2015.
4.3 Substantial deposition amounts in January in Fukushima city
The climatological deposition velocities (or the ratios of the deposition rate to the mean airborne surface concentration) in Fukushima city were remarkably high in January 2013, 2014, 2015, and 2017 (Fig. 9). They were approximately 1 order of magnitude larger than those in the other months. The ratio of the deposition in Fukushima to that at the MRI was approximately 10 on average, but the ratios in January of those years exceeded 100 (Fig. 10). On the other hand, no peaks were observed in January of 2012, 2016, or 2018.
There are two possible explanations for these results: vertical distribution and the existence of superlarge particles. In terms of the former, the substantial proportions of 137Cs in the upper air may have caused lower concentrations but higher deposition due to the wet removal of 137Cs aloft. However, due to the northwesterly winter monsoon, the upper air over Fukushima city is also upwind of the Abukuma Highlands; thus, this possibility is less likely. In terms of the latter, superlarge particles (∼100 µm or larger in diameter) have settling velocities that are too high (as high as those of drizzle droplets) to enter the high-volume air sampler but that allow them to settle efficiently in a deposition sampler. Unfortunately, however, analyses of the surface meteorological observational data for Fukushima city from the JMA, such as temperature, precipitation, snow cover, and wind speed data, did not reveal the differentiating features between the years with (2013, 2014, 2015, and 2017) and without (2012, 2016, and 2018) high deposition peaks.
Eight years of atmospheric 134Cs and 137Cs measurements conducted at Fukushima University from March 2011 to March 2019 are summarized in this study. A high-volume sampler, a cascade impactor, and an impactor–cyclone system were used to collect aerosol samples, and the airborne surface concentrations of radio-Cs were detected by high-purity germanium detectors. A precipitation sampler was used to collect deposition samples, and the dissolved and particulate fractions of radio-Cs in the samples were measured. X-ray fluorescence (XRF) analysis was carried out to measure the elemental contents of the aerosol and precipitation samples. The concentration and deposition data measured at Fukushima University were compared with numerical simulation results.
The major findings are itemized as follows:
-
The observed radio-Cs concentrations and deposition at Fukushima University (an urban/rural area of Fukushima city, 60 km northwest of the FDNPP) were high in winter and low in summer; these seasonal trends are the same as those observed in the city area (Kitayama et al., 2016) and the opposite of those observed in a contaminated forest area (30 km northwest of the FDNPP, in the Abukuma Highlands) (Ochiai et al., 2016; Kinase et al., 2018). Resuspension due to bioaerosol emissions (Kinase et al., 2018; Igarashi et al., 2019a) may be substantial in forests but may not be in urban/rural areas. The half-life (Th) and decrease rate (Rd) for the 8 years were 1.24 years and 55.9 % yr−1 for the concentrations and 2.49 years and 27.8 % yr−1 for the deposition, respectively.
-
The bioavailability of different chemical forms of radio-Cs in soils may be an important factor determining the tendencies of concentrations and deposition at Fukushima University. The decreasing tendencies changed around 2015 and were associated with changes in the dissolved/particulate fractions of 137Cs in precipitation. The Th and Rd for concentrations before 2015 were 0.754 years and 92.0 % yr−1, respectively, whereas they were 2.07 years and 33.5 % yr−1 after 2015, respectively. The Th and Rd for deposition before 2015 were 1.30 years and 53.4 % yr−1, respectively, whereas they were 4.69 years and 14.8 % yr−1 after 2015, respectively, and 12.7 years and 5.5 % yr−1 after 2016, respectively. The dissolved fractions were higher before 2015, whereas the particulate fractions were higher after 2016. This may have been because the dissolved proportion of radio-Cs discharged faster than its particulate forms from the local terrestrial ecosystems. Decontamination likely also contributed to the difference because the decontamination of some land use types, such as agricultural fields, was completed before 2014, and 100 % of the planned decontamination was completed by March 2018. The contribution of decontamination was estimated to be 30 %–45 % for the 3–7 years in this study, which is significantly smaller than the differences in the Rd of the concentrations (92.0 % yr−1 before 2015 and 33.5 (5.5) % yr−1 after 2015 (2016)). Therefore, decontamination may play a partial role in explaining the differences in Th and Rd before and after 2015, but changes in the chemical forms of radio-Cs likely play a major role.
-
The size-resolved measurements revealed that seasonal variations in 137Cs of different sizes are different from each other. Due to the possible bouncing effect of the cascade impactor and long-duration measurement of the impactor–cyclone system, it is hard to quantify the values, but the current measurement indicates that the dominant particles and their sizes may be distinct depending on the season. The XRF analysis showed that biotite may have played a key role in the environmental circulation of particulate forms of resuspended radio-Cs in Fukushima city after September 2014.
Certain issues remained unresolved, and topics for future study are summarized as follows:
-
The height of our measurement (building roof) is higher than the other measurements referenced in this study (near the ground). When the observation site is characterized as an emission source, there should be a clear vertical difference in concentration; thus, the concentration measured at Fukushima University is not equivalently comparable with the other location data. It may be comparable when the site is characterized as a downwind region, as turbulent mixing during transport may reduce the vertical difference. In the future, parallel sampling near the ground and rooftop will need to be installed to characterize the sampling locations and to quantify the vertical differences at the Fukushima University site.
-
The rebound issue of the impactor and the cyclone/impactor instruments have not yet been resolved. Parallel sampling is also required for the size-resolved measurements using normal filters and filters with adhesive materials such as vacuum grease. The additional microscopy of the filters is even more useful.
-
The Abukuma Highlands are upwind of Fukushima city in summer. The enhancement of 137Cs in PMc in summer is consistent with the fact that most bioaerosols exist in the coarse mode. However, if radiocesium is carried mainly by biotite (i.e., soil particles) in winter, there should be an enhancement of 137Cs in PMc because major proportions of soil particles exist in the coarse mode (e.g., Kaneyasu et al., 2017). On the other hand, sources of Cs-bearing fine-mode particles such as combustion emissions may be less likely. Thus, the main carrier of radio-Cs may be biotite in winter, but this is still not fully confirmed. XRF measurements were conducted for PMf from September 2014 to January 2018, when the particulate proportions were dominant in the precipitation. Thus, the carrier aerosols of dissolved radio-Cs in Fukushima city are still unknown. As Kaneyasu et al. (2012) and (2017) reported, comparisons of the size distributions of 137Cs with those of other chemical components in Fukushima city would be an effective way to investigate the origin of resuspended radio-Cs from winter to spring. Alternatively, a PM2.5 cyclone or virtual impactor could be applied to separate the fine-mode and coarse-mode particles, which can completely exclude the bouncing effect.
-
The simulation used in this study was made to be consistent with the concentrations in a contaminated forest (Tsushima) and those in a downwind area (the MRI, 170 km southwest of the FDNPP). However, the current study found that the simulated seasonal variation in Fukushima city was the total opposite of that for the observations. The current study indicated that the deposition velocities applied in the simulation were significantly underestimated. Numerical simulation is a powerful tool for quantitative assessment, but the current simulation requires further improvement. The reasons for the seasonal variations in concentrations and deposition in the different locations need to be investigated with an improved model.
-
The deposition amounts of 137Cs in January at Fukushima University were remarkably high compared to the concentrations of 137Cs and the deposition amounts of 137Cs at the MRI. The reason needs to be investigated in the future.
The observation data used in the study are provided as a Microsoft Excel file in the Supplement.
The supplement related to this article is available online at: https://doi.org/10.5194/acp-22-675-2022-supplement.
AW, KN, and AS conducted the long-term measurements. YN performed the XRF analysis, and MK performed the numerical simulation. AW, MK, and KN designed the structure of the paper and completed the draft with input from all co-authors.
The contact author has declared that neither they nor their co-authors have any competing interests.
Publisher's note: Copernicus Publications remains neutral with regard to jurisdictional claims in published maps and institutional affiliations.
The authors thank Teruyuki Nakajima (National Institute for Environmental Studies) and Haruo Tsuruta (Remote Sensing Technology Center) for proving and installing a high-volume sampler and Naohiro Yoshida (Tokyo Institute of Technology) for the installation of an impactor observation system. The authors are grateful to Shogo Togo (Isotope Research Center of the University of Tokyo) for the radioactivity measurements of the initial samples and to Yoshiaki Yamaguchi, Zijian Zhang, Makoto Inagaki, Shunsuke Kakitani, Kazuya Fujihara, and Nobufumi Fujita (Osaka University) for their support with the radioactivity measurements of the air samples. The authors also thank Kakeru Konnai (University of Tsukuba) for data visualization, Akane Saya (MRI) for a useful discussion on aerosol deposition processes, and Tomoaki Okuda (Keio University) for a useful discussion on the possible artifacts in the impactor measurements.
This research has been supported by the Japan Society for the Promotion of Science, Grants-in-Aid for Scientific Research (KAKENHI) (grant nos. JP16H01777 and JP24110009); the Sumitomo Foundation's environmental studies grant; and the Environmental Restoration and Conservation Agency of Japan via the Environment Research and Technology Development Fund (grant no. JPMEERF20215003).
This paper was edited by Stefano Galmarini and reviewed by three anonymous referees.
Adachi, K., Kajino, M., Zaizen, Y., and Igarashi, Y.: Emission of spherical cesium-bearing particles from an early stage of the Fukushima nuclear accident, Sci. Rep.-UK, 3, 12–15, https://doi.org/10.1038/srep02554, 2013.
Ager, A. A., Lasko, R., Myroniuk, V., Zibtsev, S., Day, M. A., Usenia, U., Bogomolov, V., Kovalets, I., and Evers, C. R.: The wildfire problem in areas contaminated by the Chernobyl disaster, Sci. Total Environ., 696, 133954, https://doi.org/10.1016/j.scitotenv.2019.133954, 2019.
Doi, T., Masumoto, K., Toyoda, A., Tanaka, A., Shibata, Y., and Hirose, K.: Anthropogenic radionuclides in the atmosphere observed at Tsukuba: characteristics of the radionuclides derived from Fukushima, J. Environ. Radioact., 122, 55–62, https://doi.org/10.1016/j.jenvrad.2013.02.001, 2013.
Igarashi, Y., Kita, K., Maki, T., Kinase, T., Hayashi, N., Hosaka, K., Adachi, K., Kajino, M., Ishizuka, M., Sekiyama, T. T., Zaizen, Y., Takenaka, C., Ninomiya, K., Okochi, H., and Sorimachi, A.: Fungal spore involvement in the resuspension of radiocaesium in summer, Sci. Rep.-UK, 9, 1954, https://doi.org/10.1038/s41598-018-37698-x, 2019a.
Igarashi, Y., Kogure, T., Kurihara, Y., Miura, H., Okumura, T., Satou, Y., Takahashi, Y. and Yamaguchi, N.: A review of Cs-bearing microparticles in the environment emitted by the Fukushima Dai-ichi Nuclear Power Plant accident, J. Environ. Radioact., 205–206, 101–118, https://doi.org/10.1016/j.jenvrad.2019.04.011, 2019b.
Igarashi, Y., Onda, Y., Wakiyama, Y., Konoplev, A., Zheleznyak, M., Lisovyi, H., Laptev, G., Damiyanovich, V., Samoilov, D., Nanba, K., and Kirieiev, S.: Impact of wildfire on 137Cs and 90Sr wash-off in heavily contaminated forests in the Chernobyl exclusion zone, Environ. Pollut., 259, 113764, https://doi.org/10.1016/j.envpol.2019.113764, 2020.
Ikehara, R., Morooka, K., Suetake, M., Komiya, T., Kurihara, E., Takehara, M., Takami, R., Kino, C., Horie, K., Takehara, M., Yamasaki, S., Ohnuki, T., Law, G. T. W., Bower, W., Grambow, B., Ewing, R. C., and Utsunomiya, S.: Abundance and distribution of radioactive cesium-rich microparticles released from the Fukushima Daiichi Nuclear Power Plant into the environment, Chemosphere, 241, 125019, https://doi.org/10.1016/j.chemosphere.2019.125019, 2020.
Iwagami, S., Onda, Y., Tsujimura, M., and Abe, Y.: Contribution of radioactive 137Cs discharge by suspended sediment, coarse organic matter, and dissolved fraction from a headwater catchment in Fukushima after the Fukushima Dai-ichi Nuclear Power Plant accident, J. Environ. Radioact., 166, 466–474, https://doi.org/10.1016/j.jenvrad.2016.07.025, 2017.
Kajino, M., Ishizuka, M., Igarashi, Y., Kita, K., Yoshikawa, C., and Inatsu, M.: Long-term assessment of airborne radiocesium after the Fukushima nuclear accident: re-suspension from bare soil and forest ecosystems, Atmos. Chem. Phys., 16, 13149–13172, https://doi.org/10.5194/acp-16-13149-2016, 2016.
Kajino, M., Adachi, K., Igarashi, Y., Satou, Y., Sawada, M., Thomas Sekiyama, T., Zaizen, Y., Saya, A., Tsuruta, H. and Moriguchi, Y.: Deposition and Dispersion of Radio-Cesium Released due to the Fukushima Nuclear Accident: 2. Sensitivity to Aerosol Microphysical Properties of Cs-Bearing Microparticles (CsMPs), J. Geophys. Res.-Atmos., 126, e2020JD033460, https://doi.org/10.1029/2020JD033460, 2021.
Kaneyasu, N., Ohashi, H., Suzuki, F., Okuda, T., and Ikemori, F.: Sulfate aerosol as a potential transport medium of radiocesium from the fukushima nuclear accident, Environ. Sci. Technol., 46, 5720–5726, https://doi.org/10.1021/es204667h, 2012.
Kaneyasu, N., Ohashi, H., Suzuki, F., Okuda, T., Ikemori, F., Akata, N., and Kogure, T.: Weak size dependence of resuspended radiocesium adsorbed on soil particles collected after the Fukushima nuclear accident, J. Environ. Radioact., 172, 122–129, https://doi.org/10.1016/j.jenvrad.2017.03.001, 2017.
Kinase, T., Kita, K., Igarashi, Y., Adachi, K., Ninomiya, K., Shinohara, A., Okochi, H., Ogata, H., Ishizuka, M., Toyoda, S., Yamada, K., Yoshida, N., Zaizen, Y., Mikami, M., Demizu, H., and Onda, Y.: The seasonal variations of atmospheric 134,137Cs activity and possible host particles for their resuspension in the contaminated areas of Tsushima and Yamakiya, Fukushima, Japan, Prog. Earth Planet. Sci., 5, 12, https://doi.org/10.1186/s40645-018-0171-z, 2018.
Kita, K., Igarashi, Y., Kinase, T., Hayashi, N., Ishizuka, M., Adachi, K., Koitabashi, M., Sekiyama, T. T., and Onda, Y.: Rain-induced bioecological resuspension of radiocaesium in a polluted forest in Japan, Sci. Rep.-UK, 10, 1–15, https://doi.org/10.1038/s41598-020-72029-z, 2020.
Kitayama, K., Ohse, K., Shima, N., Kawatsu, K., and Tsukada H.: Regression model analysis of the decreasing trend of cesium-137 concentration in the atmosphere since the Fukushima accident, J. Environ. Radioact., 164, 151–157, https://doi.org/10.1016/j.jenvrad.2016.07.015, 2016.
Kogure, T., Mukai, H., and Kikuchi, R.: Weathered biotite: A key material of radioactive contamination in Fukushima, in: Agricultural Implications of the Fukushima Nuclear Accident (III): After 7 years, edited by: Nakanishi, T. M., O'Brien, M., and Tanoi, K., Springer Open, Singapore, https://doi.org/10.1007/978-981-13-3218-0, 2019.
Manaka, T., Imamura, N., Kaneko, S., Miura, S., Furusawa, H., and Kanasashi, T.: Six-year trends in exchangeable radiocesium in Fukushima forest soils, J. Environ. Radioact., 203, 84–92, https://doi.org/10.1016/j.jenvrad.2019.02.014, 2019.
MEXT (Ministry of Education, Culture, Sports, Science and Technology): The manual for analysis of radiocesium, Issue No. 3 of a Series of Manuals for Measurement of Radioactivity, Japan Chemical Analysis Center, Chiba, Japan, available at https://www.kankyo-hoshano.go.jp/wp-content/uploads/2020/12/No3.pdf (last access: 8 December 2021), 1976 (in Japanese).
Minami, K., Katata, G., Kita, K., Sorimachi, A., Hosaka, K., and Igarashi, Y.: Numerical analyses of transport processes of bioaerosol released from a temperate deciduous broad-leaved forest, Earozoru Kenkyu, 35, 208–218, https://doi.org/10.11203/jar.35.208, 2020 (in Japanese).
Miyamoto, Y., Yasuda, K., and Magara, M.: Size distribution of radioactive particles collected at Tokai, Japan 6 days after the nuclear accident, J. Environ. Radioact., 123, 1–7, https://doi.org/10.1016/j.jenvrad.2014.01.010, 2014.
Nakajima, T., Misawa, S., Morino, Y., Tsuruta, H., Goto, D., Uchida, J., Takemura, T., Ohara, T., Oura, Y., Ebihara, M., and Satoh, M.: Model depiction of the atmospheric flows of radioactive cesium emitted from the Fukushima Daiichi nuclear power station accident, Prog. Earth Planet. Sci., 4, 2, https://doi.org/10.1186/s40645-017-0117-x, 2017.
NRA (Nuclear Regulation Authority): Airborne Monitoring Results in each prefecture, available at: http://radioactivity.nsr.go.jp/en/list/203/list-1.html (last access: 13 January 2022), 2012.
Ochiai, S., Hasegawa, H., Kakiuchi, H., Akata, N., Ueda, S., Tokonami, S., and Hisamatsu, S.: Temporal variation of post-accident atmospheric 137Cs in an evacuated area of Fukushima Prefecture: Size-dependent behaviors of 137Cs-bearing particles, J. Environ. Radioact., 165, 131–139, https://doi.org/10.1016/j.jenvrad.2016.09.014, 2016.
Okuda, T., Isobe, R., Nagai, Y., Okahisa, S., Funato, K., and Inoue, K.: Development of a high-volume PM2.5 particle sample using impactor and cyclone techniques, Aerosol Air Qaul. Res., 15, 759–767, https://doi.org/10.4209/aaqr.2014.09.0194, 2015.
Onda, Y., Taniguchi, K., Yoshimura, K., Kato, H., Takahashi, J., Wakiyama, Y., Coppin, F., and Smith, H.: Radionuclides from the Fukushima Daiichi Nuclear Power Plant in terrestrial systems, Nat. Rev. Earth Environ., 1, 644–660, https://doi.org/10.1038/s43017-020-0099-x, 2020.
Petroff, A. and Zhang, L.: Development and validation of a size-resolved particle dry deposition scheme for application in aerosol transport models, Geosci. Model Dev., 3, 753–769, https://doi.org/10.5194/gmd-3-753-2010, 2010.
Sato, Y., Sekiyama, T. T., Fang, S., Kajino, M., Quérel, A., Quélo, D., Kondo, H., Terada, H., Kadowaki, M., Takigawa, M., Morino, Y., Uchida, J., Goto, D., and Yamazawa, H.: A model intercomparison of atmospheric 137Cs concentrations from the Fukushima Daiichi Nuclear Power Plant accident, phase III: Simulation with an identical source term and meteorological field at 1-km resolution, Atmos. Environ.-X, 7, 100086, https://doi.org/10.1016/j.aeaoa.2020.100086, 2020.
Steinhauser, G., Niisoe, T., Harada, K. H., Shozugawa, K., Schneider, S., Synal, H. A., Walther, C., Christl, M., Nanba, K., Ishikawa, H., and Koizumi, A.: Post-Accident Sporadic Releases of Airborne Radionuclides from the Fukushima Daiichi Nuclear Power Plant Site, Environ. Sci. Technol., 49, 14028–14035, https://doi.org/10.1021/acs.est.5b03155, 2015.
Takase, T.: Study of the existence form of radioactive cesium – In the case of fine particles collected from the suburbs of FDNPP, Grant-in-Aid for Scientific Research Result Reports (grant number 17K00545), 9 pp., available at: https://kaken.nii.ac.jp/ja/file/KAKENHI-PROJECT-17K00545/17K00545seika.pdf (last access: 23 June 2021), 2020.
Takase, T. and Nagahashi, Y.: Determination of major and trace elements in rock samples by X-ray fluorescence spectrometry -Comparison with a glass bands and a powder pellets method-, Journal of the Center for Regional Affairs Fukushima University, 19, 32–47, 2007 (in Japanese).
Terada, H., Nagai, H., Tsuduki, K., Furuno, A., Kadowaki, M., and Kakefuda, T.: Refinement of source term and atmospheric dispersion simulations of radionuclides during the Fukushima Daiichi Nuclear Power Station accident, J. Environ. Radioact., 213, 106104, https://doi.org/10.1016/j.jenvrad.2019.106104, 2020.
WHO (World Health Organization): IARC Monographs on the Evaluation of Carcinogenic Risks to Humans, Ionizing Radiation, Part 2: Some Internally Deposited Radionuclides, IARC Press, 78, 617 pp., 2001.
Yoshimura, K., Saegusa, J., and Sanada, Y.: Initial decrease in the ambient dose equivalent rate after the Fukushima accident and its difference from Chernobyl, Sci. Rep.-UK, 10, 1–9, https://doi.org/10.1038/s41598-020-60847-0, 2020.
The annual resuspension rate to the atmosphere was estimated as 0.047 % yr−1 by Kajino et al. (2016). However, the current study found that the resuspension rate was likely substantially underestimated (see Sect. 3.5 and Fig. 9). A value of approximately 1 % yr−1 was obtained from improved simulations, but that paper is still in preparation.