the Creative Commons Attribution 4.0 License.
the Creative Commons Attribution 4.0 License.
 | 20 May 2022
Joint occurrence of heatwaves and ozone pollution and increased health risks in Beijing, China: role of synoptic weather pattern and urbanization
Lian Zong
Yuanjian Yang
Zhaobin Sun
Zuofang Zheng
Xianxiang Li
Guicai Ning
Yubin Li
Simone Lolli
Heatwaves (HWs) paired with higher ozone (O3) concentration at the surface level pose a serious threat to human health. Their combined modulation of synoptic patterns and urbanization remains unclear. Using 5 years of summertime temperature and O3 concentration observation in Beijing, this study explored potential drivers of compound HWs and O3 pollution events and their public health effects. Three favorable synoptic weather patterns were identified to dominate the compound HWs and O3 pollution events. These weather patterns contributing to enhance those conditions are characterized by sinking air motion, low boundary layer height, and high temperatures. Under the synergy of HWs and O3 pollution, the mortality risk from all non-accidental causes increased by approximately 12.31 % (95 % confidence interval: 4.66 %, 20.81 %). Urbanization caused a higher risk of HWs and O3 in urban areas than at rural stations. Particularly, due to O3 depletion caused by NO titration at traffic and urban stations, the health risks related to O3 pollution in different regions are characterized as follows: suburban stations > urban stations > rural stations > traffic stations. In general, favorable synoptic patterns and urbanization enhanced the health risk of these compound events in Beijing by 33.09 % and 18.95 %, respectively. Our findings provide robust evidence and implications for forecasting compound HWs and O3 pollution events and their health risks in Beijing or in other urban areas all over the world that have high concentrations of O3 and high-density populations.
- Article
(4966 KB) - Full-text XML
-
Supplement
(336 KB) - BibTeX
- EndNote


Climate warming and rapid urbanization have led to increases in the frequency and duration of extreme high-temperature episodes (Lehner et al., 2018; Li et al., 2020; Meehl and Tebaldi, 2004; Wang et al., 2021b; Yang et al., 2017). Such prolonged extreme high-temperature exposure can induce an increase in the morbidity and mortality due to cardiovascular and respiratory diseases, posing a serious threat to human health (Patz et al., 2005; Xu et al., 2016). Therefore, extreme high-temperature events are recognized as one of the most serious types of meteorological disaster worldwide. However, high temperatures during summer heatwaves (HWs) frequently co-occur with serious O3 pollution; for instance, significantly increased O3 concentrations were observed in the UK and France during the August 2013 HW event (Lee et al., 2006; Vautard et al., 2005, 2007). High concentrations of O3 exposure stimulate the human respiratory system, damage lung cells, and aggravate other chronic lung diseases (WHO, 2021), therefore posing a great threat to human health. Consequently, residents may suffer from dual health risks caused by both high temperatures and O3 exposure in summer. Although extreme high-temperature events have received extensive attention from academia and society, research on health risks aroused by O3 pollution associated with high temperature has been neglected. As a result, health risks to humans that are consistently exposed to the outdoors during hot days might be greatly underestimated.
As a continuous extreme case of high-temperature weather in summer, HWs have previously been shown by numerous epidemiological studies to cause significantly higher overall deaths than non-heatwave (NHW) periods (Conti et al., 2005; Fouillet et al., 2006). Subsequently, many scholars launched investigations into the relationship between high-temperature exposure and mortality (Abbas and Mylene, 2005; Huang et al., 2015; Zhang et al., 2017), and they found that when the temperature was higher than a certain threshold, the mortality rate increased with the increase of temperature. Most studies suggested that there were a U-, V-, W-, or J-shaped nonlinear change relationship between daily mortality and daily temperature (Goggins et al., 2012; Huang et al., 2015; Zhang et al., 2017). Similar studies on O3 concentration and mortality have also been conducted (Atkinson et al., 2012; Gu et al., 2018; Pope et al., 2016). In particular, some epidemiological evidence showed that the coefficient of the O3 concentration–response relationship for mortality in summer was higher with respect to other seasons (Pattenden et al., 2010; Pope et al., 2016), suggesting that the health effects and mortality related to O3 pollution were exacerbated by high temperatures. Therefore, the significant increase in O3 concentrations during the summertime is also greatly responsible for the increase in excess mortality; that is, high temperatures and O3 exhibit a joint impact on public health (Hertig et al., 2020; Katsouyanni et al., 1993; Pattenden et al., 2010). Numerous previous studies have been devoted to the individual impacts of a single extreme high-temperature or air pollution event on human health (Ma et al., 2015; Ning et al., 2020; Wang et al., 2020; Wong et al., 2013; Xu et al., 2016). However, with the co-occurrence of extreme HW and O3 pollution events in summer becoming more frequent, it is imperative to reveal the underlying mechanisms of extreme HW–O3 compound events and to improve the level of risk assessment related to extreme events in urban areas (Hertig et al., 2020; Sartor et al., 1995).
Together with the rapid development of economic globalization and urbanization, human activities have induced frequent occurrences of both extremely high surface air temperature and air pollution issues (Chen et al., 2022; Chew et al., 2021; Li et al., 2016; Lolli et al., 2018a; Luo and Lau, 2018, 2019; Meehl et al., 2007; Rastogi, 2020; Wang et al., 2007; Yang et al., 2020). Particularly, HWs paired with the urban heat island (UHI) effect expose urban residents to more sustained extremely high temperatures (Chew et al., 2021; Jiang et al., 2019; Tan et al., 2010; Wang et al., 2017; Zong et al., 2021b). Meanwhile, rapid urbanization induced many more emissions of hydrocarbons and nitrogen oxides into the atmosphere from traffic vehicle and industries; the rising concentrations of these precursors coupled with high temperature and intense solar radiation during HWs can accelerate the photochemical reaction rate and generate more O3 (Sillman, 1999; Yim et al., 2019; Zanis et al., 2000). As a result, urban residents may face more severe stresses from both heat and O3 pollution. However, note that the improvement of economic level, medical infrastructure, and air-conditioning utilization associated with urbanization can alleviate the health burden of the human body in the face of high temperature and O3 exposure to a certain extent (Bai et al., 2016; Kovach et al., 2015; Li et al., 2017). Therefore, it can be concluded that there still are some uncertainties in affecting the excess mortality of high temperature and O3 pollution. To sum up, clarifying the formation mechanism of HW–O3 compound events and quantifying their health risks to urban residents are important scientific issues that warrant further investigation.
Beijing, the capital of China, is the second largest city in the country, with a permanent population of 21.89 million. It is not only one of the fastest developing metropolises in China in recent decades, but also a typical heat island city (Ren et al., 2007; Wang et al., 2017; Yang et al., 2013, 2022). Taking Beijing as a typical example, therefore, this study focuses on the health risks of extreme HW–O3 compound events during summertime of 2014–2019 and comprehensively investigates the role of synoptic weather patterns and urbanization in these compound events based on surface observation and reanalysis data. Then, the contributions of weather types and urbanization to the excess mortality induced by combined heat and O3 stress were quantified according to an established health assessment model. The findings are expected to provide a scientific reference for the monitoring and forecasting of summertime HW–O3 compound events and their health risks from the perspective of synoptic patterns and urbanization in high-density megacities.
2.1 Data
Ground-level O3 observation data during summertime (June–August) of 2014–2019 were retrieved from the Beijing Municipal Ecological and Environmental Monitoring Center. After quality control, and excluding stations with a missing value rate for the O3 concentration of more than 10%, 31 air quality stations (AQSs; including 11 for urban stations, 11 for suburban stations, 3 for traffic stations (road monitoring stations for traffic air quality), and 6 for rural stations) are ultimately used in this study. In order to better assess the relationship between O3 pollution and the meteorological variables, we selected 29 automatic weather stations (AWSs) closest to the environmental monitoring stations from the high-density AWS network. For specific geographic location information, see Fig. 1 and Table 1. Hourly 2 m air temperature, relative humidity (RH), daily maximum temperature (Tmax), and 10 m wind speed (WS) of these 29 AWSs were obtained from the National Meteorological Information Center of the China Meteorological Administration, and then heat index (HI) was retrieved as shown in Rothfusz (1990), as given in Eq. (1):
where T indicates the temperature (unit: ∘F), and RH (unit: %) indicates relative humidity.
In addition, we also used the hourly geopotential height (GH), boundary layer height (BLH), wind vector, vertical velocity, and temperature fields to further analyze the weather type and local boundary layer characteristics under the joint occurrence of HW and O3 pollution (fifth major global reanalysis produced by the European Centre for Medium-Range Weather Forecasts, with a spatiotemporal resolution of 0.25∘).
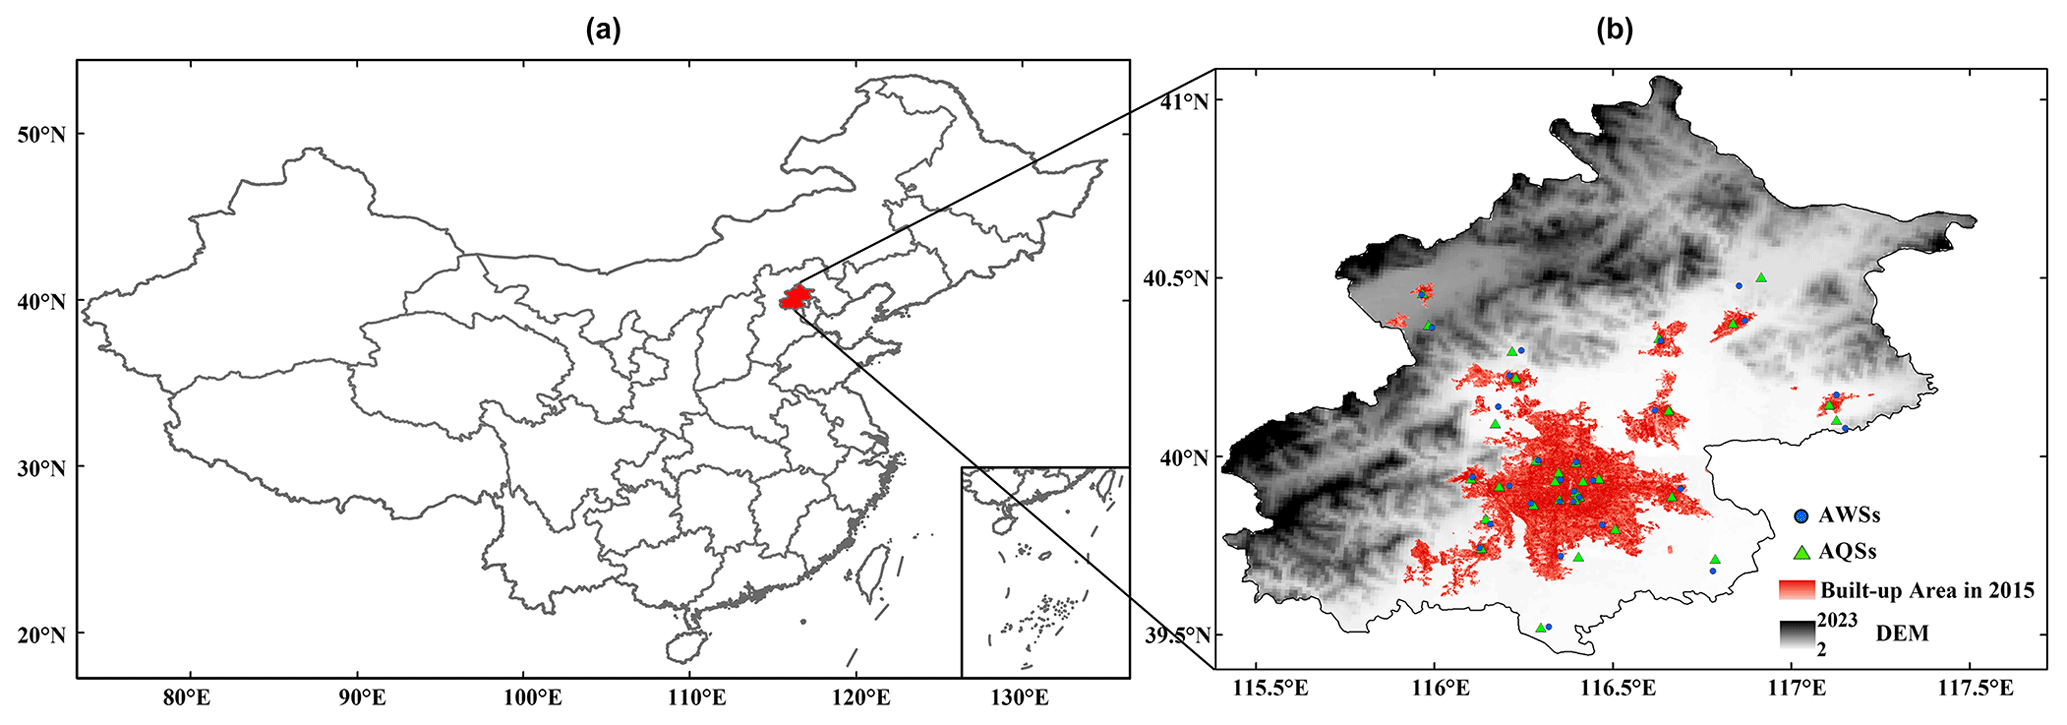
Figure 1(a) Geography of Beijing. (b) Distribution of AWSs and AQSs in Beijing (superimposed on the built-up area data for 2015 from digital elevation model data).
Table 1The location information and station type of AQSs; the corresponding AWSs are the closest matching weather station among 295 AWSs.
∗ indicates that the underlying surface of the observing station is covered by vegetation.
2.2 Methods
2.2.1 Compound HW and O3 pollution events
An HW event is usually characterized by the daily maximum temperature reaching or exceeding a certain threshold (it can be a relative value or an absolute threshold) for several consecutive days (Ngarambe et al., 2020). In this paper, we selected 33 ∘C (which corresponds to the 90th percentile of Tmax during 2014–2019 in Beijing) as the threshold for Tmax lasting for 3 d or more to determine an HW event; otherwise, it was a NHW event. Moreover, precipitation has a certain regulating effect on urban pollution and high temperature (Lolli et al., 2018b; Roth, 2007; Zhao et al., 2014; Zheng et al., 2020); in particular, the occurrence of precipitation during the day inhibits the photochemical reaction of O3 production (Yu et al., 2020; Zhang et al., 2015; Zhao and Wang, 2017). Here a daytime precipitation event (accumulated precipitation ≥2 mm during 07:00–19:00 LST) was excluded to avoid the impact of precipitation on compound HW and O3 pollution events. O3 pollution was identified as when the MDA8 O3 concentration exceeded 160 µg m−3, which is in accordance with the Ambient Air Quality Standards issued by the Ministry of Ecology and Environment of the People's Republic of China. Based on the above criteria, 84 d of co-occurring HW and O3 pollution events during 2014–2019 were finally obtained.
2.2.2 Weather type classification
The T-mode principal component analysis (T-PCA) is an improved mathematical method to classify the circulation pattern, which has a low dependence on preset parameters and has advanced temporal and spatial stability of classification (Huth et al., 2008). Consequently, T-PCA has been widely used in the studies of atmospheric circulation effects of extreme weather (Liu et al., 2019; Miao et al., 2019; Yang et al., 2018, 2021; Zhang and Villarini, 2019; Zong et al., 2021a). It decomposes the original data matrix into the product of the principle component matrix and the load matrix (two low-dimensional matrices), then rotates the first r (r≤n) principal components with larger variance contributions obliquely, and finally obtains the synoptic patterns and classifications of each time according to the magnitude of the load (Huth, 2000). Here, T-PCA was applied in COST733class software to classify the 850 hPa GH field of the joint occurrence of HW and O3 pollution events, and the number of classifications was determined based on the explained cluster variance; more specific details on T-PCA were introduced in our previous study (Zong et al., 2021a). As for the categorical data, we mainly focused on the domain (110–125∘ E, 32–47∘ N), including Beijing, associated with these 84 d of compound events during summertime (June–August) 2014–2019.
2.2.3 Excess mortality
In epidemiology, the relative risk (RR) is usually used to evaluate the intensity of the association between exposure and disease, which refers to the ratio of the incidence of the exposed group to the incidence of the non-exposed group (Chen et al., 2018; Pope et al., 2016). The RR is calculated by Eq. (2):
where i indicates the risk factor (high temperature or O3 concentration), βi denotes the coefficients of the exposure response function between the risk factor i and total mortality through nonlinear regression (Cao et al., 2021; Du et al., 2020; Gu et al., 2018), and ΔXi is the difference between the risk factor i and its reference health threshold. The excess risk (ER) is calculated by Eq. (3):
Previous studies indicated that there were distinctly different magnitudes of human morbidity and mortality caused by high temperature and O3 overexposure over various geographic regions (Huang et al., 2015; Ma et al., 2015; Wang et al., 2020; Yin et al., 2017). For instance, Huang et al. (2015) revealed that for a 1 ∘C increase above the minimum mortality temperature, the daily mortality increased by 1.04 % (95 % confidence interval (CI): 0.90 % to 1.18 %), 1.25 % (95 % CI: 0.71 % to 1.79 %), 1.19 % (95 % CI: 0.79 % to 1.58 %), and 1.38 % (95 % CI: 0.54 % to 2.23 %) in nationwide, central China, eastern China, and south China, respectively. Here, we refer to the coefficients of exposure response function (β) for the high temperature as suggested by Liu et al. (2021) and those for O3 concentration as suggested by Yin et al. (2017) in northern China. In detail, Liu et al. (2021) investigated the mortality caused by high temperature in 84 cities in China from 2013 to 2016 and found that for every 1 ∘C increase in the daily Tmax above 31.5 ∘C, the largest RR of mortality caused by high temperature in northern China was 1.002 (95 % CI: 1.001, 1.004). According to Eq. (2), we can deduce that % (95 % CI: 0.996 %, 0.999 %); note that RR is equal to 1 when Tmax=31.5 ∘C. For O3 exposure, a 10 µg m−3 increase in MDA8 O3 was related to an increase in the total daily mortality of 0.39 % (95 % CI: 0.04 %, 0.75 %) in northern China during the warm season (Yin et al., 2017); that is, βOzone=0.39 % (95 % CI: 0.04 %, 0.75 %). Since the two models have removed mutual influence, the final joint ER is the sum of the ERs of both high temperature and O3.
2.2.4 Urbanization and Synoptic contribution rates
To estimate the impact of urbanization and weather patterns on compound HW and O3 pollution events, we further determined their contribution rates to the excess mortality of compound events. With reference to Ma and Yuan (2021) and Yang et al. (2017), the urbanization effect is calculated by Eq. (4):
and the contribution rate is calculated by Eq. (5):
where i indicates risk factor (high temperature or ozone pollution), ER is excess mortality, and CR is the contribution rate.
Similarly, we also defined synoptic effects as
and the contribution rate as
where i, ER, and CR are the same as in Eq. (6).
3.1 Compound HW–O3 pollution events and associated public health in Beijing
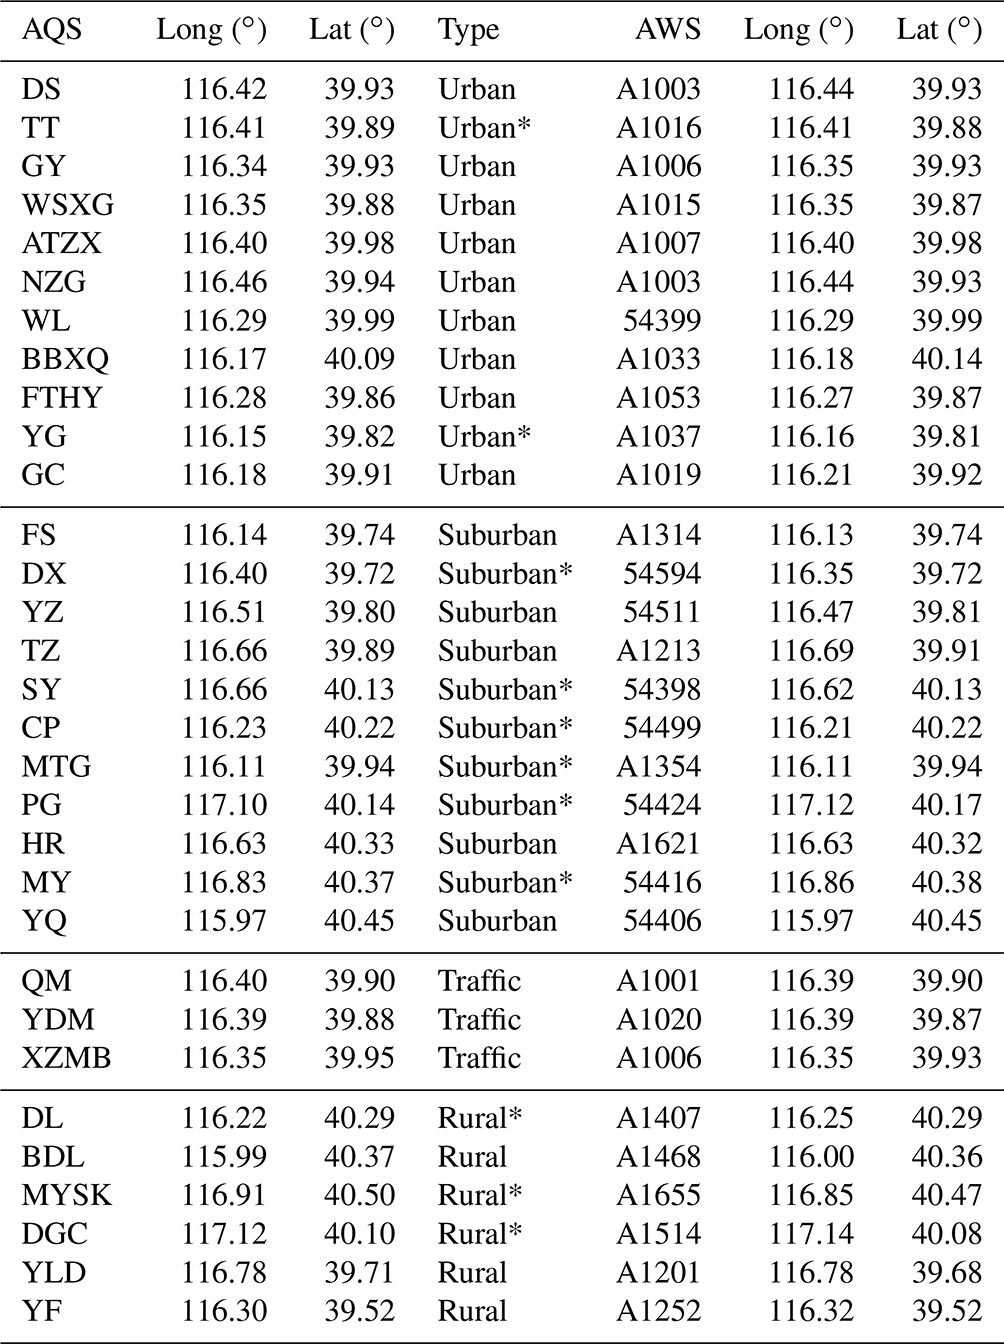
Figure 2 shows the time series of the HW, NHW, O3 pollution, and precipitation days and the interannual and intraseasonal variations of HW and O3 pollution days. For interannual variation, the total number of days of O3 pollution in summer was relative stable, while the total number of days of HW increased slightly. For intraseasonal variation, O3 pollution was the most serious in June, while HW events were most frequent in July. Obviously, higher O3 pollution levels (>160 µg m−3) were always accompanied by most HW periods (approximately 79.2 % of HW days) in Beijing (Figs. 2a and 3b), which were mainly in the middle of summer. In addition, note that there was an increase in the maximum duration of HW events and the number of HW–O3 paired days during the summertime of 2014–2019 (Fig. 3), especially in 2019, when the longest HW event lasted for 10 d, resulting in more extreme and enduring dual heat and O3 stresses to residents. As shown in Fig. 4, relative to NHW days, MDA8 O3 increased significantly on HW days, exceeding 160 µg m−3 across all stations, with an average of 189.35 µg m−3. Both surface O3 concentration and MDA8 O3 concentration in Beijing showed significant differences (P<0.001) through analysis of variance among three conditions (Table S1 in the Supplement).
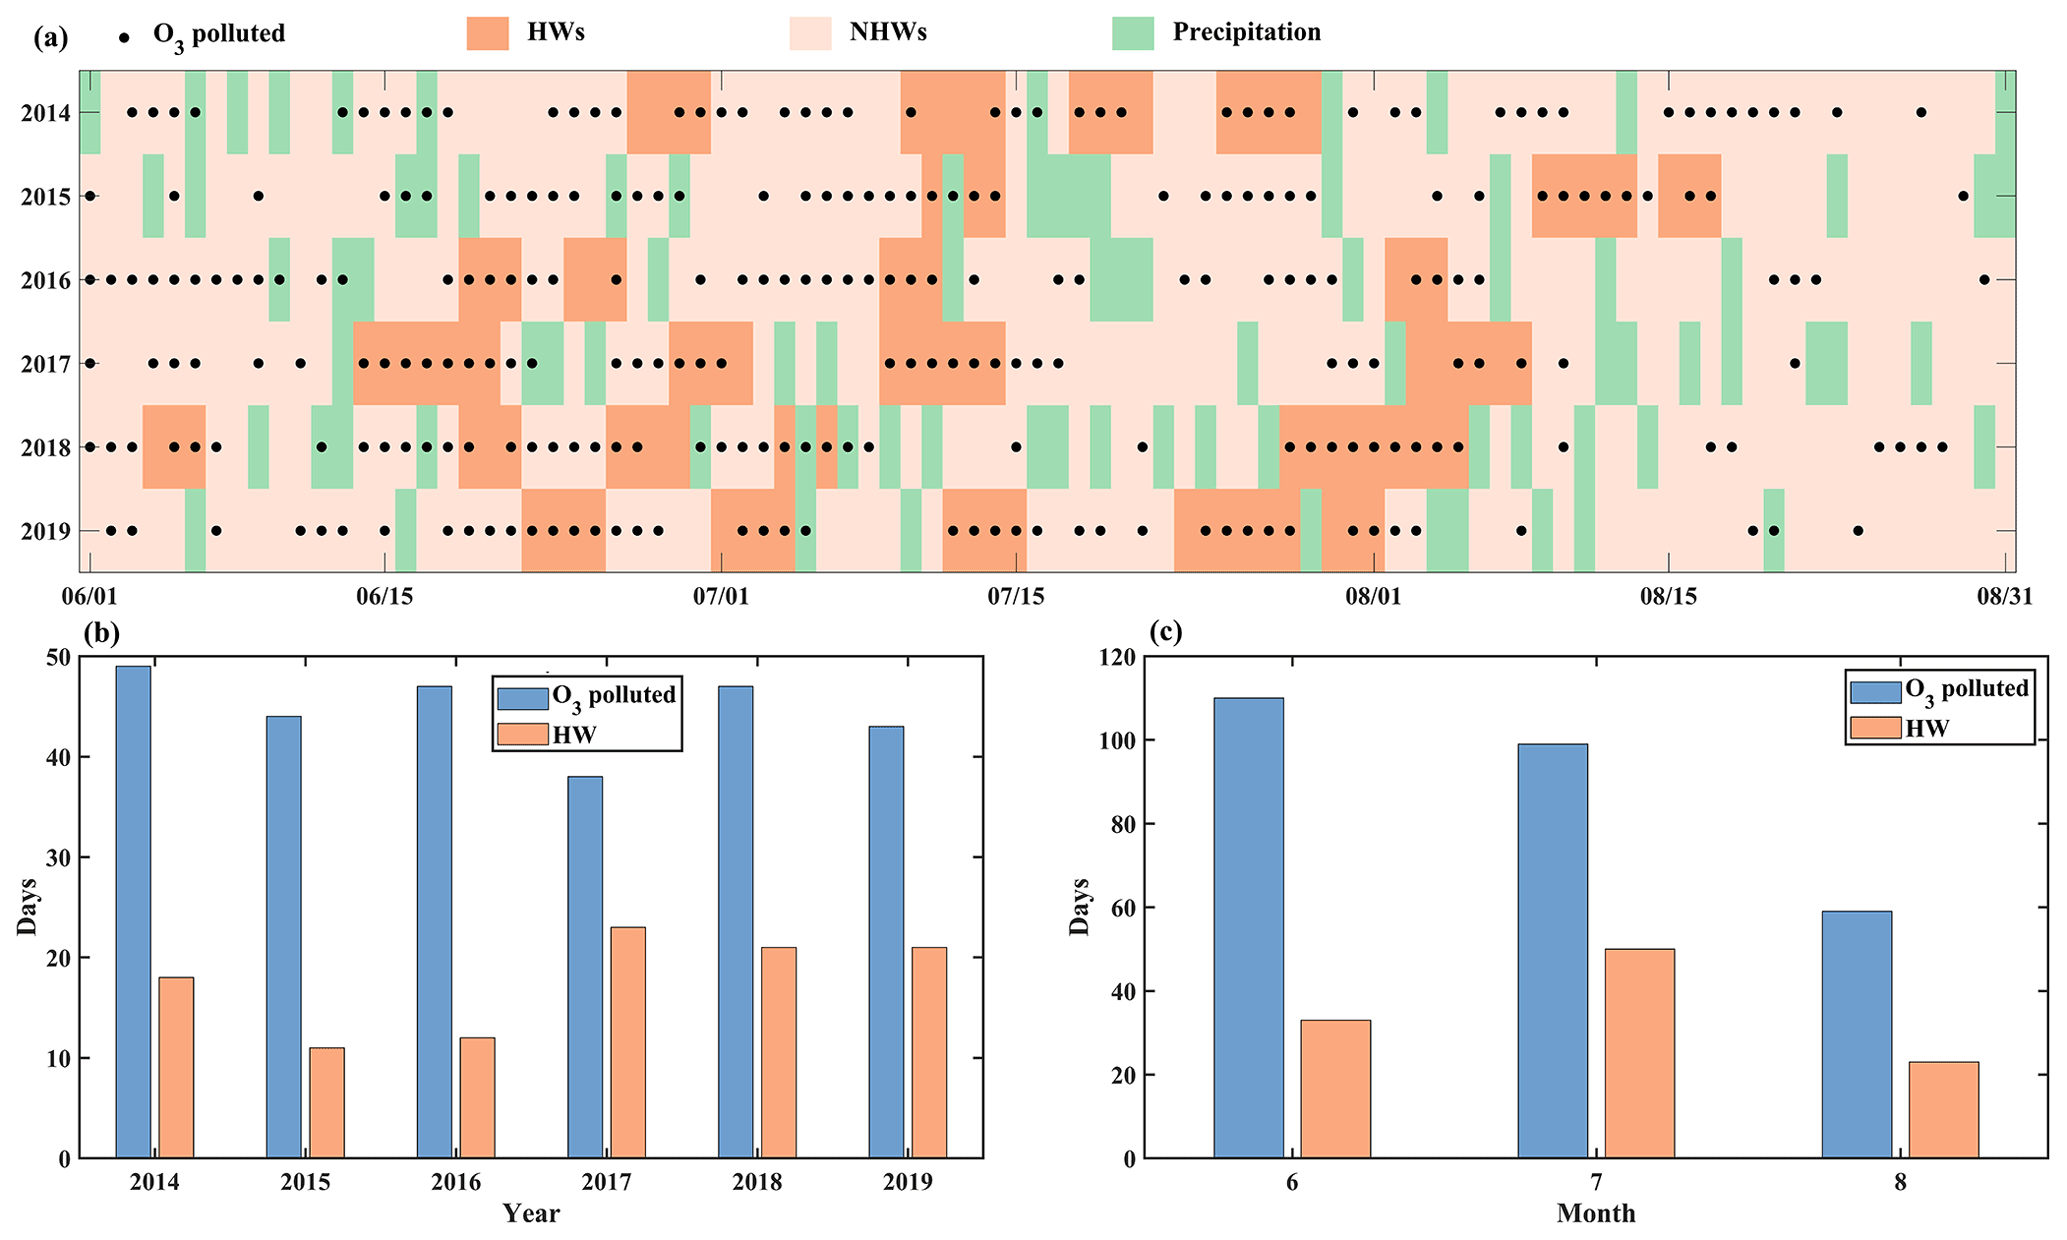
Figure 2(a) Time series of synoptic weather types, in which the black dots indicate O3 pollution that occurred on that day. Interannual (b) and intraseasonal (c) variations in summertime O3 pollution and HW days.
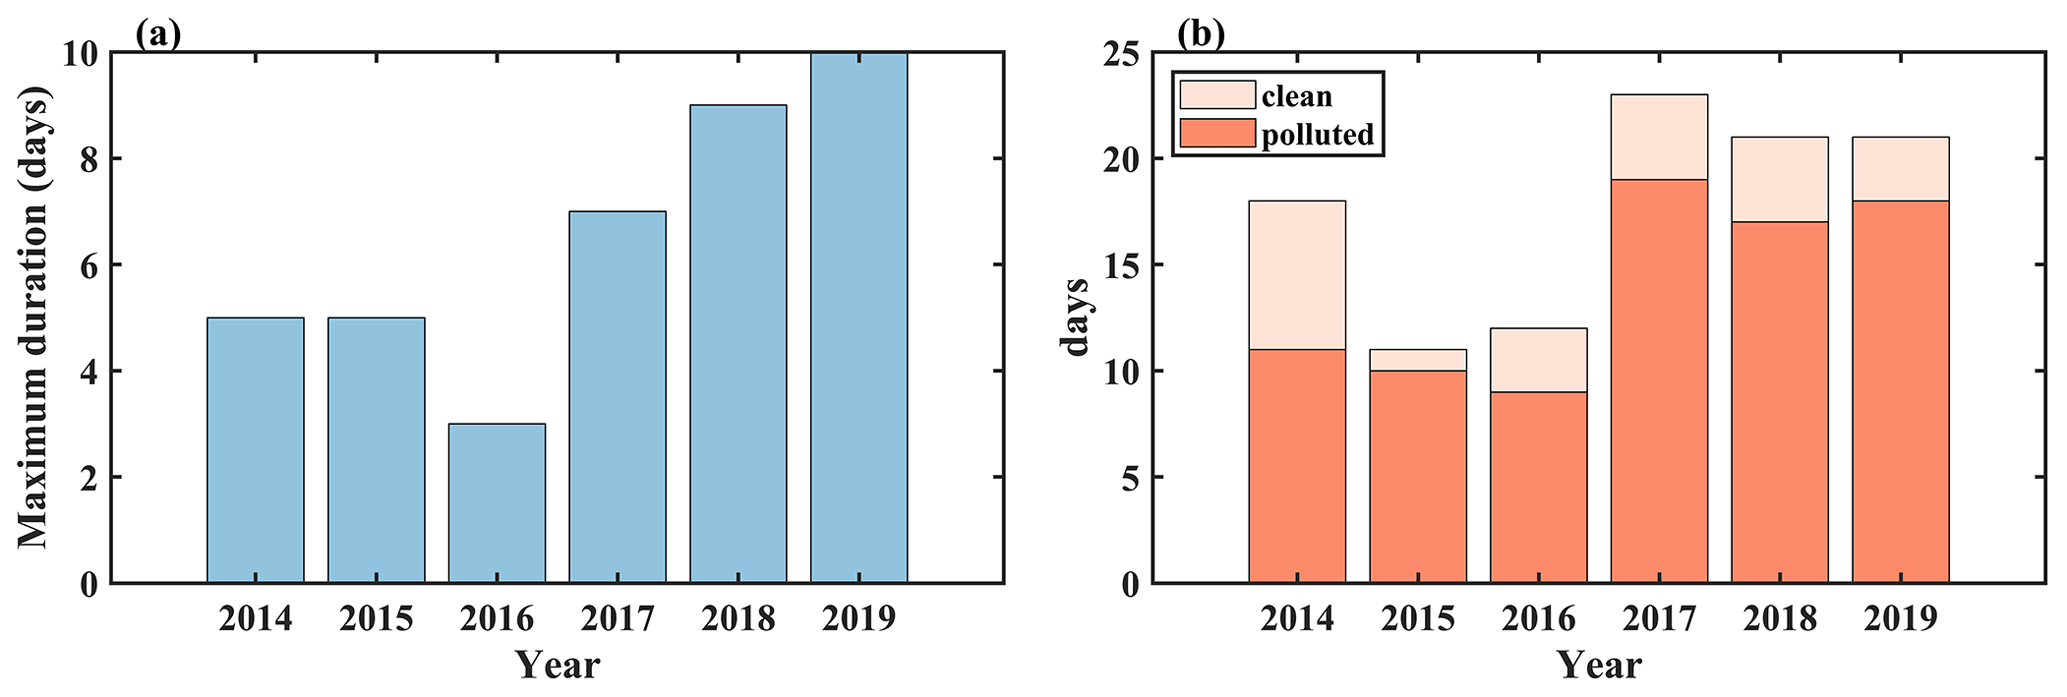
Figure 3(a) Maximum number of days of HW events each year. (b) Proportion of O3 pollution during HW events each year.
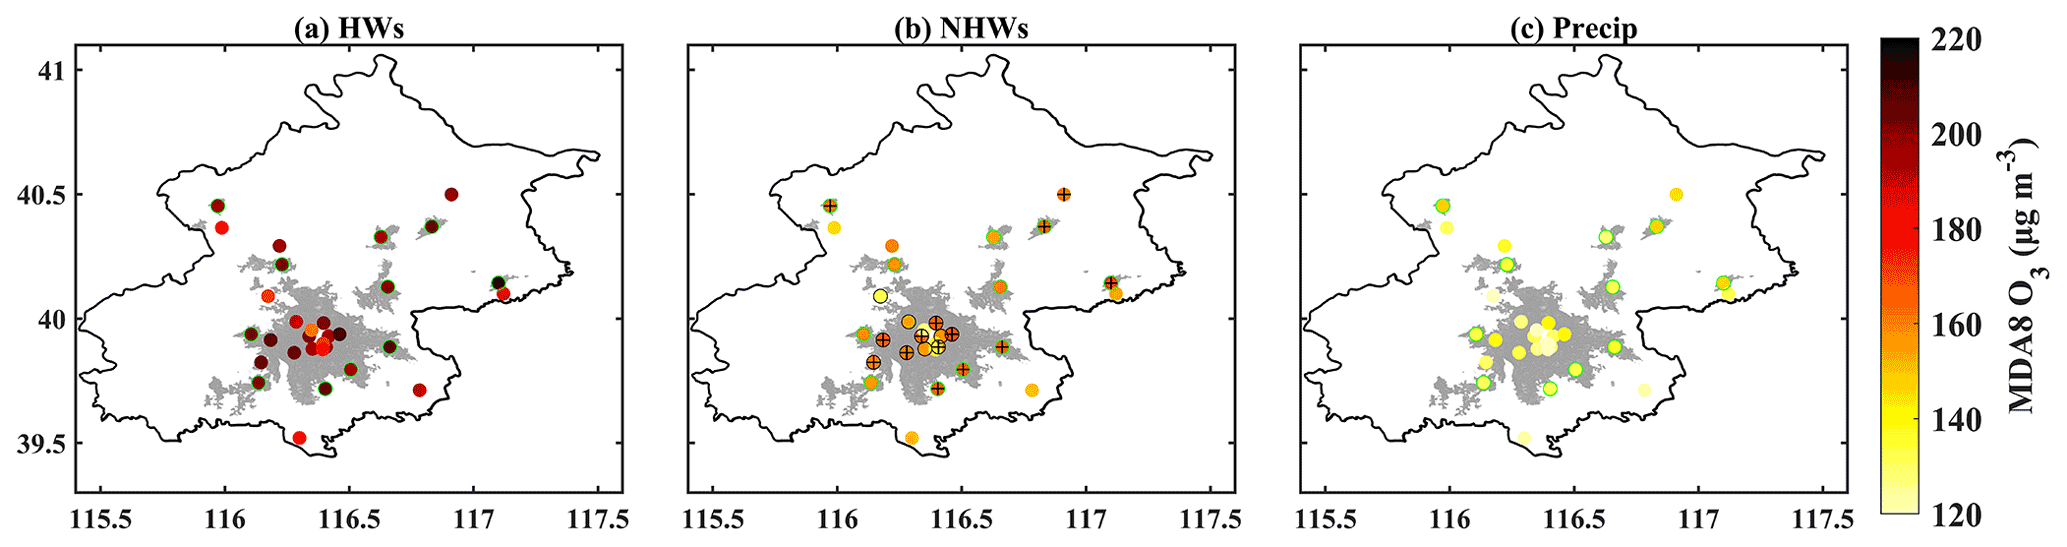
Figure 4Distribution of MDA8 O3 under (a) HW, (b) NHW, and (c) precipitation periods (superimposed on built-up area data for 2015; black and green circles represent urban and suburban stations, respectively).
In general, the difference in O3 concentration was mainly due to meteorological conditions and the precursors' emission paired with photochemical reactions in the boundary layer. We further investigated the diurnal variation for surface air temperature (T), RH, HI, BLH, and WS under HW, NHW, and precipitation periods (Fig. 5), and these five variables also showed significant differences (passed the Kruskal–Wallis test with a result of 0.001; for more details, see Table S2) in the three periods. For HW days, HI raised more by increased air temperature, and although the RH was relative lower, people still suffered from higher apparent temperature than actual air temperature. Under HW conditions, solar radiation reaching the ground heats the atmosphere, increasing the near-surface temperature. Warmer air convection promotes atmospheric instability, with increased WS and higher BLH. It is clear that the meteorological variables in the daytime were significantly different during HW periods with respect to NHW periods (Fig. 5; Zong et al., 2021b). Similarly, hourly O3 concentrations also showed significant differences under different meteorological conditions and reached peak levels in the afternoon on HW days (Fig. 5f). Note that the contribution of local and regional emissions (transport of pollution between urban and rural areas) to air quality at a city scale should be focused on (Thunis et al., 2021), as it can also induce urban–rural differences. We assumed that the intraseasonal differences in precursor emissions can be ignored, and the diurnal variation differences in NO2, CO, and O3 among different stations are further compared (Fig. 6 and Table S3). CO and NO2 levels were higher at traffic stations than urban and suburban stations due to enhanced emission from vehicles, and the lowest CO and NO2 levels appeared at rural stations. Generally speaking, high precursor levels are supposed to correspond to high resultant levels, but the lowest O3 levels were found at traffic stations, followed by rural stations, then urban and suburban stations. Since automobile exhaust in the traffic and urban stations also caused heavy NO emission (Colvile et al., 2001), ambient O3 can be titrated by NO via the reaction NO + O3 → NO2 + O2 (Gao et al., 2020; Murphy et al., 2007; Sillman, 1999); this process in turn led to higher NO2 levels and the loss of O3 in traffic and urban areas. As for rural stations, low pollutant emissions may be the primary reason for the lower O3 levels. Note that although the CO and NO2 emissions were significantly higher at urban stations than those of suburban stations, there was less difference in O3 concentrations between these two types of station, which may be due to O3 consumption induced by titration at urban stations or more biogenic volatile organic compounds (BVOCs) at suburban stations. This is because the difference in O3 concentrations between the rural and the suburban stations was the largest in the afternoon, while the difference in CO and NO2 levels was the smallest, indicating that anthropogenic emissions have less impact in suburban areas, coupled with more than half of suburban stations being covered by vegetation, leading to more BVOC emissions.
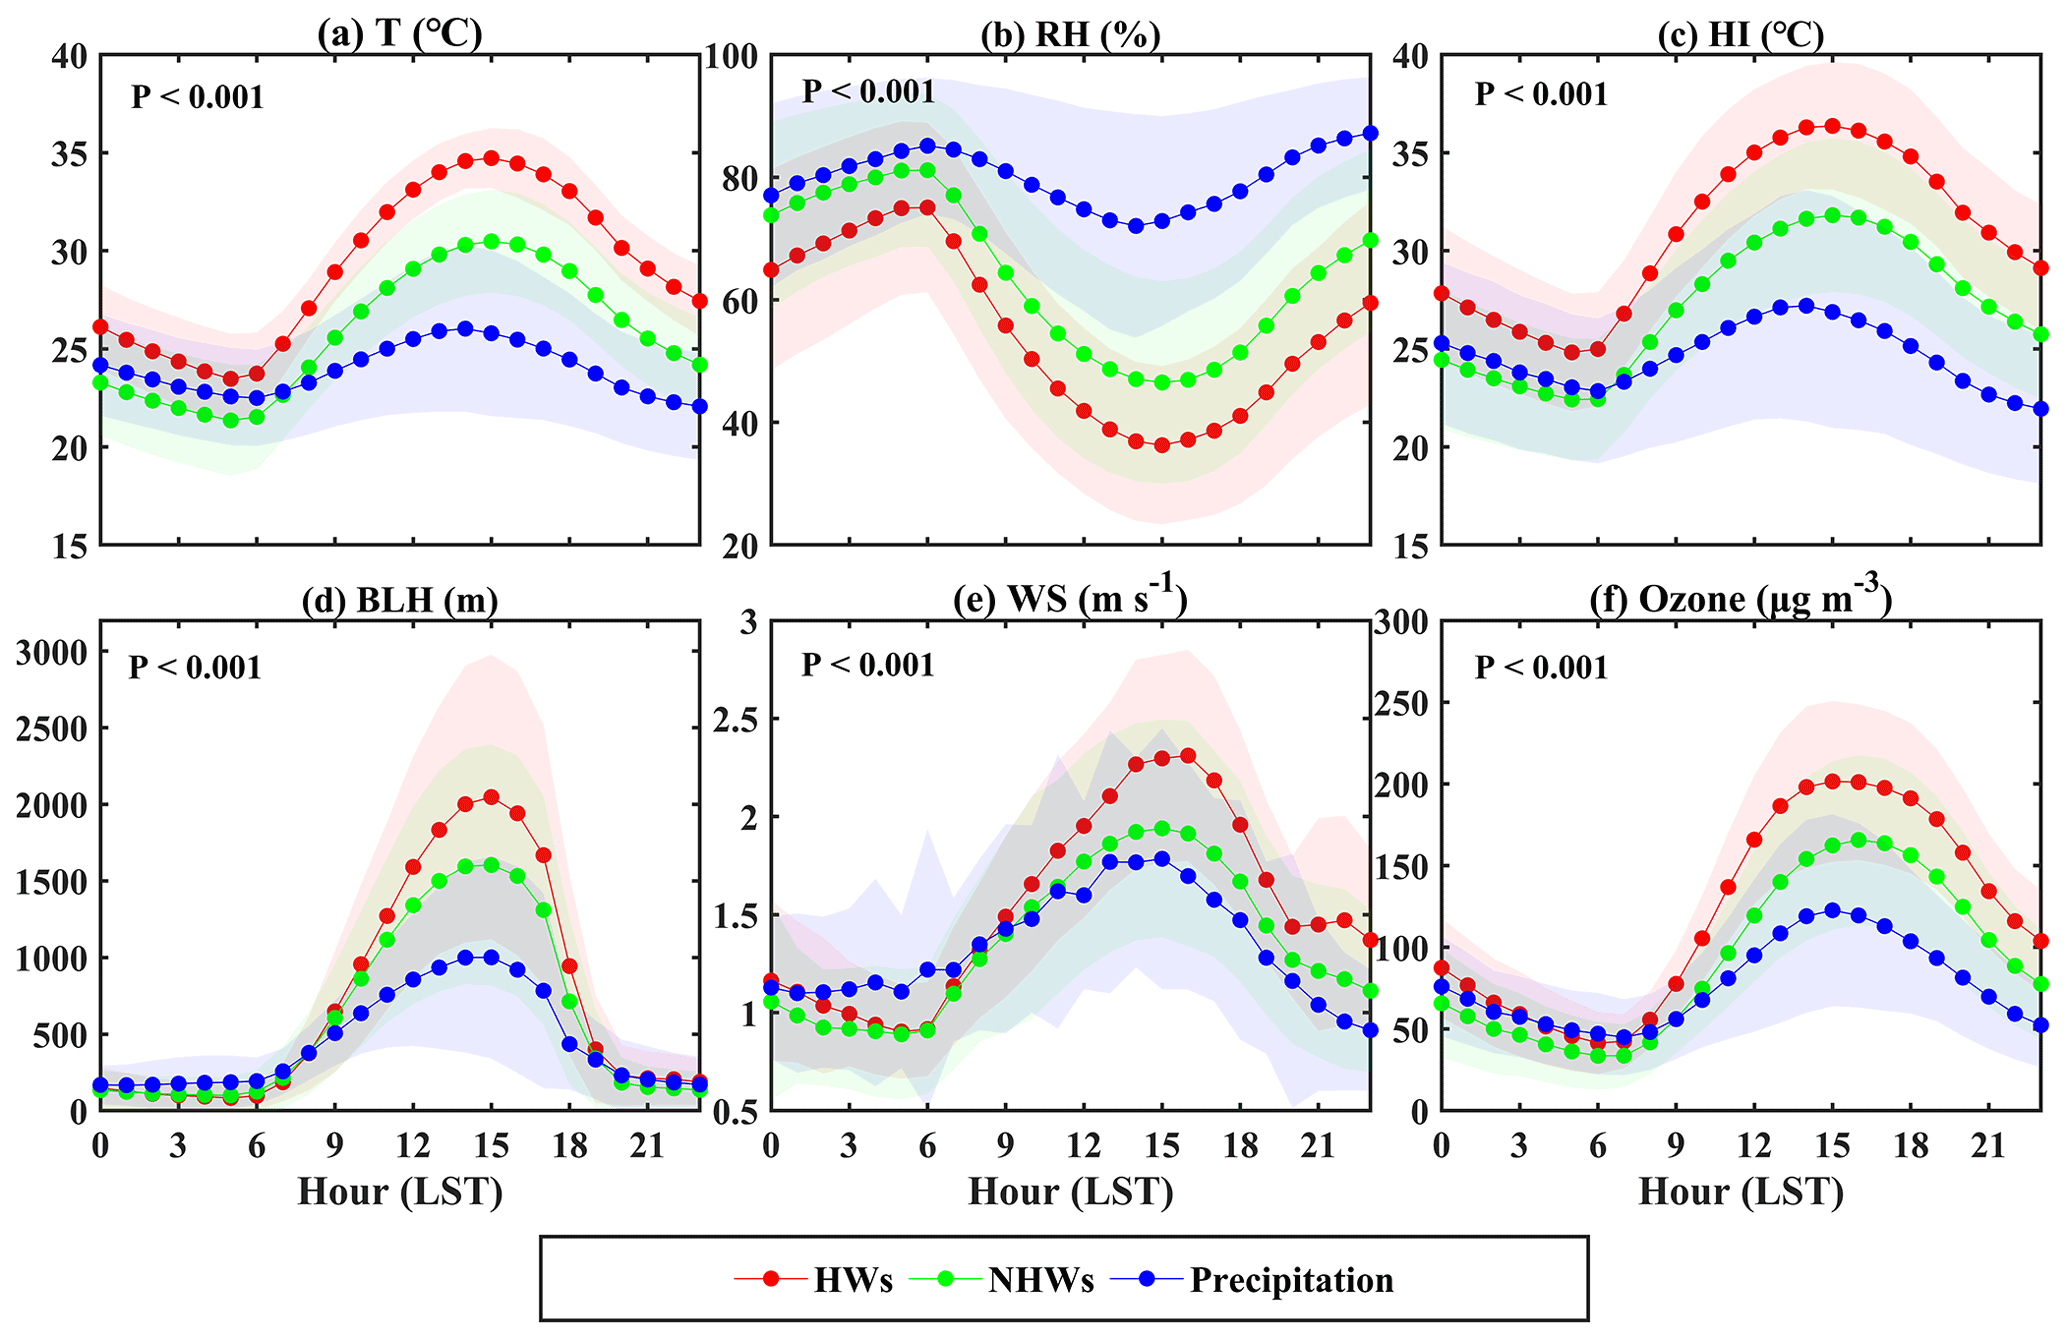
Figure 5The diurnal variation of (a) air temperature, (b) RH, (c) HI, (d) BLH, (e) WS, and (f) O3, under HW, NHW, and precipitation periods (shading indicates standard deviation; P<0.001 shows statistical significance).

Figure 6The diurnal variation of (a) CO, (b) NO, and (c) O3, at different stations (shading indicates standard deviation; P<0.001 shows statistical significance).
Moreover, the high temperatures on HW days not only induce a higher public risk related to high-temperature exposure, but also increase mortality related to O3 exposure. During HW periods, high temperatures and strong solar radiation accelerate the rate of the photochemical reaction that produces O3 (Pu et al., 2017; Sun et al., 2017), favoring the production and accumulation of O3, thereby aggravating health risks. The health risks related to both O3 and high temperature have greatly increased during HW days for all types of station. Specifically, for all stations, HWs have increased the ER caused by high temperatures and O3 by 3.867 % (90 % CI: 3.863 %, 3.875 %) and 7.9 % (90 %CI: 0.78 %, 15.78 %), respectively (Table 2). The high-temperature risks were mainly manifested as follows: urban stations > traffic stations > suburban stations > rural stations, but the health risks aroused by O3 exposure in different underlying surface stations were more difficult to quantify due to the complexity of O3 photochemical reactions. As mentioned above, urbanization-enhanced NO or CO titration reduced more O3 loss in urban areas, which was more pronounced over traffic stations. For suburban stations, the abundant BVOCs emitted by vegetation also contributed to O3 generation, and BVOC emissions were enhanced more, especially on hot days (Ma et al., 2019; Trainer et al., 1987; Wang et al., 2021a). As a result, O3 exposure risks in Beijing were mainly characterized by suburban stations > urban stations > rural stations > traffic stations. Urbanization seems to have increased the ER induced by both high temperatures and O3 exposure. In details, summertime HW, O3, and compound ER increased by 1.67 %, 0.20 %, and 1.89 %, respectively, compared to rural stations. Note that urbanization has alleviated O3 pollution to a certain extent, and the health risk of O3 at stations with developed transportation was even lower than that of rural stations.
Table 2RH, temperature, HI, MDA8 O3, O3 concentration, and ER of HW and O3 pollution compound events for mortalities in different station types, associated with different weather conditions.
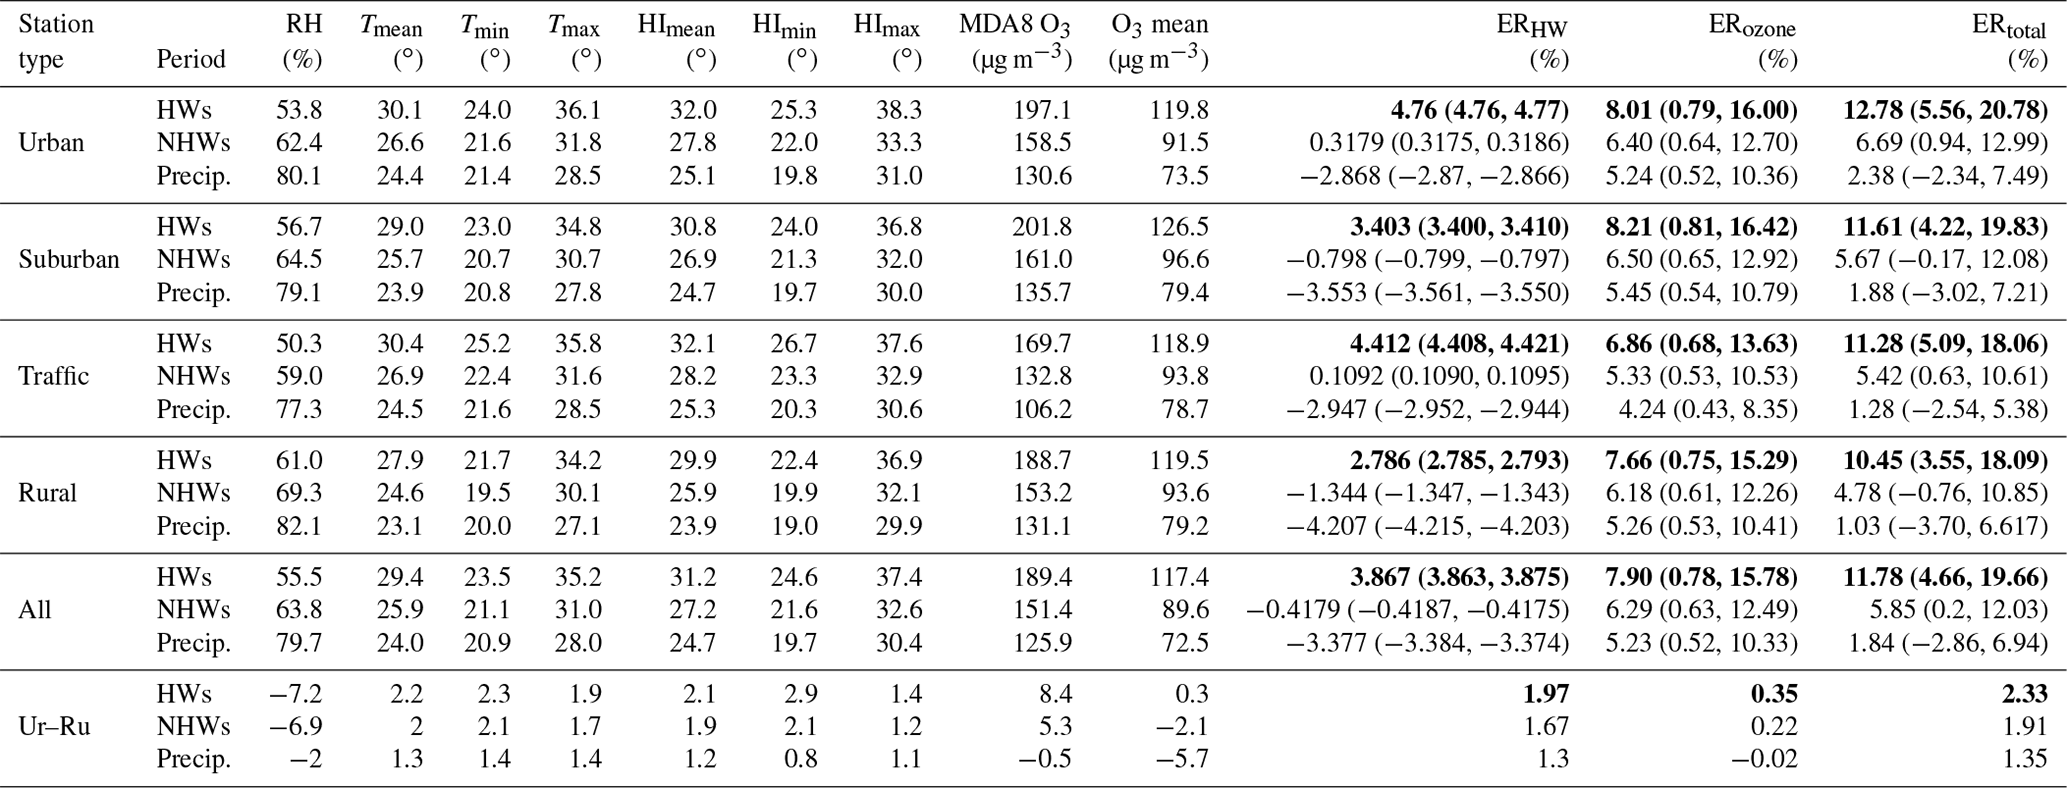
Note: Ur–Ru: urban–rural. Bold numbers indicate groups with greater ER.
3.2 Role of synoptic weather pattern and urbanization
To further clarify the mechanism underlying the joint occurrence of HW–O3 events in Beijing, three favorable synoptic weather patterns were identified as follows: (1) Type 1, characterized by the western Pacific subtropical high being located in the southeast of Beijing with prevailing southwesterly winds; (2) Type 2, controlled by a high-pressure system accompanied by weak southerly winds; and (3) Type 3, a low-vortex located over northeast Beijing with prevailing northwesterly winds (Fig. 7a–c; for detailed HW–O3 date and type, see Table S4). Additionally, vertical cross-sections of the potential temperature and wind vectors at 14:00 LST under the three patterns are shown in Fig. 7e–f. Under Type 1, a low boundary layer paired with weak vertical motion favors pollutants' accumulation. In addition, the prevailing southwesterly wind may blow pollutants from the upwind direction to Beijing, and the northern mountains block the pollutants from continuing to be transported in the downward wind direction, causing the pollutants to gather in Beijing. For Type 2, a lower BLH and vertical convection together regulate the transportation and accumulation of O3 in the boundary layer. Under Type 3, there is a valley–plain wind circulation in the boundary layer, and the strong downdraft over urban areas and the higher boundary layer cause the lowest MDA8 O3 concentrations among the three weather types.

Figure 7(a–c) 850 hPa GH (contours) and υν wind (vectors) patterns related to HW and O3 pollution compound events based on objective classification (grey outline represents Beijing, and the number in the upper-right corner of each panel indicates the frequency of occurrence of each pattern). (d–f) Vertical cross-sections of the potential temperature (contours) and wind vectors (synthesized by ν and scaled ω, ω scaled by 100) averaged between 116.0 and 117.0∘ E, associated with the synoptic patterns (solid purple lines mark the BLH, grey contours mark the topography, and the green dot marks the location of Beijing).
Overall, Type 1 tends to be associated with the highest excess mortality caused by O3, and Type 3 is related with the highest excess mortality caused by HWs. For excess mortality induced by the HW–O3 compound events, Type 1 (12.59 %) > Type 3 (12.05 %) > Type 2 (11.66 %). Although there is marginal difference in the HW–O3 compound ER under the three weather types, the mechanisms of the three types are quite different. Under the modulation of weather circulation and boundary layer meteorological elements, Type 1, Type 2, and Type 3 were associated with high O3 and intermediate Tmax exposure, intermediate O3 and low Tmax exposure, and low O3 and high Tmax exposure (Fig. 8 and Table 3), respectively. Therefore, the synoptic weather pattern plays an important role in regulating the formation mechanism of HW–O3 compound events, which also further leads to it having a significant impact on morbidities and deaths caused by HW–O3 compound events.

Figure 8Schematic illustration of the mechanism of HW and O3 compound pollution events under different synoptic weather patterns (height of the icon indicates the size of each variable).
Table 3RH, temperature, HI, MDA8 O3, O3 concentration, and ER of HW and O3 compound pollution events for mortalities at different station types, associated with different synoptic patterns.
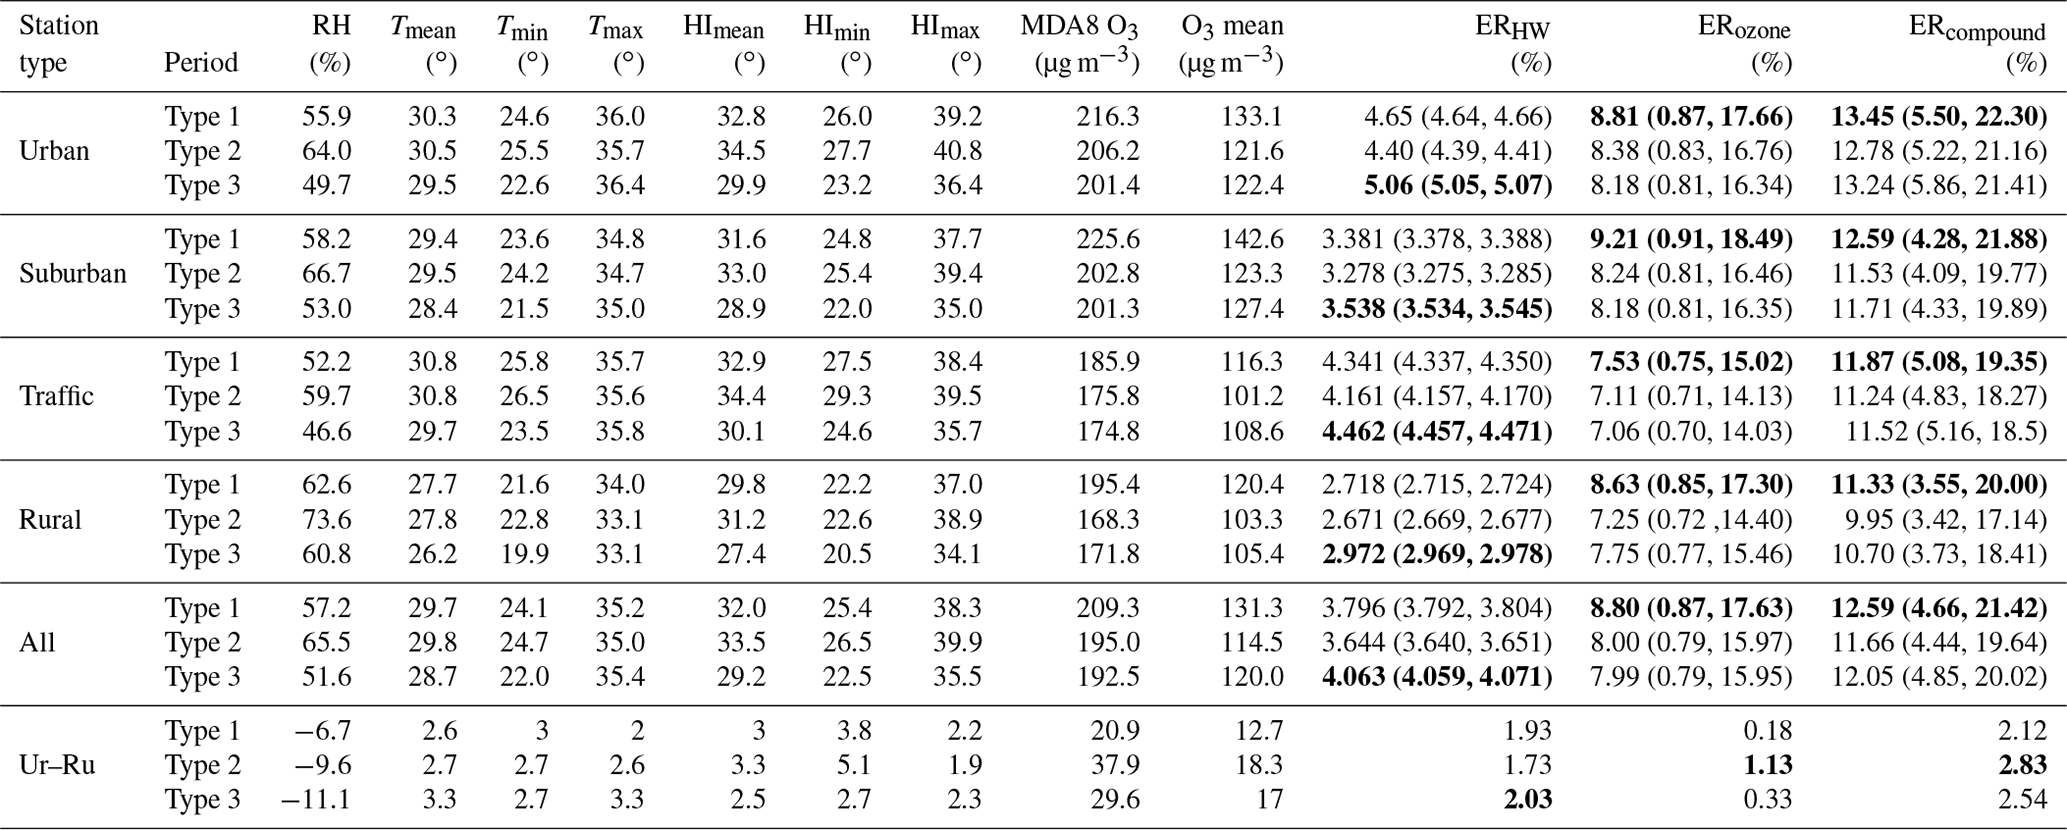
Note: Ur–Ru: Urban–Rural. Bold numbers indicate groups with greater ER.
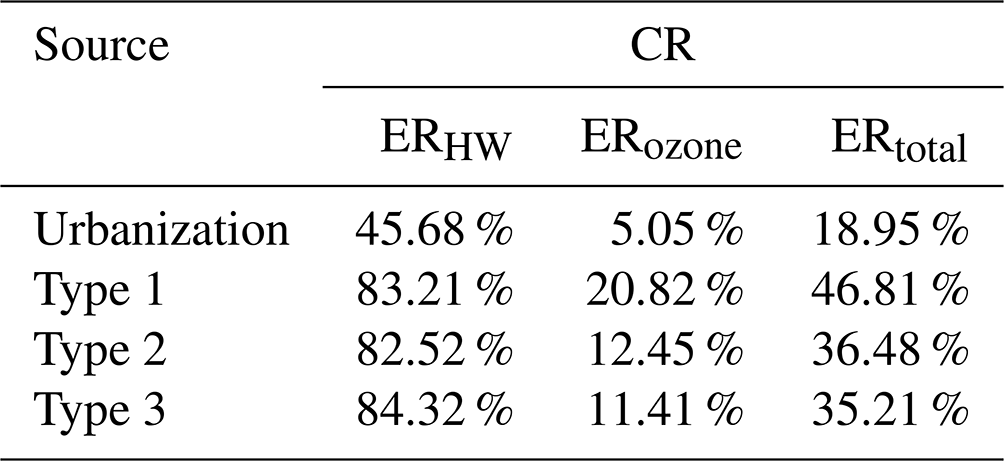
To sum up, urbanization shows a positive regulation on health risks of O3 and high temperature under different synoptic weather patterns. In particular, HWs extended the urban–rural air temperature difference (the UHI effect) in Beijing (Table 2), which was also found in our previous study (Zong et al., 2021b). That is, the urbanization effect on health risk associated with heat exposure was amplified during hot days. But for O3 pollution, urbanization and anthropogenic activities have significantly increased the emission of pollutants. On the one hand, it promotes photochemical reactions to generate O3 during HW days. On the other hand, the titration of NO and CO in cities can deplete O3. Under Type 1, the strong southerly airflow caused the horizontal transportation of O3 and its precursors from the southwest (urban) to the northeast (suburban and rural), which is favorable for the accumulation of pollutants under the topography of Yanshan (to the north of Beijing). Therefore, urban–rural differences in O3 concentration were narrowed, and the risk related to O3 exposure in the suburban areas was the greatest under this weather pattern. Type 3 is mainly dominated by the northerly airflow at 850 hPa and the southerly wind at the lower level; the transport of local circulation has a weak adjustment to the urban–rural difference of O3. However, the BLH difference between urban and rural areas (north–south difference) should be responsible for the decrease in urban–rural difference of health risk induced by O3 concentration. For the stable weather and lower BLH under Type 2, the difference in O3 concentration between urban and rural areas was the largest. Based on statistical analysis, the contribution rates of urbanization to the excessive mortality caused by high temperatures and O3 exposure were 45.68 % and 5.05 %, respectively, while 80.2 1% and 13.9 % were caused by the synoptic pattern, respectively. In summary, urbanization and the synoptic pattern respectively contributed 18.95 % and 33.09 % to the total HW–O3 excess mortality (Table 4).
Table 4Contribution rate of urbanization and synoptic weather pattern to ER.
In addition to heatstroke, heat exhaustion, heat fainting, heat cramps, and other diseases, high temperature during HW days can also lead to increased mortality of residents. Several studies have proposed that the mortality because of respiratory diseases, cardiovascular diseases, and cardiopulmonary diseases induced by high temperature and O3 exposure is particularly relevant (Chen et al., 2018; Du et al., 2020; Hu et al., 2019). Therefore, patients with preexisting conditions, such as respiratory and cardiovascular diseases, should pay more attention and limit outdoor activity during heatwaves and on O3-polluted days. Furthermore, demographic and socio-economic factors related to the level of urbanization, including age structure, education, and healthcare services, occupational types, and air-conditioning use, also greatly affect the exposure response function of high temperature and O3. For instance, females, the elderly, and people with lower education have suffered significantly higher health risks from overexposure of high temperature and O3 than the average population (Huang et al., 2015; Yin et al., 2017; Zhang et al., 2017). However, this study mainly considers mortality by all causes for all the population caused by high temperature and O3 exposure. Health risks for special groups such as the elderly, children, and patients with cardiovascular and respiratory diseases should be higher than our results. Consequently, especially during synoptic weather patterns that can cause paired HW and O3 pollution events, the responsible departments should strengthen the risk management of extreme compound events such as HW and O3 pollution, establish an early warning system, configure emergency plans, strengthen the health precautions of respiratory and cardiovascular diseases, as well as the elderly and other vulnerable groups, and protect public health.
To date, there is no exact consensus on the urbanization effects on the risk of concurrent high temperature and O3 exposure. Previously, a common perception was that urban residents were more prone to the risks of heat effects in the context of global warming and the UHI effect (Clarke, 1972; Goggins et al., 2012; Heaviside et al., 2017). Indeed, air temperature is one of the dominant reasons for the change in excess mortality caused by compound HW and O3 events. In terms of urban areas, the higher density of buildings, roads, and population and the greater heat capacity, anthropogenic heat, and temperature of urban areas are significantly higher than those of rural areas (Roth, 2007; Stewart and Oke, 2012). The heatwaves increase the urban and rural areas' temperature difference, as well as the maximum temperature difference, so urban residents may be exposed to a higher temperature environment. However, the urban–rural difference in O3 concentration modulated by HW days is inconsistent with that in temperature. Since urban O3 can be consumed by NO titration (Gao et al., 2020; Murphy et al., 2007; Sillman, 1999), urbanization alleviates the ozone exposure risk of residents to a certain extent. But suburban forests emit additional BVOCs that generate O3 during hot days (Ma et al., 2019; Wang et al., 2021a; Werner et al., 2020), resulting in O3 pollution slightly lower in urban areas than suburban areas (Gao et al., 2020). Based on the regional exposure response function model, urban areas suffer from higher mortality related to high temperature, while suburban areas experience higher public mortality associated with O3 pollution. Overall, there is little difference in the risk of O3 exposure from urbanization. It should be highlighted that urbanization has also brought some positive aspects. For example, a better economic level and medical conditions can help to prevent more deaths to a certain extent; a high air-conditioning utilization rate can also effectively reduce heat exposure; and a reduction in the proportion of highly exposed people engaged in agriculture, forestry, and animal husbandry in urban areas also greatly reduces the risk of outdoor high-temperature and O3 overexposure. As a result, rural residents are more vulnerable to facing the dual high temperature and O3 stress, and their exposure response function coefficients may also be higher than those of urban residents (Hu et al., 2019; Kovach et al., 2015; Li et al., 2017; Williams et al., 2013; Xing et al., 2020; Zhang et al., 2017). This also means that under co-occurring heatwaves and ozone-polluted weather patterns, vulnerable groups in the suburbs should be warned of the risks of outdoor activity and so limit their exposure to the pollutants.
Regarding the paired HW–O3 events, though we moved a step forward in exploring the role of synoptic weather pattern and urbanization, there are still some limitations in our study. As mentioned earlier, in a specific area, the health risks faced by residents adjusted by different levels of urbanization may be quite different. Moreover, the high-temperature and O3 compound health risk model for special populations (e.g., patients with cardiovascular and respiratory diseases, the elderly, and children) can also be further established and analyzed. Therefore, in future research on compound climate and pollution health impacts, it is necessary to consider a more refined discussion in a city based on the level of urbanization and different population groups.
In this study, the complex mechanism of co-occurring HW–O3 events in the boundary layer in Beijing was systematically investigated by combining meteorological observations, environmental monitoring observations, and reanalysis data, and the regulatory role on health risks induced by such compound events was explained from the perspective of the synoptic pattern and urbanization.
The Beijing area not only experienced a stronger UHI effect during the summertime high-temperature HWs, but it was also often accompanied by more serious O3 pollution. In the period under study, the max temperature Tmax and MDA8 O3 concentrations during HW days were ∼4.21∘ and ∼37.98 µg m−3 higher than those on NHW days, respectively, excluding rainy daytime days. When people are exposed to the dual stress of high temperatures and O3 pollution during HW–O3 days, the increase in Tmax and MDA8 O3 concentrations is associated with an 12.31 % (95 % CI: 4.66 %, 20.81 %) higher excess mortality from all non-accidental causes. Three favorable synoptic weather patterns dominate such compound events and were identified as follows:
-
Type 1. This is a high-pressure system located in the southeast of Beijing and accompanied by southwesterly winds, under which the weak downdraft and relative stable boundary layer weaken the vertical mixing of O3 and induce heavy O3 pollution, consequently meaning that people consistently experience high health risks.
-
Type 2. Under this pattern, Beijing is under the influence of a high-pressure system, accompanied by weak southerly winds and sinking airflow in the boundary layer that favors O3 transport together with its precursors. This translates into a lower excess mortality compared to Type 1.
-
Type 3. This is a low-pressure system located in the northeast of Beijing, accompanied by northwesterly winds. Under this type, people endure stronger heat stress owing to higher temperatures and lower RH, but the higher BLH and large atmospheric environment capacity alleviate O3 exposure to a certain extent, which results in a decrease in O3 concentration and ER compared with the other two patterns.
Overall, the unfavorable weather types contributed ∼33.09 % to the excess mortality attributed to the HW–O3 compound events. In addition, urbanization has also exacerbated the combined health risks of high temperature and O3 pollution, which contributed ∼18.95 %. During the co-occurring HW–O3 days, urbanization greatly affected the increase in high temperatures and related excess mortality risks in urban areas, which were significantly higher than those in rural areas. However, O3 pollution and its health risks in urban areas were slightly higher than those in rural areas, and the urbanization effect was attenuated due to the reaction of O3 and NO. Note that O3 pollution and its health risks in suburban areas were quite prominent due to less O3 depletion and more BVOC emissions.
In summary, our findings help to better understand the formation mechanism of HW–O3 compound events in Beijing, with robust supporting evidence from the perspective of synoptic patterns and urbanization. Our results also suggest that the forecasting of identified synoptic patterns could help to avoid exposure of compound HW–O3 events. However, the urbanization effect has a different regulatory effect on HWs and O3, meaning that high temperatures and O3 exposure are deserving of the establishment of a more refined health model that takes into account the differences between urban and rural areas.
The datasets that are analyzed and used to support the findings of this study are publicly available. The ground-level O3 observation data from the Beijing Municipal Ecological and Environmental Monitoring Center was collected at https://doi.org/10.5281/zenodo.5703735 (Zong, 2021). The hourly meteorological data can be obtained from the National Meteorological Information Center of the China Meteorological Administration (http://data.cma.cn/, last access: 20 November 2021; CMA, 2021). The ERA5 hourly data on pressure levels from the European Centre for Medium-Range Weather Forecasts are available at (https://cds.climate.copernicus.eu/cdsapp#!/dataset/reanalysis-era5-pressure-levels?tab=overview, last access: 20 November 2021; ECMWF, 2021).
The supplement related to this article is available online at: https://doi.org/10.5194/acp-22-6523-2022-supplement.
YY and HX designed the research. LZ, YY, and HX developed and wrote the manuscript. LZ and YY collected and analyzed the data. HX, ZS, ZZ, XL, GN, YL, and SL provided useful comments. All the authors contributed to the revision of the manuscript.
The contact author has declared that neither they nor their co-authors have any competing interests.
Publisher's note: Copernicus Publications remains neutral with regard to jurisdictional claims in published maps and institutional affiliations.
We thank the editor and Sergio Ibarra and one anonymous referee for their constructive comments.
This research has been supported by the National Natural Science Foundation of China (grant no. 42175098).
This paper was edited by Eduardo Landulfo and reviewed by Sergio Ibarra and one anonymous referee.
Abbas, E.-Z. and Mylene, T.: On the association between high temperature and mortality in warm climates, Sci. Total Environ., 343, 273–275, https://doi.org/10.1016/j.scitotenv.2004.12.024, 2005.
Atkinson, R. W., Yu, D., Armstrong, B. G., Pattenden, S., Wilkinson, P., Doherty, R. M., Heal, M. R., and Anderson, H. R.: Results from Five Urban and Five Rural U . K . Populations, Environ. Health Perspect., 120, 1411–1417, 2012.
Bai, L., Woodward, A., Cirendunzhu, and Liu, Q.: County-level heat vulnerability of urban and rural residents in Tibet, China, Environ. Heal., 15, 3, https://doi.org/10.1186/s12940-015-0081-0, 2016.
Cao, R., Wang, Y., Huang, J., Zeng, Q., Pan, X., Li, G., and He, T.: The construction of the air quality health index (AQHI) and a validity comparison based on three different methods, Environ. Res., 197, 110987, https://doi.org/10.1016/j.envres.2021.110987, 2021.
Chen, R., Yin, P., Wang, L., Liu, C., Niu, Y., Wang, W., Jiang, Y., Liu, Y., Liu, J., Qi, J., You, J., Kan, H., and Zhou, M.: Association between ambient temperature and mortality risk and burden: Time series study in 272 main Chinese cities, The British Medical Journal, 363, k4306, https://doi.org/10.1136/bmj.k4306, 2018.
Chen, S., Yang, Y., Deng, F., Zhang, Y., Liu, D., Liu, C., and Gao, Z.: A high-resolution monitoring approach of canopy urban heat island using a random forest model and multi-platform observations, Atmos. Meas. Tech., 15, 735–756, https://doi.org/10.5194/amt-15-735-2022, 2022.
Chew, L. W., Liu, X., Li, X. X., and Norford, L. K.: Interaction between heat wave and urban heat island: A case study in a tropical coastal city, Singapore, Atmos. Res., 247, 105134, https://doi.org/10.1016/j.atmosres.2020.105134, 2021.
Clarke, J. F.: Some effects of the urban structure on heat mortality, Environ. Res., 5, 93–104, https://doi.org/10.1016/0013-9351(72)90023-0, 1972.
CMA: The hourly meteorological data can be obtained from the National Meteorological Information Center of the China Meteorological Administration, CMA [data set], http://data.cma.cn/en/, 2021.
Colvile, R. N., Hutchinson, E. J., Mindell, J. S., and Warren, R. F.: The transport sector as a source of air pollution, Atmos. Environ., 35, 1537–1565, https://doi.org/10.1016/S1352-2310(00)00551-3, 2001.
Conti, S., Meli, P., Minelli, G., Solimini, R., Toccaceli, V., Vichi, M., Beltrano, C., and Perini, L.: Epidemiologic study of mortality during the Summer 2003 heat wave in Italy, Environ. Res., 98, 390–399, https://doi.org/10.1016/j.envres.2004.10.009, 2005.
Du, X., Chen, R., Meng, X., Liu, C., Niu, Y., Wang, W., Li, S., Kan, H., and Zhou, M.: The establishment of National Air Quality Health Index in China, Environ. Int., 138, 105594, https://doi.org/10.1016/j.envint.2020.105594, 2020.
ECMWF: ERA5 hourly data on pressure levels from 1979 to present, ECMWF [data set], https://cds.climate.copernicus.eu/cdsapp#!/dataset/10.24381/cds.bd0915c6?tab=overview, last access: 20 November 2021.
Fouillet, A., Rey, G., Laurent, F., Pavillon, G., Bellec, S., Guihenneuc-Jouyaux, C., Clavel, J., Jougla, E., and Hémon, D.: Excess mortality related to the August 2003 heat wave in France, Int. Arch. Occup. Environ. Health, 80, 16–24, https://doi.org/10.1007/s00420-006-0089-4, 2006.
Gao, L., Yue, X., Meng, X., Du, L., Lei, Y., Tian, C., and Qiu, L.: Comparison of Ozone and PM2.5 Concentrations over Urban, Suburban, and Background Sites in China, Adv. Atmos. Sci., 37, 1297–1309, https://doi.org/10.1007/s00376-020-0054-2, 2020.
Goggins, W. B., Chan, E. Y. Y., Ng, E., Ren, C., and Chen, L.: Effect modification of the association between short-term meteorological factors and mortality by urban heat islands in Hong Kong, PLoS One, 7, e38511, https://doi.org/10.1371/journal.pone.0038551, 2012.
Gu, Y., Wong, T. W., Law, C. K., Dong, G. H., Ho, K. F., Yang, Y., and Yim, S. H. L.: Impacts of sectoral emissions in China and the implications: Air quality, public health, crop production, and economic costs, Environ. Res. Lett., 13, 084008, https://doi.org/10.1088/1748-9326/aad138, 2018.
Heaviside, C., Macintyre, H., and Vardoulakis, S.: The Urban Heat Island: Implications for Health in a Changing Environment, Curr. Environ. Heal. Reports, 4, 296–305, https://doi.org/10.1007/s40572-017-0150-3, 2017.
Hertig, E., Russo, A., and Trigo, R. M.: Heat and ozone pollution waves in central and south Europe – characteristics, weather types, and association with mortality, Atmosphere, 11, 1–18, https://doi.org/10.3390/atmos11121271, 2020.
Hu, K., Guo, Y., Hochrainer-Stigler, S., Liu, W., See, L., Yang, X., Zhong, J., Fei, F., Chen, F., Zhang, Y., Zhao, Q., Chen, G., Chen, Q., Zhang, Y., Ye, T., Ma, L., Li, S., and Qi, J.: Evidence for urban–rural disparity in temperature–mortality relationships in Zhejiang Province, China, Environ. Health Perspect., 127, 1–11, https://doi.org/10.1289/EHP3556, 2019.
Huang, Z., Lin, H., Liu, Y., Zhou, M., Liu, T., Xiao, J., Zeng, W., Li, X., Zhang, Y., Ebi, K. L., Tong, S., Ma, W., and Wang, L.: Individual-level and community-level effect modifiers of the temperature-mortality relationship in 66 Chinese communities, BMJ Open, 5, e009172, https://doi.org/10.1136/bmjopen-2015-009172, 2015.
Huth, R.: A circulation classification scheme applicable in GCM studies, Theor. Appl. Climatol., 67, 1–18, https://doi.org/10.1007/s007040070012, 2000.
Huth, R., Beck, C., Philipp, A., Demuzere, M., Ustrnul, Z., Cahynová, M., Kyselý, J., and Tveito, O. E.: Classifications of atmospheric circulation patterns: Recent advances and applications, Ann. N. Y. Acad. Sci., 1146, 105–152, https://doi.org/10.1196/annals.1446.019, 2008.
Jiang, S., Lee, X., Wang, J., and Wang, K.: Amplified Urban Heat Islands during Heat Wave Periods, J. Geophys. Res.-Atmos., 124, 7797–7812, https://doi.org/10.1029/2018JD030230, 2019.
Katsouyanni, K., Pantazopoulou, A., Touloumi, G., Tselepidaki, I., and Moustris, K.: Archives of Environmental Health: An International Evidence for Interaction between Air Pollution and High Temperature in the Causation of Excess Mortality Evidence for Interaction between Air Pollution and High Temperature in the Causation of Excess Mor, Arch. Environ. Heal. An Int. J., 48, 235–242, https://doi.org/10.1080/00039896.1993.9940365, 1993.
Kovach, M. M., Konrad, C. E., and Fuhrmann, C. M.: Area-level risk factors for heat-related illness in rural and urban locations across North Carolina, USA, Appl. Geogr., 60, 175–183, https://doi.org/10.1016/j.apgeog.2015.03.012, 2015.
Lee, J. D., Lewis, A. C., Monks, P. S., Jacob, M., Hamilton, J. F., Hopkins, J. R., Watson, N. M., Saxton, J. E., Ennis, C., Carpenter, L. J., Carslaw, N., Fleming, Z., Bandy, B. J., Oram, D. E., Penkett, S. A., Slemr, J., Norton, E., Rickard, A. R., K Whalley, L., Heard, D. E., Bloss, W. J., Gravestock, T., Smith, S. C., Stanton, J., Pilling, M. J., and Jenkin, M. E.: Ozone photochemistry and elevated isoprene during the UK heatwave of august 2003, Atmos. Environ., 40, 7598–7613, https://doi.org/10.1016/j.atmosenv.2006.06.057, 2006.
Lehner, F., Deser, C., and Sanderson, B. M.: Future risk of record-breaking summer temperatures and its mitigation, Clim. Change, 146, 363–375, https://doi.org/10.1007/s10584-016-1616-2, 2018.
Li, D., Sun, T., Liu, M., Wang, L., and Gao, Z.: Changes in wind speed under heat waves enhance urban heat islands in the Beijing metropolitan area, J. Appl. Meteorol. Climatol., 55, 2369–2375, https://doi.org/10.1175/JAMC-D-16-0102.1, 2016.
Li, Y., Odame, E. A., Silver, K., and Zheng, S.: Comparing Urban and Rural Vulnerability to Heat-Related Mortality: A Systematic Review and Meta-analysis, J. Global Epidemiol. Environ. Heal., 1, 9–15, https://doi.org/10.29199/geeh.101016, 2017.
Li, Y., Schubert, S., Kropp, J. P., and Rybski, D.: On the influence of density and morphology on the Urban Heat Island intensity, Nat. Commun., 11, 1–9, https://doi.org/10.1038/s41467-020-16461-9, 2020.
Liu, J., Ai, S., Qi, J., Wang, L., Zhou, M., Wang, C., Yin, P., and Lin, H.: Defining region-specific heatwave in China based on a novel concept of “avoidable mortality for each temperature unit decrease,” Adv. Clim. Chang. Res., 12, 611–618, https://doi.org/10.1016/j.accre.2021.08.002, 2021.
Liu, N., Zhou, S., Liu, C., and Guo, J.: Synoptic circulation pattern and boundary layer structure associated with PM2.5 during wintertime haze pollution episodes in Shanghai, Atmos. Res., 228, 186–195, https://doi.org/10.1016/j.atmosres.2019.06.001, 2019.
Lolli, S., Bilal, M., Alparone, L., Garzelli, A., and Vivone, G.: High-resolution satellite aerosol optical depth retrieval and its variability over highly industrialized hotspots in the Po Valley, Italy, Remote Sens. Clouds Atmos. XXIII, 1078606, https://doi.org/10.1117/12.2325853, 2018a.
Lolli, S., D'Adderio, L. P., Campbell, J. R., Sicard, M., Welton, E. J., Binci, A., Rea, A., Tokay, A., Comerón, A., Barragan, R., Baldasano, J. M., Gonzalez, S., Bech, J., Afflitto, N., Lewis, J. R., and Madonna, F.: Vertically resolved precipitation intensity retrieved through a synergy between the ground-based NASA MPLNET lidar network measurements, surface disdrometer datasets and an analytical model solution, Remote Sens., 10, 1102, https://doi.org/10.3390/rs10071102, 2018b.
Luo, M. and Lau, N. C.: Increasing Heat Stress in Urban Areas of Eastern China: Acceleration by Urbanization, Geophys. Res. Lett., 45, 13060–13069, https://doi.org/10.1029/2018GL080306, 2018.
Luo, M. and Lau, N. C.: Urban Expansion and Drying Climate in an Urban Agglomeration of East China, Geophys. Res. Lett., 46, 6868–6877, https://doi.org/10.1029/2019GL082736, 2019.
Ma, F. and Yuan, X.: More Persistent Summer Compound Hot Extremes Caused by Global Urbanization, Geophys. Res. Lett., 48, 1–12, https://doi.org/10.1029/2021GL093721, 2021.
Ma, M., Gao, Y., Wang, Y., Zhang, S., Leung, L. R., Liu, C., Wang, S., Zhao, B., Chang, X., Su, H., Zhang, T., Sheng, L., Yao, X., and Gao, H.: Substantial ozone enhancement over the North China Plain from increased biogenic emissions due to heat waves and land cover in summer 2017, Atmos. Chem. Phys., 19, 12195–12207, https://doi.org/10.5194/acp-19-12195-2019, 2019.
Ma, W., Zeng, W., Zhou, M., Wang, L., Rutherford, S., Lin, H., Liu, T., Zhang, Y., Xiao, J., Zhang, Y., Wang, X., Gu, X., and Chu, C.: The short-term effect of heat waves on mortality and its modifiers in China: An analysis from 66 communities, Environ. Int., 75, 103–109, https://doi.org/10.1016/j.envint.2014.11.004, 2015.
Meehl, G. A. and Tebaldi, C.: More Intense , More Frequent , and Longer Lasting Heat Waves in the 21st Century, Science, 80, 305, 994–997, https://doi.org/10.1126/science.1098704, 2004.
Meehl, G. A., Arblaster, J. M., and Tebaldi, C.: Contributions of natural and anthropogenic forcing to changes in temperature extremes over the United States, Geophys. Res. Lett., 34, 1–5, https://doi.org/10.1029/2007GL030948, 2007.
Miao, Y., Liu, S., and Huang, S.: Synoptic pattern and planetary boundary layer structure associated with aerosol pollution during winter in Beijing, China, Sci. Total Environ., 682, 464–474, https://doi.org/10.1016/j.scitotenv.2019.05.199, 2019.
Murphy, J. G., Day, D. A., Cleary, P. A., Wooldridge, P. J., Millet, D. B., Goldstein, A. H., and Cohen, R. C.: The weekend effect within and downwind of Sacramento – Part 1: Observations of ozone, nitrogen oxides, and VOC reactivity, Atmos. Chem. Phys., 7, 5327–5339, https://doi.org/10.5194/acp-7-5327-2007, 2007.
Ngarambe, J., Nganyiyimana, J., Kim, I., Santamouris, M., and Young Yun, G.: Synergies between urban heat island and heat waves in Seoul: The role of wind speed and land use characteristics, PLoS One, 15, e0243571, https://doi.org/10.1371/journal.pone.0243571, 2020.
Ning, G., Yim, S. H. L., Yang, Y., Gu, Y., and Dong, G.: Modulations of synoptic and climatic changes on ozone pollution and its health risks in mountain-basin areas, Atmos. Environ., 240, 117808, https://doi.org/10.1016/j.atmosenv.2020.117808, 2020.
Pattenden, S., Armstrong, B., Milojevic, A., Heal, M. R., Chalabi, Z., Doherty, R., Barratt, B., Kovats, R. S., and Wilkinson, P.: Ozone, heat and mortality: acute effects in 15 British conurbations, Occup. Environ. Med., 67, 699–707, https://doi.org/10.1136/oem.2009.051714, 2010.
Patz, J. A., Campbell-Lendrum, D., Holloway, T., and Foley, J. A.: Impact of regional climate change on human health, Nature, 438, 310–317, https://doi.org/10.1038/nature04188, 2005.
Pope, R. J., Butt, E. W., Chipperfield, M. P., Doherty, R. M., Fenech, S., Schmidt, A., Arnold, S. R., and Savage, N. H.: The impact of synoptic weather on UK surface ozone and implications for premature mortality, Environ. Res. Lett., 11, 124004, https://doi.org/10.1088/1748-9326/11/12/124004, 2016.
Pu, X., Wang, T. J., Huang, X., Melas, D., Zanis, P., Papanastasiou, D. K., and Poupkou, A.: Enhanced surface ozone during the heat wave of 2013 in Yangtze River Delta region, China, Sci. Total Environ., 603–604, 807–816, https://doi.org/10.1016/j.scitotenv.2017.03.056, 2017.
Rastogi, D.: Revisiting Recent U.S. Heat Waves in a Warmer and More Humid Climate, Geophys. Res. Lett., 47, 1–11, https://doi.org/10.1029/2019GL086736, 2020.
Ren, G. Y., Chu, Z. Y., Chen, Z. H., and Ren, Y. Y.: Implications of temporal change in urban heat island intensity observed at Beijing and Wuhan stations, Geophys. Res. Lett., 34, 1–5, https://doi.org/10.1029/2006GL027927, 2007.
Roth, M.: Review of urban climate research in (sub)tropical regions, Int. J. Climatol., 27, 1859–1837, https://doi.org/10.1002/joc.1591, 2007.
Rothfusz, L.: The heat index equation, Natl. Weather Serv. Tech. Attach., SR:23-90, https://www.wpc.ncep.noaa.gov/html/heatindex_equation.shtml (last access: 13 May 2022), 1990.
Sartor, F., Rene, S., Claude, D., and Denise, W.: Temperature, ambient ozone levels, and mortality during summer, 1994, in Belgium, Environ. Res., 70, 105–113, https://doi.org/10.1006/enrs.1995.1054, 1995.
Sillman, S.: The relation between ozone, NOx and hydrocarbons in urban and polluted rural environments, Dev. Environ. Sci., 33, 1821–1845, https://doi.org/10.1016/S1474-8177(02)80015-8, 1999.
Stewart, I. D. and Oke, T. R.: Local climate zones for urban temperature studies, Bull. Am. Meteorol. Soc., 93, 1879–1900, https://doi.org/10.1175/BAMS-D-11-00019.1, 2012.
Sun, W., Hess, P., and Liu, C.: The impact of meteorological persistence on the distribution and extremes of ozone, Geophys. Res. Lett., 44, 1545–1553, https://doi.org/10.1002/2016GL071731, 2017.
Tan, J., Zheng, Y., Tang, X., Guo, C., Li, L., Song, G., Zhen, X., Yuan, D., Kalkstein, A. J., Li, F., and Chen, H.: The urban heat island and its impact on heat waves and human health in Shanghai, Int. J. Biometeorol., 54, 75–84, https://doi.org/10.1007/s00484-009-0256-x, 2010.
Thunis, P., Clappier, A., de Meij, A., Pisoni, E., Bessagnet, B., and Tarrason, L.: Why is the city's responsibility for its air pollution often underestimated? A focus on PM2.5, Atmos. Chem. Phys., 21, 18195–18212, https://doi.org/10.5194/acp-21-18195-2021, 2021.
Trainer, M., Williams, E., Parrish, D., Buhr, M., Allwine, E., Westberg, H., Fehsenfeld, F., and Liu, S.: Models and observations of the impact of natural hydrocarbons on rural ozone, Nature, 329, 705–707, https://doi.org/10.1038/329705a0, 1987.
Vautard, R., Honoré, C., Beekmann, M., and Rouil, L.: Simulation of ozone during the August 2003 heat wave and emission control scenarios, Atmos. Environ., 39, 2957–2967, https://doi.org/10.1016/j.atmosenv.2005.01.039, 2005.
Vautard, R., Beekmann, M., Desplat, J., Hodzic, A., and Morel, S.: Air quality in Europe during the summer of 2003 as a prototype of air quality in a warmer climate, Comptes Rendus – Geosci., 339, 747–763, https://doi.org/10.1016/j.crte.2007.08.003, 2007.
Wang, H., Wu, K., Liu, Y., Sheng, B., Lu, X., He, Y., Xie, J., Wang, H., and Fan, S.: Role of Heat Wave-Induced Biogenic VOC Enhancements in Persistent Ozone Episodes Formation in Pearl River Delta, J. Geophys. Res.-Atmos., 126, 1–19, https://doi.org/10.1029/2020JD034317, 2021a.
Wang, J., Chen, Y., Liao, W., He, G., Tett, S. F. B., Yan, Z., Zhai, P., Feng, J., Ma, W., Huang, C., and Hu, Y.: Anthropogenic emissions and urbanization increase risk of compound hot extremes in cities, Nat. Clim. Chang., 11, 1084–1089, https://doi.org/10.1038/s41558-021-01196-2, 2021b.
Wang, K., Wang, J., Wang, P., Sparrow, M., Yang, J., and Chen, H.: Influences of urbanization on surface characteristics as derived from the Moderate-Resolution Imaging Spectroradiometer: A case study for the Beijing metropolitan area, J. Geophys. Res.-Atmos., 112, 1–12, https://doi.org/10.1029/2006JD007997, 2007.
Wang, K., Jiang, S., Wang, J., Zhou, C., Wang, X., and Lee, X.: Comparing the diurnal and seasonal variabilities of atmospheric and surface urban heat islands based on the Beijing urban meteorological network, J. Geophys. Res., 122, 2131–2154, https://doi.org/10.1002/2016JD025304, 2017.
Wang, Y., Wild, O., Chen, X., Wu, Q., Gao, M., Chen, H., Qi, Y., and Wang, Z.: Health impacts of long-term ozone exposure in China over 2013–2017, Environ. Int., 144, 106030, https://doi.org/10.1016/j.envint.2020.106030, 2020.
Werner, C., Fasbender, L., Romek, K. M., Yáñez-Serrano, A. M., and Kreuzwieser, J.: Heat Waves Change Plant Carbon Allocation Among Primary and Secondary Metabolism Altering CO2 Assimilation, Respiration, and VOC Emissions, Front. Plant Sci., 11, 1–17, https://doi.org/10.3389/fpls.2020.01242, 2020.
WHO: Ambient (outdoor) air pollution, https://www.who.int/en/news-room/fact-sheets/detail/ambient-(outdoor)-air-quality-and-health (last access: 13 May 2022), 2021.
Williams, S., Bi, P., Newbury, J., Robinson, G., Pisaniello, D., Saniotis, A., and Hansen, A.: Extreme heat and health: Perspectives from health service providers in rural and remote communities in South Australia, Int. J. Environ. Res. Public Health, 10, 5565–5583, https://doi.org/10.3390/ijerph10115565, 2013.
Wong, T. W., Tam, W. W. S., Yu, I. T. S., Lau, A. K. H., Pang, S. W., and Wong, A. H. S.: Developing a risk-based air quality health index, Atmos. Environ., 76, 52–58, https://doi.org/10.1016/j.atmosenv.2012.06.071, 2013.
Xing, Q., Sun, Z. Bin, Tao, Y., Zhang, X., Miao, S., Zheng, C., and Tong, S.: Impacts of urbanization on the temperature-cardiovascular mortality relationship in Beijing, China, Environ. Res., 191, 110234, https://doi.org/10.1016/j.envres.2020.110234, 2020.
Xu, Z., Fitzgerald, G., Guo, Y., Jalaludin, B., and Tong, S.: Impact of heatwave on mortality under different heatwave definitions: A systematic review and meta-analysis, Environ. Int., 89–90, 193–203, https://doi.org/10.1016/j.envint.2016.02.007, 2016.
Yang, P., Ren, G., and Liu, W.: Spatial and temporal characteristics of Beijing urban heat island intensity, J. Appl. Meteorol. Climatol., 52, 1803–1816, https://doi.org/10.1175/JAMC-D-12-0125.1, 2013.
Yang, X., Ruby Leung, L., Zhao, N., Zhao, C., Qian, Y., Hu, K., Liu, X., and Chen, B.: Contribution of urbanization to the increase of extreme heat events in an urban agglomeration in east China, Geophys. Res. Lett., 44, 6940–6950, https://doi.org/10.1002/2017GL074084, 2017.
Yang, Y., Zheng, X., Gao, Z., Wang, H., Wang, T., Li, Y., Lau, G. N. C., and Yim, S. H. L.: Long-Term Trends of Persistent Synoptic Circulation Events in Planetary Boundary Layer and Their Relationships With Haze Pollution in Winter Half Year Over Eastern China, J. Geophys. Res.-Atmos., 123, 10991–11007, https://doi.org/10.1029/2018JD028982, 2018.
Yang, Y., Zheng, Z., Yim, S. Y. L., Roth, M., Ren, G., Gao, Z., Wang, T., Li, Q., Shi, C., Ning, G., and Li, Y.: PM2.5 Pollution Modulates Wintertime Urban Heat Island Intensity in the Beijing-Tianjin-Hebei Megalopolis, China, Geophys. Res. Lett., 47, 0–3, https://doi.org/10.1029/2019GL084288, 2020.
Yang, Y., Wang, R., Chen, F., Liu, C., Bi, X., and Huang, M.: Synoptic weather patterns modulate the frequency, type and vertical structure of summer precipitation over Eastern China: A perspective from GPM observations, Atmos. Res., 249, 105342, https://doi.org/10.1016/j.atmosres.2020.105342, 2021.
Yang, Y., Guo, M., Ren, G., Liu, S., Zong, L., Zhang, Y., Zheng, Z., Miao, Y., and Zhang, Y.: Modulation of wintertime canopy Urban Heat Island (CUHI) intensity in Beijing by synoptic weather pattern in planetary boundary layer, J. Geophys. Res.-Atmos., 127, e2021JD035988, https://doi.org/10.1029/2021jd035988, 2022.
Yim, S. H. L., Wang, M., Gu, Y., Yang, Y., Dong, G., and Li, Q.: Effect of Urbanization on Ozone and Resultant Health Effects in the Pearl River Delta Region of China, J. Geophys. Res.-Atmos., 124, 11568–11579, https://doi.org/10.1029/2019JD030562, 2019.
Yin, P., Chen, R., Wang, L., Meng, X., Liu, C., Niu, Y., Lin, Z., Liu, Y., Liu, J., Qi, J., You, J., Zhou, M., and Kan, H.: Ambient ozone pollution and daily mortality: A nationwide study in 272 Chinese cities, Environ. Health Perspect., 125, 1–7, https://doi.org/10.1289/EHP1849, 2017.
Yu, S., Yin, S., Zhang, R., Wang, L., Su, F., Zhang, Y., and Yang, J.: Spatiotemporal characterization and regional contributions of O3 and NO2: An investigation of two years of monitoring data in Henan, China, J. Environ. Sci., 90, 29–40, https://doi.org/10.1016/j.jes.2019.10.012, 2020.
Zanis, P., Monks, P. S., Schuepbach, E., Carpenter, L. J., Green, T. J., Mills, G. P., Bauguitte, S., and Penkett, S. A.: In situ ozone production under free tropospheric conditions during FREETEX '98 in the Swiss Alps, J. Geophys. Res.-Atmos., 105, 24223–24234, 2000.
Zhang, W. and Villarini, G.: On the weather types that shape the precipitation patterns across the U.S. Midwest, Clim. Dynam., 53, 4217–4232, https://doi.org/10.1007/s00382-019-04783-4, 2019.
Zhang, Y., Yu, C., Bao, J., and Li, X.: Impact of temperature on mortality in Hubei, China: A multi-county time series analysis, Sci. Rep., 7, 45093, https://doi.org/10.1038/srep45093, 2017.
Zhang, Z., Zhang, X., Gong, D., Quan, W., Zhao, X., Ma, Z., and Kim, S. J.: Evolution of surface O3 and PM2.5 concentrations and their relationships with meteorological conditions over the last decade in Beijing, Atmos. Environ., 108, 67–75, https://doi.org/10.1016/j.atmosenv.2015.02.071, 2015.
Zhao, L., Lee, X., Smith, R. B., and Oleson, K.: Strong contributions of local background climate to urban heat islands, Nature, 511, 216–219, https://doi.org/10.1038/nature13462, 2014.
Zhao, Z. and Wang, Y.: Influence of the West Pacific subtropical high on surface ozone daily variability in summertime over eastern China, Atmos. Environ., 170, 197–204, https://doi.org/10.1016/j.atmosenv.2017.09.024, 2017.
Zheng, Z., Zhao, C., Lolli, S., Wang, X., Wang, Y., Ma, X., Li, Q., and Yang, Y.: Diurnal variation of summer precipitation modulated by air pollution: Observational evidences in the beijing metropolitan area, Environ. Res. Lett., 15, 094053, https://doi.org/10.1088/1748-9326/ab99fc, 2020.
Zong, L.: Ozone data set, Zenodo [data set], https://doi.org/10.5281/zenodo.5703735, 2021.
Zong, L., Yang, Y., Gao, M., Wang, H., Wang, P., Zhang, H., Wang, L., Ning, G., Liu, C., Li, Y., and Gao, Z.: Large-scale synoptic drivers of co-occurring summertime ozone and PM2.5 pollution in eastern China, Atmos. Chem. Phys., 21, 9105–9124, https://doi.org/10.5194/acp-21-9105-2021, 2021a.
Zong, L., Liu, S., Yang, Y., Ren, G., Yu, M., Zhang, Y., and Li, Y.: Synergistic Influence of Local Climate Zones and Wind Speeds on the Urban Heat Island and Heat Waves in the Megacity of Beijing, China, Front. Earth Sci., 9, 458, https://doi.org/10.3389/feart.2021.673786, 2021b.