the Creative Commons Attribution 4.0 License.
the Creative Commons Attribution 4.0 License.
 | 13 May 2022
Measurement report: Source apportionment of carbonaceous aerosol using dual-carbon isotopes (13C and 14C) and levoglucosan in three northern Chinese cities during 2018–2019
Huiyizhe Zhao
Weijian Zhou
Sen Wang
Xue Feng
Shugang Wu
Xuefeng Lu
Hua Du
To investigate the characteristics and changes in the sources of carbonaceous aerosols in northern Chinese cities after the implementation of the Action Plan for Air Pollution Prevention and Control in 2013, we collected PM2.5 samples from three representative inland cities, i.e., Beijing (BJ), Xi'an (XA), and Linfen (LF), from January 2018 to April 2019. Elemental carbon (EC), organic carbon (OC), levoglucosan, stable carbon isotope, and radiocarbon were measured in PM2.5 to quantify the sources of carbonaceous aerosol, combined with Latin hypercube sampling. The best estimate of source apportionment showed that the emissions from liquid fossil fuels contributed 29.3±12.7 %, 24.9±18.0 %, and 20.9±12.3 % of the total carbon (TC) in BJ, XA, and LF, respectively, whereas coal combustion contributed 15.5±8.8 %, 20.9±18.0 %, and 42.9±19.4 %, respectively. Non-fossil sources accounted for 55±11 %, 54±10 %, and 36±14 % of the TC in BJ, XA, and LF, respectively. In XA, 44.8±26.8 % of non-fossil sources were attributed to biomass burning. The highest contributors to OC in LF and XA were fossil sources (74.2±9.6 % and 43.2±10.8 %, respectively), whereas those in BJ were non-fossil sources (66.8±13.9 %). The main contributors to EC were fossil sources, accounting for 91.4±7.5 %, 66.8±23.8 %, and 88.4±10.8 % in BJ, XA, and LF, respectively. The decline (6 %–16 %) in fossil source contributions in BJ since the implementation of the Action Plan indicates the effectiveness of air quality management. We suggest that specific measures targeted at coal combustion, biomass burning, and vehicle emissions in different cities should be strengthened in the future.
- Article
(5935 KB) - Full-text XML
-
Supplement
(884 KB) - BibTeX
- EndNote


Atmospheric aerosols are extremely complex suspension systems. Carbonaceous aerosols are an important component of atmospheric aerosols, accounting for approximately 10 %–60 % of the total mass of global fine particulate matter (Cao et al., 2003, 2007; Feng et al., 2009). Carbonaceous aerosols contain elemental carbon (EC), organic carbon (OC), and inorganic carbon (IC). IC is mainly derived from sand dust, it has a low concentration and simple composition, and it can be removed via acid treatment (Clarke et al., 1992). EC is produced by incomplete combustion and is directly discharged from pollution sources. It can cause global warming by changing the radiative forcing and ice albedo (Jacobson et al., 2001; Kiehl, 2007). OC is a complex mixture of primary and secondary pollutants produced by the combustion of domestic biomass and fossil fuels. It is an important contributor to tropospheric ozone, photochemical smog, and rainwater acidification, and it can significantly impact regional and global environments through biogeochemical cycling (Jacobson et al., 2000; Seinfeld, 1998). Therefore, identifying and quantifying the source contributions of carbonaceous aerosols can provide a scientific basis for the management of regional air quality.
The natural radiocarbon (14C) is completely depleted in fossil emissions, due to the age of fossil fuels well above the half-life of 14C (5730 years), whereas non-fossil sources show the similar 14C as the environment (Szidat et al., 2009; Heal, 2014). Therefore, 14C can be used to study the source of atmospheric particulate matter and to quantitatively and accurately distinguish the contributions of fossil and non-fossil sources (Clayton et al., 1955; Currie, 2000; Szidat et al., 2009). In recent decades, this method has been widely used to trace non-fossil carbonaceous aerosols in various regions (Ceburnis et al., 2011; Huang et al., 2010; Lewis et al., 2004; Szidat et al., 2009; Vonwiller et al., 2017; Yang et al., 2005; Y. L. Zhang et al., 2012, 2017). Stable carbon isotope (13C) is a useful geochemical marker that can provide valuable information about both the sources and atmospheric processing of carbonaceous aerosols (López-Veneroni, 2009; Widory, 2006), and it has been applied in various types of environmental research to identify emission sources (Cachier et al., 1985, 1986; Cao et al., 2011; Chesselet et al., 1981; Fang et al., 2017; Kawashima and Haneishi, 2012; Kirillova et al., 2013). The analysis of can refine 14C source apportionment because both coal and liquid fossil fuels are depleted of 14C, while their 13C source signatures are different (Andersson et al., 2015; Li et al., 2016; Winiger et al., 2017).
Levoglucosan (Lev), a thermal degradation product of cellulose combustion, is a common molecular tracer that can be used to evaluate the contribution of biomass burning (Hoffmann et al., 2010; Locker et al., 1988; Simoneit et al., 1999). The combination of the carbon isotope analysis and Lev can further divide the contributions of different carbonaceous sources. Some studies have confirmed the feasibility of this combination (Claeys et al., 2010; Gelencsér et al., 2007; Genberg et al., 2011; Huang et al., 2014; Kumagai et al., 2010; Liu et al., 2013; Niu et al., 2013; Zhang et al., 2015).
Cities in northern China have been affected by severe haze for several decades (Cao et al., 2012; R. Han et al., 2016; Sun et al., 2006; Wang et al., 1990). After the Action Plan for Air Pollution Prevention and Control (hereafter simplified as “Action Plan”) was promulgated in 2013, all parts of China responded to the issue and implemented numerous air quality management practices (CSC, 2013). In 2020, the average PM2.5 concentration in Chinese cities across the country decreased by 54.2 % compared with that in 2013 (MEE, 2014, 2021). In 2020, the proportion of clean energy consumption, such as that of natural gas and electricity, increased by 7.9 % compared with that in 2013, and the proportion of coal combustion decreased by 9.7 % (NBS, 2021). Before the Action Plan, fossil-fuel sources were identified as the main contributor to carbonaceous aerosols in Chinese cities (56 %–81 %) (Ni et al., 2018; Niu et al., 2013; Shao et al., 1996; Sun et al., 2012; Yang et al., 2005). In this study, we aimed to determine the main contribution of the current carbonaceous aerosols in northern Chinese cities. Also, we aimed to identify whether changes in energy type and emission control caused a change in the source of carbonaceous aerosols.
To address those issues, we conducted a source apportionment of carbonaceous aerosols based on yearly measurements of OC, EC, Lev, 13C, and 14C in PM2.5, combined with Latin hypercube sampling (LHS), in three representative northern Chinese cities during 2018–2019. This study provides a comprehensive understanding of current sources of carbonaceous aerosol after the implementation of the Action Plan in Chinese cities.
2.1 Research sites
We selected one urban sampling site in Beijing (BJ), one in Xi'an (XA), and one in Linfen (LF) (Fig. 1).
BJ is the capital of China, one of the largest megacities in the world, and the central city of the Beijing–Tianjin–Hebei economic region. It has a population of more than 20 million and has experienced serious air pollution problems in the past few decades.
XA, the capital of Shaanxi Province, is the ninth-largest central city and an important city of the Northwest Economic Belt in China. It is located in a basin surrounded by mountains on three sides, where atmospheric pollutants are discharged mainly from the basin and are less affected by other urban areas (Cao et al., 2009; Shen et al., 2011).
LF is located in western Shanxi Province and is one of the representative cities in the northern air-polluted region. Shanxi Province is the center of Chinese energy production and chemical metallurgy industries; its coal production and consumption were approximately 736.81 and 349.07 million tons, accounting for 27.1 % and 12.4 % of the Chinese total in 2019, respectively (NBS, 2020; SPBS, 2020). The air quality in LF was ranked in the worst 10 in China from 2018 to 2020 (MEE, 2019, 2020, 2021).
According to the pollutant data released by the National Air Quality Real-time Release Platform, Ministry of Ecology and Environment (MEE) of the People's Republic of China (http://106.37.208.233:20035/, last access: 20 April 2022), the daily average atmospheric SO2 concentration in LF exceeded 850 µg m−3 on 4 January 2017. XA and LF heavily suffer from air pollution in the Fenwei Plain. In July 2018, the State Council issued the Three-Year Action Plan to Win the Blue Sky Defense War. This included the Fenwei Plain as one of the key areas in which to prevent and control pollution (CSC, 2018).
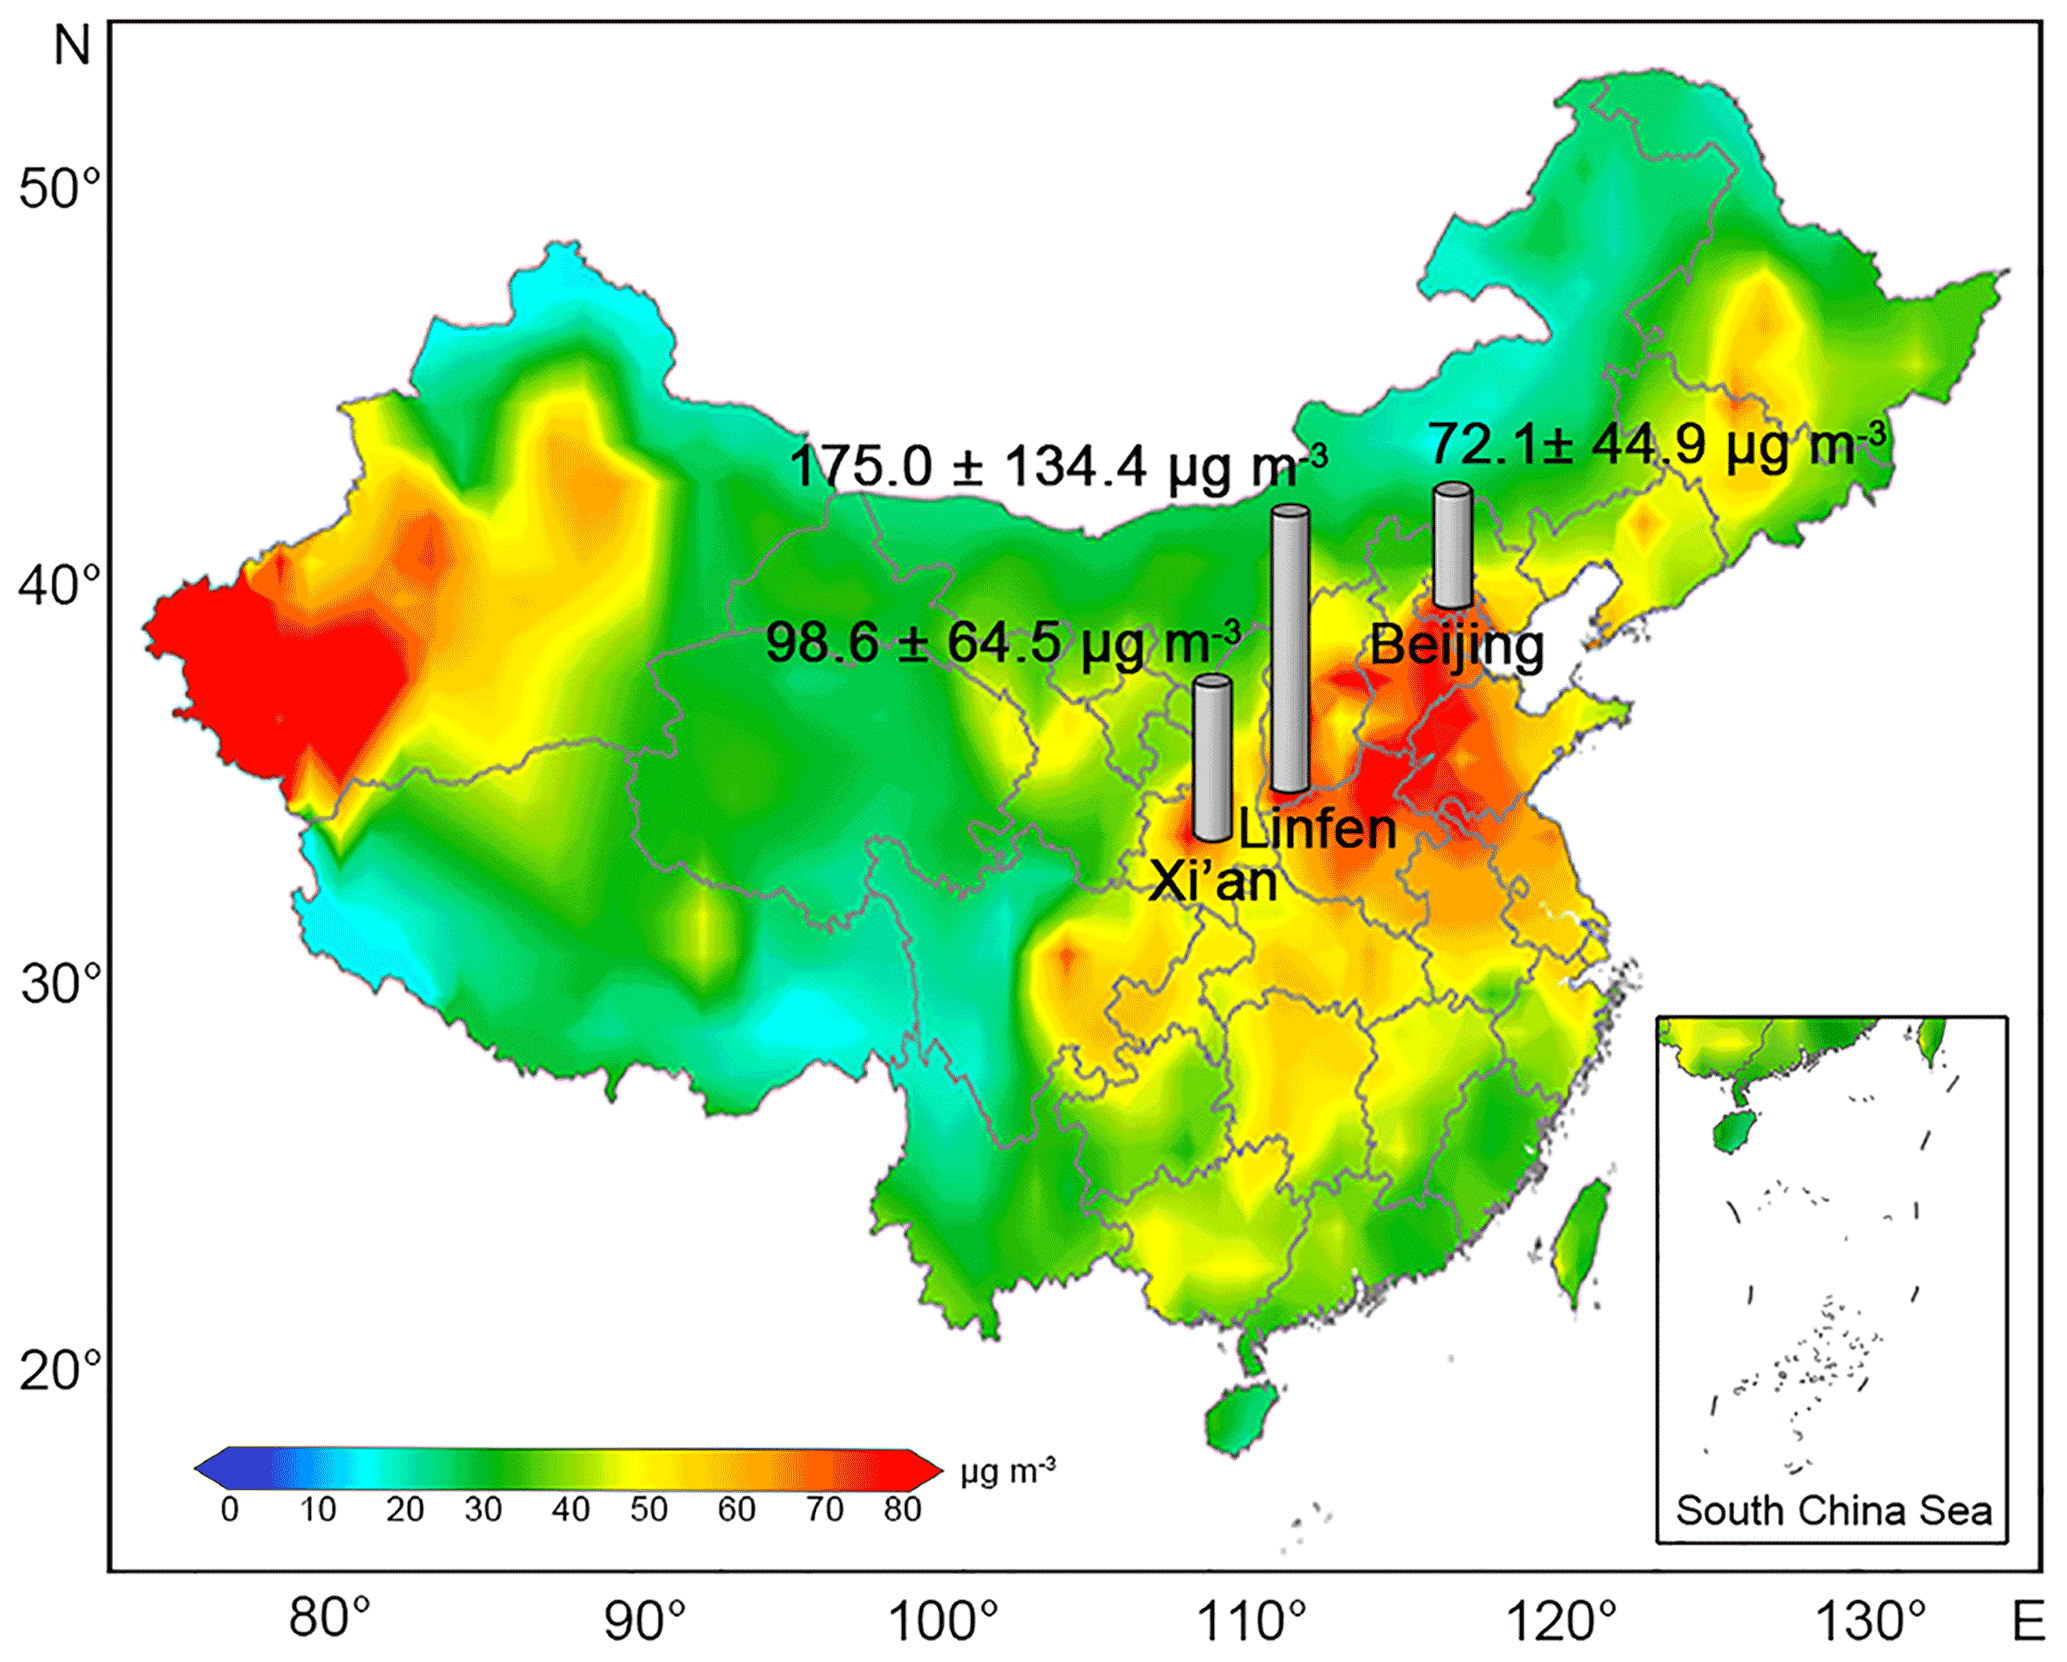
Figure 1Locations and PM2.5 concentration of Beijing (BJ), Xi'an (XA), and Linfen (LF). The background map shows the distribution of PM2.5 concentrations in most of China from 2015 to 2019 (H. M. Li et al., 2021). The gray bars are the average PM2.5 concentrations of the samples collected in this study during 2018 to 2019.
The first site was located in the northwest of BJ, on the rooftop of the Research Center for Eco-Environmental Sciences, Chinese Academy of Sciences (40∘0′33′′ N, 116∘20′38′′ E). The site was approximately 200 m from the road. The second site was located southwest of XA, on the rooftop of the School of Urban and Environmental Sciences in Northwest University (34∘15′36′′ N, 108∘88′53′′ E). Living quarters and teaching areas were located around these two sampling sites. The third site was located in Houma, a county-level city of LF, on the rooftop of a residential building (35∘63′56′′ N, 111∘39′53′′ E). There was no industrial pollution near each site, and they were representative urban sites.
2.2 Sample collection
At BJ and XA, PM2.5 samples were collected on the 7th, 14th, 21st, and 28th of each month from 28 April 2018 to 21 April 2019. In LF, 7 consecutive days in each season were selected for sample collection, and the sampling periods were concentrated in January, April, July, and October 2018. A total of 124 24 h (10:00 to 10:00 on the following day) PM2.5 samples and four field blanks were obtained.
Samples in each city were collected continuously on pre-baked quartz fiber filters (203 mm × 254 mm, Whatman, UK) using a high-volume (1.05 m3 min−1) sampler (TH-1000CII). The sampler was equipped with an impact collector to collect the particles less than 2.5 µm in aerodynamic diameter. To remove the existing carbon in the materials, the filter and foil used for wrapping should be baked in a muffle furnace at 375 ∘C for 5 h before use. After sampling, the filters were folded, wrapped in pre-baked aluminum foil, and stored at −18 ∘C. All filters were weighed after equilibrating at 25±1 ∘C and 52±5 % humidity for more than 24 h. The PM2.5 mass loadings were determined gravimetrically using a 0.1 mg sensitivity electronic microbalance. Carbonate has been removed from the filters by spraying with hydrochloric acid (1 mol L−1) before measurement.
2.3 OC and EC analyses
Filter pieces of 0.526 cm2 were used to measure the OC and EC using a DRI Model 2001 (Thermal/Optical Carbon Analyzer) at the Institute of Earth Environment, Chinese Academy of Sciences. The Interagency Monitoring of Protected Visual Environments (IMPROVE) thermal/optical reflectance protocol must be followed because OC and EC have different oxidation priorities under different temperatures (Cao et al., 2007; Chow and Watson, 2002). OC and EC were defined as OC1 + OC2 + OC3 + OC4 + OP and EC1 + EC2 + EC3 − OP, respectively, in accordance with the IMPROVE protocol (Chow et al., 2004). Sample analysis results were corrected by the average blank and standard sucrose concentrations of OC and EC, respectively.
2.4 Lev analysis
The molecular tracer (Lev) was determined by the high-performance anion exchange chromatography with pulsed amperometric detection (HPAEC-PAD) method at the South China Institute of Environmental Science, Ministry of Ecology and Environment. A quartz filter sample (2 cm2) was extracted with 3 mL of deionized water in a pre-baked glass bottle under ultrasonic agitation and was subsequently analyzed using a Dionex ICS-3000 system after filtration. The separation requires an equilibrium period, isocratic elution, and gradient elution. (For a specific description, refer to Z. S. Zhang et al., 2013.) The instrument sample loop was 100 µL, and the detection limit of Lev was µg mL−1.
Recent studies indicated that Lev was degraded to some extent during atmospheric transportation, and about 25 % of it came from other non-biomass burning sources (Hoffmann et al., 2010; Wu et al., 2021). Therefore, correction of the biomass burning source Lev (Levbb) is required before the source apportionment:
where p (0.4–0.65) is the degradation rate of Lev, which has different characteristics in each season. For a specific p value in each season, please refer to the research of Y. M. Li et al. (2021).
2.5 Stable carbon isotope analysis
The 13C compositions were determined using a gas isotopic analyzer (Picarro G2131-i) in conjunction with an elemental analyzer (Elemental Combustion System 4010) at the Institute of Earth Environment, Chinese Academy of Sciences. Specifically, 0.2–0.4 mgC of sample has been placed in a precombusted tin capsule (6×10 mm), and the air was removed by squeezing. The samples were tested at 980 and 650 ∘C with 70–80 mL min−1 helium as the carrier gas and 20–30 mL min−1 oxygen as the reaction gas. The resulting gas mixture was then collected in a gas isotopic analyzer (Bachar et al., 2020). Urea standard (CAS number 57-13-6) was used as a standard sample. 13C data are expressed in delta notation with respect to Vienna Pee Dee Belemnite (VPDB) (Coplen, 1996):
2.6 Radiocarbon analysis
The 14C samples were prepared and tested in the laboratory of the Xi'an Accelerator Mass Spectrometry (AMS) Center. The processed sample was packed in a sealed quartz tube with a silver wire and excessive CuO. The solid sample was then combusted at 850 ∘C for 2.5 h to convert it into gas after the vacuum degree was less than mbar. The gas sample was passed through a liquid nitrogen cold trap (−196 ∘C) to freeze CO2 and water vapor and then passed through an ethanol–liquid nitrogen cold trap (−90 ∘C) to remove water vapor and purify CO2 (Turnbull et al., 2007; Zhou et al., 2014). The collected CO2 was reduced to graphite via a reduction reaction with zinc particles and iron powder as the reductant and catalyst, respectively (Jull, 2007; Slota et al., 1987). The graphite was pressed into an aluminum holder and measured using a 3 MV AMS, with a precision of 3 ‰ (Zhou et al., 2006, 2007).
Forty-nine targets were arranged in sequence in the sample fixed wheel, including 40 samples, 6 OX-II standard samples, 2 anthracite standard samples, and 1 sugar carbon standard sample each time. AMS online δ13C was used for isotope fractionation correction.
The 14C results were expressed as a fraction of modern carbon (fM) (Currie, 2000; Mook and Plicht, 1999). It is defined as the ratio of the sample related to the isotopic ratio of the reference year 1950 (Stuiver and Polach, 1977):
Atmospheric nuclear bomb tests in the late 1950s and the early 1960s released a large amount of 14C, and the ratio of in atmospheric CO2 roughly doubled in the mid-1960s (Hua and Barbetti, 2004; Levin et al., 2003, 2010; Lewis et al., 2004; Niu et al., 2021). However, fM in the atmosphere has been decreasing because of the dilution effect produced by the absorption of marine and terrestrial biospheres and the release of fossil fuels. In recent years, studies on background 14CO2 in China and other countries have shown that the fM value in the atmosphere has decreased and approached 1 (Hammer and Levin, 2017; Niu et al., 2016). This means that the impact of the nuclear explosions has almost disappeared for the current atmosphere, and the change in current atmospheric 14C was mainly influenced by the regional natural carbon cycle and fossil-fuel CO2 emissions. Thus, the fM values were not corrected in this study, because the material used for biomass burning in China was mainly from crop straw (Fu et al., 2012; Streets et al., 2003b; Yan et al., 2006; Z. S. Zhang et al., 2017), and the influence of atmospheric nuclear bomb tests has basically vanished for the annual plants.
Non-fossil fractions (fnf) and fossil fractions (ff) were determined from the fM values.
2.7 Source apportionment of total carbon using 14C and 13C
To study the contribution of each fossil source to the total carbon (TC), we used the principle of isotopic chemical mass balance to further separate fossil sources into liquid fossil fuels and coal. Since the amount of carbonaceous aerosol produced by natural gas is very low compared with coal and liquid fossil combustion, its contribution was not considered here (Chen et al., 2005; England et al., 2002; Guo et al., 2014; Yan et al., 2010). In this part, 13C and 14C were combined to calculate the contributions of non-fossil, coal, and liquid fossil sources.
where fnf, fcoal, and fliq.fossil represent the proportions of non-fossil source, coal and liquid-fossil combustion, respectively, and δ13Cnf, δ13Ccoal, and δ13Cliq.fossil represent δ13C from the corresponding sources. δ13Csample is the δ13C of the samples at each site, and β is a small correction.
Since the formation process of OC can cause the fractionation of 13C, with a range mainly in 0.03 ‰–1.40 ‰ (mean 0.2 ‰) (Aggarwal and Kawamura, 2008; Cao et al., 2011; Ho et al., 2006; Zhao et al., 2018), a small correction (0.2 ‰) was made for the δ13C sample used in Eq. (6). The selection of the reference value is described in detail in Sect. 2.9.
2.8 Source apportionment of OC and EC using 14C and Levbb
The method combines 14C with the concentration of carbon components and a molecular tracer (Levbb) to quantify the sources of OC and EC. Carbon was assumed to originate from fossil-fuel combustion, biomass burning, and other non-fossil emissions (Gelencsér et al., 2007). The following is a simple calculation method.
EC consists of biomass burning (ECbb) and fossil-fuel combustion (ECff).
ECbb was calculated based on the Levbb concentration and the estimated ECbb/Levbb ratio:
Then, ECff was calculated by subtraction (Eq. 8).
OC consists of OC from biomass burning (OCbb), fossil-fuel combustion (OCff), and other sources (OCother), including primary and secondary biogenic OC and SOC (secondary organic carbon) from non-fossil emissions.
OCbb was calculated based on the Levbb concentration and the estimated ratio:
OCother was calculated by balancing the 14C content that was not attributed to OCbb.
Furthermore, fnf(OC) was calculated based on the 14C concentration measured in the sample (detailed description of the formulas can be found in Genberg et al., 2011); fM(bb) and fM(nf) are the 14C concentrations in biomass burning and other non-fossil emissions, respectively.
Finally, OCff was calculated by subtraction (Eq. 10).
2.9 Uncertainties of source apportionment
Some uncertainties exist in some parameters in Eqs. (5)–(11) and need to be evaluated. Table 1 lists the range of reference values used in this study. The ratios and depend on the type of biofuel and the burning conditions (Oros et al., 2001a, b). In foreign studies, the most common distributions of and are 0.08–0.2 and 0.07–0.45, respectively (Gelencsér et al., 2007; Puxbaum et al., 2007; Szidat et al., 2006). The distribution ranges of and burned by trees, shrubs, and rice are approximately 0.01–0.04 and 0.05–0.31, respectively (Engling et al., 2006, 2009; Wang et al., 2009). Zhang et al. (2007) found that the values of and in the cereal straw of BJ were 0.08 and 0.13, respectively.
The δ13C of aerosols derived from liquid fossil fuels (gasoline and diesel oil) was approximately −31 ‰ to −25 ‰ (Agnihotri et al., 2011; Huang et al., 2006; López-Veneroni, 2009; Pugliese et al., 2017; Vardag et al., 2015; Widory, 2006). The δ13C derived from coal combustion was relatively high, ranging from −25 ‰ to −21 ‰ (Agnihotri et al., 2011; Pugliese et al., 2017; Widory, 2006). The results of Agnihotri et al. (2011) showed that the δ13C characteristic of biomass burning emissions ranged from −25.9 ‰ to −29.4 ‰. Smith and Epstein (1971) found that plants with C3 (e.g., wheat, soybeans, and most woody plants) and C4 (e.g., corn, grass, and sugar cane) metabolism had significantly different δ13C, with an average of −27 ‰ and −13 ‰, respectively. In other studies, these two types of plant-derived aerosols had different characteristics; the 13C from C3 and C4 plants ranged from approximately −23.9 ‰ to −32 ‰ (Moura et al., 2008; Turekian et al., 1998) and from −11.5 ‰ to −13.5 ‰ (Martinelli et al., 2002), respectively.
Table 1Values with limits of input parameters for source apportionment using Latin hypercube sampling (LHS).
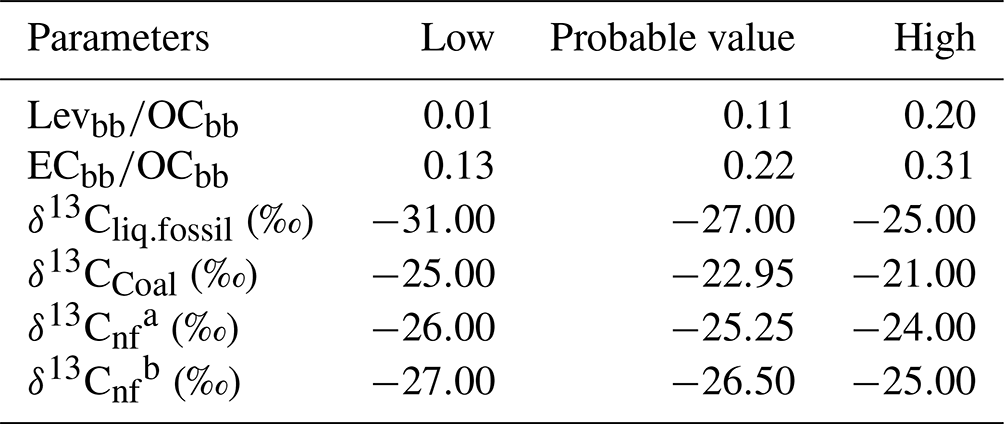
a Values used in BJ/LF. b Values used in XA.
The parameters in Table 1 are referenced from Agnihotri et al. (2011), Engling et al. (2006, 2009), Gelencsér et al. (2007), Huang et al. (2006), López-Veneroni (2009), Martinelli et al. (2002),
Moura et al. (2008), Oros et al. (2001a, b), Puxbaum et al. (2007),
Smith and Epstein (1971), Szidat et al. (2006), Turekian et al. (1998),
Wang et al. (2009), Widory (2006), and Zhang et al. (2007).
Because of the differences in the structure of biomass fuels in different cities, we selected the δ13C value based on the current status of biomass fuel used in research regions. In China, biomass fuels mainly include crop residues, branches, and leaves, and the amount of perennial wood is quite small (Zhang et al., 2015). BJ has a small area of arable land, with low agricultural output and corn production (BJMBS, 2020). The neighboring province, Hebei, is a large agricultural province that produces a large amount of wheat and corn annually; the latter has a larger sown area (PGHP, 2021). Shaanxi Province also mainly produces wheat and corn; however, the sown area of corn is more than 3 times that of wheat (SPBS, 2020). Agricultural production in XA and the surrounding Guanzhong area is relatively large. The agricultural structure is dominated by wheat and corn, and their sown areas are not very different (SAPBS, 2020). This shows that the δ13C of agricultural straw burning in LF is likely to be higher, and that in XA may be lower. Some studies considered that δ13C used for quantitative mass–balance source apportionment calculations from biomass burning should mainly be defined as C3 plants (Andersson et al., 2015; Fang et al., 2017; Ni et al., 2020). Based on this information, the δ13C value of biomass burning in BJ and LF was found to be approximately −26 ‰ to −24 ‰, and that in XA is likely to be from approximately −27 ‰ to −25 ‰.
According to the research about biomass burning type, perennial biomass fuel was less frequently used in China (Fu et al., 2012; Streets et al., 2003b; Yan et al., 2006; Z. S. Zhang et al., 2017), the impact of nuclear explosions on 14C data can be ignored, and the fM(nf) and fM(bb) of the local station should be close to the atmospheric value.
To evaluate the uncertainties of the quantification of source contributions, which resulted from the uncertainties of the parameters used, we used Python software to generate 3000 random variable simulations based on the LHS method (Gelencsér et al., 2007). After excluding part of the out-of-range data, the median values of the remaining simulations of each sample were considered the best estimate. The results of the uncertainty analysis are discussed further in Sect. 3.6.
2.10 Air mass back-trajectory analysis
For back-trajectory analysis, air mass back trajectories from the previous 48 h were determined by using the HYbrid Single-Particle Lagrangian Integrated Trajectory (HYSPLIT) model (Draxler and Hess, 1998) at three different endpoint heights (e.g., 100, 500, and 1000 m) and a time interval of 6 h for the sampling day (https://www.arl.noaa.gov/, last access: 20 April 2022).
3.1 Characteristics and variation of carbonaceous components
During the sampling period, the average mass concentration of PM2.5 in BJ, XA, and LF was 72.1±44.9, 98.6±64.5, and 175.0±134.4 µg m−3, respectively. All concentrations were higher in winter and lower in summer; LF showed the highest value of 368.7±75.0 µg m−3 in winter.
Figure 2 shows the changes in OC and EC and their ratios at the sampling sites. The carbon components in the BJ, XA, and LF samples accounted for approximately 17.5±6.0 %, 21.5±21.0 %, and 17.8±7.2 % of PM2.5, respectively. Both OC and EC were changing simultaneously and were characterized by low carbonaceous concentrations in summer (OC: 8.9±3.7 µg m−3; EC: 1.6±0.9 µg m−3) and high concentrations in winter (OC: 69.2±58.9 µg m−3; EC: 11.8±7.9 µg m−3). The average ratios in BJ, XA, and LF were 4.0±1.4, 9.0±6.1, and 6.6±2.0, respectively. Recent studies have shown that the average ratio of in BJ, XA, and Shanxi Province was approximately 1.22–6.5 (Y. M. Han et al., 2016; Ji et al., 2018; Wang et al., 2015; Zhao et al., 2013). Generally, SOC is considered to occur when >2 (Castro et al., 1999; Novakov et al., 2005; Turpin and Huntzicker, 1995). Additionally, the use of biomass fuels can also enhance the ratio (Popovicheva et al., 2014; Rajput et al., 2011). Therefore, the high ratio indicates that carbonaceous aerosols contained a large number of SOCs or biomass burning sources, especially in XA.
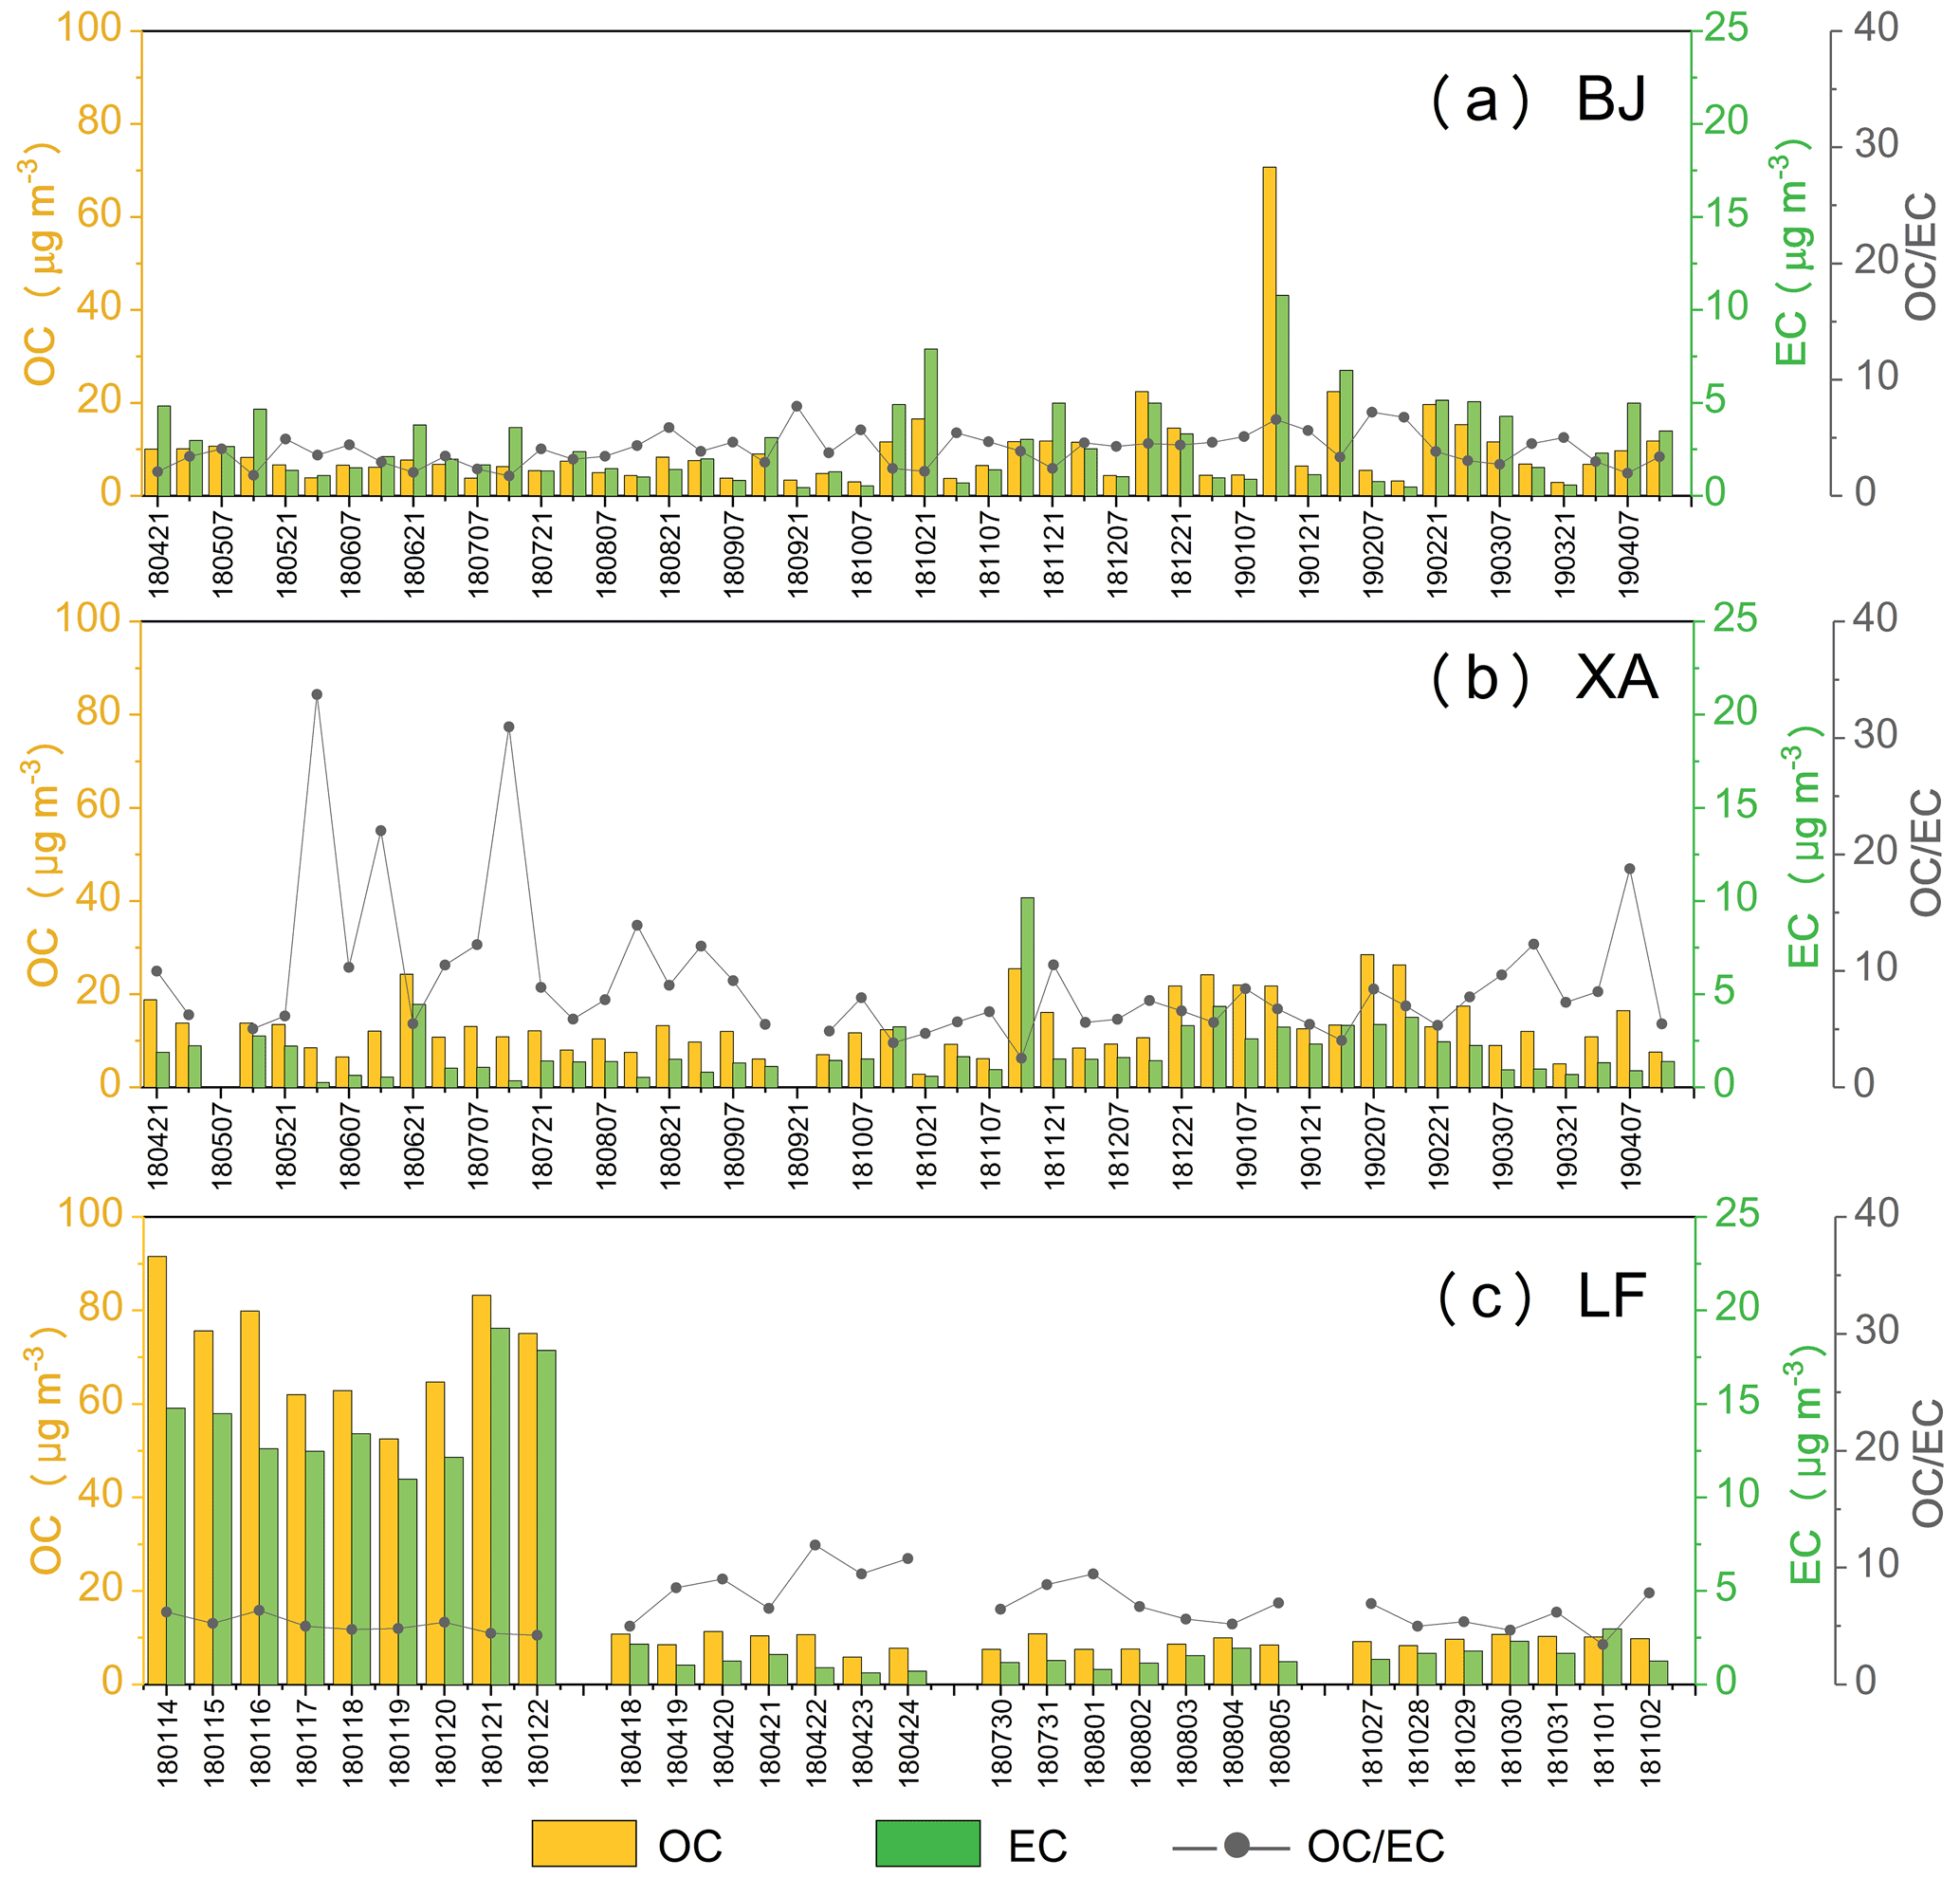
Figure 2Variations of elemental carbon (EC), organic carbon (OC), and their ratios in PM2.5 at the sampling sites in BJ, XA, and LF (date, “yymmdd”).
The average mass concentrations of TC, OC, and EC at the sampling site in BJ were 12.5±11.8, 9.7±10.0, and 2.8±2.1 µgC m−3. The concentration of carbon components was relatively stable in spring and summer but fluctuated greatly in fall and winter. The concentration of carbon components in most cases was close to that of other periods, but there was a rapid increase in fall and winter. The highest TC value was observed in the middle of January 2019 (81.5 µgC m−3).
The average concentrations of TC, OC, and EC in XA were 14.6±7.5, 12.8±6.3, and 1.9±1.6 µgC m−3, respectively. In contrast to that in BJ, the concentration of the carbon components in XA fluctuated greatly throughout the year. Specifically, the concentration was lower from July to October and significantly higher from December to February. However, there were high concentrations of TC on some days in spring and summer, such as 21 June 2018, with the concentration reaching 28.8 µgC m−3.
The average concentrations of TC, OC, and EC in LF were 35.7±36.5, 30.0±30.4, and 5.6±6.2 µgC m−3, respectively. In contrast to those in BJ and XA, the concentrations of the carbon components in LF were persistently high in winter and stable and low in other seasons.
3.2 Variations of 14C
The 14C results showed that the average fnf values in BJ, XA, and LF were 54±11 %, 54±10 %, and 36±14 %, respectively. Non-fossil sources were the main contributors in the BJ and XA samples (Fig. 3). Furthermore, the fnf in the BJ samples showed a higher average value in spring (59±6 %), whereas that in the XA samples had higher average values in fall (fnf, 59±7 %) and winter (fnf, 63±6 %). In the LF samples, fossil sources were the main contributors, contributing 81±1 % in winter.

Figure 3Variations in proportion of non-fossil sources (fnf) of carbonaceous aerosols at the sampling sites in BJ, XA, and LF. The red scatter dot represents the fnf of each sample, and the black solid line represents the sliding average fnf value of every five samples (date, “yymmdd”).
By analyzing the fnf characteristics of samples with different pollution levels based on the PM2.5 concentration, we can study the causes and characteristics of air pollution more effectively. Using the relevant classification index of the daily average PM2.5 concentration in the Technical Regulation on Ambient Air Quality Index (MEE, 2012), we classified the samples as clean (with a concentration of less than 75 µg m−3), regular (with a concentration between 75 and 150 µg m−3), and polluted (with a concentration greater than 150 µg m−3). The fnf value in most samples in BJ (44±8 %) and LF (19±2 %) was lower during serious air pollution (Fig. 4), indicating that the high concentrations of aerosols in BJ and LF were more affected by fossil sources. One BJ sample had a low fnf value (36 %) in January, and another had a high fnf value (89 %) in February. These samples were collected when the atmosphere was severely polluted and very clean, respectively. This might indicate that emissions from fossil-fuel sources are a decisive factor in air pollution in BJ. In the XA samples, when the atmosphere was clean, fnf decreased by 2 %–3 %, indicating that the carbonaceous aerosol pollution may be more affected by biomass burning or secondary non-fossil sources from local emissions.
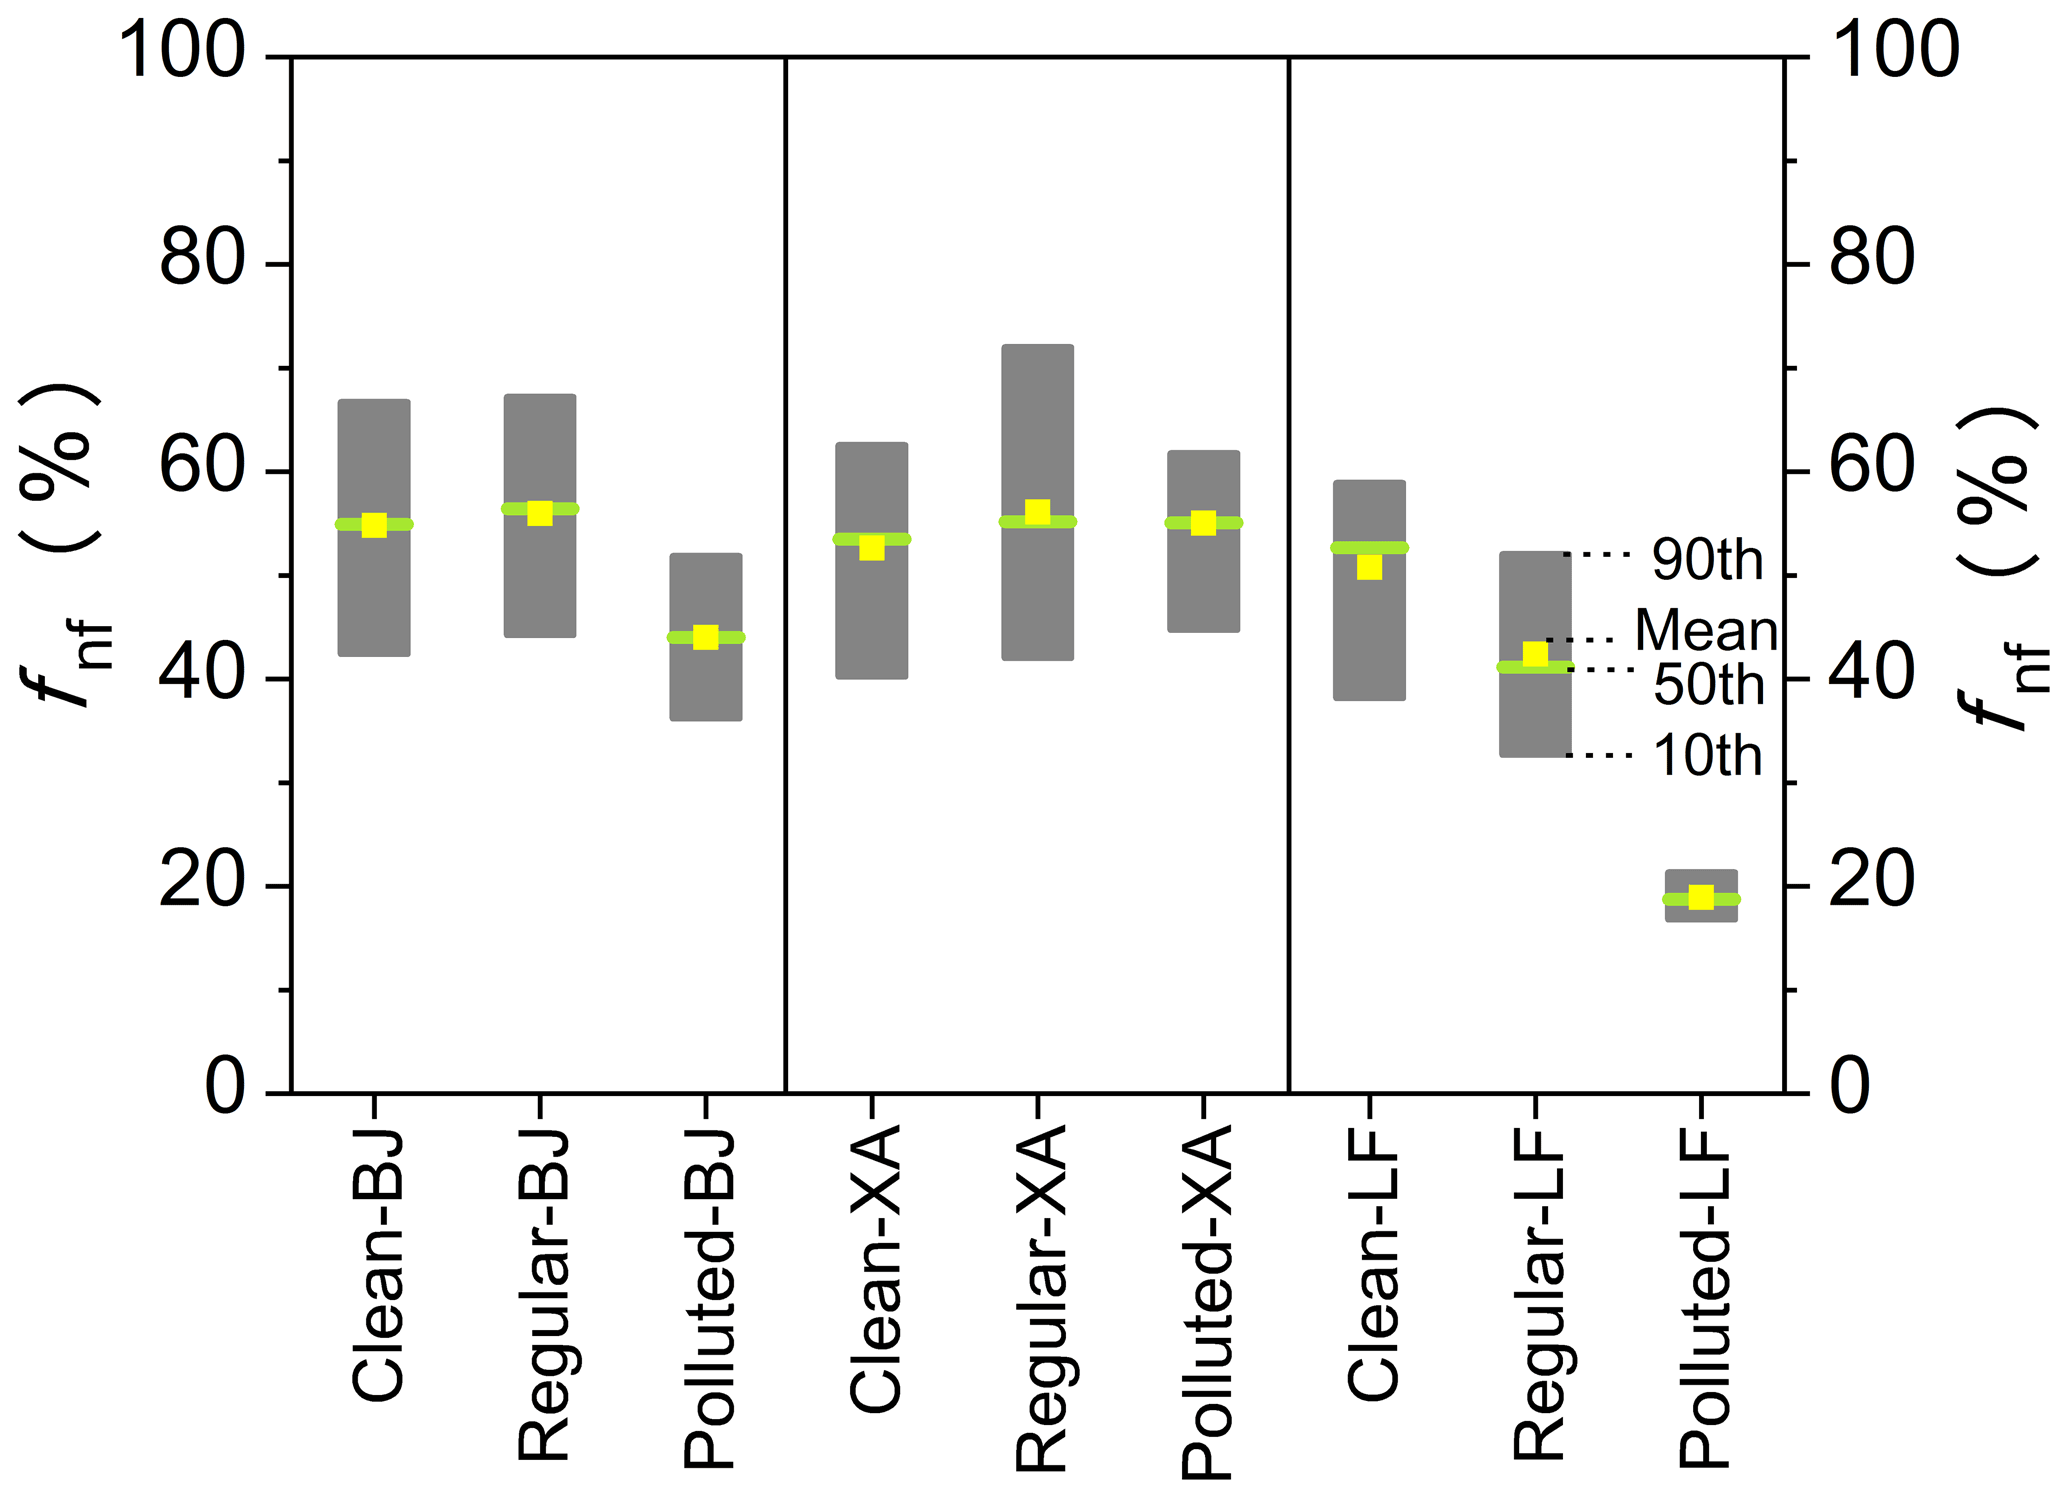
Figure 4Box plot distribution of fnf of samples with different pollution levels. Clean samples: PM2.5<75 µg m−3; regular samples: 75 µg m−3 ≤ PM2.5<150 µg m−3; polluted samples: PM2.5≥150 µg m−3.
As can be seen in Fig. 5, the contribution of fossil sources in BJ decreased by about 6 %–16 % for the different sampling season/period after the implementation of the Action Plan, based on previous studies (Fang et al., 2017; Lim et al., 2020; Liu et al., 2016a, b; Ni et al., 2018, 2020; Shao et al., 1996; Sun et al., 2012; Yang et al., 2005; Y. L. Zhang et al., 2015, 2017) and this study. Among them, fossil sources decreased significantly in fall and winter after the Action Plan, which were 15 % and 14 %, respectively. The contribution of fossil sources in our study decreased by 16 % in winter compared with the previous results. For the polluted and clean periods, the proportion of fossil sources reduced by 6 % and 9 %, respectively. With the implementation of energy conservation and emission reduction policies, many non-clean fossil fuels have been replaced by clean energy. In 2019, the coal consumption in BJ was only 1.3 million tons, which was 91.5 % lower than that in 2013 (BJMBS, 2020).
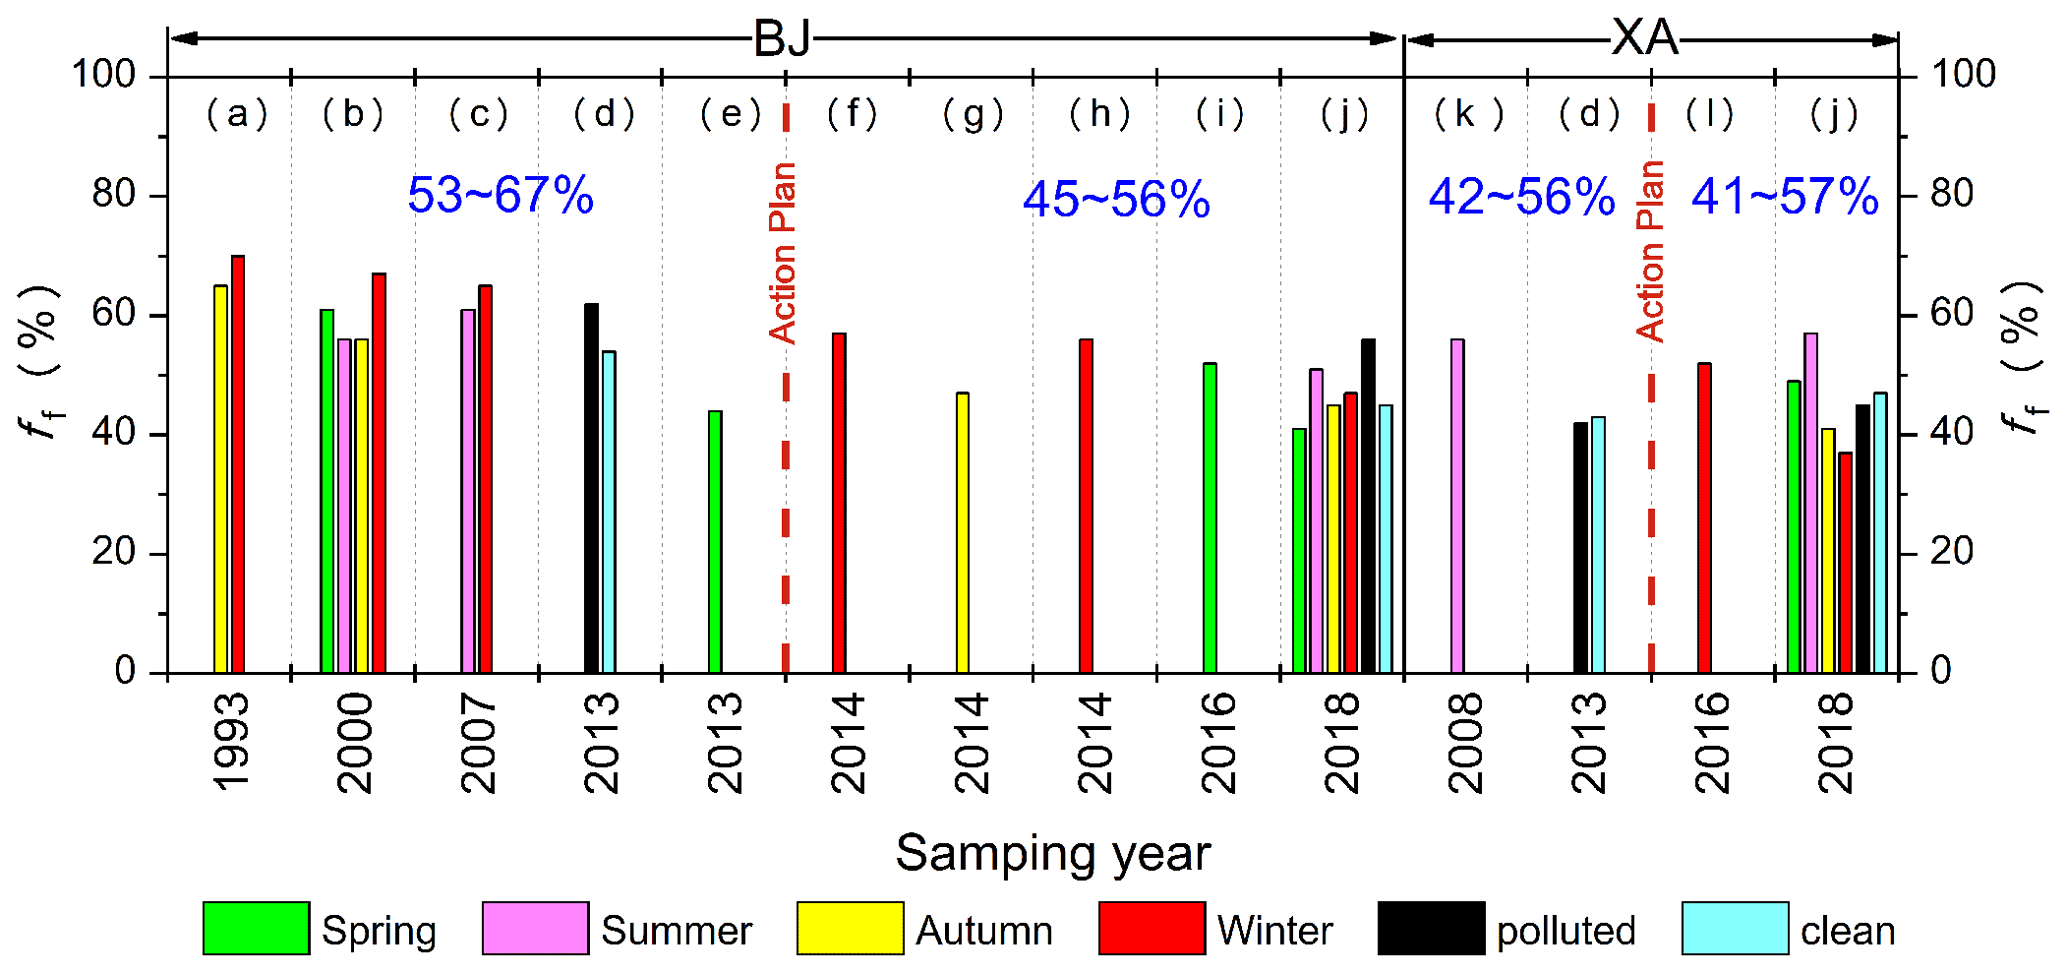
Figure 5Comparison of fossil proportion (ff) of carbonaceous aerosol reported in different studies in BJ and XA, China, for each season/period. The data have been converted to the ratio of total carbon. The ranges shown in the upper part of the figure are the average values of each season/period before and after the Action Plan. (a) Shao et al. (1996), (b) Yang et al. (2005), (c) Sun et al. (2012), (d) Zhang et al. (2015), (e) Liu et al. (2016b), (f) Zhang et al. (2017), (g) Liu et al. (2016a), (h) Fang et al. (2017), (i) Lim et al. (2020), (j) this study, (k) Ni et al. (2018), (l) Ni et al. (2020).
Different from the results in BJ, the proportion of fossil sources in XA has not decreased significantly for each season/period (Fig. 5). This difference might be related to a small decline (<0.5 %) in coal consumption in Xi'an during 2019 compared with 2013 (XAMBS, 2014, 2021). Due to the less attention to LF, there is still a lack of related research of carbonaceous aerosols using radiocarbon in this city to compare.
3.3 Air mass back-trajectory analysis
We analyzed and counted the backward trajectory during the sampling period; several typical types were presented in Fig. S1 in the Supplement. Figure S1a shows the type of backward trajectory with the highest frequency during the sample collection in BJ. This type of long-distance transportation from the northwest accounted for approximately 43.9 % of all cases. The average PM2.5 concentration, carbonaceous aerosol concentration, and fnf of the sample were 45.4±22.7 µg m−3, 9.5±6.4 µgC m−3, and 56±10 %, respectively. As shown in Fig. S1b, when air mass was transported from the south or stayed for a long time in Hebei Province, air pollution was usually more serious. These cases accounted for approximately 26.3 % of all cases. The average concentrations of PM2.5 and carbonaceous aerosols were 97.3±43.6 µg m−3 and 15.6±7.9 µgC m−3, which were 2.1 and 1.6 times those in the northwest, respectively. The aerosol concentration of air masses transported from the southern region was higher than that from the northern regions. The fnf value in these cases was 46±5 %, which was 10 % higher than in the northwestern cases. Thus, air pollution in BJ might be affected by fossil sources in Hebei Province and other southern regions.
The PM2.5 and carbonaceous concentrations were low when the air mass transported from the northwest for a long distance at the XA site (Fig. S1c). In this case, the average PM2.5 concentration, carbonaceous aerosol concentration, and fnf of the samples were 93.1±65.1 µg m−3, 17.4±9.6 µgC m−3, and 62±7 %, respectively. However, when air masses circulated in the Guanzhong Basin or converged into the basin from multiple directions due to the local topography (Fig. S1d), the concentration of carbonaceous aerosol was usually high. The proportion of this type of air mass transportation accounted for 53.6 % of the total cases. The average PM2.5 concentration, carbonaceous aerosol concentration, and fnf of the corresponding samples were 132.0±72.8 µg m−3, 19.7±10.4 µgC m−3, and 58±9 %, respectively. Thus, air pollution in XA was mainly affected by the diffusion environment. The air mass remained in the upper part of the Guanzhong region for a long time when the diffusion environment was poor, causing secondary reactions and air pollution. Moreover, when the air mass came from eastern cities (e.g., Henan or Hubei provinces), fnf was 47 %, which was significantly lower than that in other cases. This indicated that fossil source emissions in Henan and other eastern regions might contribute to air pollution in XA.
As shown in Fig. S1e, when the air mass was long-distance transported to LF, the concentration of carbonaceous aerosols was relatively stable. However, pollutants accumulated when the air mass returned over and around the city (Fig. S1f). In these cases, the concentrations of PM2.5 and carbonaceous aerosols of the sample increased by 46.35 %–57.10 %, and fnf decreased by 5 %. Thus, the LF samples were more susceptible to the diffusion environment, and the proportion of fossil sources discharged locally.
Air pollution in BJ was more susceptible to the impact of transportation from the southern region, whereas XA and LF were more affected by local emissions and diffusion environments.
3.4 Best estimate of source apportionment of TC using 14C and 13C
The δ13C values at the sampling sites in BJ, XA, and LF were ‰, ‰, and ‰, respectively. Figure 6 shows the δ13C values of the samples from each city and various sources. Specifically, δ13C had lower values in the BJ and LF samples during summer ( ‰ and ‰, respectively) and higher values during winter ( ‰ and ‰, respectively). Conversely, the lower and higher δ13C values in the XA samples appeared in winter ( ‰) and spring ( ‰).
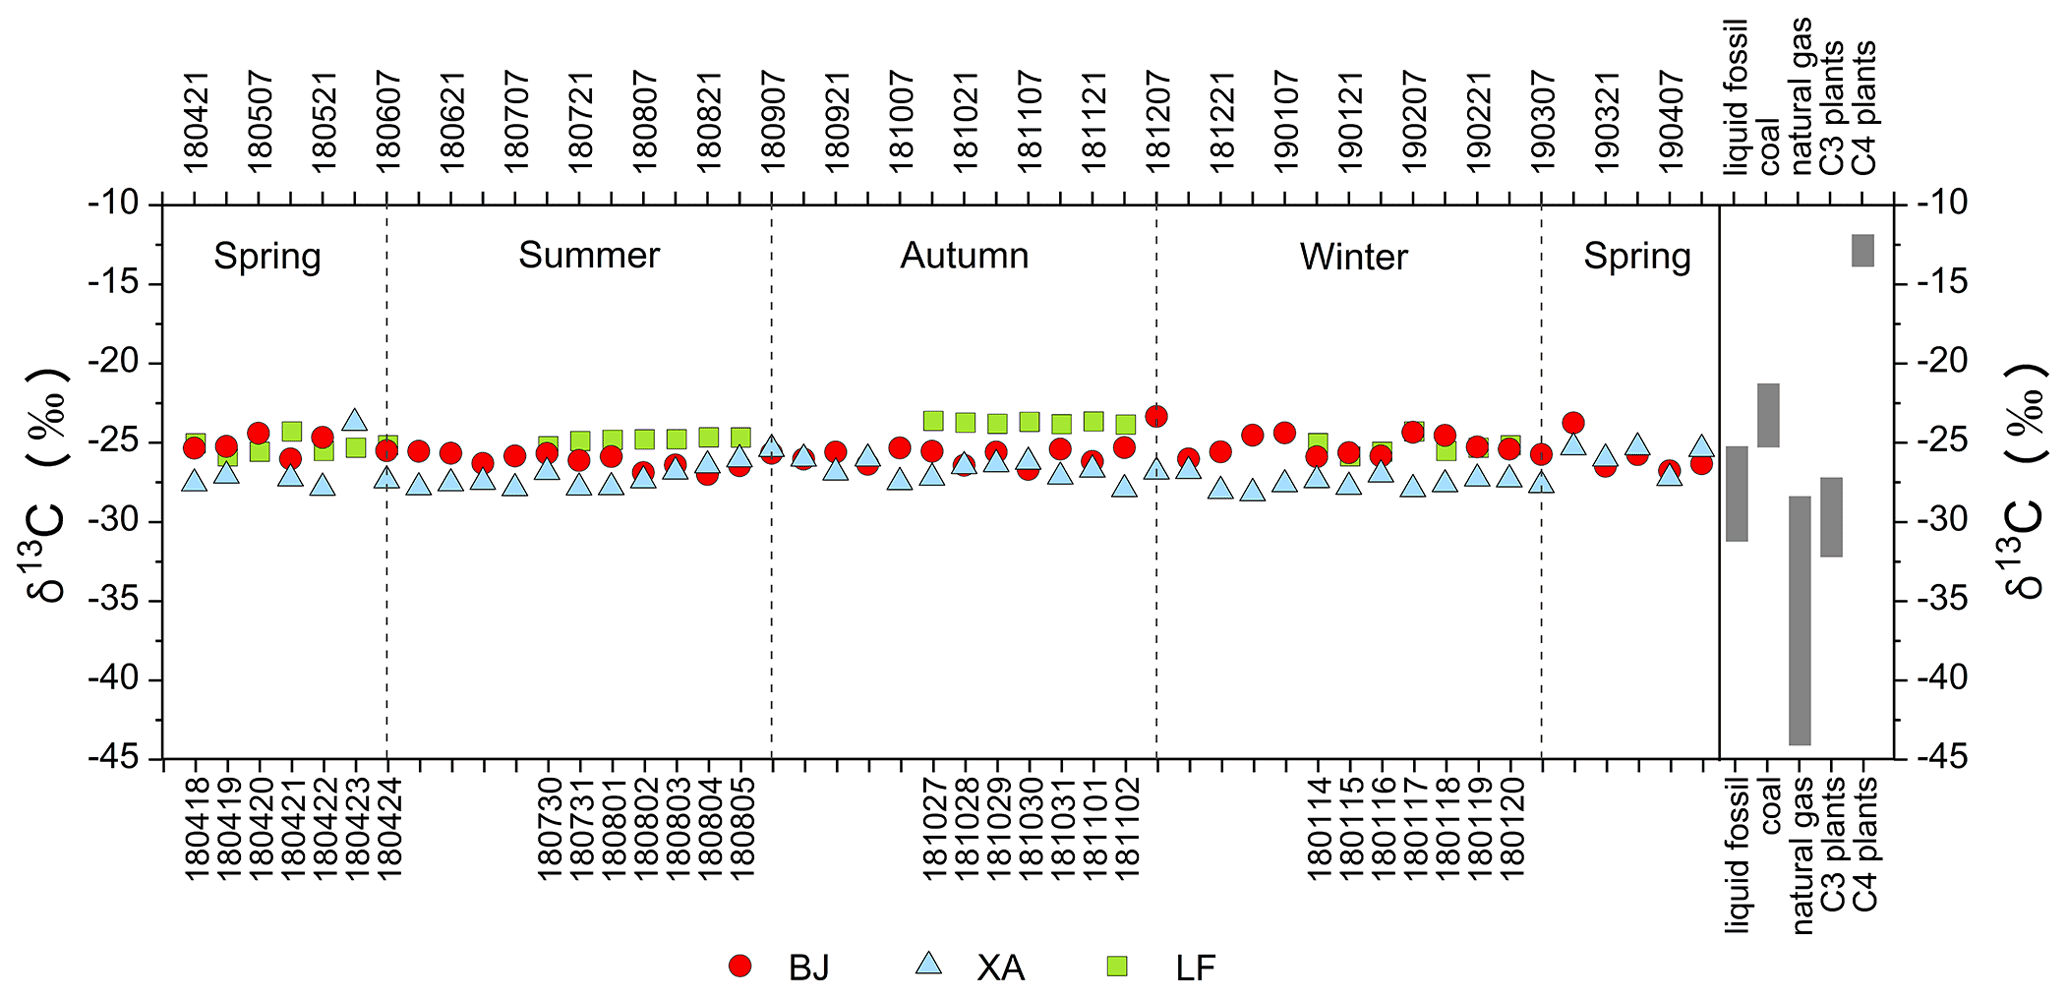
Figure 6δ13C values of samples from BJ, XA, and LF and comparison with the δ13C distribution of various sources. The abscissa represents the sampling date (yymmdd). The tick labels of the top axis represent the dates of BJ and XA, and the bottom axis represents the date of LF. The gray box indicates the δ13C of the main source (Agnihotri et al., 2011; Huang et al., 2006; López-Veneroni, 2009; Martinelli et al., 2002; Moura et al., 2008; Pugliese et al., 2017; Smith and Epstein, 1971; Vardag et al., 2015; Widory, 2006).
Compared with the existing isotope indicators of various sources (Fig. 6), the increase in δ13C in the BJ and LF samples during winter may be more related to the increase in coal combustion from local and surrounding cities. The increase in δ13C in XA samples during fall and winter may be related to the use of C4 plant fuel, whereas the decrease during winter may be related to vehicle emissions and the use of C3 plant fuels, such as wheat straw or wood.
14C and 13C were used to quantify the sources of TC in the carbonaceous aerosols (Fig. 7). For the carbonaceous aerosols in BJ and XA, the best estimate of source apportionment showed that the contributions of liquid fossil fuels were 29.3±12.7 % and 24.9±18.0 %, respectively, which were greater than the contribution of coal (15.5±8.8 % and 20.9±14.2 %, respectively). In 2019, coal accounted for only 2.6 % of all fossil fuels used in BJ (BJMBS, 2020). This indicates that the local combustion of coal was very low, and the coal contribution might be somewhat related to transportation from the surrounding regions. Moreover, the higher contribution of liquid fossil fuels in BJ was due to the high number of motor vehicles (6.4 million), which was 1.7 times higher than that in XA in 2019 (BJMBS, 2020; XAMBS, 2021). Figure S2 shows some studies on the source apportionment of coal and liquid fossil fuels in aerosols in BJ over the past few decades. The coal contribution in BJ decreased, whereas liquid fossil fuels gradually became the main source of fossil fuels. After the implementation of the Action Plan, the proportion of coal in fossil sources decreased by approximately 32 % in BJ (Gao et al., 2018; Li et al., 2013; Liu et al., 2014; Shang et al., 2019; Song et al., 2006; Tian et al., 2016; Wang et al., 2008; Y. L. Zhang et al., 2013).
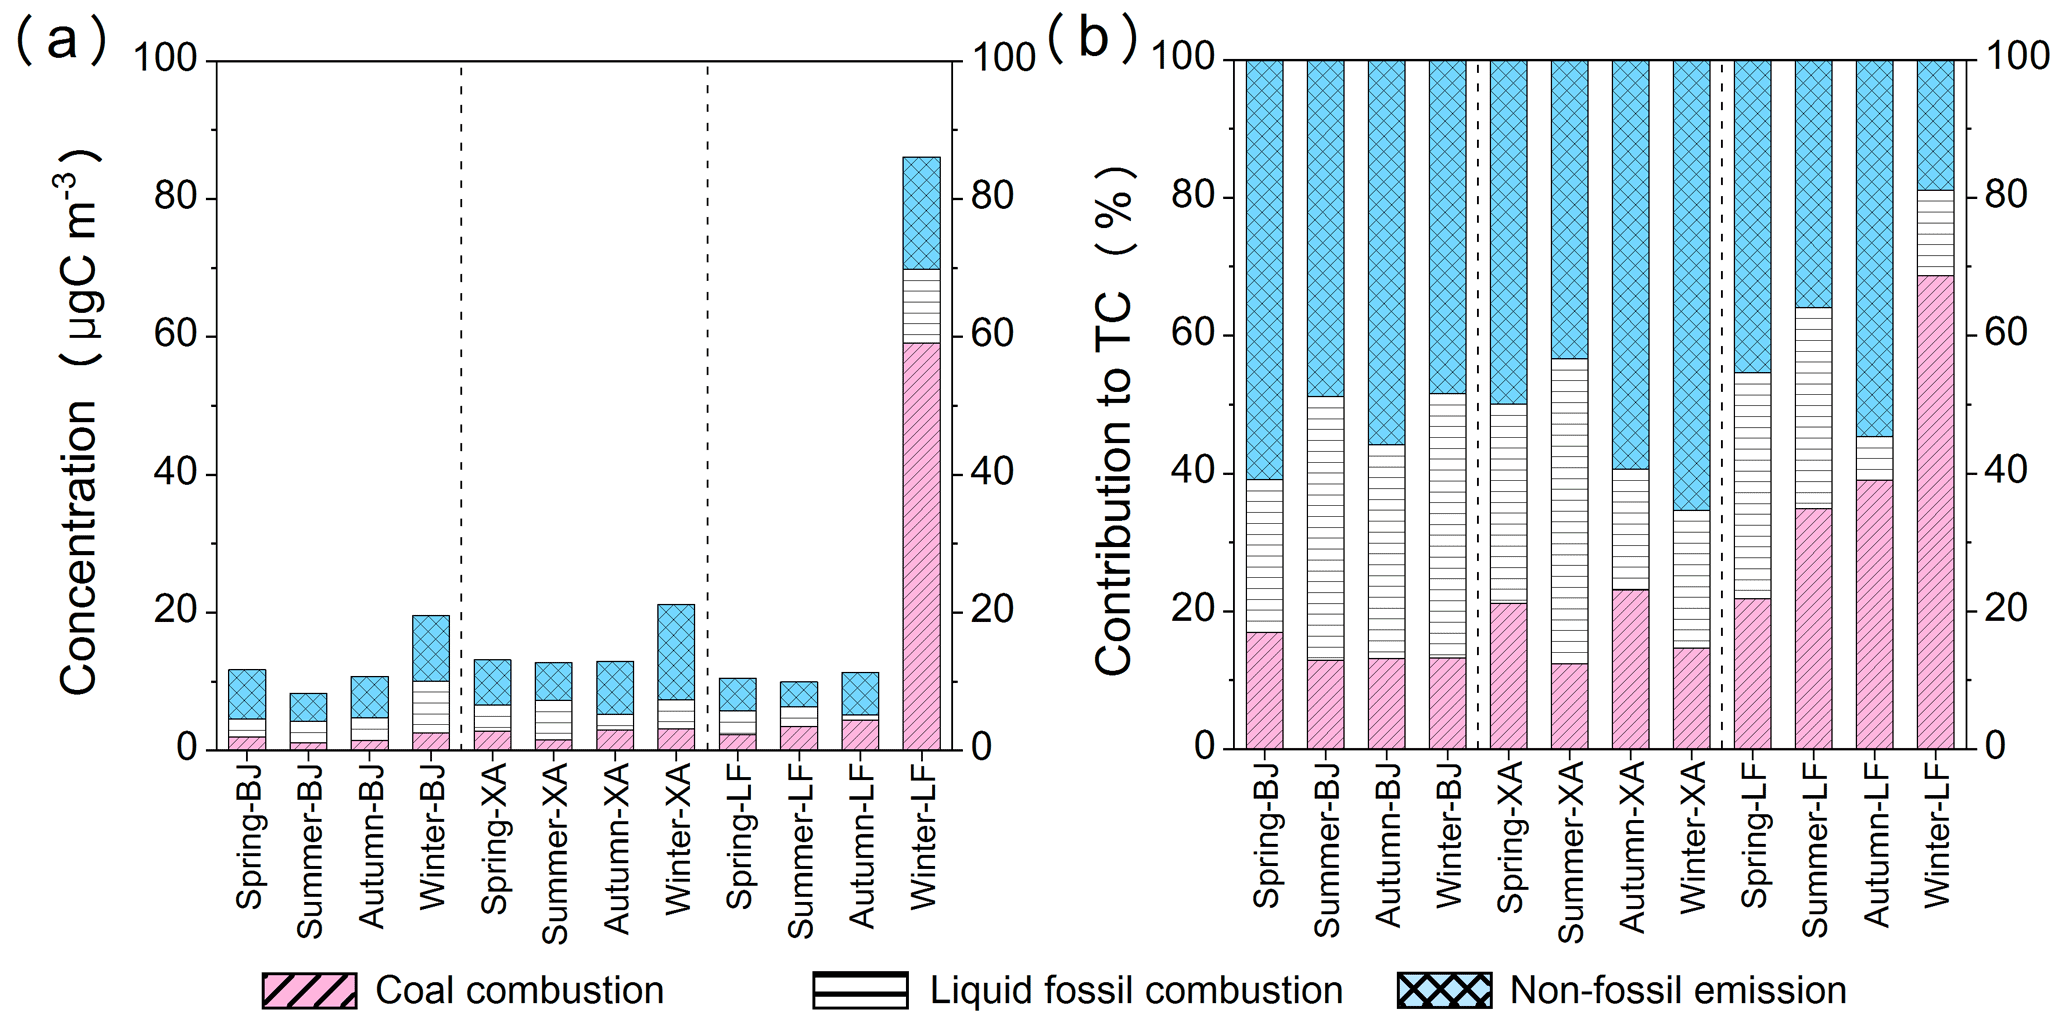
Figure 7Mass concentrations (µgC m−3) (a) and percentage (b) of coal combustion, liquid fossil fuel, and non-fossil source emissions for carbonaceous aerosol samples in BJ, XA, and LF during different seasons.
In contrast, coal combustion contributed 42.9±19.4 % to LF samples, which was greater than the contribution of liquid fossil emissions (20.9±12.3 %) and significantly higher than those in BJ and XA. Especially in winter, coal contributed as much as 68.6±3.6 % (59.1±10.0 µgC m−3). According to the data released by the Shanxi Provincial Bureau of Statistics, coal consumption in Shanxi Province was as high as 349.06 million tons in 2019, which was 46.7 times the consumption of liquid fossil fuels, accounting for 70.3 % of the total fossil-fuel consumption (SPBS, 2020). The high contribution of coal combustion in winter might be related to the use of household coal for heating by rural residents in Shanxi. This is because household coal can emit a large amount of carbonaceous particles and is an important source of carbonaceous aerosols in rural areas in northern China (Chen et al., 2005; Shen et al., 2010; Streets et al., 2003a; Zhi et al., 2008).
3.5 Best estimate of source apportionment of OC and EC by 14C and Lev
The concentration of each carbon component in BJ, XA, and LF was calculated based on the combination of Lev and 14C. The best estimate of source apportionment is shown in Fig. 8. The contributions of OCother (43.6±12.9 %), OCff (25.5±11.7 %), and ECff (20.5±6.5 %) were relatively high in BJ. The OCbb (23.0±17.3 %) and OCff (39.7±9.7 %) were the highest contributors in XA. The LF samples showed different characteristics, and the contribution of fossil sources was significantly high, especially for the OCff (56.1±11.9 %).
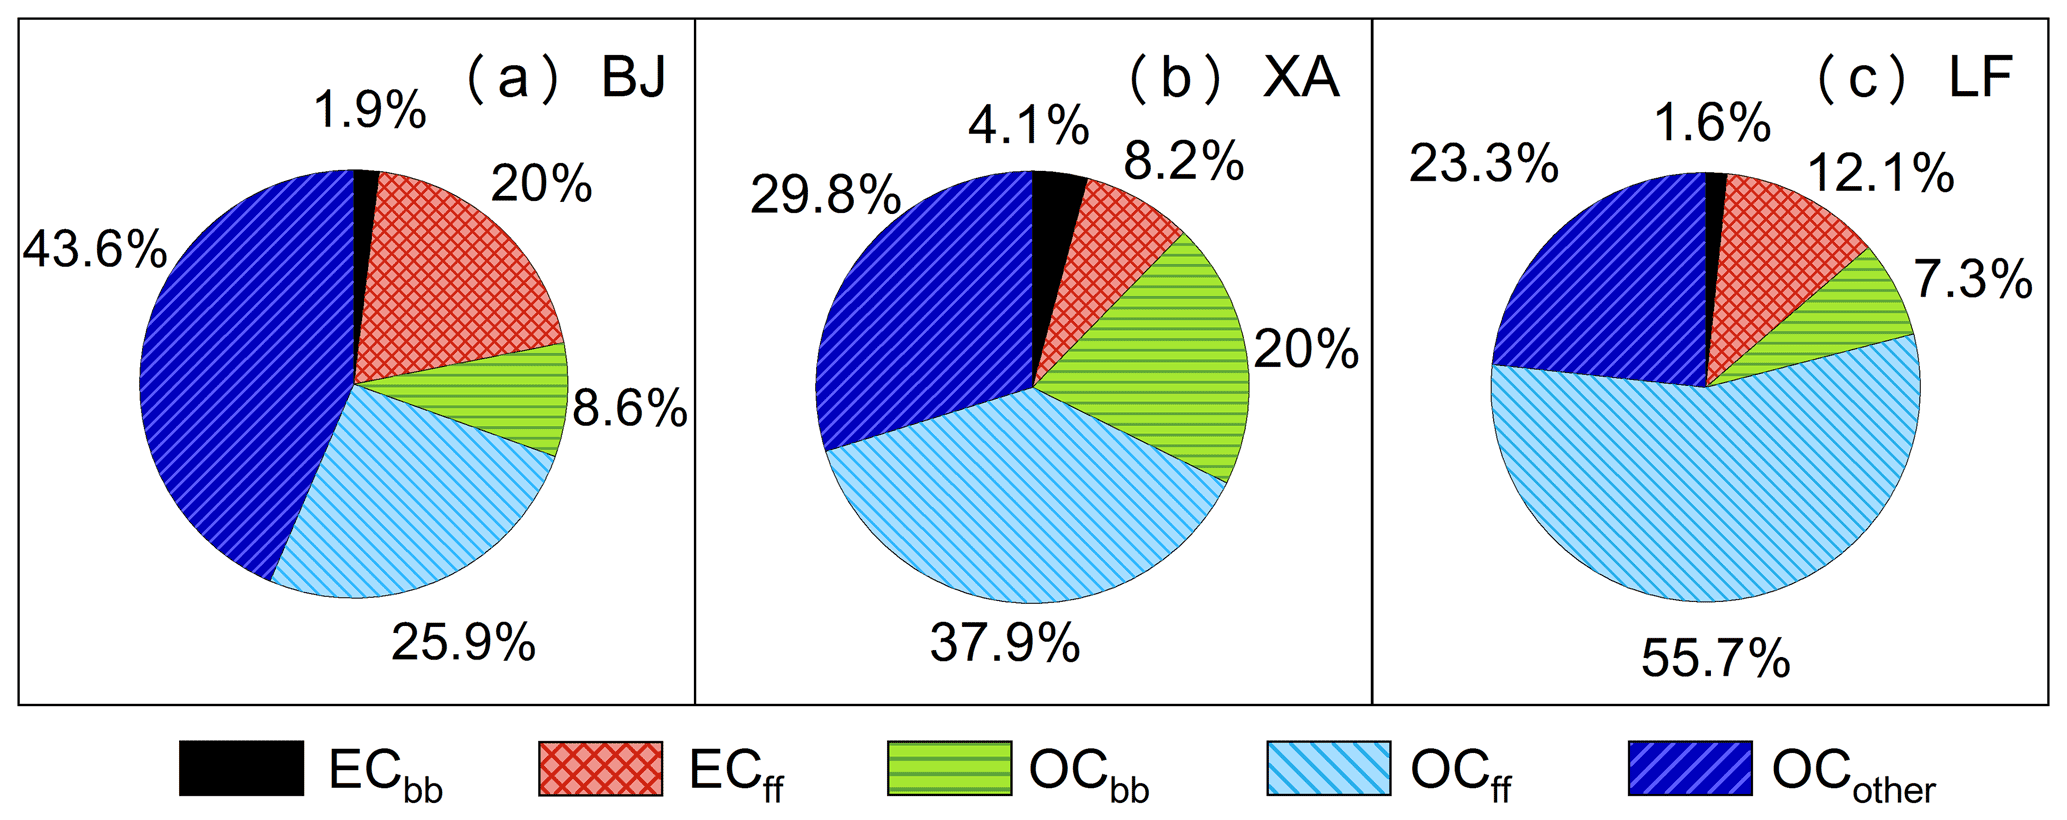
Figure 8Percentage of elemental carbon from biomass burning (ECbb) and fossil-fuel combustion (ECff) and percentage of organic carbon from biomass burning (OCbb), fossil-fuel combustion (OCff), and other sources (OCother) for the PM2.5 samples in BJ, XA, and LF.
3.5.1 Biomass burning contribution to TC
The concentrations (0.3±0.3 µgC m−3) and contributions (1.9±1.4 %) of ECbb in BJ were relatively low during the whole year (Fig. 9). The ECbb at the XA and LF sites had high concentrations in fall (0.7±0.5 and 0.6±0.1 µgC m−3) and winter (1.5±0.7 and 1.7±0.3 µgC m−3) and low concentrations in summer (0.2±0.1 and 0.1±0.0 µgC m−3), respectively.

Figure 9Mass concentrations (µgC m−3) (a) and percentage (b) of elemental carbon from biomass burning (ECbb) and fossil-fuel combustion (ECff), organic carbon from biomass burning (OCbb), fossil-fuel combustion (OCff), and other sources (OCother) for carbonaceous aerosol samples in BJ, XA, and LF during different seasons.
The OCbb concentrations in the BJ, XA, and LF samples showed an increase in fall (1.6±1.4, 3.3±2.2, and 2.9±0.4 µgC m−3) and winter (2.5±2.1, 6.9±3.3, and 7.9±1.3 µgC m−3), respectively. Especially in the XA samples, OCbb had high contributions in fall (28.6±15.8 %) and winter (32.8±12.3 %). The contribution of biomass combustion in XA (24.1±18.0 %) was significantly larger than that in BJ (10.8±7.9 %) and LF (8.8±8.9 %), which was also reflected in the concentration of Lev (Fig. S3). The Lev concentration in XA (0.36±0.38 µg m−3) was higher than that in BJ (0.15±0.17 µg m−3) and slightly higher than that in LF (0.32±0.34 µg m−3). Furthermore, the Lev concentration in XA during fall and winter was up to 5.3 times higher than that during the other seasons. Especially in winter, the proportion of Lev in the TC was 4.0±2.3 % in XA, which was 3.9 and 3.8 times those in BJ and LF, respectively.
Zhang et al. (2015) attributed this to emissions from neighboring rural regions because such areas use biofuels for heating and cooking more commonly in winter. China produces 939 million tons of agricultural biomass residues annually, which is the main energy source for some rural areas (Liao et al., 2004; Lu et al., 2009). In addition, the increase in urban vegetation coverage may also increase the photochemical reactions of biological volatile organic compounds (VOCs) (Gelencsér et al., 2007; NBS, 2021). Therefore, in recent years, non-fossil fuels have gradually become a major contributor to carbonaceous aerosols in BJ and XA with the reduction in the use of fossil energy.
3.5.2 Fossil contribution to TC
The ECff concentrations at BJ (spring: 2.7±1.4 µgC m−3; summer: 2.0±0.8 µgC m−3; fall: 2.3±2.0 µgC m−3; winter: 2.9±2.6 µgC m−3) and XA (spring: 1.1±0.8 µgC m−3; summer: 1.1±1.1 µgC m−3; fall: 1.6±2.3 µgC m−3; winter: 1.4±0.8 µgC m−3) did not fluctuate significantly during the year. The concentration of ECff in LF during spring, summer, and fall was relatively stable (1.0–1.2 µgC m−3), but it was high during winter (12.5±2.5 µgC m−3), reaching 10.2 times that in summer.
The concentration of OCff was slightly higher in XA during summer (6.2±2.2 µgC m−3) and winter (6.1±2.1 µgC m−3). The contribution of OCff in the BJ samples increased to 32.4±14.5 % during winter and decreased to 18.4±8.4 % during spring. The ratios in BJ and LF during winter were approximately 2.3±1.2 and 4.7±0.7, respectively, suggesting that the fossil source secondary carbonaceous aerosols were higher in winter. This can be explained by the lower temperature in the winter altering the gas–particle equilibrium, suggesting that a larger portion of the OCff during winter was secondary aerosol (Genberg et al., 2011). OCff in LF had high concentrations in winter (57.6±9.2 µgC m−3) and low concentrations in summer (5.2±1.2 µgC m−3). This indicated that the burning of fossil sources was an important source of OC in BJ (OCff: 32.4±14.5 %) and LF (OCff: 66.8±1.7 %) during winter. Fang et al. (2017) found that fossil fuels contributed significantly (>50 %) to carbon components in the haze in East Asia during January 2014, suggesting that the aerosol contribution was generally dominated by fossil combustion sources. Therefore, using cleaner energy and cleaner residential stoves to reduce and replace the high-emission end-use coal combustion processes and control the emissions from liquid-fossil-fueled vehicles in megacities should be beneficial to the air quality.
3.5.3 Other non-fossil contributions to OC
In addition to the OC directly emitted from fossil and biomass fuels, there are many components of OC, such as SOC, whose source is difficult to identify. Residential oil fume emissions from urban residents, emissions from biological sources, and secondary bio-organic aerosols generated by the secondary reaction of biomass fuels are also important components of OC (Gelencsér et al., 2007; Zhang et al., 2015).
The concentration of OCother in the LF samples did not vary greatly during spring (3.7±1.2 µgC m−3) and summer (3.2±0.5 µgC m−3), but it was lower in fall (2.6±0.3 µgC m−3) and higher in winter (6.5±2.8 µgC m−3). In BJ, the contribution of OCother was high during spring (49.9±9.9 %) and summer (45.8±9.8 %), and its concentration was relatively high during winter (6.1±5.6 µgC m−3). Zhang et al. (2015) mainly attributed the presence of OCother in northern China to SOC formation from non-fossil, non-biogenic precursors. In general, secondary bio-organic aerosols in spring and fall are mainly caused by biological emissions or long-distance transportation of biological VOCs and secondary organic aerosols (SOAs) in particulates (Gelencsér et al., 2007; Jimenez et al., 2009). The high concentration in winter may be because low temperatures drive condensable semi-volatile organic compounds (SVOCs) into the particulate phase (Simpson et al., 2007; Tanarit et al., 2008).
The OCother contribution and concentration in XA were high in summer (35.2±10.0 %) and winter (5.4±4.2 µgC m−3), respectively. We assume that this excess is mainly attributed to SOC formation from non-fossil and primary biogenic particles. Some SOAs are formed by VOCs that are produced by burning wood or biofuels (e.g., ethanol), and they increase the load of these sources on organic aerosols (Genberg et al., 2011). Huang et al. (2014) found that severe haze pollution was largely driven by secondary aerosol formation, and non-fossil SOAs dominated, accounting for 66±8 % of the SOAs in XA despite extensive urban emissions. Ni et al. (2020) also considered that non-fossil sources largely contributed (56 %) to SOC in XA. Thus, the control of biomass burning activities could be an efficient strategy for reducing aerosols, especially in XA. Furthermore, SOC formation from these non-fossil VOCs may be enhanced when they are mixed with other pollutants, such as VOCs and NOx (Hoyle et al., 2011; Weber et al., 2007). Motor vehicles are one of the main anthropogenic sources of VOCs and NOx (Barletta et al., 2005; Liu et al., 2008). In Sect. 3.4, we found that the carbonaceous concentrations from motor vehicle emissions were high in XA during winter and summer (Fig. 7a), and the increase in motor vehicle activities might partly explain the high concentration of OCother during the two seasons.
3.6 Uncertainty analysis
The results of the uncertainty analysis of the given set (Table 1) of the parameters in the three cities are shown in Fig. 10. Each curve represents the probability distribution of the sources of carbon components that contribute to the TC, from which the uncertainty of the source allocation can be derived. Some results were uncertain because the input parameters of the LHS calculation varied greatly. The contributions of OCff and OCother to the TC were mostly uncertain. This is mainly related to the uncertainty of the two parameters, and . Both these parameters depend on the burning conditions and type of biomass, as mentioned in Sect. 2.9. More reliable data would be obtained if could be performed on the pure OC fractions of the samples, which has been proven to be feasible (Huang et al., 2014; Szidat et al., 2004, 2006; Zhang et al., 2015). Other contributions have single peaks, which prove that the results of the source analysis are reliable. These results demonstrate that we can identify the main contributors.
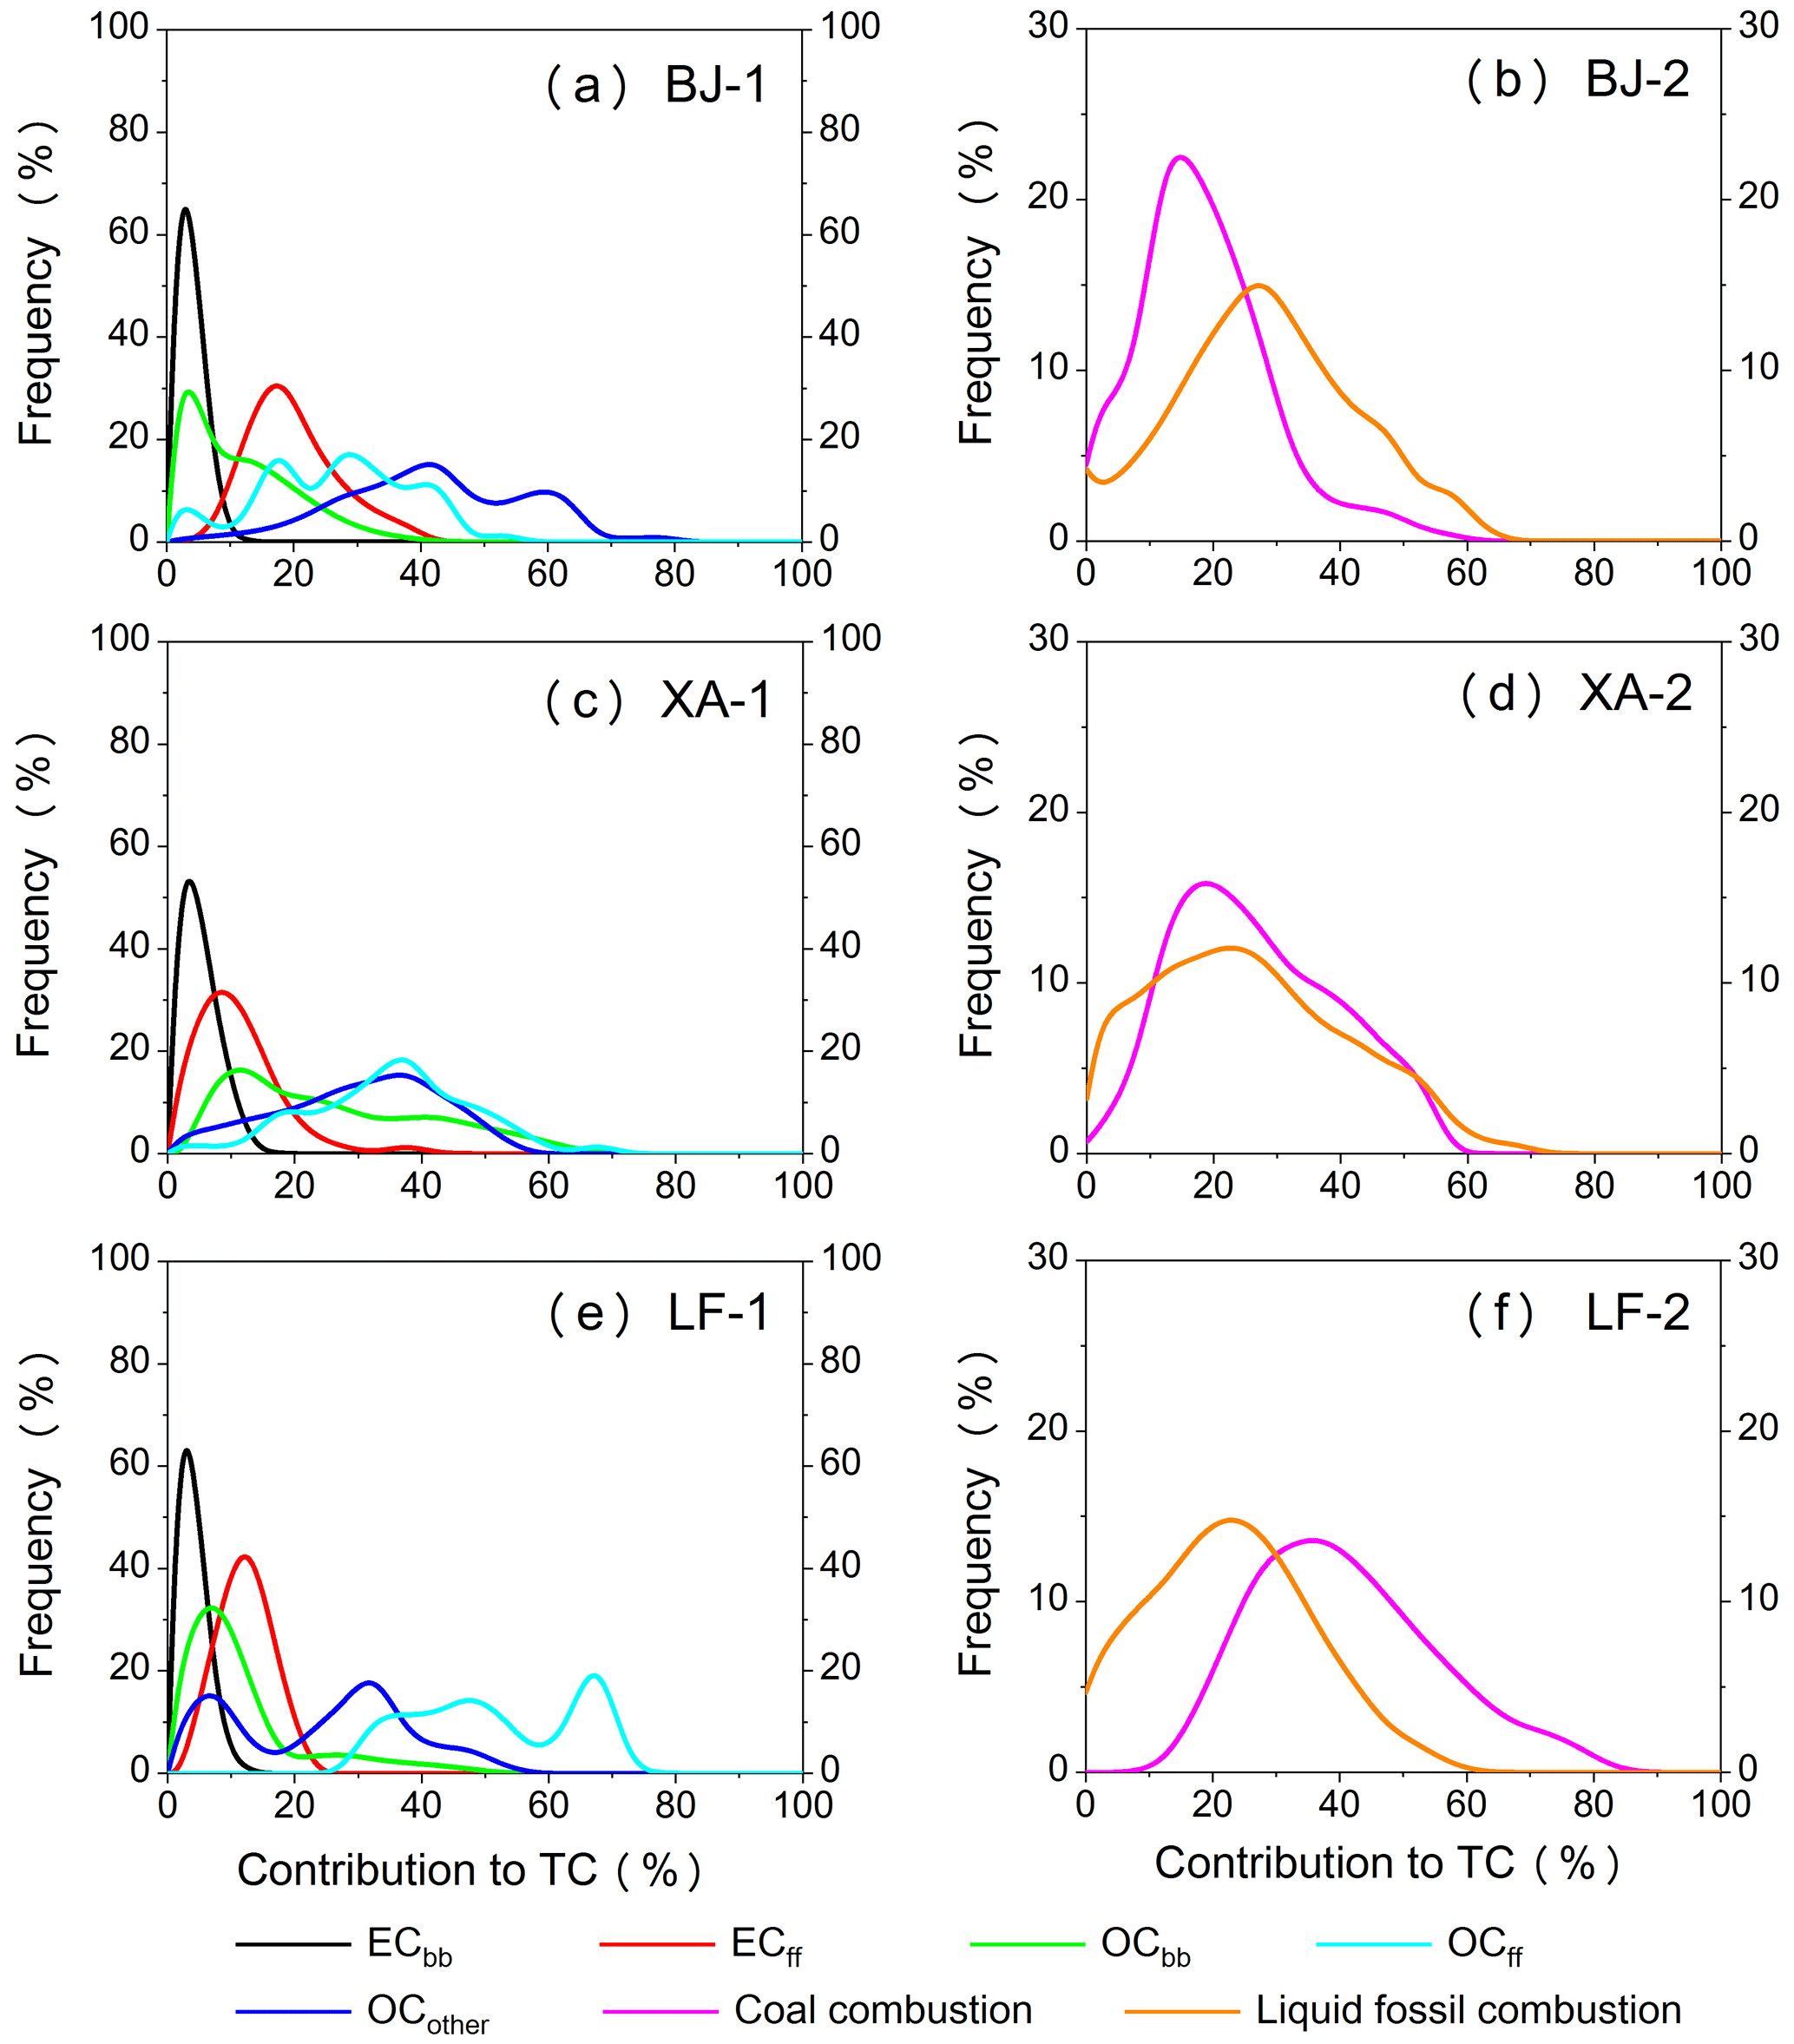
Figure 10Latin hypercube sampling of frequency distributions of the source contributions to the total carbon (TC) from fossil, OC, and EC source categories (Table 1) for the samples collected in BJ, XA, and LF.
PM2.5 samples were collected from BJ, XA, and LF in northern China from January 2018 to April 2019. The main objective of this study was to quantify the sources of carbonaceous aerosols by measuring the EC, OC, Lev, 13C, and 14C combined with LHS.
The TC accounted for approximately 17.5±6 %, 21.5±21 %, and 17.8±7.2 % of PM2.5 in the samples from BJ, XA, and LF, and the corresponding concentrations were 12.5±11.8, 14.6±7.5, and 35.7±36.5 µgC m−3, respectively. The concentrations at the three sites showed high values in winter and low values in summer. Based on back-trajectory analysis, we found that carbonaceous aerosols in BJ were more susceptible to transportation from the southern regions. Local emissions and the diffusion environment significantly impacted carbonaceous aerosols in XA and LF.
The best estimate of source apportionment of the fossil components in the TC showed that the contribution of liquid-fossil-fuel combustion was 29.3±12.7 % and 24.9±18.0 % in BJ and XA, respectively, which was greater than the contribution of coal combustion (15.5±8.8 %; 20.9±14.5 %). In contrast, coal combustion contributed 42.9±19.4 % in LF, which was greater than the contribution of liquid-fossil-fuel combustion (20.9±12.3 %).
The best estimate of source apportionment of OC and EC indicated that the contributions of ECff (20.0±6.5 %), OCff (25.9±11.6 %), and OCother (43.6±12.9 %) were relatively high in BJ. The OCff contribution was higher in winter (32.4±14.5 %), and its concentration was 3.3 times higher than that in other seasons. The contribution of OCbb (20.0±15.3 %) and OCff (37.9±10.8 %) was higher in XA. The contribution of biomass burning to the TC was as high as 39.6±14.5 % in winter. The contribution of OCff in LF was significantly high (55.7±12.2 %), especially in winter (66.8±1.7 %).
The decline (6 %–16 %) in the contribution of fossil sources since the implementation of the Action Plan indicates the effectiveness of air quality management. In the future, the government needs to further regulate and control emissions from motor vehicles in megacities such as BJ and XA. The cleaner use of coal must be further strengthened in coal-based cities such as LF in the eastern part of the Fenwei Plain. This study indicates that attention should be paid to the control of biomass burning in northern China, especially in the Guanzhong region.
The raw data of carbon components concentration and dual-carbon isotope values after correction in this paper are available at the East Asian Paleoenvironmental Science Database, National Earth System Science Data Center, National Science and Technology Infrastructure of China (http://paleodata.ieecas.cn/FrmDataInfo_EN.aspx?id=5f8b678f-716c-4cc7-81aa-0528c42e698c, last access: 20 April 2022; Zhao et al., 2022).
The supplement related to this article is available online at: https://doi.org/10.5194/acp-22-6255-2022-supplement.
HZ performed the data analysis and wrote the initial draft of the manuscript. ZN and WZ conceived the project and reviewed the paper. ZN and SW provided the samples. HZ, XF, SW, XL, and HD conducted the measurements. All the authors made substantial contributions to this work.
The contact author has declared that neither they nor their co-authors have any competing interests.
Publisher's note: Copernicus Publications remains neutral with regard to jurisdictional claims in published maps and institutional affiliations.
The authors were helped by anonymous reviewers to improve this article.
This research has been supported by the Strategic Priority Research Program of the Chinese Academy of Sciences (CAS, grant no. XDA23010302), the National Research Program for Key Issues in Air Pollution Control (grant no. DQGG0105-02), the National Natural Science Foundation of China (grant nos. 41730108, 42173082, and 41773141), the Natural Science Foundation of Shaanxi Province (grant no. 2014JQ2-4018), Key Projects of the CAS (grant no. ZDRW-ZS-2017-6), and the Natural Science Basic Research Program of Shaanxi Province (grant no. 2019JCW-20).
This paper was edited by Eliza Harris and reviewed by two anonymous referees.
Aggarwal, S. G. and Kawamura, K.: Molecular distributions and stable carbon isotopic compositions of dicarboxylic acids and related compounds in aerosols from Sapporo, Japan: Implications for photochemical aging during long-range atmospheric transport, J. Geophys. Res, 113, D14301, https://doi.org/10.1029/2007JD009365, 2008.
Agnihotri, R., Mandal, T. K., Karapurkar, S. G., Naja, M., Gadi, R., Ahammmed, Y. N., Kumar, A., Saud, T., and Saxena, M.: Stable carbon and nitrogen isotopic composition of bulk aerosols over India and northern Indian Ocean, Atmos. Environ., 45, 2828–2835, https://doi.org/10.1016/j.atmosenv.2011.03.003, 2011.
Andersson, A., Deng, J. J., Du, K., Zheng, M., Yan, C. Q., Sköld, M., and Gustafsson, Ö: Regionally-varying combustion sources of the January 2013 severe haze events over eastern China, Environ. Sci. Technol., 49, 2038–2043, https://doi.org/10.1021/es503855e, 2015.
Bachar, A., Markus-Shi, J., Regev, L., Boaretto, E., and Klein, T.: Tree rings reveal the adverse effect of water pumping on protected riparian Platanus orientalis tree growth, Forest Ecol. Manag., 458, 117784, https://doi.org/10.1016/j.foreco.2019.117784, 2020.
Barletta, B., Meinardi, S., Rowland, F. S., Chan, C., Wang, X. M., Zou, S. C., Chan, L., and Blake, D. R.: Volatile organic compounds in 43 Chinese cities, Atmos. Environ., 39, 5979–5990, https://doi.org/10.1016/j.atmosenv.2005.06.029, 2005.
BJMBS (Beijing Municipal Bureau Statistics): Beijing Statistical Yearbook-2020, China Statistics press, http://nj.tjj.beijing.gov.cn/nj/main/2020-tjnj/zk/indexch.htm (last access: 20 April 2022), 2020 (in Chinese).
Cachier, H., Buat Menard, P., Fontugne, M., and Rancher, J.: Source terms and source strengths of the carbonaceous aerosol in the tropics, J. Atmos. Chem., 3, 469–489, https://doi.org/10.1007/BF00053872, 1985.
Cachier, H., Buat Menard, P., Fontugne, M., and Chesselet, R.: Long-range transport of continentally-derived particulate carbon in the marine atmosphere: Evidence from stable carbon isotope studies, Tellus B, 38, 161–177, https://doi.org/10.3402/tellusb.v38i3-4.15125, 1986.
Cao, J. J., Lee, S. C., Ho, K. F., Zhang, X. Y., Zou, S. C., Fung, K., Chow, J. C., and Watson, J. G.: Characteristics of carbonaceous aerosol in Pearl River Delta Region, China during 2001 winter period, Atmos. Environ., 37, 1451–1460, https://doi.org/10.1016/S1352-2310(02)01002-6, 2003.
Cao, J. J., Lee, S. C., Chow, J. C., Watson, J. G., Ho, K. F., Zhang, R. J., Jin, Z. D., Shen, Z. X., Chen, G. C., and Kang, Y. M.: Spatial and seasonal distributions of carbonaceous aerosols over China, J. Geophys. Res., 112, D22S11, https://doi.org/10.1029/2006JD008205, 2007.
Cao, J. J., Zhu, C. S., Chow, J. C., Watson, J. G., Han, Y. M., Wang, G. H., Shen, Z. X., and An, Z. S.: Black carbon relationships with emissions and meteorology in Xi'an, China, Atmos. Res., 94, 194–202, https://doi.org/10.1016/j.atmosres.2009.05.009, 2009.
Cao, J. J., Chow, J. C., Tao, J., Lee, S. C., Watson, J. G., Ho, K., Wang, G. H., Zhu, C. S., and Han, Y. M.: Stable carbon isotopes in aerosols from Chinese cities: Influence of fossil fuels, Atmos. Environ., 45, 1359–1363 https://doi.org/10.1016/j.atmosenv.2010.10.056, 2011.
Cao, J. J., Shen, Z. X., Chow, J. C., Watson, J. G., Lee, S. C., Tie, X. X., Ho, K. F., Wang, G. H., and Han, Y. M.: Winter and summer PM2.5 chemical compositions in fourteen Chinese Cities, J. Air Waste Manage., 62, 1214–1226, https://doi.org/10.1080/10962247.2012.701193, 2012.
Castro, L. M., Pio, C. A., Harrison, R. M., and Smith, D.: Carbonaceous aerosol in urban and rural European atmospheres: estimation of secondary organic carbon concentrations, Atmos. Environ., 33, 2771–2781, https://doi.org/10.1016/S1352-2310(98)00331-8, 1999.
Ceburnis, D., Garbaras, A., Szidat, S., Rinaldi, M., Fahrni, S., Perron, N., Wacker, L., Leinert, S., Remeikis, V., Facchini, M. C., Prevot, A. S. H., Jennings, S. G., Ramonet, M., and O'Dowd, C. D.: Quantification of the carbonaceous matter origin in submicron marine aerosol by 13C and 14C isotope analysis, Atmos. Chem. Phys., 11, 8593–8606, https://doi.org/10.5194/acp-11-8593-2011, 2011.
Chen, Y. J., Sheng, G. Y., Bi, X. H., Feng, Y. L., Mai, B. X., and Fu, J. M.: Emission Factors for Carbonaceous Particles and Polycyclic Aromatic Hydrocarbons from Residential Coal Combustion in China, Environ. Sci. Technol., 39, 1861–1867, https://doi.org/10.1021/es0493650, 2005.
Chesselet, R., Fontugne, M., Buat Menard, P., Ezat, U., and Lambert, C. E.: The origin of particulate organic carbon in the marine atmosphere as indicated by its stable carbon isotopic composition, Geophys. Res. Lett., 8, 345–348, https://doi.org/10.1029/GL008i004p00345, 1981.
Chow, J. C. and Watson, J. G.: PM2.5 carbonate concentrations at regionally representative Interagency Monitoring of Protected Visual Environment sites, J. Geophys. Res., 107, 8344, https://doi.org/10.1029/2001JD000574, 2002.
Chow, J. C., Watson, J. G., Chen, L. W. A., Arnott, W. P., Moosmüller, H., and Fung, K.: Equivalence of Elemental Carbon by Thermal/Optical Reflectance and Transmittance with Different Temperature Protocols, Environ. Sci. Technol., 38, 4414–4422, https://doi.org/10.1021/es034936u, 2004.
Claeys, M., Kourtchev, I., Pashynska, V., Vas, G., Vermeylen, R., Wang, W., Cafmeyer, J., Chi, X., Artaxo, P., Andreae, M. O., and Maenhaut, W.: Polar organic marker compounds in atmospheric aerosols during the LBA-SMOCC 2002 biomass burning experiment in Rondônia, Brazil: sources and source processes, time series, diel variations and size distributions, Atmos. Chem. Phys., 10, 9319–9331, https://doi.org/10.5194/acp-10-9319-2010, 2010.
Clarke, A. G. and Karani, G. N.: Characterisation of the carbonate content of atmospheric aerosols, J. Atmos. Chem., 14, 119–128, https://doi.org/10.1007/BF00115228, 1992.
Clayton, G. D., Arnold, J. R., and Patty, F. A.: Determination of Sources of Particulate Atmospheric Carbon, Science, 122, 751–753, https://doi.org/10.1126/science.122.3173.751, 1955.
Coplen, T. B.: New guidelines for reporting stable hydrogen, carbon, and oxygen isotope-ratio data, Geochim. Cosmochim. Ac., 60, 3359–3360, https://doi.org/10.1016/0016-7037(96)00263-3, 1996.
CSC (Chinese State Council): Action Plan for Air Pollution Prevention and Control, http://www.gov.cn/zhengce/content/2013-09/13/content_4561.htm (last access: 20 April 2022), 2013 (in Chinese).
CSC (Chinese State Council): Three-year action plan to fight air pollution (NO. 2018. 22), http://www.gov.cn/zhengce/content/2018-07/03/content_5303158.htm (last access: 20 April 2022), 2018 (in Chinese).
Currie, L. A.: Evolution and Multidisciplinary Frontiers of 14C Aerosol Science, Radiocarbon, 42, 115–126, https://doi.org/10.1017/S003382220005308X, 2000.
Draxler, R. R. and Hess, G. D.: An overview of the HYSPLIT_4 modelling system for trajectories, dispersion and deposition, Aust. Meteorol. Mag., 47, 295–308, 1998.
England, G., Chang, O., and Wien, S.: Development of fine particulate emission factors and speciation profiles for oil and gas-fired combustion systems, United States, https://doi.org/10.2172/822131, 2002.
Engling, G., Carrico, C. M., Kreidenweis, S. M., CollettJr., J. L., Day, D. E., Malm, W. C., Lincoln, E., Hao, W. M., Iinuma, Y., and Herrmann, H.: Determination of levoglucosan in biomass combustion aerosol by high-performance anion-exchange chromatography with pulsed amperometric detection, Atmos. Environ., 40, 299–311, https://doi.org/10.1016/j.atmosenv.2005.12.069, 2006.
Engling, G., Lee, J. J., Tsai, Y. W., Lung, S. H., C., C., Chou, C. K., and Chan, C.: Size-Resolved Anhydrosugar Composition in Smoke Aerosol from Controlled Field Burning of Rice Straw, Aerosol Sci. Tech., 43, 662–672, https://doi.org/10.1080/02786820902825113, 2009.
Fang, W., Andersson, A., Zheng, M., Lee, M., Holmstrand, H., Kim, S. W., Du, K., and Örjan, G.: Divergent Evolution of Carbonaceous Aerosols during Dispersal of East Asian Haze, Sci. Rep., 7, 10422, https://doi.org/10.1038/s41598-017-10766-4, 2017.
Feng, Y. L., Chen, Y. J., Guo, H., Zhi, G. R., Xiong, S. C., Li, J., Sheng, G. Y., and Fu, J. M.: Characteristics of organic and elemental carbon in PM2.5 samples in Shanghai, China, Atmos. Res., 92, 434–442, https://doi.org/10.1016/j.atmosres.2009.01.003, 2009.
Fu, P. Q., Kawamura, K., Chen, J., Li, J., Sun, Y. L., Liu, Y., Tachibana, E., Aggarwal, S. G., Okuzawa, K., Tanimoto, H., Kanaya, Y., and Wang, Z. F.: Diurnal variations of organic molecular tracers and stable carbon isotopic composition in atmospheric aerosols over Mt. Tai in the North China Plain: an influence of biomass burning, Atmos. Chem. Phys., 12, 8359–8375, https://doi.org/10.5194/acp-12-8359-2012, 2012.
Gao, J. J., Wang, K., Wang, Y., Liu, S. H., Zhu, C. Y., Hao, J. M., Liu, H. J., Hua, S. B., and Tian, H. Z.: Temporal-spatial characteristics and source apportionment of PM2.5 as well as its associated chemical species in the Beijing-Tianjin-Hebei region of China, Environ. Pollut., 233, 714–724, https://doi.org/10.1016/j.envpol.2017.10.123, 2018.
Gelencsér, A., May, B., Simpson, D., Sánchez-Ochoa, A., Kasper-Giebl, A., Puxbaum, H., Caseiro, A., Pio, C., and Legrand, M.: Source apportionment of PM2.5 organic aerosol over Europe: Primary/secondary, natural/anthropogenic, and fossil/biogenic origin, J. Geophys. Res., 112, D23S04, https://doi.org/10.1029/2006JD008094, 2007.
Genberg, J., Hyder, M., Stenström, K., Bergström, R., Simpson, D., Fors, E. O., Jönsson, J. Å., and Swietlicki, E.: Source apportionment of carbonaceous aerosol in southern Sweden, Atmos. Chem. Phys., 11, 11387–11400, https://doi.org/10.5194/acp-11-11387-2011, 2011.
Guo, J. D., Ge, Y. S., Hao, L. J., Tan, J. W., Li, J. Q., and Feng, X. Y.: On-road measurement of regulated pollutants from diesel and CNG buses with urea selective catalytic reduction systems, Atmos. Environ., 99, 1–9, https://doi.org/10.1016/j.atmosenv.2014.07.032, 2014.
Hammer, S. and Levin, I.: Monthly mean atmospheric D14CO2 at Jungfraujoch and Schauinsland from 1986 to 2016, heiDATA [data set], V2, https://doi.org/10.11588/data/10100, 2017.
Han, R., Wang, S. X., Shen, W. H., Wang, J. D., Wu, K., Ren, Z. H., and Feng, M. N.: Spatial and temporal variation of haze in China from 1961 to 2012, J. Environ. Sci., 46, 1001–0742, https://doi.org/10.1016/j.jes.2015.12.033, 2016.
Han, Y. M., Chen, L. W., Huang, R. J., Chow, J. C., Watson, J. G., Ni, H. Y., Liu, S. X., Fung, K. K., Shen, Z. X., Wei, C., Wang, Q. Y., Tian, J., Zhao, Z. Z., Prévôt, A. S. H., and Cao, J. J.: Carbonaceous aerosols in megacity Xi'an, China: Implications of thermal/optical protocols comparison, Atmos. Environ., 132, 58–68, https://doi.org/10.1016/j.atmosenv.2016.02.023, 2016.
Heal, M. R.: The application of carbon-14 analyses to the source apportionment of atmospheric carbonaceous particulate matter: a review, Anal. Bioanal. Chem., 406, 81–98, https://doi.org/10.1007/s00216-013-7404-1, 2014.
Ho, K. F., Lee, S. C., Cao, J. J., Li, Y. S., Chow, J. C., Watson, J. G., and Fung, K.: Variability of organic and elemental carbon, water soluble organic carbon, and isotopes in Hong Kong, Atmos. Chem. Phys., 6, 4569–4576, https://doi.org/10.5194/acp-6-4569-2006, 2006.
Hoffmann, D., Tilgner, A., Iinuma, Y., and Herrmann, H.: Atmospheric stability of levoglucosan: a detailed laboratory and modeling study, Environ. Sci. Technol., 44, 694–699, https://doi.org/10.1021/es902476f, 2010.
Hoyle, C. R., Boy, M., Donahue, N. M., Fry, J. L., Glasius, M., Guenther, A., Hallar, A. G., Huff Hartz, K., Petters, M. D., Petäjä, T., Rosenoern, T., and Sullivan, A. P.: A review of the anthropogenic influence on biogenic secondary organic aerosol, Atmos. Chem. Phys., 11, 321–343, https://doi.org/10.5194/acp-11-321-2011, 2011.
Hua, Q. and Barbetti, M.: Review of Tropospheric Bomb 14C Data for Carbon Cycle Modeling and Age Calibration Purposes, Radiocarbon, 46, 1273–1298, https://doi.org/10.1017/S0033822200033142, 2004.
Huang, J., Kang, S. C., Shen, C. D., Cong, Z. Y., Liu, K. X., Wang, W., and Liu, L. C.: Seasonal variations and sources of ambient fossil and biogenic-derived carbonaceous aerosols based on 14C measurements in Lhasa, Tibet, Atmos. Res., 96, 553–559, https://doi.org/10.1016/j.atmosres.2010.01.003, 2010.
Huang, L., Brook, J. R., Zhang, W., Li, S. M., Graham, L., Ernst, D., Chivulescu, A., and Lu, G.: Stable isotope measurements of carbon fractions () in airborne particulate: A new dimension for source characterization and apportionment, Atmos. Environ., 40, 2690–2705, https://doi.org/10.1016/j.atmosenv.2005.11.062, 2006.
Huang, R. J., Zhang, Y. L., Bozzetti, C., Ho, K. F., Cao, J. J., Han, Y. M., Dällenbach, K. R., Slowik, J. G., Platt, S. M., Canonaco, F., Zotter, P., Wolf, R., Pieber, S. M., Bruns, E. A., Crippa, M., Ciarelli, G., Piazzalunga, A., Schwikowski, M., Abbaszade, G., Schnelle-Kreis, J., Zimmermann, R., An, Z., Szidat, S., Baltensperger, U., Haddad, I. E., and Prévôt, A.: High secondary aerosol contribution to particulate pollution during haze events in China, Nature, 514, 218–222, https://doi.org/10.1038/nature13774, 2014.
Jacobson, M. C., Hansson, H.-C., Noone, K. J., and Charlson, R. J.: Organic atmospheric aerosols: Review and state of the science, Rev. Geophys., 38, 267–294, https://doi.org/10.1029/1998RG000045, 2000.
Jacobson, M. Z.: Strong radiative heating due to the mixing state of black carbon in atmospheric aerosols, Nature, 409, 695–697, https://doi.org/10.1038/35055518, 2001.
Ji, D. S., Yan, Y. C., Wang, Z. S., He, J., Liu, B. X., Sun, Y., Gao, M., Li, Y., Cao, W., Cui, Y., Hu, B., Xin, J. Y., Wang, L. L., Liu, Z. R., Tang, G. Q., and Wang, Y. S.: Two-year continuous measurements of carbonaceous aerosols in urban Beijing, China: Temporal variations, characteristics and source analyses, Chemosphere, 200, 191–200, https://doi.org/10.1016/j.chemosphere.2018.02.067, 2018.
Jimenez, J. L., Canagaratna, M. R., Donahue, N. M., Prevot, A. S. H., Zhang, Q., Kroll, J. H., DeCarlo, P. F., Allan, J. D., Coe, H., Ng, N. L., Aiken, A. C., Docherty, K. S., Ulbrich, I. M., Grieshop, A. P., Robinson, A. L., Duplissy, J., Smith, J. D., Wilson, K. R., Lanz, V. A., Hueglin, C., Sun, Y. L., Tian, J., Laaksonen, A., Raatikainen, T., Rautiainen, J., Vaattovaara, P., Ehn, M., Kulmala, M., Tomlinson, J. M., Collins, D. R., Cubison, M. J., Dunlea, J., Huffman, J. A., Onasch, T. B., Alfarra, M. R., Williams, P. I., Bower, K., Kondo, Y., Schneider, J., Drewnick, F., Borrmann, S., Weimer, S., Demerjian, K., Salcedo, D., Cottrell, L., Griffin, R., Takami, A., Miyoshi, T., Hatakeyama, S., Shimono, A., Sun, J. Y., Zhang, Y. M., Dzepina, K., Kimmel, J. R., Sueper, D., Jayne, J. T., Herndon, S. C., Trimborn, A. M., Williams, L. R., Wood, E. C., Middlebrook, A. M., Kolb, C. E., Baltensperger, U., and Worsnop, D. R.: Evolution of Organic Aerosols in the Atmosphere, Science, 326, 1525–1529, https://doi.org/10.1126/science.1180353, 2009.
Jull, A. J. T.: Radiocarbon dating/AMS method, Encyclopedia of Quaternary Science, 2911–2918, https://doi.org/10.1016/B0-44-452747-8/00041-7, 2007.
Kawashima, H. and Haneishi, Y.: Effects of combustion emissions from the Eurasian continent in winter on seasonal δ13C of elemental carbon in aerosols in Japan, Atmos. Environ., 46, 568–579, https://doi.org/10.1016/j.atmosenv.2011.05.015, 2012.
Kiehl, J. T.: Twentieth century climate model response and climate sensitivity, Geophys. Res. Lett., 34, 22710, https://doi.org/10.1029/2007GL031383, 2007.
Kirillova, E. N., Andersson, A., Sheesley, R. J., Kruså, M., Praveen, P. S., Budhavant, K., Safai, P. D., Rao, P., and Gustafsson, Ö.: 13C- and 14C-based study of sources and atmospheric processing of water-soluble organic carbon (WSOC) in South Asian aerosols, J. Geophys. Res.-Atmos., 118, 614–626, https://doi.org/10.1002/jgrd.50130, 2013.
Kumagai, K., Iijima, A., Shimoda, M., Saitoh, Y., Kozawa, K., Hagino, H., and Sakamoto, K.: Determination of Dicarboxylic Acids and Levoglucosan in Fine Particles in the Kanto Plain, Japan, for Source Apportionment of Organic Aerosols, Aerosol Air Qual. Res., 10, 282–291, https://doi.org/10.4209/aaqr.2009.11.0075, 2010.
Levin, I., Kromer, B., Schmidt, M., and Sartorius, H.: A novel approach for independent budgeting of fossil fuel CO2 over Europe by 14CO2 observations, Geophys. Res. Lett., 30, 2194, https://doi.org/10.1029/2003GL018477, 2003.
Levin, I., Naegler, T., Kromer, B., Diehl, M., Francey, R., Gomez Pelaez, A., Steele, P., Wagenbach, D., Weller, R., and Worthy, D.: Observations and modelling of the global distribution and long-term trend of atmospheric 14CO2, Tellus B, 62, 26–46, https://doi.org/10.1111/j.1600-0889.2009.00446.x, 2010.
Lewis, C. W., Klouda, G. A., and Ellenson, W. D.: Radiocarbon measurement of the biogenic contribution to summertime PM-2.5 ambient aerosol in Nashville, TN, Atmos. Environ., 38, 6053–6061, https://doi.org/10.1016/j.atmosenv.2004.06.011, 2004.
Li, C. L., Bosch, C., Kang, S. C., Andersson, A., Chen, P. F., Zhang, Q. G., Cong, Z. Y., Chen, B., Qin, D. H., and Gustafsson, Ö.: Sources of black carbon to the Himalayan–Tibetan Plateau glaciers, Nat. Commun., 7, 12574, https://doi.org/10.1038/ncomms12574, 2016.
Li, H. M., Yang, Y., Wang, H. L., Li, B. J., Wang, P. Y., Li, J. D., and Liao, H.: Constructing a spatiotemporally coherent long-term PM2.5 concentration dataset over China during 1980–2019 using a machine learning approach, Sci. Total Environ., 765, 144256, https://doi.org/10.1016/j.scitotenv.2020.144263, 2021.
Li, X. R., Wang, Y. S., Guo, X. Q., and Wang, Y. F.: Seasonal variation and source apportionment of organic and inorganic compounds in PM2.5 and PM10 particulates in Beijing, China, J. Environ. Sci., 25, 741–750, https://doi.org/10.1016/S1001-0742(12)60121-1, 2013.
Li, Y. M., Fu, T.-M., Yu, J. Z., Feng, X., Zhang, L. J., Chen, J., Boreddy, S. K. R., Kawamura, K., Fu, P., Yang, X., Zhu, L., and Zeng, Z. Z.: Impacts of chemical degradation on the global budget of atmospheric levoglucosan and its use as a biomass burning tracer, Environ. Sci. Technol., 55, 5525–5536, https://doi.org/10.1021/acs.est.0c07313, 2021.
Liao, C. P., Wu, C. Z., Yan, Y. J., and Huang, H. T.: Chemical elemental characteristics of biomass fuels in China, Biomass Bioenerg., 27, 119–130, https://doi.org/10.1016/j.biombioe.2004.01.002, 2004.
Lim, S., Yang, X., Lee, M., Li, G., Jeon, K., Lim, S. H., YangYang, X., Lee, M. H., Li, G., Gao, Y. G., Shang, X. N., Zhang, K., I.Czimczik, C., Xu, X. M., Min-SukBae, Moon, K.-J., and Jeon, K.: Fossil-driven secondary inorganic PM2.5 enhancement in the North China Plain: Evidence from carbon and nitrogen isotopes, Environ. Pollut., 266, 115163, https://doi.org/10.1016/j.envpol.2020.115163, 2020.
Liu, D., Li, J., Zhang, Y. L., Xu, Y., Liu, X., Ping, D., Shen, C. D., Chen, Y. J., Tian, C., and Zhang, G.: The Use of Levoglucosan and Radiocarbon for Source Apportionment of PM2.5 Carbonaceous Aerosols at a Background Site in East China, Environ. Sci. Technol., 47, 10454–10461, https://doi.org/10.1021/es401250k, 2013.
Liu, J., Mo, Y., Li, J., Liu, D., Shen, C., Ding, P., Jiang, H., Cheng, Z., Zhang, X., and Tian, C.: Radiocarbon-derived source apportionment of fine carbonaceous aerosols before, during, and after the 2014 Asia-Pacific Economic Cooperation (APEC) summit in Beijing, China, J. Geophys. Res.-Atmos., 121, 4177–4187, https://doi.org/10.1002/2016JD024865, 2016a.
Liu, J., Li, J., Liu, D., Ding, P., Shen, C., Mo, Y., Wang, X., Luo, C., Cheng, Z., Szidat, S., Zhang, Y., Chen, Y., and Zhang, G.: Source apportionment and dynamic changes of carbonaceous aerosols during the haze bloom-decay process in China based on radiocarbon and organic molecular tracers, Atmos. Chem. Phys., 16, 2985–2996, https://doi.org/10.5194/acp-16-2985-2016, 2016b.
Liu, Y., Shao, M., Fu, L. L., Lu, S. H., Zeng, L. M., and Tang, D. G.: Source profiles of volatile organic compounds (VOCs) measured in China: Part I, Atmos. Environ., 42, 6247–6260, https://doi.org/10.1016/j.atmosenv.2008.01.070, 2008.
Liu, Z. R., Hu, B., Liu, Q., Sun, Y., and Wang, Y. S.: Source apportionment of urban fine particle number concentration during summertime in Beijing, Atmos. Environ., 96, 359–369, https://doi.org/10.1016/j.atmosenv.2014.06.055, 2014.
Locker, H. B.: The use of levoglucosan to assess the environmental impact of residential wood-burning on air quality, PhD thesis, Dartmouth College, Hanover, NH, US, 1988.
López-Veneroni, D.: The stable carbon isotope composition of PM2.5 and PM10 in Mexico City Metropolitan Area air, Atmos. Environ., 43, 4491–4502, https://doi.org/10.1016/j.atmosenv.2009.06.036, 2009.
Lu, L., Tang, Y., Xie, J. S., and Yuan, Y. L.: The role of marginal agricultural land-based mulberry planting in biomass energy production, Renew. Energ., 34, 1789–1794, https://doi.org/10.1016/j.renene.2008.12.017, 2009.
Martinelli, L. A., Camargo, P. B., Lara, L., Victoria, R. L., and Artaxo, P.: Stable carbon and nitrogen isotopic composition of bulk aerosol particles in a C4 plant landscape of southeast Brazil, Atmos. Environ., 36, 2427–2432, https://doi.org/10.1016/S1352-2310(01)00454-X, 2002.
MEE (Ministry of Ecology and Environment of the People's Republic of China): Technical Regulation on Ambient Air Quality Index, China Environmental Science Press (HJ 633–2012), http://www.mee.gov.cn/ywgz/fgbz/bz/bzwb/jcffbz/201203/t20120302_224166.shtml (last access: 20 April 2022), 2012 (in Chinese).
MEE (Ministry of Ecology and Environment of the People's Republic of China): Bulletin of Ecology and Environment of the People's Republic of China 2013, http://www.mee.gov.cn/hjzl/sthjzk/zghjzkgb/201605/P020160526564730573906.pdf (last access: 20 April 2022), 2014 (in Chinese).
MEE (Ministry of Ecology and Environment of the People's Republic of China): Bulletin of Ecology and Environment of the People's Republic of China 2018, http://www.mee.gov.cn/hjzl/sthjzk/zghjzkgb/201905/P020190619587632630618.pdf (last access: 20 April 2022), 2019 (in Chinese).
MEE (Ministry of Ecology and Environment of the People's Republic of China): Bulletin of Ecology and Environment of the People's Republic of China 2019, http://www.mee.gov.cn/hjzl/sthjzk/zghjzkgb/202006/P020200602509464172096.pdf. (last access: 20 April 2022), 2020 (in Chinese).
MEE (Ministry of Ecology and Environment of the People's Republic of China): Bulletin of Ecology and Environment of the People's Republic of China 2020, http://www.mee.gov.cn/hjzl/sthjzk/zghjzkgb/202105/P020210526572756184785.pdf (last access: 20 April 2022), 2021 (in Chinese).
Mook, W. G. and Plicht, J. V. D.: Reporting 14C Activities and Concentrations, Radiocarbon, 41, 227–239, https://doi.org/10.1017/S0033822200057106, 1999.
Moura, J. M. S., Martens, C. S., Moreira, M. Z., Lima, R. L., Sampaio, I. C. G., Mendlovitz, H. P., and Menton, M. C.: Spatial and seasonal variations in the stable carbon isotopic composition of methane in stream sediments of eastern Amazonia, Tellus B, 60, 21–31, https://doi.org/10.1111/j.1600-0889.2007.00322.x, 2008.
NBS (National bureau of statistics): China Statistical Yearbook-2019, China Statistics press http://www.stats.gov.cn/tjsj/ndsj/2019/indexch.htm (last access: 20 April 2022), 2020 (in Chinese).
NBS (National bureau of statistics): China Statistical Yearbook-2020, China Statistics press, http://www.stats.gov.cn/tjsj/ndsj/2020/indexch.htm (last access: 20 April 2022), 2021 (in Chinese).
Ni, H., Huang, R.-J., Cao, J., Liu, W., Zhang, T., Wang, M., Meijer, H. A. J., and Dusek, U.: Source apportionment of carbonaceous aerosols in Xi'an, China: insights from a full year of measurements of radiocarbon and the stable isotope 13C, Atmos. Chem. Phys., 18, 16363–16383, https://doi.org/10.5194/acp-18-16363-2018, 2018.
Ni, H., Huang, R.-J., Cosijn, M. M., Yang, L., Guo, J., Cao, J., and Dusek, U.: Measurement report: dual-carbon isotopic characterization of carbonaceous aerosol reveals different primary and secondary sources in Beijing and Xi'an during severe haze events, Atmos. Chem. Phys., 20, 16041–16053, https://doi.org/10.5194/acp-20-16041-2020, 2020.
Niu, Z. C., Wang, S., Chen, J. S., Zhang, F. W., Chen, X. Q., He, C., Lin, L. F., Yin, L. Q., and Xu, L. L.: Source contributions to carbonaceous species in PM2.5 and their uncertainty analysis at typical urban, peri-urban and background sites in southeast China, Environ. Pollut., 181, 107–114, https://doi.org/10.1016/j.envpol.2013.06.006, 2013.
Niu, Z. C., Zhou, W. J., Cheng, P., Wu, S. G., Lu, X. F., Xiong, X. H., Du, H., and Fu, Y. C.: Observations of Atmospheric Δ14CO2 at the Global and Regional Background Sites in China: Implication for Fossil Fuel CO2 Inputs, Environ. Sci. Technol., 50, 12122–12128, https://doi.org/10.1021/acs.est.6b02814, 2016.
Niu, Z. C., Feng, X., Zhou, W. J., Wang, P., Liu, Y., Lu, X. F., Du, H., Fu, Y. C., Li, M., Mei, R. C., Li, Q., and Cai, Q. F.: Tree-ring Ä Δ14C time series from 1948 to 2018 at a regional background site, China: Influences of atmospheric nuclear weapons tests and fossil fuel emissions, Atmos. Environ., 246, 118156, https://doi.org/10.1016/j.atmosenv.2020.118156, 2021.
Novakov, T., Menon, S., Kirchstetter, T. W., Koch, D., and Hansen, J. E.: Aerosol organic carbon to black carbon ratios: Analysis of published data and implications for climate forcing, J. Geophys. Res., 110, D21205, https://doi.org/10.1029/2005JD005977, 2005.
Oros, D. R. and Simoneit, B. R. T.: Identification and emission factors of molecular tracers in organic aerosols from biomass burning Part 2. Deciduous trees, Appl. Geochem., 16, 1545–1565, https://doi.org/10.1016/s0883-2927(01)00022-1, 2001a.
Oros, D. R. and Simoneit, B. R. T.: Identification and emission factors of molecular tracers in organic aerosols from biomass burning Part 1. Temperate climate conifers, Appl. Geochem., 16, 1513–1544, https://doi.org/10.1016/s0883-2927(01)00021-x, 2001b.
PGHP (The People's Government of Hebei Province): Hebei Economic Yearbook-2020, China Statistics press, http://tjj.hebei.gov.cn/hetj/tjnj/2020/indexch.htm (last access: 20 April 2022), 2021 (in Chinese).
Popovicheva, O. B., Kozlov, V. S., Engling, G., Diapouli, E., Persiantseva, N. M., Timofeev, M. A., Fan, T.-S., Saraga, D., and Eleftheriadis, K.: Small-scale study of siberian biomass burning: I. Smoke microstructure, Aerosol Air Qual. Res., 15, 117–128, https://doi.org/10.4209/aaqr.2014.09.0206, 2014.
Pugliese, S. C., Murphy, J. G., Vogel, F., and Worthy, D.: Characterization of the δ13C signatures of anthropogenic CO2 emissions in the Greater Toronto Area, Canada, Appl. Geochem., 83, 171–1800, https://doi.org/10.1016/j.apgeochem.2016.11.003, 2017.
Puxbaum, H., Caseiro, A., Sánchez-Ochoa, A., Kasper-Giebl, A., Claeys, M., Gelencsér, A., Legrand, M., Preunkert, S., and Pio, C.: Levoglucosan levels at background sites in Europe for assessing the impact of biomass combustion on the European aerosol background, J. Geophys. Res., 112, D23S05, https://doi.org/10.1029/2006jd008114, 2007.
Rajput, P., Sarin, M. M., Rengarajan, R., and Singh, D.: Atmospheric polycyclic aromatic hydrocarbons (PAHs) from post-harvest biomass burning emissions in the Indo-Gangetic Plain: isomer ratios and temporal trends, Atmos. Environ., 45, 6732–6740, https://doi.org/10.1016/j.atmosenv.2011.08.018, 2011.
SAPBS (Shaanxi Provincial Bureau of Statistics): Shaanxi Statistical Yearbook-2020, China Statistics press, http://tjj.shaanxi.gov.cn/upload/2021/zl/2020/zk/indexch.htm (last access: 20 April 2022), 2020 (in Chinese).
Seinfeld, J. H: Atmospheric Chemistry and Physics: From Air Pollution to Climate Change, Environ.: Sci. Policy Sustainable Dev., 40, 26, https://doi.org/10.1080/00139157.1999.10544295, 1998.
Shang, J., Khuzestani, R. B., Tian, J., Schauer, J. J., Hua, J., Zhang, Y., Cai, T., Fang, D., An, J., and Zhang, Y.: Chemical characterization and source apportionment of PM2.5 personal exposure of two cohorts living in urban and suburban Beijing, Environ. Pollut., 246, 225–236, https://doi.org/10.1016/j.envpol.2018.11.076, 2019.
Shao, M., Li, J., and Tang, X.: The application of accelerator mass spectrometry (AMS) in the study of source identification of aerosols, Acta Scientiae Circumstantiae, 16, 130–141, 1996 (in Chinese).
Shen, G. F., Wang, W., Yang, Y. F., Zhu, C., Min, Y. J., Xue, M., Ding, J. N., Li, W., Wang, B., Shen, H. Z., Wang, R., Wang, X. L., and Tao, S.: Emission factors and particulate matter size distribution of polycyclic aromatic hydrocarbons from residential coal combustions in rural Northern China, Atmos. Environ., 44, 5237–5243, https://doi.org/10.1016/j.atmosenv.2010.08.042, 2010.
Shen, Z. X., Cao, J. J., Liu, S. X., Zhu, C. S., Wang, X., Zhang, T., Xu, H. M., and Hu, T. F.: Chemical Composition of PM10 and PM2.5 Collected at Ground Level and 100 Meters during a Strong Winter-Time Pollution Episode in Xi'an, China, J. Air Waste Manage. Assoc., 61, 1150–1159, https://doi.org/10.1080/10473289.2011.608619, 2011.
Simoneit, B. R. T., Schauer, J. J., Nolte, C. G., Oros, D. R., Elias, V. O., Fraser, M. P., Rogge, W. F., and Cass, G. R.: Levoglucosan, a tracer for cellulose in biomass burning and atmospheric particles, Atmos. Environ., 33, 173–182, https://doi.org/10.1016/S1352-2310(98)00145-9, 1999.
Simpson, D., Yttri, K. E., Klimont, Z., Kupiainen, K., Caseiro, A., Gelencsér, A., Pio, C., Puxbaum, H., and Legrand, M.: Modeling carbonaceous aerosol over Europe: Analysis of the CARBOSOL and EMEP EC/OC campaigns, J. Geophys. Res., 112, D23S14, https://doi.org/10.1029/2006JD008158, 2007.
Slota, P. J., Jull, A. J. T., Linick, T. W., and Toolin, L. J.: Preparation of Small Samples for 14C Accelerator Targets by Catalytic Reduction of CO, Radiocarbon, 29, 303–306, https://doi.org/10.1017/S0033822200056988, 1987.
Smith, B. N., and Epstein, S.: Two Categories of 13C/12C Ratios for Higher Plants, Plant Physiol., 47, 380–384, https://doi.org/10.1029/2006JD008158, 1971.
Song, Y., Zhang, Y. H., Xie, S. D., Zeng, L. M., Zheng, M., Salmon, L., Shao, M., and Slanina, S.: Source apportionment of PM2.5 in Beijing by positive matrix factorization, Atmos. Environ., 40, 1526–1537, https://doi.org/10.1016/j.atmosenv.2005.10.039, 2006.
SPBS (Shanxi Provincial Bureau of Statistics): Shanxi Statistical Yearbook-2019, China Statistics press, http://tjj.shanxi.gov.cn/tjsj/tjnj/nj2019/zk/indexch.htm (last access: 20 April 2022), 2020 (in Chinese).
Streets, D. G., Bond, T. C., Carmichael, G. R., Fernandes, S. D., Fu, Q., He, D., Klimont, Z., Nelson, S. M., Tsai, N. Y., Wang, M. Q., Woo, J. H., and Yarber, K. F.: An inventory of gaseous and primary aerosol emissions in Asia in the year 2000, J. Geophys. Res., 108, 8809, https://doi.org/10.1029/2002JD003093, 2003a.
Streets, D. G., Yarber, K. F., Woo, J.-H., and Carmichael, G. R.: Biomass burning in Asia: Annual and seasonal estimates and atmospheric emissions, Global Biogeochem. Cy., 17, 1099, https://doi.org/10.1029/2003GB002040, 2003b.
Stuiver, M. and Polach, H.: Discussion: Reporting of 14C data, Radiocarbon, 19, 355–363, https://doi.org/10.1017/S0033822200003672, 1977.
Sun, X. S., Hu, M., Guo, S., Liu, K. X., and Zhou, L. P.: 14C-Based source assessment of carbonaceous aerosols at a rural site, Atmos. Environ., 50, 36–40, https://doi.org/10.1016/j.atmosenv.2012.01.008, 2012.
Sun, Y. L., Zhuang, G. S., Tang, A. H., Wang, Y., and An, Z. S.: Chemical characteristics of PM2.5 and PM10 in haze-fog episodes in Beijing, Environ. Sci. Technol., 40, 3148–3155, https://doi.org/10.1021/es051533g, 2006.
Szidat, S., Jenk, T. M., Gaeggeler, H. W., Synal, H. A., Hajdas, I., Bonani, G., and Saurer, M.: THEODORE, a two-step heating system for the determination of radiocarbon (14C) in the environment, Nucl. Instrum. Meth. B, 223, 829–836, https://doi.org/10.1016/j.nimb.2004.04.153, 2004.
Szidat, S., Jenk, T. M., Synal, H.-A., Kalberer, M., Wacker, L., Hajdas, I., Kasper-Giebl, A., and Baltensperger, U.: Contributions of fossil fuel, biomass burning, and biogenic emissions to carbonaceous aerosols in Zürich as traced by 14C, J. Geophys. Res., 111, D07206, https://doi.org/10.1029/2005JD006590, 2006.
Szidat, S., Ruff, M., Perron, N., Wacker, L., Synal, H.-A., Hallquist, M., Shannigrahi, A. S., Yttri, K. E., Dye, C., and Simpson, D.: Fossil and non-fossil sources of organic carbon (OC) and elemental carbon (EC) in Göteborg, Sweden, Atmos. Chem. Phys., 9, 1521–1535, https://doi.org/10.5194/acp-9-1521-2009, 2009.
Tanarit, S., Alex, G., Detlev, H., Jana, M., and Christine, W.: Secondary Organic Aerosol from Sesquiterpene and Monoterpene Emissions in the United States, Environ. Sci. Technol., 42, 8784–8790, https://doi.org/10.1021/es800817r, 2008.
Tian, S. L., Pan, Y. P., and Wang, Y. S.: Size-resolved source apportionment of particulate matter in urban Beijing during haze and non-haze episodes, Atmos. Chem. Phys., 16, 1–19, https://doi.org/10.5194/acp-16-1-2016, 2016.
Turekian, V. C., Macko, S., Ballentine, D., Swap, R. J., and Garstang, M.: Causes of bulk carbon and nitrogen isotopic fractionations in the products of vegetation burns: laboratory studies, Chem. Geol., 152, 181–192, https://doi.org/10.1016/S0009-2541(98)00105-3, 1998.
Turnbull, J. C., Lehman, S. J., Miller, J. B., Sparks, R. J., Southon, J. R., and Tans, P. P.: A new high precision 14CO2 time series for North American continental air, J. Geophys. Res., 112, D11310, https://doi.org/10.1029/2006jd008184, 2007.
Turpin, B. J. and Huntzicker, J. J.: Identification of secondary organic aerosol episodes and quantitation of primary and secondary organic aerosol concentrations during SCAQS, Atmos. Environ., 29, 3527–3544, https://doi.org/10.1016/1352-2310(94)00276-Q, 1995.
Vardag, S. N., Gerbig, C., Janssens-Maenhout, G., and Levin, I.: Estimation of continuous anthropogenic CO2: model-based evaluation of CO2, CO, δ13C(CO2) and Δ14C(CO2) tracer methods, Atmos. Chem. Phys., 15, 12705–12729, https://doi.org/10.5194/acp-15-12705-2015, 2015.
Vonwiller, M., Quintero, G. S., and Szidat, S.: Isolation and 14C analysis of humic-like substances (HULIS) from ambient aerosol samples, in: 2nd International Radiocarbon in the Environment Conference. Debrecen, Hungary, 3–7 July 2017, https://doi.org/10.7892/boris.108864, 2017.
Wang, G., Cheng, S., Li, J., Lang, J., Wen, W., Yang, X., Tian, L., Wang, G., Cheng, S. Y., Li, J. B., Lang, J. L., Wen, W., Yang, X. W., and Tian, L.: Source apportionment and seasonal variation of PM2.5 carbonaceous aerosol in the Beijing-Tianjin-Hebei Region of China, Environ. Monit. Assess., 187, 143, https://doi.org/10.1007/s10661-015-4288-x, 2015.
Wang, H. L., Zhuang, Y. H., Wang, Y., Yuan, Y. L., and Zhuang, G. S.: Long-term monitoring and source apportionment of PM2.5/PM10 in Beijing, China, J. Environ. Sci., 20, 1323–1327, https://doi.org/10.1016/S1001-0742(08)62228-7, 2008.
Wang, X. F., Zhu, G. H., Wu, Y. G., and Shen, X. Y.: Chemical composition and size distribution of particles in the atmosphere in north part of Beijing city for winter and summer, Chinese Journal of Atmospheric Sciences, 14, 199–206, https://doi.org/10.3878/j.issn.1006-9895.1990.02.09, 1990 (in Chinese).
Wang, Z. Z., Bi, X. H., Sheng, G. Y., and Fu, J. M.: Characterization of organic compounds and molecular tracers from biomass burning smoke in South China I: Broad-leaf trees and shrubs, Atmos. Environ., 43, 3096–3102, https://doi.org/10.1016/j.atmosenv.2009.03.012, 2009.
Weber, R. J., Sullivan, A. P., Peltier, R. E., Russell, A., Yan, B., Zheng, M., Gouw, J. D., Warneke, C., Brock, C., and Holloway, J. S.: A study of secondary organic aerosol formation in the anthropogenic-influenced southeastern United States, J. Geophys. Res., 112, D13302, https://doi.org/10.1029/2007jd008408, 2007.
Widory, D.: Combustibles, fuels and their combustion products: A view through carbon isotopes, Combust. Theor. Model., 10, 831–841, https://doi.org/10.1080/13647830600720264, 2006.
Winiger, P., Andersson, A., Eckhardt, S., Stohl, A., Semiletov, I. P., Dudarev, O. V., Charkin, A., Shakhova, N., Klimont, Z., and Heyes, C.: Siberian Arctic black carbon sources constrained by model and observation, P. Natl. Acad. Sci. USA, 114, E1054–E1061, https://doi.org/10.1073/pnas.1613401114, 2017.
Wu, J., Kong, S. F., Zeng, X., Cheng, Y., Yan, Q., Zheng, H., Yan, Y. Y., Zheng, S. R., Liu, D. T., Zhang, X. Y., Fu, P. Q., Wang, S. X., and Qi, S. H.: First High-Resolution Emission Inventory of Levoglucosan for Biomass Burning and Non-Biomass Burning Sources in China, Environ. Sci. Technol., 55, 1497–1507, https://doi.org/10.1021/acs.est.0c06675, 2021.
XAMBS (Xi'an Municipal Bureau Statistics): Xi'an Statistical Yearbook-2014, China Statistics press, http://tjj.xa.gov.cn/tjnj/2014/tjnj/indexch.htm (last access: 20 April 2022), 2014 (in Chinese).
XAMBS (Xi'an Municipal Bureau Statistics): Xi'an Statistical Yearbook-2020 China Statistics press, http://tjj.xa.gov.cn/tjnj/2020/zk/indexch.htm (last access: 20 April 2022), 2021 (in Chinese).
Yan, X. Y. and Crookes, R. J.: Energy demand and emissions from road transportation vehicles in China, Prog. Energ. Combust., 36, 651–676, https://doi.org/10.1016/j.pecs.2010.02.003, 2010.
Yan, X. Y., Ohara, T., and Akimoto, H.: Bottom-up estimate of biomass burning in mainland china, Atmos. Environ., 40, 5262–5273, https://doi.org/10.1016/j.atmosenv.2006.04.040, 2006.
Yang, F., He, K., Ye, B., Chen, X., Cha, L., Cadle, S. H., Chan, T., and Mulawa, P. A.: One-year record of organic and elemental carbon in fine particles in downtown Beijing and Shanghai, Atmos. Chem. Phys., 5, 1449–1457, https://doi.org/10.5194/acp-5-1449-2005, 2005.
Zhang, R., Jing, J., Tao, J., Hsu, S.-C., Wang, G., Cao, J., Lee, C. S. L., Zhu, L., Chen, Z., Zhao, Y., and Shen, Z.: Chemical characterization and source apportionment of PM2.5 in Beijing: seasonal perspective, Atmos. Chem. Phys., 13, 7053–7074, https://doi.org/10.5194/acp-13-7053-2013, 2013.
Zhang, Y. L., Perron, N., Ciobanu, V. G., Zotter, P., Minguillón, M. C., Wacker, L., Prévôt, A. S. H., Baltensperger, U., and Szidat, S.: On the isolation of OC and EC and the optimal strategy of radiocarbon-based source apportionment of carbonaceous aerosols, Atmos. Chem. Phys., 12, 10841–10856, https://doi.org/10.5194/acp-12-10841-2012, 2012.
Zhang, Y.-L., Huang, R.-J., El Haddad, I., Ho, K.-F., Cao, J.-J., Han, Y., Zotter, P., Bozzetti, C., Daellenbach, K. R., Canonaco, F., Slowik, J. G., Salazar, G., Schwikowski, M., Schnelle-Kreis, J., Abbaszade, G., Zimmermann, R., Baltensperger, U., Prévôt, A. S. H., and Szidat, S.: Fossil vs. non-fossil sources of fine carbonaceous aerosols in four Chinese cities during the extreme winter haze episode of 2013, Atmos. Chem. Phys., 15, 1299–1312, https://doi.org/10.5194/acp-15-1299-2015, 2015.
Zhang, Y. L., Ren, H., Sun, Y. L., Cao, F., Chang, Y. H., Liu, S. D., Lee, X. H., Agrios, K., Kawamura, K., Liu, D., Ren, L. J., Du, W., Wang, Z. F., Prévôt, A. S. H., Szidat, S., and Fu, P. Q.: High Contribution of Nonfossil Sources to Submicrometer Organic Aerosols in Beijing, China, Environ. Sci. Technol., 51, 7842–7852, https://doi.org/10.1021/acs.est.7b01517, 2017.
Zhang, Y. X., Shao, M., Zhang, Y. H., Zeng, L. M., HE., L. Y., Zhu, B., Wei, Y. J., and Zhu, X. L.: Source profiles of particulate organic matters emitted from cereal straw burnings, J. Environ. Sci., 19, 167–175, https://doi.org/10.1016/S1001-0742(07)60027-8, 2007.
Zhang, Z. S., Engling, G., Chan, C. Y., Yang, Y. H., Lin, M., Shi, S., He, J., Li, Y. D., and Wang, X. M.: Determination of isoprene-derived secondary organic aerosol tracers (2-methyltetrols) by HPAEC-PAD: Results from size-resolved aerosols in a tropical rainforest, Atmos. Environ., 70, 468–476, https://doi.org/10.1016/j.atmosenv.2013.01.020, 2013.
Zhang, Z. S., Gao, J., Zhang, L. M., Wang, H., Tao, J., Qiu, X. H., Chai, F. H., Li, Y., and Wang, S. L.: Observations of biomass burning tracers in PM2.5 at two megacities in North China during 2014 APEC summit, Atmos. Environ., 169, 54–65, https://doi.org/10.1016/j.atmosenv.2017.09.011, 2017.
Zhao, H., Niu, Z., Zhou W., Wang, S., Feng, X., Wu, S., Lu, X., and Du, H.: Research data supporting “Measurement report: Source apportionment of carbonaceous aerosol using dual-carbon isotopes (13C and 14C) and levoglucosan in three northern Chinese cities during 2018–2019”, East Asian Paleoenvironmental Science Database [data set], http://paleodata.ieecas.cn/FrmDataInfo_EN.aspx?id=5f8b678f-716c-4cc7-81aa-0528c42e698c, last access: 20 April 2022.
Zhao, P. S., Dong, F., Yang, Y. D., He, D., Zhao, X. J., Zhang, W. Z., Yao, Q., and Liu, H. Y.: Characteristics of carbonaceous aerosol in the region of Beijing, Tianjin, and Hebei, China, Atmos. Environ., 71, 389–398, https://doi.org/10.1016/j.atmosenv.2013.02.010, 2013.
Zhao, Z. Z., Cao, J. J., Zhang, T., XingShen, Z., Ni, H. Y., Tian, J., Wang, Q. Y., Liu, S. X., Zhou, J. M., Gu, J., and Shen, G. Z.: Stable carbon isotopes and levoglucosan for PM2.5 elemental carbon source apportionments in the largest city of northwest china, Atmos. Environ., 185, 253–261, https://doi.org/10.1016/j.atmosenv.2018.05.008, 2018.
Zhi, G. R., Chen, Y. J., Feng, Y. L., Xiong, S. C., Jun, L. I., Zhang, G., Sheng, G. Y., and Jiamo, F. U.: Emission characteristics of carbonaceous particles from various residential coal-stoves in China, Environ. Sci. Technol., 42, 3310–3315, https://doi.org/10.1021/es702247q, 2008.
Zhou, W. J., Zhao, X. L., Feng, L. X., Lin, L., Kun, W. Z., Peng, C., Nian, Z. W., and Hai, H. C.: The 3MV multi-element AMS in Xi'an, China: Unique features and preliminary tests, Radiocarbon, 48, 285–293, https://doi.org/10.1017/S0033822200066492, 2006.
Zhou, W. J., Lua, X. F., Wu, Z. K., Zhao, W. N., Huang, C. H., Lia, L. L., Chen, P., and Xin, Z. H.: New results on Xi'an-AMS and sample preparation systems at Xi'an-AMS center, Nucl. Instrum. B, 262, 135–142, https://doi.org/10.1016/j.nimb.2007.04.221, 2007.
Zhou, W. J., Wu, S. G., Huo, W. W., Xiong, X. H., Cheng, P., Lu, X. F., and Niu, Z. C.: Tracing fossil fuel CO2 using Δ14C in Xi'an City, China, Atmos. Environ., 94, 538–545, https://doi.org/10.1016/j.atmosenv.2014.05.058, 2014.