the Creative Commons Attribution 4.0 License.
the Creative Commons Attribution 4.0 License.
 | 17 Jan 2022
Prediction of secondary organic aerosol from the multiphase reaction of gasoline vapor by using volatility–reactivity base lumping
Sanghee Han
Heterogeneous chemistry of oxidized carbons in aerosol phase is known to significantly contribute to secondary organic aerosol (SOA) burdens. The UNIfied Partitioning Aerosol phase Reaction (UNIPAR) model was developed to process the multiphase chemistry of various oxygenated organics into SOA mass predictions in the presence of salted aqueous phase. In this study, the UNIPAR model simulated the SOA formation from gasoline fuel, which is a major contributor to the observed concentration of SOA in urban areas. The oxygenated products, predicted by the explicit mechanism, were lumped according to their volatility and reactivity and linked to stoichiometric coefficients which were dynamically constructed by predetermined mathematical equations at different NOx levels and degrees of gas aging. To improve the model feasibility in regional scales, the UNIPAR model was coupled with the Carbon Bond 6 (CB6r3) mechanism. CB6r3 estimated the hydrocarbon consumption and the concentration of radicals (i.e., RO2 and HO2) to process atmospheric aging of gas products. The organic species concentrations, estimated by stoichiometric coefficient array and the consumption of hydrocarbons, were applied to form gasoline SOA via multiphase partitioning and aerosol-phase reactions. To improve the gasoline SOA potential in ambient air, model parameters were also corrected for gas–wall partitioning (GWP). The simulated gasoline SOA mass was evaluated against observed data obtained in the University of Florida Atmospheric PHotochemical Outdoor Reactor (UF-APHOR) chamber under varying sunlight, NOx levels, aerosol acidity, humidity, temperature, and concentrations of aqueous salts and gasoline vapor. Overall, gasoline SOA was dominantly produced via aerosol-phase reaction, regardless of the seed conditions owing to heterogeneous reactions of reactive multifunctional organic products. Both the measured and simulated gasoline SOA was sensitive to seed conditions showing a significant increase in SOA mass with increasing aerosol acidity and water content. A considerable difference in SOA mass appeared between two inorganic aerosol states (dry aerosol vs. wet aerosol) suggesting a large difference in SOA formation potential between arid (western United States) and humid regions (eastern United States). Additionally, aqueous reactions of organic products increased the sensitivity of gasoline SOA formation to NOx levels as well as temperature. The impact of the chamber wall on SOA formation was generally significant, and it appeared to be higher in the absence of wet salts. Based on the evaluation of UNIPAR against chamber data from 10 aromatic hydrocarbons and gasoline fuel, we conclude that the UNIPAR model with both heterogeneous reactions and the model parameters corrected for GWP can improve the ability to accurately estimate SOA mass in regional scales.
- Article
(953 KB) - Full-text XML
-
Supplement
(1071 KB) - BibTeX
- EndNote


The atmospheric oxidation of hydrocarbons (HCs) produces ozone in the troposphere through a photochemical cycle of nitrogen oxides. This ozone can increase the risks of respiratory disease (Jerrett et al., 2009), cardiovascular disease, and premature death (Turner et al., 2016). Additionally, the atmospheric process of HCs can produce semi-volatile oxygenated products that can form secondary organic aerosol (SOA) through either gas–particle partitioning or aerosol-phase reactions. SOA is a major contributor to the fine particular matter (PM2.5) in ambient air (Jimenez et al., 2009), with significant effects on climate (Heald et al., 2008) and human health (Cohen et al., 2017; Pöschl, 2005). Thus, it is critical to understand and predict the amount of SOA produced from the atmospheric oxidation of various HCs to effectively improve air quality and human health.
The air quality models, integrated with the partitioning based SOA module using two (Odum et al., 1996) or several surrogate species (i.e., Volatility Basis Set, Donahue et al., 2006), tend to underpredict SOA mass in the urban ambient air (Volkamer et al., 2006; Dzepina et al., 2011; Ensberg et al., 2014; Hayes et al., 2015; Appel et al., 2017; Woody et al., 2016). Much effort has been made to reduce the model–measurement discrepancies by adding missing SOA precursors (McDonald et al., 2018), including heterogeneous reactions (Carlton et al., 2010), and correcting the SOA model parameters by considering gas–wall partitioning (GWP) bias (Cappa et al., 2016; Baker et al., 2015; Hayes et al., 2015). For example, high SOA yields (> 0.1) were reported from several individual intermediate volatility compounds in consumer product mixtures (Li et al., 2018). Thus, the extension of the SOA model to additional precursors emitted from the commercial usage of chemicals was attempted to close the model–measurement gap (Qin et al., 2021; Shah et al., 2019; McDonald et al., 2018).
The oligomers in SOA formed from photooxidation of precursor HCs in chambers and the ambient air has been identified as 25 %–80 % of the SOA mass (Kalberer et al., 2004; 2006; Tolocka et al., 2004; Gross et al., 2006; Hallquist et al., 2009). Thus, there have been numerous implications of in-particle chemistry in SOA formation for the model studies (Carlton and Turpin, 2013; Carlton et al., 2010; Pye et al., 2017). For example, the formation of oligomers was considered in the SOA module of Community Multiscale Air Quality (CMAQ) as a first-order reaction of condensed organic species, resulting in the improvement of spatial and temporal trends of SOA mass in particular for biogenic SOA (Carlton et al., 2010). To introduce the role of aerosol water contents in SOA formation, Jathar et al. (2016) examined the water uptake to the organic phase in SOA model and assess its influence on SOA formation (Jathar et al., 2016). Moreover, Pye et al. (2017) evaluate the importance of aerosol–water–organic interactions in the CMAQ model accounting for the uptake of water onto the hydrophilic organics (Pye et al., 2017). Despite such efforts, the performance of SOA formation in representing spatial and seasonal variation in ambient aerosol tends to underestimate total aerosol mass in the southern and western US (Appel et al., 2021).
The inaccuracy of SOA predictions can originate from the integration of the SOA model with the model parameters originated from biased chamber data. The deposition of organic vapor onto the reactor wall can cause the negative bias in SOA prediction because SOA model parameters are typically determined on the basis of a mass balance by using chamber data (Matsunaga and Ziemann, 2010; Zhang et al., 2014; Yeh and Ziemann, 2015; Krechmer et al., 2016; Huang et al., 2018). Thus, the GWP of semi-volatile organic compounds was semi-empirically characterized for various organic species. Many model studies reported that the significance of GWP varied with precursor HCs, gas oxidation process (different NOx levels or oxidants), chamber dimension and size, seed conditions, and meteorological conditions (temperature and humidity) (Zhang et al., 2014; Krechmer et al., 2020; Brune, 2019; Huang et al., 2018; Cappa et al., 2016). To simulate SOA formation accurately, the integration of the GWP model to the SOA model is inevitable in chamber studies. However, the application of individually determined GWP bias in the air quality model is challenging due to the surrogate species in air quality models.
Table 1Experimental conditions for the photooxidation of the gasoline in the UF-APHOR chamber.
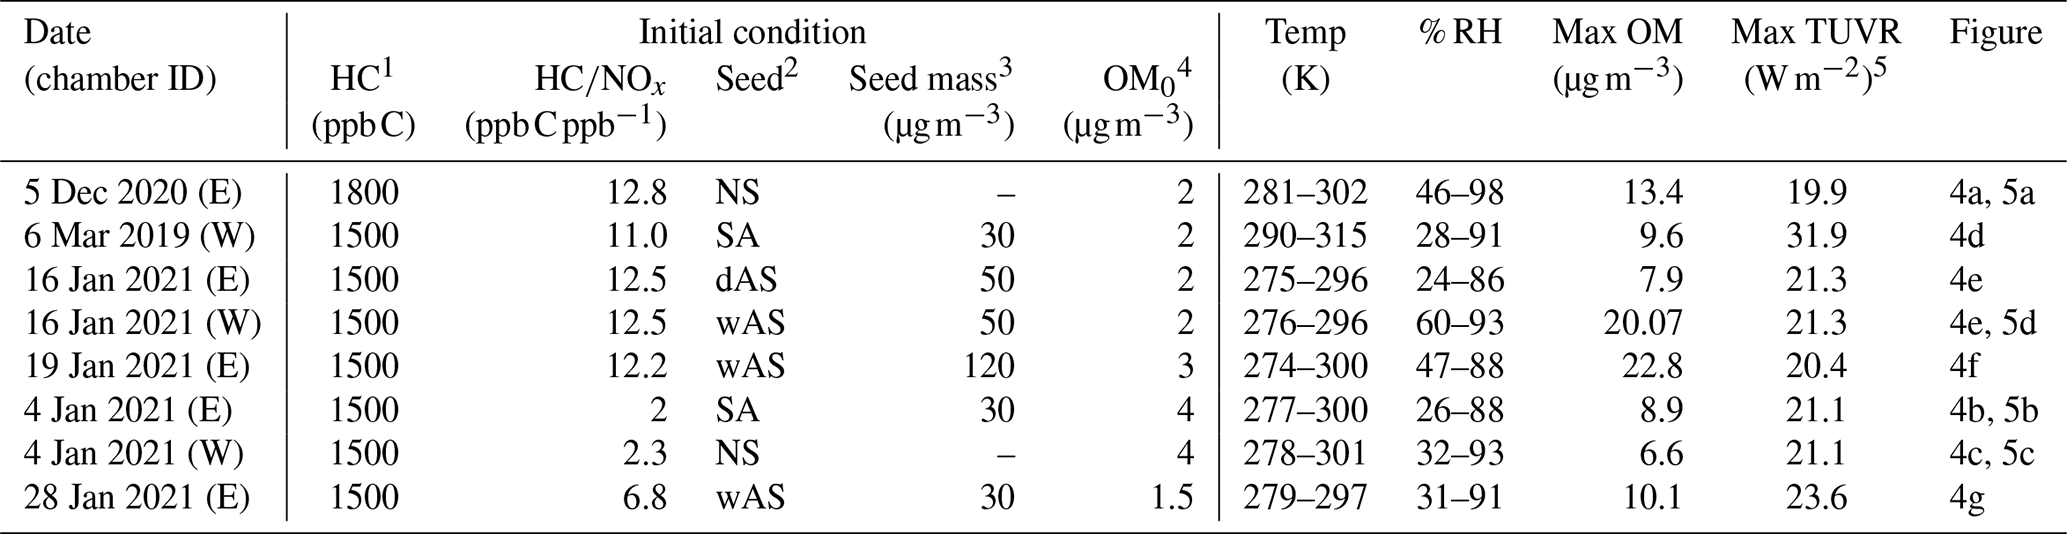
1 Total HC concentrations in gasoline injected into the chamber. The HC concentrations were determined by using GC/FID (Fig. S1). 2 NS, SA, wAS, and dAS indicate non-seeded, sulfuric acid seed, wet ammonium sulfate seed, and dry ammonium sulfate seed, respectively. 3 The seed mass is determined as a dry mass, without water mass. 4 The pre-existing organic matter (OM0) is determined for the chamber air prior to the injection of inorganic seed and HC. 5 Total ultraviolet radiation (TUVR) measured solar ultraviolet radiation (W m−2). The measured solar ultraviolet radiation on 5 December 2020 and 6 March 2019 is shown in Fig. S5b.
In this study, the SOA formation from photooxidation of gasoline vapor was simulated with the UNIfied Partitioning Aerosol-phase Reaction (UNIPAR) model, which predicts SOA formation via multiphase reactions. The important feature of the UNIPAR model is to simulate SOA formation via aqueous-phase reactions of organic species in the absence of GWP. The UNIPAR model streamlines gas oxidation mechanisms, multiphase partitioning (gas, organic phase, and inorganic salted solution), and aerosol-phase reactions in both organic and inorganic phases (Beardsley and Jang, 2016; Im et al., 2014; Zhou et al., 2019; Yu et al., 2021). The model parameters and equations in the model have been demonstrated for various SOA produced from aromatic HCs (Im et al., 2014; Zhou et al., 2019), terpenes (Yu et al., 2021), and isoprene (Beardsley and Jang, 2016). In order to predict SOA mass in ambient air, the model parameters were updated by using the GWP model that employed a quantitative structure activity relationship (QSAR) approach (Han and Jang, 2020). The Carbon Bond 6 (CB6r3) (Yarwood et al., 2010) mechanism was integrated with UNIPAR to obtain the consumption of HCs and the concentration of radicals (RO2 and HO2) that processed atmospheric aging. The simulated SOA mass was compared to chamber-generated SOA data under the University of Florida Atmospheric PHotochemical Outdoor Reactor (UF-APHOR). The UNIPAR prediction was also compared to the prediction from the AERO7 module in the CMAQ model (CMAQ-AE7) (Appel et al., 2021). The sensitivity of gasoline SOA formation to various environmental conditions, such as temperature, relative humidity (RH), seed conditions, and the concentration of HC, was investigated.
Gasoline SOA was generated from the photooxidation of US commercial gasoline vapor (octane numbers of 87) under ambient sunlight in the UF-APHOR outdoor chamber located on the rooftop of Black Hall (29.64∘, −82.34∘) at the University of Florida, Gainesville, Florida. Based on the gas chromatography – flame ionization detector (GC-FID, HP-5890/Agilent Technologies 7820A) analysis of injected gasoline vapor, 30 % of carbons in the gasoline were from single-ring aromatic HCs (Fig. S1 in the Supplement). The gasoline vapor, NOx, and inorganic seed aerosols were injected into the chamber before sunrise, and experiments were conducted for 10 h after sunrise. The NOx level was classified into high NOx ( < 5.5 ppb C ppb−1) and low NOx level ( > 5.5 ppb C ppb−1) based on the initial concentration of HC and NOx. Four different seed conditions (non-seeded, NS; sulfuric acid, SA; wet ammonium sulfate, wAS; dry ammonium sulfate, dAS) were applied to evaluate the seed effects on gasoline SOA. The chamber conditions for conducted experiments were summarized in Table 1.
The concentration of HCs and CCl4 were monitored using a GC-FID. The measured HC concentration from GC-FID determined HC consumption in the chamber during the experiment. The concentration of CCl4 was measured as a function of time to obtain the dilution factor in the chamber. The concentrations of O3 and NOx were monitored with a photometric ozone analyzer (Teledyne, model 400E) and a chemiluminescence NO/NO2 analyzer (Teledyne, model 200E), respectively. The measurements of inorganic ion ( and ) and organic carbon (OC) concentrations of aerosol were conducted with in situ monitoring by the particle-into-liquid sampler (Applikon, ADI 2081) coupled with ion chromatography (Metrohm, 761Compact IC) (PILS-IC) and an OC/EC carbon aerosol analyzer (Sunset Laboratory, model 4), respectively. The particle volume concentration was monitored with a scanning mobility particle sizer (SMPS, TSI, model 3080) integrated with a condensation nuclei counter (TSI, model 3025A and model 3022). The composition (, , , and organic) of aerosol was also monitored using an aerosol chemical speciation monitor (ACSM, Aerodyne Research Inc., USA) to compare with the data obtained from OC and PILS-IC for the accurate measurement. The meteorological factors (RH, temperature, and ultraviolet radiation) were measured in the UF-APHOR and applied to the simulation. The sunlight intensity was measured by a total ultraviolet radiometer (EPLAB, TUVR). Aerosol acidity (mol/L of aerosol) was monitored by colorimetry integrated in the reflectance UV–visible spectrometer (Li and Jang, 2012; Jang et al., 2020).
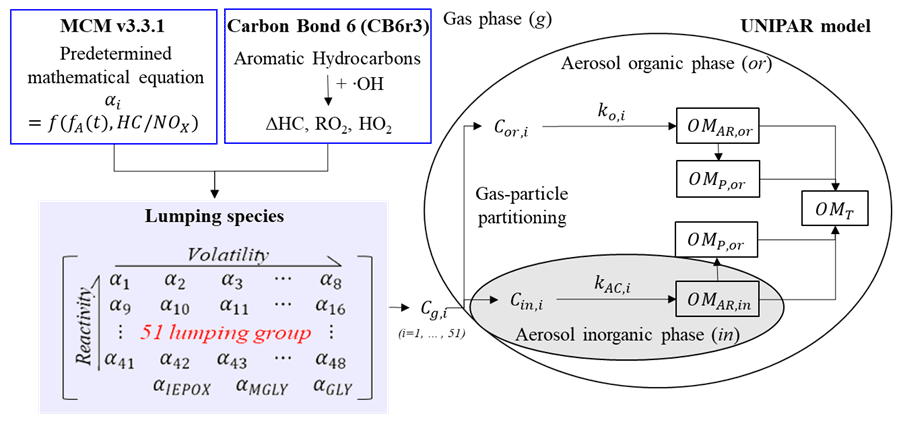
Figure 1The structure of the UNIPAR-CB6r3 to predict the gasoline SOA formation. Cg,i, Cor,i, and Cin,i are the concentration of organic compound (i) in the gas phase (g), organic phase (or), and inorganic phase (in). The dynamic stoichiometric coefficient (dynamic αi), the consumption of HC (ΔHC), the concentration of hydroperoxide radical ([HO2]), and the concentration of organic peroxyl radical ([RO2]) are simulated from the CB6r3. The aging scale factor (fA) is represented as a function of [HO2], [RO2], and the initial concentration of HC (Zhou et al., 2019). OMAR, OMP, and OMT indicate organic matter (OM) formed from aerosol-phase reactions, OM formed from the partitioning process, and total OM, respectively.
The UNIPAR model was coupled with CB6r3 gas mechanism to simulate SOA formation from photooxidation of HCs (UNIPAR-CB6r3). The overall structure of the UNIPAR-CB6r3 model is illustrated in Fig. 1. The main feature of the model is the SOA simulation based on volatility and reactivity of organic products by using lumping species that are constructed from explicit gas products. In UNIPAR-CB6r3, the model parameters are corrected by the GWP artifacts, and they are also universalized for 10 aromatic HCs to predict SOA formation from gasoline vapor. The UNIPAR-CB6r3 model was simulated in the Dynamically Simple Model of Atmospheric Chemical Complexity (DSMACC) (Emmerson and Evans, 2009) integrated with the Kinetic PreProcessor (KPP) (Damian et al., 2002).
The CB6r3 mechanism simulates the atmospheric oxidation of anthropogenic precursors in the gas phase and yields the consumption of HCs (ΔHC) and concentration of RO2 ([RO2]) and HO2 ([HO2]). In the model, the predetermined polynomial equations, derived by using explicit gas mechanisms (Master Chemical Mechanism, MCM v3.3.1) (Jenkin et al., 2012), estimate the stoichiometric coefficients (αi) of the lumping species (i) of gas-phase oxygenated products. The quantity of the αi array, which was classified into 51 lumping species according to their volatility and reactivity in the aerosol phase, is dynamic as a function of a level and degree of aging, which is calculated with ΔHC, [RO2], and [HO2] from CB6r3. These lumping species are then used to generate SOA mass (OMT) via gas–particle partitioning (OMP) and heterogeneous reactions (OMAR) in both organic and inorganic phases. The SOA formation via aqueous-phase reactions of organic species was simulated under the assumption of the liquid–liquid phase separation (LLPS) between organic and inorganic phases. The details of the model description are shown in the following sections.
3.1 Lumped organic species
The formation of oxygenated products is predicted by simulating the MCM v3.3.1 gas mechanism. The resulting oxygenated products are then classified into 51 lumping species based on their volatility and chemical reactivity. αi is determined at varying ratios and the different degree of gas aging, and dynamically constructed by using the mathematical equations based on the simulation of MCM v.3.3.1. The degree of aging is mathematically correlated with the concentration of RO2 and HO2, which are normalized with the initial concentration of HCs. These lumping species are linked to a mass-based αi to produce the concentrations of each lumping species. In order to process the multiphase thermodynamic equilibrium of lumping species (i), the physicochemical properties (vapor pressure, ; molecular weight, MWi; oxygen to carbon ratio, O:Ci; and hydrogen bonding, HBi) are determined based on the group contribution (Stein and Brown, 1994). In the UNIPAR model, the volatilities of each oxidation product are classified into eight levels of the vapor pressure () (1–8: 10−8, 10−6, 10−5, 10−4, 10−3, 10−2, 10−1, and 1 mm Hg) and six levels based on the aerosol-phase reactivity scale (Ri): very fast (VF), fast (F), medium (M), slow (S), partitioning only (P), and multi-alcohol (MA) and three additional reactive species (glyoxal, methylglyoxal, and epoxydiols).
In UNIPAR-CB6r3, the UNIPAR model is coupled with the CB6r3 mechanism (Yarwood et al., 2010) that is used in air quality models. The CB6r3 mechanism has been frequently used to predict the ozone formation by using a unique lumping species (Yarwood et al., 2005, 2010) but is limited to consider the physicochemical properties of oxygenated products, which are necessary to process SOA formation. In CB6r3, the reaction of toluene or benzene with an OH radical is explicitly expressed. In order to obtain ΔHC from each aromatic HC, the reactions of other aromatic HCs (i.e., ethylbenzene, propylbenzene, 3 xylene isomers, and 3 trimethylbenzene isomers) with an OH radical were explicitly treated by using individual reaction rate constants (Table S1 in the Supplement). In this study, ΔHC, [RO2], and [HO2] are obtained from CB6r3 and incorporated with predetermined polynomial equations to determine the αi array as a function of ratios and an aging scale (Fig. 1). These equations are mathematically derived by using explicit products predicted from MCM v3.3.1. The gas concentration (Cg,i) of lumping species, i, is estimated by multiplying ΔHC by dynamically predicted αi (Zhou et al., 2019). The physicochemical parameter arrays (MWi, O:Ci, and HBi) are unified by using 51 lumping species for 10 different aromatic HCs and they are applied to estimate multiphase partitioning and aerosols' medium properties.
3.2 Multiphase partitioning
The gas products produced from the atmospheric oxidation of precursor HCs partition onto both organic and inorganic phase (Cor,i and Cin,i, respectively). Cor,i and Cin,i are incorporated into in-particle chemistry to form OMAR (Fig. 1). In this model, the gas–particle partitioning processes are assumed as an equilibrium partitioning process based on the absorptive partitioning theory (Pankow, 1994), which assumes that the gas–particle partitioning instantaneously reaches equilibrium to distribute the gas products into the gas, organic, and inorganic phases.
The partitioning coefficient of i into the organic phase (Kor,i) and inorganic phase (Kin,i) is determined by the traditional absorptive partitioning theory (Pankow, 1994) as follows:
where MWor (g mol−1) is the molecular weight of OMT, R (8.314 ) is the ideal gas constant, and T (K) is the temperature. γor,i is the activity coefficient of i in organic phase. MWin is the averaged molecular weight of inorganic aerosol, and γin,i is the activity coefficient of i in inorganic phase. γor,i is assumed as unity, while γin,i is semi-empirically estimated with a polynomial equation, determined by fitting the γin,i estimated by the aerosol inorganic–organic mixtures functional groups activity coefficient (AIOMFAC) (Zuend et al., 2011):
where RH is relative humidity (%), and FS (fractional sulfate, FS = ) is the concentration ratio of total sulfate to the sum of total sulfate and ammonium ions in aerosol (Zhou et al., 2019). In the model, FS, introduced to determine aerosol acidity, ranges from 0.334 for AS to 1 for SA. To simulate the gasoline SOA, a unified matrix of MWi, O:Ci, and HBi for 51 lumping species was applied to the SOA prediction from 10 different aromatic HCs, which are the compositions of gasoline vapor.
3.3 OMAR: SOA growth via aerosol-phase reactions
OMAR is produced via oligomerization in both organic and inorganic phases, as described in previous studies (Im et al., 2014; Zhou et al., 2019). OMAR is estimated as a second-order reaction product from condensed organics based on the assumption of a self-dimerization reaction of organic compounds in media (Odian, 2004):
where and are the concentration of i in the organic and inorganic aerosol phases (mol L−1), respectively. The reaction rate constants in the aqueous phase (kAC,i) and organic phase (ko,i) are determined:
where kAC,i is semi-empirically defined as a function of Ri, the protonation equilibrium constant (), excess acidity (X) (Cox and Yates, 1979; Jang et al., 2006), water activity (aw), and the proton concentration [H+] (Im et al., 2014; Zhou et al., 2019). ko,i is determined without the X, aw, and [H+] terms because aw, [H+], and X converged to zero in the absence of wet inorganic seed. In our previous work (Jang et al., 2005, 2006), a second-order kAC,i () was described via a rate-determining step for polymerization to form polyacetal. ko,i is determined by extrapolating kAC,i to the neutral condition in the absence of salted aqueous solution to process oligomerization in the organic phase.
SOA formation in the aqueous phase may not be affected by viscosity because of abundant water molecules, while SOA formation in organic phase can be impacted by viscosity. In the traditional SOA models, it is often assumed that the equilibrium in gas–particle partitioning is rapidly achieved. However, studies have shown the relatively long characteristic time of less volatile organic species onto the semi-solid particle to reach equilibrium (Shiraiwa and Seinfeld, 2012; Shiraiwa et al., 2011). In general, the higher viscosity appears with an organic compound with the higher MW (Koop et al., 2011). Although the high O:C ratio (higher polarity) can increase viscosity, polar aerosol can absorb water in some degree at high humidity increasing fluidity. Studies have shown that viscosity can also influence chemical reaction rate, limited by slow bulk diffusion within a particle (De Schrijver and Smets, 1966; Reid et al., 2018). In the current knowledge, it is difficult to distinguish the impact of viscosity on the partitioning process from that on reaction rates. In this study, the impact of aerosol viscosity on SOA formation was related to heterogeneous reactions in the organic phase by controlling their reaction rate constant. The sigmoidal functions for MWor and O:C are involved in ko,i to consider the viscosity of organic aerosol.
3.4 OMP: SOA formation via partitioning
It is assumed that gas–organic partitioning is governed by Raoult's law in that the saturation vapor pressure of the species is dependent on the mole fraction of the species in the solution. To consider the subtracted mass in total concentration () of i by oligomerization, OMP is recalculated after OMAR integration with the partitioning model (Schell et al., 2001) which is reconstructed by including OMAR (Cao and Jang, 2010). OMP is estimated from CT,i using a mass balance equation and solved by the Newton–Raphson method (Press et al., 1992):
where () is the effective saturation concentration of i, OM0 (mol m−3) is the pre-existing OM concentration, and MWoli,i (g mol−1) is the molecular weight of the dimer.
3.5 Model parameters in the absence of GWP bias
The model parameters inherited from chamber-generated SOA mass can be biased and increase inaccuracy in prediction of SOA mass in ambient air. In this study, the UNIPAR-CB6r3 simulation was performed with the model parameters that were not biased by GWP. Regardless of the absence or the presence of GWP, the prediction of OMP is approached by a fundamental partitioning theory. The modification was mainly made for the model parameters associated with aerosol-phase reaction rate constants of lumping species (i.e., ko,i). Consequently, the change in OMAR, predicted with the new model parameters, modulates OMP (Fig. 1).
In order to establish ko,i in the absence of GWP on the model, UNIPAR was integrated with explicit gas mechanisms (MCM v3.3.1) and the GWP model (UNIPAR-GWP, in Sect. S2) (Han and Jang, 2020). Multiphase HC reactions, including gas-phase oxidation, gas–particle partitioning, aerosol-phase reactions in the organic phase and inorganic aqueous phase, and GWP, were kinetically treated in the model (Fig. S2) by using the absorption rate constants (konw) and desorption rate constants (koffw) of organic species i, in wall (w) phases. In UNIPAR-GWP, the GWP processes were predicted with GWP model parameters (organic vapor–wall partitioning and its accommodation coefficient) and the chamber-specific characteristics (chamber dimension and the organic matter concentration on the wall). The QSAR approach that employed organic physicochemical parameters facilitated the derivation of the semi-empirical polynomial model to predict GWP model parameters, as described in the previous study (Han and Jang, 2020). The ko,i values were amended to predict aromatic SOA by using UNIPAR-GWP against chamber-generated data. The amended ko,i was then applied to the UNIPAR-CB6r3 model to predict the gasoline SOA formation potential in this study.
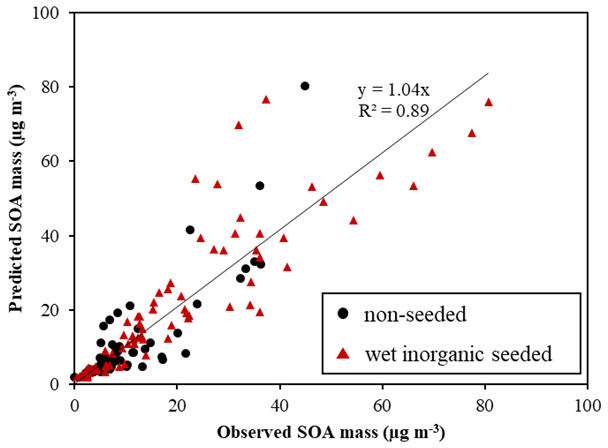
Figure 2The linearity of predicted SOA mass (µg m−3) using UNIPAR-CB6r3 and observed SOA mass (µg m−3) in the absence and the presence of wet inorganic seed. SOA mass was produced via the photooxidation of various aromatic HCs (Table S2) in the UF-APHOR chamber.
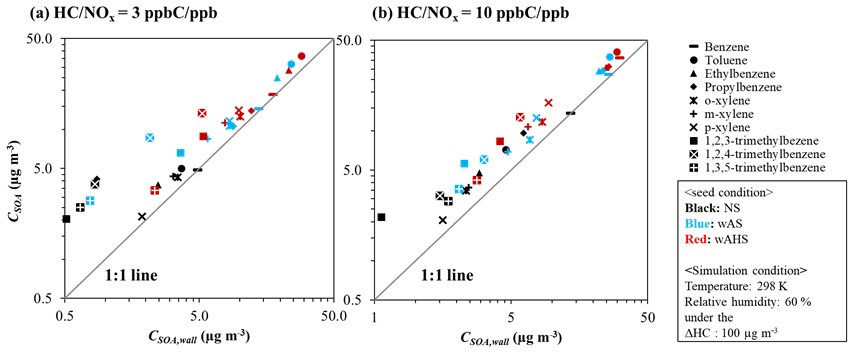
Figure 3The simulated CSOA and CSOA,wall for 10 different aromatic HCs at the given reference conditions. The SOA formation is simulated at the 298 K and 60 % at a given sunlight intensity (Fig. S5a). The concentration of initial HC is determined to consume 100 µg m−3 of HC at 17:00 EST. The initial HC ppb C/NOx ppb sets to 3 and 10 for high NOx level and low NOx level, respectively. SOA masses are also obtained at 17:00 EST. The color of the symbol indicates the seed conditions: black, blue, and red for non-seeded (NS), wet ammonium sulfate (wAS), and wet ammonium hydrogen sulfate (wAHS), respectively.
4.1 Aromatic SOA simulation with UNIPAR-CB6r3
The gasoline fuel is the mixture of various HCs including aromatics, alkenes, alkanes, and ethanol. It has been known that the photooxidation of aromatic HCs in the presence of NOx mainly attributes to gasoline SOA (Gentner et al., 2017). Thus, the feasibility of UNIPAR-CB6r3 was evaluated for the prediction of the SOA formation from photooxidation of aromatic HCs in gasoline against chamber-generated SOA data (Table S2). In Fig. 2, the simulation was plotted against chamber-generated SOA mass produced from the photooxidation of 10 different aromatic HCs under various experimental conditions (Table S2). Overall, the predicted SOA mass with UNIPAR-CB6r3 in the presence of GWP agreed well with the observed SOA mass (slope of 1.04 and R2 = 0.89). Figure S3 illustrates the simulated (solid line) and observed (symbol) concentration of NO, NO2, O3, and HC over the course of the experiment. Figure S4 shows a time profile of simulated OMT (solid line), simulated OMAR (dotted line), and observed SOA data (symbol) over the course of the chamber experiment. A significant contribution of OMAR to OMT suggests an importance of heterogeneous reactions in SOA formation. The oligomers in SOA formed from photooxidation of precursor HCs in chambers and the ambient air has been identified as a considerable fraction in the SOA mass (Kalberer et al., 2004, 2006; Tolocka et al., 2004; Gross et al., 2006; Hallquist et al., 2009).
To characterize the impact of GWP on aromatic SOA formation, the aromatic SOA mass (CSOA, µg m−3) in the absence of GWP bias was plotted vs. the aromatic SOA mass (CSOA,wall, µg m−3) predicted in the presence of the GWP (Fig. 3). The SOA formation was simulated at (a) high NOx level ( = 3 ppb C ppb−1) and (b) low NOx level ( = 10 ppb C ppb−1) at the given reference conditions (298 K, 60 % RH) under the specific sunlight intensity measured on 19 June 2015 (Fig. S5a). In Fig. 3, the more deviated plot from the 1:1 line indicates the larger impact of GWP on SOA formation. The impact of GWP on SOA formation differs with oxidation product distributions according to volatility and reactivity. The estimated konw,i of i to the chamber wall was ∼ 5 × 10⁻⁴ s−1 for UF-APHOR chamber. Similar to OMP, the impact of GWP on SOA formation is significant in the HCs with low volatile products. The HC with the higher impact of OMAR on OMT is less influenced by GWP. The characteristic time of aerosol-phase reactions that lead OMAR is generally shorter than that of GWP (Han and Jang, 2020). In the UNIPAR model, the formation of OMAR is irreversible to form non-volatile oligomer products. Benzene SOA, which is mainly attributed to OMAR, was little influenced by GWP. The oxygenated products from benzene are highly reactive in the aerosol phase, leading a high contribution of OMAR to OMT, but they are volatile, lowering OMP as well as the impact of GWP. In the case of a high NOx level, SOA mass from the photooxidation of benzene increased by a factor of 1.04 after GWP correction, which is insignificant compared to other aromatic HCs which can produce 1.14–4.75 times higher SOA mass in the absence of GWP impact. The impact of GWP on SOA formation in the presence of inorganic seed (wAHS in red and wAS in blue) was significantly lower than that without the wet inorganic seed (black). In the presence of wet seed, plots are much less deviated from the 1:1 line as seen in Fig. 3 in comparison to non-seeded SOA. The CSOA to CSOA,wall ratio is higher under the NS condition (∼ 4.75) than that in the presence of wAHS (∼ 2.54). This tendency agreed with the previously reported results (Krechmer et al., 2020; Zhang et al., 2014). The SOA formation pathway via aqueous reactions of organic products shows little sensitivity to GWP.
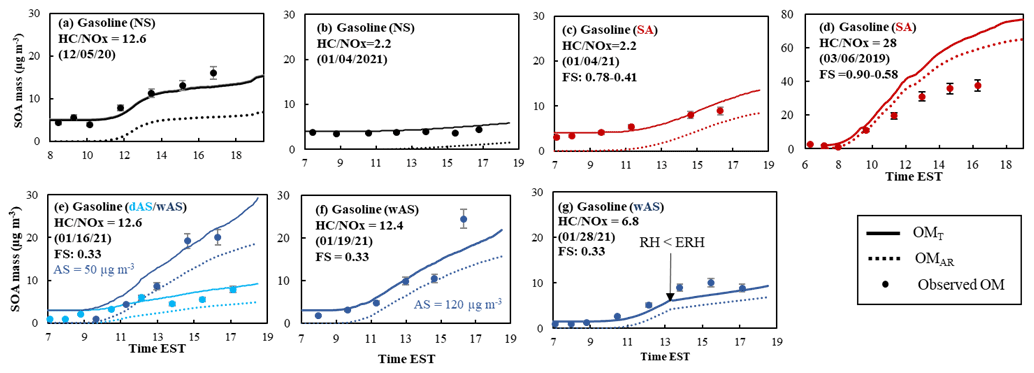
Figure 4Observed (symbol) and simulated SOA mass using UNIPAR-CB6r3 (line) for the photooxidation of gasoline vapor at different NOx levels. SOA mass concentrations are corrected for the particle loss to the chamber wall. The simulated OMT (solid line) and OMAR (dotted line) are also illustrated. The error (9 %) associated with SOA mass was estimated with the instrumental uncertainty in the OC/EC analyzer. SOA mass was produced via the photooxidation of gasoline vapor (Table 1) in the UF-APHOR chamber. The averaged deviations of simulation from experimental data are (a) 2 %, (b) −14 %, (c) −32 %, (d) −22 % and −24 %, (e) −10 %, and (f) 10 %.

Figure 5The comparison of gasoline SOA mass (CSOA,wall) in the presence of GWP and gasoline SOA mass (CSOA) in the absence of GWP. SOA formation was simulated using UNIPAR-CB6r3 for the photooxidation of gasoline vapor at given experimental conditions (Table 1).
4.2 Gasoline SOA simulation with UNIPAR-CB6r3
Figure 4 shows the time profiles of simulated OMT (solid line), OMAR (dotted line), and observed organic matter (symbols) under the experimental conditions summarized in Table 1. Overall, the gasoline SOA mass predicted by UNIPAR-CB6r3 in the presence of wall agrees with SOA mass generated in UF-APHOR under varying NOx levels and seed conditions. Similar to aromatic SOA (Fig. S4), gasoline SOA formation was dominated by OMAR. SOA mass at the low NOx level is higher than that at the high NOx level (Fig. 4a vs. b), causing higher contribution of OMP to the higher OMT. At the high NOx level, organonitrates and peroxyacetyl nitrate are produced via the reaction of a peroxy radical (RO2) with NO2. Additionally, at the high NOx level, atmospheric processes yield fewer highly volatile chemical species (i.e., carbonyls, hydroxy carbonyls) (Hallquist et al., 2009) because OH radicals tend to react with NO2 to form HNO3.
A significant enhancement of gasoline SOA mass was observed in the presence of acidic seed (Fig. 4b vs. c) or wet seed (Fig. 4e). The electrolytic inorganic particle can contain a significant amount of aerosol water above efflorescence RH (ERH) or deliquescence RH (DRH). When the inorganic aerosol is wet, reactive organic species can heterogeneously react in the aqueous phase and increase SOA mass. The UNIPAR-CB6r3 model simulation shows the importance of aqueous reactions of reactive organic products to increase SOA mass. In the current model, produced gasoline SOA mass is not subtracted from the gas phase. Thus, the model can cause inaccuracy particularly for a high-yield SOA system. For example, the gasoline SOA yield in the presence of acidic seed under the low NOx level is high, and this presumably would cause the overestimation of SOA mass as seen in Fig. 4d.
The gasoline SOA was produced in the presence of different amounts of wAS (excluding water mass) as 50 µg m−3 (Fig. 4e) and 120 µg m−3 (Fig. 4f). However, the influence of the concentration of wAS is trivial in both simulation and observations. This tendency indicates that a certain quantity of wAS is enough to rapidly progress aqueous reactions of reactive organic species. Figure 4g demonstrates the impact of the aerosol phase on SOA formation, showing a significantly different SOA growth rate after 13:00 EST where RH dropped lower than ERH (changing from wAS to dAS).
Figure 5 shows the impact of GWP on chamber-generated SOA (Table 1). Similar to aromatic SOA, the impact of GWP on SOA is greater with the higher NOx level because peroxyacyl nitrates and organonitrates, which are little reactive in aerosol phase, can attribute to SOA mass (Fig. 5a vs. b). In the presence of acidic seed (Fig. 5c) or wAS (Fig. 5d), gasoline SOA formation is less affected by GWP.
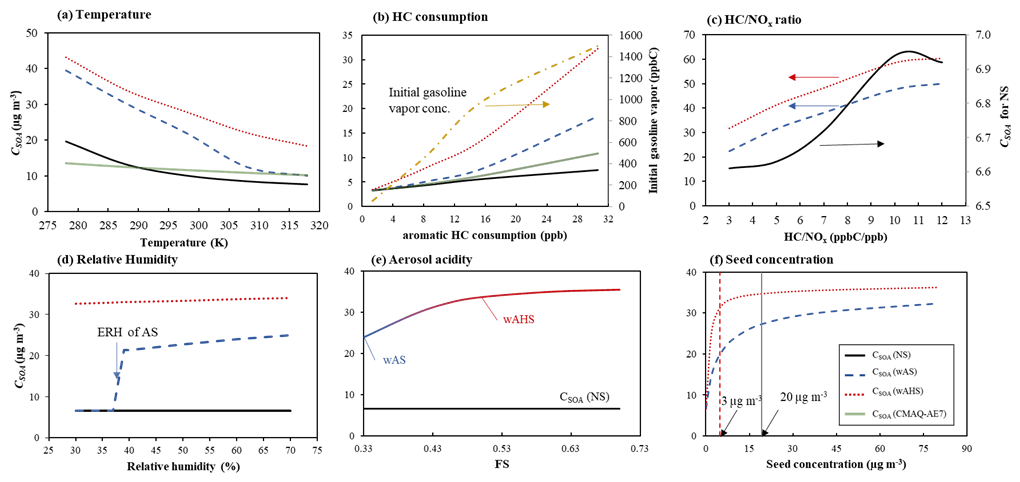
Figure 6Sensitivities of simulated gasoline SOA mass to (a) temperature, (b) aromatic HC consumption, (c) ratio, (d) relative humidity, (e) aerosol acidity, and (f) seed concentrations. SOA mass is simulated at the high NOx level ( = 3 ppb C ppb−1) under given reference conditions (298 K, 60 % RH, and 1500 ppb C of gasoline vapor) under the specific sunlight intensity measured on 19 June 2015 (Fig. S5a). The concentrations of OM0 and inorganic seed are 3 and 10 µg m−3, respectively. The simulated SOA mass using UNIPAR-CB6r3 was compared to that using CMAQ-AE7 module in panels (a) and (b).
The UNIPAR-CB6r3 model simulation (Fig. 4a and b) in the presence of GWP was compared to that predicted with CMAQ-AE7, as seen in Fig. S6. For SOA formation via gas–particle partitioning of semi-volatile compounds in CMAQ-AE7, four surrogate compounds produced from anthropogenic precursors (i.e., aromatic HCs, long chain alkanes, and polycyclic aromatic hydrocarbons) are employed (Qin et al., 2021). The non-volatile species that are predominantly present in particle phase are also included. The first-order oligomerization reaction of organic species is included in gas mechanisms. A distinguishable difference between two models is oligomeric fraction in SOA mass. A small fraction of SOA mass predicted with CMAQ-AE7 (Fig. S6) is attributed to oligomeric matter (∼ 10 %), while SOA mass predicted with UNIPAR-CB6r3 (Fig. 4) is dominantly attributed to OMAR (∼ 80 %). Laboratory studies report that 25 % to 80 % of SOA mass is oligomeric matter (Hallquist et al., 2009; Hall IV and Johnston, 2011; Kalberer et al., 2006). For the ozonolysis of α-pinene, Hall and Johnston reported that the weight percentage of oligomers was estimated to be more than 50 % (Hall IV and Johnston, 2011). The oligomeric fraction in 1,3,5-trimethylbenzene SOA was reported as 50 %–60 % after 5–6 h and increased up to 80 % after 25 h (Kalberer et al., 2006).
4.3 Sensitivity and uncertainties
Figure 6 simulates the sensitivity of gasoline SOA to environmental variables (temperature, initial gasoline vapor concentration, RH, aerosol acidity, and seed concentration). The SOA mass that predicted different environmental conditions were compared to that of the predicted at the given reference condition (60 % RH, 298 K, and = 3 ppb C ppb−1) under the sunlight intensity measured on 19 June 2015 (Fig. S5a). The wet inorganic seed concentration was 10 µg m−3, and the preexisting organic matter concentration was 3 µg m−3. The initial gasoline vapor concentration was 1500 ppb C. In addition to the UNIPAR-CB6r3 simulation, the SOA formation was also predicted by the aerosol module in CMAQ-AE7.
In Fig. 6a, the sensitivity of SOA formation to temperature was simulated between 278 and 318 K. Gas–particle partitioning of reactive organic products increases with decreasing temperature, and consequently SOA formation via aqueous reaction increases. There, the high sensitivity of SOA growth to temperature appears with wet seed aerosol compared to non-seeded SOA. The SOA simulation with the CMAQ-AE7 module shows a little sensitivity to temperature compared to the UNIPAR-CB6r3 simulation. Gasoline SOA formation was simulated with various initial concentrations of gasoline vapor ranging from 50 to 1500 ppb C. The SOA mass was plotted to the consumption of aromatic HCs at a given initial gasoline vapor concentration in Fig. 6b. The consumption of aromatic HC is not linearly related to the initial gasoline vapor concentration. The SOA mass shows a curved shape, indicating the partitioning contribution on the SOA growth. At the maximum SOA yield, the constant slope appears. Figure 6c illustrates the impact of NOx levels on gasoline SOA formation. All three simulated SOA masses are negatively correlated to NOx levels as seen in several studies (Zhou et al., 2019; Im et al., 2014). The SOA formation in the presence of aqueous salted solution gradually increases with higher ratios (low NOx levels). In the absence of seed, SOA mass increases with a shape of a sigmoidal curve.
The impact of RH on gasoline SOA formation was simulated using UNIPAR-CB6r3 for different seed conditions under the assumption of LLPS between the organic and the inorganic phases (Fig. 6d). Currently, there is no process to predict aromatic SOA formation in salted solution in CMAQ-AE7. In the presence of wAS, a relatively large decrease in SOA yields appeared when the inorganic aerosol was effloresced at ERH (37 % of ammonium sulfate, Tang and Munkelwitz, 1994). Within our simulation ranges (RH > 30 %), AHS has no phase transition. As reported in previous work (Zhou et al., 2019), SOA formation in the LLPS mode has little sensitivity to RH above ERH.
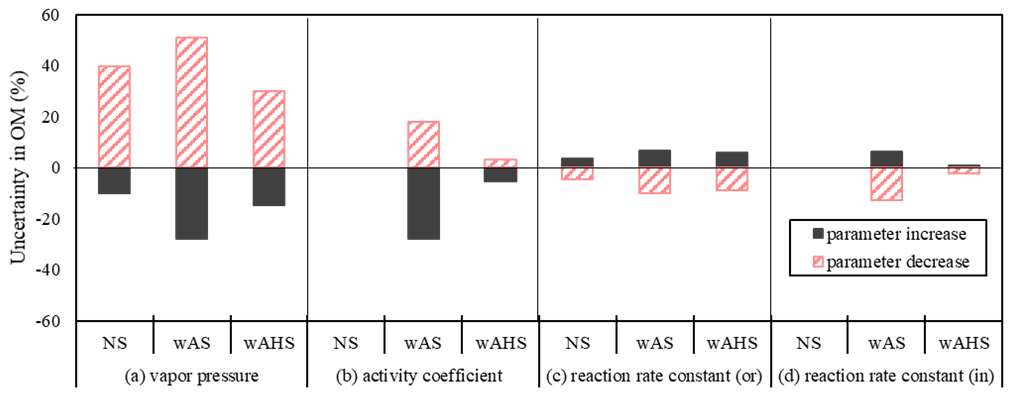
Figure 7Uncertainties in UNIPAR-CB6r3 simulated gasoline SOA mass due to model parameters: (a) vapor pressure (PL,i), (b) activity coefficient in inorganic phase (γin), (c) aerosol-phase reaction rate constant in organic phase (ko), and (d) aqueous-phase reaction rate constant (kAC). The errors associated with PL,i, kAC, and ko were estimated by increasing and decreasing the factors by 150 % and 50 %. The uncertainties associated with γin were estimated through increasing and decreasing γin by 200 % and 50 %, respectively. The SOA formation was simulated at the high NOx level ( = 3 ppb C ppb−1) under the given reference conditions (298 K, 60 % RH, and 1500 ppb C of gasoline vapor) under the specific sunlight intensity measured on 19 June 2015 (Fig. S5a). The concentration of pre-existing organic matter and inorganic seed was 3 and 10 µg m−3, respectively.
As seen in Fig. 6e, aerosol acidity accelerates SOA growth via acid-catalyzed reactions of organic products (Jang et al., 2002). The efficiency of aerosol acidity on SOA growth differs in NOx levels and HC ppb/seed mass. The impact of aerosol acidity is limited by the amount of reactive organic products. At our simulation condition, gasoline SOA growth shows a plateau (at 80 % of maximum SOA mass) as seen in Fig. 6e, and weak acidity is enough to lead to the maximum acidity effect. The effect of the quantity of wet seed (wAS and wAHS) on SOA formation is represented in Fig. 6f. SOA mass drastically increases with increasing wAS when the wAS mass concentration is less than 20 µg m−3. In a similar manner to aerosol acidity, SOA formation reaches a plateau because heterogeneous reactions are limited to the quantity of reactive organic compounds. In the presence of AHS, SOA formation more quickly reaches a plateau (5 µg m−3 of AHS) than that with wAS.
Figure 7 represents the uncertainties of the SOA prediction caused by the uncertainties in the major model parameters (, γin,i, ko,i, and kAC,i) in the absence of GWP. At given conditions, γw,i and are more significantly influential on SOA prediction than ko,i, and kAC,i. The uncertainty in was reported as a factor of 1.45 based on the group contributions (Myrdal and Yalkowsky, 1997; Zhao et al., 1999). The gasoline SOA mass was influenced from −25 % to 50 % by increasing/decreasing as a factor of 1.5/0.5. The uncertainty associated with γin,i ranged from −28 % to 18 % by increases/decreases of a factor of 2/0.5. The estimated uncertainties of gasoline SOA from ko,i and kAC,i are relatively as small as −13 % to 9 % by increasing/decreasing them as a factor of 1.5/0.5.
In this study, the gasoline SOA formation potential was simulated by using the UNIPAR-CB6r3 model under varying NOx levels and seed conditions. UNIPAR-CB6r3 has a mechanism to predict SOA formation via CB6r3 gas mechanisms, gas–particle partitioning, and heterogeneous reaction in the absence of GWP bias. Through the model simulation, we conclude that both heterogeneous reactions in the salted aqueous phase and the implementation of model parameters corrected for GWP are critical to accurately predict SOA mass. For example, SOA mass in Fig. 5 increases up to 1.8 times by using the corrected model parameter on account of GWP bias. As seen in Fig. 6e and f (model sensitivity to seed conditions), SOA mass increases by a factor of 3 by including 10 µg m−3 of wAS at 60 % RH, in comparison to non-seeded SOA mass. The concentrations of SO2 and sulfate have been rapidly declining due to innovative technologies and governmental efforts (Aas et al., 2019). However, the impact of the salted aqueous phase on SOA growth can be achieved even with a relatively small quantity of inorganic seed. For example, SOA formation from the photooxidation of 1500 ppb C of gasoline vapor can reach a plateau of 3–4 times higher organic mass with 5 µg m−3 of wAHS or 20 µg m−3 of wAS (Fig. 6f) under the high NOx level.
Electrolytic inorganic salts are ubiquitous in an urban atmosphere, because sulfate and nitrate are produced by the atmospheric oxidation of anthropogenic SO2 and NOx, respectively (Finlayson-Pitts and Pitts, 1999). However, most current SOA modules are able to simulate SOA formation via aqueous reactions only for a few reactive organic species (i.e., epoxydiol, glyoxal, and methylglyoxal). Numerous chemical species originating from the atmospheric oxidation of various precursors can be involved in aqueous reactions to form SOA. For example, the glyoxal fraction of the simulated gasoline SOA mass in Fig. 4e in the presence of wAS was about 40 %, the methylglyoxal fraction was about 1 %, and OMP was 26 %. The remaining 23 % associated with OMAR indicates a significant contribution of heterogeneous reactions of the reactive organic species other than glyoxal and methylglyoxal.
The liquid water content of PM2.5 is high during regionally (i.e., eastern US) and seasonally (i.e., summer) humid conditions (Carlton et al., 2020). High humidity can shift the partitioning of hydrophilic organic gases toward the coexisting inorganic salted solution than to the organic phase, enhancing SOA growth via aqueous-phase reactions (Carlton and Turpin, 2013). When inorganic salt reaches the DRH (80 % for AS, Brooks et al., 2002), reactive organic species undergo aqueous-phase reactions to form SOA. During warm periods at night, inorganic salts can often be deliquesced in the eastern US and remain in aqueous solution above ERH. In arid areas where inorganic salts can be effloresced, SOA formation is depressed. Evidently, many field studies and model simulations have shown the greater amounts of SOA formation in eastern US in the summertime (Malm et al., 2017; Kelly et al., 2018), suggesting the important role of aqueous reactions on SOA formation.
In this study, the aerosol phase state is assumed to be LLPS for gasoline SOA formation in the presence of inorganic seed, because of hydrophobicity of some gasoline oxygenated products. The inorganic/organic mixed aerosol in the urban atmosphere, where automobile exhaust emissions and industrial solvents are abundant, may be governed in LLPS. Unlike the SOA originating from aromatics and terpenes, isoprene SOA is very polar and possibly mixes with electrolytic aqueous solution to form a homogeneously mixed phase under the high humidity (Beardsley and Jang, 2016; Bertram et al., 2011). However, isoprene is not the only precursory HC to form SOA. For example, terpene, a biogenic HC, can coexist and form much less polar products than isoprene. The determination of the aerosol phase state is still controversial due to complex chemistry and precursors. LLPS likely appears in most urban areas and the regions that are influenced by high terpene emissions. In general, the atmospheric aging process increases the polarity and oligomeric matter in aerosol. Increased polarity increases organic solubility in the salted aqueous phase. However, oligomer is relatively unfavorable to be mixed with the salted aqueous phase, in comparison to the low MW organics, because oligomers require a large combinational energy for mixing with small water molecules (Barton, 2017).
The organic products consumed to form SOA can influence gas mechanisms, although their quantity is little. Highly reactive organic species (i.e., glyoxal and multifunctional products in groups VF and F) for heterogeneous chemistry to form SOA can also be quickly photolyzed in the gas phase. Thus, the consumed organics to form SOA can possibly influence concentrations of atmospheric oxidants and radicals. However, most SOA models including UNIPAR-CB6r3 are not capable of connecting carbon depletion to gas mechanisms due to SOA formation. This issue would potentially introduce inaccuracy in gas oxidation and aerosol prediction. Though the explicit approach (including detailed gas oxidation mechanisms, partitioning, and in-particle chemistry formation) is complex and time demanding, it improves a mass balance of organic products in multiphase reactions. In UNIPAR-CB6r3, the mathematical equations associated with stoichiometric coefficients of lumping species and their physicochemical parameters are inherited from explicit gas mechanisms. Thus, the model uncertainty can be caused by missing mechanisms in the gas phase. Additionally, the unidentified aerosol chemistry causes inaccuracy in SOA prediction and interpretation of aerosol formation mechanisms. For example, a recent study showed that the autoxidation of oxidized products can yield highly oxidized matter and increase SOA mass for certain precursors (i.e., terpenes) (Bianchi et al., 2019; Pye et al., 2019). Cross reactions between RO2 radicals can form accretion products (ROOR') with a low vapor pressure (Berndt et al., 2018).
Code to run the SOA model in this study is available upon request.
The chamber data and simulated results used in this study are available upon request.
The supplement related to this article is available online at: https://doi.org/10.5194/acp-22-625-2022-supplement.
MJ designed the experiments, and MJ and SH carried them out. SH prepared the manuscript with contributions from MJ.
The contact author has declared that neither they nor their co-author has any competing interests.
Publisher's note: Copernicus Publications remains neutral with regard to jurisdictional claims in published maps and institutional affiliations.
This research has been supported by the National Science Foundation (grant no. AGS1923651), the National Research Foundation of Korea (grant no. 2020M3G1A1114556), and the National Institute of Environmental Research (grant no. NIER-2020-01-01-010).
This paper was edited by Arthur Chan and reviewed by two anonymous referees.
Aas, W., Mortier, A., Bowersox, V., Cherian, R., Faluvegi, G., Fagerli, H., Hand, J., Klimont, Z., Galy-Lacaux, C., and Lehmann, C. M.: Global and regional trends of atmospheric sulfur, Sci. Rep.-UK, 9, 1–11, 2019.
Appel, K. W., Napelenok, S. L., Foley, K. M., Pye, H. O. T., Hogrefe, C., Luecken, D. J., Bash, J. O., Roselle, S. J., Pleim, J. E., Foroutan, H., Hutzell, W. T., Pouliot, G. A., Sarwar, G., Fahey, K. M., Gantt, B., Gilliam, R. C., Heath, N. K., Kang, D., Mathur, R., Schwede, D. B., Spero, T. L., Wong, D. C., and Young, J. O.: Description and evaluation of the Community Multiscale Air Quality (CMAQ) modeling system version 5.1, Geosci. Model Dev., 10, 1703–1732, https://doi.org/10.5194/gmd-10-1703-2017, 2017.
Appel, K. W., Bash, J. O., Fahey, K. M., Foley, K. M., Gilliam, R. C., Hogrefe, C., Hutzell, W. T., Kang, D., Mathur, R., Murphy, B. N., Napelenok, S. L., Nolte, C. G., Pleim, J. E., Pouliot, G. A., Pye, H. O. T., Ran, L., Roselle, S. J., Sarwar, G., Schwede, D. B., Sidi, F. I., Spero, T. L., and Wong, D. C.: The Community Multiscale Air Quality (CMAQ) model versions 5.3 and 5.3.1: system updates and evaluation, Geosci. Model Dev., 14, 2867–2897, https://doi.org/10.5194/gmd-14-2867-2021, 2021.
Baker, K. R., Carlton, A. G., Kleindienst, T. E., Offenberg, J. H., Beaver, M. R., Gentner, D. R., Goldstein, A. H., Hayes, P. L., Jimenez, J. L., Gilman, J. B., de Gouw, J. A., Woody, M. C., Pye, H. O. T., Kelly, J. T., Lewandowski, M., Jaoui, M., Stevens, P. S., Brune, W. H., Lin, Y.-H., Rubitschun, C. L., and Surratt, J. D.: Gas and aerosol carbon in California: comparison of measurements and model predictions in Pasadena and Bakersfield, Atmos. Chem. Phys., 15, 5243–5258, https://doi.org/10.5194/acp-15-5243-2015, 2015.
Barton, A. F.: CRC handbook of solubility parameters and other cohesion parameters, Routledge, https://doi.org/0.1201/9781315140575, 2017.
Beardsley, R. L. and Jang, M.: Simulating the SOA formation of isoprene from partitioning and aerosol phase reactions in the presence of inorganics, Atmos. Chem. Phys., 16, 5993–6009, https://doi.org/10.5194/acp-16-5993-2016, 2016.
Berndt, T., Scholz, W., Mentler, B., Fischer, L., Herrmann, H., Kulmala, M., and Hansel, A.: Accretion product formation from self-and cross-reactions of RO2 radicals in the atmosphere, Angew. Chem. Int. Edit., 57, 3820–3824, 2018.
Bertram, A. K., Martin, S. T., Hanna, S. J., Smith, M. L., Bodsworth, A., Chen, Q., Kuwata, M., Liu, A., You, Y., and Zorn, S. R.: Predicting the relative humidities of liquid-liquid phase separation, efflorescence, and deliquescence of mixed particles of ammonium sulfate, organic material, and water using the organic-to-sulfate mass ratio of the particle and the oxygen-to-carbon elemental ratio of the organic component, Atmos. Chem. Phys., 11, 10995–11006, https://doi.org/10.5194/acp-11-10995-2011, 2011.
Bianchi, F., Kurten, T., Riva, M., Mohr, C., Rissanen, M., Roldin, P., Berndt, T., Crounse, J., Wennberg, P., Mentel, T., Wildt, J., Junninen, H., Jokinen, T., Kulmala, M., Worsnop, D., Thornton, J., Donahue, N., Kjaergaard, H., and Ehn, M.: Highly Oxygenated Organic Molecules (HOM) from Gas-Phase Autoxidation Involving Peroxy Radicals: A Key Contributor to Atmospheric Aerosol, Chem. Rev., 119, 3472–3509, https://doi.org/10.1021/acs.chemrev.8b00395, 2019.
Brooks, S. D., Wise, M. E., Cushing, M., and Tolbert, M. A.: Deliquescence behavior of organic/ammonium sulfate aerosol, Geophys. Res. Lett., 29, 23-21–23-24, 2002.
Brune, W. H.: The Chamber Wall Index for Gas–Wall Interactions in Atmospheric Environmental Enclosures, Environ. Sci. Technol., 53, 3645–3652, 2019.
Cao, G. and Jang, M.: An SOA model for toluene oxidation in the presence of inorganic aerosols, Environ. Sci. Technol., 44, 727–733, 2010.
Cappa, C. D., Jathar, S. H., Kleeman, M. J., Docherty, K. S., Jimenez, J. L., Seinfeld, J. H., and Wexler, A. S.: Simulating secondary organic aerosol in a regional air quality model using the statistical oxidation model – Part 2: Assessing the influence of vapor wall losses, Atmos. Chem. Phys., 16, 3041–3059, https://doi.org/10.5194/acp-16-3041-2016, 2016.
Carlton, A. G. and Turpin, B. J.: Particle partitioning potential of organic compounds is highest in the Eastern US and driven by anthropogenic water, Atmos. Chem. Phys., 13, 10203–10214, https://doi.org/10.5194/acp-13-10203-2013, 2013.
Carlton, A. G., Bhave, P. V., Napelenok, S. L., Edney, E. O., Sarwar, G., Pinder, R. W., Pouliot, G. A., and Houyoux, M.: Model representation of secondary organic aerosol in CMAQv4. 7, Environ. Sci. Technol., 44, 8553–8560, 2010.
Carlton, A. G., Christiansen, A. E., Flesch, M. M., Hennigan, C. J., and Sareen, N.: Mulitphase Atmospheric Chemistry in Liquid Water: Impacts and Controllability of Organic Aerosol, Accounts Chem. Res., 53, 1715–1723, 2020.
Cohen, A., Brauer, M., Burnett, R., Anderson, H., Frostad, J., Estep, K., Balakrishnan, K., Brunekreef, B., Dandona, L., Dandona, R., Feigin, V., Freedman, G., Hubbell, B., Jobling, A., Kan, H., Knibbs, L., Liu, Y., Martin, R., Morawska, L., Pope, C., Shin, H., Straif, K., Shaddick, G., Thomas, M., van Dingenen, R., van Donkelaar, A., Vos, T., Murray, C., and Forouzanfar, M.: Estimates and 25-year trends of the global burden of disease attributable to ambient air pollution: an analysis of data from the Global Burden of Diseases Study 2015, Lancet, 389, 1907–1918, https://doi.org/10.1016/S0140-6736(17)30505-6, 2017.
Cox, R. A. and Yates, K.: Kinetic equations for reactions in concentrated aqueous acids based on the concept of “excess acidity”, Can. J. Chem., 57, 2944–2951, 1979.
Damian, V., Sandu, A., Damian, M., Potra, F., and Carmichael, G. R.: The kinetic preprocessor KPP-a software environment for solving chemical kinetics, Comput. Chem. Eng., 26, 1567–1579, 2002.
De Schrijver, F. and Smets, G.: Polymerization kinetics in highly viscous media, J. Polym. Sci. A1, 4, 2201–2210, 1966.
Donahue, N., Robinson, A., Stanier, C., and Pandis, S.: Coupled partitioning, dilution, and chemical aging of semivolatile organics, Environ. Sci. Technol., 40, 2635–2643, https://doi.org/10.1021/es052297c, 2006.
Dzepina, K., Cappa, C. D., Volkamer, R. M., Madronich, S., DeCarlo, P. F., Zaveri, R. A., and Jimenez, J. L.: Modeling the multiday evolution and aging of secondary organic aerosol during MILAGRO 2006, Environ. Sci. Technol., 45, 3496–3503, 2011.
Emmerson, K. M. and Evans, M. J.: Comparison of tropospheric gas-phase chemistry schemes for use within global models, Atmos. Chem. Phys., 9, 1831–1845, https://doi.org/10.5194/acp-9-1831-2009, 2009.
Ensberg, J. J., Hayes, P. L., Jimenez, J. L., Gilman, J. B., Kuster, W. C., de Gouw, J. A., Holloway, J. S., Gordon, T. D., Jathar, S., Robinson, A. L., and Seinfeld, J. H.: Emission factor ratios, SOA mass yields, and the impact of vehicular emissions on SOA formation, Atmos. Chem. Phys., 14, 2383–2397, https://doi.org/10.5194/acp-14-2383-2014, 2014.
Finlayson-Pitts, B. J. and Pitts Jr., J. N.: Chemistry of the upper and lower atmosphere: theory, experiments, and applications, Elsevier, https://doi.org/10.1016/B978-0-12-257060-5.X5000-X, 1999.
Gentner, D. R., Jathar, S. H., Gordon, T. D., Bahreini, R., Day, D. A., El Haddad, I., Hayes, P. L., Pieber, S. M., Platt, S. M., and de Gouw, J.: Review of urban secondary organic aerosol formation from gasoline and diesel motor vehicle emissions, Environ. Sci. Technol., 51, 1074–1093, 2017.
Gross, D. S., Gälli, M. E., Kalberer, M., Prevot, A. S., Dommen, J., Alfarra, M. R., Duplissy, J., Gaeggeler, K., Gascho, A., and Metzger, A.: Real-time measurement of oligomeric species in secondary organic aerosol with the aerosol time-of-flight mass spectrometer, Anal. Chem., 78, 2130–2137, 2006.
Hall IV, W. A. and Johnston, M. V.: Oligomer content of α-pinene secondary organic aerosol, Aerosol Sci. Tech., 45, 37–45, 2011.
Hallquist, M., Wenger, J. C., Baltensperger, U., Rudich, Y., Simpson, D., Claeys, M., Dommen, J., Donahue, N. M., George, C., Goldstein, A. H., Hamilton, J. F., Herrmann, H., Hoffmann, T., Iinuma, Y., Jang, M., Jenkin, M. E., Jimenez, J. L., Kiendler-Scharr, A., Maenhaut, W., McFiggans, G., Mentel, Th. F., Monod, A., Prévôt, A. S. H., Seinfeld, J. H., Surratt, J. D., Szmigielski, R., and Wildt, J.: The formation, properties and impact of secondary organic aerosol: current and emerging issues, Atmos. Chem. Phys., 9, 5155–5236, https://doi.org/10.5194/acp-9-5155-2009, 2009.
Han, S. and Jang, M.: Simulating the impact of gas-wall partitioning on SOA formation using the explicit gas mechanism integrated with aqueous reactions containing electrolytes, Sci. Total Environ., 748, 141360, https://doi.org/10.1016/j.scitotenv.2020.141360, 2020.
Hayes, P. L., Carlton, A. G., Baker, K. R., Ahmadov, R., Washenfelder, R. A., Alvarez, S., Rappenglück, B., Gilman, J. B., Kuster, W. C., de Gouw, J. A., Zotter, P., Prévôt, A. S. H., Szidat, S., Kleindienst, T. E., Offenberg, J. H., Ma, P. K., and Jimenez, J. L.: Modeling the formation and aging of secondary organic aerosols in Los Angeles during CalNex 2010, Atmos. Chem. Phys., 15, 5773–5801, https://doi.org/10.5194/acp-15-5773-2015, 2015.
Heald, C., Henze, D., Horowitz, L., Feddema, J., Lamarque, J. F., Guenther, A., Hess, P., Vitt, F., Seinfeld, J., and Goldstein, A.: Predicted change in global secondary organic aerosol concentrations in response to future climate, emissions, and land use change, J. Geophys. Res, 113, D05211, https://doi.org/10.1029/2007JD009092, 2008.
Huang, Y., Zhao, R., Charan, S., Kenseth, C., Zhang, X., and Seinfeld, J.: Unified Theory of Vapor-Wall Mass Transport in Teflon-Walled Environmental Chambers, Environ. Sci. Technol., 52, 2134–2142, https://doi.org/10.1021/acs.est.7b05575, 2018.
Im, Y., Jang, M., and Beardsley, R. L.: Simulation of aromatic SOA formation using the lumping model integrated with explicit gas-phase kinetic mechanisms and aerosol-phase reactions, Atmos. Chem. Phys., 14, 4013–4027, https://doi.org/10.5194/acp-14-4013-2014, 2014.
Jang, M., Czoschke, N., Lee, S., and Kamens, R.: Heterogeneous atmospheric aerosol production by acid-catalyzed particle-phase reactions, Science, 298, 814–817, https://doi.org/10.1126/science.1075798, 2002.
Jang, M., Czoschke, N. M., and Northcross, A. L.: Semiempirical model for organic aerosol growth by acid-catalyzed heterogeneous reactions of organic carbonyls, Environ. Sci. Technol., 39, 164–174, 2005.
Jang, M., Czoschke, N. M., Northcross, A. L., Cao, G., and Shaof, D.: SOA formation from partitioning and heterogeneous reactions: model study in the presence of inorganic species, Environ. Sci. Technol., 40, 3013–3022, 2006.
Jang, M., Sun, S., Winslow, R., Han, S., and Yu, Z.: In situ aerosol acidity measurements using a UV–Visible micro-spectrometer and its application to the ambient air, Aerosol Sci. Tech., 54, 446–461, 2020.
Jathar, S. H., Mahmud, A., Barsanti, K. C., Asher, W. E., Pankow, J. F., and Kleeman, M. J.: Water uptake by organic aerosol and its influence on gas/particle partitioning of secondary organic aerosol in the United States, Atmos. Environ., 129, 142–154, 2016.
Jenkin, M. E., Wyche, K. P., Evans, C. J., Carr, T., Monks, P. S., Alfarra, M. R., Barley, M. H., McFiggans, G. B., Young, J. C., and Rickard, A. R.: Development and chamber evaluation of the MCM v3.2 degradation scheme for β-caryophyllene, Atmos. Chem. Phys., 12, 5275–5308, https://doi.org/10.5194/acp-12-5275-2012, 2012.
Jerrett, M., Burnett, R. T., Pope III, C. A., Ito, K., Thurston, G., Krewski, D., Shi, Y., Calle, E., and Thun, M.: Long-term ozone exposure and mortality, New Engl. J. Med., 360, 1085–1095, 2009.
Jimenez, J. L., Canagaratna, M., Donahue, N., Prevot, A., Zhang, Q., Kroll, J. H., DeCarlo, P. F., Allan, J. D., Coe, H., and Ng, N.: Evolution of organic aerosols in the atmosphere, Science, 326, 1525–1529, 2009.
Kalberer, M., Paulsen, D., Sax, M., Steinbacher, M., Dommen, J., Prévôt, A. S., Fisseha, R., Weingartner, E., Frankevich, V., and Zenobi, R.: Identification of polymers as major components of atmospheric organic aerosols, Science, 303, 1659–1662, 2004.
Kalberer, M., Sax, M., and Samburova, V.: Molecular size evolution of oligomers in organic aerosols collected in urban atmospheres and generated in a smog chamber, Environ. Sci. Technol., 40, 5917–5922, 2006.
Kelly, J. M., Doherty, R. M., O'Connor, F. M., and Mann, G. W.: The impact of biogenic, anthropogenic, and biomass burning volatile organic compound emissions on regional and seasonal variations in secondary organic aerosol, Atmos. Chem. Phys., 18, 7393–7422, https://doi.org/10.5194/acp-18-7393-2018, 2018.
Koop, T., Bookhold, J., Shiraiwa, M., and Pöschl, U.: Glass transition and phase state of organic compounds: dependency on molecular properties and implications for secondary organic aerosols in the atmosphere, Phys. Chem. Chem. Phys., 13, 19238–19255, 2011.
Krechmer, J., Pagonis, D., Ziemann, P., and Jimenez, J.: Quantification of Gas-Wall Partitioning in Teflon Environmental Chambers Using Rapid Bursts of Low-Volatility Oxidized Species Generated in Situ, Environ. Sci. Technol., 50, 5757–5765, https://doi.org/10.1021/acs.est.6b00606, 2016.
Krechmer, J. E., Day, D. A., and Jimenez, J. L.: Always Lost but Never Forgotten: Gas-Phase Wall Losses Are Important in All Teflon Environmental Chambers, Environ. Sci. Technol., 54, 12890–12897, 2020.
Li, J. and Jang, M.: Aerosol acidity measurement using colorimetry coupled with a reflectance UV-visible spectrometer, Aerosol Sci. Tech., 46, 833–842, 2012.
Li, W., Li, L., Chen, C.-l., Kacarab, M., Peng, W., Price, D., Xu, J., and Cocker III, D. R.: Potential of select intermediate-volatility organic compounds and consumer products for secondary organic aerosol and ozone formation under relevant urban conditions, Atmos. Environ., 178, 109–117, 2018.
Malm, W. C., Schichtel, B. A., Hand, J. L., and Collett Jr, J. L.: Concurrent temporal and spatial trends in sulfate and organic mass concentrations measured in the IMPROVE monitoring program, J. Geophys.Res.-Atmos., 122, 10,462-410,476, 2017.
Matsunaga, A. and Ziemann, P.: Gas-Wall Partitioning of Organic Compounds in a Teflon Film Chamber and Potential Effects on Reaction Product and Aerosol Yield Measurements, Aerosol Sci. Tech., 44, 881–892, https://doi.org/10.1080/02786826.2010.501044, 2010.
McDonald, B. C., de Gouw, J. A., Gilman, J. B., Jathar, S. H., Akherati, A., Cappa, C. D., Jimenez, J. L., Lee-Taylor, J., Hayes, P. L., and McKeen, S. A.: Volatile chemical products emerging as largest petrochemical source of urban organic emissions, Science, 359, 760–764, 2018.
Myrdal, P. B. and Yalkowsky, S. H.: Estimating pure component vapor pressures of complex organic molecules, Ind. Eng. Chem. Res., 36, 2494–2499, 1997.
Odian, G.: Principles of polymerization, John Wiley & Sons, https://doi.org/10.1002/047147875X, 2004.
Odum, J., Hoffmann, T., Bowman, F., Collins, D., Flagan, R., and Seinfeld, J.: Gas/particle partitioning and secondary organic aerosol yields, Environ. Sci. Technol., 30, 2580–2585, https://doi.org/10.1021/es950943+, 1996.
Pankow, J. F.: An absorption model of the gas/aerosol partitioning involved in the formation of secondary organic aerosol, Atmos. Environ., 28, 189–193, 1994.
Pöschl, U.: Atmospheric aerosols: composition, transformation, climate and health effects, Angew. Chem. Int. Edit., 44, 7520–7540, 2005.
Press, W. H., Teukolsky, S. A., Flannery, B. P., and Vetterling, W. T.: Numerical recipes in Fortran 77: volume 1, volume 1 of Fortran numerical recipes: the art of scientific computing, Cambridge University Press, ISBN 9780521430647, 1992.
Pye, H. O., D'Ambro, E. L., Lee, B. H., Schobesberger, S., Takeuchi, M., Zhao, Y., Lopez-Hilfiker, F., Liu, J., Shilling, J. E., and Xing, J.: Anthropogenic enhancements to production of highly oxygenated molecules from autoxidation, P. Natl. Acad. Sci. USA, 116, 6641–6646, 2019.
Pye, H. O. T., Murphy, B. N., Xu, L., Ng, N. L., Carlton, A. G., Guo, H., Weber, R., Vasilakos, P., Appel, K. W., Budisulistiorini, S. H., Surratt, J. D., Nenes, A., Hu, W., Jimenez, J. L., Isaacman-VanWertz, G., Misztal, P. K., and Goldstein, A. H.: On the implications of aerosol liquid water and phase separation for organic aerosol mass, Atmos. Chem. Phys., 17, 343–369, https://doi.org/10.5194/acp-17-343-2017, 2017.
Qin, M., Murphy, B. N., Isaacs, K. K., McDonald, B. C., Lu, Q., McKeen, S. A., Koval, L., Robinson, A. L., Efstathiou, C., and Allen, C.: Criteria pollutant impacts of volatile chemical products informed by near-field modelling, Nature Sustainability, 4, 129–137, 2021.
Reid, J. P., Bertram, A. K., Topping, D. O., Laskin, A., Martin, S. T., Petters, M. D., Pope, F. D., and Rovelli, G.: The viscosity of atmospherically relevant organic particles, Nat. Commun., 9, 1–14, 2018.
Schell, B., Ackermann, I. J., Hass, H., Binkowski, F. S., and Ebel, A.: Modeling the formation of secondary organic aerosol within a comprehensive air quality model system, J. Geophys.Res.-Atmos., 106, 28275–28293, 2001.
Shah, R. U., Coggon, M. M., Gkatzelis, G. I., McDonald, B. C., Tasoglou, A., Huber, H., Gilman, J., Warneke, C., Robinson, A. L., and Presto, A. A.: Urban oxidation flow reactor measurements reveal significant secondary organic aerosol contributions from volatile emissions of emerging importance, Environ. Sci. Technol., 54, 714–725, 2019.
Shiraiwa, M. and Seinfeld, J. H.: Equilibration timescale of atmospheric secondary organic aerosol partitioning, Geophys. Res. Lett., 39, L24801, https://doi.org/10.1029/2012GL054008, 2012.
Shiraiwa, M., Ammann, M., Koop, T., and Pöschl, U.: Gas uptake and chemical aging of semisolid organic aerosol particles, P. Natl. Acad. Sci. USA, 108, 11003–11008, 2011.
Stein, S. and Brown, R.: Estimation of normal boiling points from group contributions, J. Chem. Inf. Comp. Sci., 34, 581–587, https://doi.org/10.1021/ci00019a016, 1994.
Tang, I. and Munkelwitz, H.: Aerosol phase transformation and growth in the atmosphere, J. Appl. Meteorol., 33, 791–796, 1994.
Tolocka, M., Jang, M., Ginter, J., Cox, F., Kamens, R., and Johnston, M.: Formation of oligomers in secondary organic aerosol, Environ. Sci. Technol., 38, 1428–1434, https://doi.org/10.1021/es035030r, 2004.
Turner, M. C., Jerrett, M., Pope III, C. A., Krewski, D., Gapstur, S. M., Diver, W. R., Beckerman, B. S., Marshall, J. D., Su, J., and Crouse, D. L.: Long-term ozone exposure and mortality in a large prospective study, Am. J. Resp. Crit. Care, 193, 1134–1142, 2016.
Volkamer, R., Jimenez, J., San Martini, F., Dzepina, K., Zhang, Q., Salcedo, D., Molina, L., Worsnop, D., and Molina, M.: Secondary organic aerosol formation from anthropogenic air pollution: Rapid and higher than expected, Geophys. Res. Lett., 33, L17811, https://doi.org/10.1029/2006GL026899, 2006.
Woody, M. C., Baker, K. R., Hayes, P. L., Jimenez, J. L., Koo, B., and Pye, H. O. T.: Understanding sources of organic aerosol during CalNex-2010 using the CMAQ-VBS, Atmos. Chem. Phys., 16, 4081–4100, https://doi.org/10.5194/acp-16-4081-2016, 2016.
Yarwood, G., Rao, S., Yocke, M., and Whitten, G.: Updates to the carbon bond mechanism: CB05, Report to the US Environmental Protection Agency. RT-04, 675, available at: https://camx-wp.azurewebsites.net/Files/CB05_Final_Report_120805.pdf (last access: 7 January 2022), 2005.
Yarwood, G., Jung, J., Whitten, G. Z., Heo, G., Mellberg, J., and Estes, M.: Updates to the Carbon Bond mechanism for version 6 (CB6), 9th Annual CMAS Conference, Chapel Hill, NC, 2010, 11–13, 2010.
Yeh, G. and Ziemann, P.: Gas-Wall Partitioning of Oxygenated Organic Compounds: Measurements, Structure-Activity Relationships, and Correlation with Gas Chromatographic Retention Factor, Aerosol Sci. Tech., 49, 726–737, https://doi.org/10.1080/02786826.2015.1068427, 2015.
Yu, Z., Jang, M., Zhang, T., Madhu, A., and Han, S.: Simulation of Monoterpene SOA Formation by Multiphase Reactions Using Explicit Mechanisms, ACS Earth Space Chem., 5, 1455–1467, https://doi.org/10.1021/acsearthspacechem.1c00056, 2021.
Zhang, X., Cappa, C., Jathar, S., Mcvay, R., Ensberg, J., Kleeman, M., and Seinfeld, J.: Influence of vapor wall loss in laboratory chambers on yields of secondary organic aerosol, P. Natl. Acad. Sci. USA, 111, 5802–5807, https://doi.org/10.1073/pnas.1404727111, 2014.
Zhao, L., Li, P., and Yalkowsky, S.: Predicting the entropy of boiling for organic compounds, J. Chem. Inf. Comp. Sci., 39, 1112–1116, https://doi.org/10.1021/ci990054w, 1999.
Zhou, C., Jang, M., and Yu, Z.: Simulation of SOA formation from the photooxidation of monoalkylbenzenes in the presence of aqueous aerosols containing electrolytes under various NOx levels, Atmos. Chem. Phys., 19, 5719–5735, https://doi.org/10.5194/acp-19-5719-2019, 2019.
Zuend, A., Marcolli, C., Booth, A. M., Lienhard, D. M., Soonsin, V., Krieger, U. K., Topping, D. O., McFiggans, G., Peter, T., and Seinfeld, J. H.: New and extended parameterization of the thermodynamic model AIOMFAC: calculation of activity coefficients for organic-inorganic mixtures containing carboxyl, hydroxyl, carbonyl, ether, ester, alkenyl, alkyl, and aromatic functional groups, Atmos. Chem. Phys., 11, 9155–9206, https://doi.org/10.5194/acp-11-9155-2011, 2011.