the Creative Commons Attribution 4.0 License.
the Creative Commons Attribution 4.0 License.
 | 09 May 2022
Zonal variations in the vertical distribution of atmospheric aerosols over the Indian region and the consequent radiative effects
Nair K. Kala
Narayana Sarma Anand
Mohanan R. Manoj
Harshavardhana S. Pathak
Krishnaswamy K. Moorthy
Sreedharan K. Satheesh
The vertical structure of atmospheric aerosols over the Indian mainland and the surrounding oceans and its spatial distinctiveness and resultant atmospheric heating are characterised using long-term (2007–2020) satellite observations, assimilated aerosol single scattering albedo, and radiative transfer calculations. The results show strong, seasonally varying zonal gradients in the concentration and vertical extent of aerosols over the study region. Compared to the surrounding oceans, where the vertical extent of aerosols is confined within 3 km, the aerosol extinction coefficients extend to considerably higher altitudes over the mainland, reaching as high as 6 km during pre-monsoon and monsoon seasons. Longitudinally, the vertical extent is highest around 75∘ E and decreasing gradually towards either side of the study region, particularly over peninsular India. Particulate depolarisation ratio profiles affirm the ubiquity of dust aerosols in western India from the surface to nearly 6 km. While the presence of low-altitude dust aerosols decreases further east, the high-altitude (above 4 km) dust layers remain aloft throughout the year with seasonal variations in the zonal distribution over north-western India. High-altitude (around 4 km) dust aerosols are observed over southern peninsular India and the surrounding oceans during the monsoon season. Radiative transfer calculations show that these changes in the vertical distribution of aerosols result in enhanced atmospheric heating at the lower altitudes during the pre-monsoon, especially in the 2–3 km altitude range throughout the Indian region. These results have strong implications for aerosol–radiation interactions in regional climate simulations.
- Article
(6481 KB) - Full-text XML
-
Supplement
(632 KB) - BibTeX
- EndNote


Atmospheric aerosols are known to regulate the Earth's radiation budget by interacting with incoming shortwave solar radiation and the outgoing longwave radiation (Schulz et al., 2006; Ghan et al., 2012; Leibensperger et al., 2012; Myhre et al., 2013). However, significant uncertainties still exist in the knowledge on the direct radiative effects of aerosols (Bond et al., 2013; Boucher et al., 2013), both globally and regionally, arising from the limited understanding of the different aerosol types and their spatio-temporal and vertical variations at regional and sub-regional scales (Pöschl, 2005; Remer et al., 2005). A primary source of uncertainty in aerosol–radiation interactions and climate forcing of aerosols is the inadequate representation of the vertical distribution and radiative effects of aerosols, as well as their spatial variations in climate models (Koffi et al., 2012; Samset et al., 2013; Kipling et al., 2016; Koffi et al., 2016).
Long-term satellite measurements offer a solution to address this issue (Yu et al., 2010; Koffi et al., 2012; Winker et al., 2013; Prijith et al., 2016) despite their inherent uncertainties. Koffi et al. (2016) have reported large discrepancies in the vertical distribution of aerosols between different climate models, particularly over the Indian region, which is attributed partly to the poor availability of ground-based observations to constrain the models. These discrepancies, though smaller over the oceans (Mann et al., 2014) than the landmass, would lead to significant differences in the aerosol-induced atmospheric heating in climate simulations as the same aerosol species at different altitudes can lead to different atmospheric heating owing to the reduction in air density with increasing altitude (Babu et al., 2011). This will also have implications for climate model simulations of the Indian summer monsoon (Lau et al., 2006; Bhattacharya et al., 2017).
As such, concerted efforts are being made to improve the accuracy in aerosol characteristics globally (Ramanathan et al., 2001; Anderson et al., 2003; Remer et al., 2008; Vaughan et al., 2009; Yu et al., 2010; Koffi et al., 2012; Yoon et al., 2014; Pozzer et al., 2015). Lidar measurements conducted over the Indian Ocean and a few surrounding locations during the Indian Ocean Experiment (INDOEX) revealed the presence and long-range transport of light-absorbing aerosols into the free atmosphere (Ansmann et al., 2000; Léon et al., 2001; Müller et al., 2001a, b; Franke et al., 2001, 2003). Over the Indian region, several campaigns were conducted using lidars (Satheesh et al., 2006), research aircraft (Satheesh et al., 2008; Babu et al., 2010, 2016), and high-altitude balloons (Babu et al., 2011) to improve the understanding of the vertical distribution of aerosols and their spatio-temporal variations. Such snapshot-like field campaigns provide deeper insight into the location-specific aerosol properties. The Indian sub-continent is home to different types of aerosols that vary spatially and temporally. In an earlier study using spaceborne lidar observations limited to the Indian mainland, the seasonally varying presence of high-altitude (dust-dominated) aerosol layers was observed, which leads to a meridional gradient in the vertical distribution of aerosols (Prijith et al., 2016).
The Indian region encompasses the highly polluted Indo-Gangetic Plain (IGP) over the northern side and the arid region (Thar Desert) over the western side, both being major sources of distinct aerosol types. The aerosols from these contrasting source regions are advected across the IGP and the north-eastern region (Pathak and Bhuyan, 2014) to the Bay of Bengal (BoB) (Moorthy et al., 2007; Satheesh et al., 2009a; Srinivas and Sarin, 2013) and are often observed as elevated layers. The west-to-east transport is consistent in the northern parts of India irrespective of the season, though there is a reversal in the synoptic wind direction during the post-monsoon and winter in the southern part. Recent aircraft campaigns revealed the presence of elevated aerosol layers throughout the Indian region in the 1–3 km altitude range (Vaishya et al., 2018; Manoj et al., 2020). Interestingly, the altitudes at which these elevated layers were observed were higher in the north-western part of India compared to the north-east (Manoj et al., 2020). Aerosol concentration within the atmospheric boundary layer (ABL) and free-atmosphere has been reported to exhibit a decreasing and increasing trend respectively over the Indian region (Manoj et al., 2019; Ratnam et al., 2021). This has partly been attributed to an increased convective lifting of aerosols, lofting them from the surface to the free-atmospheric altitudes. Under such conditions, unless climate models use realistic vertical structures of aerosol distribution, they cannot improve the climate impact assessments over the Indian region (Koffi et al., 2016).
In the light of the above scenario, in this work, we examine the vertical distribution of aerosols, their zonal (east–west) gradients over the Indian mainland and its surrounding ocean, and the resulting changes in the aerosol-induced atmospheric heating using long-term multi-satellite observations constrained by in situ and assimilated observational data sets combined with radiative transfer calculations. The observational data, radiative transfer calculations, and the methodology followed in deriving assimilated data sets are discussed in Sect. 2. The vertical structure and zonal gradients of aerosols and associated particulate depolarisation ratio (PDR) are presented in Sect. 3.1 and 3.2 respectively. The zonal gradients in the single scattering albedo (SSA) and the impacts on aerosol-induced atmospheric heating are presented in Sect. 3.3 and 3.4 respectively.
2.1 Spaceborne lidar observations
The observations from the spaceborne lidar – Cloud-Aerosol Lidar with Orthogonal Polarization (CALIOP) on board the Cloud Aerosol Lidar and Infrared Pathfinder Satellite Observations (CALIPSO) satellite form the primary database for the present study. CALIOP uses an active laser remote sensing technique and provides measurement data during both day and night. Lidar profiles collected from 2007 to 2020 have been used to generate a statistically robust mean picture of the vertical distribution of aerosols over the Indian region. The level 2 version 4.20 (Young et al., 2018; Liu et al., 2019) clear-sky, day and night layer product of aerosol extinction coefficient for the 532 nm wavelength has been used to analyse the vertical structure of aerosols within the region 0–32∘ N and 55–95∘ E, encompassing the Indian landmass and the adjoining oceans, as shown in Fig. 1.
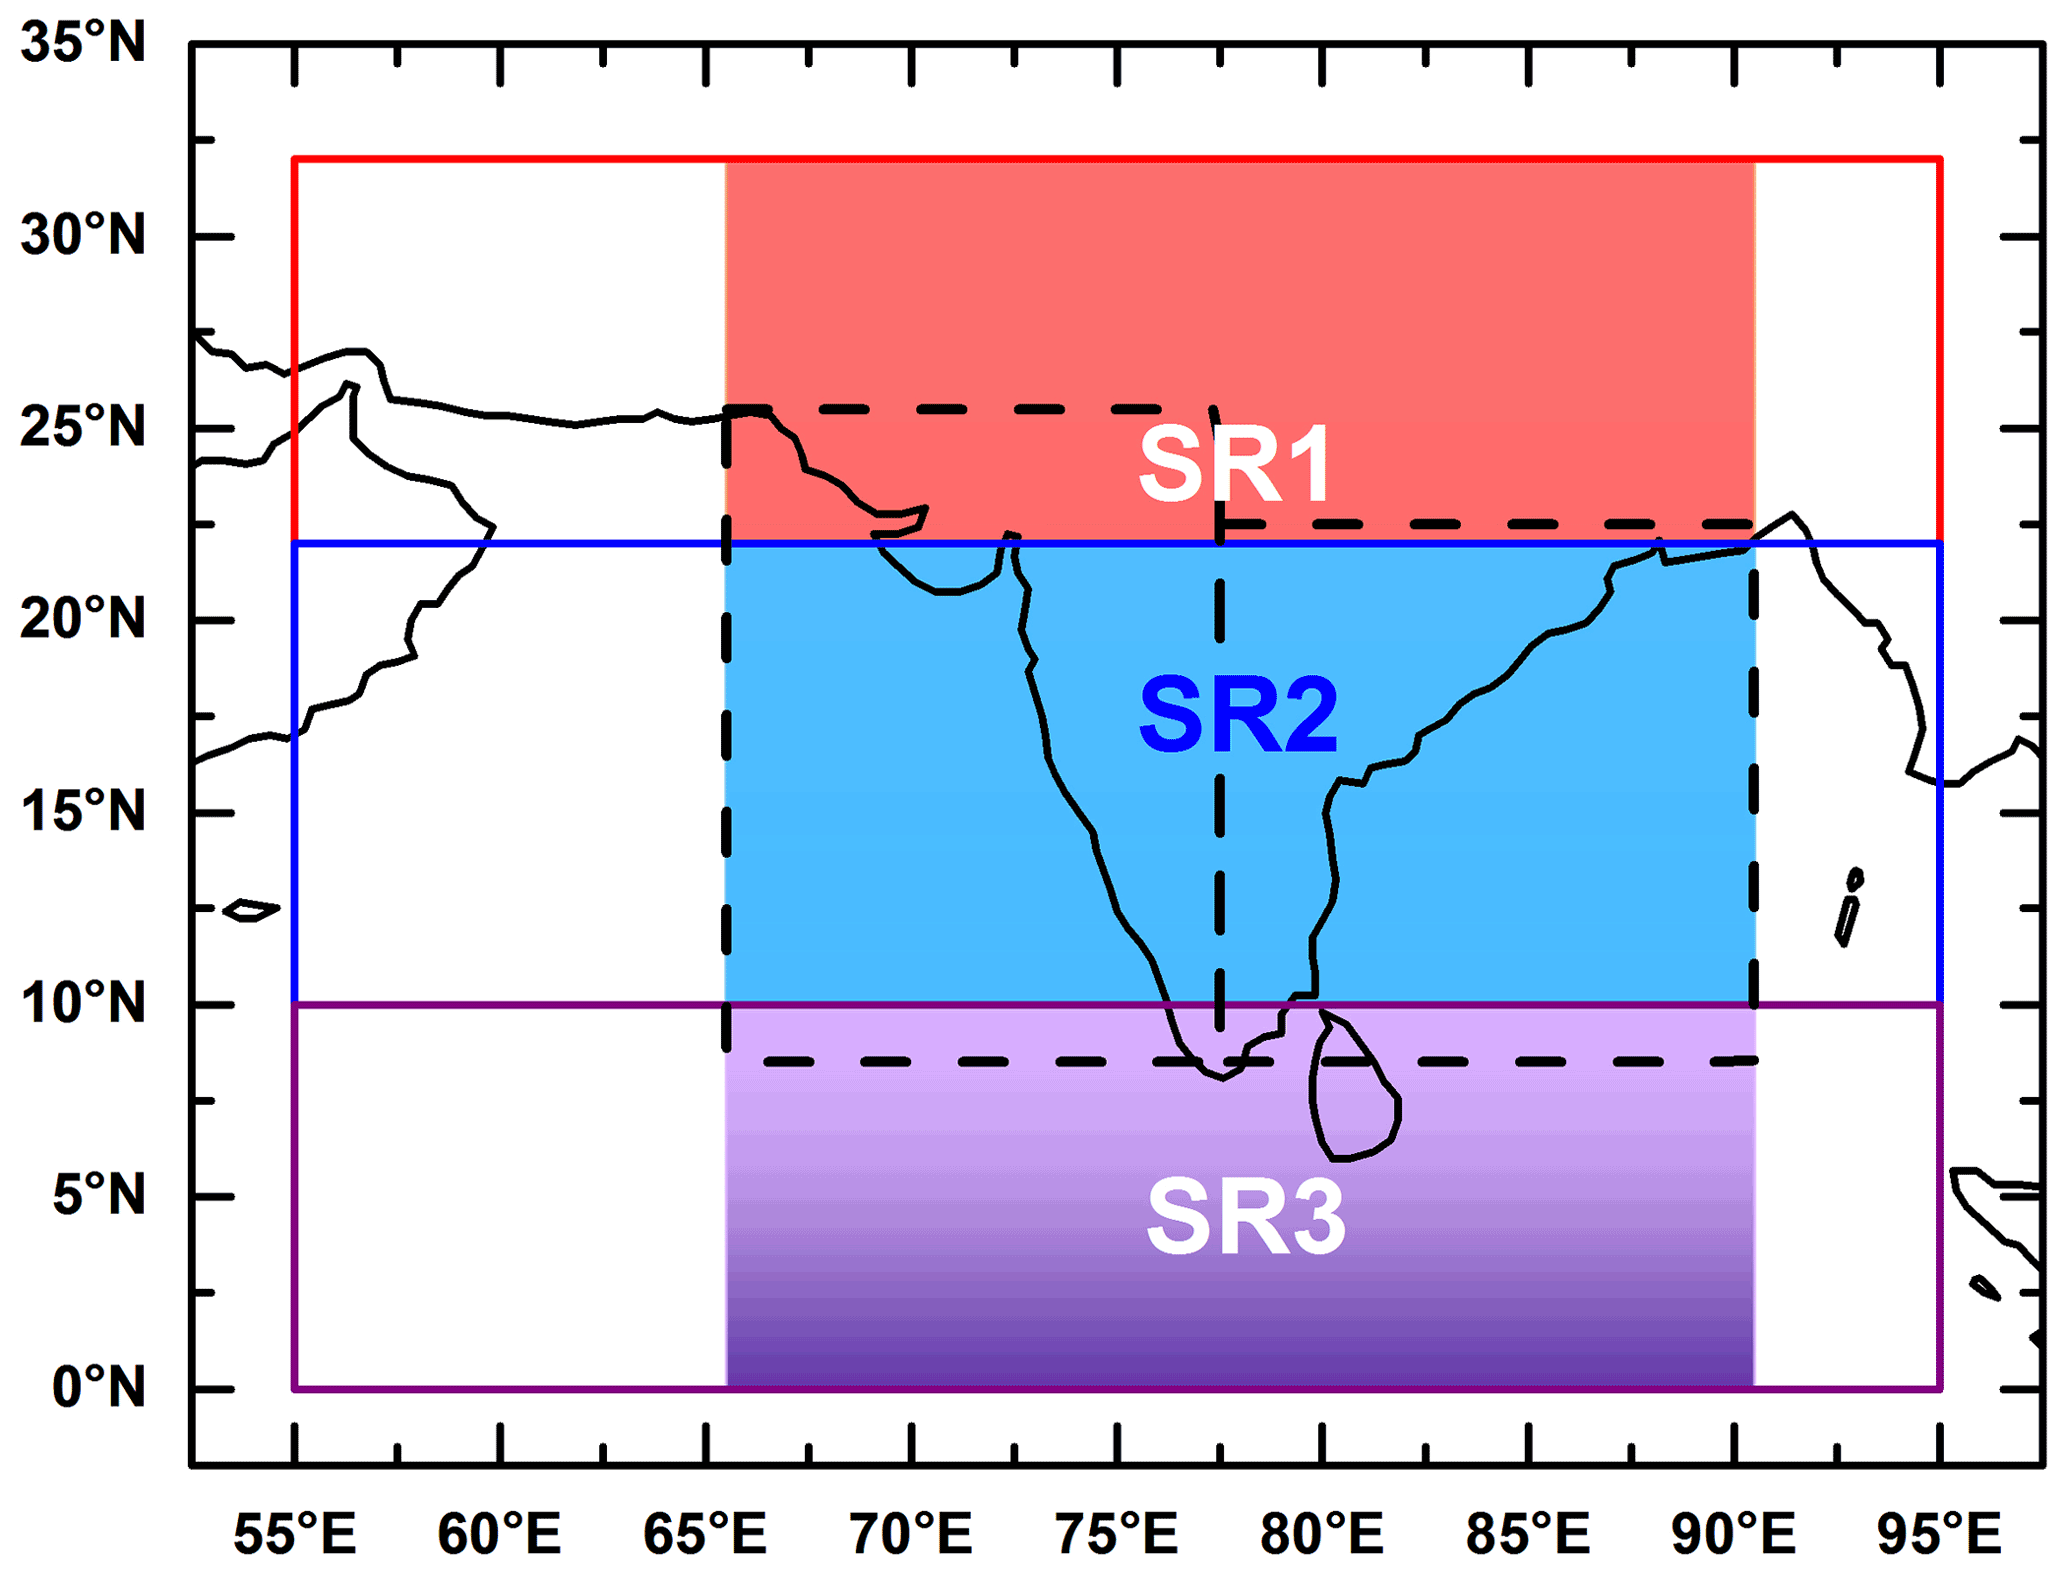
Figure 1The study region is divided into three sub-regions. All the sub-regions cover the longitude range from 55 to 95∘ E. The latitude bands covered by the sub-regions SR1 (red), SR2 (blue), and SR3 (purple) are respectively 22–32, 10–22, and 0–10∘ N. The sub-regions are marked by the solid rectangular boxes. The aerosol SSA values have been estimated within the latitude band 65.5–90.5∘ E represented by the filled rectangular boxes within the sub-regions. The dashed rectangular boxes represent the regions selected for extending the assimilated SSA to the oceanic region. The dashed rectangular boxes on the western and eastern sides of peninsular India represent 8.5–25.5∘ N and 65.5–77.5∘ E and 8.5–22.5∘ N and 77.5–90.5∘ E regions respectively.
In view of the reported large spatial and temporal variations in the aerosol properties (Satheesh et al., 2006; Moorthy et al., 2009) and meridional gradients in the vertical distribution of aerosols over the Indian region (Prijith et al., 2016), the study region has been divided into three sub-regional latitude bands: (a) sub-region 1 (SR1; 22–32∘ N), which covers northern India, (b) sub-region 2 (SR2; 10–22∘ N), which covers central and peninsular India, the Arabian Sea (AS), and the BoB, and (c) sub-region 3 (SR3; 0–10∘ N), which covers the southern tip of peninsular India and the northern Indian Ocean, as shown in Fig. 1. The present study has been carried out during the four seasons: winter (DJF; December–February), pre-monsoon (MAM; March–May), monsoon (JJAS; June–September), and post-monsoon (ON; October–November).
The CALIOP-derived level 2 aerosol extinction coefficient profiles were subjected to standard screening procedures (Winker et al., 2013). Aerosols were identified using the atmospheric volume description (AVD) flag. Data points having cloud–aerosol discrimination (CAD) scores outside −80 to −100 were identified as clouds/non-aerosols and were eschewed from the analysis (Liu et al., 2009). Extinction quality control (QC) flags have been used to account for the error in extinction coefficient retrieval resulting from the lidar ratio adjustments incurred during the data inversion. For example, if the first bit of the QC flag is 0 (1), it refers to the lidar ratio remaining unchanged (constrained) during the lidar retrieval process (Young et al., 2018). CALIOP makes use of different lidar ratios to capture different aerosol species, with the values ranging from 23 ± 5 sr for clean marine aerosols to 70 ± 25 sr for polluted continental aerosols (Kim et al., 2018). Data having uncertainty flag values above 99.99 km−1, which indicates that the iterations for the solution did not converge, have been omitted in the final stage. The resulting vertical profiles provide a qualitative but not quantitative representation of the vertical structure of aerosols due to the uncertainties involved in the lidar ratio (extinction to backscatter ratio) assumption during the retrieval of aerosol extinction coefficient from the lidar backscatter signals. The CALIOP aerosol extinction profiles are retrieved from the backscatter signals using lidar ratios as reported in Kim et al. (2018). These lidar ratios are in good agreement with previous lidar ratio observations carried out during field campaigns such as INDOEX. As an additional quality check, we calculated the lidar ratios separately for a representative month (January 2010) by dividing MODIS aerosol optical depth (AOD) by the level 2 CALIOP column-integrated aerosol backscattering coefficient. Mean lidar ratios of 34.1, 42.6, and 23.3 sr were observed respectively over SR1, SR2, and SR3, which are in good agreement with the past lidar ratio observations surrounding the Indian region (Ansmann et al., 2000; Franke et al., 2001, 2003) and the lidar ratios employed in CALIOP. Furthermore, to overcome this limitation due to uncertainties in lidar ratios, the aerosol extinction coefficient profiles have been normalised using the combined level 3 version 6.1 average AOD from the Moderate Resolution Imaging Spectroradiometer (MODIS) on board Aqua and Terra satellites (Wei et al., 2019). The resulting profiles will then capture the realistic vertical distribution (offered by CALIOP) and the columnar loading (offered by MODIS) of aerosols. Dust aerosols have been identified using the PDR profiles from CALIOP. Both level 2 aerosol extinction coefficient and PDR profiles at 532 nm from CALIOP have a horizontal resolution of 333 m and a vertical resolution of 30 m in the troposphere (Winker et al., 2009). For deriving the quality-assured PDR data, a procedure similar to that employed for extinction coefficient profiles has been followed except that the PDR QC and PDR uncertainty flags have been used instead of extinction QC and uncertainty flags.
2.2 Radiative transfer calculations
The CALIOP-derived vertical structure of aerosols has been used to estimate the layer-wise atmospheric heating effects of aerosols and the zonal gradient over the Indian region. Radiative transfer calculations have been carried out using Santa Barbara DISORT Atmospheric Radiative Transfer (SBDART; Ricchiazzi et al., 1998) code for a plane-parallel and vertically inhomogeneous atmosphere. SBDART calculations are carried out using the discrete ordinate method (Chandrasekhar, 1960; Stamnes et al., 1988) for eight radiation streams and considering an atmosphere having a vertical resolution of 0.5 km from 0 to 10 km and a lower resolution thereafter. The calculations were carried out in all the three sub-regions and all the four seasons for every degree longitude from 65.5 to 90.5∘ E. The longitudinal outer bounds are set by the availability of the assimilated AOD and SSA data sets, which will be explained in detail in Sect. 2.3.
The vertical structure of atmospheric thermodynamics pertaining to tropical atmospheric conditions was input to SBDART. The spectral surface reflectance values within the visible and near-infrared wavelengths for all the seasons, corresponding to all the grid points, were obtained from MODIS (Surface Reflectance product Daily L2G Global 250 m, MOD09A1.006, and MYD09A1.006). The accuracy of critical inputs, such as aerosol scattering phase function and SSA, is important in improving the accuracy of the estimated radiative effects. Since we did not have a species-segregated composition of aerosols over the entire study region, aerosol scattering phase function values were obtained from a Mie scattering model – Optical Properties of Aerosols and Clouds (OPAC) (Hess et al., 1998). SBDART calculations were made at 5∘ solar zenith angle intervals and clear-sky conditions for two cases: “without aerosols” and “with aerosols” over the shortwave radiation spectrum. The difference in the layer-wise net radiative forcing between these two cases provides the aerosol radiative forcing (ΔF), which has been used to estimate the aerosol-induced atmospheric heating rate (dT dt) as given below (Liou, 2002).
where g is the acceleration due to gravity, Cp is the specific heat capacity of air under constant pressure, and ΔP is the pressure difference between the top and bottom levels in a layer. Further details on the estimation of ΔF and dT dt may be found elsewhere (Babu et al., 2002; Satheesh, 2002; Vinoj et al., 2004; Satheesh et al., 2008) and are not repeated here.
The radiative forcing of aerosols and the resulting atmospheric heating effects under clear-sky conditions are primarily dependent on the aerosol concentration and SSA within each layer. While the CALIOP profiles provide the former data set, a realistic data set of the latter is not readily available. Even though the SSA measurements provided by satellite sensors such as the Ozone Monitoring Instrument (OMI) on board the Aura satellite capture the spatial variations in aerosol absorption to a large extent, their magnitudes have been reported to include large uncertainties, especially over the Indian region (Eswaran et al., 2019), partly attributed to the assumption of aerosol layer heights (Satheesh et al., 2009b, 2010). A few ground-based measurements provide more accurate estimates of SSA but are limited by the sparsity of measurements and provide rather point values. An optimal combination of the advantages offered by OMI (the accurate spatial variations) and the sparse yet more realistic columnar measurements from in situ observations are utilised to derive more realistic estimates of aerosol radiative forcing and atmospheric heating rate. For this, statistical data assimilation techniques have been employed (Kalnay, 2003; Lewis et al., 2006; Pathak et al., 2019). In the present study, an assimilated data set of the aerosol SSA derived by combining OMI and in situ observational data has been used, as detailed in the next section.
2.3 Assimilated SSA data set
Assimilated gridded data sets of SSA covering the entire Indian landmass has been generated for the first time by Pathak et al. (2019) using long-term ground- and satellite-based measurements of AOD and absorption AOD (AAOD). This data set, which provides SSA over the Indian mainland at 1∘ × 1∘ spatial resolution for the three seasons DJF, MAM, and ON, is used in this study to constrain the absorption potential of aerosols in the radiative transfer calculations. However, as the assimilated data sets are available only over the landmass, we have extended these over the adjoining oceanic region based on some important observations and assumptions which are explained in detail later in this section. Nair et al. (2008b) observed high concentrations of black carbon (BC) away from the coast over the AS and BoB. Consequently, very low values of SSA (∼ 0.85) exist over the BoB away from the coast (Nair et al., 2008a). From Fig. 2, it can be seen that OMI fails to reproduce the low values of SSA over both land (Goto et al., 2011; Srivastava et al., 2011) and ocean (Nair et al., 2008a). Taking this into account, we extended the assimilated SSA (ASSA) over to the ocean instead of directly using the OMI SSA for radiative transfer calculations.
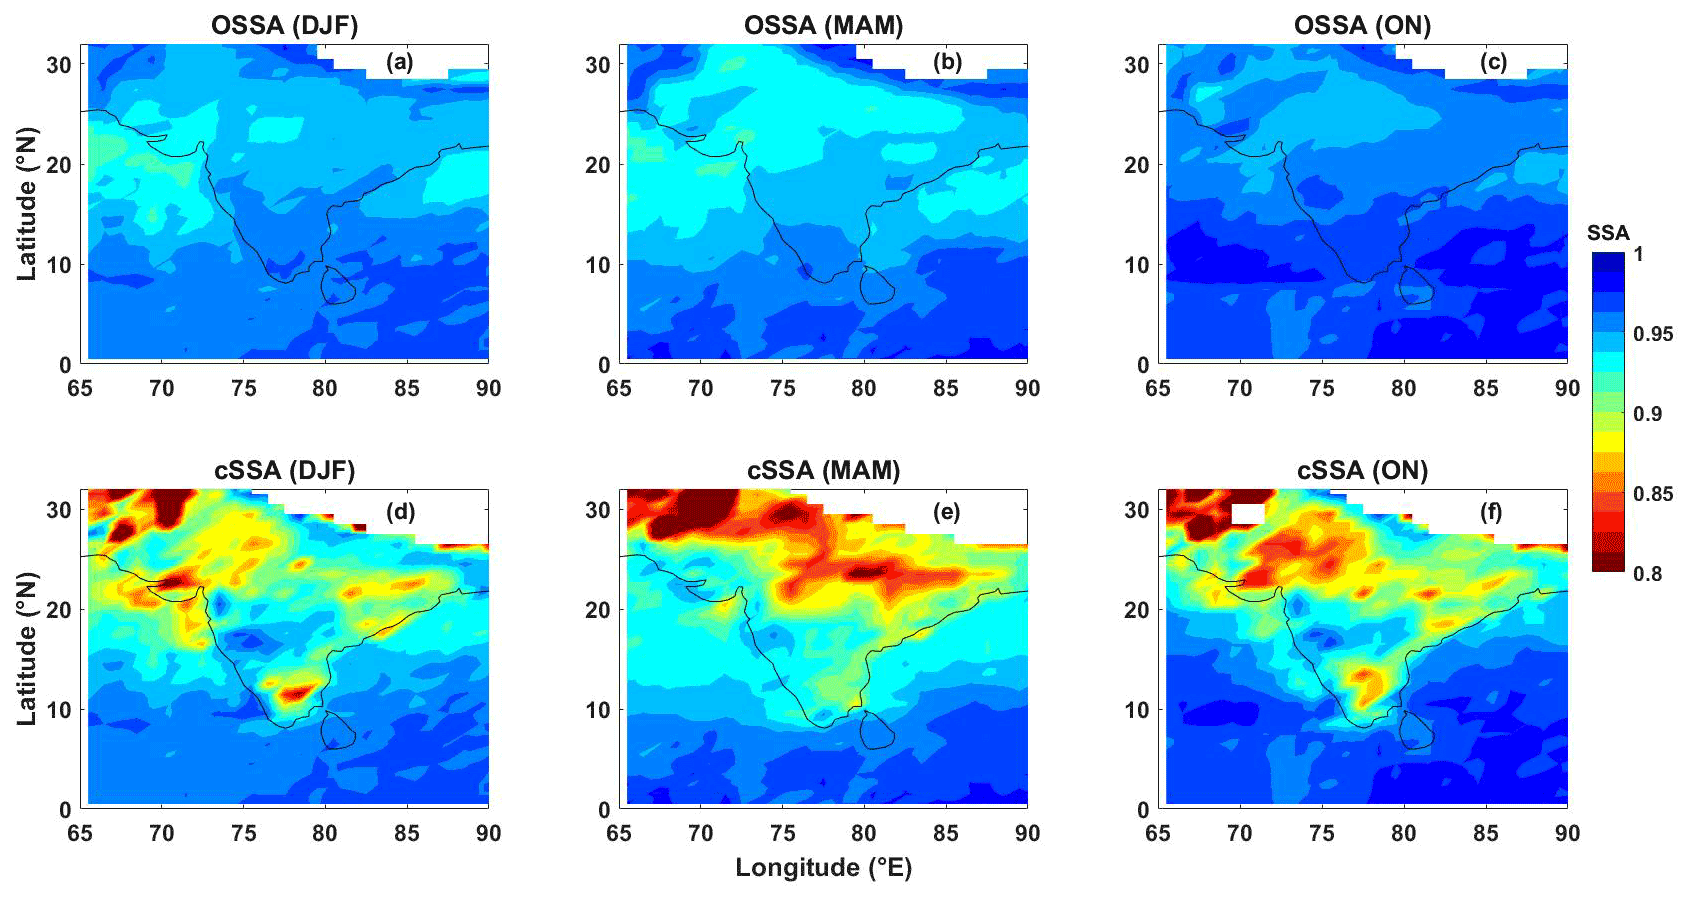
Figure 2Spatial map of OMI SSA (a, b, c) and cSSA (combined SSA; d, e, f). The left, middle, and right panels represent the seasons DJF, MAM, and ON respectively.
For this, we started by choosing two regions consisting of both land and ocean, one including the AS (west) and the other including the BoB (east). These regions are represented by the dashed rectangles in Fig. 1. The mean values of OMI SSA in these regions for the different seasons are given in Table 1. The table shows the mean SSA over land and ocean separately. It can be seen that OMI SSA shows weak seasonal variations over both land and ocean. The seasonal changes are similar over land and ocean with the highest values during ON and lowest values during MAM. In general, the magnitudes of OMI SSA over the land are marginally lower. In the west, during DJF and MAM, the SSA over ocean is marginally higher. Next, we estimated the difference between OMI SSA and ASSA for these regions considering only the data points over the land. In our study, the ASSA values are considered over the land region, and to overcome the OMI overestimation over the ocean, we extended the ASSA to the oceanic regions as well. For this, we made the following assumptions: (1) OMI SSA and ASSA values at the coast should be the same, and (2) as we move away from the coast, the difference between OMI SSA and ASSA vary as a function of the longitude.
Table 1Mean OMI SSA corresponding to the two dashed rectangles (on the west and east of the Indian mainland) shown in Fig. 1. The suffixes L and O correspond to land and ocean respectively.
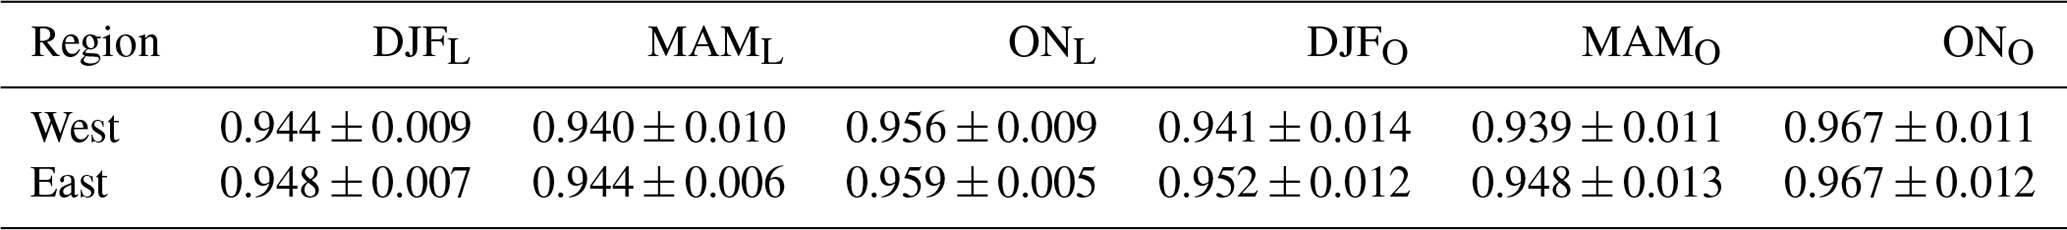
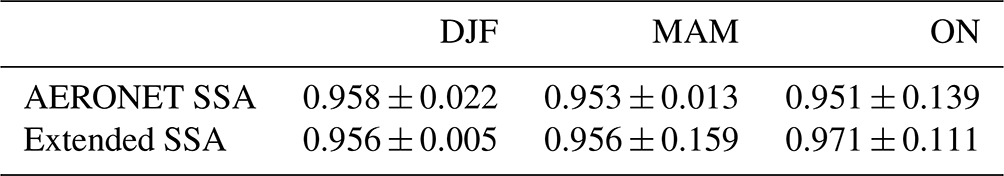
The extension was done separately for the regions on the east and west considering one latitude at a time. We started the extension by estimating the meridional average of the OMI SSA over the ocean (AS and BoB, represented by the dashed rectangles in Fig. 1). Linear regression is performed on the mean OMI SSA values, and these regression coefficients were used to estimate the SSA at the coast corresponding to individual latitudes. The ASSA over the land has sharp spatial variations, and hence the mean SSA for a 2∘ × 2∘ grid close to the coast was estimated. The difference between this mean SSA value and the value obtained for the coast using the regression coefficients was estimated and is referred to as δSSA hereafter. Since the effect of anthropogenic sources reduce as we move away from the coast, the zonal variation in δSSA was parameterised as a function of longitude (δSSAlon). Removing δSSAlon from the OMI SSA, the extended SSA for a particular latitude is estimated. This is repeated for each latitude, and the extended SSA for the whole oceanic region is estimated. After completing the extension, we have extended SSA values for the oceanic region above 8∘ N. Since we do not have ASSA to constrain the model below this latitude, the same method cannot be employed. To overcome this limitation, we estimated the difference in OMI SSA and extended SSA over the oceanic region (Table 2). Assuming a constant bias in the OMI SSA in this region, the extended SSA values are estimated by subtracting the bias from the OMI SSA values. This method of extension ensures that the spatial and zonal variations in OMI SSA are retained. Finally, merging extended SSA over ocean and ASSA over land, we obtained the combined SSA (cSSA) for the study region. The OMI SSA and the cSSA for the three seasons DJF, MAM, and ON are shown in Fig. 2. The method employed in this study retains the spatial variations in OMI SSA and offers the realistic lower values and sharp changes near the coast. The extended SSA values have been compared with the AErosol RObotic NETwork (AERONET)-retrieved SSA values from Maldives Climate Observatory at Hanimaadhoo (MCOH), a remote island station located in the Indian Ocean (Table 3). The values are comparable during DJF and MAM, while extended SSA values are marginally higher during ON. The SSA from extensive measurements over the entire BoB during the Integrated Campaign for Aerosols, gases, and Radiation Budget (ICARB) – 2006 (March–May) revealed values in the range 0.89–0.96 (Nair et al., 2008a), which is in line with the cSSA estimates in the present work. This cSSA has been used in the radiative transfer calculations explained in Sect. 2.2.
Table 2Difference between OMI SSA and cSSA. Subscripts L and O denote land and ocean respectively.
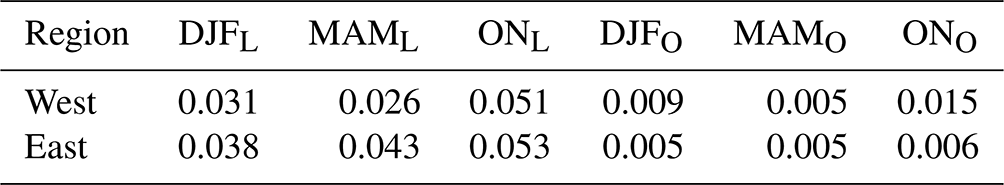
Table 3Comparison of extended SSA over the ocean with AERONET SSA from MCOH.
3.1 Aerosol extinction coefficient
The zonal variations in the seasonally averaged vertical distribution of aerosol extinction coefficients over the study region are shown in Fig. 3. The three sub-regions are shown in the panels from top to bottom (SR1 to SR3), and in each row, the seasonal changes are shown from DJF (left extreme) to ON (right extreme) through MAM and JJAS seasons. A significant intrusion of aerosols into higher altitudes is seen, comparatively more in the north (SR1) and least in the south (SR3), irrespective of the seasons. In all the three sub-regions, the vertical extent is minimum in DJF and is maximum in MAM and JJAS. The vertical transport of aerosols to altitudes above 6 km is controlled by dynamics (Ratnam et al., 2018). Aerosols are mostly limited to below 3 km in DJF, while they are present even above 5 km during MAM and JJAS. The maximum vertical extent of aerosols during JJAS is above 6 km for SR1, around 5.5 km for SR2, and within 4 km for SR3. This is in line with earlier reports from campaign measurements using airborne lidars (for example Satheesh et al., 2008), as well as using satellite data (Prijith et al., 2016), in which meridional (north to south) gradients have been reported in the vertical distribution of aerosols over the Indian mainland. The difference in the vertical extent of aerosols observed in Fig. 3 for all the sub-regions and seasons is due to the existence of this north-to-south gradient. However, the zonal (west-to-east) gradients remained unexplored until this study.
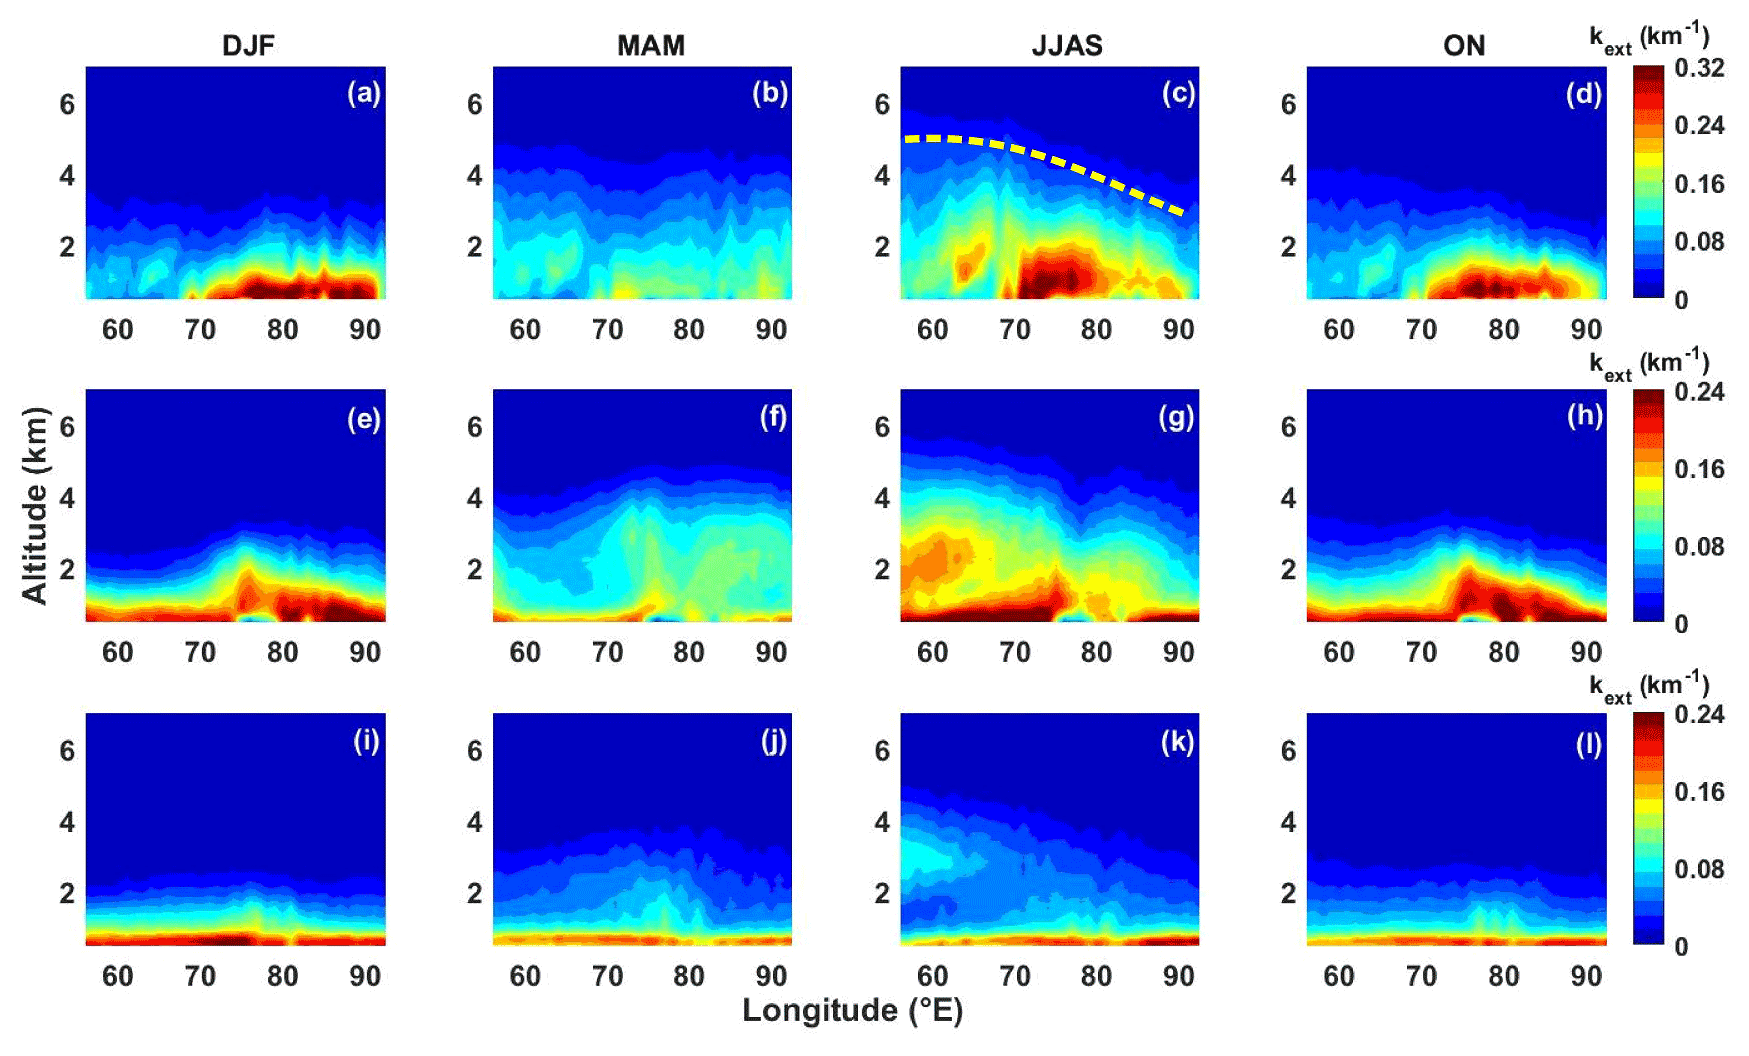
Figure 3Zonal variation in the CALIOP aerosol extinction coefficient (kext) profiles for SR1 (top panels), SR2 (middle panels), and SR3 (bottom panels) sub-regions. Each column corresponds to a particular season, as marked above them. The dotted yellow line in Fig. 3c illustrates the eastward gradient in the extent of the vertical intrusion of aerosols.
Figure 3 also reveals that the extent of vertical intrusion has an eastward gradient, as revealed by the profiles of the blue shades in most of the panels, being highest in west and sloping downwards towards east, as indicated by the dotted yellow line in Fig. 3c as an illustration. In general, the magnitudes of the extinction coefficients are higher close to the surface and decreasing with altitude. In SR1, such a feature is observed to be the strongest within the longitude region 70–80∘ E, whereas in SR2, it is more widespread. The vertical extent is controlled by the combined actions of the convective lofting and the consequent dynamics of the ABL, long-range transport, scavenging by clouds and precipitation, and the proximity to the sources. ABL is shallower during DJF and ON over the Indian region due to the lower surface temperatures and the resulting reduced convective mixing processes (Sathyanadh et al., 2017), particularly so in SR1, where the winter temperatures come down to a few degrees Celsius near to zero. As a result, during these seasons, the vertical extent of aerosols remains low due to lack of mixing. On the other hand, during MAM and JJAS, when the convection is stronger (temperature goes well above 40 ∘C in SR1), vigorous convective lifting prevails over the Indian region. In addition to this, effects of long-range transport are also observed in the north-west (<70∘ E; in SR3 and SR2) during this period.
Closer examination of the seasonality in the longitudinal variations in Fig. 3 reveals the following:
-
During DJF (Fig. 3a, e, i), the vertical extent of aerosol extinction peaks within 75–80∘ E and drops off as we move further to the east or west. The peak in the vertical distribution is observed to be above the surface (within 0.5–2 km) in SR2 as compared to the surrounding oceanic regions. This general pattern is weakest in SR1 (mostly land) and clearly visible in SR2 (mixture of land and ocean). In SR1, the near-surface aerosol extinction coefficient values are highest in the 70–90∘ longitude band (Fig. 3a). This can be attributed to the confinement of aerosols near the surface by the shallow winter ABL and the weak winds typical to IGP during that season, leading to low ventilation coefficients, as has been reported earlier in campaign studies (Nair et al., 2007). In the 55–70∘ longitude band, the magnitudes of near-surface aerosol extinction coefficients are lower as this region consists of the ocean in SR2 and SR3. Nevertheless, the vertical extent of aerosols remains comparable to that in the 70–90∘ longitude band. In SR2 (Fig. 3e), the general pattern is very similar, and the fall in the vertical extent is sharper towards the west as compared to the east. It is worth noticing that in the 85–95∘ longitude band, composed mostly of the BoB, the near-surface values of extinction coefficients are comparable to or even higher than that over the land. This feature has been reported in several earlier studies as well and is attributed to the outflow of aerosols from the IGP to the BoB (Banerjee et al., 2019; Kompalli et al., 2021). In SR2, the land–sea boundaries on the west (east) are around 72.5∘ E (85∘ E) longitude, which changes to 75∘ E (80∘ E) in SR3, reducing the width of the land region. The general pattern described above, i.e. the vertical extent being higher over the land region, is observed to be modulated by this meridional change in the land–sea border. Both the width of the central peak and its vertical extent reduce from SR2 to SR3 (see, for example, Fig. 3e, i). During MAM and JJAS, when the transport of mineral dust is strong, the zonal variations exhibit a slightly different pattern with a considerable amount of aerosols above 2 km. The west-to-east decreasing gradient in the vertical extent of aerosols is clear during this period. It can also be seen that as the influence of dust subsides, the vertical extent decreases and reaches a minimum by DJF.
-
As the season advances to MAM, even though the zonal gradient remains weak, the vertical extent of aerosol extinction increases, and their near-surface values decrease (compared to DJF), which is attributed to the enhanced convective mixing and the consequent lofting of aerosols over the land.
-
A negative zonal gradient emerges clearly during JJAS with the vertical extent increasing in the west and decreasing in the east. Earlier studies have reported the transport of dust aerosols from western Asia and eastern Africa during this period across the IGP (Prijith et al., 2016; Banerjee et al., 2019). The emergence of a negative zonal gradient in SR3, and the increase in vertical extent over the western region in particular, during JJAS could be attributed to this. A similar negative zonal gradient is sustained during ON but with a reduced vertical extent. The transport from the west weakens, its impacts on the aerosol loading becomes negligible, and the conditions during ON closely resemble DJF. A striking feature seen in SR3 is the occurrence of an elevated aerosol layer with high extinction coefficient between 2 and 4 km altitude during JJAS.
-
SR2, which is the land region sandwiched between the AS and the BoB, provides a clear signature of the vertical structure of aerosols: the prominent feature is the higher vertical extent over the land with the extinction coefficient maxima occurring within 1–2 km above ground, in general conformity with earlier reports (Moorthy et al., 2004; Satheesh et al., 2006; Prijith et al., 2016; Prasad et al., 2019). During DJF, the eastern side exhibits a higher concentration of aerosols (below 1 km) compared to the western side which may be due to the larger share of land in the eastern side compared to the western side. Consequently, the ABL dynamics may exhibit larger temporal variations on the eastern side leading to larger confinement of aerosols close to the surface during DJF. During MAM, the vertical extent increases throughout SR2, but interestingly, the altitude above which the extinction coefficient is less than 0.1 km−1 does not exhibit a similar pattern and is observed to be the least around 65∘ E, where the land–ocean boundary of the Indian peninsula commences in SR2. This length scale marks the influence of near-surface aerosols in the vertical distribution and raises another question of why the vertical extent does not follow such a pattern. It should be noted that during MAM, the dust transport from the Arabian Peninsula might be the reason why the aerosol concentration is not close to zero at higher altitudes. This argument becomes clear during the transition to JJAS when the dust transport is strong and leads to an increased vertical extent and negative zonal gradient in SR2. ON marks the return to the vertical structure and its zonal variations similar to that observed in DJF.
-
A plume-like structure, observed in the 55–70∘ E longitude band in SR1, is small in size and at lower altitudes in DJF but becomes larger and extends to ∼ 2.5 km in MAM. But, compared to SR1, the plume in the western region is absent in SR2 during DJF and MAM but appears with a larger spatial extent in JJAS, more or less appearing as a high-altitude layer of aerosols all the way from 55 to 65∘ E. This leads to a dual peak vertical structure in JJAS in SR2. Interestingly, the eastern side of the plume overlaps roughly with the western boundary of the peninsula.
-
SR3 is mostly oceanic with a much smaller share of land; consequently, the zonal gradients are weak in all the seasons except JJAS and exhibits a higher vertical extent around 75–80∘ E where land is present.
-
During JJAS, all the regions exhibit a negative zonal gradient of the aerosol extinction coefficient due to the strong inflow of aerosols brought about by the south-westerly winds. The west-to-east gradient is strongly modified by the west Asian (including the Thar Desert and the semi-arid regions of north-western India) dust transport across the IGP and over the BoB (Prasad and Singh, 2007; Kumar et al., 2008). These regions, including the contiguous arid regions of western Asia, are known to be strong sources of mineral dust, which are advected across the IGP aided by the favourable meteorological conditions (Moorthy et al., 2005a, b; Niranjan et al., 2007; Beegum et al., 2008; Vaishya et al., 2018; Manoj et al., 2020). The anthropogenic dust source can contribute ∼ 45 % to the total dust contribution over the Indian region, and the one major source region is IGP (Ginoux et al., 2012). Previous studies using ground-based and spaceborne lidars have shown elevated aerosol layers, reaching altitudes as high as 5 km, over IGP during MAM and JJAS (Gautam et al., 2010; Mishra and Shibata, 2012). Furthermore, the vertical extent of the aerosol extinction coefficient increases around 55∘ E. This is due to the portion of the Middle East, a major dust source to the AS (Namdari et al., 2018), included in the north-west part of SR2. The dust transport has been reported to cause a strengthening of the Indian summer monsoon through tropospheric heating (Jin et al., 2014; Vinoj et al., 2014; Solmon et al., 2015).
Our kext values are in good agreement with the micro pulse lidar measurements by Satheesh et al. (2006), in which the presence of aerosol layers aloft (within 1–2 km) during DJF over the urban region of Bengaluru (13.01∘ N, 77.34∘ E) was reported. Satheesh et al. (2008) reported the large concentration of aerosols within 2–5 km over the inland regions of peninsular India during the Integrated Campaign for Aerosols, gases and Radiation Budget (ICARB). They highlighted the decrease in the vertical extent (from 5 km over central India to 1 km in the northern Indian Ocean) and concentration of aerosols (a reduction in the maximum value of kext in the atmospheric column from 0.4 km−1 in central India to 0.2 km−1 in northern Indian Ocean) as we move meridionally away from the land into the surrounding oceans. Airborne lidar measurements during ICARB reported two eastern coastal regions in peninsular India, namely Bhubaneshwar and Chennai, as having the vertical extents of kext of 3 and 5 km respectively during MAM (Satheesh et al., 2009c). The maximum values of kext within the atmospheric column were observed to be 0.3 and 0.35 km−1 respectively. Meanwhile, the southern coastal region Trivandrum had the vertical extent of kext of 1.5 km and a maximum value of 0.15 km−1. It should be noted that all these stations had the maximum value of kext at altitudes above 2 km and not close to the surface. Satheesh et al. (2009a, c) showed how the vertical extent and magnitude of kext decreases away from the coasts of the three regions in the Indian peninsula. The contribution of aerosols above 3 km to columnar optical depth (AOD) was observed to decrease with increasing distance off the shorelines for Chennai, whereas it remained more or less independent of distance for Bhubaneshwar. Lidar measurements by Moorthy et al. (2008) reported the presence of high-altitude aerosols even 400 km away from the coasts of the BoB, with a decreasing vertical extent and concentration (with a maximum value of 0.15 km−1 in the kext profile) away from the Chennai coast. Vaishya et al. (2018) made use of aircraft observations to study the vertical profiles of kext over western India (Jodhpur), central India (Varanasi), and eastern India (Bhubaneshwar) during the South West Asian Aerosol Monsoon Interactions (SWAAMI) campaign conducted along with the Regional Aerosol Warming Experiment (RAWEX) campaign in June 2016. The peak value in the kext profile was reported by them to be maximum (0.2 km−1) over central India and reducing to either side to attain peak kext values of ∼ 0.1 km−1 over western and eastern India. Manoj et al. (2020) reported the presence of aerosols above 2 km during the onset of the monsoon over northern India (Lucknow), central India (Nagpur), north-western India (Jaipur), the Arabian Sea, and the Bay of Bengal during the SWAAMI aircraft campaign. These observations are in excellent agreement with our observations on the seasonality and zonal gradients in kext shown in Fig. 3. These observations suggest that the zonal gradients in the vertical extent of aerosols is largely controlled by the long-range transport of dust. With a view to examining whether this elevated aerosol layer in JJAS is formed by advected dust aerosols, we looked into the PDR profiles from CALIOP.
3.2 Particulate depolarisation ratio
The seasonality in the zonal variations in the PDR profiles over the three sub-regions is shown in Fig. 4. It emerges that SR1 is the region most impacted by the dust transport throughout the year. The non-dust and fine-dust aerosols are identified by the PDR ranges 0.02–0.07 and 0.2–0.4 respectively (Gautam et al., 2009; Groß et al., 2011; Lakshmi et al., 2017; Hofer et al., 2017, 2020; Hu et al., 2020). Long-range transport of dust from the west across the northern AS towards the Indian mainland has a strong influence on the aerosol loading and composition over the Indian region (Moorthy and Saha, 2000; Li and Ramanathan, 2002; Prijith et al., 2012; Banerjee et al., 2019). We observe that the PDR values are mostly in the range 0.2–0.3 in SR1 (Fig. 4a–d). High PDR values between 0.2 and 0.4 are prominently seen over the western arid parts associated with the dust sources. However, these high values are limited to longitudes below 80∘ except during MAM in SR1 and SR2 and during JJAS in SR3.
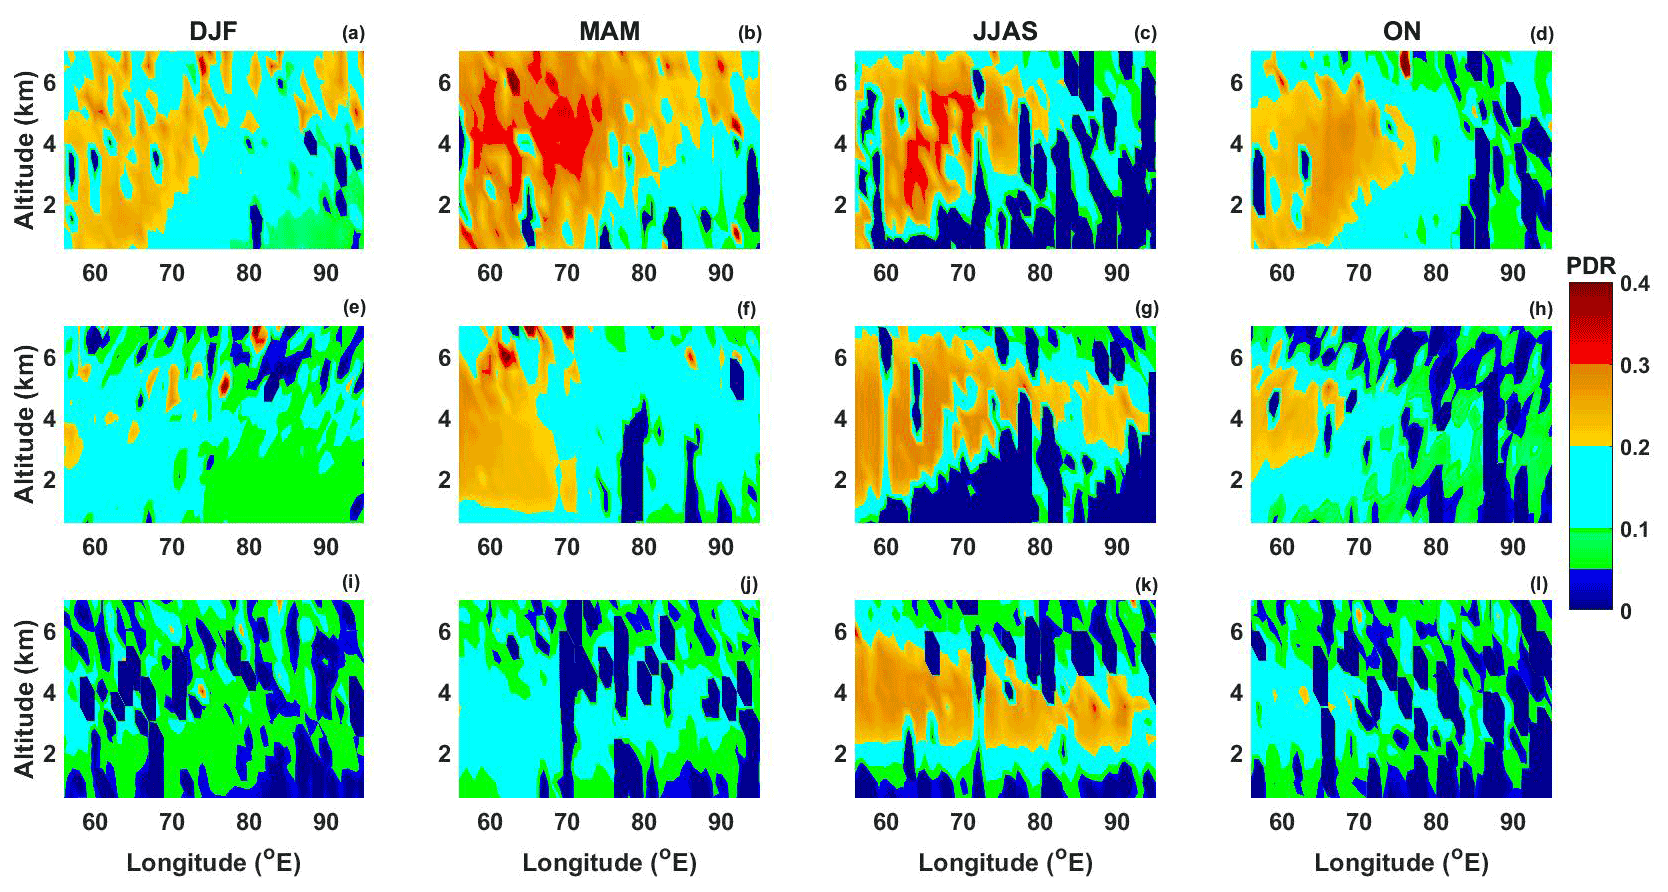
Figure 4Zonal variation in PDR profiles for SR1 (top panels), SR2 (middle panels), and SR3 (bottom panels) sub-regions. Each column corresponds to a particular season, as marked above them.
The influence of mineral dust is evident throughout the year over SR1 – highest in MAM and lowest in DJF. Vaishya et al. (2018) have shown that the dust fraction was ∼ 0.5 in the west and central IGP during the pre-monsoon, while it was negligibly small in the eastern IGP. A similar seasonal variation is observed over SR2 where PDR values above 0.3 are limited to the east of 70∘ E except in JJAS. In SR3, the influence of dust is much lower, and PDR values above 0.2 are observed only during JJAS. However, the extinction coefficient values are less than 0.1 km−1 above 4 km in this region, indicating that although PDR values are high, the impact will be negligible due to the low aerosol concentrations (Fig. 4k).
During MAM and JJAS, high PDR values are observed throughout the column extending from close to the surface to above 6 km over the west (mostly at longitudes >70∘ E). However, the extinction coefficient values are below 0.05 km−1 above 5 km. Modelling studies (Banerjee et al., 2019) have delineated the different pathways of dust transport from local and remote sources across IGP and the distinctiveness in their vertical distribution. The strength of dust transport leads to the scattering aerosol concentration observed over the south-eastern part of AS and northern Indian Ocean to be comparable to that observed over the western coast of India (Kompalli et al., 2021). With the exception of the northern BoB which is affected by local sources, BoB is affected by the remote sources all through the year, and this intensifies during the monsoon (Banerjee et al., 2019; Kompalli et al., 2021). The elevated dust travelling across the IGP becomes more absorbing when fine BC (produced by anthropogenic activities in the IGP) gets coated/adsorbed on the porous dust (Moorthy et al., 2007; Prasad and Singh, 2007; Pandithurai et al., 2008; Brooks et al., 2019). The higher hematite content in the soil also adds to the enhanced dust absorption (Deepshikha et al., 2005; Moorthy et al., 2007). It was shown that these coated aerosols have an east-to-west contrast with higher coating of BC in the eastern part of the northern Indian Ocean (outflow to BoB through IGP) compared to the western part (outflow from west coast of India; Kompalli et al., 2021). The radiative impact of these aerosols should be evaluated by taking into consideration the extinction coefficients and the absorbing nature of the aerosols. The aerosol absorption over the region has been examined using cSSA explained in Sect. 2.3 and is discussed below.
3.3 Combined SSA
SSA is an important parameter controlling the radiative effects of aerosols. Ideally, it is desirable to have altitude-resolved measurements of SSA as it can reproduce more realistic estimates of atmospheric heating induced by aerosol layers at different altitudes. However, the availability of SSA from in situ measurements is limited over the Indian region, and satellite measurements (OMI) tend to overestimate the regional SSA. Estimates of aerosol radiative effects are often made by relying on the column-averaged values of SSA (Dubovik et al., 2000; Satheesh et al., 2010; Choi and Chung, 2014), which can lead to uncertainty in the vertical profiles of aerosol radiative forcing and the resulting atmospheric heating effects. It can be observed from Fig. 2 that cSSA provides more realistic values of SSA over the oceanic region.
A comparison of the zonal variations in the cSSA and OMI SSA corresponding to the different seasons during which ASSA is available is shown in Fig. 5; cSSA shows stronger absorption and significant zonal variation in most parts of the sub-regions compared to the OMI SSA. The reported low SSA over the IGP region (Di Girolamo et al., 2004; Ramana et al., 2004) is well captured by cSSA along with the high SSA over the western part of India during MAM and JJAS due to the inflow of dust (Badarinath et al., 2009; Das et al., 2020). The low SSA during MAM and high SSA during DJF are also observed in cSSA. As expected, SR3 exhibits the highest SSA, while SR1 has the lowest values, well in accordance with the fact that SR3 has limited sources of absorbing aerosols compared to SR1. While OMI SSA captures the spatial variations quite well, the absolute magnitudes are high and unrealistic due to reasons explained before. The cSSA values are observed to sort this out and provide more realistic values in addition to the accurate spatial variations observed in OMI SSA. The seasonal low over SR1 is observed during MAM with an average of 0.87 ± 0.02, while for DJF and ON, the average values are 0.89 ± 0.02 and 0.88 ± 0.02 respectively. The zonal variations in cSSA in SR1 are similar during DJF and ON, but there is a visible drop in the magnitudes near 90∘ E in ON.
SR1 consists mostly of land areas of the northern part of India, over which advected dust and local anthropogenic emissions contribute significantly (Kedia et al., 2014), leading to the lowest SSA over SR1 (0.89 ± 0.02 in DJF, 0.86 ± 0.02 in MAM, and 0.88 ± 0.02 in ON). This sub-region has densely distributed coal-fired thermal power plants and several small- and large-scale industries (including cement factories and iron and steel mills), the emissions from which contribute significantly to the aerosol loading throughout the year (Garg et al., 2001; Reddy and Venkataraman, 2002; Prasad et al., 2006; Gadi et al., 2011). Low SSA values over this region are consistent with the previously reported in situ measurements (Verma et al., 2013; Babu et al., 2016; Vaishya et al., 2018), as well as the high concentrations of absorbing BC (for example Prasad et al., 2006; Badarinath et al., 2009; Eck et al., 2010; Giles et al., 2011).
During MAM, the SSA values decrease in the western part of India (Fig. 5b), and this increase in SSA coincides with the influx of dust (Fig. 4b). A corresponding change is observed in the vertical extent of the aerosol extinction coefficient in the west (Fig. 3b, f, j). The PDR values in the range 0.2–0.4 indicate the strong influence of dust during MAM (Fig. 4b, f). The effect of dust over the Indian region starts during MAM, peaks during JJAS, drastically reduces during ON, and reaches a minimum during DJF (Banerjee et al., 2019).
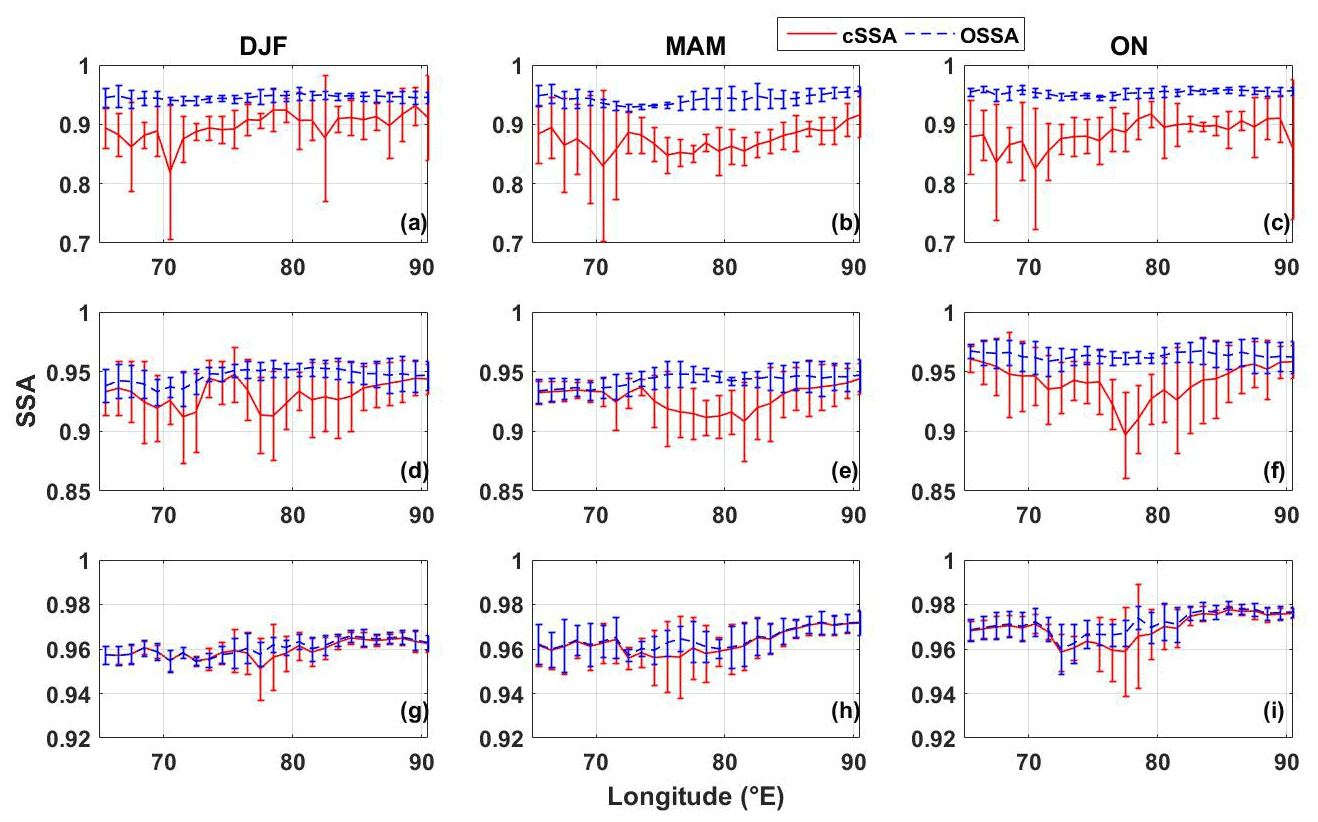
Figure 5Zonal variation in cSSA (combined SSA) and OMI SSA in SR1, SR2, and SR3 during DJF, MAM, and ON seasons. The rows from top to bottom correspond to sub-regions SR1, SR2, and SR3 respectively.
In general, the SSA values in SR2 (0.92 ± 0.01 in DJF, 0.91 ± 0.01 in MAM, and 0.93 ± 0.01 in ON) are higher than those in SR1, but the low values of SSA in the longitude band 75–85∘ E in SR2 clearly indicate the influence of highly absorbing anthropogenic emissions over the land. The aerosols in the west are clearly much less absorbing as compared to those in the IGP outflow region (near 85∘ E). Thus, there is a west-to-east decrease in SSA. Beyond 85∘ E, SSA starts increasing due to the relatively cleaner nature of the oceanic region. During DJF, SSA is low in the 67–72∘ longitude band, but as dust intrudes on this region in MAM, SSA sharply increases as dust is less absorbing than BC. In SR3, the sub-region with the highest SSA, the pattern of zonal variations (0.95 ± 0.03 in DJF, 0.96 ± 0.01 in MAM, and 0.97 ± 0.01 in ON) closely resembles that in SR2. Aerosols and Chemistry Model Intercomparison Project (AerChemMIP) simulations of kext for the same location and time period, presented in detail in Sect. S1 in the Supplement, revealed a similar zonal gradient with an increasing gradient from the west to the east, a maximum in the centre, and a reduction thereafter towards the east. Even though the model simulations are in good agreement with the zonal gradients and the magnitudes of kext in Fig. 3 on a larger scale, our results reveal that the AerChemMIP6 simulations are underestimated over finer spatial scales.
3.4 Zonal variations in aerosol-induced atmospheric heating
The information on the height-resolved aerosol extinction coefficients and SSA (cSSA), as well as their spatial and seasonal variations, has been used to estimate 3-D aerosol radiative heating for the first time over the Indian region following the methodology detailed in Sect. 2.2. The zonal variations in seasonally averaged dT dt profiles over the three sub-regions are shown in Fig. 6. In general, dT dt is high near the surface and decreases with altitude throughout the study region, closely following the vertical distribution of aerosols. The magnitude of dT dt increases from south to north; i.e. they are highest in SR1 and lowest in SR3 irrespective of the season.
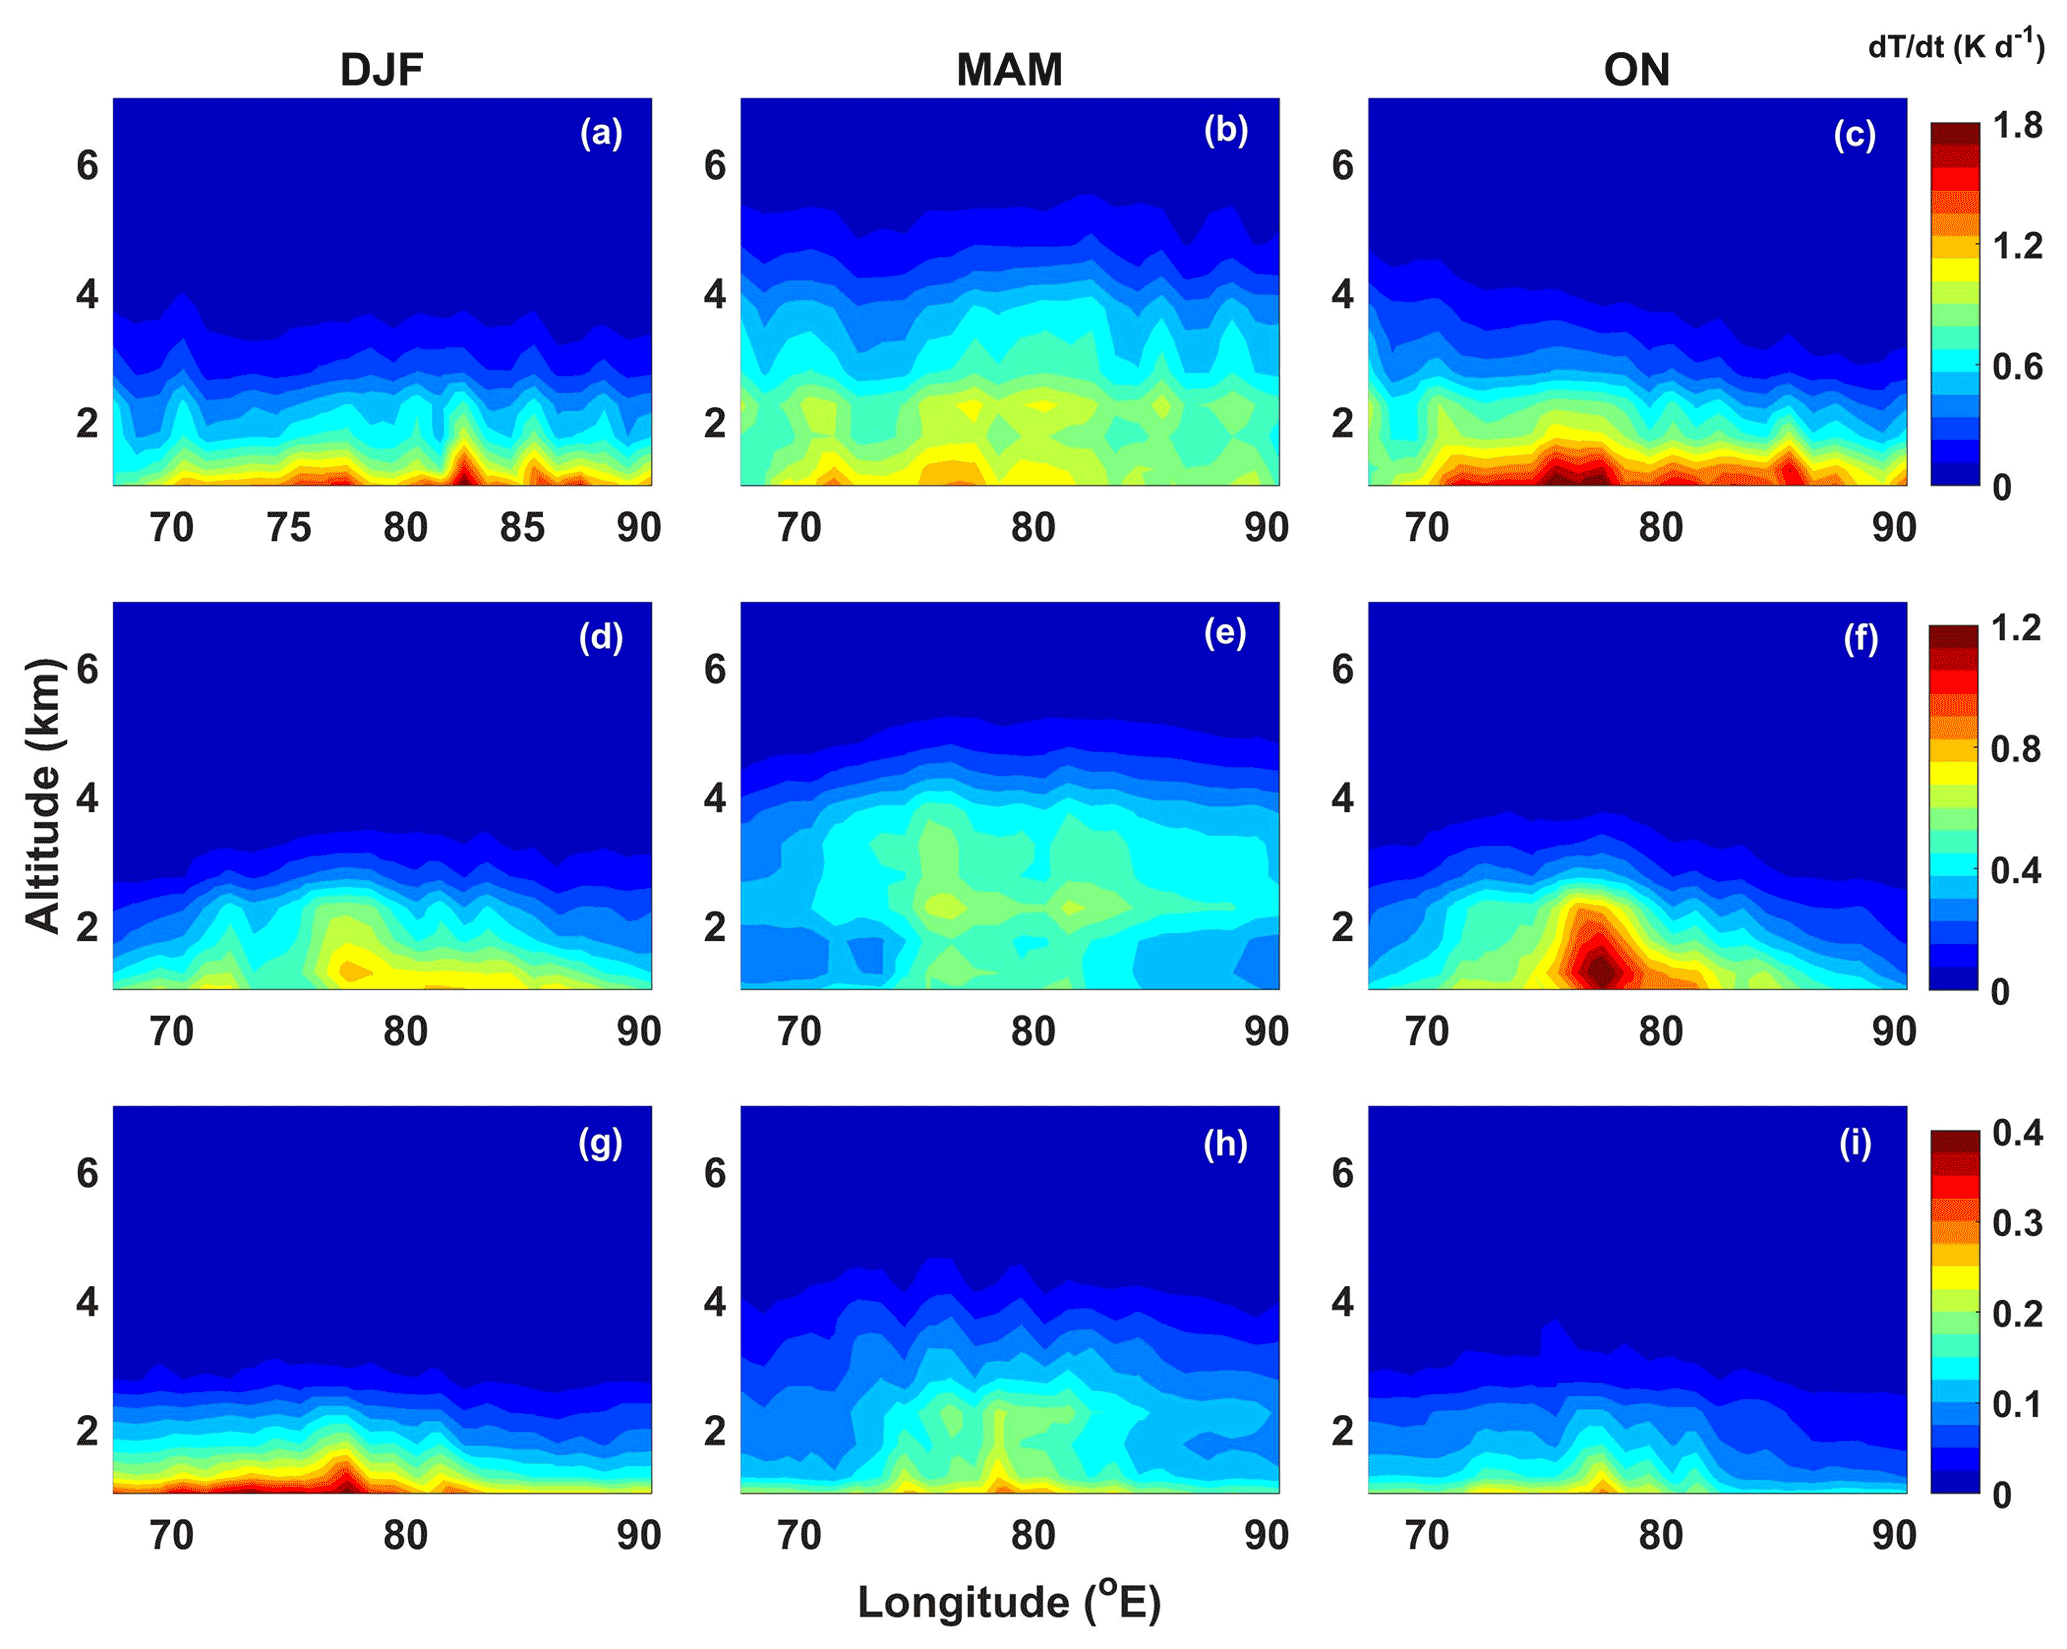
Figure 6Zonal variation in aerosol-induced atmospheric heating rate profiles (dT dt) for SR1 (a, b, c), SR2 (d, e, f), and SR3 (g, h, i) sub-regions. Each column corresponds to a particular season, as marked above them.
During MAM, the effect of elevated aerosol layers on dT dt profiles is clearly discernible between 2 and 4 km within the longitude range 70–90∘ E (Fig. 6b, e, h). The magnitude of dT dt in these layers is ∼ 1 K d−1 and is higher compared to the values in adjacent altitude levels. Such layers, observed in SR2, extend up to ∼ 3 km with a peak near 2.5 km (∼ 0.8 K d−1). In SR3, the vertical extent and magnitude of dT dt are much less within 1 km altitude, and the higher values beyond 1 km are observed close to the land between 75 and 80∘ N. It has been observed that the dust optical depth over the BoB significantly increases during MAM in the 10–20∘ N latitude band (Lakshmi et al., 2017).
Higher values of dT dt are observed more on the western side in SR1 and SR2 during ON (Fig. 6f). In the western side (∼ 70∘ E), these larger values of dT dt extend to relatively higher altitudes during ON as compared to DJF (Fig. 6a, d). Due to the weak precipitation in the western region, the influence of dust is still observed in this region, which is also reflected in the high PDR values in the region (Fig. 4d). It may be noted that the zonal variations in the heating rate profiles do not exactly follow the pattern observed in the extinction coefficient profiles, which is due to the differences in the aerosol types across the study region. Srivastava et al. (2012) showed that compared to the pristine dust in western India, the dust over central IGP is more absorbing due to the mixing with anthropogenic pollutants. Vaishya et al. (2018) showed that altitude-resolved in situ SSA measurements across the IGP were lowest over the central IGP and highest in the western IGP during MAM. However, while using column integrated values of SSA, the heating rates will be underestimated or overestimated depending on whether the SSA at the particular altitude level is overestimated or underestimated (Manoj et al., 2020).
Zonal variations in the columnar mean dT dt for the different regions were estimated for the period when ASSA is available (DJF, MAM, and ON), and the results are shown in Fig. 7. During DJF, the mean values are 0.23, 0.13, and 0.05 K d−1 for sub-regions SR1, SR2, and SR3 respectively. During MAM, these values attain their annual highs of 0.32, 0.17, and 0.05 K d−1, which decrease during ON to 0.27, 0.13, and 0.04 K d−1 respectively in SR1, SR2, and SR3. It is interesting to note that the seasonal variation is significant in SR1 with the highest values in MAM and the lowest values in DJF. The magnitude of dT dt in SR1 is almost double that observed in SR2. On the other hand, SR3 has the lowest magnitudes and the weakest seasonal variations, with the values remaining around ∼ 0.05 K d−1 during all the seasons. It was discussed in Sect. 3.1 that the maximum vertical extent of aerosols is observed around 75∘ E, and it decreases on both sides; a similar pattern can be observed in the case of columnar mean dT dt as well, as shown in Fig. 7. To quantify this, we selected the longitude bands 65.5–77.5∘ E and 77.5–90.5∘ E, and linear regression fits were made between the columnar mean dT dt and longitude. The regression coefficients are shown in Table 4; it can be seen that the slopes of the linear regression fits are positive in the 65.5–77.5∘ E and negative in the 77.5–90.5∘ E longitude bands respectively, as expected. This variation is consistent over the Indian region.
Table 4Mean slope along with its standard error of the linear regression fits created to identify zonal variation in columnar atmospheric heating rates imparted by aerosols for all seasons and sub-regions.
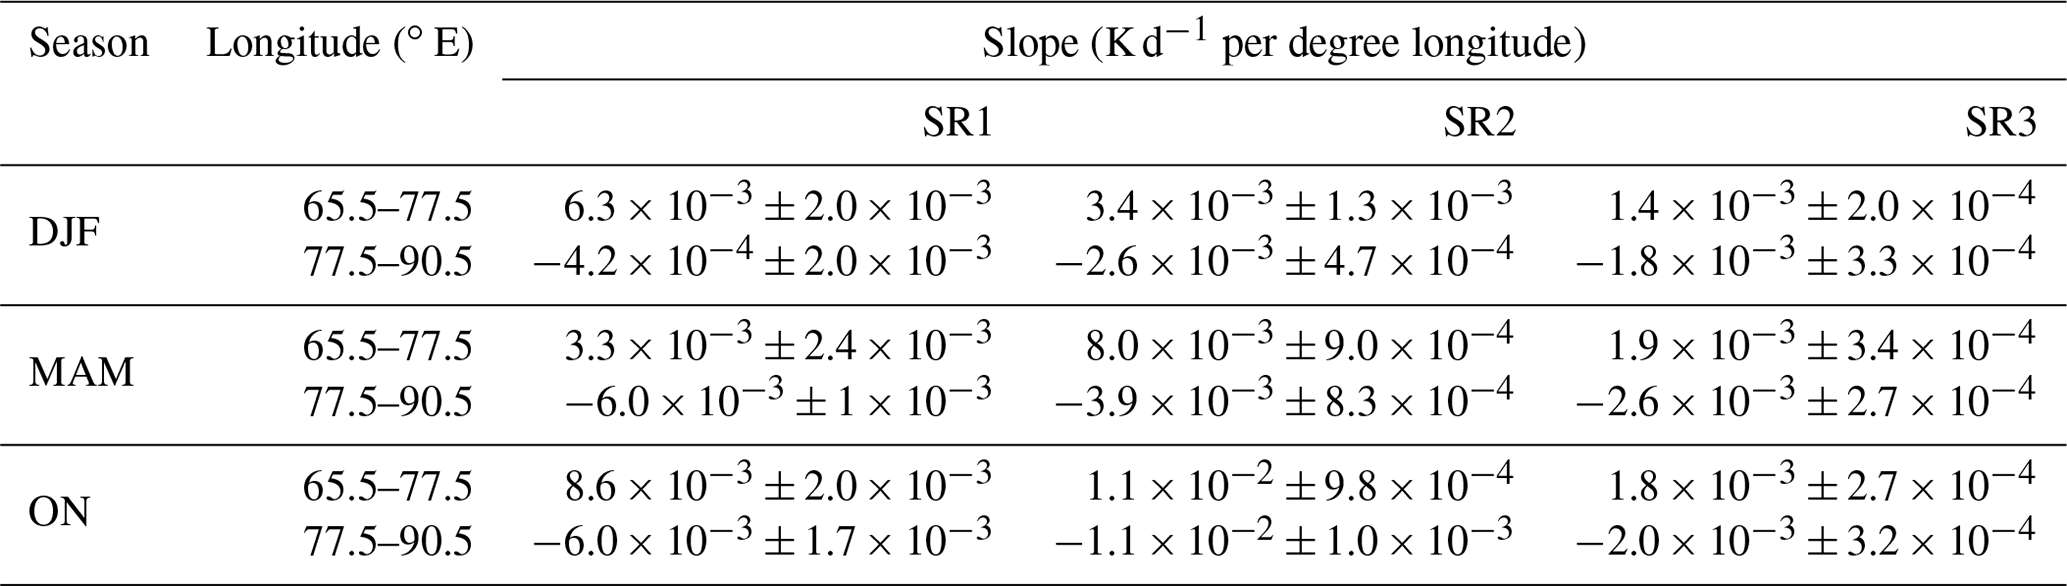
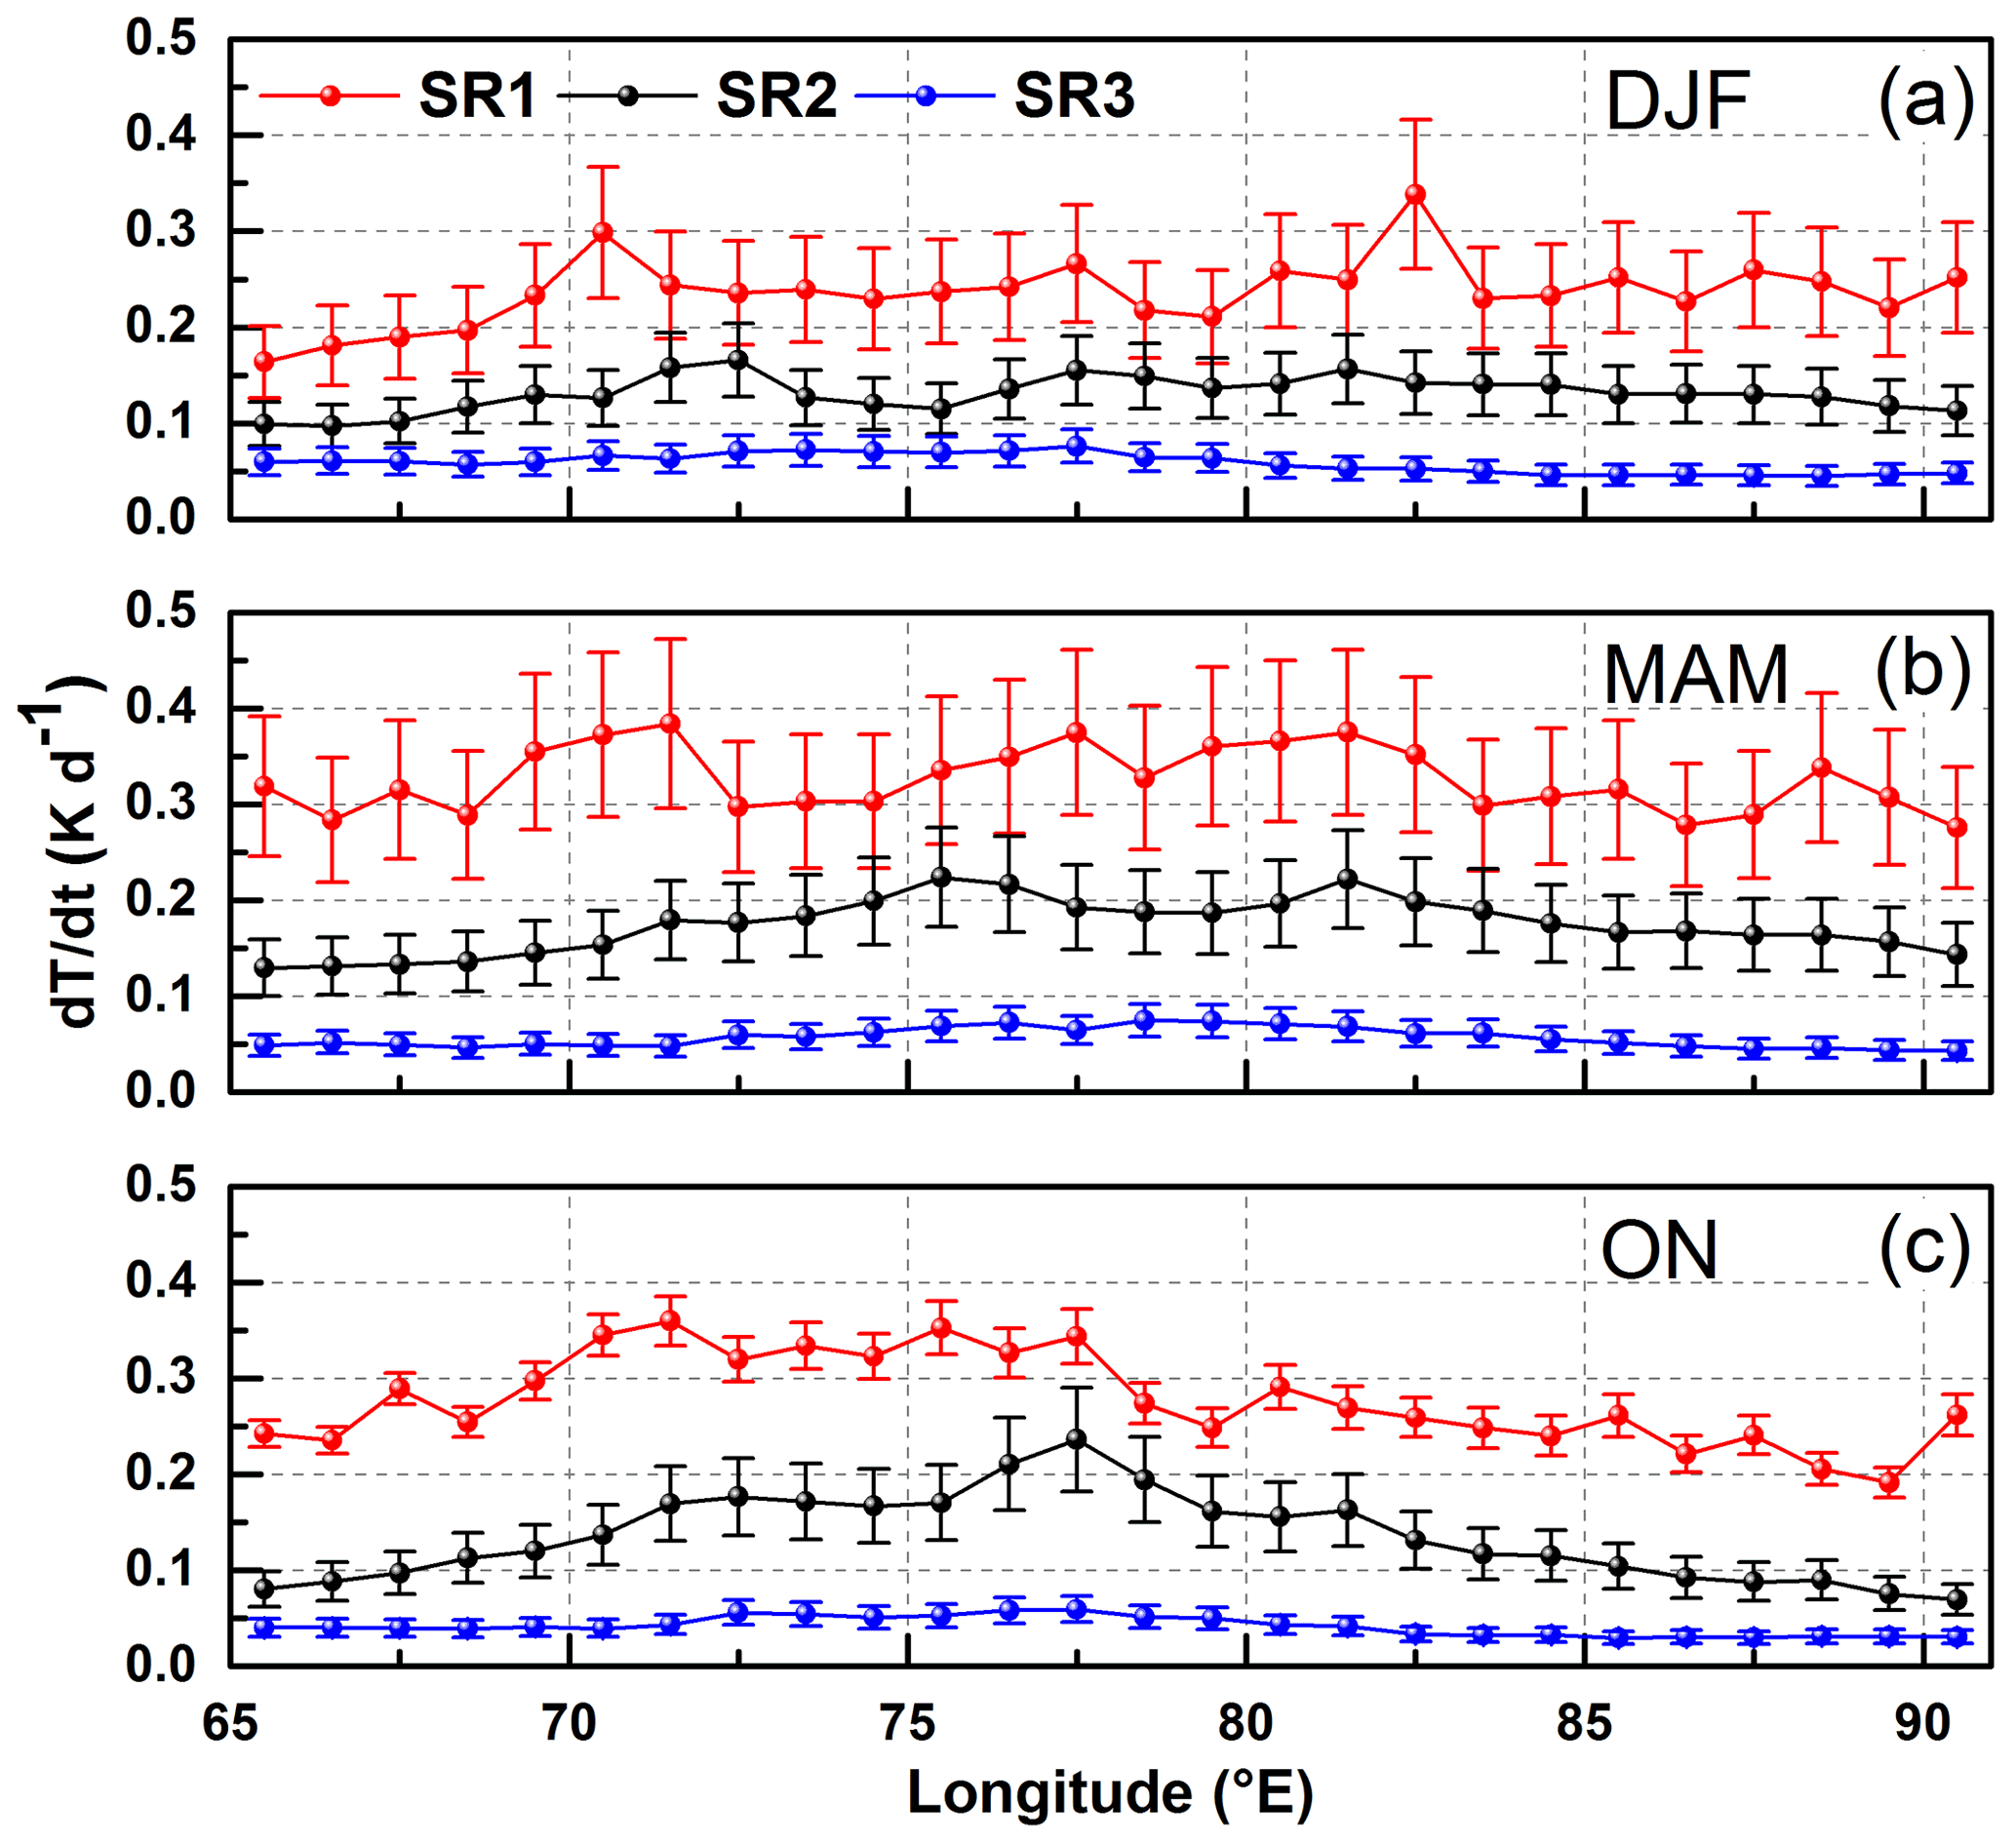
Figure 7Zonal variation in columnar atmospheric heating rates (dT dt) for (a) DJF, (b) MAM, and (c) ON seasons. The error bars represent the standard error.
The nature of the spatial gradients observed in this study, with landmass in between the AS and BoB, is consistent with that over the oceanic regions reported by Nair et al. (2013). Our results show that the pattern is consistent irrespective of seasons. The heating rates peak around the middle of the Indian landmass and decrease on either side. The anthropogenic pollutants, especially the BC aerosols, are abundant over the landmass, and as the distance from the landmass increases, the influence of the pollutants decreases. A previous study by Feng et al. (2016) showed the profiles of dT dt estimates over the Indian landmass and oceanic region separately using a Rapid Radiative Transfer Model (RRTM) for radiative transfer calculations in the WRF-Chem (Weather Research and Forecasting model coupled with chemistry) model: dT dt in their study showed higher values over land than over the ocean, with land exhibiting an exponential decrease vertically from high values at the surface. A detailed comparison of our results with Feng et al. (2016) can be found in Sect. S2 in the Supplement. These observations are consistent with the present work. The observed high-altitude atmospheric heating imparted by aerosols can increase the atmospheric stability, suppress the convective lifting, and possibly influence the synoptic circulation and precipitation patterns over the Indian region. Regional weather modelling studies making use of realistic aerosol observations can shed more light on the role of individual species in bringing about the observed changes.
The vertical structure of aerosols, the atmospheric heating imparted by them, and the seasonality of the spatial (zonal) gradients across the Indian landmass and the adjoining oceans have been characterised for the first time using long-term (2007–2020) data of altitude-resolved aerosol extinction coefficients. An assimilated SSA data set, derived from in situ and satellite observations, has been used to obtain realistic aerosol radiative heating estimates. The important findings are given below.
-
Strong seasonal variations are observed in the aerosol extinction coefficient profiles over the Indian region. Two distinct patterns are observed: one with a higher vertical extent over the western part of India and the other in which the vertical extent increases from west to east, attains a maximum in the centre, and decreases thereafter. The first pattern prevails over the northern Indian plains throughout the year and over the central and southern peninsula only during summer or monsoon seasons.
-
The magnitudes of extinction coefficients also show strong altitudinal variations with the surface concentrations constantly decreasing with increasing altitudes in the southern peninsula. On the other hand, over central India and northern plains, it increases initially with altitude to reach a peak and decreases thereafter.
-
The western region, which acts as a gateway for the transported dust reaching the Indian region, is marked by an abundance of dust aerosols. The dust transport modulates the existing zonal gradients, and its influence decreases towards the east. The vertical extent of dust aerosols is highest during JJAS over northern and central India.
-
The aerosol radiative forcing and the subsequent atmospheric heating rates exhibit strong zonal variations. In northern India, there is a weak positive gradient in DJF which reverses during ON. In central and peninsular India, the AS, the BoB, and the northern Indian Ocean, the zonal variations and vertical extent are identical during DJF and ON. During MAM, elevated heating layers are observed throughout the Indian landmass around 2 km altitude.
Processed data can be downloaded from https://doi.org/10.6084/m9.figshare.19572889.v2 (Kala et al., 2022).
The supplement related to this article is available online at: https://doi.org/10.5194/acp-22-6067-2022-supplement.
NKK, SKS, and KKM together conceived the work. NKK carried out the scientific data analysis and along with NSA, MRM, KKM, and SKS was involved in the scientific interpretation of the results, leading to the formulation of the manuscript. HSP provided the assimilated SSA. NKK prepared the initial draft with inputs from NSA and MRM. All authors reviewed the manuscript.
The contact author has declared that neither they nor their co-authors have any competing interests.
Publisher’s note: Copernicus Publications remains neutral with regard to jurisdictional claims in published maps and institutional affiliations.
CALIPSO data used in this study were obtained from the NASA Langley Research Center Atmospheric Science Data Center. MODIS level 2 surface reflectance was acquired from https://ladsweb.nascom.nasa.gov/, last access: 1 February 2021. We acknowledge the mission scientists of MODIS (for level 3 AOD and level 2 surface reflectance) and OMI (for the SSA) and the associated NASA personnel for the data used in this work. We thank AERONET for providing SSA data through their website https://aeronet.gsfc.nasa.gov/, last access: 22 January 2021. One of the authors (Sreedharan K. Satheesh) would like to thank SERB-DST for the J. C. Bose Fellowship and Tata Education and Development Trust for the support. We thank the Divecha Centre for Climate Change for supporting this work.
This paper was edited by Andreas Petzold and reviewed by three anonymous referees.
Anderson, T. L., Masonis, S. J., Covert, D. S., Ahlquist, N. C., Howell, S. G., Clarke, A. D., and McNaughton, C. S.: Variability of aerosol optical properties derived from in situ aircraft measurements during ACE-Asia, J. Geophys. Res.-Atmos., 108, D23, https://doi.org/10.1029/2002JD003247, 2003.
Ansmann, A., Althausen, D., Wandinger, U., Franke, K., Müller, D., Wagner, F., and Heintzenberg, J.: Vertical profiling of the Indian aerosol plume with six-wavelength lidar during INDOEX: A first case study, Geophys. Res. Lett., 27, 963–966, 2000.
Babu, S. S., Satheesh, S. K., and Moorthy, K. K.: Aerosol radiative forcing due to enhanced black carbon at an urban site in India, Geophys. Res. Lett., 29, 27 pp., 2002.
Babu, S. S., Moorthy, K. K., and Satheesh, S. K.: Vertical and horizontal gradients in aerosol black carbon and its mass fraction to composite aerosols over the east coast of Peninsular India from Aircraft measurements, Adv. Meteorol., 2010, https://doi.org/10.1155/2010/812075, 2010.
Babu, S. S., Moorthy, K. K., Manchanda, R. K., Sinha, P. R., Satheesh, S. K., Vajja, D. P., Srinivasan, S., and Kumar, V. H. A.: Free tropospheric black carbon aerosol measurements using high altitude balloon: Do BC layers build “their own homes” up in the atmosphere?, Geophys. Res. Lett., 38, 8, https://doi.org/10.1029/2011GL046654, 2011.
Babu, S. S., Nair, V. S., Gogoi, M. M., and Moorthy, K. K.: Seasonal variation of vertical distribution of aerosol single scattering albedo over Indian sub-continent: RAWEX aircraft observations, Atmos. Environ., 125, 312–323, 2016.
Badarinath, K. V. S., Kharol, S. K., and Sharma, A. R.: Long-range transport of aerosols from agriculture crop residue burning in Indo-Gangetic Plains – a study using LIDAR, ground measurements and satellite data, J. Atmos. Sol.-Terr. Phys., 71, 112–120, 2009.
Banerjee, P., Satheesh, S. K., Moorthy, K. K., Nanjundiah, R. S., and Nair, V. S.: Long-range transport of mineral dust to the Northeast Indian Ocean: Regional versus remote sources and the implications, J. Clim., 32, 1525–1549, 2019.
Beegum, S. N., Moorthy, K. K., Nair, V. S., Babu, S. S., Satheesh, S. K., Vinoj, V., Reddy, R. R., Gopal, K. R., Badarinath, K. V. S., and Niranjan, K.: Characteristics of spectral aerosol optical depths over India during ICARB, J. Earth Syst. Sci., 117, 303–313, 2008.
Bhattacharya, A., Chakraborty, A., and Venugopal, V.: Role of aerosols in modulating cloud properties during active–break cycle of Indian summer monsoon, Clim. Dynam., 49, 2131–2145, 2017.
Bond, T. C., Doherty, S. J., Fahey, D. W., Forster, P. M., Berntsen, T., DeAngelo, B. J., Flanner, M. G., Ghan, S., Kärcher, B., Koch, D., Kinne, S., Kondo, Y., Quinn, P. K., Sarofim, M. C., Schultz, M. G., Schulz, M., Venkataraman, C., Zhang, H., Zhang, S., Bellouin, N., Guttikunda, S. K., Hopke, P. K., Jacobson, M. Z., Kaiser, J. W., Klimont, Z., Lohmann, U., Schwarz, J. P., Shindell, D., Storelvmo, T., Warren, S. G., and Zender, C. S.: Bounding the role of black carbon in the climate system: A scientific assessment, J. Geophys. Res.-Atmos., 118, 5380–5552, https://doi.org/10.1002/jgrd.50171, 2013.
Boucher, O., Randall, D., Artaxo, P., Bretherton, C., Feingold, G., Forster, P., Kerminen, V.-M., Kondo, Y., Liao, H., and Lohmann, U.: Clouds and aerosols, in: Climate change 2013: the physical science basis. Contribution of Working Group I to the Fifth Assessment Report of the Intergovernmental Panel on Climate Change, Cambridge University Press, 571–657, 2013.
Brooks, J., Allan, J. D., Williams, P. I., Liu, D., Fox, C., Haywood, J., Langridge, J. M., Highwood, E. J., Kompalli, S. K., O'Sullivan, D., Babu, S. S., Satheesh, S. K., Turner, A. G., and Coe, H.: Vertical and horizontal distribution of submicron aerosol chemical composition and physical characteristics across northern India during pre-monsoon and monsoon seasons, Atmos. Chem. Phys., 19, 5615–5634, https://doi.org/10.5194/acp-19-5615-2019, 2019.
Chandrasekhar, S.: Radiative transfer, Dover Publications, New York, ISBN 10 0486605906, ISBN 13 9780486605906, 1960.
Choi, J.-O. and Chung, C. E.: Sensitivity of aerosol direct radiative forcing to aerosol vertical profile, Tellus B, 66, 24376, https://doi.org/10.3402/tellusb.v66.24376, 2014.
Das, S., Giorgi, F., and Giuliani, G.: Investigating the relative responses of regional monsoon dynamics to snow darkening and direct radiative effects of dust and carbonaceous aerosols over the Indian subcontinent, Clim. Dynam., 55, 1011–1030, 2020.
Deepshikha, S., Satheesh, S. K., and Srinivasan, J.: Regional distribution of absorbing efficiency of dust aerosols over India and adjacent continents inferred using satellite remote sensing, Geophys. Res. Lett., 32, https://doi.org/10.1029/2004GL022091, 2005.
Di Girolamo, L., Bond, T. C., Bramer, D., Diner, D. J., Fettinger, F., Kahn, R. A., Martonchik, J. V., Ramana, M. V., Ramanathan, V., and Rasch, P. J.: Analysis of Multi-angle Imaging SpectroRadiometer (MISR) aerosol optical depths over greater India during winter 2001–2004, Geophys. Res. Lett., 31, https://doi.org/10.1029/2004GL021273, 2004.
Dubovik, O., Smirnov, A., Holben, B. N., King, M. D., Kaufman, Y. J., Eck, T. F., and Slutsker, I.: Accuracy assessments of aerosol optical properties retrieved from Aerosol Robotic Network (AERONET) Sun and sky radiance measurements, J. Geophys. Res.-Atmos., 105, 9791–9806, 2000.
Eck, T. F., Holben, B. N., Sinyuk, A., Pinker, R. T., Goloub, P., Chen, H., Chatenet, B., Li, Z., Singh, R. P., and Tripathi, S. N.: Climatological aspects of the optical properties of fine/coarse mode aerosol mixtures, J. Geophys. Res.-Atmos., 115, D19, https://doi.org/10.1029/2010JD014002, 2010.
Eswaran, K., Satheesh, S. K., and Srinivasan, J.: Multi-satellite retrieval of single scattering albedo using the OMI–MODIS algorithm, Atmos. Chem. Phys., 19, 3307–3324, https://doi.org/10.5194/acp-19-3307-2019, 2019.
Feng, Y., Kotamarthi, V. R., Coulter, R., Zhao, C., and Cadeddu, M.: Radiative and thermodynamic responses to aerosol extinction profiles during the pre-monsoon month over South Asia, Atmos. Chem. Phys., 16, 247–264, https://doi.org/10.5194/acp-16-247-2016, 2016.
Franke, K., Ansmann, A., Müller, D., Althausen, D., Wagner, F., and Scheele, R.: One-year observations of particle lidar ratio over the tropical Indian Ocean with Raman lidar, Geophys. Res. Lett., 28, 4559–4562, 2001.
Franke, K., Ansmann, A., Müller, D., Althausen, D., Venkataraman, C., Reddy, M. S., Wagner, F., and Scheele, R.: Optical properties of the Indo-Asian haze layer over the tropical Indian Ocean, J. Geophys. Res.-Atmos., 108, D2, https://doi.org/10.1029/2002JD002473, 2003.
Gadi, R., Kulshrestha, U. C., Sarkar, A. K., Garg, S. C., and Parashar, D. C.: Emissions of SO2 and NOx from biofuels in India, Tellus B, 55, 787–795, 2011.
Garg, A., Shukla, P. R., Bhattacharya, S., and Dadhwal, V. K.: Sub-region (district) and sector level SO2 and NOx emissions for India: assessment of inventories and mitigation flexibility, Atmos. Environ., 35, 703–713, 2001.
Gautam, R., Liu, Z., Singh, R. P., and Hsu, N. C.: Two contrasting dust-dominant periods over India observed from MODIS and CALIPSO data, Geophys. Res. Lett., 36, https://doi.org/10.1029/2008GL036967, 2009.
Gautam, R., Hsu, N. C., and Lau, K. M.: Premonsoon aerosol characterization and radiative effects over the Indo-Gangetic Plains: Implications for regional climate warming, J. Geophys. Res.-Atmos., 115, https://doi.org/10.1029/2010JD013819, 2010.
Ghan, S. J., Liu, X., Easter, R. C., Zaveri, R., Rasch, P. J., Yoon, J.-H., and Eaton, B.: Toward a minimal representation of aerosols in climate models: Comparative decomposition of aerosol direct, semidirect, and indirect radiative forcing, J. Clim., 25, 6461–6476, 2012.
Giles, D. M., Holben, B. N., Tripathi, S. N., Eck, T. F., Newcomb, W. W., Slutsker, I., Dickerson, R. R., Thompson, A. M., Mattoo, S., and Wang, S. H.: Aerosol properties over the Indo-Gangetic Plain: A mesoscale perspective from the TIGERZ experiment, J. Geophys. Res.-Atmos., 116, D18, https://doi.org/10.1029/2011JD015809, 2011.
Ginoux, P., Prospero, J. M., Gill, T. E., Hsu, N. C., and Zhao, M.: Global-scale attribution of anthropogenic and natural dust sources and their emission rates based on MODIS Deep Blue aerosol products, Rev. Geophys., 50, https://doi.org/10.1029/2012RG000388, 2012.
Goto, D., Takemura, T., Nakajima, T., and Badarinath, K. V. S.: Global aerosol model-derived black carbon concentration and single scattering albedo over Indian region and its comparison with ground observations, Atmos. Environ., 45, 3277–3285, https://doi.org/10.1016/j.atmosenv.2011.03.037, 2011.
Groß, S., Tesche, M., Freudenthaler, V., Toledano, C., Wiegner, M., Ansmann, A., Althausen, D., and Seefeldner, M.: Characterization of Saharan dust, marine aerosols and mixtures of biomass-burning aerosols and dust by means of multi-wavelength depolarization and Raman lidar measurements during SAMUM 2, Tellus B, 63, 706–724, 2011.
Hess, M., Koepke, P., and Schult, I.: Optical properties of aerosols and clouds: The software package OPAC, Bull. Am. Meteorol. Soc., 79, 831–844, 1998.
Hofer, J., Althausen, D., Abdullaev, S. F., Makhmudov, A. N., Nazarov, B. I., Schettler, G., Engelmann, R., Baars, H., Fomba, K. W., Müller, K., Heinold, B., Kandler, K., and Ansmann, A.: Long-term profiling of mineral dust and pollution aerosol with multiwavelength polarization Raman lidar at the Central Asian site of Dushanbe, Tajikistan: case studies, Atmos. Chem. Phys., 17, 14559–14577, https://doi.org/10.5194/acp-17-14559-2017, 2017.
Hofer, J., Ansmann, A., Althausen, D., Engelmann, R., Baars, H., Fomba, K. W., Wandinger, U., Abdullaev, S. F., and Makhmudov, A. N.: Optical properties of Central Asian aerosol relevant for spaceborne lidar applications and aerosol typing at 355 and 532 nm, Atmos. Chem. Phys., 20, 9265–9280, https://doi.org/10.5194/acp-20-9265-2020, 2020.
Hu, Q., Wang, H., Goloub, P., Li, Z., Veselovskii, I., Podvin, T., Li, K., and Korenskiy, M.: The characterization of Taklamakan dust properties using a multiwavelength Raman polarization lidar in Kashi, China, Atmos. Chem. Phys., 20, 13817–13834, https://doi.org/10.5194/acp-20-13817-2020, 2020.
Jin, Q., Wei, J., and Yang, Z. L.: Positive response of Indian summer rainfall to Middle East dust, Geophys. Res. Lett., 41, 4068–4074, 2014.
Kala, N. K., Anand, N. S., Manoj, M. R., Pathak, H. S., Moorthy, K. K., and Satheesh, S. K.: ACP-2021-740, figshare [data set], https://doi.org/10.6084/m9.figshare.19572889.v2, 2022
Kalnay, E.: Atmospheric modeling, data assimilation and predictability, Cambridge University Press, 2003.
Kedia, S., Ramachandran, S., Holben, B. N., and Tripathi, S. N.: Quantification of aerosol type, and sources of aerosols over the Indo-Gangetic Plain, Atmos. Environ., 98, 607–619, https://doi.org/10.1016/j.atmosenv.2014.09.022, 2014.
Kim, M.-H., Omar, A. H., Tackett, J. L., Vaughan, M. A., Winker, D. M., Trepte, C. R., Hu, Y., Liu, Z., Poole, L. R., Pitts, M. C., Kar, J., and Magill, B. E.: The CALIPSO version 4 automated aerosol classification and lidar ratio selection algorithm, Atmos. Meas. Tech., 11, 6107–6135, https://doi.org/10.5194/amt-11-6107-2018, 2018.
Kipling, Z., Stier, P., Johnson, C. E., Mann, G. W., Bellouin, N., Bauer, S. E., Bergman, T., Chin, M., Diehl, T., Ghan, S. J., Iversen, T., Kirkevåg, A., Kokkola, H., Liu, X., Luo, G., van Noije, T., Pringle, K. J., von Salzen, K., Schulz, M., Seland, Ø., Skeie, R. B., Takemura, T., Tsigaridis, K., and Zhang, K.: What controls the vertical distribution of aerosol? Relationships between process sensitivity in HadGEM3–UKCA and inter-model variation from AeroCom Phase II, Atmos. Chem. Phys., 16, 2221–2241, https://doi.org/10.5194/acp-16-2221-2016, 2016.
Koffi, B., Schulz, M., Bréon, F. M., Griesfeller, J., Winker, D., Balkanski, Y., Bauer, S., Berntsen, T., Chin, M., and Collins, W. D.: Application of the CALIOP layer product to evaluate the vertical distribution of aerosols estimated by global models: AeroCom phase I results, J. Geophys. Res.-Atmos., 117, D10, https://doi.org/10.1029/2011JD016858, 2012.
Koffi, B., Schulz, M., Bréon, F. M., Dentener, F., Steensen, B. M., Griesfeller, J., Winker, D., Balkanski, Y., Bauer, S. E., and Bellouin, N.: Evaluation of the aerosol vertical distribution in global aerosol models through comparison against CALIOP measurements: AeroCom phase II results, J. Geophys. Res.-Atmos., 121, 7254–7283, 2016.
Kompalli, S. K., Babu, S. N. S., Moorthy, K. K., Satheesh, S. K., Gogoi, M. M., Nair, V. S., Jayachandran, V. N., Liu, D., Flynn, M. J., and Coe, H.: Mixing state of refractory black carbon aerosol in the South Asian outflow over the northern Indian Ocean during winter, Atmos. Chem. Phys., 21, 9173–9199, https://doi.org/10.5194/acp-21-9173-2021, 2021.
Kumar, A., Sudheer, A. K., and Sarin, M. M.: Chemical characteristics of aerosols in MABL of Bay of Bengal and Arabian Sea during spring inter-monsoon: a comparative study, J. Earth Syst. Sci., 117, 325–332, 2008.
Lakshmi, N. B., Nair, V. S., and Babu, S. S.: Vertical structure of aerosols and mineral dust over the Bay of Bengal from multisatellite observations, J. Geophys. Res.-Atmos., 122, 812845–812861, https://doi.org/10.1002/2017JD027643, 2017.
Lau, K. M., Kim, M. K., and Kim, K. M.: Asian summer monsoon anomalies induced by aerosol direct forcing: the role of the Tibetan Plateau, Clim. Dynam., 26, 855–864, 2006.
Leibensperger, E. M., Mickley, L. J., Jacob, D. J., Chen, W.-T., Seinfeld, J. H., Nenes, A., Adams, P. J., Streets, D. G., Kumar, N., and Rind, D.: Climatic effects of 1950–2050 changes in US anthropogenic aerosols – Part 2: Climate response, Atmos. Chem. Phys., 12, 3349–3362, https://doi.org/10.5194/acp-12-3349-2012, 2012.
Léon, J. F., Chazette, P., Dulac, F., Pelon, J., Flamant, C., Bonazzola, M., Foret, G., Alfaro, S. C., Cachier, H., Cautenet, S., and Hamonou, E.: Large-scale advection of continental aerosols during INDOEX, J. Geophys. Res.-Atmos., 106, 28427–28439, 2001.
Lewis, J. M., Lakshmivarahan, S., and Dhall, S.: Dynamic data assimilation: a least squares approach, Cambridge University Press, Cambridge, https://doi.org/10.1017/CBO9780511526480, 2006.
Li, F. and Ramanathan, V.: Winter to summer monsoon variation of aerosol optical depth over the tropical Indian Ocean, J. Geophys. Res.-Atmos., 107, D16, https://doi.org/10.1029/2001JD000949, 2002.
Liou, K.-N.: An introduction to atmospheric radiation, Elsevier, Vol. 84, ISBN 9780124514508, ISBN 9780080954592, 2002.
Liu, Z., Vaughan, M., Winker, D., Kittaka, C., Getzewich, B., Kuehn, R., Omar, A., Powell, K., Trepte, C., and Hostetler, C.: The CALIPSO lidar cloud and aerosol discrimination: Version 2 algorithm and initial assessment of performance, J. Atmos. Ocean. Technol., 26, 1198–1213, 2009.
Liu, Z., Kar, J., Zeng, S., Tackett, J., Vaughan, M., Avery, M., Pelon, J., Getzewich, B., Lee, K.-P., Magill, B., Omar, A., Lucker, P., Trepte, C., and Winker, D.: Discriminating between clouds and aerosols in the CALIOP version 4.1 data products, Atmos. Meas. Tech., 12, 703–734, https://doi.org/10.5194/amt-12-703-2019, 2019.
Mann, G. W., Carslaw, K. S., Reddington, C. L., Pringle, K. J., Schulz, M., Asmi, A., Spracklen, D. V., Ridley, D. A., Woodhouse, M. T., Lee, L. A., Zhang, K., Ghan, S. J., Easter, R. C., Liu, X., Stier, P., Lee, Y. H., Adams, P. J., Tost, H., Lelieveld, J., Bauer, S. E., Tsigaridis, K., van Noije, T. P. C., Strunk, A., Vignati, E., Bellouin, N., Dalvi, M., Johnson, C. E., Bergman, T., Kokkola, H., von Salzen, K., Yu, F., Luo, G., Petzold, A., Heintzenberg, J., Clarke, A., Ogren, J. A., Gras, J., Baltensperger, U., Kaminski, U., Jennings, S. G., O'Dowd, C. D., Harrison, R. M., Beddows, D. C. S., Kulmala, M., Viisanen, Y., Ulevicius, V., Mihalopoulos, N., Zdimal, V., Fiebig, M., Hansson, H.-C., Swietlicki, E., and Henzing, J. S.: Intercomparison and evaluation of global aerosol microphysical properties among AeroCom models of a range of complexity, Atmos. Chem. Phys., 14, 4679–4713, https://doi.org/10.5194/acp-14-4679-2014, 2014.
Manoj, M. R., Satheesh, S. K., Moorthy, K. K., Gogoi, M. M., and Babu, S. S.: Decreasing trend in black carbon aerosols over the Indian region, Geophys. Res. Lett., 46, 2903–2910, 2019.
Manoj, M. R., Satheesh, S. K., Moorthy, K. K., and Coe, H.: Vertical profiles of submicron aerosol single scattering albedo over the Indian region immediately before monsoon onset and during its development: research from the SWAAMI field campaign, Atmos. Chem. Phys., 20, 4031–4046, https://doi.org/10.5194/acp-20-4031-2020, 2020.
Mishra, A. K. and Shibata, T.: Climatological aspects of seasonal variation of aerosol vertical distribution over central Indo-Gangetic belt (IGB) inferred by the space-borne lidar CALIOP, Atmos. Environ., 57, 205–218, 2012.
Moorthy, K. K. and Saha, A.: Aerosol study during INDOEX: Observation of enhanced aerosol activity over the mid Arabian Sea during the northern winter, J. Atmos. Sol.-Terr. Phys., 62, 65–72, 2000.
Moorthy, K. K., Babu, S. S., Sunilkumar, S. V., Gupta, P. K., and Gera, B. S.: Altitude profiles of aerosol BC, derived from aircraft measurements over an inland urban location in India, Geophys. Res. Lett., 31, 2004.
Moorthy, K. K., Sunilkumar, S. V., Pillai, P. S., Parameswaran, K., Nair, P. R., Ahmed, Y. N., Ramgopal, K., Narasimhulu, K., Reddy, R. R., and Vinoj, V.: Wintertime spatial characteristics of boundary layer aerosols over peninsular India, J. Geophys. Res.-Atmos., 110, D8, https://doi.org/10.1029/2004JD005520, 2005a.
Moorthy, K. K., Babu, S. S., and Satheesh, S. K.: Aerosol characteristics and radiative impacts over the Arabian Sea during the intermonsoon season: Results from ARMEX field campaign, J. Atmos. Sci., 62, 192–206, 2005b.
Moorthy, K. K., Babu, S. S., Satheesh, S. K., Srinivasan, J., and Dutt, C. B. S.: Dust absorption over the “Great Indian Desert” inferred using ground-based and satellite remote sensing, J. Geophys. Res.-Atmos., 112, D9, https://doi.org/10.1029/2006JD007690, 2007.
Moorthy, K. K., Satheesh, S. K., Babu, S. S., and Dutt, C. B. S.: Integrated campaign for aerosols, gases and radiation budget (ICARB): an overview, J. Earth Syst. Sci., 117, 243–262, 2008.
Moorthy, K. K., Nair, V. S., Babu, S. S., and Satheesh, S. K.: Spatial and vertical heterogeneities in aerosol properties over oceanic regions around India: Implications for radiative forcing, Q. J. Roy. Meteor. Soc., 135, 2131–2145, 2009.
Müller, D., Franke, K., Wagner, F., Althausen, D., Ansmann, A., and Heintzenberg, J.: Vertical profiling of optical and physical particle properties over the tropical Indian Ocean with six-wavelength lidar: 1. Seasonal cycle, J. Geophys. Res., 106, 28567–28575, 2001a.
Müller, D., Franke, K., Wagner, F., Althausen, D., Ansmann, A., and Heintzenberg, J.: Vertical profiling of optical and physical particle properties over the tropical Indian Ocean with six-wavelength lidar: 2. Case studies, J. Geophys. Res., 106, 28577–28595, 2001b.
Myhre, G., Samset, B. H., Schulz, M., Balkanski, Y., Bauer, S., Berntsen, T. K., Bian, H., Bellouin, N., Chin, M., Diehl, T., Easter, R. C., Feichter, J., Ghan, S. J., Hauglustaine, D., Iversen, T., Kinne, S., Kirkevåg, A., Lamarque, J.-F., Lin, G., Liu, X., Lund, M. T., Luo, G., Ma, X., van Noije, T., Penner, J. E., Rasch, P. J., Ruiz, A., Seland, Ø., Skeie, R. B., Stier, P., Takemura, T., Tsigaridis, K., Wang, P., Wang, Z., Xu, L., Yu, H., Yu, F., Yoon, J.-H., Zhang, K., Zhang, H., and Zhou, C.: Radiative forcing of the direct aerosol effect from AeroCom Phase II simulations, Atmos. Chem. Phys., 13, 1853–1877, https://doi.org/10.5194/acp-13-1853-2013, 2013.
Nair, V. S., Moorthy, K. K., Alappattu, D. P., Kunhikrishnan, P. K., George, S., Nair, P. R., Babu, S. S., Abish, B., Satheesh, S. K., and Tripathi, S. N.: Wintertime aerosol characteristics over the Indo-Gangetic Plain (IGP): Impacts of local boundary layer processes and long-range transport, J. Geophys. Res.-Atmos., 112, D13, https://doi.org/10.1029/2006JD008099, 2007.
Nair, V. S., Babu, S. S., and Moorthy, K. K.: Spatial distribution and spectral characteristics of aerosol single scattering albedo over the Bay of Bengal inferred from shipborne measurements, Geophys. Res. Lett., 35, https://doi.org/10.1029/2008GL033687, 2008a.
Nair, V. S., Babu, S. S., and Moorthy, K. K.: Aerosol characteristics in the marine atmospheric boundary layer over the Bay of Bengal and Arabian Sea during ICARB: Spatial distribution and latitudinal and longitudinal gradients, J. Geophys. Res.-Atmos., 113, D15208, https://doi.org/10.1029/2008jd009823, 2008b.
Nair, V. S., Babu, S. S., Moorthy, K. K., Sharma, A. K., Marinoni, A., and Ajai: Black carbon aerosols over the Himalayas: direct and surface albedo forcing, Tellus B, 65, 19738, https://doi.org/10.3402/tellusb.v65i0.19738, 2013.
Namdari, S., Karimi, N., Sorooshian, A., Mohammadi, G., and Sehatkashani, S.: Impacts of climate and synoptic fluctuations on dust storm activity over the Middle East, Atmos. Environ., 173, 265–276, https://doi.org/10.1016/j.atmosenv.2017.11.016, 2018.
Niranjan, K., Sreekanth, V., Madhavan, B. L., and Moorthy, K. K.: Aerosol physical properties and Radiative forcing at the outflow region from the Indo-Gangetic plains during typical clear and hazy periods of wintertime, Geophys. Res. Lett., 34, https://doi.org/10.1029/2007GL031224, 2007.
Pandithurai, G., Dipu, S., Dani, K. K., Tiwari, S., Bisht, D. S., Devara, P. C. S., and Pinker, R. T.: Aerosol radiative forcing during dust events over New Delhi, India, J. Geophys. Res.-Atmos., 113, D13, https://doi.org/10.1029/2008JD009804, 2008.
Patel, P. and Shukla, A. K.: Aerosol optical properties over marine and continental sites of India during pre-monsoon season, Curr. Sci., 108, 666–676, 2015.
Pathak, B. and Bhuyan, P. K.: Absorbing and scattering properties of boundary layer aerosols over Dibrugarh, Northeast India, Int. J. Remote Sens., 35, 5527–5543, 2014.
Pathak, H. S., Satheesh, S. K., Nanjundiah, R. S., Moorthy, K. K., Lakshmivarahan, S., and Babu, S. N. S.: Assessment of regional aerosol radiative effects under the SWAAMI campaign – Part 1: Quality-enhanced estimation of columnar aerosol extinction and absorption over the Indian subcontinent, Atmos. Chem. Phys., 19, 11865–11886, https://doi.org/10.5194/acp-19-11865-2019, 2019.
Pöschl, U.: Atmospheric aerosols: composition, transformation, climate and health effects, Angew. Chem. Int. Edit., 44, 7520–7540, 2005.
Pozzer, A., de Meij, A., Yoon, J., Tost, H., Georgoulias, A. K., and Astitha, M.: AOD trends during 2001–2010 from observations and model simulations, Atmos. Chem. Phys., 15, 5521–5535, https://doi.org/10.5194/acp-15-5521-2015, 2015.
Prasad, A. K. and Singh, R. P.: Changes in aerosol parameters during major dust storm events (2001–2005) over the Indo-Gangetic Plains using AERONET and MODIS data, J. Geophys. Res.-Atmos., 112, D9, https://doi.org/10.1029/2006JD007778, 2007.
Prasad, A. K., Singh, R. P., and Kafatos, M.: Influence of coal based thermal power plants on aerosol optical properties in the Indo-Gangetic basin, Geophys. Res. Lett., 33, https://doi.org/10.1029/2005GL023801, 2006.
Prasad, P., Raman, M. R., Ratnam, M. V., Ravikiran, V., Madhavan, B. L., and Rao, S. V. B.: Nocturnal, seasonal and intra-annual variability of tropospheric aerosols observed using ground-based and space-borne lidars over a tropical location of India, Atmos. Environ., 213, 185–198, 2019.
Prijith, S. S., Aloysius, M., Mohan, M., Beegum, N., and Moorthy, K. K.: Role of circulation parameters in long range aerosol transport: evidence from Winter-ICARB, J. Atmos. Sol.-Terr. Phys., 77, 144–151, 2012.
Prijith, S. S., Babu, S. S., Lakshmi, N. B., Satheesh, S. K., and Moorthy, K. K.: Meridional gradients in aerosol vertical distribution over Indian Mainland: Observations and model simulations, Atmos. Environ., 125, 337–345, 2016.
Ramana, M. V., Ramanathan, V., Podgorny, I. A., Pradhan, B. B., and Shrestha, B.: The direct observations of large aerosol radiative forcing in the Himalayan region, Geophys. Res. Lett., 31, https://doi.org/10.1029/2003GL018824, 2004.
Ramanathan, V., Crutzen, P. J., Kiehl, J. T., and Rosenfeld, D.: Aerosols, climate, and the hydrological cycle, Science, 294, 2119–2124, 2001.
Ratnam, M. V., Prasad, P., Roja Raman, M., Ravikiran, V., Bhaskara Rao, S. V., Krishna Murthy, B. V., and Jayaraman, A.: Role of dynamics on the formation and maintenance of the elevated aerosol layer during monsoon season over south-east peninsular India, Atmos. Environ., 188, 43–49, https://doi.org/10.1016/j.atmosenv.2018.06.023, 2018.
Ratnam, M. V., Prasad, P., Raj, S. T. A., Raman, M. R., and Basha, G.: Changing patterns in aerosol vertical distribution over South and East Asia, Sci. Rep., 11, 1–11, 2021.
Reddy, M. S. and Venkataraman, C.: Inventory of aerosol and sulphur dioxide emissions from India: I – Fossil fuel combustion, Atmos. Environ., 36, 677–697, 2002.
Remer, L. A., Kaufman, Y. J., Tanre, D., Mattoo, S., and Chu, D. A.: Coauthors, 2005: The MODIS algorithm, products, and validation, J. Atmos. Sci., 62, 947–973, 2005.
Remer, L. A., Kleidman, R. G., Levy, R. C., Kaufman, Y. J., Tanré, D., Mattoo, S., Martins, J. V., Ichoku, C., Koren, I., and Yu, H.: Global aerosol climatology from the MODIS satellite sensors, J. Geophys. Res.-Atmos., 113, D14, https://doi.org/10.1029/2007JD009661, 2008.
Ricchiazzi, P., Yang, S., Gautier, C., and Sowle, D.: SBDART: A research and teaching software tool for plane-parallel radiative transfer in the Earth's atmosphere, Bull. Am. Meteorol. Soc., 79, 2101–2114, 1998.
Samset, B. H., Myhre, G., Schulz, M., Balkanski, Y., Bauer, S., Berntsen, T. K., Bian, H., Bellouin, N., Diehl, T., Easter, R. C., Ghan, S. J., Iversen, T., Kinne, S., Kirkevåg, A., Lamarque, J.-F., Lin, G., Liu, X., Penner, J. E., Seland, Ø., Skeie, R. B., Stier, P., Takemura, T., Tsigaridis, K., and Zhang, K.: Black carbon vertical profiles strongly affect its radiative forcing uncertainty, Atmos. Chem. Phys., 13, 2423–2434, https://doi.org/10.5194/acp-13-2423-2013, 2013.
Satheesh, S. K.: Radiative forcing by aerosols over Bay of Bengal region, Geophys. Res. Lett, 29, https://doi.org/10.1029/2002GL015334, 2002.
Satheesh, S. K., Vinoj, V., and Moorthy, K. K.: Vertical distribution of aerosols over an urban continental site in India inferred using a micro pulse lidar, Geophys. Res. Lett., 33, https://doi.org/10.1029/2006GL027729, 2006.
Satheesh, S. K., Moorthy, K. K., Babu, S. S., Vinoj, V., and Dutt, C. B. S.: Climate implications of large warming by elevated aerosol over India, Geophys. Res. Lett., 35, https://doi.org/10.1029/2008GL034944, 2008.
Satheesh, S. K., Vinoj, V., Suresh Babu, S., Krishna Moorthy, K., and Nair, V. S.: Vertical distribution of aerosols over the east coast of India inferred from airborne LIDAR measurements, Ann. Geophys., 27, 4157–4169, https://doi.org/10.5194/angeo-27-4157-2009, 2009a.
Satheesh, S. K., Torres, O., Remer, L. A., Babu, S. S., Vinoj, V., Eck, T. F., Kleidman, R. G., and Holben, B. N.: Improved assessment of aerosol absorption using OMI-MODIS joint retrieval, J. Geophys. Res.-Atmos., 114, D5, https://doi.org/10.1029/2008JD011024, 2009b.
Satheesh, S. K., Moorthy, K. K., Suresh Babu, S., Vinoj, V., Nair, V. S., Naseema Beegum, S., Dutt, C. B. S., Alappattu, D. P., and Kunhikrishnan, P. K.: Vertical structure and horizontal gradients of aerosol extinction coefficients over coastal India inferred from airborne lidar measurements during the Integrated Campaign for Aerosol, Gases and Radiation Budget (ICARB) field campaign, J. Geophys. Res.-Atmos., 114, D5, https://doi.org/10.1029/2008JD011033, 2009c.
Satheesh, S. K., Vinoj, V., and Krishnamoorthy, K.: Assessment of aerosol radiative impact over oceanic regions adjacent to Indian subcontinent using multisatellite analysis, Adv. Meteorol., 2010, https://doi.org/10.1155/2010/139186, 2010.
Sathyanadh, A., Prabhakaran, T., Patil, C., and Karipot, A.: Planetary boundary layer height over the Indian subcontinent: Variability and controls with respect to monsoon, Atmos. Res., 195, 44–61, 2017.
Schulz, M., Textor, C., Kinne, S., Balkanski, Y., Bauer, S., Berntsen, T., Berglen, T., Boucher, O., Dentener, F., Guibert, S., Isaksen, I. S. A., Iversen, T., Koch, D., Kirkevåg, A., Liu, X., Montanaro, V., Myhre, G., Penner, J. E., Pitari, G., Reddy, S., Seland, Ø., Stier, P., and Takemura, T.: Radiative forcing by aerosols as derived from the AeroCom present-day and pre-industrial simulations, Atmos. Chem. Phys., 6, 5225–5246, https://doi.org/10.5194/acp-6-5225-2006, 2006.
Solmon, F., Nair, V. S., and Mallet, M.: Increasing Arabian dust activity and the Indian summer monsoon, Atmos. Chem. Phys., 15, 8051–8064, https://doi.org/10.5194/acp-15-8051-2015, 2015.
Srinivas, B. and Sarin, M. M.: Atmospheric dry-deposition of mineral dust and anthropogenic trace metals to the Bay of Bengal, J. Mar. Syst., 126, 56–68, 2013.
Srivastava, A. K., Ram, K., Pant, P., Hegde, P., and Joshi, H.: Black carbon aerosols over Manora Peak in the Indian Himalayan foothills: implications for climate forcing, Environ. Res. Lett., 7, 014002, https://doi.org/10.1088/1748-9326/7/1/014002, 2012.
Srivastava, R., Ramachandran, S., Rajesh, T. A., and Kedia, S.: Aerosol radiative forcing deduced from observations and models over an urban location and sensitivity to single scattering albedo, Atmos. Environ., 45, 6163–6171, https://doi.org/10.1016/j.atmosenv.2011.08.015, 2011.
Stamnes, K., Tsay, S.-C., Wiscombe, W., and Jayaweera, K.: Numerically stable algorithm for discrete-ordinate-method radiative transfer in multiple scattering and emitting layered media, Appl. Opt., 27, 2502–2509, 1988.
Vaishya, A., Babu, S. N. S., Jayachandran, V., Gogoi, M. M., Lakshmi, N. B., Moorthy, K. K., and Satheesh, S. K.: Large contrast in the vertical distribution of aerosol optical properties and radiative effects across the Indo-Gangetic Plain during the SWAAMI–RAWEX campaign, Atmos. Chem. Phys., 18, 17669–17685, https://doi.org/10.5194/acp-18-17669-2018, 2018.
Vaughan, M. A., Powell, K. A., Winker, D. M., Hostetler, C. A., Kuehn, R. E., Hunt, W. H., Getzewich, B. J., Young, S. A., Liu, Z., and McGill, M. J.: Fully Automated Detection of Cloud and Aerosol Layers in the CALIPSO Lidar Measurements, J. Atmos. Ocean. Technol., 26, 2034–2050, https://doi.org/10.1175/2009JTECHA1228.1, 2009.
Verma, S., Payra, S., Gautam, R., Prakash, D., Soni, M., Holben, B., and Bell, S.: Dust events and their influence on aerosol optical properties over Jaipur in Northwestern India, Environ. Monit. Assess., 185, 7327–7342, https://doi.org/10.1007/s10661-013-3103-9, 2013.
Vinoj, V., Babu, S. S., Satheesh, S. K., Moorthy, K., and Kaufman, Y. J.: Radiative forcing by aerosols over the Bay of Bengal region derived from shipborne, island-based, and satellite (Moderate-Resolution Imaging Spectroradiometer) observations, J. Geophys. Res.-Atmos., 109, D5, https://doi.org/10.1029/2003JD004329, 2004.
Vinoj, V., Rasch, P. J., Wang, H., Yoon, J.-H., Ma, P.-L., Landu, K., and Singh, B.: Short-term modulation of Indian summer monsoon rainfall by West Asian dust, Nat. Geosci., 7, 308–313, 2014.
Wei, J., Peng, Y., Guo, J., and Sun, L.: Performance of MODIS Collection 6.1 Level 3 aerosol products in spatial-temporal variations over land, Atmos. Environ., 206, 30–44, 2019.
Winker, D. M., Vaughan, M. A., Omar, A., Hu, Y., Powell, K. A., Liu, Z., Hunt, W. H., and Young, S. A.: Overview of the CALIPSO mission and CALIOP data processing algorithms, J. Atmos. Ocean. Technol., 26, 2310–2323, 2009.
Winker, D. M., Tackett, J. L., Getzewich, B. J., Liu, Z., Vaughan, M. A., and Rogers, R. R.: The global 3-D distribution of tropospheric aerosols as characterized by CALIOP, Atmos. Chem. Phys., 13, 3345–3361, https://doi.org/10.5194/acp-13-3345-2013, 2013.
Yoon, J., Burrows, J. P., Vountas, M., von Hoyningen-Huene, W., Chang, D. Y., Richter, A., and Hilboll, A.: Changes in atmospheric aerosol loading retrieved from space-based measurements during the past decade, Atmos. Chem. Phys., 14, 6881–6902, https://doi.org/10.5194/acp-14-6881-2014, 2014.
Young, S. A., Vaughan, M. A., Garnier, A., Tackett, J. L., Lambeth, J. D., and Powell, K. A.: Extinction and optical depth retrievals for CALIPSO's Version 4 data release, Atmos. Meas. Tech., 11, 5701–5727, https://doi.org/10.5194/amt-11-5701-2018, 2018.
Yu, H., Chin, M., Winker, D. M., Omar, A. H., Liu, Z., Kittaka, C., and Diehl, T.: Global view of aerosol vertical distributions from CALIPSO lidar measurements and GOCART simulations: Regional and seasonal variations, J. Geophys. Res.-Atmos., 115, D4, https://doi.org/10.1029/2009JD013364, 2010.