the Creative Commons Attribution 4.0 License.
the Creative Commons Attribution 4.0 License.
 | 06 May 2022
Cellulose in atmospheric particulate matter at rural and urban sites across France and Switzerland
Adam Brighty
Véronique Jacob
Gaëlle Uzu
Lucille Borlaza
Sébastien Conil
Christoph Hueglin
Stuart K. Grange
Olivier Favez
Cécile Trébuchon
Jean-Luc Jaffrezo
The spatiotemporal variations in free-cellulose concentrations in atmospheric particles, as a proxy for plant debris, were investigated using an improved protocol with a high-performance liquid chromatography with pulsed amperometric detection (HPLC-PAD) method. Filter samples were taken from nine sites of varying characteristics across France and Switzerland, with sampling covering all seasons. Concentrations of cellulose, as well as carbonaceous aerosol and other source-specific chemical tracers (e.g. elemental carbon, EC; levoglucosan; polyols; trace metals; and glucose), were quantified. Annual mean free-cellulose concentrations within PM10 (particulate matter) ranged from 29 ± 38 ng m−3 at Basel (urban site) to 284 ± 225 ng m−3 at Payerne (rural site). Concentrations were considerably higher during episodes, with spikes exceeding 1150 and 2200 ng m−3 at Payerne and ANDRA-OPE (Agence nationale pour la gestion des déchets radioactifs Observatoire Pérenne de l'Environnement; rural site), respectively. A clear seasonality, with highest cellulose concentrations during summer and autumn, was observed at all rural and some urban sites. However, some urban locations exhibited a weakened seasonality. Contributions of cellulose carbon to total organic carbon are moderate on average (0.7 %–5.9 %) but much greater during “episodes”, reaching close to 20 % at Payerne. Cellulose concentrations correlated poorly between sites, even at ranges of about 10 km, indicating the localised nature of the sources of atmospheric plant debris. With regards to these sources, correlations between cellulose and typical biogenic chemical tracers (polyols and glucose) were moderate to strong (Rs = 0.28–0.78, p < 0.0001) across the nine sites. Seasonality was strongest at sites with stronger biogenic correlations, suggesting the main source of cellulose arises from biogenic origins. A second input to ambient plant debris concentrations was suggested via resuspension of plant matter at several urban sites, due to moderate cellulose correlations with mineral dust tracers, Ca2+, and Ti metal (Rs = 0.28–0.45, p < 0.007). No correlation was obtained with the biomass burning tracer (levoglucosan), an indication that this is not a source of atmospheric cellulose. Finally, an investigation into the interannual variability in atmospheric cellulose across the Grenoble metropole was completed. It was shown that concentrations and sources of ambient cellulose can vary considerably between years. All together, these results deeply improve our knowledge on the phenomenology of plant debris within ambient air.
- Article
(3846 KB) - Full-text XML
-
Supplement
(918 KB) - BibTeX
- EndNote


Ambient aerosols are a key component of our atmospheric system, with complex compositions arising from multiple sources and formation mechanisms. These airborne particles (or particulate matter, PM) have both climatic and health effects which remain poorly understood (Boucher et al., 2013). Particulate matter is made up of elemental and inorganic material, as well as a significant proportion of material of a carbonaceous nature (organic carbon, OC, and elemental carbon, EC) (Hansen et al., 1984; Birch and Cary, 1996; Putaud et al., 2004; Yttri et al., 2007; Franke et al., 2017). PM contains an important portion of organic matter (OM), the chemical composition of which remains largely unidentified (Putaud et al., 2010). In the majority of studies, at most 20 % of the OM can be speciated and quantified at the molecular level (Alfarra et al., 2007; Michoud et al., 2021). Understanding the sources and atmospheric mechanisms of this OM fraction remains key to uncovering more knowledge of its climatic and health effects, on both local and larger scales (Nozière et al., 2015). Indeed, it has been hypothesised that our current understanding does not account for a number of hidden sources and processes of PM (Karagulian et al., 2015; Wagenbrenner et al., 2017; Klimont et al., 2017).
A large proportion of research in the last 2 decades has been focussed on the production of secondary organic aerosol (SOA) arising from the processing of volatile organic compounds (VOCs) or intermediate/semi-volatile ones (I/SVOCs). So far, a smaller effort has been made to account for the potential additional input from primary biological aerosol particles (PBAPs; also known as primary biogenic organic aerosol, PBOA). However, the limited number of available studies show that a significant portion of OM can be associated with biogenic emissions (Liang et al., 2016; Alves, 2017; Samaké et al., 2019a). PBAPs are emitted directly into the atmosphere from the source material and are described as “solid airborne particles derived from biological organisms, including microorganisms and fragments of biological materials such as plant debris and animal dander” (Després et al., 2012). PBAP aerodynamic diameters can vary greatly based on the source: ranging from a few nanometres (e.g. viruses and cell fragments) to > 100 µm (plant debris, fungal spores, and pollen) (Pöschl, 2005). In terms of their atmospheric significance, some forms of PBAPs have been shown to be very efficient ice nuclei and giant cloud condensation nuclei, in regions where anthropogenic sources do not dominate emissions (Rosenfeld et al., 2008; Pöschl et al., 2010). Biological particles have also been linked with acute respiratory effects (e.g. asthma), allergies, and cancer (Peccia et al., 2011). Estimations of global PBAP natural emissions are in the broad range of 50–1000 Tg yr−1, highlighting the need for further studies to produce more precise estimates (Penner et al., 2001; Jaenicke, 2005). For comparison, global anthropogenic emissions of PM10 via road transport amount to about 3.3 Tg yr−1 (Klimont et al., 2017).
Within modern field studies, the characterisation of PM is simplified with the use of chemical tracers (also referred to as molecular markers) as proxy species. Such species should be persistently emitted from a given source and sufficiently stable in the atmosphere to be characterised and quantified. The use of these tracers can also lead to more constrained source apportionment calculations, owing to decreased uncertainties and a stronger statistical output, together with a better understanding of the emission processes (Waked et al., 2014; Weber et al., 2019; Borlaza et al., 2021a).
Plant debris (e.g. air-dispersed seeds or plant fragments via abrasion or decomposition mechanisms) is suspected to be a major contributor to PBAPs within the atmosphere (Graham et al., 2003; Winiwarter et al., 2009; Martin et al., 2010; Yttri et al., 2011b; Bozzetti et al., 2016). However, atmospheric plant debris has received much less attention than other sources of PBAPs, such as fungal spores, and thus knowledge of plant debris is severely limited. Both cellulose and plant waxes (as n-alkanes) have been used as proxy species for atmospheric plant debris. Early studies of the fraction of plant debris (or vegetative detritus) centred around analysis of plant waxes as the proxy species (Simoneit and Mazurek, 1982; Rogge et al., 1993a, b). These studies have formed the basis of our work, using identifiable chemical species to supply information on insoluble components. For example, Rogge et al. (1993a) in their experiment found significant amounts of non-extractable, insoluble organic components yet were able to identify soluble components, such as plant waxes, as chemical tracers for insoluble components, such as plant debris. Rogge et al. (1993a) found local differences in the n-alkane observed pattern, as a function of the variability in local plant composition, whilst Simoneit and Mazurek (1982) found plant wax to be a major component of rural OC.
As scientific understanding increased, cellulose was proposed as a new chemical tracer for plant debris by Kunit and Puxbaum (1996) and has been used a tracer in several field and PMF (positive matrix factorisation) studies since (Puxbaum and Tenze-Kunit, 2003; Sánchez-Ochoa et al., 2007; Caseiro, 2008; Yttri et al., 2011a, b; Bozzetti et al., 2016; Borlaza et al., 2021a). Interestingly, Kotianová et al. (2008) evaluated the use of both plant waxes and cellulose as plant debris tracers. They found a much weaker seasonal pattern with respect to cellulose concentrations but showed plant wax and n-alkane concentrations peaked significantly during the warm summer months. The authors hypothesised that the difference between the two tracers revolved around plant waxes coming from the plant surface, whereas cellulose originates from bulk plant material. As such, atmospheric cellulose is predicted to be derived from machining and decomposition processes, and n-alkanes are emitted as part of surface abrasion mechanisms. Kotianová et al. (2008) found very good agreement in the results between the contributions of both cellulose and plant wax to PM10.
Studies of other molecular markers are more prominent, both within the primary biogenic fraction and other aerosol classes. The number of campaigns investigating measurements of atmospheric cellulose are scarce in comparison and do not sufficiently cover all ambient environments (Alves, 2017, and references therein). This remains a concern, especially considering that contributions of cellulose-derived carbon (cellulose C) to overall organic carbon in the atmosphere can be significant during some periods of the year (Sánchez-Ochoa et al., 2007; Caseiro, 2008).
Cellulose is present as two forms within global flora: firstly as “free cellulose” and also as cellulose embedded in lignin or hemicellulose. This portion of cellulose bound to lignin requires an additional delignification process before quantification in atmospheric PM, which requires harsh conditions and long reaction times (Gould, 1984; Kunit and Puxbaum, 1996). A conversion from free to total cellulose concentrations was created by Puxbaum and Tenze-Kunit (2003), where free cellulose was shown to contribute 72 % of total cellulose abundance. This conversion presents large uncertainties, as it was developed using a very limited sample size (n < 10). Thus, free cellulose is commonly used as the proxy species for atmospheric plant debris, over total cellulose.
Of the few previous characterisation studies to have taken place, only two have had a duration longer than 1 year. Regardless, some insights into the seasonal variations in cellulose concentrations have been afforded (Sánchez-Ochoa et al., 2007; Caseiro, 2008; Yttri et al., 2011a, b). For example, Sánchez-Ochoa et al. (2007) highlighted a pattern of cellulose concentration maxima during spring and summer at their rural background sites, excluding their maritime counterparts. This seasonal pattern, however, was found to be much weaker than other aerosol classes and showed higher winter concentrations than anticipated. Further, Caseiro (2008) found winter maxima at close to half their monitoring locations when observing from both urban and background locations. The reasons for the difference in seasonality between these two studies are likely owe to the differences in location and the variety of PM sizes used (PM2 to PM10) by Sánchez-Ochoa et al. (2007) compared to the consistent PM10 sampling used by Caseiro (2008). More long-term studies would be beneficial to understanding these geographical discrepancies.
The lack of sufficient long-term studies and clarity regarding cellulose characterisation of concentrations, seasonal cycles, sources, and emission processes calls for further measurements. This would enable a better comprehension of the importance of this fraction of PBOA in atmospheric PM. In this study, we present a multi-seasonal investigation of cellulose concentrations alongside other chemical tracers in ambient aerosol, collected at nine sites across both France and Switzerland. The objective of the study was to investigate the seasonal and geographical variability in atmospheric cellulose across sites of varying characteristics. Contributions of cellulose to the OM fraction of PM and correlations of cellulose with tracers of characteristic sources were also completed, alongside the creation of a biannual and triannual dataset of cellulose concentrations at three sites within the Grenoble metropole and at ANDRA-OPE (Agence nationale pour la gestion des déchets radioactifs Observatoire Pérenne de l'Environnement; both France), respectively. Further, a PM2.5 PM10 intercomparison was also established. This study, with the gathering of one of the largest databases on atmospheric cellulose with more than 1500 samples, aims to provide a better understanding of this understudied component of atmospheric PM.
2.1 Sampling sites
PM samples used for the present study have been collected during three distinct projects, which are described in the following. The locations of the corresponding measurement sites are presented in Fig. 1a and b, while site classifications, sampling periods, and numbers of available samples are summarised in Tables 1 and 2.

Figure 1(a) A map of all sampling sites from within the study (highlighted with yellow pin drops). Five sites are sampled within Switzerland; three sites are within the Grenoble metropole; and one is in northern France (ANDRA-OPE). (b) Situation of the three sampling sites within Grenoble.
Table 1Sampling period and site characteristics for the PM10 sampling campaign. LF: Les Frênes, CB: Caserne de Bonne. LF, CB, and Vif represent sites from the Grenoble metropole.
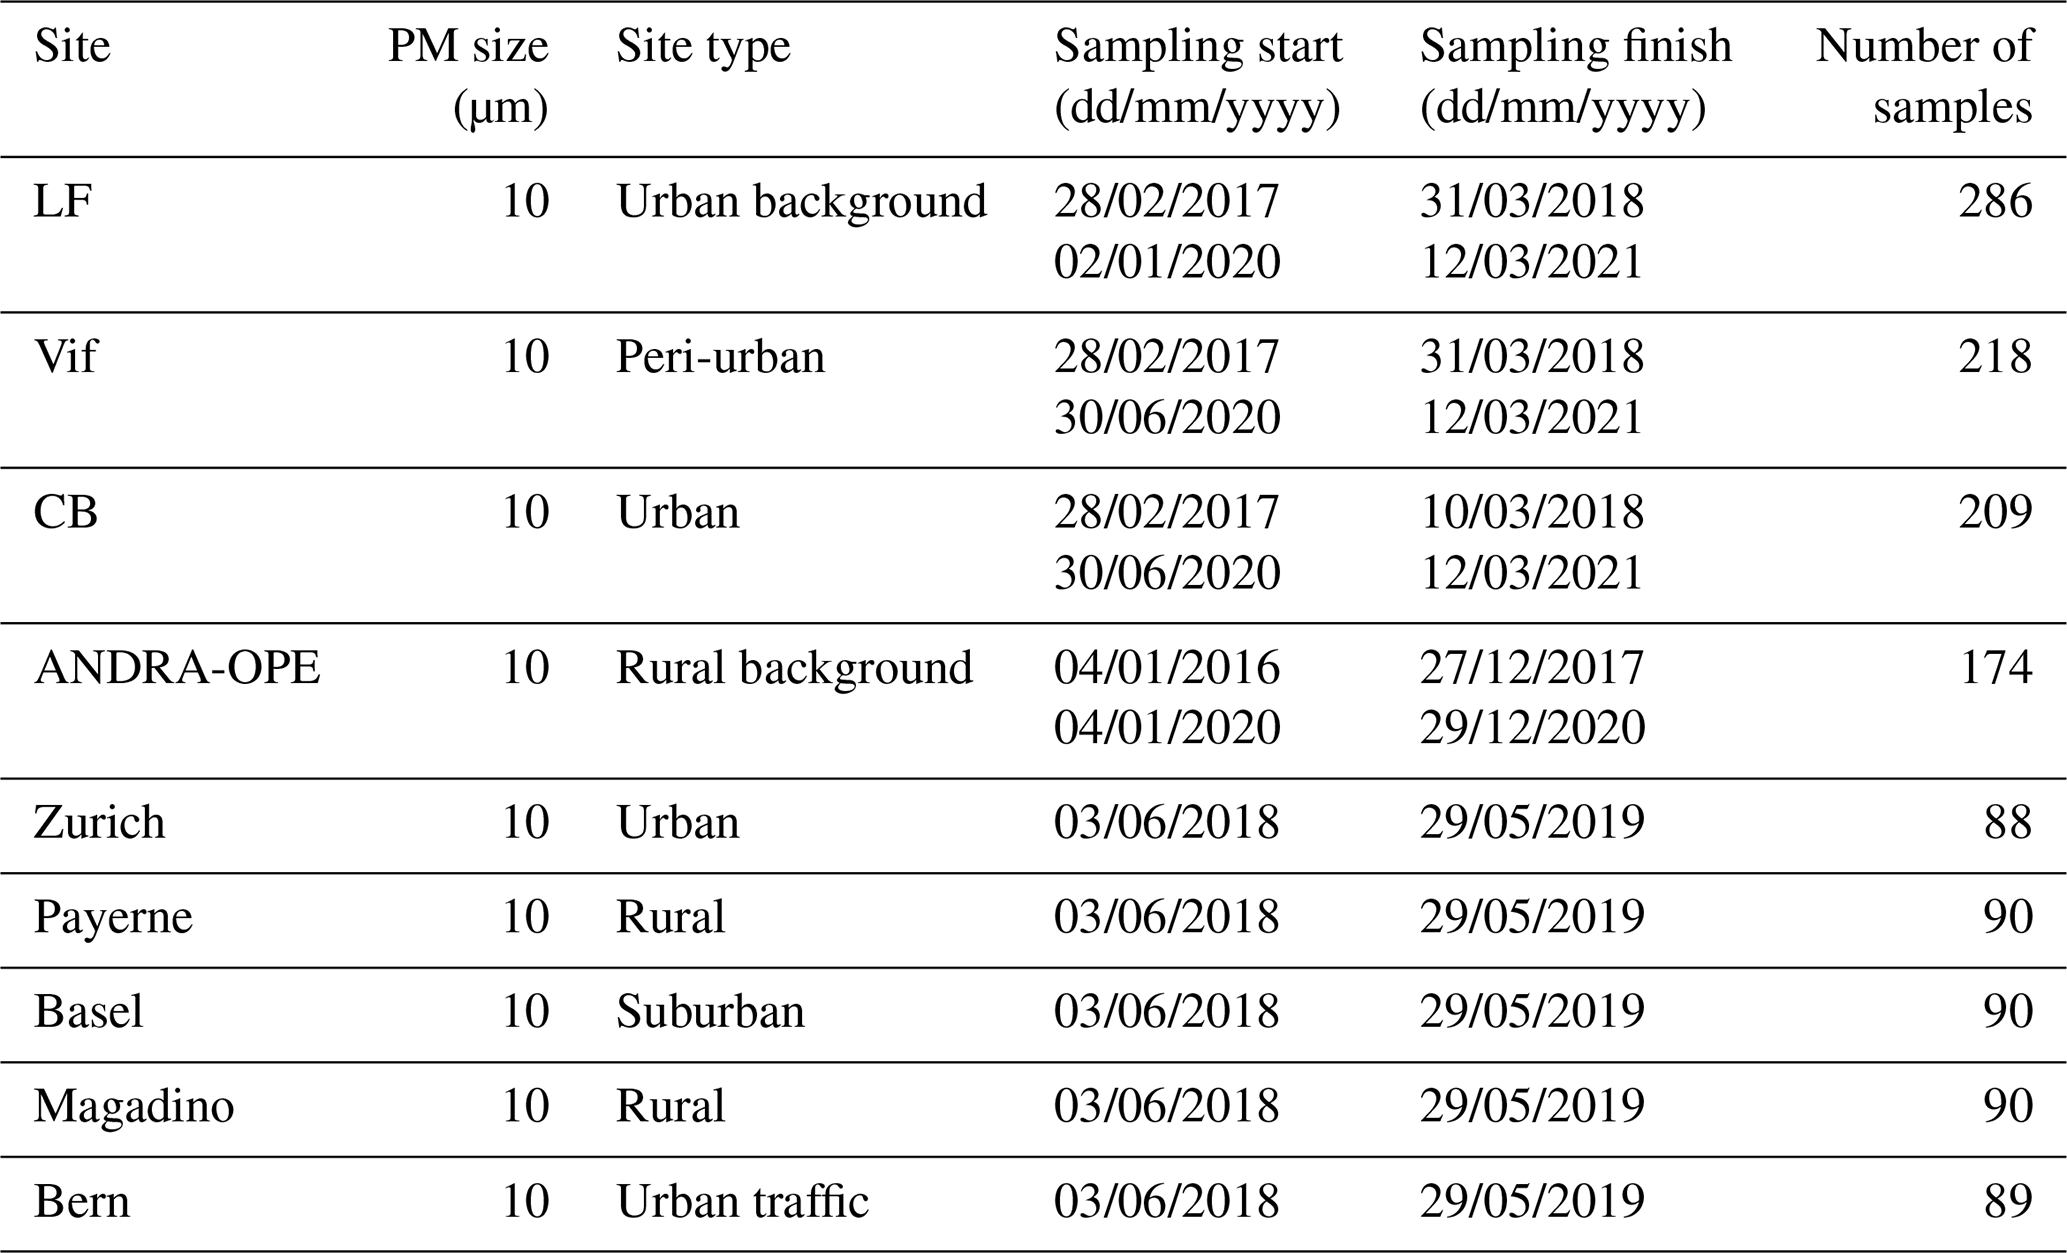
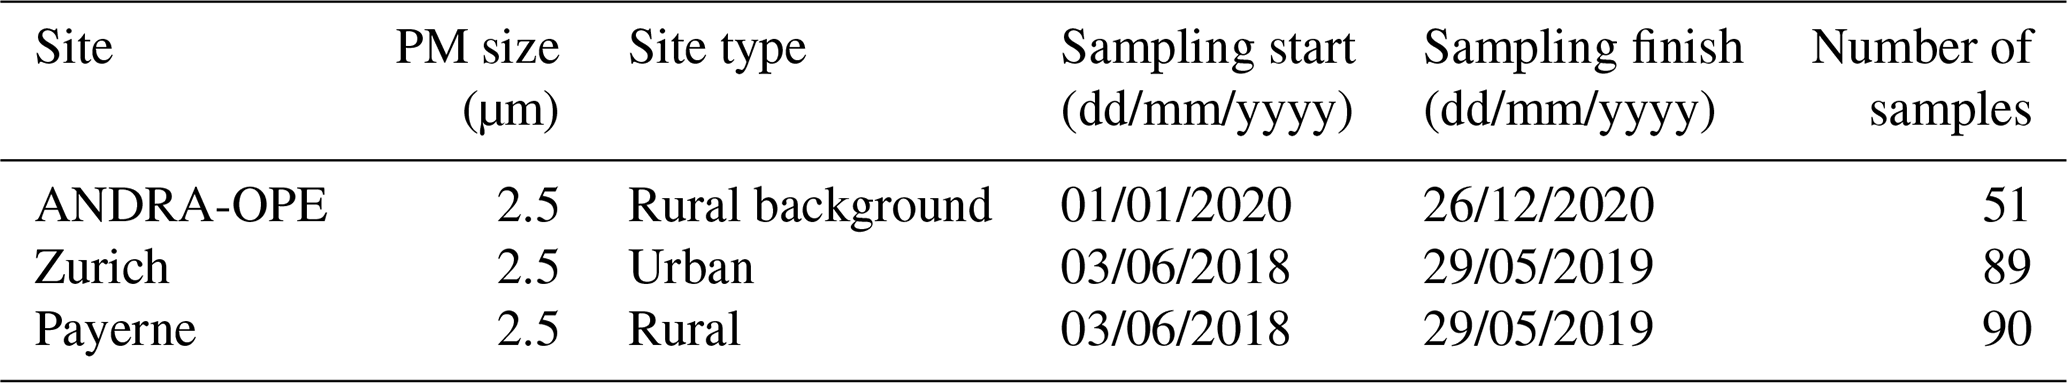
Table 2Sampling period and site characteristics for the PM2.5 sampling campaign.
The first measurement campaign (QAMECS, Air Quality in the Grenoble Area: Assessment of Environment, Behaviour and Health) focussed on the PM10 loading and composition at various sites within the Grenoble metropole (France), as part of the MobilAir air quality programme (Borlaza et al., 2021a, b). In these campaigns, three sites were monitored over two 1-year periods (2017–2018 and 2020–2021). As the largest metropolis in the Alps, Grenoble is home to around 450 000 inhabitants. The city itself is situated within an Alpine valley: the centre is at relatively low altitude (between 200 and 600 m above sea level) and is surrounded by multiple separate mountain ranges, namely Chartreuse (to the north), Belledonne (east), and Vercors (south and west). These ranges heavily inhibit horizontal air movement, leading to unique meteorological conditions and favouring the formation of temperature inversions, trapping pollutants within the valley, especially during winter. During this study, a PM10 sampling campaign was undertaken in the Grenoble metropole at three sites, each representing a different urban site typology: Les Frênes (LF, urban background), Vif (peri-urban), and Caserne de Bonne (CB, urban centre). All three sites are within 15 km of one another (Fig. 1b).
Secondly, PM10 and PM2.5 samples could be obtained from a monitoring campaign at the Observatoire Pérenne de l'Environnement (ANDRA-OPE), in northern France (http://ope.andra.fr/index.php?, last access: 15 March 2021). Samples have been collected continuously for about a decade at this site (Golly et al., 2019; Borlaza et al., 2021c), but cellulose measurements were conducted and presented in this work for the years 2016, 2017, and 2020 only. PM10 and PM2.5 samples were taken on alternate days. The ANDRA-OPE site is situated 230 km east of Paris, on a rise in between lows of the Paris basin and the mountains in the department of Vosges (OPE-ANDRA Atmospheric Station, 2021). It is subject to persistent westerly prevailing winds and is surrounded by significant agricultural activities but is notably distant from towns (> 25 km) and small villages (> 4 km).
Last but not least, simultaneous PM10 and PM2.5 filter samples were taken across five sites in Switzerland, as part of an Empa (Swiss Federal Laboratories for Materials Science and Technology) monitoring campaign (Grange et al., 2021). These sites varied in characteristics and were sampled for 1 year (from June 2018 to May 2019). Two rural sites, Magadino and Payerne, are included within the study. The former is located south of the Alps, whilst the latter is found on the northern plateau roughly 50 km from the nearest city of Bern. Filter samples were also taken from urban sites within three of the most populous cities in Switzerland: Basel, Bern, and Zurich. Zurich has a similar topography to the Grenoble metropole, whilst the traffic-impacted site in Bern resides within a “street canyon”; thus both sites may also experience inhibited air movement. The monitoring site in Basel is within a suburban area, located in an open and park-like environment. It is not expected to be impacted by accumulation effects.
2.2 Sampling procedure
At each of the nine sites used for the present study, daily (24 h) PM sample collection periods were conducted according to Tables 1 and 2 (starting at 00:00 or 09:00 local time) with an average 3 d sampling interval within the Grenoble metropole, 4 d interval for the Swiss sites, and 6 d interval for the ANDRA-OPE monitoring site. Additional samples for PM10 were collected daily during 9 weeks in summer 2017 in OPE and Grenoble and measured for cellulose but are not considered in this study (Samaké et al., 2020). The PM collection was performed using high-volume samplers (Digitel DA80, 30 m3 h−1) onto 150 mm diameter pure quartz fibre filters (Pall Tissuquartz 2500 QAT-UP, diameter 150 mm). Excluding the Swiss sites, filters were pre-fired at 500 ∘C for 12 h before use to avoid organic contamination, and all were handled under strict quality control procedures. After collection, samples were wrapped in aluminium foil or sterile parchment, sealed in Ziploc plastic bags, and stored at < 4 ∘C until use for chemical analyses. Blank filters were collected to determine the detection limit (DL) and to check for the absence of contamination during sample transport, setup, and recovery.
2.3 Set of analyses
All PM10 filters from the nine monitoring locations were analysed for cellulose, while PM2.5 filter samples have been analysed at three of the monitoring locations available. The PM10 and PM2.5 filter samples were subjected to several other chemical analyses in order to quantify their major chemical components and tracers used in this study.
2.3.1 Carbonaceous aerosol
Organic carbon (OC) and elemental carbon (EC) were analysed with a Sunset Laboratory analyser following the EUSAAR2 (European Supersites for Atmospheric Aerosol Research) thermo-optical protocol (Hansen et al., 1984; Birch and Cary, 1996; Aymoz et al., 2007; Cavalli et al., 2010) and according to the recommendations of the EN 16909 European standard. A punch of 1.5 cm2 was used, and automatic split time was always selected in order to differentiate between EC and OC.
2.3.2 Sugar alcohols, anhydrides, and glucose
Sugar anhydrides (levoglucosan, mannosan, and galactosan), sugar alcohols (mannitol, arabitol, and sorbitol), and glucose were analysed by high-performance liquid chromatography with pulsed amperometric detection (HPLC-PAD; Waked et al., 2014; Samaké et al., 2019a). A Thermo Scientific ICS 5000+ HPLC was used with a 4 mm diameter Metrosep Carb 2 × 150 mm column and 50 mm pre-column in isocratic mode with an eluent of 15 % of sodium hydroxide (200 mM), sodium acetate (4 mM), and 85 % water, at 1 mL min−1. For this analysis, an extraction was performed upon 5.09 cm2 punches soaked in 7 mL of ultra-pure water under vortex agitation for 20 min. The extract was then filtered with a 0.25 µm porosity Acrodisc (Millipore Millex-EIMF) filter before analysis.
2.3.3 Ionic components
Quantification of sodium (Na+), ammonium (NH), potassium (K+), magnesium (Mg2+), calcium (Ca2+), chloride (Cl−), nitrate (NO), sulfate (SO), and methane sulfonic acid (MSA) was completed using ion chromatography (IC), in agreement with EN 16913. An extraction was performed on 11.34 cm2 filter punches in 10 mL of ultra-pure water under vortex agitation for 20 min. The extract was then filtered with a 0.25 µm porosity Acrodisc (Millipore Millex-EIMF) filter. The major ionic components were measured by ion chromatography (IC) following a standard protocol described in Jaffrezo et al. (1998) and Waked et al. (2014) using an ICS-3000 dual-channel chromatograph (Thermo Fisher) with AS11-HC column for the anions and CS12 for the cations.
2.3.4 Major and trace elements
Preparation of an extract was completed via mineralisation of a 38 mm diameter filter punch in 5 mL of HNO3 (70 %) and 1.25 mL of H2O2 at 180 ∘C for 30 min in a microwave oven (microwave MARS 6, CEM). The analysis of 18 elements (Al, As, Ba, Cd, Cr, Cu, Fe, Mn, Mo, Ni, Pb, Rb, Sb, Se, Sn, Ti, V, and Zn) was performed on each filter extract using inductively coupled plasma mass spectroscopy (ICP-MS) (PerkinElmer ELAN 6100 DRC II or PerkinElmer NexION) akin to the method described by Alleman et al. (2010).
2.3.5 Cellulose
The concentration of free cellulose within the filter samples was determined following an improved protocol based on the enzymatic procedure proposed by Kunit and Puxbaum (1996). Free cellulose was extracted in an aqueous solution, which was then enzymatically hydrolysed to glucose units using two cellulolytic enzymes. The glucose concentration was then quantified by using an HPLC-PAD method. The hydrolysis step was the same as originally proposed; however the enzyme quantities and analytical step have been modified in our protocol.
First, a 21 mm diameter punch was soaked in 3 mL of aqueous solution with a thymol buffer (pH 4.8; see Supplement) and was extracted for 40 min in an ultrasound bath. The two enzymes are added into the solution containing the filter: cellulase (from Trichoderma reesei, Sigma-Aldrich C2730) with 20 µL of an aqueous solution at 70 units g−1 and glucosidase (from Aspergillus niger, Sigma-Aldrich 49291), with 60 µL of an aqueous solution at 5 units g−1. The filter-containing solution was then incubated at 50 ∘C for 24 h for hydrolysis to occur. Hydrolysis was then terminated by denaturing the enzymes, by placing the solution in an oven at 100 ∘C for 45 min. Finally, the solution was centrifuged (9000 rpm) for 15 min at 15 ∘C and carefully separated and extracted from the filter and enzymes, before being analysed with an HPLC-PAD instrument.
The HPLC-PAD (Dionex DX-500) was equipped with a Metrohm column (250 mm long, 4 mm diameter), with an isocratic run of 40 min with the eluents A (84 %, H2O), B (14 %, 100 mM NaOH), and C (2 %, 100 mM NaOH + 150 mM NaOAc, sodium acetate). Column temperature was maintained at 30 ∘C. Eluent flow rate was 1.10 mL min−1, and injection volume was 250 µL.
Each analytical batch contained six glucose and six cellulose hydrolysis standard solutions, alongside unknown samples. Cellulose standards are used to calculate the cellulose-to-glucose hydrolysis efficiency for each batch and are made from cellulose beads of 20 µm (Sigma-Aldrich S3504). The final calculation of the atmospheric concentration of the free cellulose takes this efficiency of conversion into account. The efficiency was variable between batches but was typically between 75 %–94 %, resulting in an average of 85 ± 8 %. The calculation also subtracts the initial concentrations of atmospheric glucose of each sample, determined in parallel with the aforementioned analysis of sugars and polyols. Finally, field and procedural blanks are taken into account. The procedural blank results are greatly improved when the stock cellulase enzyme solution is filtered to lower their glucose content. This is performed through a series of centrifugal cleaning steps (n = 10) by tangential ultrafiltration in a Vivaspin 15R tube at 9000 rpm in Milli-Q water. Additional procedural information can be found in the Supplement.
2.4 Cellulose method validation
This cellulose quantification method was subjected to a repeatability test, in order to quantify the uncertainties with respect to glucose content within the filter punches. Briefly, a high-volume sampler (Digitel DA80, 30 m3 h−1) was used to collect PM10 onto a pre-fired quartz fibre filter (Pall Tissuquartz 2500 QAT-UP, diameter 150 mm) on the roof of the laboratory and sampled a total of 615.1 m3 of air on 15 March 2021. Ten filter punches of 21 mm were then taken and subjected to the same cellulose-to-glucose enzymatic procedure as for normal samples. It is important to state that we assume constant concentrations of both native glucose and cellulose within the filter, as well as the same enzymatic cellulose-to-glucose conversion efficiency for all 10 filter punches. Each filter punch was then analysed three times using the same HPLC-PAD method to monitor repeatability in terms of both cellulose hydrolysis and PAD glucose concentration measurements. After hydrolysis, the total glucose content of the 10 filters was found. The variability (relative standard deviation, RSD) was small, ranging from 0.7 %–5.7 % for the three repeats of the same filter sample. The RSD of the glucose content within the 10 filter punches was calculated to be 9.9 %. For a 95 % confidence in the uncertainty estimate, the uncertainty in the measurement was therefore found to be 20 % at a maximum.
2.5 Limit of quantification
In order to check for potential contamination of filters during transport, sampling, and storage, blank filters were taken across the nine sites. Within the Grenoble metropole, blank filters were taken at Les Frênes and then applied to Caserne de Bonne and Vif (labelled QAMECS in Table 3). Further, blanks filters were taken at ANDRA-OPE on both PM10 and PM2.5 sampling days. With regards to the Swiss sites (Empa), blanks were taken from each sampling site, and an average glucose concentration was taken from across the five locations.
Table 3Cellulose concentrations derived from blank filters to derive the quantification limit (QL) for each site.
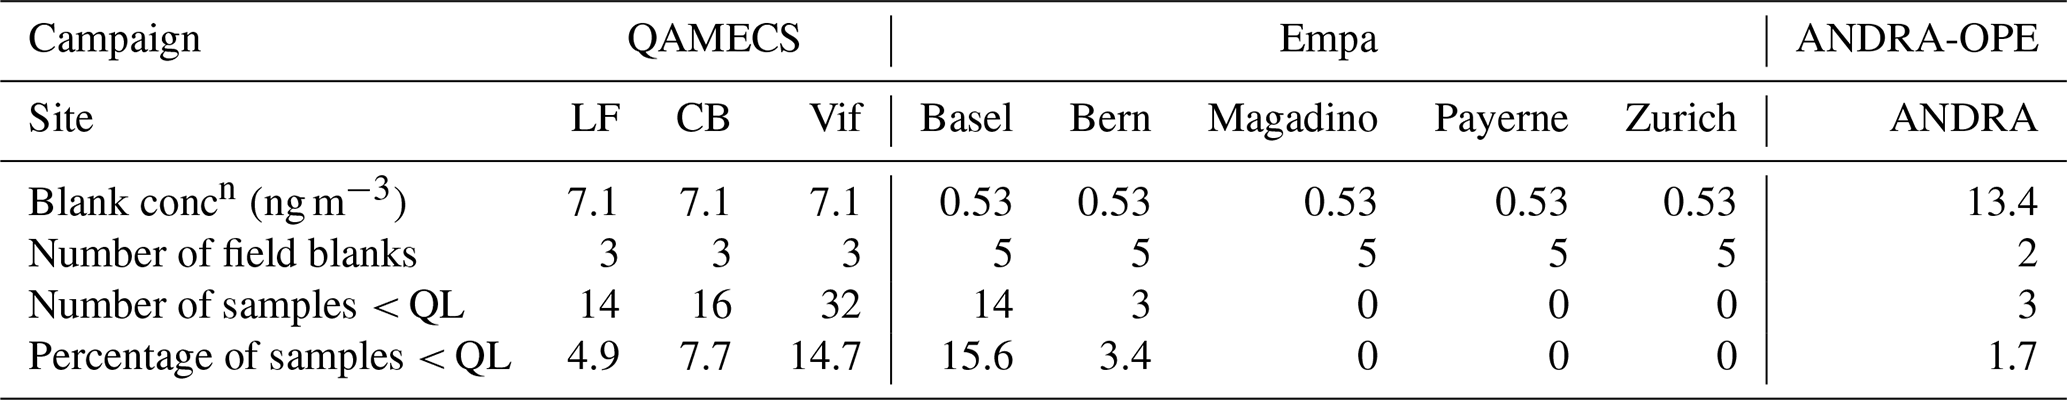
Glucose concentrations calculated in the blanks were then subtracted from measured glucose concentrations within each sample. After, any sample that then yielded a negative concentration of glucose was deemed to be lower than the quantification limit (< QL), representing 5.2 % of all samples. Table 3 summarises the concentrations of cellulose on the blank filters, which has been converted from the blank glucose concentration and the average sampling volume taken across the series. QL varied according to the site, from 0.53 to 13.4 ng m−3. In subsequent analyses of monthly, seasonal or annual concentrations (Sect. 3.1–3.3 and 3.6), any sample that was deemed < QL was assigned a cellulose concentration of [Blank] 2. This prevents an artificial increase in average cellulose concentrations.
In the following, cellulose concentrations are reported as free cellulose. The multiplication factor of 1.39 derived by Puxbaum and Tenze-Kunit (2003) could have been used to derive total cellulose. We chose not to do this, due to the large uncertainty in this ratio. From this point onwards, free cellulose will be regarded as cellulose.
3.1 Comparison with previous data from the literature
Figure 2 illustrates the annual averages of cellulose concentrations across our nine sites (in orange), as well as previous data from the literature (in blue), sorted by site typology and sampled particle size. The bars represent either annual cellulose averages (if sampling lasted greater than 1 year) or cellulose averages for the designated sampling period. We believe that the roughly 4440 samples (excluding the ones produced within our study) considered in this literature survey represent a nearly complete database of cellulose concentrations in PM available in the literature. A tabulated version of the results from within the study can be found in Table 4. An expanded version of Table 4, also including previous literature results, can be found in Table S1 in the Supplement. The evolution of cellulose concentrations across the respective sampling periods for our study has further been included in the Supplement (Fig. S1).
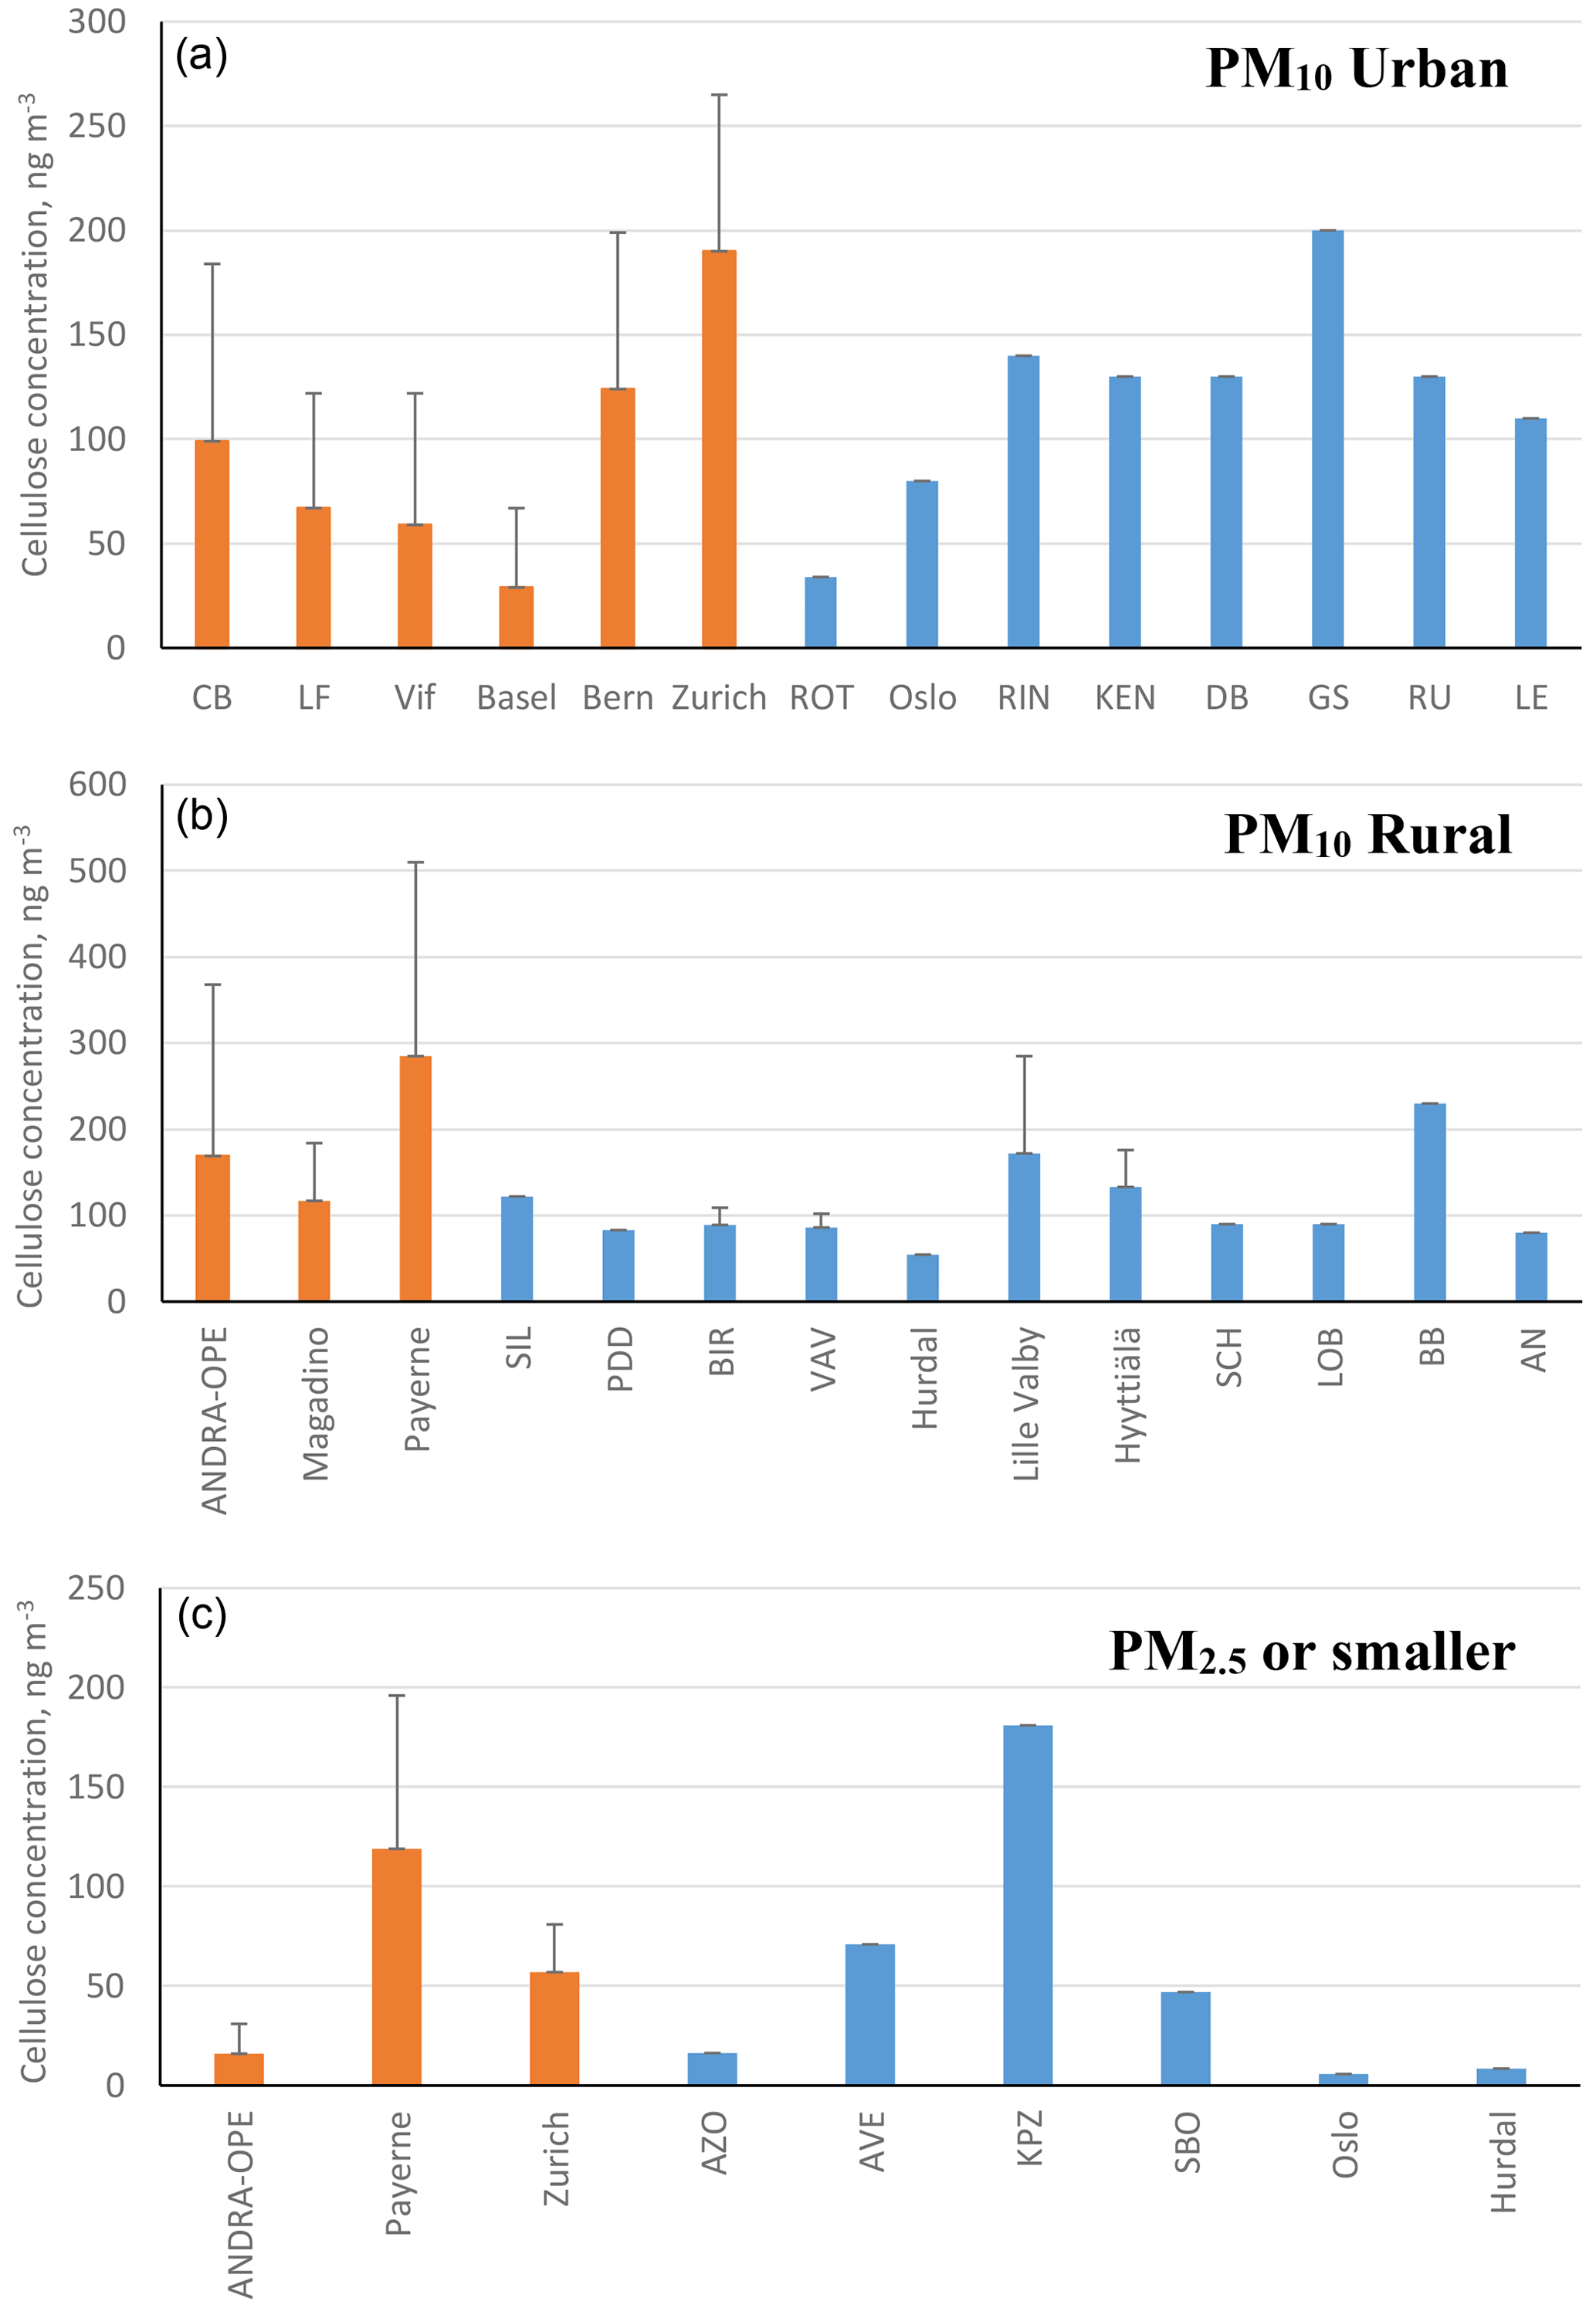
Figure 2Annual cellulose concentrations (ng m−3) reported within this study (orange bars) alongside previous literature measurements (blue bars). Black bars represent the standard deviation of the results. Bar charts are assigned as follows: (a) urban-based sites, (b) rural-based sites, and (c) PM2.5 cellulose measurements (fine mode) or smaller. Note that only positive error bars are used for clarity. Literature sampling sites by country are the following. PM10 urban: ROT (Netherlands); Oslo (Norway); and RIN, KEN, DB, GS, RU, and LE (Austria). PM10 rural: SIL (Germany); PDD (France); BIR, Hurdal, and Hyyttiälä (Norway); Lille Valby and VAV (Denmark); and SCH, LOB, BB, and AN (Austria). PM2.5 or smaller: AZO and AVE (Portugal), KPZ (Hungary), SBO (Austria), and Oslo and Hurdal (Norway).
Table 4Cellulose concentrations (ng m−3) within PM10 and PM2.5 across the nine locations studied. Concentrations are shown as annual and seasonal averages (plus 1σ), as well as the total range of cellulose concentrations seen across the respective period.
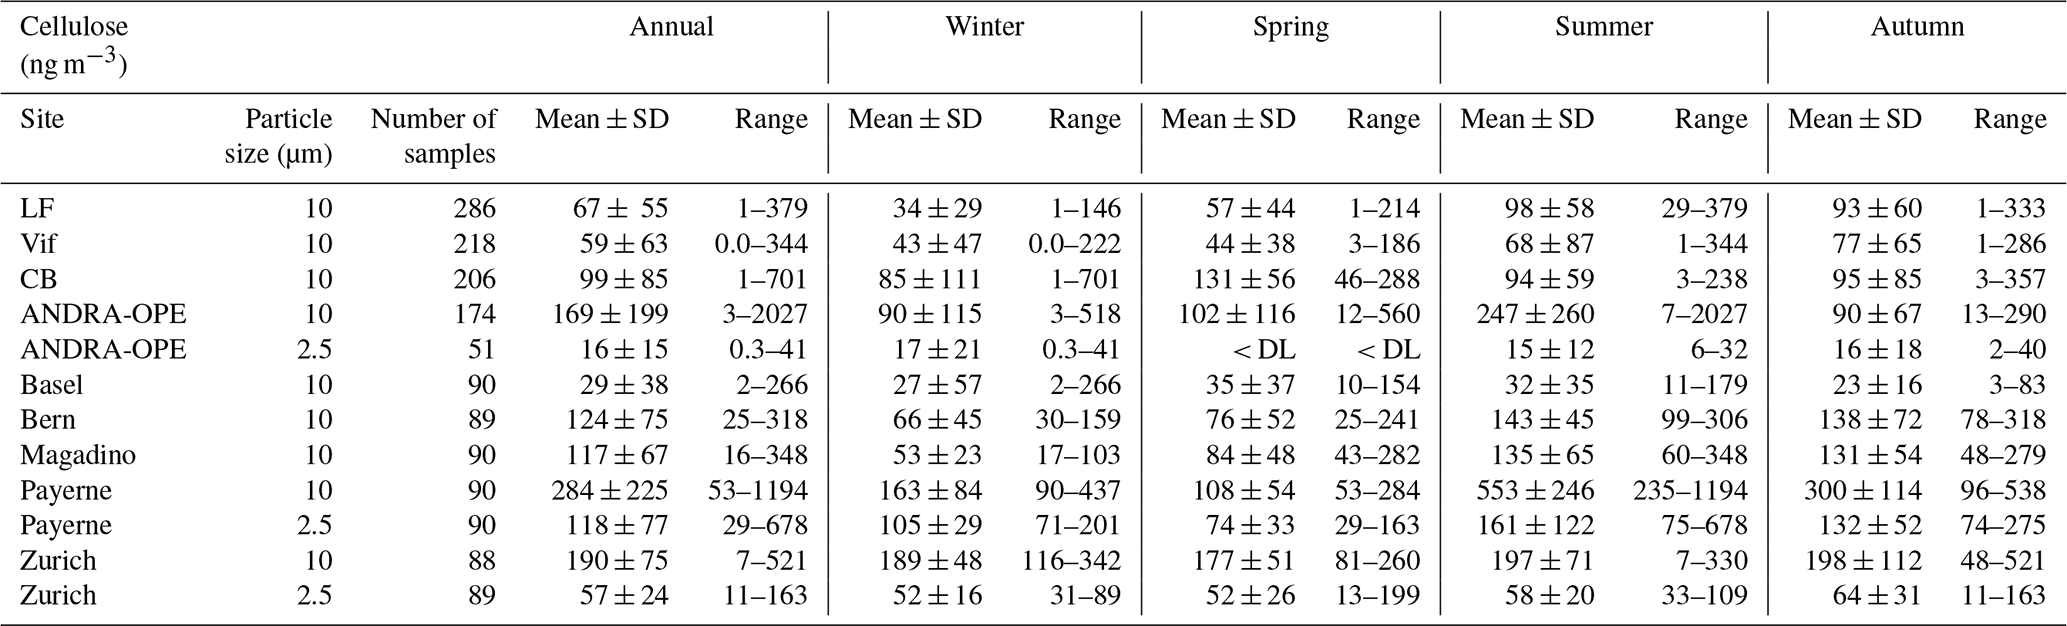
The concentrations measured in this study are in the same order of magnitude as those reported in the literature for previous measurement campaigns. This is generally the case for both seasonal averages and overall maximum concentrations, in both coarse- and fine-mode aerosol (Sánchez-Ochoa et al., 2007; Caseiro, 2008; Yttri et al., 2011a, b). As shown in Fig. 4, annual cellulose concentrations in PM10 in our study ranged from 29.3 ± 38.4 ng m−3 (Bern) to 284.3 ± 224.8 ng m−3 (Payerne), and in PM2.5 it ranged from 15.9 ± 15.0 ng m−3 (ANDRA-OPE) to 118.1 ± 76.5 ng m−3 (Payerne). This annual average PM10 cellulose concentration taken at Payerne is higher than any previously recorded in the literature by roughly 50 ng m−3.
Moreover, results obtained at Payerne evidenced three episodic (high cellulose concentration) spikes (3 June, 13 July, and 29 July – highlighted in red in Fig. S1) which exceeded any maximum episode found in the literature by at least 160 ng m−3 (Sánchez-Ochoa et al., 2007; Caseiro, 2008; Winiwarter et al., 2009). One striking feature of the overall concentration evolution at Payerne is the high cellulose concentrations at the beginning in June 2018 and the surprisingly low concentrations in April and May 2019 (Fig. S2). Another high-concentration episode exceeding those found in the literature was documented at the rural site of ANDRA-OPE. The episodic concentration of 2027 ng m−3 (7 July 2018 – highlighted in red in Fig. S1) is almost double that of any other measurement, including those generally obtained in the present study. Samaké et al. (2020) recently reported at the same site a noticeable increase in concentrations of PBAP tracers, cellulose included, during harvest in late summer 2017. However, given that the concentration spike in 2018 originated during early July, the middle of the European summer, it is not sure that this new episode can be correlated with agricultural activity.
3.2 Size distribution (PM10 vs. PM2.5)
Figure 3 presents the comparative monthly average concentrations of cellulose in PM10 and PM2.5 taken at the three sites of Payerne, Zurich, and ANDRA-OPE, respectively (overall concentration evolutions presented in Fig. S2 in the Supplement). Cellulose concentrations in PM10 are consistently much higher than those in PM2.5, with an annual average of PM2.5 representing between 18 % and 42 % of that in PM10 for the three sites. However, very large fluctuations in this monthly ratio can be observed, particularly for the two rural sites (Payerne and ANDRA-OPE). This is primarily due to changes in PM10 cellulose concentrations, as those within PM2.5 remained largely consistent. Further, considering the overall evolution in Fig. S2, episodic PM2.5 concentrations still generally remain well below the PM10 cellulose concentrations around the same period. It seems that some process is largely impacting the source strength of atmospheric plant debris within PM10, particularly in the rural sites. In the city of Zurich, the cellulose PM2.5 PM10 ratio remained relatively constant, just like the concentrations themselves. The comparatively low cellulose concentrations at ANDRA-OPE for 2020 (both PM10 and PM2.5) are discussed, as part of Sect. 3.7, in the interannual comparison. No ratio is provided at ANDRA-OPE, as PM2.5 and PM10 measurements were completed on different days, as opposed to simultaneous PM10 and PM2.5 sampling at Payerne and Zurich.

Figure 3Monthly averages of cellulose concentrations within PM10 (green bars) and PM2.5 (orange bars) at the three sampling sites of Payerne (rural, a), Zurich (urban, b), and ANDRA-OPE (rural, c). Black error bars represent 1 standard deviation of the results. The corresponding blue lines represent the ratio of the monthly mean cellulose concentrations in PM2.5 : PM10. Note that ANDRA-OPE data are only for the year of 2020, and only positive error bars are used for clarity (SD larger than mean).
Importantly, across the three sites, less than 30 % of atmospheric cellulose was found within PM2.5, on average. This large dataset of size-resolved cellulose concentrations confirms that plant debris predominantly resides within the coarse aerosol mode (Sánchez-Ochoa et al., 2007; Yttri et al., 2011a). Thus, the remainder of this work will solely discuss PM10 data to understand atmospheric cellulose and its behaviour.
3.3 Variations in cellulose concentrations in time and space
Previous studies either indicate a temporal variation with cellulose concentration maxima during the spring and summer seasons (Sánchez-Ochoa et al., 2007) or show very minimal seasonality (Caseiro, 2008). The following discussion will take these observations into account by presenting the results in terms of seasonal averages. Seasons were defined in 3-month periods: December–February (winter), March–May (spring), June–August (summer), and September–November (autumn). At the nine sites investigated, our PM10 cellulose measurements were above the limit of detection across all seasons. Figure 4 illustrates these seasonal cellulose concentrations (ng m−3) for the nine locations. Numerical values of seasonal means and ranges are tabulated as part of Table S1 (Supplement).
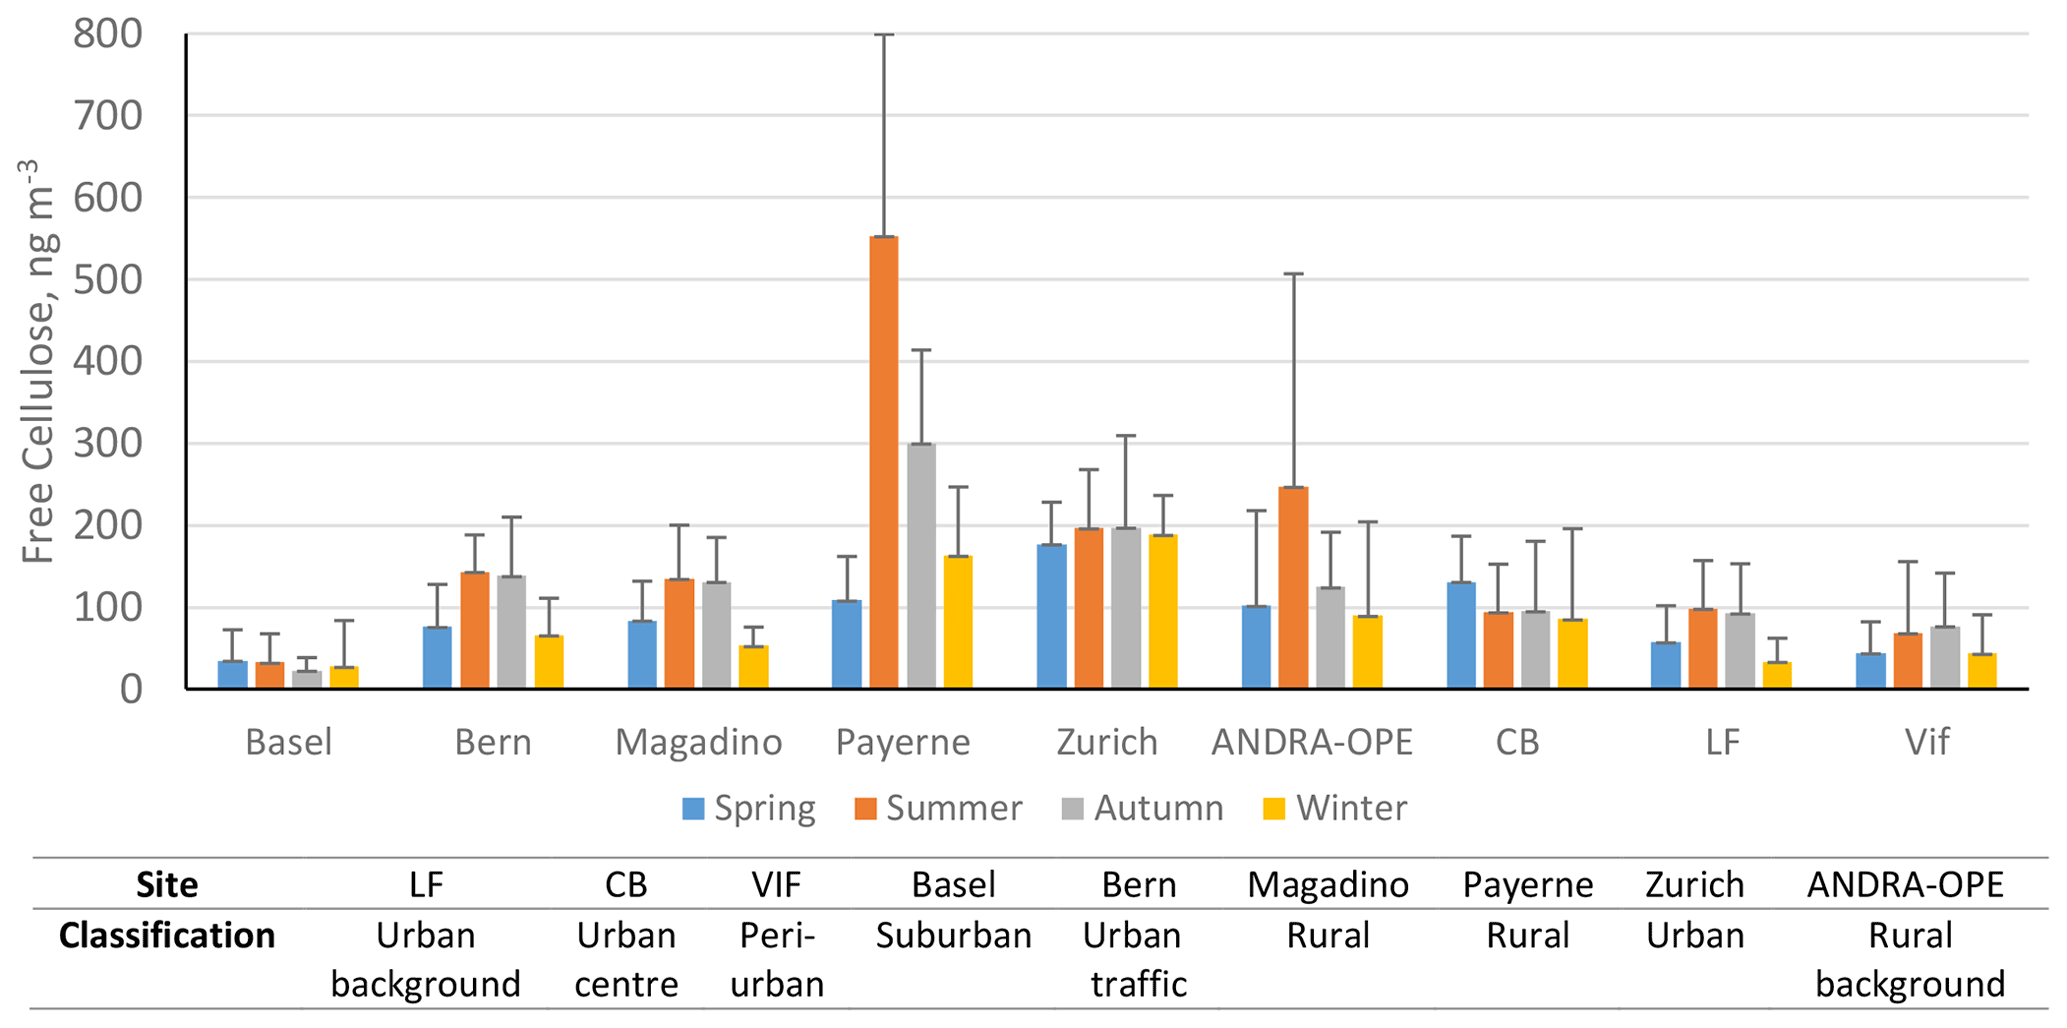
Figure 4Mean cellulose concentrations (ng m−3) at each site, by season: spring (blue), summer (orange), autumn (grey), and winter (yellow). Black error bars represent 1 standard deviation of the seasonal averages. Only positive error bars are added, for clarity. LF: Les Frênes, CB: Caserne de Bonne. Grenoble-based sites represented by CB, LF, and Vif.
In general, the seasonal pattern exhibited here shows higher cellulose concentrations during summer and autumn, likely due to increased temperature and humidity increasing the activity of soil and litter decomposers as well as improving the quality of the litter composition. For example, the nitrogen content of leaves is shown to be greater in warmer temperatures, which leads to better conditions for leaf degradation by microbial action (Liu et al., 2006; Verma et al., 2018). It should be stated that this hypothesis would require further experiments, including specific field measurements linking soil and litter state and plant debris emission. The general trend above is exhibited at all rural sites and some urban locations (Bern, LF, and Vif). However, the extent to which these concentrations exceed the other seasons varied greatly. Normalised seasonal concentrations for each site can be found in Fig. S3 to show this variability. Considering this general seasonality, a summer–autumn maximum in cellulose concentrations deviates from the spring–summer maximum suggested by Sánchez-Ochoa et al. (2007). This may be a result of the different particle size fractions measured as part of their sampling campaign (i.e. PM2, PM2.5, or PM10), compared to the consistent PM10 measurements used in this study. This might also be due to the presence of three high-altitude, mountainous sites comprised within the six sites investigated by Sánchez-Ochoa et al. (2007). Large standard deviations are also noticed at the two rural sites of ANDRA-OPE and Payerne, especially during the summer months. This implies a significant variability in the source of atmospheric cellulose at these sites, especially when compared to the more urban locations showing smaller standard deviations and therefore a smaller flux from the cellulose source.
Whilst this is the general case, there are notable exceptions. Both the urban centres of Zurich and CB show very little seasonal variability compared to their more rural counterparts. Cellulose concentrations in Basel (suburban) also show minimal seasonality, but this may be due to concentrations being too small to exhibit a full seasonal pattern. This is surprising, given the close proximity of the site to a park-like area with trees and gardens. The lack of seasonality in urban settings, however, is consistent with the findings of Caseiro (2008). Additionally, Caseiro (2008) provided some evidence of cellulose concentrations at urban sites being greater than for nearby rural or background sites, with residential areas being an intermediate case. Within our Grenoble-based dataset as a comparison, CB (urban) does indeed exhibit cellulose concentrations marginally higher than the urban-background site of LF and significantly higher than Vif (peri-urban).
Alongside Basel, Caserne de Bonne also deviates from the general trend of summer–autumn maxima in cellulose concentrations observed across the other seven locations investigated here. Reasons for this are unclear, but this is suggestive of a source change in atmospheric plant debris or an additional source being present at some urban locations that may mask the typical seasonality. Given that these locations are urban in character, the weak seasonal variations may owe to anthropogenic activity. This will be investigated in Sect. 3.5.
3.4 Contribution of cellulose C to OC
To determine the overall importance of cellulose contribution to PM, the percentage contribution of cellulose carbon to total organic carbon (cellulose C to OC) was determined. Figure 5 illustrates this seasonal average percentage contribution. Table S3 summarises numerically the overall average and seasonal percentage contributions and the ratio of cellulose C contribution during winter and summer. Also highlighted is the maximum contribution of cellulose C to OC experienced over the respective sampling periods at each site.
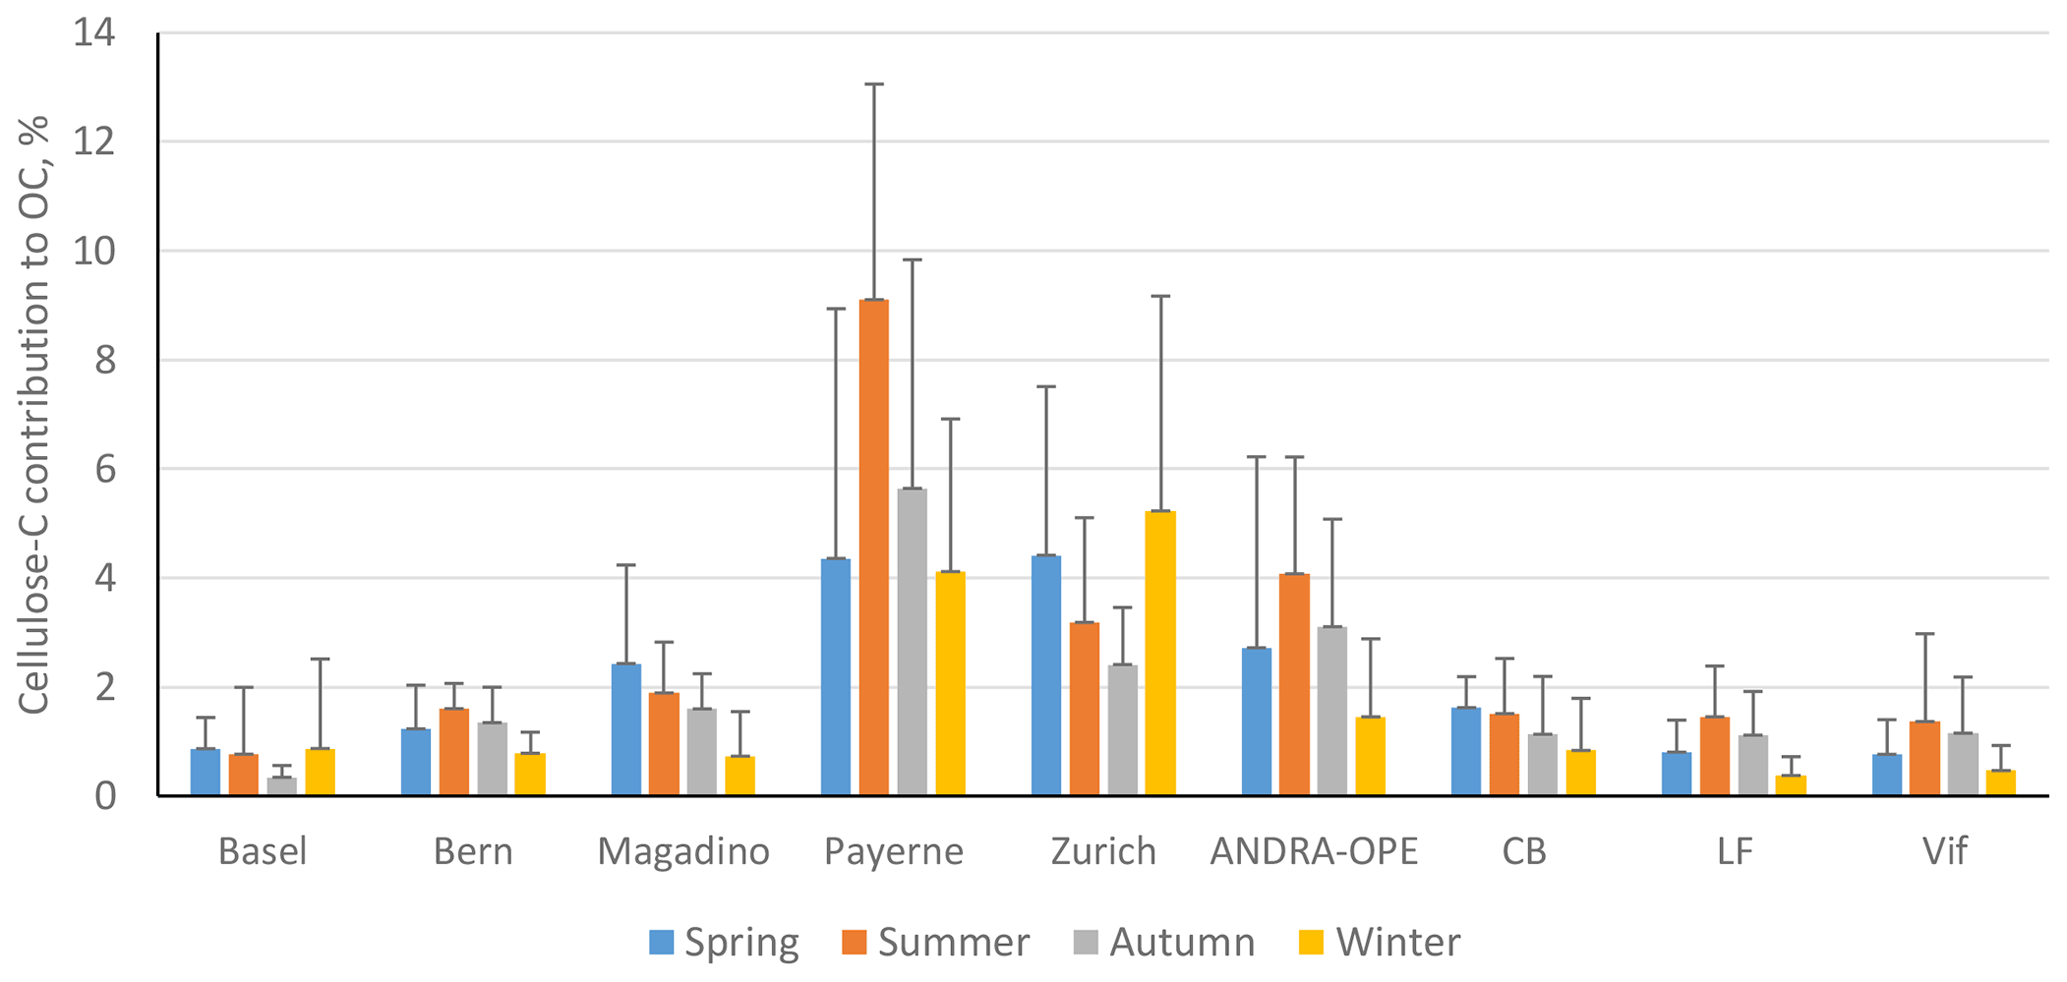
Figure 5Seasonal contributions of cellulose C to OC (%) in PM10 across the nine sites. Seasons are as follows: spring (blue; March–May), summer (orange; June–August), autumn (grey; September–November), and winter (yellow; December–February). Black error bars represent 1 standard deviation of the mean values. Only positive error bars are included, for clarity. LF: Les Frênes, CB: Caserne de Bonne. Grenoble-based sites represented by CB, LF, and Vif.
The highest contributions to OC were typically found at rural sites, potentially due to fewer local sources of OC in rural sites compared to more urban locations. In fact, the annual contribution to OC found at Payerne (5.9 ± 4.4 %) is the highest found in the literature. However, the annual average for the urban site of Zurich is also in a high range, at 3.8 ± 2.9 %. Regarding seasonal contributions, the rural sites in this study show a significantly different seasonal pattern compared those found in the study by Sánchez-Ochoa et al. (2007). Here, we see a noticeably smaller contribution of cellulose C to OC during winter compared to summer. This is reflected in the respective winter summer ratios of cellulose C contribution: the values in this study range between 0.36–0.45, in comparison to 4.2 and 0.3 at the PM10 rural and high-altitude sites used in their study (Sánchez-Ochoa et al., 2007).
While seasonal contributions appear to be moderate in most cases, the contribution of cellulose C within episodes can be much more significant. It is also worth noting that these contributions to OC are derived from free-cellulose concentrations. Thus, the contribution to overall OC will be higher when considering total cellulose. At sites with typically lower seasonal contributions (Basel, Bern, and LF), the episodic contributions reached between roughly 4.1 % and 6.3 %. However, at the sites that illustrated a much higher seasonal average contribution to OC, the maximum contributions during episodes were found to be between 16.1 % at Zurich and 19.7 % at Payerne. These maximum contributions (detailed in Table S3) are similar to those found at the background sites by Sánchez-Ochoa et al. (2007). These values stand to highlight the substantial contribution that atmospheric plant debris can have on atmospheric composition. In other words, PBAPs, as well as plant debris in particular, can contribute greatly to OM and must be considered within all future characterisation and source apportionment studies.
Lastly, the contribution of coarse-mode (PM with diameter less than 10 µm and greater than 2.5 µm) cellulose C to coarse-mode OC was evaluated at the three sites that completed both PM10 and PM2.5 analysis (ANDRA-OPE, Payerne, and Zurich). This can be seen in Table S4 in the Supplement. As PM2.5 data for ANDRA-OPE were only available for the 2020 sampling campaign, PM10 data from 2016 and 2017 were excluded. Table S4 shows a contribution of coarse cellulose C to be 3.16 % at ANDRA-OPE, which is of a very similar magnitude to that of the overall cellulose C contribution to OC. This is potentially due to the significant reduction in cellulose source strength at the ANDRA-OPE site during the year of 2020, compared to the years prior. This will be discussed in Sect. 3.7. However, at both Payerne and Zurich, the annual contributions to coarse OC are notably higher (11.02 % and 13.04 %, respectively) than that of overall cellulose C to OC (5.88 % and 3.76 %, respectively). From these data, we can see that plant debris makes up a significant component of the coarse fraction of OM within these two datasets.
3.5 Investigation of cellulose emission sources
To further evaluate the potential sources of plant debris into the atmosphere, correlations between cellulose and other source-specific tracers were investigated. This is the first cellulose field study to investigate these correlations with other tracers. Briefly, three specific sources have been hypothesised in the literature: direct biogenic emissions, unpyrolysed cellulose during domestic biomass burning, and anthropogenic resuspension and milling of plant debris (Sánchez-Ochoa et al., 2007; Caseiro, 2008; Yttri et al., 2011a, b). The chemical tracers used as proxies for these sources in this study are (i) glucose and polyols; (ii) levoglucosan; and (iii) EC, Ca2+, and Ti, respectively. A suite of correlation coefficients (Spearman's rank correlation, Rs) was created for each site to monitor variations in correlations between site types using daily samples. Spearman's rank correlation was used in this section to better account for anomalous results between different datasets (e.g. cellulose vs. polyols). A value of 1 indicates a perfect positive correlation, and a value of −1 indicates a perfect negative correlation. Table 5 shows the strength of the cellulose–tracer correlation at individual sites across the entire sampling period. A full table, inclusive with the number of data points (n) and p values for each correlation, plus Rs values within each season, can be found in the Supplement (Table S5).
Table 5Spearman correlations (Rs) between cellulose and characteristic chemical tracers across the nine sites. A red cell indicates a positive correlation between cellulose and the selected chemical tracer, whilst a blue cell indicates a negative correlation. A colour-coded key of corresponding Rs values is to the right of the table. Grenoble-based sites are CB (Caserne de Bonne), LF (Les Frênes), and Vif. Note that polyols row represents the sum of arabitol, mannitol, and sorbitol.

3.5.1 Biogenic sources
The best understood chemical tracers for biogenic emissions are polyols (sum of arabitol, sorbitol, and mannitol) and glucose (Bauer et al., 2008; Zhang et al., 2010; Després et al., 2012). Glucose is the most abundant monosaccharide amongst vascular plants, is an important carbon source for bacteria and fungi, and remains stable in the atmosphere (Jia et al., 2010; Zhu et al., 2015). Its multiple biological sources into the atmosphere mean that it can provide a good insight as to whether atmospheric plant debris comes from a predominantly biogenic source. Polyols are also used to provide tracer correlations with cellulose. These species are typically used as markers of airborne fungi but have also been found to be present within leaves and pollen (Medeiros et al., 2006).
As we can see in Table 5, relatively strong positive correlations arise between cellulose and the two selected biogenic source tracers at most sites. The strongest correlations were seen at rural locations (Magadino, Payerne, and ANDRA-OPE; p < 0.0001). However, Bern and LF, traffic-impacted and urban-background sites, respectively, also showed similar Rs magnitudes to their rural counterparts (p < 0.0001). This indicates that similar factors promote the emission of all of cellulose, polyols, and glucose. The remaining four sites, all urban in character, showed weaker correlations of cellulose with both glucose and polyols. It should also be said that correlations across all sites were of a similar magnitude when comparing cellulose–glucose and cellulose–polyol concentrations. The stronger correlations at the rural sites indicate that a significant portion of atmospheric cellulose, and thus plant debris, arises from biogenic sources at these sites. As the values are typically below 0.7, this could suggest a different timing of emissions between biogenic tracers and cellulose (e.g. meteorological conditions favouring emission of fungal spores before plant debris). This is a distinct possibility, given that sampling ranges between 3–6 d at the nine locations. Additionally, these moderate correlations with biogenic tracers could be due to some input from other sources but of a lower magnitude. By contrast, the weaker correlations observed at most urban sites suggest that there remain other, potentially more prominent, sources at play that determine atmospheric cellulose concentrations. The two exceptions to this, LF and Bern, show that the sources of atmospheric plant debris are not consistent within each designated site type.
It is noteworthy that the five locations that illustrate the strongest correlations with glucose and polyols are the five out of the six sites in which the common, general-case seasonality is observed. It is thus likely that this typical seasonality pattern is observed where the biogenic source of plant debris is the most dominant.
3.5.2 Biomass burning
A potential second source of atmospheric cellulose was proposed by Sánchez-Ochoa et al. (2007) to account for anomalous high cellulose concentrations during winter. They suggested that they were caused by unburned cellulose during biomass burning (Sánchez-Ochoa et al., 2007). They also concluded that it was an unlikely process, based on the work of Schmidl (2005) illustrating that only a very small concentration of cellulose can be found in wood smoke. Nevertheless, correlations between cellulose and levoglucosan, a chemical tracer for biomass burning, were completed here to provide a more robust understanding of the viability of this hypothesis (Giannoni et al., 2012; Madsen et al., 2018).
Table 5 indicates cellulose–levoglucosan tracers across all sites show no correlation with one another and in some instances show a moderate anti-correlation (Rs = −0.43–0.00, p = 0.0001–0.98). Stronger anti-correlations were seen at sites that also showed strong correlations with biogenic tracers. Given that the theory was based on a wintertime source of atmospheric cellulose via biomass burning, it is important to view the seasonal correlations to gain a fuller understanding (Table S5 in the Supplement). Of all sites, the Grenoble-based locations (Caserne de Bonne, Les Frênes, and Vif) were the only three to have greater than the 30 data points of simultaneous cellulose and levoglucosan measurements needed for a robust correlation. None of these three locations showed any correlation between cellulose and levoglucosan (Rs = 0.05–0.18, p = 0.14–0.74). In fact, the remaining six locations showed also very weak correlation, except for the site of Bern, which showed a moderate correlation (Rs = 0.49, p < 0.03). But, as already mentioned, the relatively small wintertime dataset for these six other sites (n = 21 to 25) does not provide strong confidence in these results. Thus, we can state that the sources of atmospheric plant debris, as indicated by measurements of free cellulose, do not seem to include any significant input from biomass burning from domestic wood. Further investigation would be needed concerning possible emissions of total cellulose, including the one still embedded in lignin.
3.5.3 Other anthropogenic sources
It has also been hypothesised that others anthropogenic activities may contribute to atmospheric cellulose. Caseiro (2008) noticed typically higher cellulose concentrations in urban locations, compared to the more rural ones within their study. The predominant hypotheses for anthropogenic input of plant debris into the atmosphere were mechanisms such as resuspension via road traffic, paper usage, and lawn mowing. To test these hypotheses, correlations were computed between cellulose and known chemical tracers for man-made emissions and mineral dust: elemental carbon (EC) and Ti Ca2+, respectively. EC is a known primary product of combustion processes and is dominated by anthropogenic sources, including road traffic, in urban areas (Wu and Yu, 2016). Ca2+ is also used as a tracer for mineral dust, which commonly enters the atmosphere via road wear, gritting, and dust resuspension due to transport, as well as via gusts of wind (Denier van der Gon et al., 2010). At the Swiss sites, Ca metal was measured as opposed to the soluble ion Ca2+ but is a still a suitable tracer for mineral dust. Titanium metal is also used as a chemical tracer for mineral dust and thus should possess a similar resuspension mechanism (Charron et al., 2019). A positive correlation with these dust tracers would suggest plant debris is resuspended into the atmosphere via the same established mechanism as mineral dust.
Considering EC first, Table 5 shows typically weak positive correlations between EC and cellulose abundance at sites considered to be urban or traffic-impacted in character, excluding Les Frênes (Rs = 0.25–0.34, p < 0.03). The rural-based sites showed very little correlation (Rs = −0.03–0.11, p = 0.16–0.79), suggesting that any resuspension mechanism of plant debris involving automotive vehicles is only active in more built-up areas. In any case, automotive resuspension of plant debris appears to be relatively weak, even when present at the more urban locations.
In general, cellulose correlations with the two mineral dust chemical tracers were slightly stronger across all sites compared to their respective cellulose–EC correlations. These values were once again higher at more urban locations compared to rural sites, in particular at Basel and Bern, which show Rs values between 0.37 and 0.45 (p < 0.001). The stronger correlations with mineral dust do seem to suggest that ambient cellulose concentrations are somewhat influenced by the resuspension of plant debris in a manner similar to that of mineral dust. Yet, given the lack of significant correlation with EC, it seems that a resuspension mechanism may not include a vehicular input. Other anthropogenic resuspension mechanisms not related to traffic may contribute; paper usage (e.g. newspaper and cardboard production) has been mooted in previous literature (Caseiro, 2008). These still unknown mechanisms could shadow the seasonality of cellulose concentrations in more urban locations. One possible process without anthropogenic input, however, could be via strong gusts of wind that resuspend this plant material. Agricultural activities can also play a large role in emitting plant matter into the atmosphere. Samaké et al. (2019b) showed maximum cellulose concentrations occurred during harvest (summer) at ANDRA-OPE. This agricultural input from harvested land is also a major emission source of polyols and glucose, which may explain the strong correlations of cellulose with these tracers at the more rural locations (Samaké et al., 2019b). A lot of these processes (seed emission, harvest, mowing, tree cutting, street sweeping, traffic, etc.) are highly sporadic and are subject to significant uncertainties, such as particle loads before, during, and after rain.
Overall, several conclusions can be drawn for the three potential sources proposed in the literature. Firstly, the direct biogenic source of atmospheric plant debris is by far the most significant, showing moderate to strong Spearman correlations between cellulose and other characteristic biogenic tracers. This is particularly clear in rural sites; the correlation is inconsistent among other site types. In addition, there is no source of atmospheric plant debris that arises from biomass burning across any season or site type, as already suggested by Borlaza et al. (2021a). Lastly, the resuspension of plant material could be another possible input to overall ambient plant debris abundance. This mechanism does not seem to incorporate road traffic in the way suggested by Caseiro (2008), given the lack of correlation between cellulose and EC abundance.
3.6 Local vs. regional origin
Seasonal cellulose variations show neither a similar pattern across all sites nor one that is consistent across different regions and scales. This trend, or lack thereof, was expressed numerically using correlation coefficients (R2) of monthly concentration averages for the groups of sites that were sampled at the same time. As shown in Table 6, the correlations between sites within the Grenoble metropole (CB, LF, and Vif) are low to moderate. This is also the case for the Swiss sites, which span a much larger spatial range compared to the Grenoble-based sites. The lack of a shared temporal variability seems to indicate that the major sources of plant debris are most likely to be local to each site. It may also suggest that several mechanisms impacting ambient cellulose concentrations contribute to different degrees according to the investigated site (Caseiro, 2008; Winiwarter et al., 2009; Borlaza et al., 2021a). Moderate correlations between the traffic-impacted location in Bern with the two rural sites of Magadino and Payerne were the highest among the Swiss sites. Regardless, these values are not indicative of a common source. The Grenoble-based sites of LF and Vif do seem to show a slight exception, producing an R2 value close to 0.7 (p < 0.0001). The three monitoring locations within the Grenoble metropole are within 15 km of one another, so a common source of atmospheric plant debris on local scales of this magnitude remains possible.
Table 6Correlations (R2) of monthly cellulose concentrations between the Swiss sites (top) and between Grenoble-based sites (bottom; LF, CB, and Vif). The colour-coded key (right) gives the corresponding colour of the correlation strength (R2 values). A strong correlation (R2 close to 1) is coded red, with no correlation coded blue. Intermediate correlations are coded white. CB: Caserne de Bonne, LF: Les Frênes. Grenoble-based sites represented by CB, LF, and Vif.
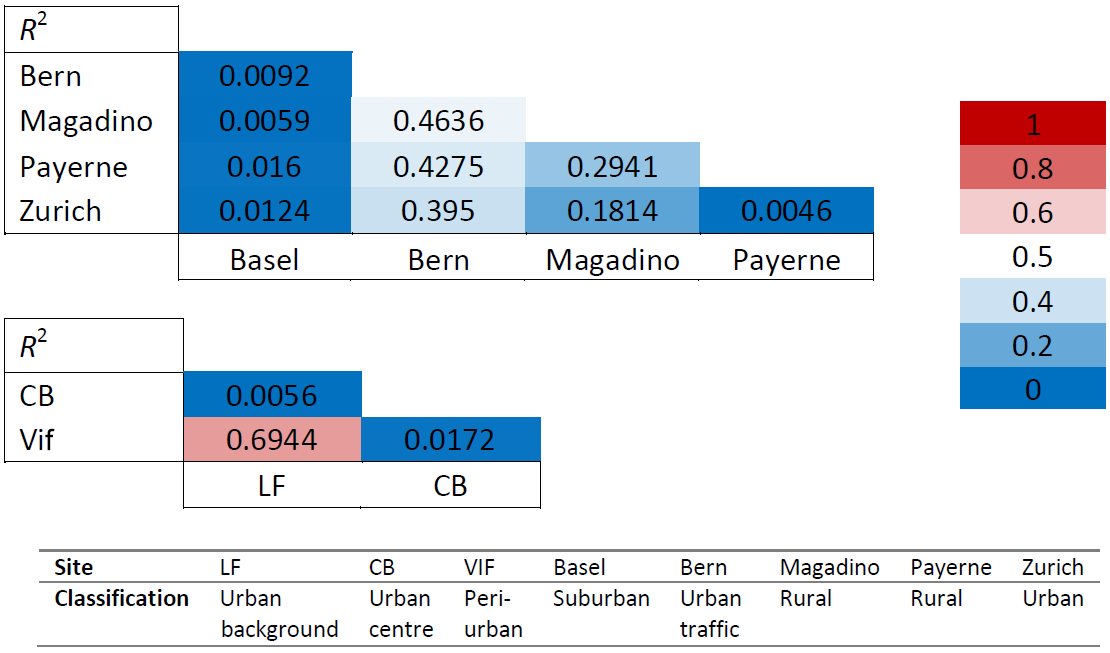
The R2 values in Table 6 were compared to correlations between monthly mean concentrations of the so-called polyol fraction (i.e. sum of arabitol, mannitol, and sorbitol) for the same set of locations (Samaké et al., 2019a; Borlaza et al., 2021a; Grange et al., 2021). In contrast to cellulose, polyols show common temporal variations, with R2 correlations ranging from 0.4–0.91 and 0.95–0.98 (p < 0.0001) within the groups of Swiss and Grenoble-based sites, respectively (Tables S6 and S7). Polyols are used as chemical tracers for fungal spores, a very common class of PBAPs, and here provide a nearly perfect example of a PBAP class displaying homogenised concentration variations over time at a regional scale. This suggests a single common source of polyols that is impacted similarly by external factors across all locations, especially at short range e.g. within the Grenoble area. This was also suggested by Borlaza et al. (2021b) during their PMF study and by Samaké et al. (2019a) as part of their study across all of France. Moreover, Samaké et al. (2020, 2021) evidenced that the presence of fungi and bacteria in ambient air is mostly related to a limited number of microorganism species only, which vary from one climatic region to the next.
The stark contrast between the two sets of chemical tracers (cellulose vs. polyols) highlights the rather local nature of atmospheric plant debris and its sources. Given that meteorology is relatively consistent on a short to medium scale (< 200 km), it would be expected that plant debris emissions would impact all sites of a given area similarly. However, heterogeneous distribution of the diverse plant species at the city (or regional) scale might induce specific temporal variations in the emissions of plant debris at the local scale. Therefore, the lack of correlation in cellulose datasets may result from site-to-site differences in the dominant sources (flora) or emission processes of ambient plant debris (Caseiro, 2008).
3.7 Interannual comparison – a combined approach
Cellulose concentrations were measured over two separate time periods, 2017–2018 and 2020–2021, in Grenoble and over three separate time periods, 2016, 2017, and 2020, at ANDRA-OPE. These multiple datasets (with a similar number of data points) gave us the opportunity to assess the interannual variations in atmospheric plant debris, in the same regions. This provided the possibility of combining the various analyses used in the above sections as part of a more small-scale, holistic investigation.
3.7.1 Grenoble
Figure 6 presents the seasonal mean cellulose concentrations across the two time periods within the Grenoble metropole (expressed numerically in Table S8 in the Supplement). The difference in cellulose concentrations between different sampling years is stark. Both CB and Vif show significant decreases in cellulose concentrations from 2017–2018 to 2020–2021, with the exception of the spring period. For example, summer and autumn cellulose concentrations decreased by over a factor of 3 between 2017–2018 and 2020–2021. This is not the case for the urban-background site of Les Frênes, where the seasonal concentrations typically increased across all seasons except for spring.
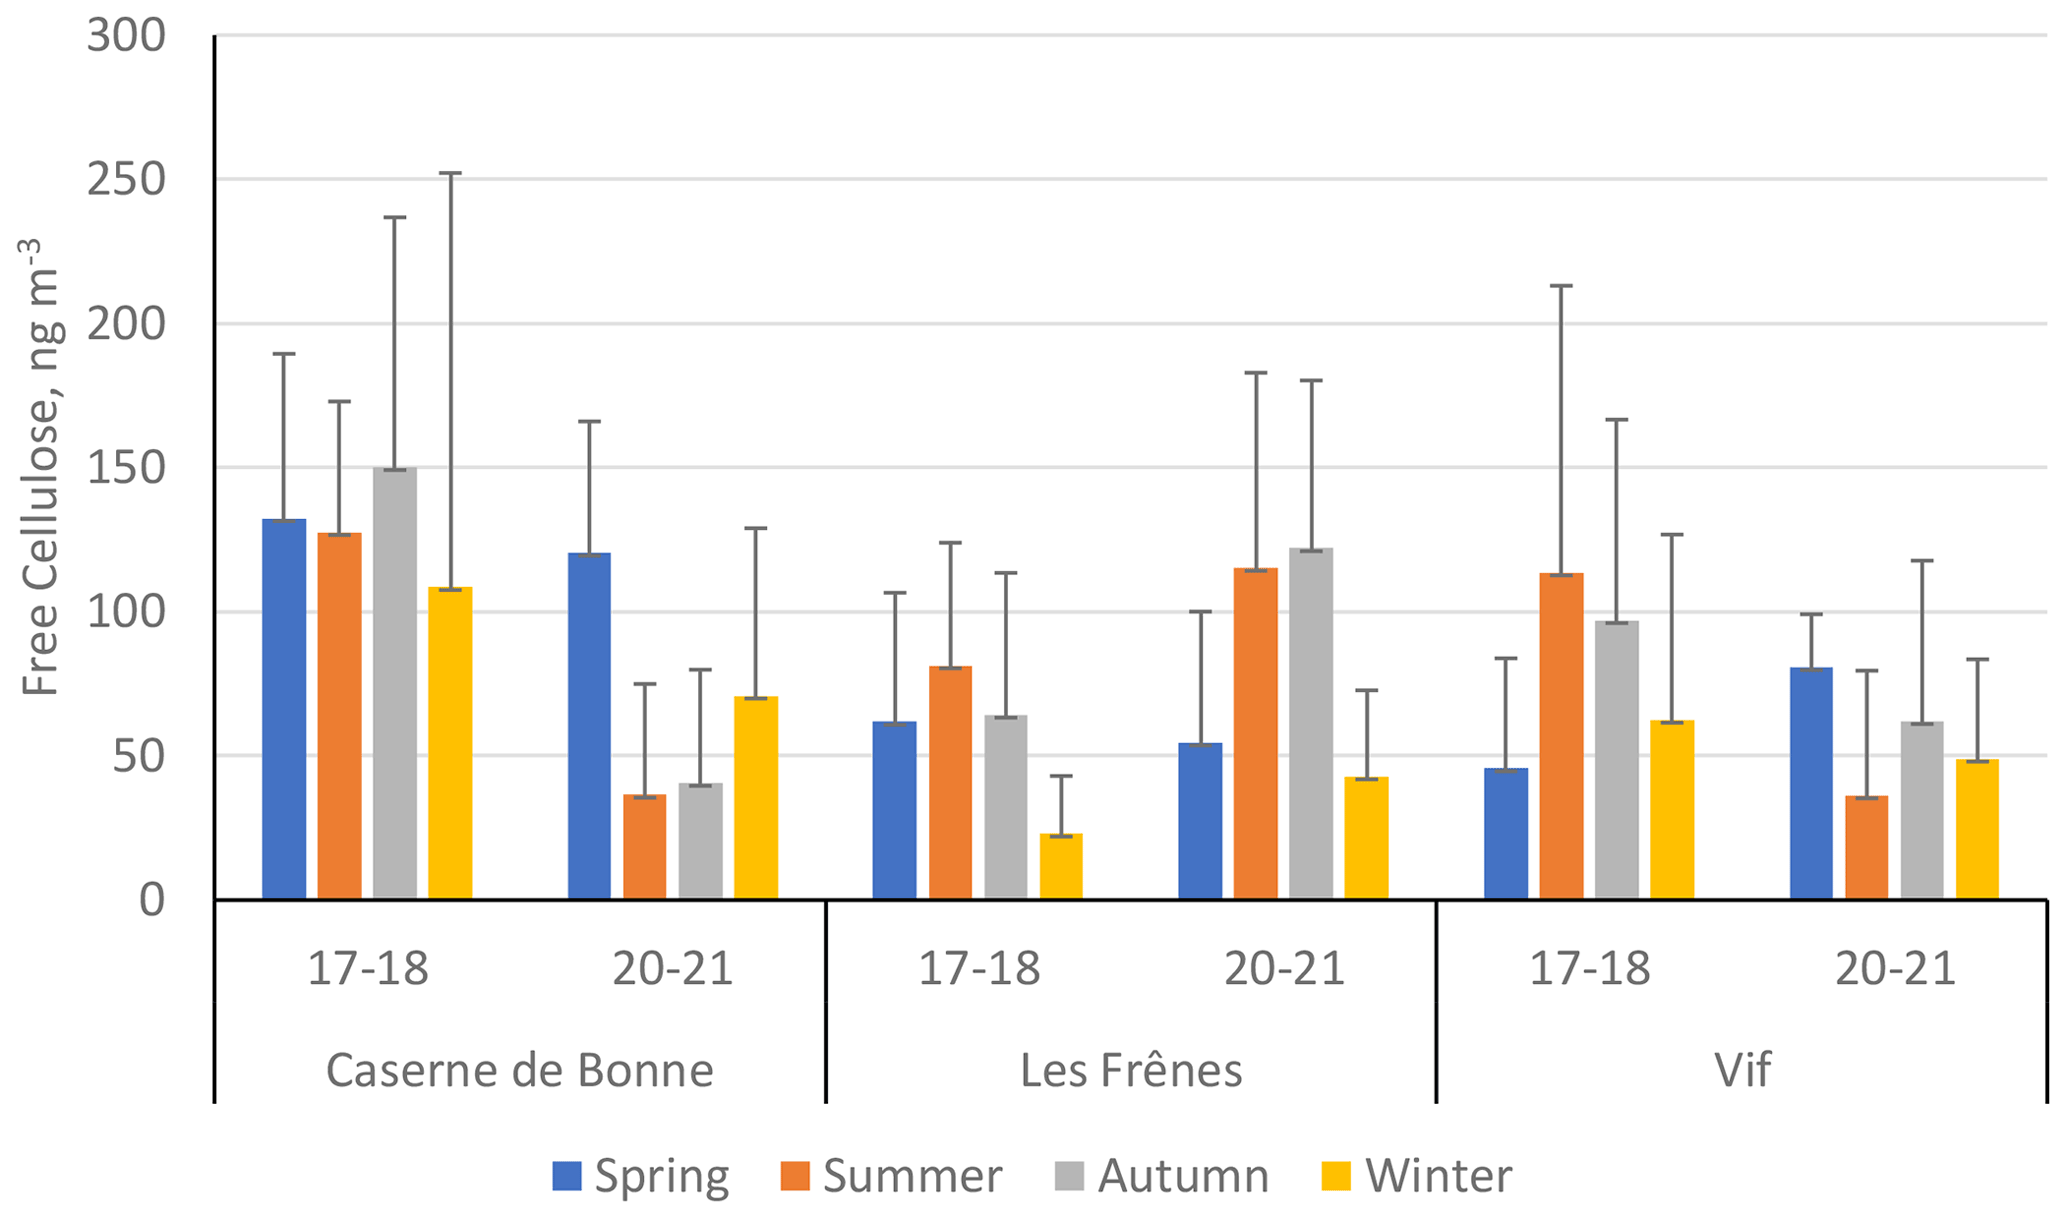
Figure 6Seasonal mean averages of cellulose concentrations (ng m−3) of the three sites within the Grenoble metropole across the two separate sampling periods: 2017–2018 (17–18) and 2020–2021 (20–21). Black error bars represent 1 standard deviation of the seasonal means. Only positive error bars are shown to aid clarity. Seasons are defined as December–February (winter), March–May (spring), June–August (summer), and September–November (autumn). Site classifications are as follows: urban for Caserne de Bonne, urban background for Les Frênes, and peri-urban for Vif.
Temperature data were used as an attempt to elucidate the contrasting concentrations across the two sampling periods (Fig. S4 in the Supplement). A warmer and more humid climate not only brings about greater biological activity (e.g. an increase in pollen production) but also can speed up the decomposition processes involved in generating plant debris (Liu et al., 2006; Martínez et al., 2014; Verma et al., 2018). Temperature data for Grenoble across the two sampling periods were provided by Atmo Auvergne-Rhône-Alpes (Atmo AURA, 2021).
Seasonal and monthly average temperatures across the two sampling periods show some differences, but the variation is slight (Fig. S4 in the Supplement). It is highly unlikely in this instance that the large variations in the atmospheric cellulose concentrations were caused by ambient temperature changes. This is further supported by the lack of change in seasonal average polyol concentrations for the same sites, shown in Fig. S5, whose concentrations are impacted solely by biogenic factors (Bauer et al., 2008; Zhang et al., 2010; Després et al., 2012). While other climate data were not been available, there is potential for the variability in cellulose source strengths to have been caused by factors that are not purely meteorological. This observed variability may be related to changes in human activities associated with the COVID-19 lockdown and sanitary restrictions. This would most profoundly affect the pedestrianised urban centre of Caserne de Bonne, with the prolonged closure of shops in the area surrounding the sampling site, together with the decrease in traffic on the nearby avenues.

Figure 7Percentage contribution of cellulose-derived carbon towards overall organic carbon (cellulose C to OC) across the three sites within the Grenoble metropole during the two separate sampling periods: 2017–2018 (17–18) and 2020–2021 (20–21). Black error bars represent 1 standard deviation of the seasonal means. Only positive error bars are shown to aid clarity. Seasons are defined as December–February (winter), March–May (spring), June–August (summer), and September–November (autumn). Site classifications are as follows: urban for Caserne de Bonne, urban background for Les Frênes, and peri-urban for Vif.
Interestingly, changes in ambient cellulose concentrations across the two periods are concomitant with changes in the contribution of cellulose C to OC (Fig. 7, numerical values in Table S9). Thus, it is likely that changes in atmospheric cellulose concentrations will have resulted from changes in the source strength of plant debris and not from a wider-scale reduction in some or all other OC sources.
Table 7Spearman correlations (Rs) between cellulose and characteristic chemical tracers at the Grenoble-based sites, across the two separate sampling periods: 2017–2018 and 2020–2021. A red cell indicates a positive correlation between cellulose and the selected chemical tracer, whilst a blue cell indicates a negative correlation. A colour-coded key of corresponding Rs values is to the right of the table. Site classifications are as follows: urban for Caserne de Bonne (CB), urban background for Les Frênes (LF), and peri-urban for Vif. Note that polyols row represents the sum of arabitol, mannitol, and sorbitol.
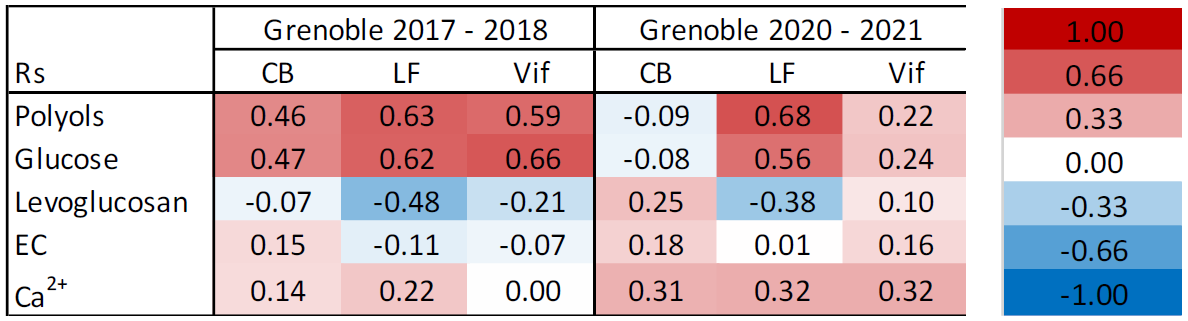
Given that these large interannual variations seemed to be predominantly limited to cellulose and not the remaining sources of OC, it was necessary to evaluate the potential sources once more. Following Sect. 3.5, cellulose–tracer correlations were again produced using the same characteristic source tracers for the two periods to see if changes in cellulose concentrations were consistent with variations in tracer correlations. These correlation coefficients can be seen in Table 7 (Table S10 for full table). From the two sets of correlations, it is evident that the sources of plant debris are only consistent between campaigns at Les Frênes. Reasonable correlations with characteristic biogenic chemical tracers (polyols and glucose) remain consistent, whilst a moderate anti-correlation is still seen between cellulose and levoglucosan. No correlations with EC were seen throughout the two campaigns.
By contrast, tracer correlations across both CB and Vif vary significantly between the two campaigns. Rs values of cellulose vs. glucose or polyol concentrations decrease significantly during the 2020–2021 campaign. A weak positive correlation becomes apparent between cellulose and Ca2+ concentrations during the 2020–2021 campaign that was absent during the previous series. This is particularly visible at Vif, but it is also a consistent trend across all three sites. These findings suggest potentially two possible hypotheses. Firstly, the contribution of plant debris arising from biogenic sources has been much weaker during the second campaign at CB and Vif, compared to 3 years earlier, thus showing little to no correlation with characteristic biogenic tracers. This may be the reason for the weakened seasonality at both CB and Vif. Secondly, the increased correlation with Ca2+ during 2020–2021 implies a better correlation between plant debris and mineral dust abundance. This in turn could suggest a slight increase in the strength of plant matter resuspension during the second campaign, compared to 2018–2019.
3.7.2 ANDRA-OPE
Figure 8 shows the seasonal mean average free-cellulose concentrations (ng m−3) for three separate sampling campaigns (2016, 2017, and 2020) at ANDRA-OPE (numerical values in Table S11 in the Supplement). During the 2017 monitoring campaign, an extended period of sampling was completed with samples being taken on average five times per week during summer. For this interannual analysis, it was important to bring the number of data points in line with the datasets from 2016 and 2020. Samples were removed from the 2017 dataset until the same sampling frequency was obtained across all the periods (one sample taken every sixth day). As can be seen in Fig. 8, cellulose concentrations dropped significantly between 2016–2017 and 2020, with the exception of the winter period. This is in a manner very similar to the variations seen at the CB and Vif sampling sites from within the Grenoble metropole. The data for the winter period in 2020 come predominantly from before the COVID-19 pandemic, so it is possible for the significant reduction in anthropogenic activities to be a major factor in the reduction in atmospheric cellulose concentrations. However, it should be mentioned that agricultural activities (fertilisation, harvest, ploughing, etc.) were not affected by the COVID-19-associated restrictions.
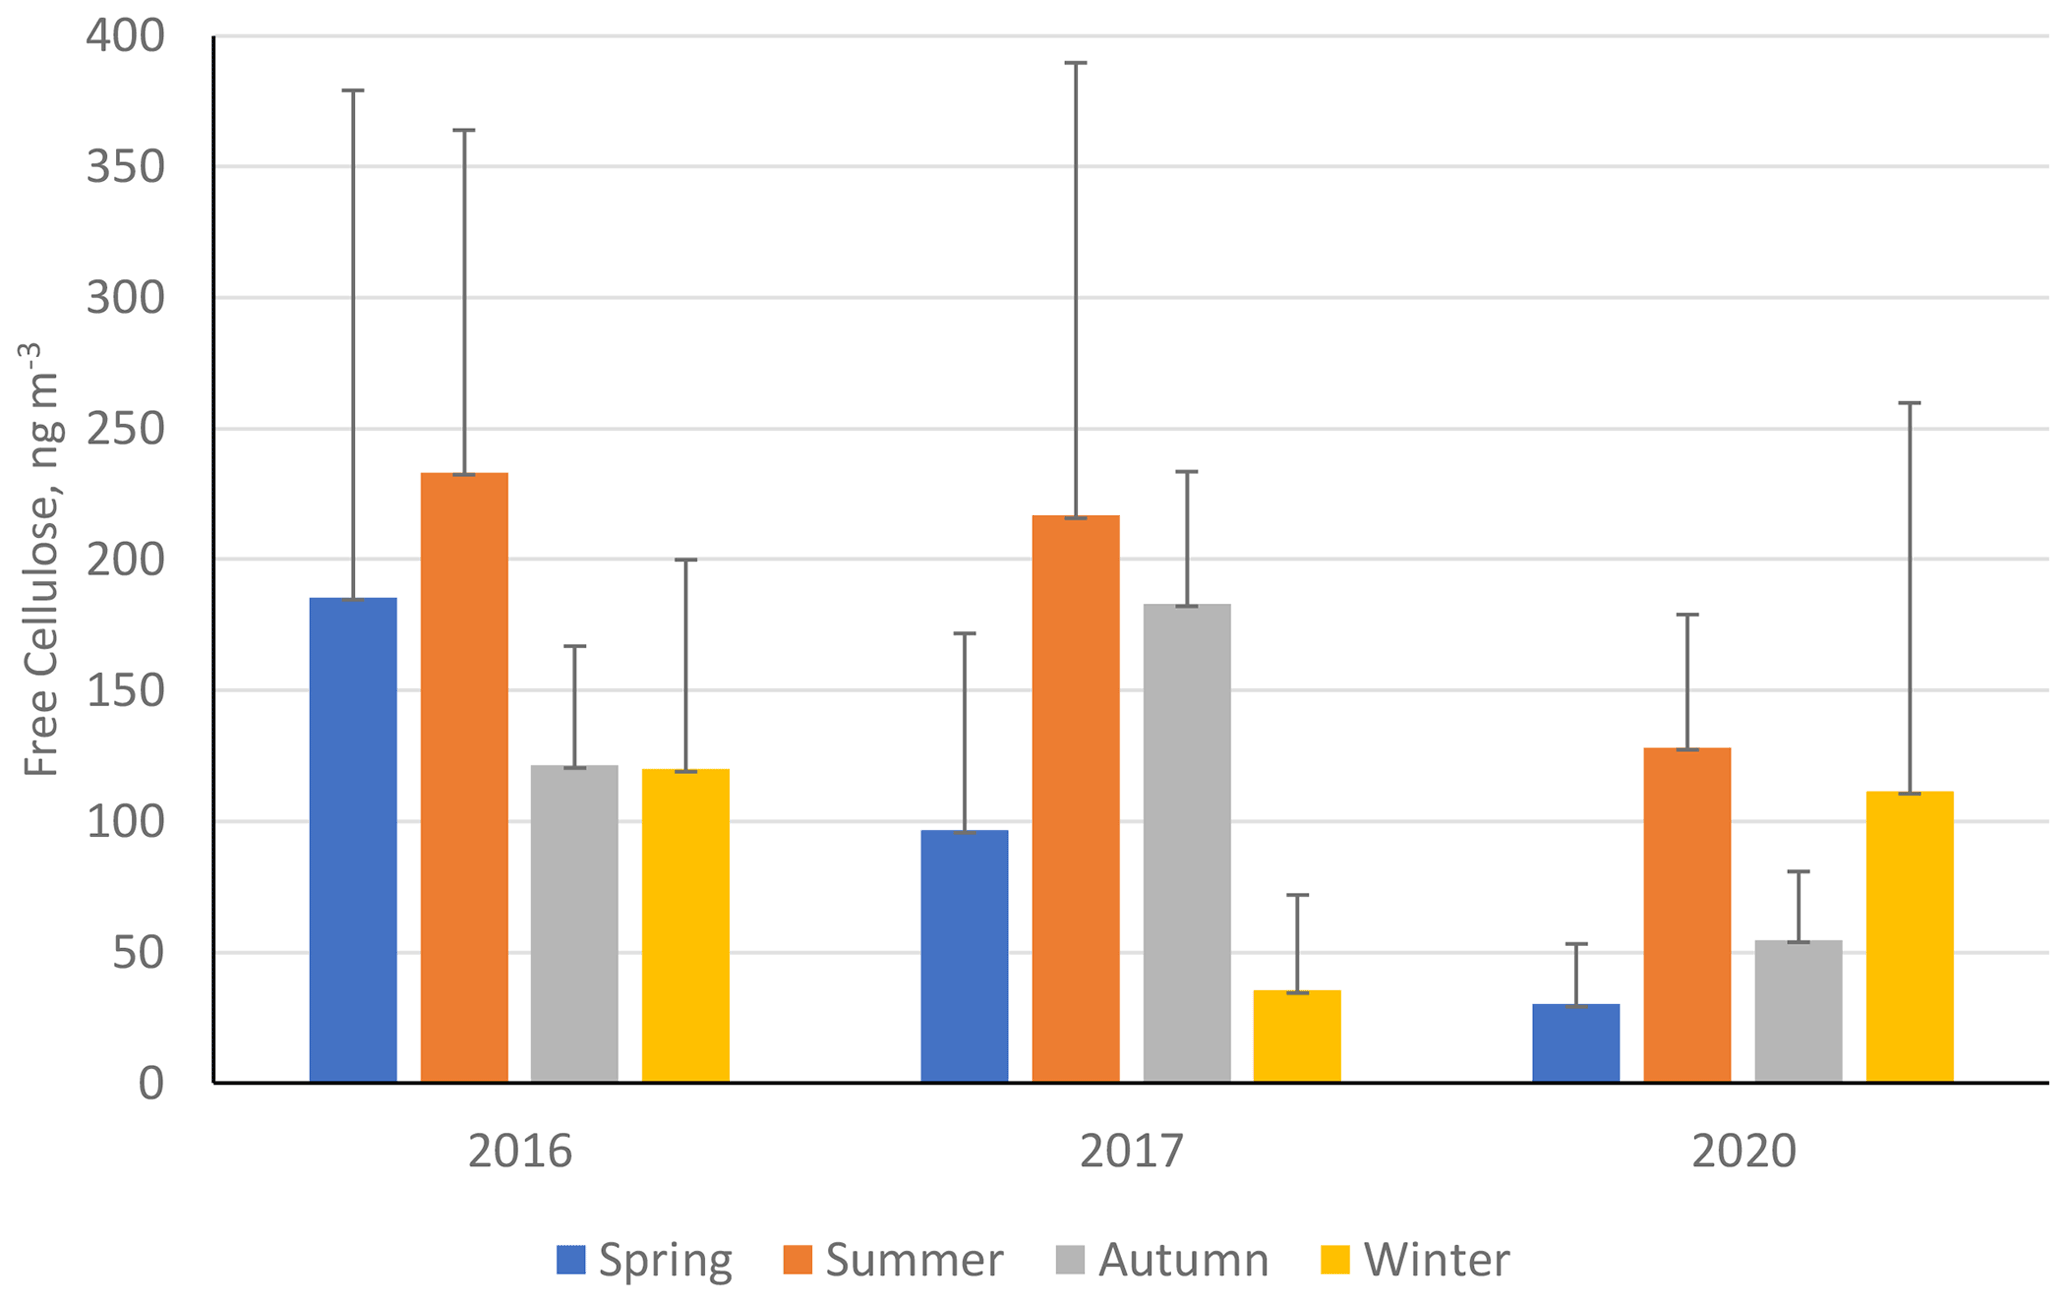
Figure 8Seasonal mean averages of cellulose concentrations (ng m−3) at ANDRA-OPE (rural site) during the three separate sampling periods: 2016, 2017, and 2020. Black error bars represent 1 standard deviation of the seasonal means. Only positive error bars are shown to aid clarity. Seasons are defined as December–February (winter), March–May (spring), June–August (summer), and September–November (autumn).
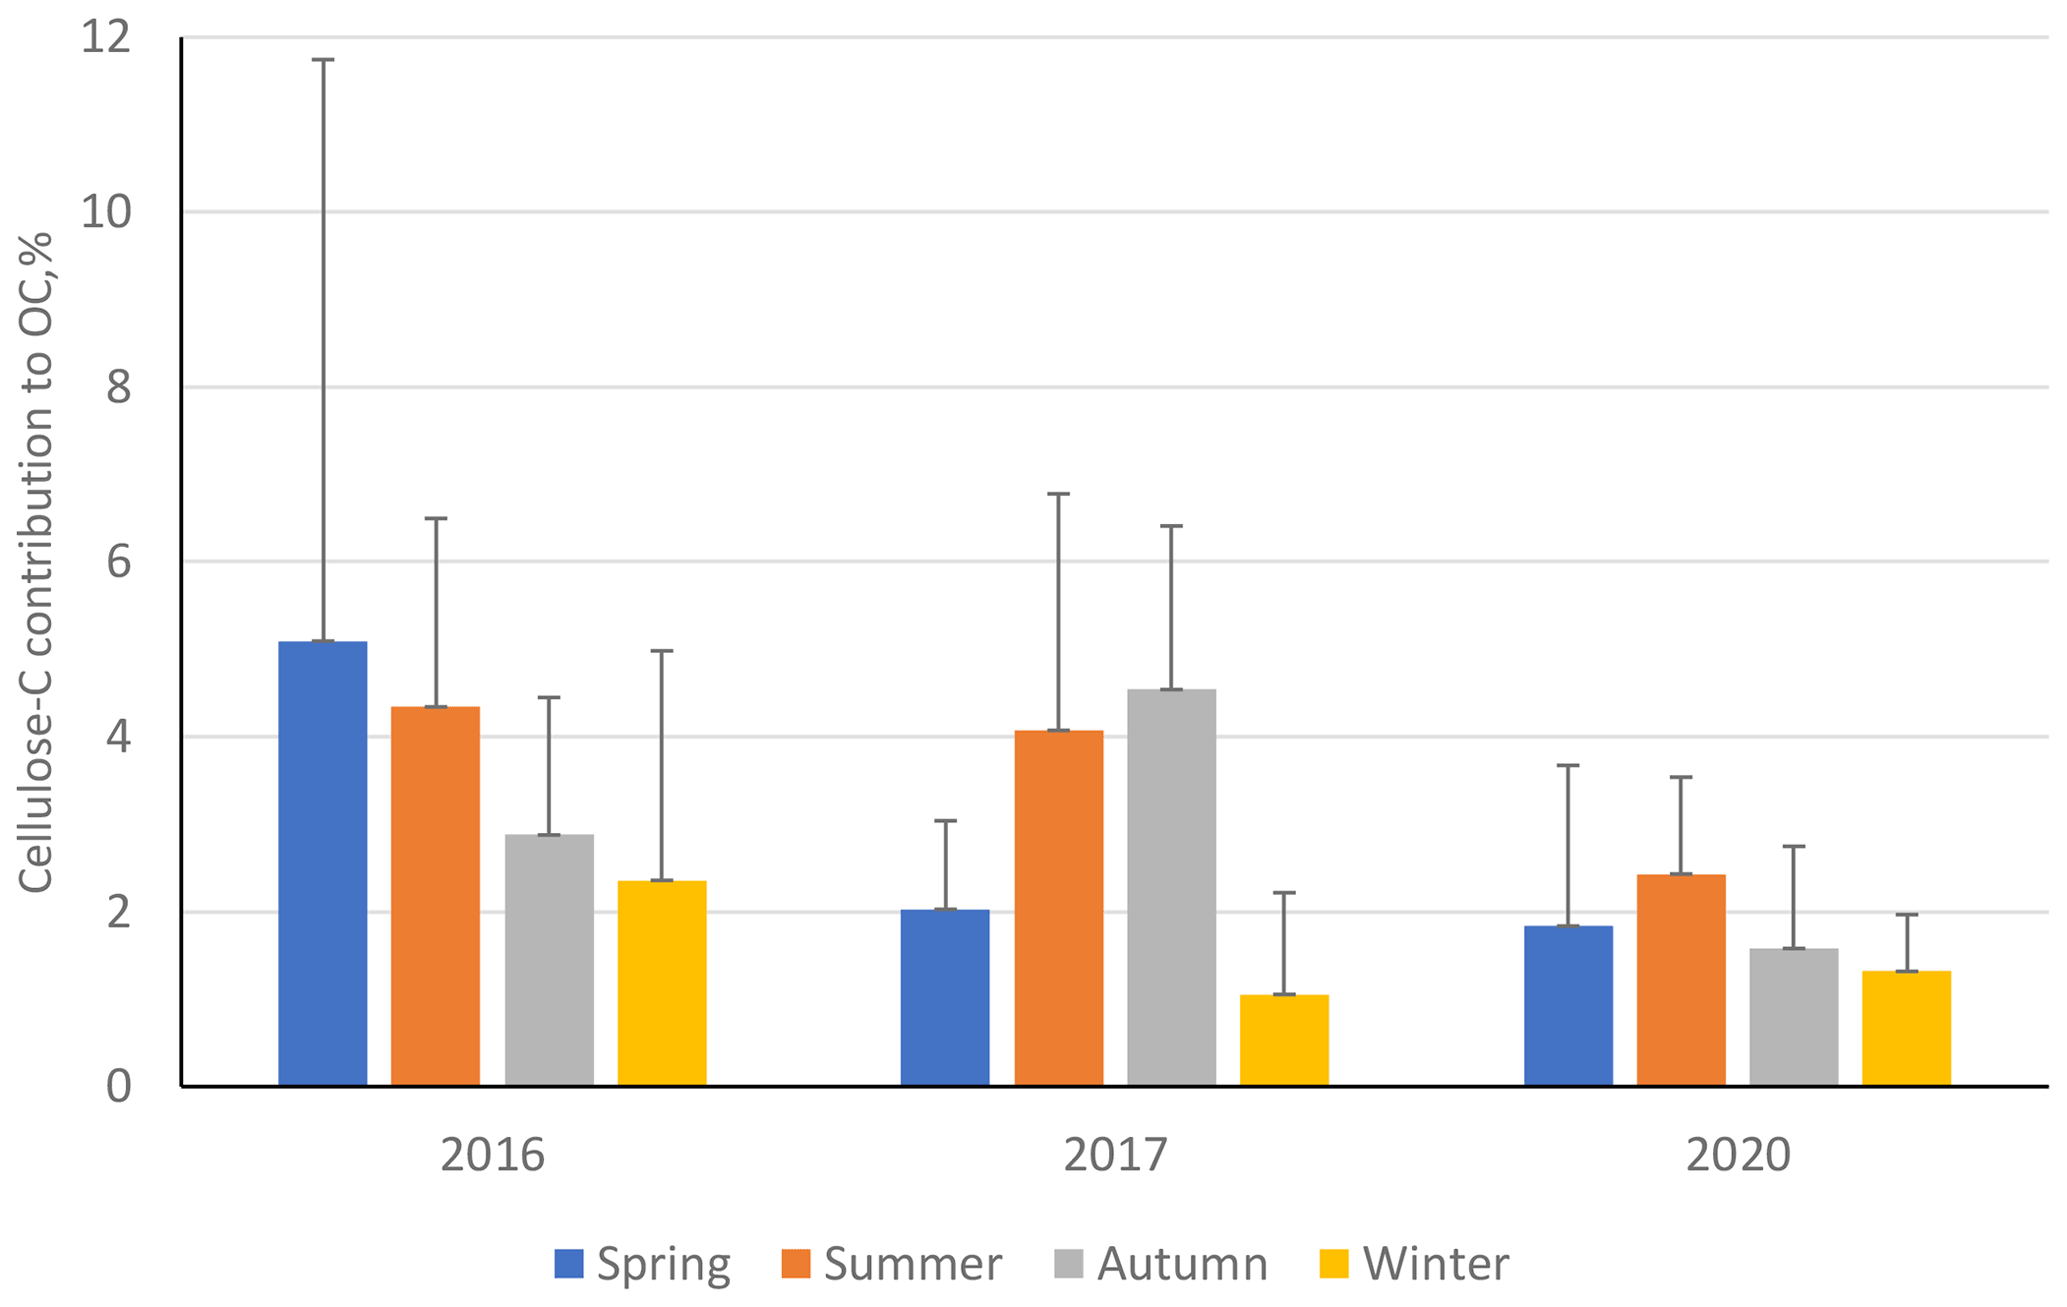
Figure 9Percentage contribution of cellulose carbon towards overall organic carbon (cellulose C to OC) at ANDRA-OPE during the three separate sampling periods: 2016, 2017, and 2020. Black error bars represent 1 standard deviation of the seasonal means. Only positive error bars are shown to aid clarity. Seasons are defined as December–February (winter), March–May (spring), June–August (summer), and September–November (autumn).
Further, we once again see a noticeable reduction in the contribution of cellulose C to OC (%) during the 2020 sampling period, compared to the two previous campaigns, especially during summer and autumn (Fig. 9, numerical values Table S12 in the Supplement). This suggests that the source of atmospheric plant debris became significantly weaker during 2020, when placed in the context of overall OC atmospheric emission. Unlike the Grenoble metropole dataset, at ANDRA-OPE the seasonal variations in cellulose concentrations and the respective contributions of cellulose C to overall OC are different. This may suggest that other emission sources of OC have varied at ANDRA-OPE, compared to the more consistent OC emission within Grenoble across its sampling periods.
Following these significant interannual variations within cellulose concentrations and cellulose C to OC, correlations of cellulose with source-specific tracers were completed to see how the source of atmospheric plant debris has changes between the three sampling periods (Table 8, p values in Table S13 in the Supplement). The three sampling periods at ANDRA-OPE exhibit significant variations in their cellulose–tracer correlations. Notably, the correlations of cellulose with biogenic tracers (polyols and glucose) remain generally moderate throughout and in fact are weakest during the 2016 campaign. This suggests that, at the rural site of ANDRA-OPE, the significant reduction in atmospheric cellulose concentrations during 2020 is consistent with that of the changes within other biogenic chemical tracers. Further, during the 2020 campaign, a relatively strong correlation is seen between cellulose and Ca2+, a mineral dust tracer that is absent during the previous two campaigns. This potentially implies a significant contribution to cellulose concentrations from an anthropogenic source or reflects a correlation to wind speed. An anthropogenic source would be unlikely however, given the rural nature of this sampling site and its lack of proximity to anthropogenic inputs, outside of agriculture.
Table 8Spearman correlations (Rs) between cellulose and characteristic chemical tracers at ANDRA-OPE, across the three separate sampling periods: 2016, 2017, and 2020. A red cell indicates a positive correlation between cellulose and the selected chemical tracer, whilst a blue cell indicates a negative correlation. A colour-coded key of corresponding Rs values is to the right of the table. Note that polyols row represents the sum of arabitol, mannitol, and sorbitol.

Overall, these results at ANDRA-OPE and within the Grenoble conurbation indicate for the first time a large interannual variability in the sources and drivers of atmospheric cellulose and highlight our emerging knowledge of these processes.
Previous work has acknowledged the potential contribution of atmospheric cellulose to PM10 and atmospheric OC (Yttri et al., 2011b; Bozzetti et al., 2016; Borlaza et al., 2021a). Yet, long-term studies using cellulose as a chemical tracer for atmospheric plant debris are still rare and typically cover only few ambient conditions (Sánchez-Ochoa et al., 2007; Caseiro, 2008; Yttri et al., 2011a, b; Alves, 2017). Thus, an investigation of ambient cellulose concentrations, across a wide range of locations and site types, using a sensitive HPLC-PAD analysis and an improved hydrolysis method was undertaken. To date, with more than 1500 samples analysed in the exact same way, this is one of the most in-depth studies of atmospheric cellulose, its seasonality, its spatiotemporal variability, and its sources.
Annual mean free-cellulose concentrations were found to range between 29 ± 38 ng m−3 at Basel to 284 ± 225 ng m−3 at Payerne (suburban and rural sites, respectively). All rural sites and half of the urban sites showed cellulose concentrations that were highest during summer and autumn, coinciding with typically higher seasonal temperatures. This seasonality differs from the spring–summer maximum illustrated by Sánchez-Ochoa et al. (2007). The remaining urban sites deviated significantly from this pattern, showing no evidence of seasonal cellulose variations. This suggests that different sources or processes may shadow the cellulose seasonality in some urban areas. Cellulose concentrations generally correlated poorly between sites, which implies a source of atmospheric plant debris that is highly localised.
For the first time, correlations of cellulose with chemical tracers, which are characteristic of specific emission sources, were completed to best apportion the origins of atmospheric plant debris. It was shown that plant debris arises predominantly via direct biogenic emissions, particularly at rural locations. Further, the sites showing the strongest correlations with biogenic tracers were the same sites that exhibited the general summer–autumn cellulose maxima. A potential secondary influence towards ambient cellulose concentrations comes via resuspension of previously settled plant matter, comparable to that of mineral dust. The mechanism associated with this source is unknown but is unlikely to possess a traffic signature at the sites investigated, given the poor cellulose correlations with EC, a known tracer for anthropogenic combustion mainly related to traffic in urban areas. This may be the factor that masks seasonality at some urban sites. At rural locations, agricultural activities can be a significant source of cellulose into the atmosphere during harvest, as demonstrated by Samaké et al. (2019b). Lastly, biomass burning is not a source of atmospheric cellulose for the sites investigated here.
The annual contribution of free-cellulose-derived carbon to total organic carbon ranged between 0.7 % and 5.9 % for the measured locations, with rural sites typically showing higher contributions. It should be noted that the percentage contribution of total-cellulose-derived carbon to OC would be greater than the above values. While the annual mean contributions to OC seem moderate, this percentage can greatly increase during episodic cellulose concentration spikes. The maximum percentage contributions seen of cellulose C to OC at Payerne and ANDRA-OPE were 19.7 % and 18.3 %, respectively, which are consistent with other background sites results found in the literature. These significant episodic contributions show that cellulose and plant debris can play a significant role in the atmospheric composition.
The interannual variations in the cellulose concentrations at the same locations within the Grenoble metropole were then assessed. Interestingly, the cellulose concentrations and the contribution (%) of cellulose C to OC showed significant fluctuations across the two periods considered. The correlations of cellulose with other chemical tracers also vary significantly. Reasons behind these dramatic fluctuations are not fully understood, and this highlights our limited knowledge of these atmospheric processes. Reduced human activities due to the COVID-19 pandemic may be a factor. Further interannual studies must be undertaken to see if these variations are a common occurrence or unique to this dataset.
Given the local-scale source of atmospheric plant debris, more monitoring campaigns similar to the one in the Grenoble metropole should be performed. An increase in sampling site numbers, with varying micro-climatic and PM emission source characteristics, within a given area should lead to a more concrete understanding of the spatial variability in plant debris. It would open the door to the inclusion of cellulose into chemical transport models, in order to better represent this component of the organic matter in PM, particularly important in rural areas.
All relevant data for this paper are archived at IGE (Institut des Géosciences de l'Environnement), and availability can be discussed with the corresponding authors.
The supplement related to this article is available online at: https://doi.org/10.5194/acp-22-6021-2022-supplement.
AB performed all cellulose analyses, processed the data, and wrote the manuscript. JLJ was the supervisor for the masters of AB. He directed all the personnel who performed the analysis at IGE and designed the study. VJ designed the protocol for cellulose analyses. JLJ and GU were the coordinators of the atmospheric part of the MobilAir programme in Grenoble. LB was the curator of the atmospheric MobilAir data. SC is the coordinator of the ANDRA-OPE site and atmospheric programme and provided the samples from this site. CH is the head of the NABEL (National Air Pollution Monitoring Network) network in Switzerland, provided all samples from this country, and directed the programme for this yearly sampling. SKG was the curator of the Swiss data. OF is responsible for the CARA (caractérisation chimique des particules) programme from LCSQA (Laboratoire Central de Surveillance de la Qualité de l'Air) in France and provided partial funding for sample analysis at the LF site. CT was responsible for the sampling by Atmo Auvergne-Rhône-Alpes at the three sites in the Grenoble area. All authors reviewed and commented on the manuscript.
The contact author has declared that neither they nor their co-authors have any competing interests.
Publisher's note: Copernicus Publications remains neutral with regard to jurisdictional claims in published maps and institutional affiliations.
The authors acknowledge the work of the many engineers in the lab at IGE for the analyses (Céline Voiron, Rhabira Elazzouzi, Batiste Morisset, Charly Le Bigaignon, Jean Chazelle, Anthony Vella, and Gift Fonkoh) as well as the dedicated efforts of many people at the sampling sites for collecting the samples. Adam Brighty would also like to thank S. Weber for his help and guidance throughout the project. Samples from the three Grenoble sites were collected and analysed within the programme QAMECS (ADEME, Agence de l'environnement et de la maîtrise de l'énergie; no. 1662C0029), coupled with funding from the CARA programme from LCSQA for the Les Frênes site.
The authors would like to thank all three referees for insightful comments that helped improve the paper. Particularly, Hans Puxbaum provided a long, precise, and detailed text with an account of the historical aspects of past research on cellulose measurements in atmospheric PM, which is extremely interesting and complete. His comments are now partially reflected in our paper, but the original texts (RC1 and RC4) should be referred to, in order to give him full credit on this point.
The development of the protocol for cellulose analysis and the processing of all the samples in this study for the cellulose measurements were supported by the French CNRS LEFE CHAT programme (project MECEA 2018–2020).
This paper was edited by Ivan Kourtchev and reviewed by Hans Puxbaum, Mario Cerqueira, and one anonymous referee.
Alfarra, M. R., Prevot, A. S. H., Szidat, S., Sandradewi, J., Weimer, S., Lanz, V. A., Schreiber, D., Mohr, M., and Baltensperger, U.: Identification of the mass spectral signature of organic aerosols from wood burning emissions, Environ. Sci. Technol., 41, 5770–5777, 2007.
Alleman, L. Y., Lamaison, L., Perdrix, E., Robache, A., and Galloo, J.-C.: PM10 metal concentrations and source identification using positive matrix factorization and wind sectoring in a French industrial zone, Atmos. Res., 96, 612–625, https://doi.org/10.1016/j.atmosres.2010.02.008, 2010.
Alves, C. A.: A short review on atmospheric cellulose, Air Qual. Atmos. Health, 10, 669–678, 2017.
Atmo AURA: https://www.atmo-auvergnerhonealpes.fr/, last access: 12 April 2021.
Aymoz, G., Jaffrezo, J. L., Chapuis, D., Cozic, J., and Maenhaut, W.: Seasonal variation of PM10 main constituents in two valleys of the French Alps. I: EC OC fractions, Atmos. Chem. Phys., 7, 661–675, https://doi.org/10.5194/acp-7-661-2007, 2007.
Bauer, H., Claeys, M., Vermeylen, R., Schueller, E., Weinke, G., Berger, A., and Puxbaum, H.: Arabitol and mannitol as tracers for the quantification of airborne fungal spores, Atmos. Environ., 42, 588–593, 2008.
Birch, M. E. and Cary, R. A.: Elemental carbon-based method for monitoring occupational exposures to particulate diesel exhaust, Aerosol Sci. Technol., 25, 221–241, 1996.
Borlaza, L. J. S., Weber, S., Uzu, G., Jacob, V., Cañete, T., Micallef, S., Trébuchon, C., Slama, R., Favez, O., and Jaffrezo, J.-L.: Disparities in particulate matter (PM10) origins and oxidative potential at a city scale (Grenoble, France) – Part 1: Source apportionment at three neighbouring sites, Atmos. Chem. Phys., 21, 5415–5437, https://doi.org/10.5194/acp-21-5415-2021, 2021a.
Borlaza, L. J. S., Weber, S., Jaffrezo, J.-L., Houdier, S., Slama, R., Rieux, C., Albinet, A., Micallef, S., Trébluchon, C., and Uzu, G.: Disparities in particulate matter (PM10) origins and oxidative potential at a city scale (Grenoble, France) – Part 2: Sources of PM10 oxidative potential using multiple linear regression analysis and the predictive applicability of multilayer perceptron neural network analysis, Atmos. Chem. Phys., 21, 9719–9739, https://doi.org/10.5194/acp-21-9719-2021, 2021b.
Borlaza, L. J., Weber, S., Marsal, A., Uzu, G., Jacob, V., Besombes, J.-L., Chatain, M., Conil, S., and Jaffrezo, J.-L.: 9-year trends of PM10 sources and oxidative potential in a rural background site in France, Atmos. Chem. Phys. Discuss. [preprint], https://doi.org/10.5194/acp-2021-839, in review, 2021c.
Boucher, O., Randall, D., Artaxo, P., Bretherton, C., Feingold, G., Forster, P., Kerminen, V.-M., Kondo, Y., Liao, H., and Lohmann, U.: Clouds and aerosols, in: Climate change 2013: the physical science basis. Contribution of Working Group I to the Fifth Assessment Report of the Intergovernmental Panel on Climate Change, Cambridge University Press, 571–657, https://doi.org/10.1017/CBO9781107415324.016, 2013.
Bozzetti, C., Daellenbach, K. R., Heuglin, C., Fermo, P., Sciare, J., Kasper-Giebl, A., Mazar, Y., Abbaszade, G., El Kazzi, M., Gonzalez, R., Shuster-Meiseles, T., Flasch, M., Wolf, R., Kreplová, A., Canonaco, F., Schnelle-Kreis, J., Slowik, J. G., Zimmermann, R., Rudich, Y., Baltensperger, U., El Haddad, I., and Prévôt, A. S. H.: Size-Resolved Identification, Characterisation, and Quantification of Primary Biological Organic Aerosol at a European Rural Site, Environ. Sci. Technol., 50, 3425–3434, 2016.
Caseiro, A. F. F.: Composicão Química do Aerossol Europeu, PhD Thesis, Universidade de Aveiro, Aveiro, https://core.ac.uk/download/pdf/15560924.pdf (last access: 27 October 2020), 2008.
Cavalli, F., Viana, M., Yttri, K. E., Genberg, J., and Putaud, J.-P.: Toward a standardised thermal-optical protocol for measuring atmospheric organic and elemental carbon: the EUSAAR protocol, Atmos. Meas. Tech., 3, 79–89, https://doi.org/10.5194/amt-3-79-2010, 2010.
Charron, A., Polo-Rehn, L., Besombes, J.-L., Golly, B., Buisson, C., Chanut, H., Marchand, N., Guillaud, G., and Jaffrezo, J.-L.: Identification and quantification of particulate tracers of exhaust and non-exhaust vehicle emissions, Atmos. Chem. Phys., 19, 5187–5207, https://doi.org/10.5194/acp-19-5187-2019, 2019.
Denier van der Gon, H., Jozwicka, M., Hendriks, E., Gondwe, M., and Schaap, M.: Mineral Dust as a component of Particulate Matters, BOP Reports, the Netherlands, 2010.
Després, V. R., Alex Huffman, J., Burrows, S. M., Hoose, C., Safatov, A. S., Buryak, G., Fröhlich-Nowoisky, J., Elbert, W., Andreae, M. O., Pöschl, U., and Jaenicke, R.: Primary biological aerosol particles in the atmosphere: a review, Tellus B, 64, 15598, https://doi.org/10.3402/tellusb.v64i0.15598, 2012.
Franke, V., Zieger, P., Wideqvist, U., Acosta Navarro, J. C., Leck, C., Tunved, P., Rosati, B., Gysel, M., Salter, M. E., and Ström, J.: Chemical composition and source analysis of carbonaceous aerosol particles at a mountaintop site in central Sweden, Tellus B, 69, 1353387, https://doi.org/10.1080/16000889.2017.1353387, 2017.
Giannoni, M., Martellini, T., Del Bubba, M., Gambaro, A., Zangrando, R., Chiari, M., Lepri, L., and Cincinelli, A.: The use of levglucosan for tracing biomass burning in PM2.5 samples in Tuscany (Italy), Environ. Pollut., 167, 7–15, 2012.
Golly, B., Waked, A., Weber, S., Samaké, A., Jacob, V., Conil, S., Rangonio, J., Chrétien, E., Vagnot, M. P., Robic, P. Y., Besombes, J. L., and Jaffrezo, J. L.: Organic Markers And OC Source Apportionment For Seasonal Variations Of PM2.5 At 5 Rural Sites In France, Atmos. Environ., 198, 142–157, https://doi.org/10.1016/J.Atmosenv.2018.10.027, 2019.
Gould, M. J.: Alkaline peroxide delignification of agricultural residues to enhance enzymatic saccharification, Biotechnol. Bioengng., 26, 46–52, 1984.
Graham, B., Guyon, P., Taylor, P. E., Artaxo, P., Maenhaut, W., Glovsky, M. M., Flagan, R. C., and Andreae, M. O.: Organic compounds present in the natural Amazonian aerosol: Characterization by gas chromatography-mass spectrometry: Organic compounds in Amazonian aerosols, J. Geophys. Res.-Atmos., 108, 4766, https://doi.org/10.1029/2003JD003990, 2003.
Grange, S. K., Fischer, A., Zellweger, C., Alastuey, A., Querol, X., Jaffrezo, J. L., Uzu, G., and Hueglin, C.: Switzerland's PM10 and PM2.5 environmental increments show the importance of non-exhaust emissions, Atmos. Environ., 12, 100145, https://doi.org/10.1016/j.aeaoa.2021.100145, 2021.
Hansen, A. D., Rosen, H., and Novakov, T.: The Aethalometer: An Instrument for the Real Time Measurement of Optical Absorption by Particles, Sci. Total Environ., 36, 191–196, https://doi.org/10.1016/0048-9697(84)90265-1, 1984.
Jaenicke, R.: Abundance of cellular material and proteins in the atmosphere, Science, 308, 73–73, https://doi.org/10.1126/science.1106335, 2005.
Jaffrezo, J. L., Calas, N., and Bouchet, M.: Carboxylic acids measurements with ionic chromatography, Atmos. Environ., 32, 2705–2708, 1998.
Jia, Y., Bhat, S., and Fraser, M. P.: Characterization of saccharides and other organic compounds in fine particles and the use of saccharides to track primary biologically derived carbon sources, Atmos. Environ., 44, 724–732, 2010.
Karagulian, F., Belis, C. A., Dora, C. F. C., Prüss-Ustün, A. M., Bonjour, S., Adair-Rohani, H., and Amann, M.: Contributions to cities' ambient particulate matter (PM): A systematic review of local source contributions at global level, Atmos. Environ., 120, 475–483, 2015.
Klimont, Z., Kupiainen, K., Heyes, C., Purohit, P., Cofala, J., Rafaj, P., Borken-Kleefeld, J., and Schöpp, W.: Global anthropogenic emissions of particulate matter including black carbon, Atmos. Chem. Phys., 17, 8681–8723, https://doi.org/10.5194/acp-17-8681-2017, 2017.
Kotianovà, P., Bauer, H., Caseiro, A., Marr, I., Cik, G., and Puxbaum, H.: Temporal patterns of n-alkanes at traffic exposed and suburban sites in Vienna, Atmos. Environ., 42, 2993–3005, https://doi.org/10.1016/j.atmosenv.2007.12.048, 2008.
Kunit, M. and Puxbaum, H.: Enzymatic determination of the cellulose content of atmospheric aerosols, Atmos. Environ., 30, 1233–1236, 1996.
Liang, L., Engling, G., Du, Z., Cheng, Y., Duan, F., Liu, X., and He, K.: Seasonal variations and source estimation of saccharides in atmospheric particulate matter in Beijing, China, Chemosphere, 150, 365–377, 2016.
Liu, C., Berg, B., Kutsch, W., Westman, C. J., Ilvesniemi, H., Shen, X., Shen, G., and Chen, X.: Leaf litter nitrogen concentration as related to climatic factors in Eurasian forests, Global Ecol. Biogeogr., 15, 438–444, 2006.
Madsen, D., Azeem, H. A., Sandahl, M., van Hees, P., and Husted, B.: Levoglucosan as a Tracer for Smouldering Fire, Fire Technol., 54, 1871–1885, 2018.
Martin, S. T., Andreae, O. M., Artaxo, P., Baumgardner, D., Chen, Q., Goldenstein, A. H., Guenther, A., Heald, C. L., Mayol-Bracero, O. L., McMurry, P. H., Pauliquevis, T., Pöschl, U., Prather, K. A., Roberts, G. C., Saleska, S. R., Silva Dias, M. A., Spracklen, D. V., Swietlicki, E., and Trebs, I.: Sources and properties of Amazonian aerosol particles, Rev. Geophys, 48, RG2002, https://doi.org/10.1029/2008RG000280, 2010.
Martínez, A., Larrañaga, A., Pérez, J., Descals, E., and Pozo, J: Temperature affects leaf litter decomposition in low-order forest streams: field and microcosm approaches, FEMS Microb. Ecol., 87, 257–267, 2014.
Medeiros, P. M., Conte, M. H., Weber, J. C., and Simoneit, B. R. T.: Sugars as source indicators of biogenic organic carbon in aerosols collected above the Howland Experimental Forest, Maine, Atmos. Environ., 40, 1694–1705, 2006.
Michoud, V., Hallemans, E., Chiappini, L., Leoz-Garziandia, E., Colomb, A., Dusanter, S., Fronval, I., Gheusi, F., Jaffrezo, J.-L., Léonardis, T., Locoge, N., Marchand, N., Sauvage, S., Sciare, J., and Doussin, J.-F.: Molecular characterization of gaseous and particulate oxygenated compounds at a remote site in Cape Corsica in the western Mediterranean Basin, Atmos. Chem. Phys., 21, 8067–8088, https://doi.org/10.5194/acp-21-8067-2021, 2021.
Nozière, B., Kalberer, M., Claeys, M., Allan, J., D'Anna, B., Decesari, S., Finessi, E., Glasius, M., Grgić, I., Hamilton, J. F., Hoffmann, T., Iinuma, Y., Jaoui, M., Kahnt, A., Kampf, C. J., Kourtchev, I., Maenhaut, W., Marsden, N., Saarikoski, S., Schnelle-Kreis, J., Surratt, J. D., Szidat, S., Szmigielski, R., and Wisthaler, A.: The molecular identification of organic compounds in the atmosphere: state of the art and challenges, Chem. Rev., 115, 3919–3983, https://doi.org/10.1021/cr5003485, 2015.
OPE-ANDRA Atmospheric Station: http://ope.andra.fr/index.php?lang=fr, last access: 6 January 2021.
Peccia, J., Hospodsky, D., and Bibby, K.: New Directions : A revolution in DNA sequencing now allows for the meaningful integration of biology with aerosol science, Atmos. Environ., 45, 1896–1897, 2011.
Penner, J. E., Andreae, M., Annegarn, H., Barrie, L., Feichter, J., Hegg, D., Jayaraman, A., Leaitch, R., Murphy, D., Nganga, J., and Pitari, G.: Aerosols, their Direct and Indirect Effects, Climate Change 2001: The Scientific Basis, Cambridge University Press, Cambridge, 2001.
Pöschl, U.: Atmospheric Aerosols: Composition, Transformation, Climate and Health Effects, Angew. Chem. Int. Ed., 44, 7520–7540, 2005.
Pöschl, U., Martin, S. T., Sinha, B., Chen, Q., Gunthe, S. S., Huffman, J. A., Borrmann, S., Farmer, D. K., Garland, R. M., Helas, G., Jimenez, J. L., King, S. M., Manzi, A., Mikhailov, E., Pauliquevis, T., Petters, M. D., Prenni, A. J., Roldin, P., Rose, D., Schneider, J., Su, H., Zorn, S. R., Artaxo, P., and Andreae, M. O.: Rainforest Aerosols as Biogenic Nuclei of Clouds and Precipitation in the Amazon, Science, 329, 1513–1516, 2010.
Putaud, J.-P., Raes, F., Van Dingenen, R., Brüggemann, E., Facchini, M.-C., Decesari, S., Fuzzi, S., Gehrig, R., Hüglin, C., Laj, P., Lorbeer, G., Maenhaut, W., Mihalopoulos, N., Müller, K., Querol, X., Rodriguez, S., Schneider, J., Spindler, G., ten Brink, H., Tørseth, K., and Wiedensohler, A.: A European aerosol phenomenology 2: chemical characteristics of particulate matter at kerbside, urban, rural and background sites in Europe, Atmos. Environ., 38, 2579–2595, 2004.
Putaud, J.-P., Van Dingenen, R., Alastuey, A., Bauer, H., Birmili, W., Cyrys, J., Flentje, H., Fuzzi, S., Gehrig, R., Hansson, H. C., Harrison, R. M., Herrmann, H., Hitzenberger, R., Hüglin, C., Jones, A. M., Kasper-Giebl, A., Kiss, G., Kousa, A., Kuhlbusch, T. A. J., Löschau, G., Maenhaut, W., Molnar, A., Moreno, T., Pekkanen, J., Perrino, C., Pitz, M., Puxbaum, H., Querol, X., Rodriguez, S., Salma, I., Schwarz, J., Smolik, J., Schneider, J., Spindler, G., ten Brink, H., Tursic, J., Viana, M., Wiedensohler, A., and Raes, F.: A European aerosol phenomenology – 3: Physical and chemical characteristics of particulate matter from 60 rural, urban, and kerbside sites across Europe, Atmos. Environ., 44, 1308–1320, https://doi.org/10.1016/j.atmosenv.2009.12.011, 2010.
Puxbaum, H. and Tenze-Kunit, M.: Size distribution and seasonal variation of atmospheric cellulose, Atmos. Environ., 37, 3693–3699, 2003.
Rogge, W. F., Mazurek, M. A., Hildemann, L. M., Cass, G. R., and Simoneit, B. R. T.: Quantification of urban organic aerosols at a molecular level: identification, abundance and seasonal variation, Atmos. Environ., 27, 1309–1330, https://doi.org/10.1016/0960-1686(93)90257-Y, 1993a.
Rogge, W. F., Mazurek, M. A., Hildemann, L. M., Cass, G. R., and Simoneit, B. R. T.: Sources of fine organic aerosol. 4. particulate abrasion products from leaf surfaces of urban plants, Environ. Sci. Technol., 27, 2700–2711, https://doi.org/10.1021/es00049a008, 1993b.
Rosenfeld, D., Lohmann, U., Raga, G. B., O'Dowd, C. D., Kulmala, M., Fuzzi, S., Reissell, A., and Andreae, M. O.: Flood or Drought: How Do Aerosols Affect Precipitation?, Science, 321, 1309–1313, 2008.
Samaké, A., Jaffrezo, J.-L., Favez, O., Weber, S., Jacob, V., Albinet, A., Riffault, V., Perdrix, E., Waked, A., Golly, B., Salameh, D., Chevrier, F., Oliveira, D. M., Bonnaire, N., Besombes, J.-L., Martins, J. M. F., Conil, S., Guillaud, G., Mesbah, B., Rocq, B., Robic, P.-Y., Hulin, A., Le Meur, S., Descheemaecker, M., Chretien, E., Marchand, N., and Uzu, G.: Polyols and glucose particulate species as tracers of primary biogenic organic aerosols at 28 French sites, Atmos. Chem. Phys., 19, 3357–3374, https://doi.org/10.5194/acp-19-3357-2019, 2019a.
Samaké, A., Jaffrezo, J.-L., Favez, O., Weber, S., Jacob, V., Canete, T., Albinet, A., Charron, A., Riffault, V., Perdrix, E., Waked, A., Golly, B., Salameh, D., Chevrier, F., Oliveira, D. M., Besombes, J.-L., Martins, J. M. F., Bonnaire, N., Conil, S., Guillaud, G., Mesbah, B., Rocq, B., Robic, P.-Y., Hulin, A., Le Meur, S., Descheemaecker, M., Chretien, E., Marchand, N., and Uzu, G.: Arabitol, mannitol, and glucose as tracers of primary biogenic organic aerosol: the influence of environmental factors on ambient air concentrations and spatial distribution over France, Atmos. Chem. Phys., 19, 11013–11030, https://doi.org/10.5194/acp-19-11013-2019, 2019b.
Samaké, A., Bonin, A., Jaffrezo, J.-L., Taberlet, P., Weber, S., Uzu, G., Jacob, V., Conil, S., and Martins, J. M. F.: High levels of primary biogenic organic aerosols are driven by only a few plant-associated microbial taxa, Atmos. Chem. Phys., 20, 5609–5628, https://doi.org/10.5194/acp-20-5609-2020, 2020.
Samake, A., Martins, J. M., Bonin, A., Uzu, G., Taberlet, P., Conil, S., Favez, O., Thomasson, A., Chazeau, B., Marchand, N., and Jaffrezo, J. L.: Variability of the atmospheric PM10 microbiome in three climatic regions of France, Front. Microbiol., 11, 576750, https://doi.org/10.3389/fmicb.2020.576750, 2021.
Sánchez-Ochoa, A., Kasper-Giebl, A., Puxbaum, H., Gelencsér, A., Legrand, M., and Pio, C.: Concentration of atmospheric cellulose: A proxy for plant debris across a west-east transect over Europe, J. Geophys. Res., 112, D23S08, https://doi.org/10.1029/2006JD008180, 2007.
Simoneit, B. R. T. and Mazurek, M. A.: Organic matter of the troposphere – II. Natural background of biogenic lipid matter in aerosols over the rural western united states, Atmos. Environ., 16, 2139–2159, https://doi.org/10.1016/0004-6981(82)90284-0, 1982.
Schmidl, C.: PM10 – Quellenprofile von Holzrauchemissionen aus Kleinfeuerungen, Diplomarbeit, Inst. für Chem. Technol. und Analytik, PhD thesis, Tech. Univ. Wien, Vienna, 2005.
Verma, S. K., Kawamura, K., Chen, J., and Fu, P.: Thirteen years of observations on primary sugars and sugar alcohols over remote Chichijima Island in the western North Pacific, Atmos. Chem. Phys., 18, 81–101, https://doi.org/10.5194/acp-18-81-2018, 2018.
Wagenbrenner, N. S., Chung, S. H., and Lamb, B. K.: A large source of dust missing in Particulate Matter emission inventories? Wind erosion of post-fire landscapes, Elem. Sci. Anth., 5, 2, https://doi.org/10.1525/elementa.185, 2017.
Waked, A., Favez, O., Alleman, L. Y., Piot, C., Petit, J.-E., Delaunay, T., Verlinden, E., Golly, B., Besombes, J.-L., Jaffrezo, J.-L., and Leoz-Garziandia, E.: Source apportionment of PM10 in a north-western Europe regional urban background site (Lens, France) using positive matrix factorization and including primary biogenic emissions, Atmos. Chem. Phys., 14, 3325–3346, https://doi.org/10.5194/acp-14-3325-2014, 2014.
Weber, S., Salameh, D., Albinet, A., Alleman, L. Y., Waked, A., Besombes, J.-L., Jacob, V., Guillaud, G., Meshbah, B., Rocq, B., Hulin, A., Dominik-Sègue, M., Chrétien, E., Jaffrezo, J.-L., and Favez, O.: Comparison of PM10 Sources Profiles at 15 French Sites Using a Harmonized Constrained Positive Matrix Factorization Approach, Atmosphere, 10, 310, https://doi.org/10.3390/atmos10060310, 2019.
Winiwarter, W., Bauer, H., Caseiro, A., and Puxbaum, H.: Quantifying emissions of primary biological aerosol particle mass in Europe, Atmos. Environ., 43, 1403–1409, 2009.
Wu, C. and Yu, J. Z.: Determination of primary combustion source organic carbon-to-elemental carbon (OC EC) ratio using ambient OC and EC measurements: secondary OC-EC correlation minimization method, Atmos. Chem. Phys., 16, 5453–5465, https://doi.org/10.5194/acp-16-5453-2016, 2016.
Yttri, K. E., Aas, W., Bjerke, A., Cape, J. N., Cavalli, F., Ceburnis, D., Dye, C., Emblico, L., Facchini, M. C., Forster, C., Hanssen, J. E., Hansson, H. C., Jennings, S. G., Maenhaut, W., Putaud, J. P., and Tørseth, K.: Elemental and organic carbon in PM10: a one year measurement campaign within the European Monitoring and Evaluation Programme EMEP, Atmos. Chem. Phys., 7, 5711–5725, https://doi.org/10.5194/acp-7-5711-2007, 2007.
Yttri, K. E., Simpson, D., Stenström, K., Puxbaum, H., and Svendby, T.: Source apportionment of the carbonaceous aerosol in Norway – quantitative estimates based on 14C, thermal-optical and organic tracer analysis, Atmos. Chem. Phys., 11, 9375–9394, https://doi.org/10.5194/acp-11-9375-2011, 2011a.
Yttri, K. E., Simpson, D., Nøjgaard, J. K., Kristensen, K., Genberg, J., Stenström, K., Swietlicki, E., Hillamo, R., Aurela, M., Bauer, H., Offenberg, J. H., Jaoui, M., Dye, C., Eckhardt, S., Burkhart, J. F., Stohl, A., and Glasius, M.: Source apportionment of the summer time carbonaceous aerosol at Nordic rural background sites, Atmos. Chem. Phys., 11, 13339–13357, https://doi.org/10.5194/acp-11-13339-2011, 2011b.
Zhang, T., Engling, G., Chan, C. Y., Zhang, Y. N., Zhang, Z. S., Lin, M., Sang, X. F., Li, Y. D., and Li, Y. S.: Contribution of fungal spores to particulate matter in a tropical rainforest, Environ. Res. Lett., 5, 24010, https://doi.org/10.1088/1748-9326/5/2/024010, 2010.
Zhu, C., Kawamura, K., and Kunwar, B.: Organic tracers of primary biological aerosol particles at subtropical Okinawa Island in the western North Pacific Rim: Organic biomarkers in the north pacific, J. Geophys. Res.-Atmos., 120, 5504–5523, 2015.