the Creative Commons Attribution 4.0 License.
the Creative Commons Attribution 4.0 License.
 | 17 Jan 2022
Duff burning from wildfires in a moist region: different impacts on PM2.5 and ozone
Aoxing Zhang
Yongqiang Liu
Scott Goodrick
Marcus D. Williams
Wildfires can significantly impact air quality and human health. However, little is known about how different fuel bed components contribute to these impacts. This study investigates the air quality impacts of duff and peat consumption during wildfires in the southeastern United States, with a focus on the differing contributions of fine particulate matter less than 2.5 µm in size (PM2.5) and ozone (O3) to air quality episodes associated with the four largest wildfire events in the region during this century. The emissions of duff burning were estimated based on a field measurement of a 2016 southern Appalachian fire. The emissions from the burning of other fuels were obtained from the Fire INventory from NCAR (FINN). The air quality impacts were simulated using a three-dimensional regional air quality model. The results show the duff burning emitted PM2.5 comparable to the burning of the above-ground fuels. The simulated surface PM2.5 concentrations due to duff burning increased by 61.3 % locally over a region approximately 300 km within the fire site and by 21.3 % and 29.7 % in remote metro Atlanta and Charlotte during the 2016 southern Appalachian fires and by 131.9 % locally and by 17.7 % and 24.8 % in remote metro Orlando and Miami during the 2007 Okefenokee Fire. However, the simulated ozone impacts from the duff burning were negligible due to the small duff emission factors of ozone precursors such as NOx. This study suggests the need to improve the modeling of PM2.5 and the air quality, human health, and climate impacts of wildfires in moist ecosystems by including duff burning in global fire emission inventories.
- Article
(3343 KB) - Full-text XML
-
Supplement
(7582 KB) - BibTeX
- EndNote


Wildfires, caused by natural factors or human activities, have a fundamental impact on air quality, human health, and climate. Wildfires contribute up to 40 % of organic carbon (OC) emissions in Europe, 42 % in Asia, and 64 % globally and dominate the regional particulate matter (PM) concentrations over the major fire regions in Africa and South America (Granier et al., 2011; Diehl et al., 2012). Fires contribute 26.9 % of total volatile organic compound (VOC) emissions and 27.5 % of PM emissions in the US according to the 2014 US Environmental Protection Agency (EPA) National Emissions Inventory (NEI) (USEPA, 2017). Wildfires are large sources of atmospheric aerosols (Crutzen and Andreae, 1990; Bond et al., 2005; Bowman et al., 2009; Brey and Fischer, 2016), contributing 30 % of the aerosol optical thickness (AOT) in Europe (Hodzic et al., 2007), more than 80 % in the Amazon area during the fire season (Reddington et al., 2019), and 10 % globally (Tosca et al., 2013). In the contiguous US during 2008–2012, fires contribute 11 % of the total PM2.5 concentrations (Wilkins et al., 2018).
Wildfires emit tracer gases including ozone precursors and therefore contribute to tropospheric ozone, a critical air pollution compound that adversely impacts human health (McKee, 1993). Ozone production has been detected in fire plumes (Goode et al., 2000; Jaffe et al., 2008). Wildfires account for 3.5 % of global tropospheric ozone production, though ozone production rates of individual fires vary with location, time, fuel type, combustion efficiency, meteorology, and local pre-existing atmospheric composition (Alvarado et al., 2010; Jaffe and Wigder, 2012). In the United States, when fires are present, 14 % of simulated maximum daily 8 h average ozone concentrations surpassed 70 ppb (Wilkins et al., 2018), which is the standard from the EPA.
High-severity fire events have frequently impacted metropolitan regions. For example, the smoke from the 2013 Rim Fire and wildfires during 2017 and 2018 in California, US, was transported long range and affected large urban areas (Liu et al., 2016; Navarro et al., 2016; Mass and Ovens, 2019; Brown et al., 2020). The smoke from the 2009 Attica forest fires decreased the surface solar irradiance levels by 70 % in Athens, Greece (Amiridis et al., 2012). The 2017 Italian Alps fire had a significant impact on the Turin metro, Italy (Bo et al., 2020). Similar fire events impacted urban air quality in other regions around the world (Shaposhnikov et al., 2014; Mallia et al., 2015; He et al., 2016; Cuchiara et al., 2017). In many regions around the world, including the US, wildfires have had an increasing trend during recent decades in both the number and area of total large fires (Dennison et al., 2014; Barbero et al., 2015). In addition, weather with high fire potential has appeared more frequently (Yang et al., 2011; Jolly et al., 2015; Abatzoglou and Williams, 2016), leading to increasing concern about its adverse impact on air quality (Singh et al., 2012; Goodrick et al., 2013; Liu et al., 2014; Zhang and Wang, 2016).
Negative impacts of wildfires on human health are devastating when smoke plumes are transported to populated metropolitan areas (Kunzli et al., 2006). Epidemiological studies have revealed fire emissions' contribution to PM2.5 oxidative potential, which is related to respiratory and cardiovascular diseases (Verma et al., 2014; Yang et al., 2016; Fang et al., 2016). During the fire events in the northwestern US during August–September, a regional mortality of 183 due to PM2.5 exposure was estimated, in which 95 % was contributed by fire emissions (Zou et al., 2019). Based on the US respiratory hospital admissions and additional premature deaths during and after fire events from 2008 to 2012, the economic loss is USD 11–20 billion due to short-term exposures and USD 76–130 billion due to long-term exposures (Fann et al., 2018).
Several datasets and three-dimensional atmospheric models have been used to understand the amount, transport, and physical and chemical processes of fire emissions (Liu et al., 2020; Pan et al., 2020). Some widely used global fire emission inventories include the Global Fire Emission Dataset (GFED) (Randerson et al., 2012; Giglio et al., 2013; van Der Werf et al., 2017), Fire INventory from NCAR (FINN) (Wiedinmyer et al., 2006, 2011), Global Fire Assimilation System (GFAS) (Kaiser et al., 2009, 2012), Fire Energetics and Emissions Research (FEER) (Ellison et al., 2014), and Quick Fire Emissions Dataset (QFED) (Darmenov and da Silva, 2013). Global atmospheric models such as the Community Earth System Model (CESM) were used to study wildfire smoke transport and interactions with land and atmosphere (Jiang et al., 2020; Zhang et al., 2020; Zou et al., 2020), and the GEOS-Chem model was used to evaluate the wildfire contribution to atmospheric chemistry (Lu et al., 2016). Regional air quality models, such as the Weather Research and Forecasting model with Chemistry (WRF-Chem) and the Community Multiscale Air Quality (CMAQ) model, have higher spatial resolutions and thus have advantages when simulating fire smoke aging and regional plume transport (Jaffe et al., 2008; Lu and Sokolik, 2017; San Jose et al., 2017; Wilkins et al., 2018; Guan et al., 2020).
Emissions from duff burns are an important contributor to the global carbon cycle. Duff typically represents the detritus or dead plant organic materials fallen at the top layer of soil. Besides duff, peat is another burnable organic soil that typically represents the fermentation below the duff layer (Frandsen, 1987). “Organic soil” is often used to represent soil formed by plant and animal decomposition, including peat and duff. Duff, peat, and organic soil were sometimes used interchangeably, and we focus on duff in this study. Temperate and boreal duff layers are well distributed in forests and swamps in North America, Europe, and Asia (Wieder et al., 2006). Compared to the burning of above-ground fuel, duff burning can have a similar or larger amount of carbon emission, enlarging the regional and global effect from wildfires (Ballhorn et al., 2009; Reddy et al., 2015). Ground-based studies have been conducted to estimate the carbon loss from temperate duff flaming or smoldering. Davies et al. (2013) surveyed the peatland smoldering in the Scottish Highlands, UK, and estimated a 17.5 ± 2.0 cm burned depth of below-ground fuel and 9.6 ± 1.5 kg m−2 carbon loss due to smoldering. In North Carolina, US, the 1985 Pocosin Lakes fire resulted in a carbon flux of 0.2–11 kg m−2 that varies with burned depth, vegetation type, and burning severity (Poulter et al., 2006). Assuming 50 % of the duff mass is carbon (Watts, 2013), this fuel loading results in a carbon loss of approximately 1.6 kg m−2. Watts (2013) estimated 4.18 kg m−2 carbon release from the wetland combustion in the Big Cypress National Preserve in southern Florida, US. Duff and peat are major reservoirs of wetland carbon and contribute 3 % of global land cover (Gorham, 1991; Yu et al., 2010). The burning properties and emission factors of the below-ground organic soils, including duff and peat, are similar (Raaflaub and Valeo, 2009; Urbanski, 2014). The air quality impacts from peatland burning have also been evaluated in tropical peatlands in Indonesia (Page et al., 2002; Kiely et al., 2020).
However, the air quality impacts of emissions from duff fires are still not well understood over some regions (Page et al., 2002; Hu et al., 2018). One of the reasons is the lack of the fire emission data (Ward et al., 2012), which is a large uncertainty source for simulations of the fire impacts on air quality. Satellite remote sensing is a very useful tool to obtain fire emissions with detailed global and regional coverage. The organic soil burning over tropical peatlands has been considered in GFED (Randerson et al., 2012; Giglio et al., 2013; van Der Werf et al., 2017). Indonesian peat fire emissions are also updated and evaluated in FINN (Kiely et al., 2019). However, compared to above-ground fuel burning, duff emissions are not documented enough by satellite-based global fire emission datasets in forest ecosystems, partially due to the presence of overhead canopies. Another reason is that duff burning usually occurs during the smoldering phase because of the relatively high soil moisture (Ottmar, 2014). Smoldering often lasts a long time. Also, the emissions do not rise to high elevations due to low heat release. Thus, the emissions, especially particles, have little impact on regional air quality in populated areas far from the source region.
Similarly to many world regions (e.g., tropical forests in Southeast Asia, Page et al., 2002, and temperate forests in the United Kingdom and Ireland, Davies et al., 2013), the southeastern US is a duff-rich region because of the high humidity and large forest coverage (Zhu and Evans, 1994; Gaffen and Ross, 1999). The warm and moist climate makes vegetation growth and falling leaves and branches decompose quickly and therefore accumulate as deep duff, especially in the southern Appalachians (Ottmar and Andreu, 2007) and the Okefenokee Swamp (Watts and Kobziar, 2012), which are located in the northern and southern portions of this region, respectively. This region has some unique features among all US regions in the contributions to the carbon cycling and regional air pollution. On the one hand, most fires in the southeastern US are prescribed (planned) and conducted in weather where duff consumption is minimized (Waldrop and Goodrick, 2012). Thus, duff burn may be only a small contributor to total pollutant emissions in this region. On the other hand, there are large wildfires that occur under drought conditions and are close to populated areas, although the frequency and severity are usually small relative to those in the western US (Goodrick et al., 2013). Wildfires in the southeastern US usually occur in spring before the summertime rain season starts. Sometimes wildfires can occur in other seasons under drought conditions, such as the southern Appalachian fire in fall 2016. As described above, duff burning usually occurs during the smoldering phase; however, this situation is changing, with more frequent occurrences of droughts, which increases the flammability of the duff layer (Hille and Stephens, 2005). Duff burn during the flaming phase of the 2016 Rough Ridge Fire in the southern Appalachians, which occurred during a prolonged severe drought (Park Williams et al., 2017), was reported by fire managers, and the related fuel consumption was measured (Zhao et al., 2019). The measured duff layer burned by the fire was 4.6 cm deep with 31.5 Mg ha−1 (3.15 kg m−2) fuel loading, estimated to account for approximately 60 % of total PM2.5 emitted from the fire. The simulations including duff emissions conducted by Zhao et al. (2019) indicated that the duff burn was a major contributor to the air pollution in nearby metro Atlanta. In contrast, a model simulation study on all major 2016 southern Appalachian fires that excluded duff burning resulted in an underestimation of PM2.5 during the fire events (Guan et al., 2020).
The Okefenokee Swamp experienced fires during the dry years of 2007, 2011, and 2017, each with a much larger burned area than the total burned area from the 2016 southern Appalachian fires. The burning of the duff layer was reported during all three fire events in the Okefenokee region (the 2007 Big Turnaround Fire: https://www.fws.gov/fire/downloads/fire_updates/BigTurnaround.FINAL.pdf (last access: 5 November 2021); the 2011 Honey Prairie Fire: https://www.wunderground.com/blog/weatherhistorian/the-great-okefenokee-swamp-fire-of-2011.html (last access: 5 November 2021); the 2017 West Mims Fire: https://gatrees.org/wp-content/uploads/2020/02/Wildfire-Damage-Assessment-for-the-West-Mims-Fire.pdf (last access: 5 November 2021). However, it is not clear how much the duff burning from these fire events contributed to air pollution in the populated areas.
The literature is still not conclusive on the differing impacts of duff burning on various air pollutants. The emission factors of duff are different from those of above-ground fuels (Yokelson et al., 2013; Urbanski, 2014; Hu et al., 2018; Kiely et al., 2019). For example, the temperate forest duff emission factor of nitrogen oxides (NOx) is 0.67 g kg−1 (Yokelson et al., 2013), more than 50 % smaller than the conifer forest emission factors. However, the temperate forest duff emission factor of PM2.5 is 50 ± 16 g kg−1 (Geron and Hays, 2013), which is more than twice that of the PM2.5 emission factors from conifer forests (13–23 g kg−1) (Yokelson et al., 2013; Urbanski, 2014). Because NOx is a major precursor of ozone formation, these different emission factors potentially lead to a stronger PM2.5 impact than ozone impact for duff burning.
The goal of this study is to investigate the contributions of duff burning from the largest wildfires this century in the southeastern US to regional air pollution and the differences between PM2.5 and ozone. The simulations of regional smoke transport were conducted based on the duff measurements from the Rough Ridge Fire (Zhao et al., 2019) and the global fire emission dataset from FINNv1.5. The simulated concentrations of air pollutants were compared to those from observations, between burns with and without duff and between PM2.5 and ozone. The results are expected to provide important implications for needs to improve global fire emission inventories and understanding the contributions of duff and peat burnings in other world regions to regional air pollution.
2.1 Study region
The study region is the southeastern US, which comprises the states of Florida, Alabama, Georgia, South Carolina, North Carolina, Tennessee, Mississippi, and Louisiana. This region is dominated by a humid subtropical climate (Belda et al., 2014). The summers are typically long with high temperature and humidity, contributed by the water vapor transport from the Bermuda High (Li et al., 2011). The winters are typically dry in peninsular Florida but relatively wet in the middle south, such as Tennessee and northern Georgia and Alabama (Gaffen and Ross, 1999). The ecozones in the southeastern US include broadleaf forest over the Appalachian region in the west of North Carolina and South Carolina and the north of Georgia and mixed forest in the other regions, including most of Georgia and Florida (Bachelet et al., 2001; Blood et al., 2016). Hardwood and pine are major above-ground fuels in the southeastern US (Ottmar and Andreu, 2007). Because of the sufficient light and the regularly high humidity, the duff layer is accumulated in the southeastern US and contributes as the potential below-ground fuel, especially in wildlife refuges or regions where deciduous trees are widely distributed with a lack of prescribed burn removal.
The wildfire cases investigated in this study occurred in three areas. The first is the southern Appalachian mountains in the northern part of the southeastern US. This area is located on the boundaries of Georgia, North Carolina, South Carolina, Tennessee, Virginia, West Virginia, and Kentucky. The southern Appalachian region is deciduous forest dominated, with small proportions of evergreen forests and mixed forests. The main forest type is hardwood oak forest (Southern Appalachian Man and the Biosphere, 1996). The second area is the Okefenokee Swamp located across the Georgia–Florida border. The 1773 km2 swamp is mainly covered by the Okefenokee National Wildlife Refuge. Cypress forests and scrub-shrub vegetation are the major vegetation types over the Okefenokee region, and the wetland is covered by a duff layer with a depth of up to 4.6 m (https://www.fws.gov/refuge/okefenokee/, last access: 17 November 2020). The Okefenokee region is sensitive to rainfall. Under drought conditions, the region is vulnerable to wildfire. The third area is coastal eastern North Carolina. The ground forest fuels are rich in organic decomposition due to the moist and warm climate. There are many populated metros nearby in the west, including the Raleigh–Durham–Chapel Hill triangle. Smoke from fires in this area can be transported to affect these metros rapidly under easterly winds.
2.2 Fire cases
In this study, we investigated six wildfire cases (Table 1), and the map of the fire cases over the study regions is shown in Figs. 1 in the paper and S2 in the Supplement. The first case included 10 large fires from mid October to December 2016 in the southern Appalachian mountains during an extreme drought (Konrad and Knox, 2017; Park Williams et al., 2017). The fires burned 369.04 km2 of forest and caused losses of 14 lives and massive property loss (McDowell et al., 2017; Pouliot et al., 2017). The largest fires were the Rough Ridge Fire (34.88∘ N, 84.63∘ W, ignited on 16 October, 111.73 km2 burned), the Rock Mountain Fire (34.98∘ N, 83.52∘ W, ignited on 9 November, 102.08 km2 burned), and the Tellico Fire (35.28∘ N, 83.58∘ W, ignited on 3 November, 57.35 km2 burned). We denote this case as App16.
Table 1The simulation period and fire emission inventories applied in different WRF-Chem simulations and experiments.
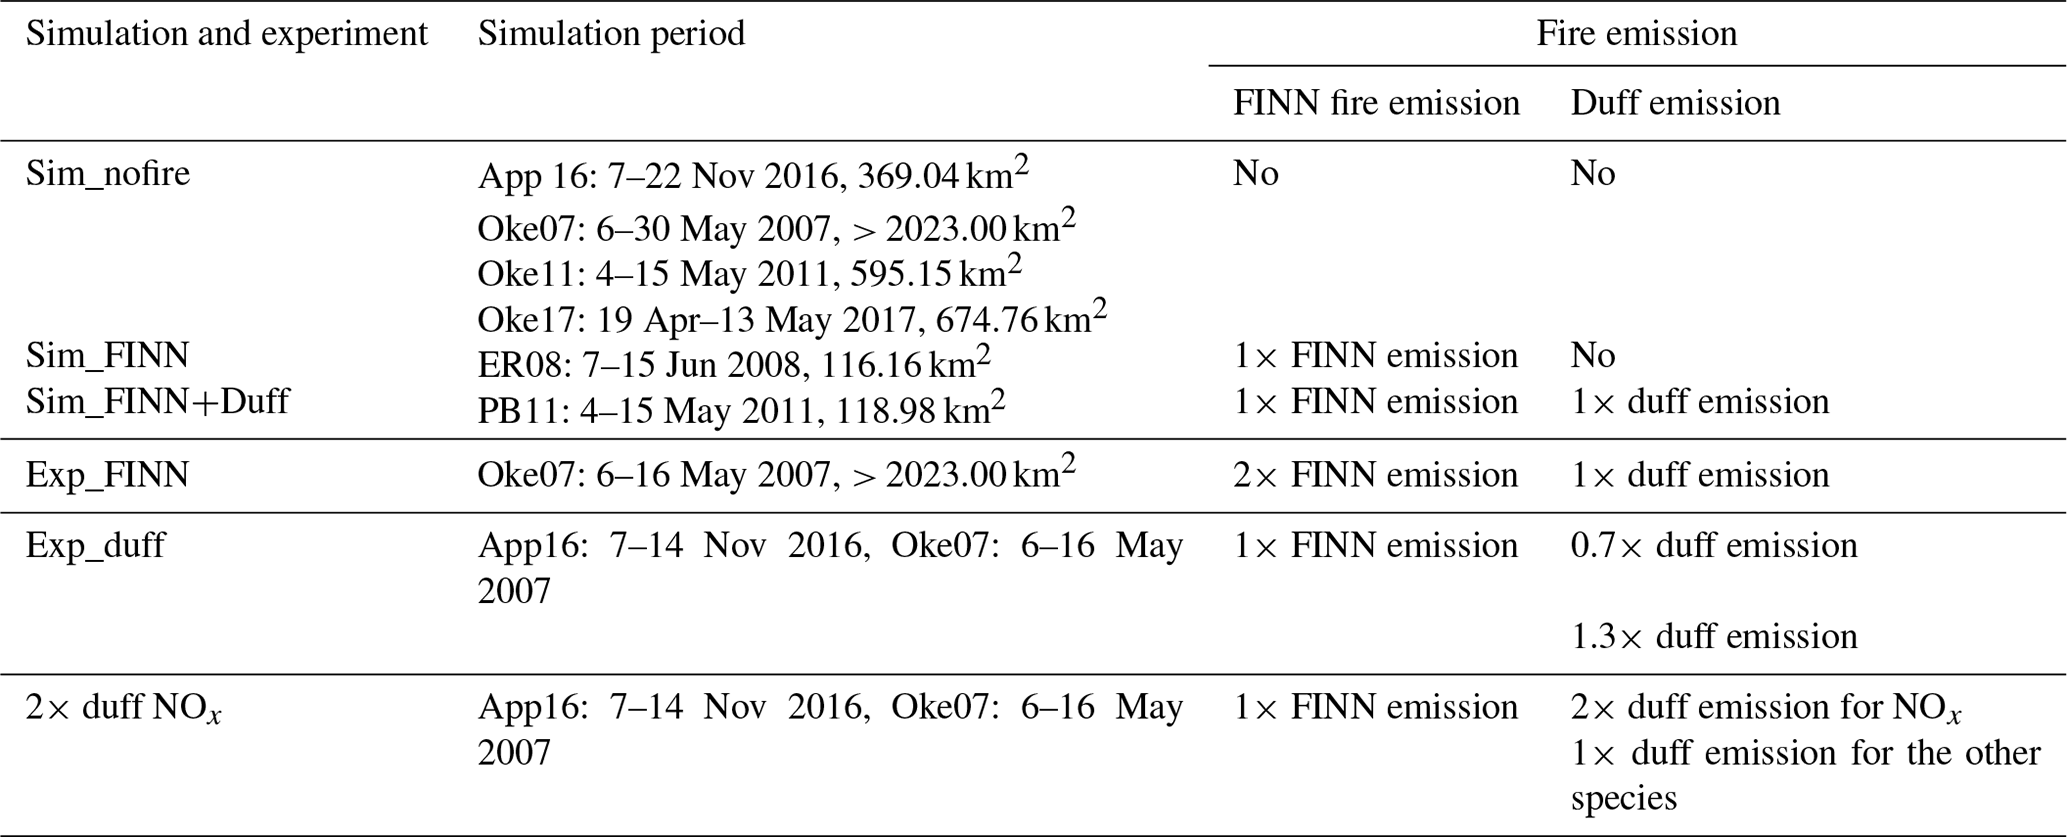
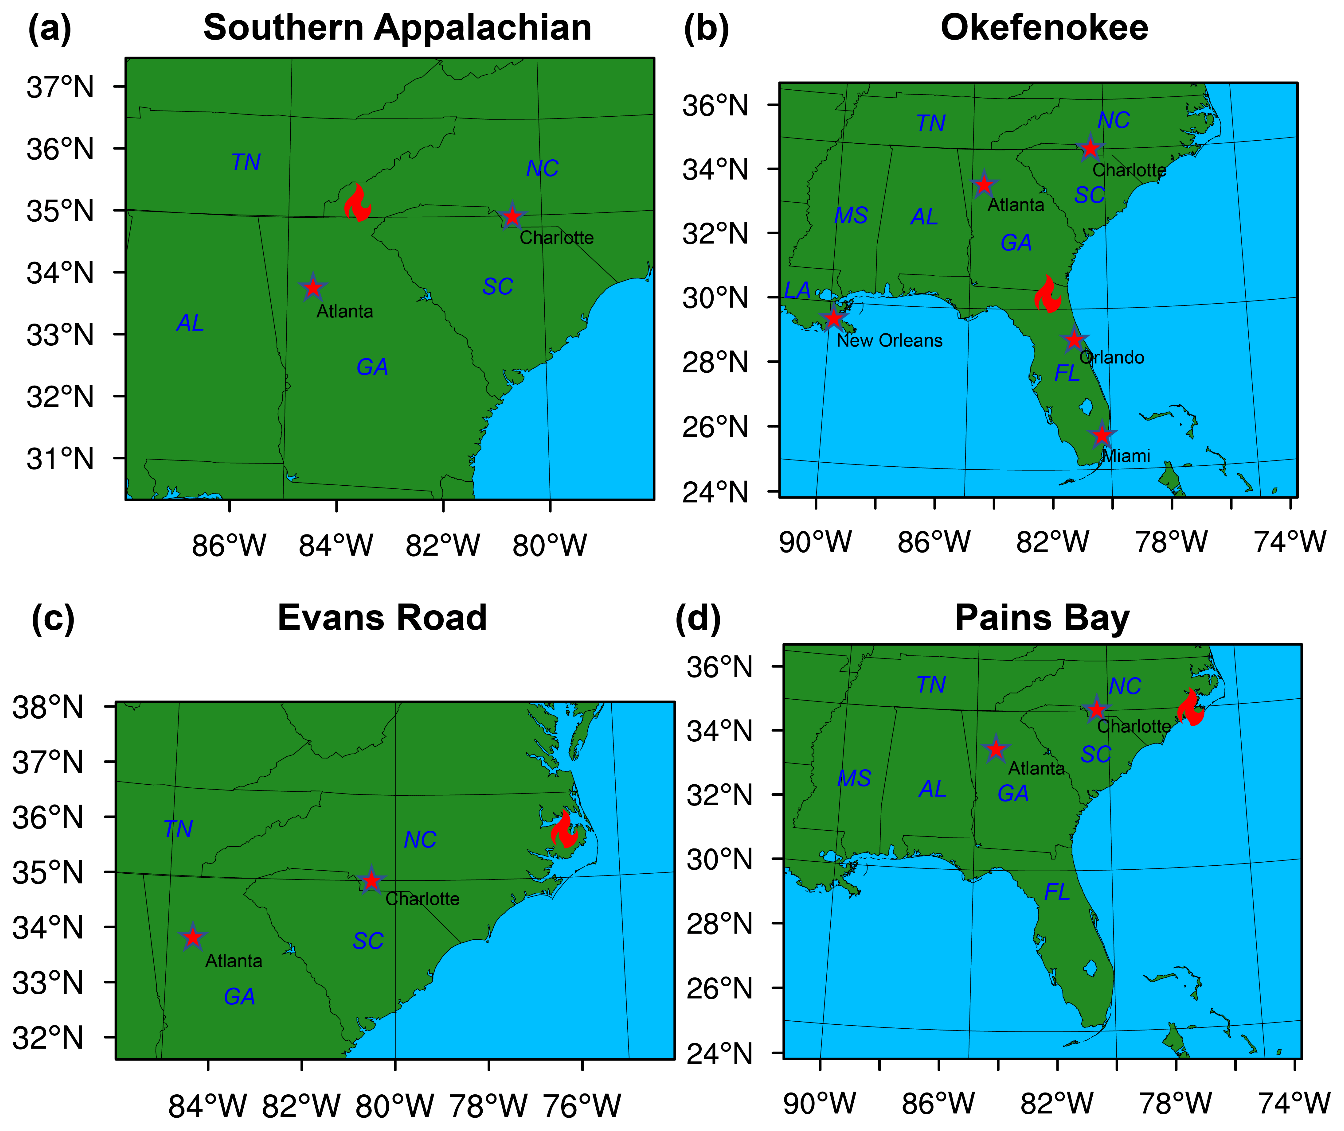
Figure 1The WRF-Chem domain used in (a) App16, (b) the Okefenokee cases, (c) ER08, and (d) PB11. The fire sites and nearby major cities are marked. The abbreviations of the US state names are Florida (FL), Alabama (AL), Georgia (GA), South Carolina (SC), North Carolina (NC), Tennessee (TN), Mississippi (MS), and Louisiana (LA).
The next three cases occurred in Okefenokee in 2007, 2011, and 2017, respectively. We denote them as Oke07, Oke11, and Oke17. The 2007 Okefenokee mega wildfire was ignited in the Okefenokee Wildlife Refuge (30.67∘ N, 82.45∘ W) on 16 April and had burned more than 2023 km2 by late June (Fire Behavior Assessment Team, 2007). Protracted drought led to low water levels in the Okefenokee Swamp and provided the condition of burning in a mix of shrub scrub, wetland prairies, duff, cypress, and long-leaf pine forests. This fire remains the largest wildfire in the history of Georgia and Florida (https://www.fws.gov/fire/downloads/fire_updates/BigTurnaround.FINAL.pdf, last access: 29 October 2020).
The 2011 Honey Prairie Fire was ignited on 30 April under a severe drought, during which the Okefenokee Swamp water level was lower than that during the 2007 mega-fire (https://www.fws.gov/refuges/news/HoneyPrairieFire_05112011.html, last access: 3 December 2020); 595.15 km2 were burned (Finco et al., 2012). The 2017 West Mims Fire was ignited on 6 April under an extreme drought and developed quickly in early May (http://www.gatrees.net/forest-management/forest-health/alerts-and-updates/Wildfire%20Damage%20Assessment%20for%20the%20West%20Mims%20Fire.pdf, last access: 3 December 2020); 674.76 km2 were burned. Historical fire records from the 19th century revealed the strong connection between drought and Okefenokee fires, leading to an “Okefenokee drought-fire cycle” (https://www.frames.gov/catalog/34075, last access: 5 November 2021). Although the Okefenokee fires from 2007 to 2017 were more frequent than the historical mean, more information on the fire cycle change is needed.
The other two fire cases occurred in the coastal southeastern US. The 2008 Evans Road Fire was ignited to the south of the Pocosin Lakes National Wildlife Refuge, North Carolina, on 1 June 2008 by lightning; 166.16 km2 were burned (https://files.nc.gov/ncdeq/Air%20Quality/monitor/specialstudies/exceptionalevents/2008/Exceptional%20Event%20Evans%20Road%20Fire.pdf, last access: 27 October 2021). The 2011 Pains Bay Fire was ignited in the FWS Alligator River National Wildlife Refuge in coastal North Carolina; 118.98 km2 were burned (https://www.geobabble.org/~hnw/first/EWSNews/EWS_Fire_PainsBay_2011-0601.pdf, last access: 27 October 2021). Significant organic/ground fuels were burned during the two coastal fires, causing subsequent air quality impacts and health impacts (Rappold et al., 2011; Tinling et al., 2016). We denote these two fire cases as ER08 and PB11, respectively.
2.3 Model simulations
2.3.1 Model
The model components and implementation procedure used for simulations are illustrated in Fig. 2. We used WRF-Chem version 3.9.1 (Grell et al., 2005; Fast et al., 2006; Powers et al., 2017) to simulate the aerosol, gas transport, and atmospheric chemistry over the southeastern US. The model has coupled gas-phase atmospheric chemistry (Wang et al., 2015; Zhang et al., 2016), aerosol optical properties (Barnard et al., 2010), and the new Thompson graupel microphysics scheme (Thompson et al., 2008). The radiation scheme is the Rapid Radiative Transfer Model for Global Climate Models (GCMs) (RRTMG) (Iacono et al., 2008; Mlawer et al., 1997). The kinetic preprocessor (KPP) library was used for chemical reactions (Damian et al., 2002; Sandu et al., 2003; Sandu and Sander, 2006). The 1∘ × 1∘ meteorological data from National Centers for Environmental Prediction (NCEP) FNL (final) Operational Model Global Tropospheric Analyses (FNL NCEP, 2000) were used as the meteorological initial and boundary conditions for the simulations.
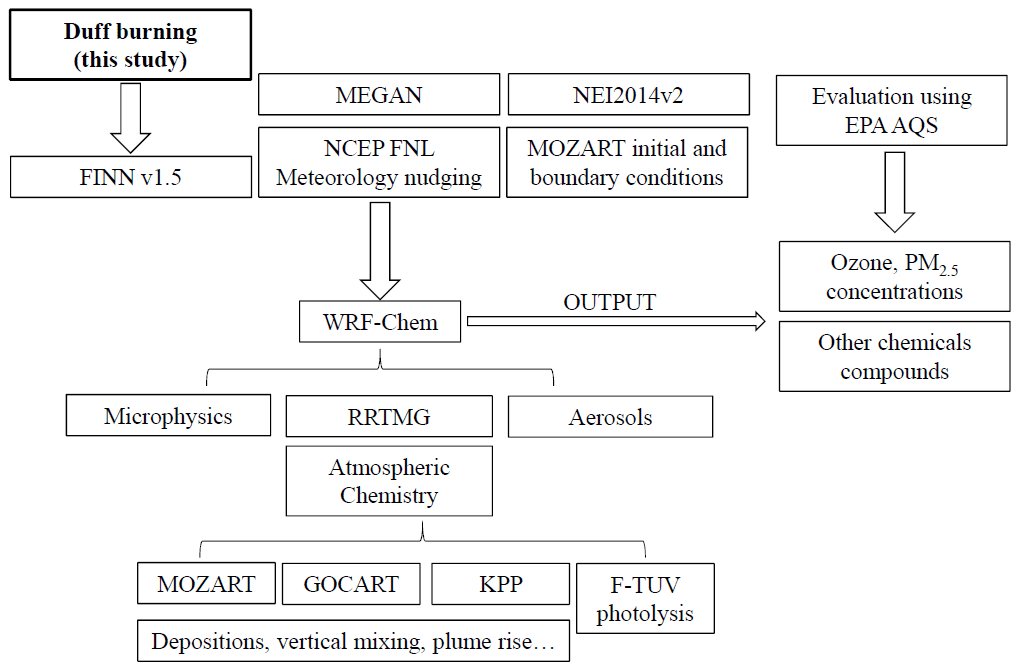
The Model for Ozone and Related chemical Tracers (MOZART) (Emmons et al., 2010) was used as the WRF chemistry module, coupled with the Georgia Tech/Goddard Global Ozone Chemistry Aerosol Radiation and Transport (GOCART) aerosol scheme (Chin et al., 2002). The Madronich F-TUV photolysis scheme was applied, with a time step of 15 min (Madronich, 1987). The time step was 3 min for chemistry. Gas and aerosol dry deposition, aerosol wet scavenging, vertical mixing, subgrid convective transport, and subgrid aqueous chemistry (Peckham et al., 2018) were included in the model simulations. The global simulation result from MOZART (Pfister et al., 2011b) was used as the chemical initial and boundary conditions of the simulation in this study. The ozone initial and boundary conditions from MOZART were also scaled by comparing the mean surface ozone concentration over the simulation domain with US EPA Air Quality System (AQS) observations (https://www.epa.gov/outdoor-air-quality-data, last access: 22 October 2020).
2.3.2 Simulation domains
The simulation domain for App16 was from 30.4 to 37.5∘ N and from 88.3 to 77.7∘ W, with a spatial resolution of 12 km. This domain included the major burning sites and the downwind nearby large cities, including Atlanta (33.75∘ N, 84.39∘ W) and Charlotte (35.23∘ N, 80.84∘ W). The simulation period was 7–22 November 2016. The daily trend of FINN OC emissions over the fire region is shown in Fig. S1, indicating that the simulation period cases contained the most severe burning that occurred during the fire case.
The simulation domain for the three Okefenokee cases was from 23.9 to 37.0∘ N and from 92.6 to 72.4∘ W, with a spatial resolution of 12 km (Fig. 1). The Okefenokee Wildlife Refuge was located at the center of this domain. Nearby cities and the ocean were included to evaluate the smoke transport to urban and remote areas. The simulation periods were 6–30 May 2007, 4–15 May 2011, and 19 April–13 May 2017, respectively. The simulation domain for the PB11 cases is the same as the Oke11 case, and the simulation domain for the ER08 case was from 31.7 to 38.1∘ N and from 84.9 to 74.1∘ W.
2.3.3 Simulations and evaluations
For each fire case, we conducted three simulations to evaluate the air quality impacts from fires and duff burning (Table 1). (1) sim_nofire: no fire emissions. (2) sim_FINN: the FINNv1.5 fire emission dataset was used as the fire emission input, but duff burning was not included in this dataset. (3) sim_FINN+duff: same as sim_FINN but with duff burning emissions. We used the differences in the results between sim_FINN and sim_nofire to represent the impacts from fire and the differences between sim_FINN+duff and sim_FINN to represent the impacts from duff burning.
We evaluated the model performances in simulating air pollutant concentrations by comparing them with the EPA AQS in situ hourly observations for PM2.5 and ozone (https://www.epa.gov/outdoor-air-quality-data, last access: 22 October 2020). Starting in 2008, the EPA included the Federal Reference Methods (FRMs) or Federal Equivalent Methods (FEMs) for the particulate measurement as a systematic framework, which provides standard methodologies and procedures for measuring and analyzing PM (Noble et al., 2001). During Oke07, the FRM/FEM was not spread out in the PM2.5 measurement system from the EPA AQS. For the consistency of all the fire cases, both FRM/FEM and non-FRM/FRM datasets were used for comparison. Fifty-six PM2.5 observation sites and 53 ozone observation sites are included in the evaluation for App16, 76 PM2.5 observation sites and 225 ozone observation sites for Oke07, 112 PM2.5 observation sites and 215 ozone observation sites for Oke11 and PB11, 120 PM2.5 observation sites and 208 ozone observation sites for Oke17, and 38 PM2.5 observation sites and 101 ozone observation sites for ER08.
The daytime surface ozone concentrations, calculated by averaging surface ozone concentrations from local time 10:00 to 18:00, were evaluated between the baseline simulations (sim_FINN) and the observations. In the model evaluation and the following result analysis, the surface concentrations in the simulation are defined as the concentrations at the bottom layer in the model, which was also the layer where the surface emission input was added in.
2.4 Emission data
2.4.1 Fire emissions of above-ground fuels
The fire emissions from FINNv1.5 were implemented in WRF-Chem by Pfister et al. (2011a), which contains the daily burned area and emissions of an number of gas and aerosol species with a spatial resolution of 1 km (Wiedinmyer et al., 2011). No a priori diurnal cycle of the fire emission was applied in the WRF-Chem model, and the hourly fire emission applied in the WRF-Chem simulations was the hourly emission converted from the daily fire cases from FINN, assuming that fire at each observed fire hotspot lasted for 1 d. The plume rise calculation of the fire emission using a one-dimensional time-dependent dynamic cloud model was called every 30 min (Freitas et al., 2007; Grell et al., 2011). The high resolution in both space and time with the FINN fire data is a valuable feature for this study.
The biogenic emissions from the Model of Emissions of Gases and Aerosols from Nature (MEGAN) (Guenther et al., 2006; Sakulyanontvittaya et al., 2008) were used as the WRF-Chem input, from which monthly biogenic emissions with a spatial resolution of approximately 1 km were derived. The dust, dimethylsulfide (DMS), and sea salt emissions from GOCART were included in the model (Ginoux et al., 2001; Chin et al., 2002). For the model anthropogenic emission input, we used the NEI 2014v2 hourly anthropogenic emission dataset for the US, based on the criteria pollutant emissions from the 2014 EPA platform (USEPA, 2018b) implemented for the National Air Toxics Assessment (USEPA, 2018a). During the simulation, the meteorological field was nudged towards the 1∘ × 1∘ NCEP FNL reanalyses (FNL NCEP, 2000) every 6 h, using the WRF four-dimensional data assimilation (FDDA) method (Stauffer and Seaman, 1990).
2.4.2 Fire emissions of duff
Current major global fire emission inventories, such as GFED and FINN (Wiedinmyer et al., 2011; Giglio et al., 2013; Van Der Werf et al., 2017), do not include enough duff and peat emissions. The fuel loading in FINN is based on the regional average from the Global Wildland Fire Emission Model (GWEM) (Hoelzemann, 2004). Total fuel loading of each grid is assigned with one of specific land cover classifications. Litter is included in the GWEM, but peat and duff are not. In contrast, duff is explicitly included in GFED. GFED4s assumes the PM2.5 emission factor of 9.1 g kg−1 from duff and peat burning based on Andreae and Merlet (2001), which is smaller than the above-ground fuel emission factors and significantly smaller than the recent field and experiment results (Yokelson et al., 2013; Urbanski, 2014). Andreae (2019) updated the PM2.5 emission factor of peat burning to 18.9 g kg−1, which is larger than the above-ground fuel emission factors, but the latest fire emission inventory has not been updated accordingly yet.
The amount of duff burned during the fire cases investigated in this study was estimated based on the measurements from Zhao et al. (2019). During the 2016 Rough Ridge Fire, 4.6 cm of a duff layer was burned within 1 d, which accounted for more than 90 % of the total duff. The duff burning was estimated to have contributed 60 % of the total PM2.5 emission. To our best knowledge, this measurement is the only duff-burned depth measurement during the flaming phase in the temperate region. In previous studies, duff burning in the smoldering phase was evaluated. For example, the duff smoldering depths in North Carolina peat fires were measured from 0.5 to 10 cm (Wilbur and Christensen, 1983; Poulter et al., 2006), and Watts (2013) estimated 8.9 ± 5.2 cm duff burn depth during the smoldering in cypress swamps in Florida. Light detection and ranging (lidar) instruments detected an approximately 47 cm soil elevation loss during the 2011 Lateral West Fire in a swamp in Virginia (Reddy et al., 2015). Because smoldering occurs at a low temperature in the long term (months to years) (Rein and Belcher, 2013), which just creates weak and low plumes, here we only studied the regional air quality impact from duff flaming.
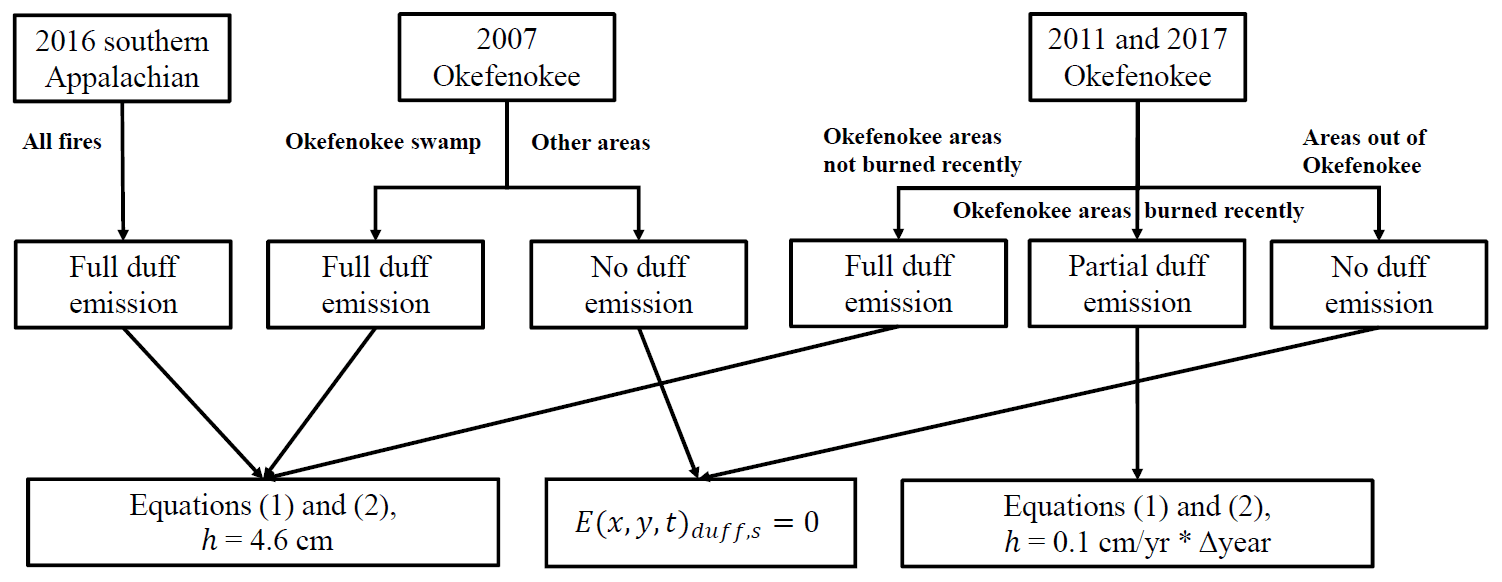
The duff emission estimation in this study is described in Fig. 3. We estimated duff emissions and added them to FINN with the following method. First, we calculated the daily duff mass burned, (kg d−1), in the burning case over the model grid box (x, y) on the day (t):
where is burned area (m2), h is the average duff-layer depth burned daily in the case (h=0.045 m d−1 assumed), and ρ is the density of duff, which was assumed to be 57.4 kg m−2 m−1 according to the measurements over the southeastern US with the vegetation type of pine and hardwoods (Ottmar and Andreu, 2007). The measurements from different locations showed a 21 % standard error of mean duff density.
The duff emissions were then added to FINN fire emission (kg d−1) for each grid box, day, and species (s):
where is the original FINN fire emission, and EFs is the duff emission factor of the species s (g kg−1).
The PM2.5 emission factor of duff/peat burning varies noticeably among the studies across the world regions and ecosystems (Table S1 in the Supplement). The four studies in the southeastern US obtained average values of about 50 g kg−1 (a field study that made in situ measurements of PM2.5 emission factors from three different peat fires in coastal North Carolina, Geron and Hays, 2013), 5.5 g kg−1 (a laboratory study that measured emission factor (EF) from peat core samples from two locations in North Carolina, Black et al., 2016), 44 g kg−1 (Benner, 1977), and 30 g kg−1 (McMahon et al., 1980). The first two studies took soil samples from the same peat location in eastern North Carolina, US. Due to a previous fire investigated by the first study, the sample from the second one had much less carbon but more ash. This was a major reason for the much lower PM2.5 emission factor proposed by the authors. For this reason, we did not consider the value from the second study when we specified the emission factor value for our study. The value from the first study was used as the US temperate duff burning emission factor in the review paper by Urbanski (2014). It was also used in our study because it is likely to better represent the burning on the vegetation type in the southeastern US. Previous studies of measuring the PM2.5 emission factors of duff/peat/organic soil burning are summarized in Table S1.
As described in the introduction section, the differences in emission factors between duff and above-ground fuels suggest different impacts of duff burning on PM2.5 and ozone (Table 2). The emission factor of PM2.5 from duff burning used in this study (50 g kg−1) is more than 3 times that from forest burning (13 g kg−1). However, the emission factors of NOx from duff burning (0.559 g kg−1 for NO and 0.176 g kg−1 for NO2) are less than 25 % of those from forest fire (0.34 g kg−1 for NO and 2.7 g kg−1 for NO2). Although the NOx emission factors vary from different locations and ecosystems, the gap of NOx emission factors from duff and the above-ground fuel was shown in different previous studies, summarized in Table S3 (Clements and McMahon, 1980; McMeeking et al., 2009; Burling et al., 2010; Selimovic et al., 2018). Except for NOx and PM2.5, a set of major fire emission compounds was added to duff emissions, as reported by Yokelson et al. (2013). The duff emission species considered in this study is summarized in Tables 1 and S2.
Table 2Comparison of duff and temperate mixed forest emission factors (g kg−1) used in this study.
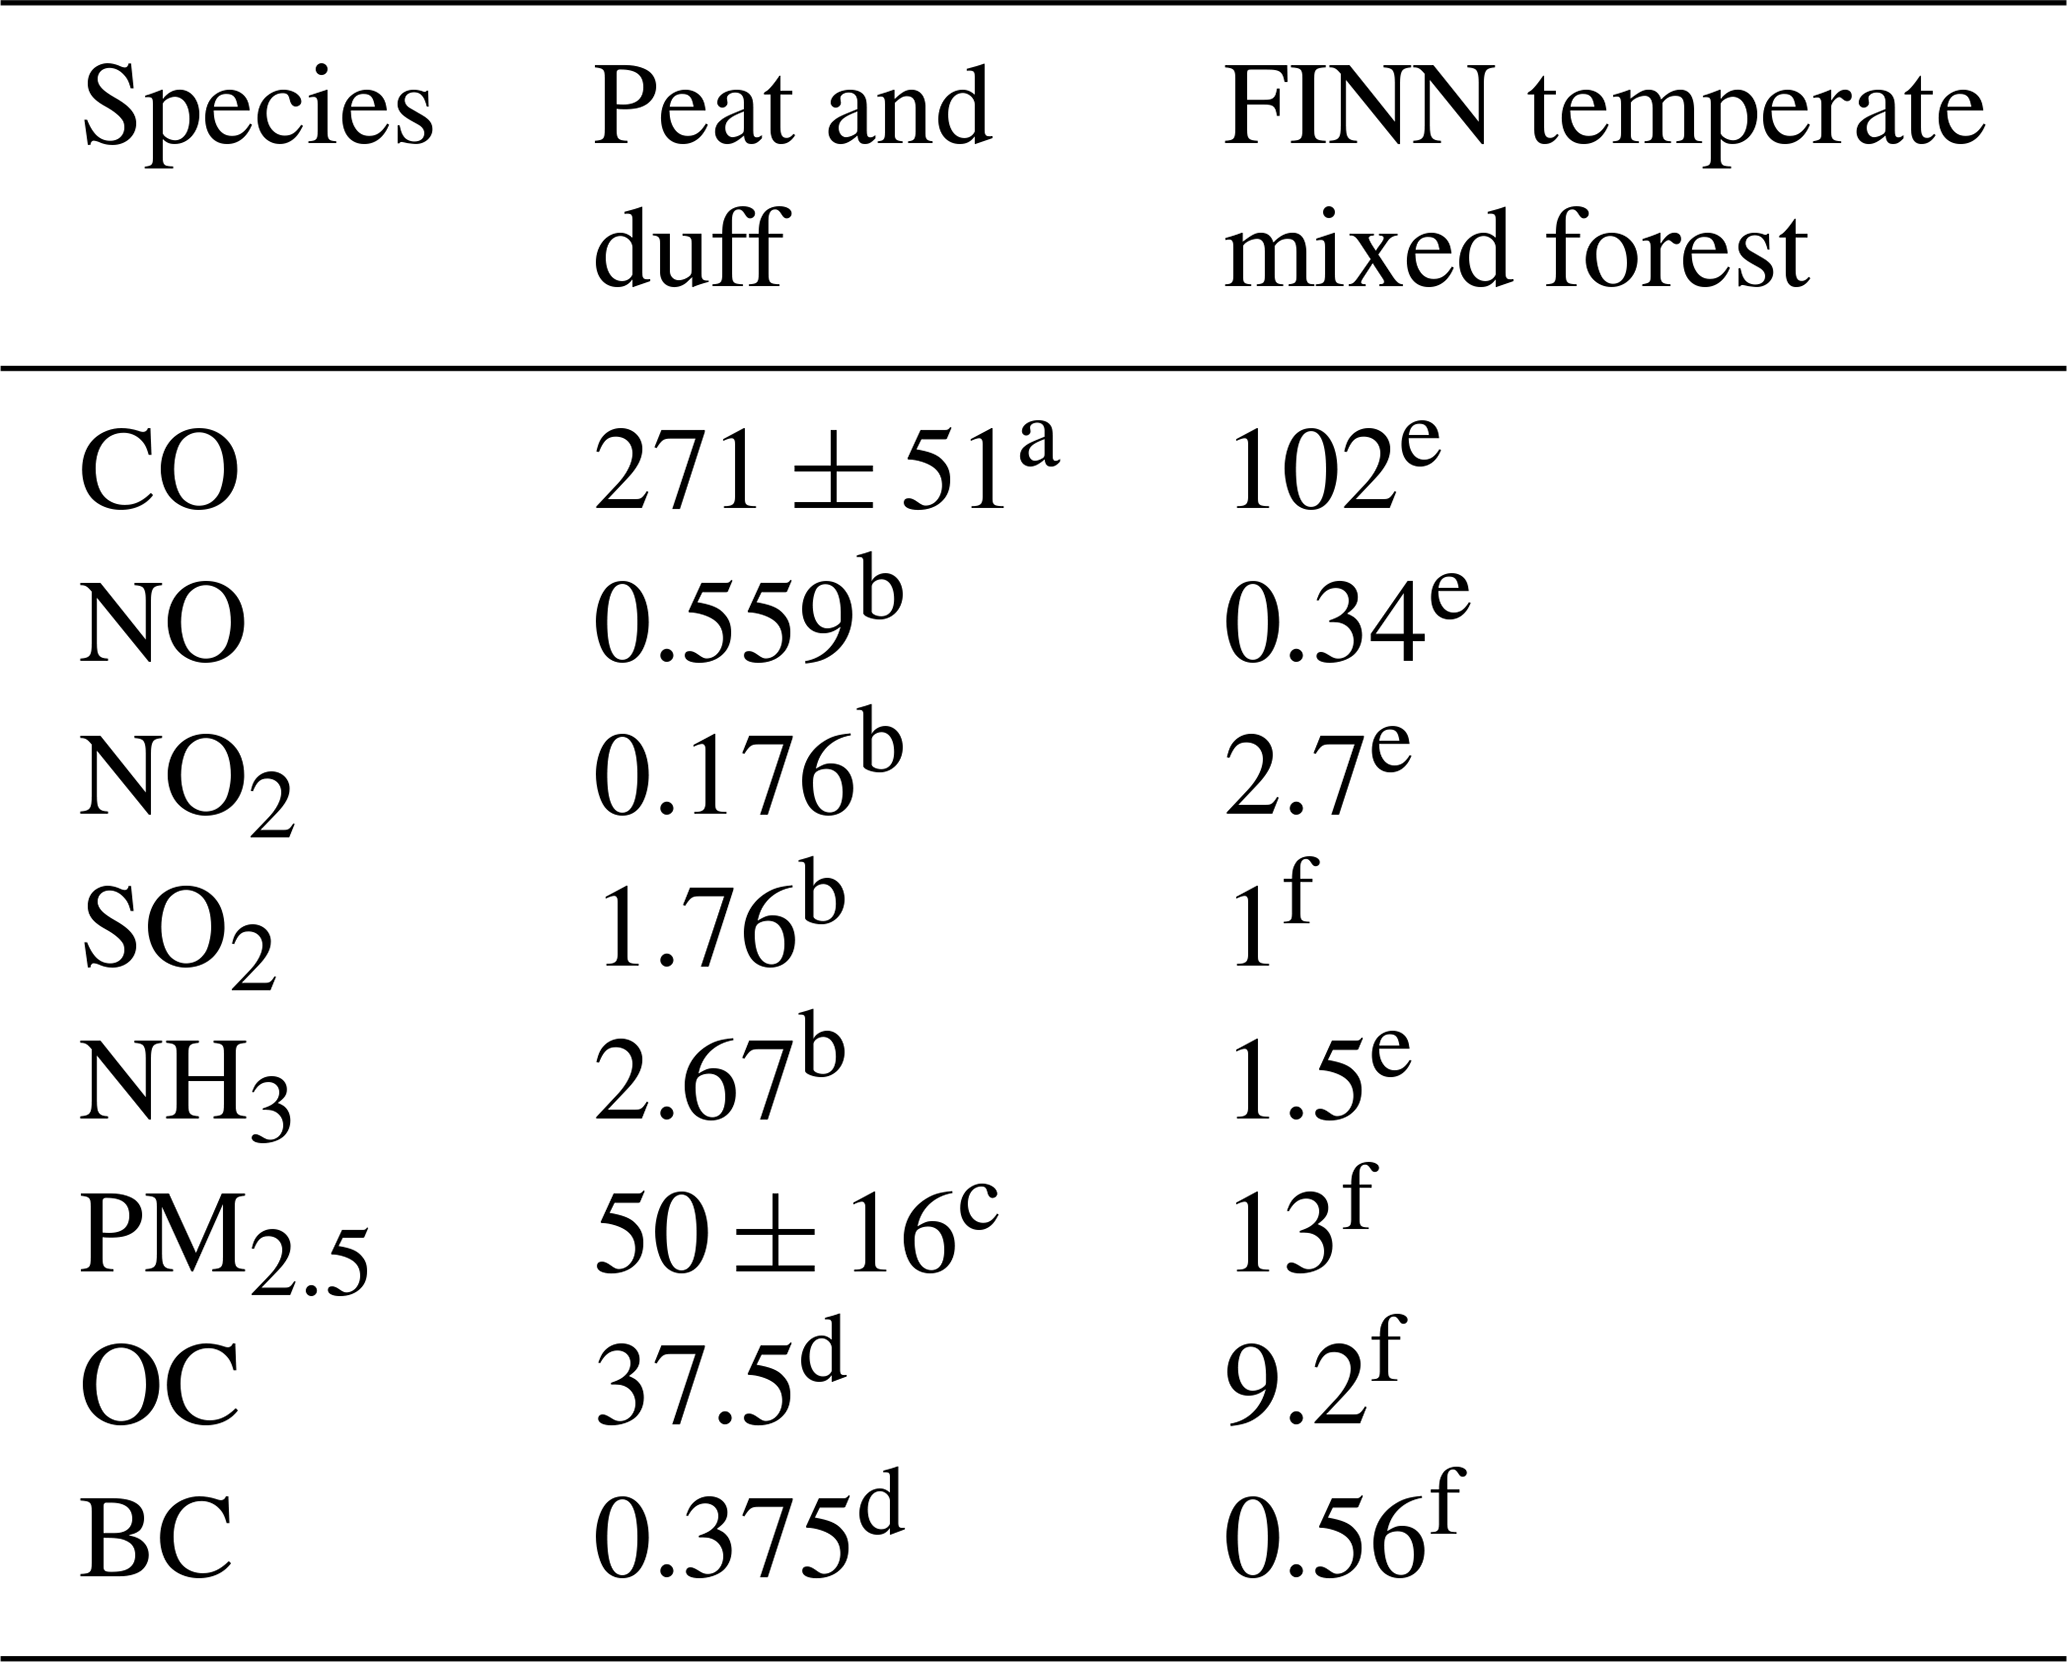
a Urbanski (2014), averaged based on Geron and Hays (2013) and Hao and Babbit (2007). b Yokelson et al. (2013). c Urbanski (2014), an average of Geron and Hays (2013). d An estimated 100:1 ratio of emission factors based on Jen et al. (2019) after applying the PM2.5 / carbonaceous aerosol emission ratio from the FINN emission factors. e Akagi et al. (2011). f Andreae and Rosenfeld (2008) in extratropical forest.
For App16, where fires had been absent for decades before 2016 in many fire sites, emissions from duff burning were calculated using the measured depth of duff burn at the Rough Ridge Fire site. The situation was the same for Oke07. However, some areas of Oke11 were overlapped with those of Oke07, while some burned areas of Oke17 overlapped with those of Oke07 and/or Oke11. From the FINN emission dataset, 87 % of the burned area in Oke11 was burned by Oke07, and 79 % of Oke17 was burned by the 2007 and 2011 fires. We assumed a duff layer recovery rate of 1 mm yr−1 based on previous studies (Ovenden, 1990; Frolking et al., 2001; Borren et al., 2004; Milner et al., 2020). Only a fraction of the measured burned duff depth for the Rough Ridge Fire (Zhao et al., 2019) was assumed for the reburned areas. For example, if the burning during Oke11 was also burned in 2007, only 4 mm of the duff layer was assumed to be burned, and the related duff emissions were added to the 2011 sim_FINN+duff run. For the other fire cases where the burning region had not been burned in the previous decade, a duff flaming rate of 4.6 cm d−1 was applied. The case mean duff flaming rate and the corresponding fuel loading are summarized in Table S4.
2.5 Sensitivity experiments
Many fire inventories using satellite-based models often underestimate fire emissions for a variety of reasons (clouds, small burned areas, timing, etc.) (Wiedinmyer et al., 2011), and a priori emissions are normally scaled up to improve model–measurement agreement (Ward et al., 2012). We found that the burned area in all four wildfire cases from FINN was approximately 50 % less than the burned area summarized in Monitoring Trends in Burn Severity (MTBS) (Eidenshink et al., 2007), which is obtained based on vegetation changes before and after a fire rather than hotspots. The FINN emissions were also lower approximately at this rate than the calculated emissions based on the measured above-ground fuel consumption by the Rough Ridge Fire in northern Georgia on 10 and 14 November 2016 (Zhao et al., 2019). This FINN emission underestimate would lead to uncertainty in quantitatively estimating the contribution relative to the above-ground fuel consumption. To roughly assess the uncertainty, we did a sensitivity experiment by doubling FINN emissions for the Oke07 case (Exp_FINN, Table 1).
As described above, there are large variations in PM2.5 and NOx emission factors. There were not enough duff measurements for the fire cases we investigated, and the duff emission factors between smoldering and flaming were also not well investigated. To evaluate the uncertainty of our simulation results due to high spatial variation of the duff layer depth, we conducted week-long sensitivity runs for App16 and Oke07 with changes in the duff burning rates by ±30 % (Exp_duff, Table 1). In addition, another set of sensitivity runs was conducted for App16 and Oke07 by doubling the duff emission of NOx to evaluate the uncertainties of the ozone effect due to the NOx emission factors (Exp_2x_duff_NOx, Table 1).
3.1 Comparisons between simulations and observations
Here we define the fire influence based on the PM2.5 impact from fire. If the PM2.5 difference between sim_nofire and sim_FINN is less than 1 µg m−3 over a specific region (and time), then this region and time are not influenced by fire smoke. This value is near the low end of the thresholds often used to assess the smoke impacts (Munoz-Alpizar et al., 2017; Matz et al., 2020). For both sim_nofire and sim_FINN, the simulated PM2.5 concentrations agree with the observations over the areas not influenced by fire events (Fig. S3). However, the baseline simulation (sim_FINN) underestimates PM2.5 concentrations over the fire-impacted areas shown in Fig. 4. For example, in the App16 areas (34.5 to 36∘ N, 82 to 84∘ W), the model underestimates PM2.5 by 56.6 % for sim_nofire and by 29.2 % for sim_FINN. For Oke07 and Oke11, the massive plume simulated by the model is transported to a large area of Georgia. The model underestimates PM2.5 in Georgia by 56.2 % in 2007 and 49.0 % in 2011 for sim_nofire and by 47.5 % in 2007 and 39.5 % in 2011 for sim_FINN. The simulated smoke from Oke17 disperses more widely in space than that from Oke11, so the intensity of the mean fire impact is minor. The comparisons of time series comparison show similar results: that is, sim_FINN underestimated PM2.5 surface concentrations (Fig. 4). Figure 4 also shows a PM2.5 increase in all four cases due to duff emissions, which improves the overall model performance, although the simulations still underestimate in the Oke11 and Oke17 cases and slightly overestimate the PM2.5 level in the App16 case.
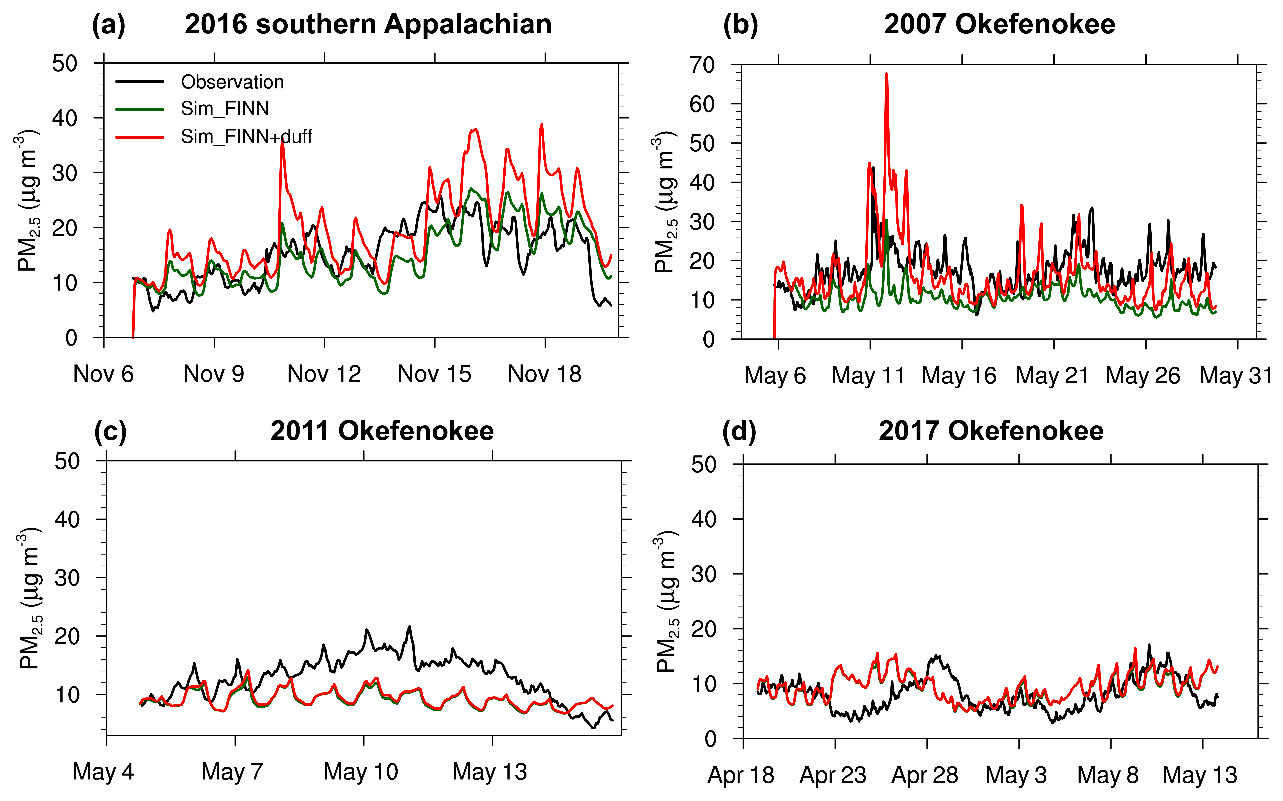
Figure 4The time series of hourly surface PM2.5 concentrations. Black: measurements averaged over observation sites within the simulation domain. Green and red: simulations of Sim_FINN and Sim_FINN+duff, respectively, averaged over the observation sites.
The model is able to reproduce the spatial distributions of surface ozone for all fire cases (Fig. S7). The baseline (sim_nofire) runs capture the observed background daytime ozone concentrations and the concentrated PM2.5 spots (the spots with high-level surface PM2.5 concentrations directly due to fire smoke) in the fire and remote areas. For example, the model reproduces the high ozone concentrations from northern Alabama and Georgia to northwestern South Carolina and North Carolina and eastern Tennessee as well as coastal Louisiana and Mississippi and central Florida from Oke07 (Fig. S7f). However, the model overestimates surface ozone in the western South Carolina and North Carolina mountains (Fig. S7c and g). This might be caused by the uncertainty of estimating biogenic VOC emissions.
The observed ozone maximum 8 h average (MDA8) shows an agreement with the baseline simulation for all fire cases. The observation–simulation correlation coefficients are larger than 0.5 for App16 and larger than 0.6 for the Okefenokee cases (Fig. S4). Both sim_FINN and sim_FINN+duff simulations also agree with the observations in terms of the time series and trend during the fire events (Fig. 5). The model overestimates nighttime ozone by approximately 10 ppb for App16, indicating the potential bias in nighttime ozone chemistry or planetary boundary layer height estimation (Li and Rappenglueck, 2018).
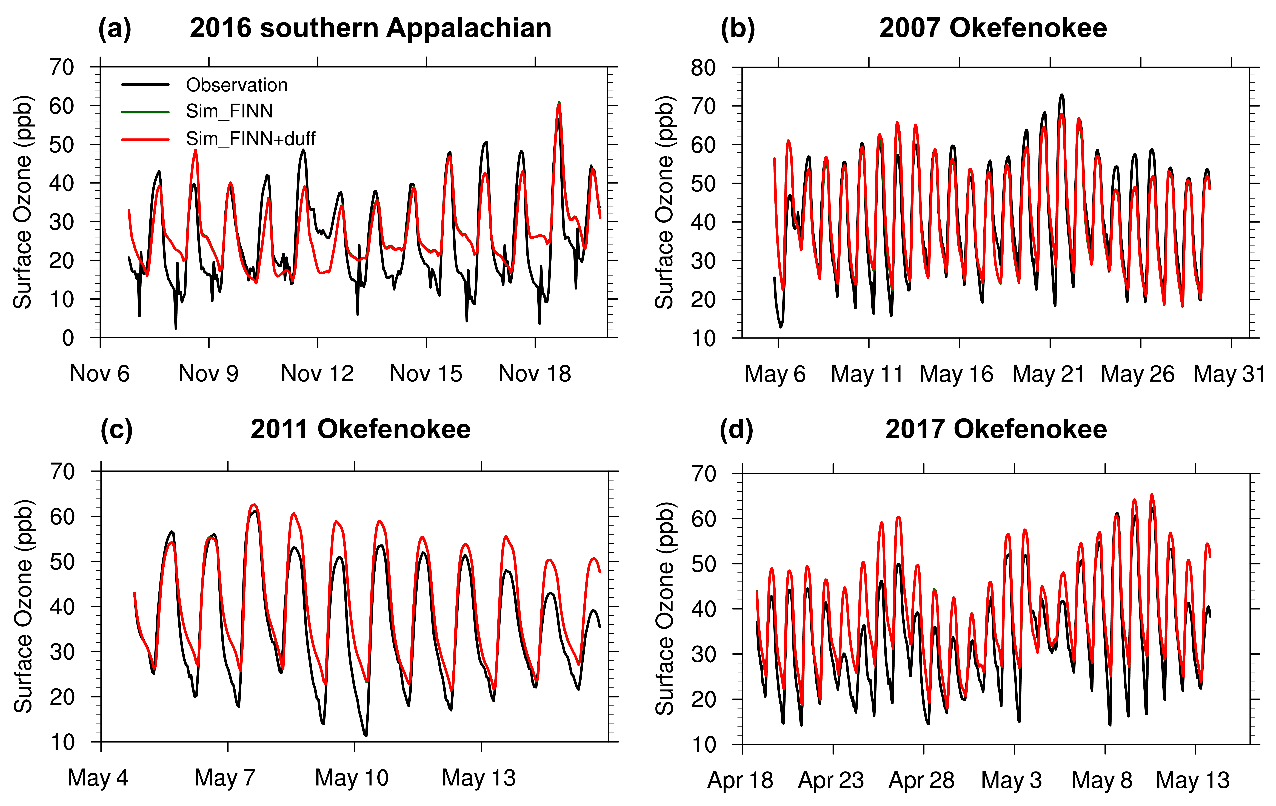
Figure 5The time series of hourly surface ozone concentrations. Black: measurements averaged over observation sites within the simulation domain. Green and red: simulations of Sim_FINN and Sim_FINN+duff, respectively, averaged over the observation sites.
While the sim_FINN simulations underestimate PM2.5 concentrations over the burning region, especially sites with the smoke impact, sim_FINN+duff simulations have better agreement with the observations, as shown in Fig. S5. The slope of the linear regression is 0.91 between sim_FINN+duff results and the observations, while the slope is only 0.15 between sim_FINN and observations. Although adding duff burning improves the regional simulation in terms of both the slope and the correlation coefficient (from 0.29 to 0.56), the correlation coefficient is still low, indicating the potential spatial–temporal uncertainty of the fire emissions. The evaluations for the SA16, Oke11, and Oke17 fires are similar to the Oke07 results as shown in Fig. S5.
The model performance in simulating the spatial patterns of smoke is evaluated by the Moderate Resolution Imaging Spectroradiometer (MODIS) image product from the Terra satellite. Figure S6 shows that the simulated smoke transport agrees well with the satellite image of the smoke. The results in the Oke07, Oke11, and Oke17 fires also show good agreement between the simulation and the satellite image. In the following sections, we will further discuss the spatial and temporal patterns of smoke ozone and PM2.5.
3.2 The PM2.5 emission and transport from duff burning
Here we show the improvement of model performance in simulating PM2.5 by including duff burning emissions. The simulation results on the selected dates of 15 November 2016, 10 May 2007, 8 May 2011, and 29 April 2017 for the four fire cases are shown in Figs. 6 and 7, and those on other days are provided in Figs. S8 to S15.
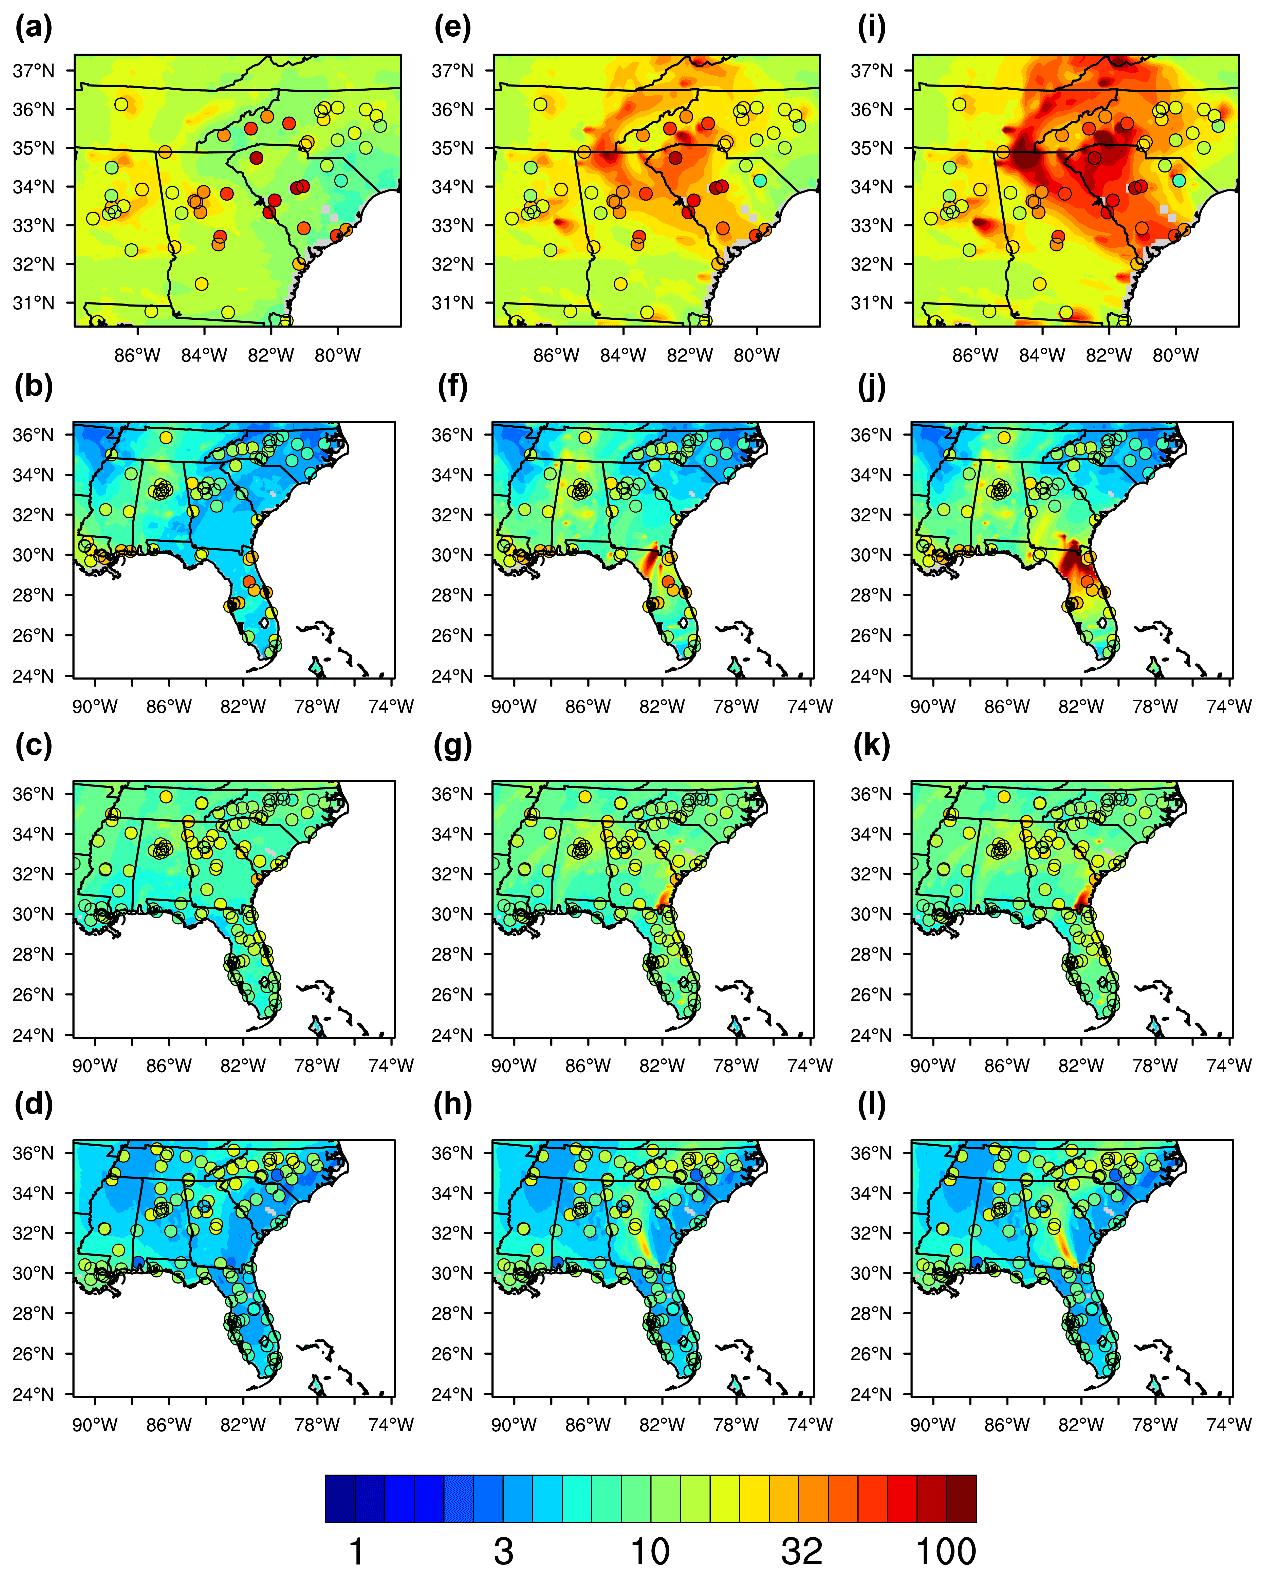
Figure 6The mean surface concentration of simulated and observed PM2.5 (µg m−3) on representative days. (a) App16 (15 November 2016), (b) Oke07 (10 May 2007), (c) Oke11 (8 May 2011), and (d) Oke17 (29 April 2017) for sim_nofire. Panels (e)–(h) are the corresponding fire cases for sim_FINN, and panels (i)–(l) are the corresponding fire cases for sim_FINN+duff. The color scatters represent the observed daily mean PM2.5 concentrations.
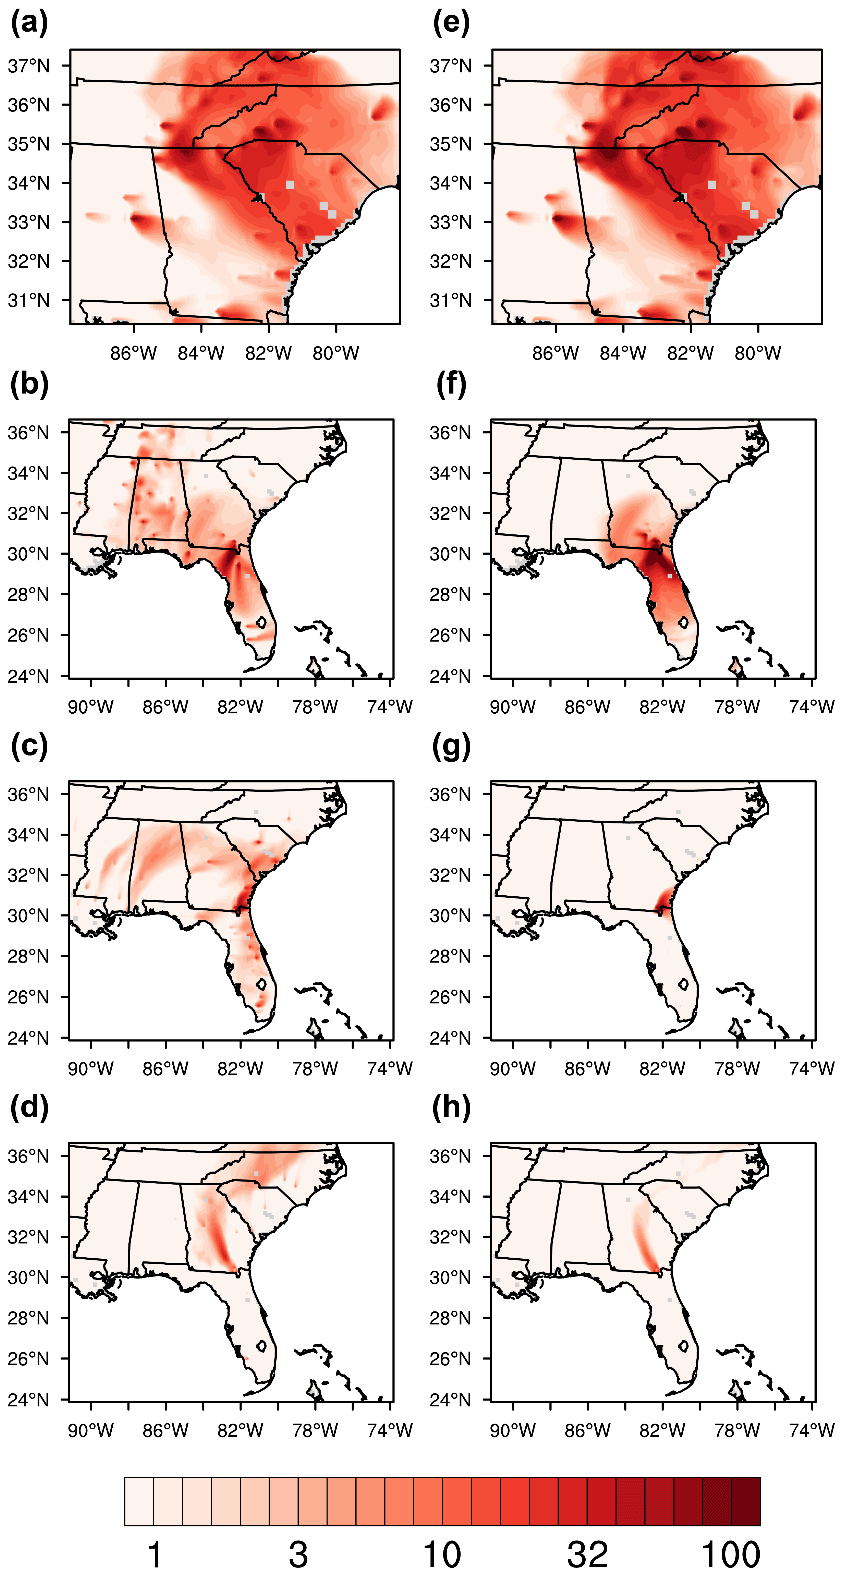
Figure 7The surface PM2.5 concentration change (µg m−3) on representative days. (a) The change due to above-ground fuel burning during App16 (15 November 2016), (b) Oke07 (10 May 2007), (c) Oke11 (8 May 2011), and (d) Oke17 (29 April 2017). Panels (e)–(h) are the corresponding changes due to duff burning.
The sim_FINN-simulated smoke from App16 is transported southeastward to Georgia and South and North Carolina on 15 November 2016 (Fig. 7a and e), leading to increased air pollution. However, the model underestimates the observed surface PM2.5 concentrations by approximately 50 % in areas with peak local concentration (Fig. 6e). On 10 and 16 November 2016, the simulated plume moves in the clockwise direction, causing air pollution in the large cities in Georgia (Fig. S9). Figure 7a and e indicate that the PM2.5 concentrations from duff burning are of the same magnitude as or even slightly higher than those from the emissions of above-ground fuel burning. Thus, implementing duff burning doubles the fire-induced PM2.5 concentrations during App16 over the study domain.
The total burned area of Oke07 was 5 times more than that of App16, and over the periods of the simulations, the daily average fire emission during Oke07 was 3 times more than that during App16 (Fig. S1). Correspondingly, the simulated PM2.5 concentrations during Oke07 are greater. In addition, different from App16 that occurred in November, Oke07 occurred in May. Thus, the photochemistry of ozone and its precursors was more active. In the sim_FINN+duff runs, the simulated surface PM2.5 in the fire plume effectively approaches the underestimated regions showing the greatest fire impact, but the enhancement is still not enough over some regions. For example, on 10 May, the simulations including duff emissions are in better agreement with the observation over southwestern Florida, where the simulated concentrations are underestimated by a factor of 2–5 (Fig. 6f and j). Over the fire-impacted region (24–34∘ N, 76–86∘ W) on 10 May, the surface PM2.5 increase due to duff burning is 126 % more than that due to above-ground fuel burning. However, the simulation that is the closest to the observation still underestimates the surface PM2.5 concentrations in the fire-impacted region in northern Georgia and North Carolina. The sim_FINN simulation underestimates some concentrated PM2.5 during the fire, including in southwestern Florida on 11 May, the Atlanta region on 16 May, and western Georgia on 26 May, by as much as more than 10 times sometimes (Fig. S9).
Similarly to the other cases, the sim_FINN+duff-simulated surface PM2.5 concentrations from Oke11 and Oke17 are approximately doubled over the fire areas of those simulated in sim_FINN (Fig. 7c, d, g, and h). However, the sim_FINN simulation of the fire cases does not underestimate PM2.5 as much as Oke07. Because a large portion of the two fires was burned by the previous fires in 2007 (and 2011 for the 2017 fire), the simulated duff impacts from them are weaker. In addition, the simulated smoke from the two fires is transported to the ocean during half of the major burning periods (9–11 May 2011 and 2–12 May 2017) (Figs. S14 and S15), which weakens the fire impact in the land areas. This inter-case comparison over the same area supports the evidence that the underestimation of PM2.5 in the sim_FINN runs is mainly due to missing duff burning emissions.
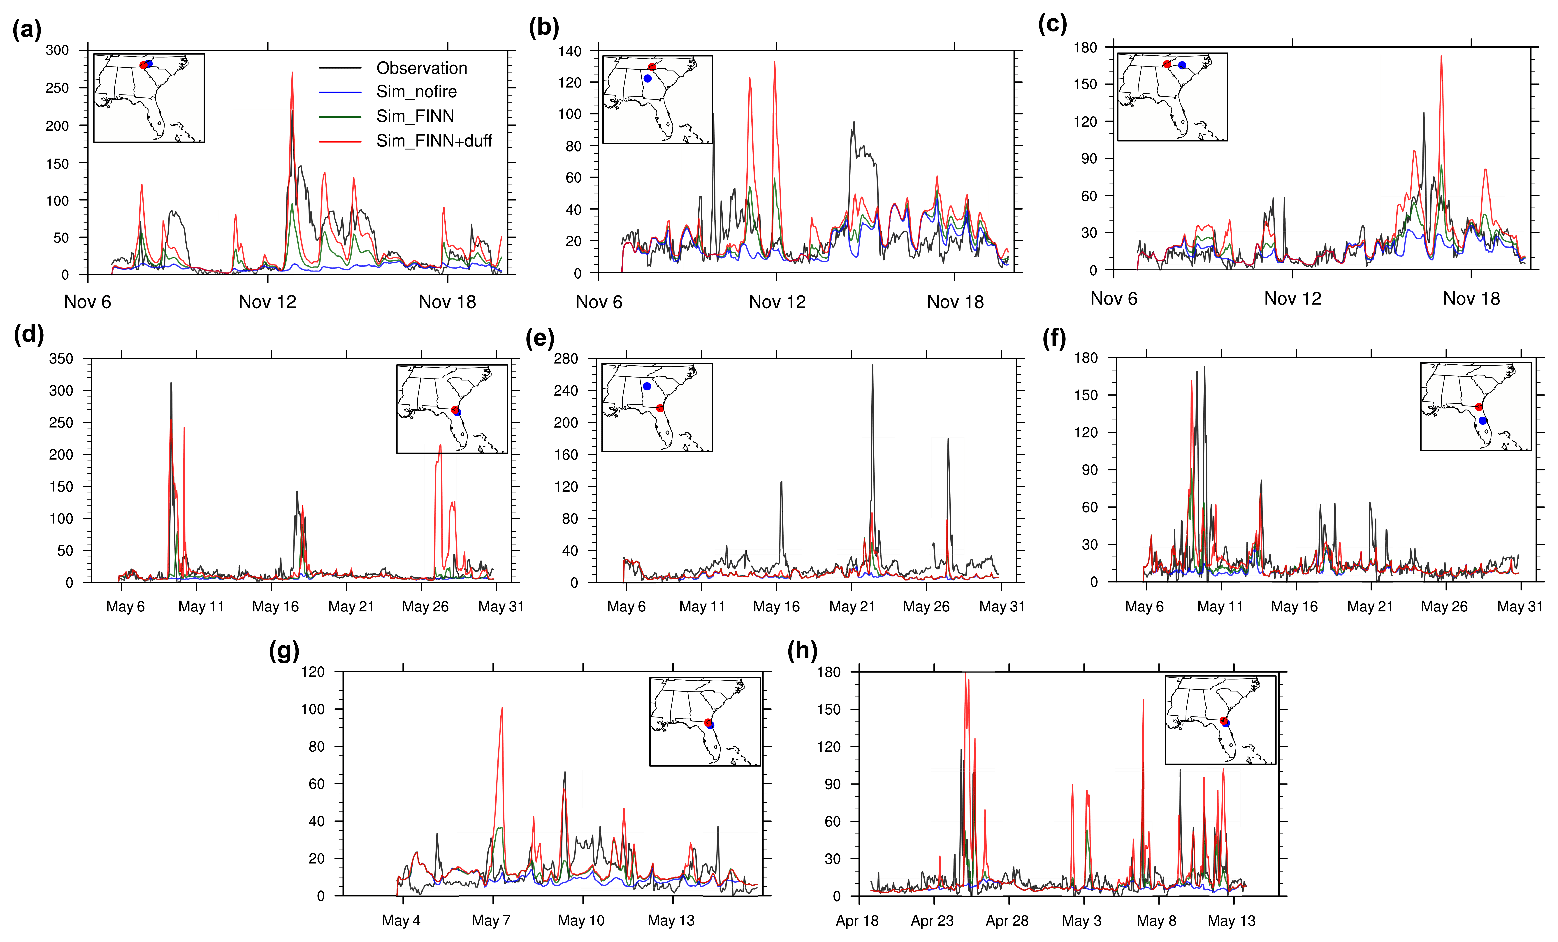
Figure 8Comparisons of in situ hourly surface PM2.5 concentrations (µg m−3) among the observation (black), sim_nofire (blue), sim_FINN (green), and sim_FINN+duff (red) simulations. (a–c) App16, (d–f) Oke07, (g) Oke11, and (h) the 2017 Okefenokee Fire. The fire location (red) and site location (blue) are shown in the map attached to each panel. The observation sites are located in (a) Macon County, North Carolina, (b) Fulton County, Georgia, (c) Mecklenburg County, North Carolina, (d) Duval County, Florida, (e) Fulton County, Georgia, (f) Orange County, Florida, and (g–h) Duval County, Florida.
The important PM2.5 impacts of duff burning are also seen in the temporal variations of stational surface concentrations (Fig. 8). Figure 7a, d, g, and h show the locations close to the fire areas. During App16, the simulated PM2.5 concentrations increase by approximately 100 % during the major burning days on 7, 8, 13, 14, and 15 November, due to including duff burning (Fig. 8a). The daily variations are different between observations and simulations because the observed fire emission dataset was at daily rather than hourly intervals. The sim_FINN+duff improves the simulations of PM2.5 surface concentrations in metro Atlanta, Georgia (Fig. 8b), and metro Charlotte, North Carolina (Fig. 8c), on major burning days.
During Oke07, including duff burning makes the simulated PM2.5 levels 1 to 10 times closer to the observed PM2.5 levels at many observation locations, for example, on 9 and 18 May in Duval County, Florida (Fig. 8d), and 8 to 13 May in Orange County, Florida (where metro Orlando is located) (Fig. 8f). The simulation shows a high bias on 27 May in Duval, potentially due to the bias in fire emissions, but on the same day, the simulation still underestimates the PM2.5 concentrations in Atlanta, Georgia. Duff emission increases the PM2.5 concentrations in Atlanta (Fig. 8e), but the model underestimation still exists.
Because of the weak impacts of duff burning during Oke11 and Oke17 on PM2.5 in metro areas as shown above, we evaluated sim_FINN+duff model performance by comparing it to in situ observation at the locations close to the fire site (Fig. 8g, h). Although the sim_FINN+duff simulation overestimates PM2.5 concentrations on 7 May 2011, 2–3 May 2017, and 7 May 2017, adding duff burning generally reduces the PM2.5 underestimation in sim_FINN runs on 9, 12, and 14 May 2011 and 24–26 April and 9–13 May 2017. Duff burning increases local PM2.5 concentration by 50 %–400 %, depending on the above-ground fuel burning and the duff recovery conditions.
The PM2.5 concentrations in the sim_FINN+duff runs better fit the burning-day observations during ER08 and PB11 (Figs. 12 and 13). On 11–12 June 2011, the ER08 fire smoke transported throughout North Carolina affected urban and rural regions more than 200 km away from the burning site. Compared to the sim_FINN runs, adding duff burning enhanced PM2.5 by 2 to 3 times in both the Charlotte metro, North Carolina, and the rural region close to the burning. The PM2.5 impact from the PB11 fire is relatively smaller in both the sim_FINN and sim_FINN_duff runs, because the burned area is less in PB11 than in ER08, and part of the fire smoke was transported to the ocean during burning. Due to duff burning, the PM2.5 concentration increased by approximately 10 % on 11 May 2011 in the Charlotte metro area, and the increase is up to 100 % in the rural region close to the fire.
There are large mismatches at times between observations and simulations. Both biases in fire emission calculation and smoke transport simulation should be the contributors (Li et al., 2020; Garcia-Menendez et al., 2013). In addition to the uncertainties with the FINN fire emissions and duff emission calculation described above, fires have large diurnal variations, but only daily burned area data for emission calculation were available. Despite the general agreement in spatial patterns between the simulated and satellite-detected smoke plume as shown above, biases in WRF simulations of atmospheric conditions, especially wind direction and speed, would lead to shifts in both space and time of the simulated plume from its actual position.
3.3 The different ozone and PM2.5 impacts from duff burning
Although the above-ground fuel burning of App16 led to a 6–10 ppb increase in surface ozone on 15 November 2016 (Fig. 9a) over the areas affected by fire plume, adding duff burning to the model simulation does not increase the surface ozone concentration. Over the downwind region where the ozone increase is high from above-ground fuel burning, duff burning slightly offset the ozone increase by 0–4 ppb. A similar minor ozone impact from duff burning is also simulated for other days (Fig. S20). The ambient VOC concentrations are lower in November than in summer, which provides a VOC-limited scenario in the ozone photochemistry. In this scenario, when NOx concentration is high due to the above-ground fuel burning, more NOx emissions from duff burning tend to decrease ozone concentrations (Seinfeld and Pandis, 2016). The above-ground fuel burning increases ozone concentrations by 10–15 ppb on 13–15 November, but the ozone concentrations in sim_FINN+duff are very similar to those in sim_FINN, indicating that the duff burning has a negligible impact on ozone concentrations in App16 (Fig. 11a–c). The ozone simulation agrees better with observations in the urban than in the rural fire areas, and similarly to the fire area, the ozone in the urban areas is not significantly affected by duff burning.

Figure 9The daytime mean (from local time 10:00 to 18:00) surface ozone concentration of simulated and observed ozone (ppb) on representative days. (a) App16 (15 November 2016), (b) Oke07 (10 May 2007), (c) Oke11 (8 May 2011), and (d) Oke17 (29 April 2017) for sim_nofire. Panels (e)–(h) are the corresponding fire cases for sim_FINN, and panels (i)–(l) are the corresponding fire cases for sim_FINN+duff. The color scatters represent the observed daytime mean surface ozone concentrations.
The simulated duff burning impact on ozone is positive during Oke07 but still smaller than the PM2.5 impact. The above-ground fuel burning and the duff burning increase the ozone concentration in the fire-impacted areas (Figs. 10b and f, S21). Oke07 occurred in summer, and the fire site was located further south in comparison with App16, meaning higher temperature, sunlight, and biogenic activities. Thus the overall VOC concentrations and the simulated ozone pollution are stronger than those in November 2016 (Seinfeld and Pandis, 2016). However, the ozone impact is significantly weaker from duff burning than from above-ground fuel burning (Figs. 10b and f, S21). The simulated surface ozone increase due to duff burning is only 32 % of that due to above-ground fuel burning over the fire-impacted region (24–34∘ N, 76–86∘ W) on 10 May 2007. This contribution is much smaller than that of duff burning to the PM2.5 impact, which is 126 % more than that from above-ground fuel burning. These different contributions of duff burning to PM2.5 and ozone are due to the larger PM2.5 emission factor but smaller NOx emission factors of duff in comparison with the above-ground fuel, as assumed in Sect. 2.4. The difference is also seen in the temporal variations. The above-ground burning led to ozone increases by 10–20 ppb in Atlanta on 21–23 May (Fig. 11e) and by 2–15 ppb in Orlando on 8–12 May (Fig. 11f), but duff burning led to ozone increases by 0–7 ppb in both Duval (Fig. 11d) and Orlando (Fig. 11f) on 8–12 May.
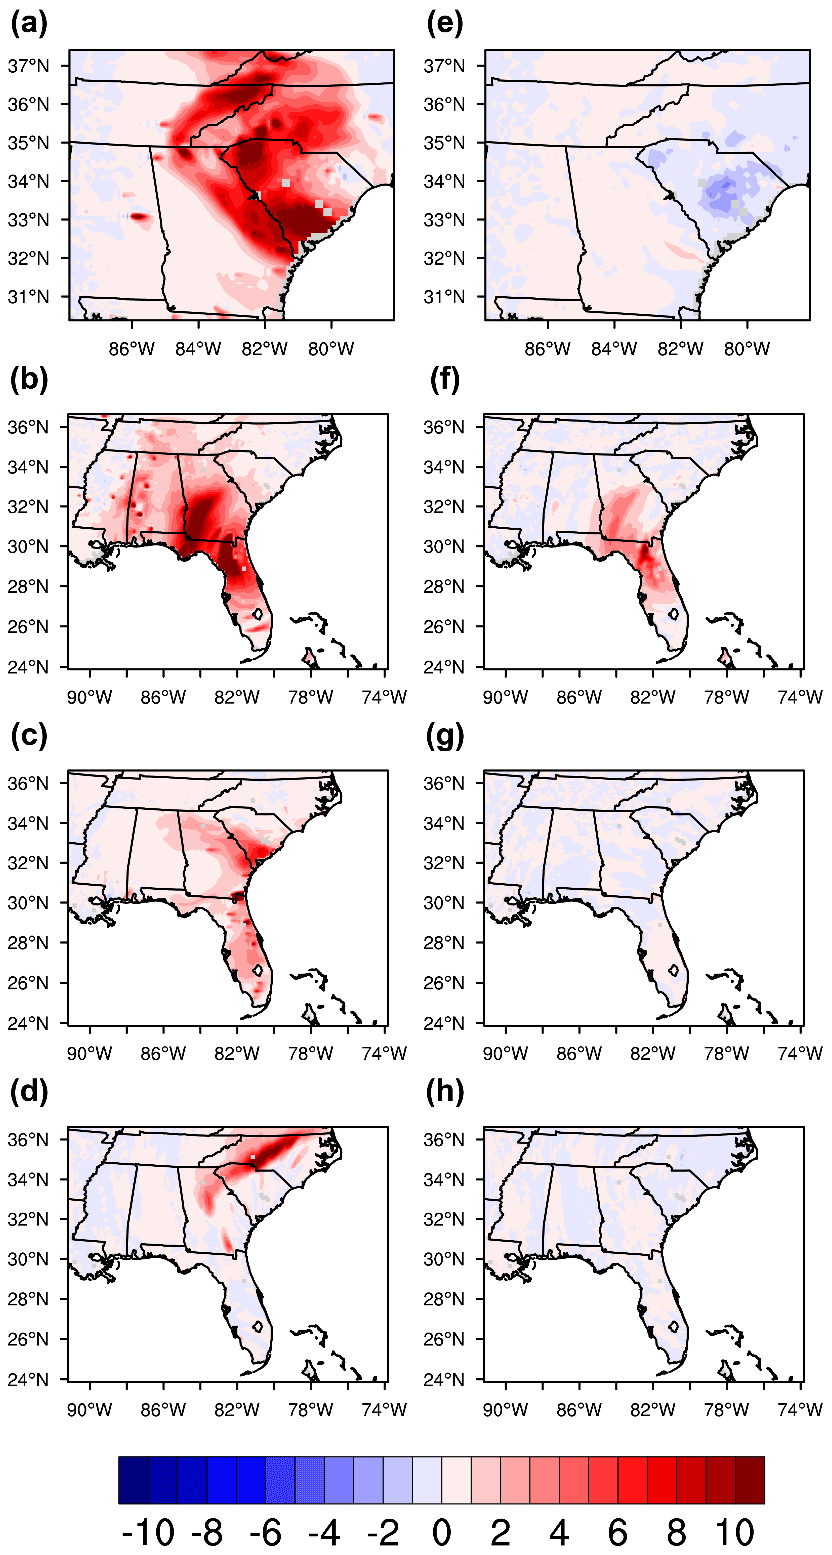
Figure 10The daytime mean (from local time 10:00 to 18:00) surface ozone concentration change due to above-ground fuel burning (ppb) on representative days. (a) 2016 southern Appalachian case (15 November 2016), (b) Oke07 (10 May 2007), (c) Oke11 (8 May 2011), and (d) Oke17 (29 April 2017). Panels (e)–(h) are the corresponding changes due to duff burning.
The ozone increase is significant due to the above-ground fuel burning from Oke11 and Oke17 (Fig. 10c and d), with a level comparable to Oke07. However, the level of ozone increase due to duff burning is low (Fig. 10g, h). This low level is also seen in the temporal variations (Fig. 11g, h). The sim_FINN and sim_FINN+duff runs accurately capture several ozone peaks on 8 and 10 May 2011 and 2 and 8–13 May 2017. Duff's contribution to the ozone peak is weak, similar to that of PM2.5. The duff layer in the Okefenokee Swamp in 2011 and 2017 was not well recovered from Oke07.
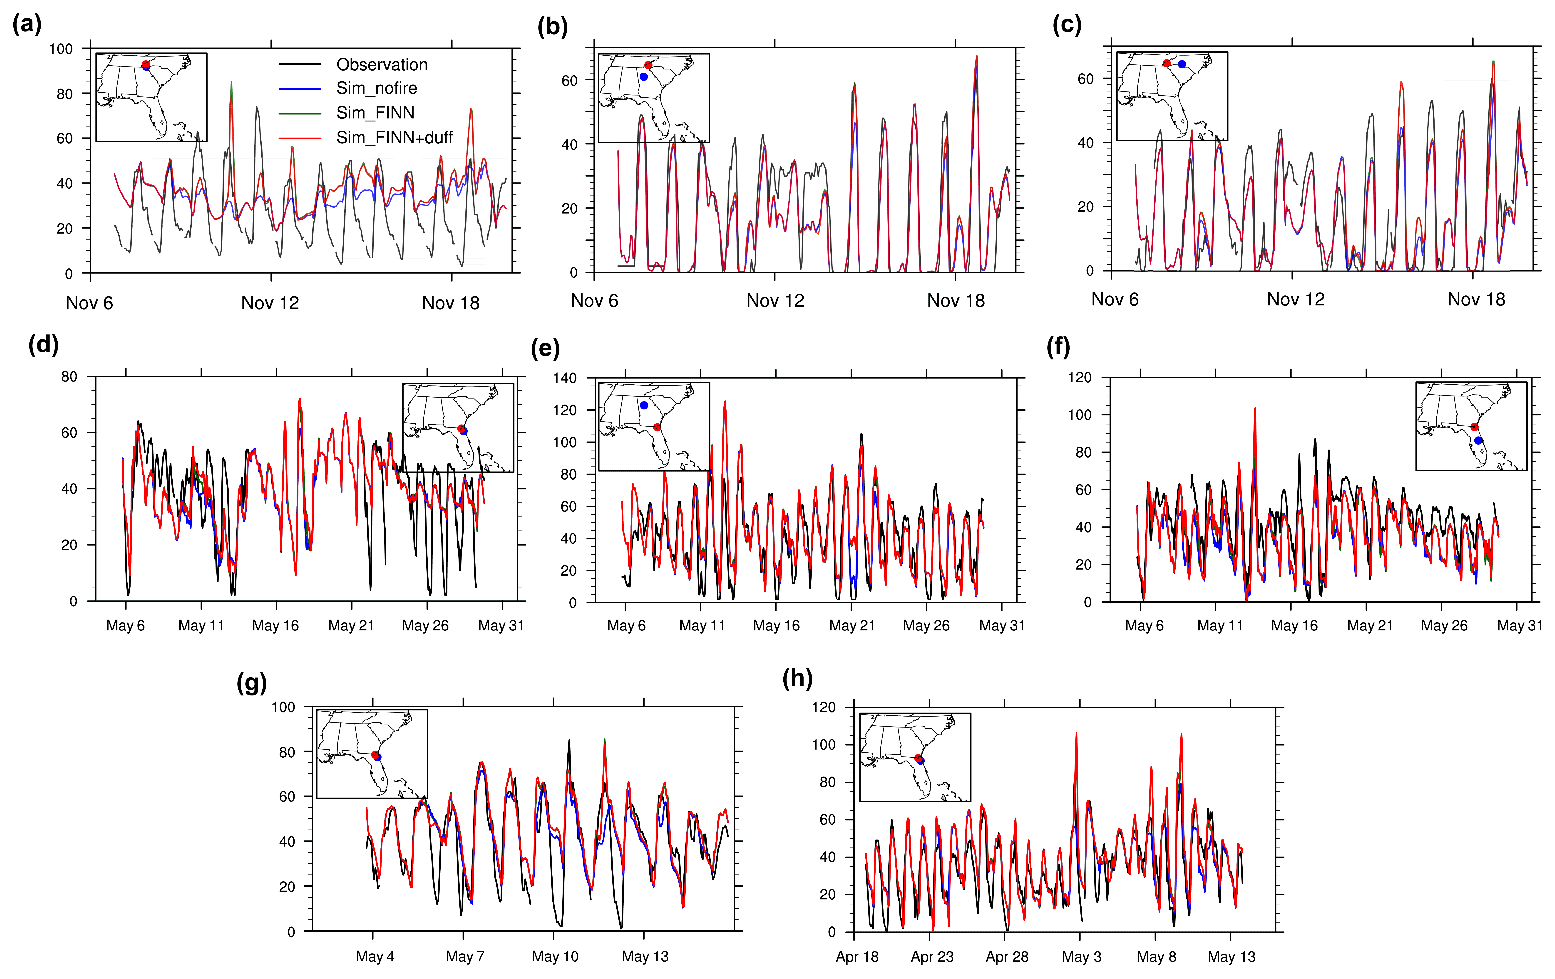
Figure 11Comparisons of in situ hourly surface ozone concentrations (ppb) among the observation (black), sim_nofire (blue), sim_FINN (green), and sim_FINN+duff (red) simulations. (a–c) App16, (d–f) Oke07, (g) Oke11, and (h) Oke17. The fire location (red) and site location (blue) are shown in the map attached to each panel. The studied sites are in (a) Macon County, North Carolina, (b) Fulton County, Georgia, (c) Mecklenburg County, North Carolina, (d) Duval County, Florida, (e) Fulton County, Georgia, (f) Orange County, Florida, and (g–h) Duval County, Florida.
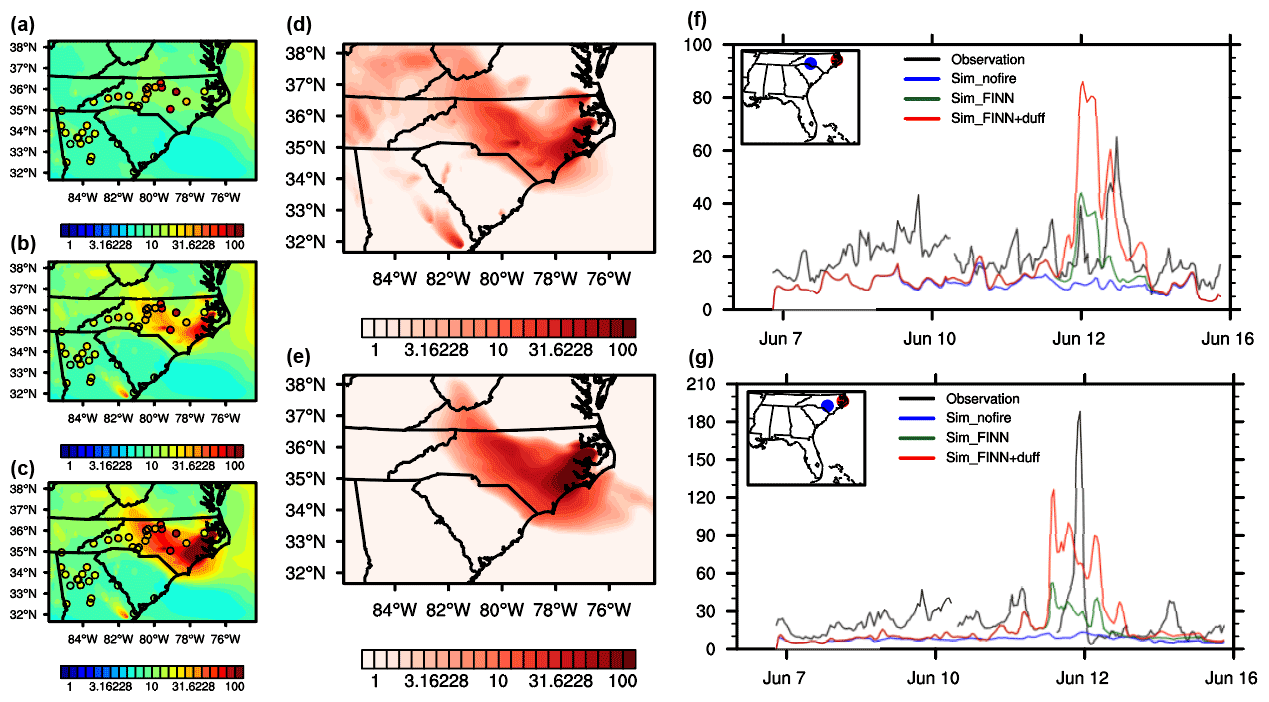
Figure 12The PM2.5 distribution and time series during the 2008 Evans Road Fire. (a–c) PM2.5 daily mean surface concentration (µg m−3) on 12 June 2008 simulated in (a) sim_nofire, (b) sim_FINN, and (c) sim_FINN+duff runs. (d–e) The PM2.5 daily surface concentration differences (µg m−3) between (d) sim_FINN and sim_nofire and between (e) sim_FINN+duff and sim_FINN on 12 June 2008. (f–g) The comparison of the time series of hourly surface PM2.5 concentrations (µg m−3) between the observation and simulations from 7 to 14 June 2008 in (f) Mecklenburg County, North Carolina, and (g) Cumberland County, North Carolina.
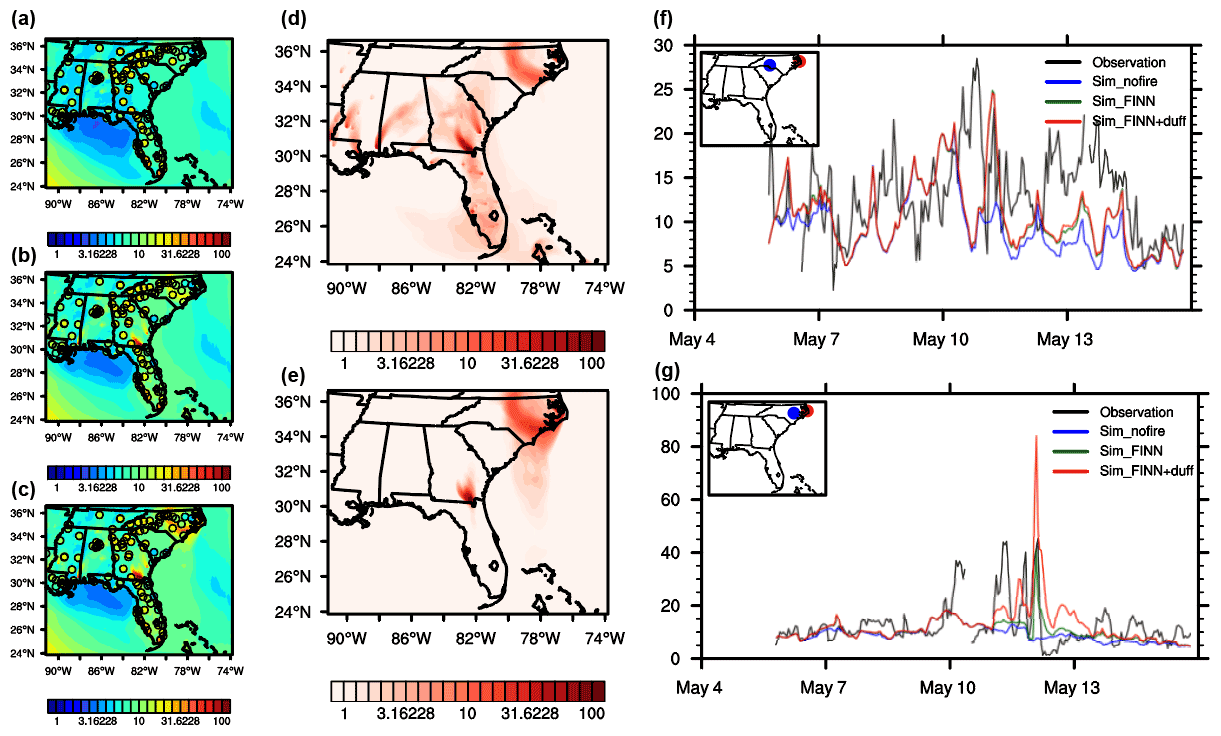
Figure 13The PM2.5 distribution and time series during the 2011 Pains Bay Fire. (a–c) PM2.5 daily mean surface concentration (µg m−3) on 12 May 2011 simulated in (a) sim_nofire, (b) sim_FINN, and (c) sim_FINN+duff runs. (d–e) The PM2.5 daily surface concentration differences (µg m−3) between (d) sim_FINN and sim_nofire and between (e) sim_FINN+duff and sim_FINN on 12 May 2008. (f–g) The comparison of the time series of hourly surface PM2.5 concentrations (µg m−3) between the observation and simulations from 6 to 15 May 2011 in (f) Mecklenburg County, North Carolina, and (g) Wayne County, North Carolina.
The ozone and PM2.5 impacts during the simulated fire periods (App16: 7–20 November 2016; Oke07: 6–30 May 2007; Oke11: 6–14 May 2011; Oke17: 20 April–13 May 2017; ER08: 8–14 June 2008; PB11; 6–14 May 2011) from duff burning and the above-ground burning in the fire areas (6∘ × 6∘ in size centered at the fire site) and nearby areas are summarized in Table 3. The above-ground fuel burning significantly increases ozone over the fire area in all cases except 2017, but duff burning does not affect ozone concentrations significantly. However, duff burning has comparable PM2.5 impacts to above-ground fuel burning in all the fire cases. Duff burning also significantly affects urban air quality during App16 and Oke07. During 2007, when duff burning in the simulation is strong in the Okefenokee Swamp, the duff impact accounts for double that of the above-ground fuel impact. During Oke11 and Oke17, the duff impacts are weaker due to the slow recovering speed of the duff layer after the 2007 fire, but the PM2.5 impact is still significant over the fire area.
Table 3Summary of the increased ratio of PM2.5 and ozone due to duff burning and above-ground fuel burning. The bold numbers show that the increase or decrease ratio passes the Student's t test with p = 0.05.
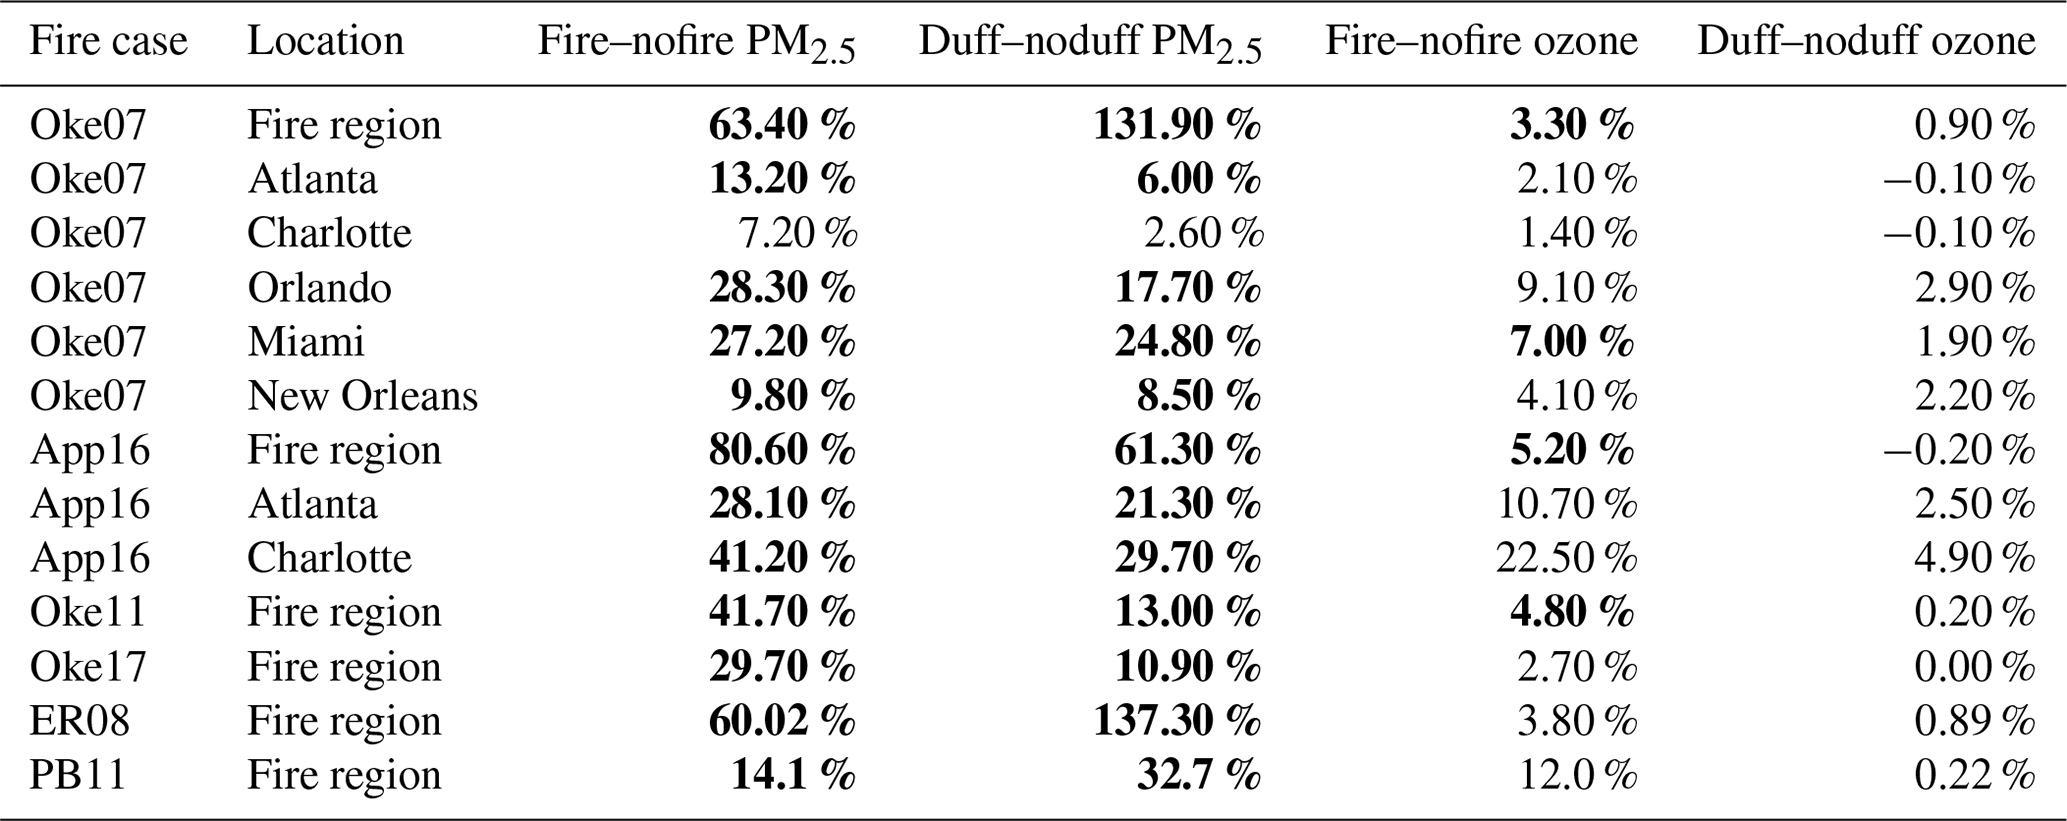
∗ The “fire region” is the squared 6∘ × 6∘ area with the fire site in the center.
3.4 Sensitivity runs
The result from Exp_2x_duff_NOx (Fig. S26) shows that doubling the NOx emissions from duff does not change the result of the different PM2.5 and ozone effects from duff burning. During the App16 case, increasing NOx further decreases the ozone concentration in the nearby urban and closest big city. Compared to the sim_FINN runs, ozone decreases by 7.5 % in Charlotte, North Carolina, during the App16 case and by 7.9 % in the rural region of Macon, North Carolina, which is close to the fire. During the Oke07 case, the ozone increase with more NOx from duff, the ozone in the Exp_2x_duff_NOx case is 1.3 % and 4.8 % more than the sim_FINN runs over the rural region close to fire (Duval, Florida) and over the nearby big city (Orlando, Florida), and still weaker than the PM2.5 effect.
The result from Exp_FINN shows that doubling FINN emission does not affect our conclusions, as shown in Fig. S27. When the regional underestimation for PM2.5 is 36 % with no duff burning, doubling FINN emission improved the underestimation to 20 % but still significantly underestimated the regional fire impacts. Doubling FINN emission did not fix the missing of some fire peaks on dates like 8, 11, and 14 May. All four fire cases shown in Fig. S27 overestimated the PM2.5 on 12 May, potentially due to the model bias in fire emission time and the smoke transport.
The result from Exp_duff (Figs. S24–25) shows that the uncertainty of duff emission does not affect our finding of the different PM2.5 and ozone effects by duff burning. The PM2.5 concentrations change by −11.7 % to 9.7 % near the fire site for App16 and by −38 % to +25 % for Oke07 (Fig. S24a and c). The ozone concentrations change within ± 2 % (Fig. S25). The PM2.5 concentrations change by −4.6 % to +2.3 % in Atlanta, Georgia, for App16 and by −13 % to +40 % in Orlando, Florida, for Oke07 (Fig. S24b and d).
Duff burning emissions have been calculated from the largest wildfires in this century in the moist southeastern US based on our previous field measurements at the site of the Rough Ridge Fire, one of the fires investigated in the study, and atmospheric PM2.5 and ozone concentrations have been simulated using WRF-Chem with the duff burning emissions added to the FINN fire emission inventory. The results indicate that contributions from duff burning to the air pollution are comparable and sometimes more than the burning of above-ground fuels, which supports the previous finding from a study of the Rough Ridge Fire (Zhao et al., 2019). The WRF-Chem simulations of all the fire cases including duff burning show better agreements with the observed PM2.5 surface concentration than the baseline simulations which include only fire emissions from above-ground fuel burning. Thus, regional air quality modeling in the southeastern US can be substantially improved by adding duff burning emissions in the existing fire emission datasets. It is further concluded that the impacts of duff burning on PM2.5 are much more remarkable than those on ozone. The simulation results indicate that the above-ground fuel burning increases regional ozone surface concentrations, but the ozone changes due to duff burning are statistically insignificant.
The importance of duff burning contribution to PM2.5 concentrations suggests an effective approach to improve regional air quality simulations in the other global regions with deep and peat duff accumulations. As described before, current major fire emission inventories, such as GFED and FINN (Wiedinmyer et al., 2011; Giglio et al., 2013; Van Der Werf et al., 2017), do not include enough duff and peat emissions. FINN v1.5 applied the emission factors mainly based on Andreae and Merlet (2001) and Akagi et al. (2011), but the emission factors of duff and peat burning are not included. On the other hand, Tansey et al. (2008) investigated the uncertainties of burned area and satellite fire hotspots over the tropical peatlands, indicating that duff burning in the emission inventories based on satellite data is highly uncertain. This potentially leads to significant underestimation over fire events with duff and peat burning, which further affects the evaluation of the regional air quality and human health impacts (Reid et al., 2016).
One major uncertainty in this study is the amount of duff burned in the Okefenokee fires. Although reports show that during the 2007 Okefenokee extreme drought and fire, 2 feet (61 cm) of duff thickness reduction was observed in some intensively burned areas, potentially due to the combination of burning and deflation of domed duff and peat surfaces, an average duff consumption for simulation is not provided from measurements (Johnson and Schmerfeld, 2016). In the sensitivity runs described in Sect. 3.4, we indicate that this bias has a minimal effect on the major findings of the large PM2.5 impact from duff burning and the different impacts between PM2.5 and ozone. Other uncertainties are the values used in the duff emission calculation, for example, the bulk density of duff mass and the emission factors of different species from duff burning. We used a 50 ± 16 g kg−1 PM2.5 emission factor for duff burns in this study based on fires in North Carolina (Geron and Hays, 2013; Urbanski, 2014), which is closest to the fire sites. It is comparable to some other peat fire measurements in the southeastern US, such as 44 ± 9 g kg−1 from Benner (1977) and 30 ± 20 g kg−1 from McMahon et al. (1980). However, the spatial variability of duff bulk density is large in the southern US, ranging from 39.4 to 103.7 kg m−2 m−1 (Ottmar and Andreu, 2007).
Many evaluation studies have indicated that WRF-Chem is able to provide ground ozone simulations within reasonable biases, less than 20 % for Europe (Mar et al., 2016) and 15 %–30 % for the western, northeastern, and midwestern US (Astitha et al., 2017). However, ozone simulation within plumes is much more complex, depending on many factors such as emissions of ozone precursors, photochemical processes, radiation change and temperature changes due to smoke, and lifetime of smoke, which make simulating ozone from wildfires challenging (Jaffe and Wigder, 2012). Our simulations did not consider the impacts of smoke on radiation, possibly leading to overestimation of ozone production in plume (Selimovic et al., 2020). We conducted a test simulation for the Ofe07 case by including the impacts to evaluate the related uncertainty in ozone simulations. The result shows that missing the aerosol radiation impacts leads to approximately 15 % of ozone overestimation in the fresh plume and 10 % of ozone increase in the aged plume. Further evaluation of ozone simulation in fire plumes is needed. The recent implementations of many field campaigns, especially the Western wildfire Experiment for Cloud chemistry, Aerosol absorption and Nitrogen (WE-CAN) (https://www2.acom.ucar.edu/campaigns/we-can, last access: 3 December 2021), are expected to help fill the evaluation and simulation gaps.
The findings from this study on the air quality impacts of wildfires in the southeastern US are valuable for future studies and can serve as guidance for other global regions with duff and peat burning, such as northeastern China (Jiang et al., 2008) and the United Kingdom and Ireland (Davies et al., 2013). In the southeastern US, the general high humidity provides good conditions for the duff layer to accumulate, which serves as a large potential fuel source during wildfires under droughts. The peatlands in boreal forests (e.g., the boreal forest in Canada and northern Eurasia) and tropical forests (e.g., the peatland in Indonesia) are also vulnerable to fire. Although the duff and peat layer and the burning types vary with ecosystems, the carbon loss from duff and peat fire and the different emission factors between the below-ground fuel and above-ground fuel are common issues (Page et al., 2002; Turetsky et al., 2015), which need to be addressed as what was conducted for the southeastern US in this study. The PM2.5 emission factor used in this study is higher than the measurements in the other regions, such as 20.6 g kg−1 estimated in the US prescribed burning (Yokelson et al., 2013), 8–58 g kg−1 measured in fires in Southeast Asia (Roulston et al., 2018), and 18.9 g kg−1 from global estimation summarized by Andreae (2019). This difference suggests that the impacts of duff burning during the flaming phase on PM2.5 may be more remarkable in the southeastern US than in many other world regions.
Duff consumption in different fire cases is highly variable, making it difficult to conduct practical operational prediction of duff consumption and the air quality impacts. A number of efforts could be made towards a solution. One is to map spatial distributions of duff. Fuel data such as the Fuel Characteristics Classification System (Prichard et al., 2019) could be expanded to include more complete duff information. The data need to be dynamical to reflect not only duff accumulation over time, but also disturbance due to wildland fires. Another effort is to conduct more field measurements of duff consumption by both wildfires and prescribed fires, such as those by Zhao et al. (2019) and the Fire and Smoke Model Evaluation Experiment (FASMEE) (Prichard et al., 2019). The measurements are essential for developing tools for duff consumption and air quality impact modeling (Liu et al., 2019). Duff burning by flaming fires occurs mainly under persistent drought conditions. Thus, duff fuel moisture is a critically important parameter to predict whether and how much duff will be consumed by a wildfire. There are fire danger rating systems such as the Canadian Forest Fire Weather Index (FWI) system (Stocks et al., 1989) and FARSITE (Finney, 1998) that estimate duff fuel moisture. They are empirically based rather than physics-based dynamical tools. Improvements to these tools and the development of dynamical tools, including those that relate duff fuel moisture to drought indices such as the Keetch–Byram drought index (KBDI) (Keetch and Byram, 1968), are needed. In this study, we focused more on duff flaming than smoldering because of the relatively weak ability to transport smoldering and the limitation of WRF-Chem in processing smoldering well. We are planning to dig into the duff smoldering phase more in a separate study using a specific smoke model such as the PB-P model (Liu et al., 2018).
Under climate change due to the increasing atmospheric greenhouse gases, duff burning becomes more important for PM simulation and the air quality impacts. Duff burning is likely to become more active under the changing climate. The increasing frequency of extreme droughts has been observed in the US (Mazdiyasni and AghaKouchak, 2015; Clark et al., 2016) and around the world and is projected for the future climate scenario (Masih et al., 2014; Longo et al., 2018; Grillakis, 2019). Therefore, fire events ignited on a generally wet land suffering from extreme drought are likely to happen more often in the future, and the duff and peatland that do not burn currently (e.g., the Amazon rainforests and Africa rainforests, Bonal et al., 2016) may become burnable under future extreme drought. The importance of duff burning is further strengthened by climate–ecosystem interactions. With the increasing mean temperature and CO2 concentrations, the duff layer accumulation is potentially benefitting from the acceleration of vegetation growth (Qian et al., 2010; Huang et al., 2018; Lawal et al., 2019; Bai et al., 2020) and soil organic carbon decomposition (Fierer et al., 2006; Karhu et al., 2014). Besides, tropical peatland fires are sensitive to El Niño–Southern Oscillation (ENSO)-induced climate variability, indicating that it is necessary to evaluate the fire–climate interactions in order to better understand the duff and peat burning (Field et al., 2009; Tosca et al., 2011).
The EPA AQS measurement data of ozone and PM2.5 are available at the EPA website (https://www.epa.gov/outdoor-air-quality-data, USEPA, 2020). The FINNv1.5 fire emission inventory is available at the NCAR ACOM website (https://bai.acom.ucar.edu/Data/fire/, NCAR, 2021a). The MOZART simulation results used for simulation of initial and boundary conditions are available at https://www.acom.ucar.edu/wrf-chem/mozart.shtml, NCAR, 2021b). The WRF-Chem model results are available from the corresponding author upon request.
The supplement related to this article is available online at: https://doi.org/10.5194/acp-22-597-2022-supplement.
YL provided the original idea. AZ and YL designed the model experiments. AZ carried out the model experiments, analyzed the observation and simulation data, and prepared the manuscript. YL, SG, and MDW contributed to the methodology and manuscript improvement.
The contact author has declared that neither they nor their co-authors have any competing interests.
Publisher's note: Copernicus Publications remains neutral with regard to jurisdictional claims in published maps and institutional affiliations.
This study was supported by an agreement between the USDA Forest Service and the Oak Ridge Institute for Science and Education (ORISE).
This research was supported by USDA Forest Service Southern Research Station (SRS-ORISE grant).
This paper was edited by Pedro Jimenez-Guerrero and reviewed by two anonymous referees.
Abatzoglou, J. T. and Williams, A. P.: Impact of anthropogenic climate change on wildfire across western US forests, P. Natl. Acad. Sci. USA, 113, 11770–11775, https://doi.org/10.1073/pnas.1607171113, 2016.
Akagi, S. K., Yokelson, R. J., Wiedinmyer, C., Alvarado, M. J., Reid, J. S., Karl, T., Crounse, J. D., and Wennberg, P. O.: Emission factors for open and domestic biomass burning for use in atmospheric models, Atmos. Chem. Phys., 11, 4039–4072, https://doi.org/10.5194/acp-11-4039-2011, 2011.
Alvarado, M. J., Logan, J. A., Mao, J., Apel, E., Riemer, D., Blake, D., Cohen, R. C., Min, K.-E., Perring, A. E., Browne, E. C., Wooldridge, P. J., Diskin, G. S., Sachse, G. W., Fuelberg, H., Sessions, W. R., Harrigan, D. L., Huey, G., Liao, J., Case-Hanks, A., Jimenez, J. L., Cubison, M. J., Vay, S. A., Weinheimer, A. J., Knapp, D. J., Montzka, D. D., Flocke, F. M., Pollack, I. B., Wennberg, P. O., Kurten, A., Crounse, J., Clair, J. M. St., Wisthaler, A., Mikoviny, T., Yantosca, R. M., Carouge, C. C., and Le Sager, P.: Nitrogen oxides and PAN in plumes from boreal fires during ARCTAS-B and their impact on ozone: an integrated analysis of aircraft and satellite observations, Atmos. Chem. Phys., 10, 9739–9760, https://doi.org/10.5194/acp-10-9739-2010, 2010.
Amiridis, V., Zerefos, C., Kazadzis, S., Gerasopoulos, E., Eleftheratos, K., Vrekoussis, M., Stohl, A., Mamouri, R.-E., Kokkalis, P., and Papayannis, A.: Impact of the 2009 Attica wild fires on the air quality in urban Athens, Atmos. Environ., 46, 536–544, https://doi.org/10.1016/j.atmosenv.2011.07.056, 2012.
Andreae, M. O.: Emission of trace gases and aerosols from biomass burning – an updated assessment, Atmos. Chem. Phys., 19, 8523–8546, https://doi.org/10.5194/acp-19-8523-2019, 2019.
Andreae, M. O. and Merlet, P.: Emission of trace gases and aerosols from biomass burning, Global Biogeochem. Cy., 15, 955–966, https://doi.org/10.1029/2000GB001382, 2001.
Andreae, M. O. and Rosenfeld, D.: Aerosol–cloud–precipitation interactions, Part 1. The nature and sources of cloud-active aerosols, Earth-Sci. Rev., 89, 13–41, https://doi.org/10.1016/j.earscirev.2008.03.001, 2008.
Astitha, M., Luo, H., Rao, S. T., Hogrefe, C., Mathur, R., and Kumar, N.: Dynamic evaluation of two decades of WRF-CMAQ ozone simulations over the contiguous United States, Atmos. Environ., 164, 102–116, 2017.
Bachelet, D., Neilson, R. P., Lenihan, J. M., and Drapek, R. J.: Climate change effects on vegetation distribution and carbon budget in the United States, Ecosystems, 4, 164–185, https://doi.org/10.1007/s10021-001-0002-7, 2001.
Bai, Y., Guo, C., Degen, A. A., Ahmad, A. A., Wang, W., Zhang, T., Li, W., Ma, L., Huang, M., and Zeng, H.: Climate warming benefits alpine vegetation growth in Three-River Headwater Region, China, Sci. Total Environ., 742, 140574, https://doi.org/10.1016/j.scitotenv.2020.140574, 2020.
Ballhorn, U., Siegert, F., Mason, M., and Limin, S.: Derivation of burn scar depths and estimation of carbon emissions with LIDAR in Indonesian peatlands, P. Natl. Acad. Sci. USA, 106, 21213–21218, https://doi.org/10.1073/pnas.0906457106, 2009.
Barbero, R., Abatzoglou, J. T., Larkin, N. K., Kolden, C. A., and Stocks, B.: Climate change presents increased potential for very large fires in the contiguous United States, Int. J. Wildland Fire, 24, 892–899, https://doi.org/10.1071/WF15083, 2015.
Barnard, J. C., Fast, J. D., Paredes-Miranda, G., Arnott, W. P., and Laskin, A.: Technical Note: Evaluation of the WRF-Chem ”Aerosol Chemical to Aerosol Optical Properties” Module using data from the MILAGRO campaign, Atmos. Chem. Phys., 10, 7325–7340, https://doi.org/10.5194/acp-10-7325-2010, 2010.
Belda, M., Holtanová, E., Halenka, T., and Kalvová, J.: Climate classification revisited: from Köppen to Trewartha, Clim. Res., 59, 1–13, https://doi.org/10.3354/cr01204, 2014.
Benner, W. H.: Photochemical reactions of forest fire combustion products, University of Florida, available at http://ufdc.ufl.edu/AA00027183/00001 (last access: 10 January 2022), 1977
Black, R. R., Aurell, J., Holder, A., George, I. J., Gullett, B. K., Hays, M. D., Geron, C. D., and Tabor, D.: Characterization of gas and particle emissions from laboratory burns of peat, Atmos. Environ., 132, 49–57, https://doi.org/10.1016/j.atmosenv.2016.02.024, 2016.
Blood, A., Starr, G., Escobedo, F., Chappelka, A., and Staudhammer, C.: How do urban forests compare? Tree diversity in urban and periurban forests of the southeastern US, Forests, 7, 120, https://doi.org/10.3390/f7060120, 2016.
Bo, M., Mercalli, L., Pognant, F., Berro, D. C., and Clerico, M.: Urban air pollution, climate change and wildfires: The case study of an extended forest fire episode in northern Italy favoured by drought and warm weather conditions, Energ. Reports, 6, 781–786, https://doi.org/10.1016/j.egyr.2019.11.002, 2020.
Bonal, D., Burban, B., Stahl, C., Wagner, F., and Hérault, B.: The response of tropical rainforests to drought – lessons from recent research and future prospects, Ann. Forest Sci., 73, 27–44, https://doi.org/10.1007/s13595-015-0522-5, 2016.
Bond, W. J., Woodward, F. I., and Midgley, G. F.: The global distribution of ecosystems in a world without fire, New Phytol., 165, 525–538, https://doi.org/10.1111/j.1469-8137.2004.01252.x, 2005.
Borren, W., Bleuten, W., and Lapshina, E. D.: Holocene peat and carbon accumulation rates in the southern taiga of western Siberia, Quaternary Res., 61, 42–51, https://doi.org/10.1016/j.yqres.2003.09.002, 2004.
Bowman, D. M., Balch, J. K., Artaxo, P., Bond, W. J., Carlson, J. M., Cochrane, M. A., D'Antonio, C. M., DeFries, R. S., Doyle, J. C., and Harrison, S. P.: Fire in the Earth system, Science, 324, 481–484, https://doi.org/10.1126/science.1163886, 2009.
Brey, S. J. and Fischer, E. V.: Smoke in the city: how often and where does smoke impact summertime ozone in the United States?, Environ. Sci. Technol., 50, 1288–1294, https://doi.org/10.1021/acs.est.5b05218, 2016.
Brown, T., Leach, S., Wachter, B., and Gardunio, B.: The Extreme 2018 Northern California Fire Season, B. Am. Meteorol. Soc., 101, S1–S4, https://doi.org/10.1175/BAMS-D-19-0275.1, 2020.
Burling, I. R., Yokelson, R. J., Griffith, D. W. T., Johnson, T. J., Veres, P., Roberts, J. M., Warneke, C., Urbanski, S. P., Reardon, J., Weise, D. R., Hao, W. M., and de Gouw, J.: Laboratory measurements of trace gas emissions from biomass burning of fuel types from the southeastern and southwestern United States, Atmos. Chem. Phys., 10, 11115–11130, https://doi.org/10.5194/acp-10-11115-2010, 2010.
Chin, M., Ginoux, P., Kinne, S., Torres, O., Holben, B. N., Duncan, B. N., Martin, R. V., Logan, J. A., Higurashi, A., and Nakajima, T.: Tropospheric aerosol optical thickness from the GOCART model and comparisons with satellite and Sun photometer measurements, J. Atmos. Sci., 59, 461–483, https://doi.org/10.1175/1520-0469(2002)059<0461:TAOTFT>2.0.CO;2, 2002.
Clark, J. S., Iverson, L., Woodall, C. W., Allen, C. D., Bell, D. M., Bragg, D. C., D'Amato, A. W., Davis, F. W., Hersh, M. H., and Ibanez, I.: The impacts of increasing drought on forest dynamics, structure, and biodiversity in the United States, Glob. Change Biol., 22, 2329–2352, https://doi.org/10.1111/gcb.13160, 2016.
Clements, H. B. and McMahon, C. K.: Nitrogen oxides from burning forest fuels examined by thermogravimetry and evolved gas analysis, Thermochimica Acta, 35, 133–139, https://doi.org/10.1016/0040-6031(80)87187-5, 1980.
Crutzen, P. J. and Andreae, M. O.: Biomass burning in the tropics: Impact on atmospheric chemistry and biogeochemical cycles, Science, 250, 1669–1678, https://doi.org/10.1126/science.250.4988.1669, 1990.
Cuchiara, G. C., Rappenglück, B., Rubio, M. A., Lissi, E., Gramsch, E., and Garreaud, R. D.: Modeling study of biomass burning plumes and their impact on urban air quality; a case study of Santiago de Chile, Atmos. Environ., 166, 79–91, https://doi.org/10.1016/j.atmosenv.2017.07.002, 2017.
Damian, V., Sandu, A., Damian, M., Potra, F., and Carmichael, G. R.: The kinetic preprocessor KPP-a software environment for solving chemical kinetics, Comput. Chem. Eng., 26, 1567–1579, https://doi.org/10.1016/S0098-1354(02)00128-X, 2002.
Darmenov, A. and da Silva, A.: The quick fire emissions dataset (QFED) – documentation of versions 2.1, 2.2 and 2.4, NASA Technical Report Series on Global Modeling and Data Assimilation, NASA TM-2013-104606, 32, 183, available at: https://ntrs.nasa.gov/citations/20180005253 (last access: 5 November 2021), 2013.
Davies, G. M., Gray, A., Rein, G., and Legg, C. J.: Peat consumption and carbon loss due to smouldering wildfire in a temperate peatland, Forest Ecol. Manage., 308, 169–177, https://doi.org/10.1016/j.foreco.2013.07.051, 2013.
Dennison, P. E., Brewer, S. C., Arnold, J. D., and Moritz, M. A.: Large wildfire trends in the western United States, 1984–2011, Geophys. Res. Lett., 41, 2928–2933, https://doi.org/10.1002/2014GL059576, 2014.
Diehl, T., Heil, A., Chin, M., Pan, X., Streets, D., Schultz, M., and Kinne, S.: Anthropogenic, biomass burning, and volcanic emissions of black carbon, organic carbon, and SO2 from 1980 to 2010 for hindcast model experiments, Atmos. Chem. Phys. Discuss., 12, 24895–24954, https://doi.org/10.5194/acpd-12-24895-2012, 2012.
Eidenshink, J., Schwind, B., Brewer, K., Zhu, Z.-L., Quayle, B., and Howard, S.: A project for monitoring trends in burn severity, Fire Ecol., 3, 3–21, 2007.
Ellison, L., Ichoku, C., Zhang, F., and Wang, J.: Building the Fire Energetics and Emissions Research (FEER) Smoke Emissions Inventory Version 1.0, available at: https://core.ac.uk/download/pdf/42724821.pdf (last access: 5 November 2021), 2014.
Emmons, L. K., Walters, S., Hess, P. G., Lamarque, J.-F., Pfister, G. G., Fillmore, D., Granier, C., Guenther, A., Kinnison, D., Laepple, T., Orlando, J., Tie, X., Tyndall, G., Wiedinmyer, C., Baughcum, S. L., and Kloster, S.: Description and evaluation of the Model for Ozone and Related chemical Tracers, version 4 (MOZART-4), Geosci. Model Dev., 3, 43–67, https://doi.org/10.5194/gmd-3-43-2010, 2010.
Fang, T., Verma, V., Bates, J. T., Abrams, J., Klein, M., Strickland, M. J., Sarnat, S. E., Chang, H. H., Mulholland, J. A., Tolbert, P. E., Russell, A. G., and Weber, R. J.: Oxidative potential of ambient water-soluble PM2.5 in the southeastern United States: contrasts in sources and health associations between ascorbic acid (AA) and dithiothreitol (DTT) assays, Atmos. Chem. Phys., 16, 3865–3879, https://doi.org/10.5194/acp-16-3865-2016, 2016.
Fann, N., Alman, B., Broome, R. A., Morgan, G. G., Johnston, F. H., Pouliot, G., and Rappold, A. G.: The health impacts and economic value of wildland fire episodes in the US: 2008–2012, Sci. Total Environ., 610, 802–809, https://doi.org/10.1016/j.scitotenv.2017.08.024, 2018.
Fast, J. D., Gustafson Jr, W. I., Easter, R. C., Zaveri, R. A., Barnard, J. C., Chapman, E. G., Grell, G. A., and Peckham, S. E.: Evolution of ozone, particulates, and aerosol direct radiative forcing in the vicinity of Houston using a fully coupled meteorology-chemistry-aerosol model, J. Geophys. Res.-Atmos., 111, D21305, https://doi.org/10.1029/2005JD006721, 2006.
Field, R. D., Van Der Werf, G. R., and Shen, S. S.: Human amplification of drought-induced biomass burning in Indonesia since 1960, Nat. Geosci., 2, 185–188, https://doi.org/10.1038/ngeo443, 2009.
Fierer, N., Colman, B. P., Schimel, J. P., and Jackson, R. B.: Predicting the temperature dependence of microbial respiration in soil: A continental-scale analysis, Global Biogeochem. Cy., 20, GB3026, https://doi.org/10.1029/2005GB002644, 2006.
Finco, M., Quayle, B., Zhang, Y., Lecker, J., Megown, K. A., and Brewer, C. K.: Monitoring trends and burn severity (MTBS): monitoring wildfire activity for the past quarter century using Landsat data, in: Moving from status to trends: Forest Inventory and Analysis (FIA) symposium 2012, composed by: Morin, R. S. and Liknes, G. C., 4–6 December 2012; Baltimore, MD. Gen. Tech. Rep. NRS-P-105, Newtown Square, PA, US Department of Agriculture, Forest Service, Northern Research Station, [CD-ROM], 222–228, 2012.
Finney, M. A.: FARSITE, Fire Area Simulator–model development and evaluation, 4, US Department of Agriculture, Forest Service, Rocky Mountain Research Station, available at: https://www.fs.fed.us/rm/pubs/rmrs_rp004.pdf (last access: 10 January 2022), 2004.
Fire Behavior Assessment Team: Big Turnaround and Georgia Bay Complexes Fire Behavior Assessment Report, available at: http://citeseerx.ist.psu.edu/viewdoc/download?doi=10.1.1.649.9331&rep=rep1&type=pdf (last access: 5 November 2021), 2007.
FNL NCEP: NCEP FNL Operational Model Global Tropospheric Analyses, continuing from July 1999, Research Data Archive at the National Center for Atmospheric Research, Computational and Information Systems Laboratory, Boulder, CO, USA, https://doi.org/10.5065/D6M043C6, 2000.
Frandsen, W. H.: The influence of moisture and mineral soil on the combustion limits of smoldering forest duff, Can. J. Forest Res., 17, 1540–1544, https://doi.org/10.1139/x87-236, 1987.
Freitas, S. R., Longo, K. M., Chatfield, R., Latham, D., Silva Dias, M. A. F., Andreae, M. O., Prins, E., Santos, J. C., Gielow, R., and Carvalho Jr., J. A.: Including the sub-grid scale plume rise of vegetation fires in low resolution atmospheric transport models, Atmos. Chem. Phys., 7, 3385–3398, https://doi.org/10.5194/acp-7-3385-2007, 2007.
Frolking, S., Roulet, N. T., Moore, T. R., Richard, P. J., Lavoie, M., and Muller, S. D.: Modeling northern peatland decomposition and peat accumulation, Ecosystems, 4, 479–498, https://doi.org/10.1007/s10021-001-0105-1, 2001.
Gaffen, D. J. and Ross, R. J.: Climatology and trends of US surface humidity and temperature, J. Climate, 12, 811–828, https://doi.org/10.1175/1520-0442(1999)012<0811:CATOUS>2.0.CO;2, 1999.
Garcia-Menendez, F., Hu, Y., and Odman, M. T.: Simulating smoke transport from wildland fires with a regional-scale air quality model: Sensitivity to uncertain wind fields, J. Geophys. Res.-Atmos., 118, 6493–6504, https://doi.org/10.1002/jgrd.50524, 2013.
Geron, C. and Hays, M.: Air emissions from organic soil burning on the coastal plain of North Carolina, Atmos. Environ., 64, 192–199, https://doi.org/10.1016/j.atmosenv.2012.09.065, 2013.
Giglio, L., Randerson, J. T., and Werf, G. R.: Analysis of daily, monthly, and annual burned area using the fourth-generation global fire emissions database (GFED4), J. Geophys. Res.-Biogeo., 118, 317–328, https://doi.org/10.1002/jgrg.20042, 2013.
Ginoux, P., Chin, M., Tegen, I., Prospero, J. M., Holben, B., Dubovik, O., and Lin, S. J.: Sources and distributions of dust aerosols simulated with the GOCART model, J. Geophys. Res.-Atmos., 106, 20255–20273, https://doi.org/10.1029/2000JD000053, 2001.
Goode, J. G., Yokelson, R. J., Ward, D. E., Susott, R. A., Babbitt, R. E., Davies, M. A., and Hao, W. M.: Measurements of excess O3, CO2, CO, CH4, C2H4, C2H2, HCN, NO, NH3, HCOOH, CH3COOH, HCHO, and CH3OH in 1997 Alaskan biomass burning plumes by airborne Fourier transform infrared spectroscopy (AFTIR), J. Geophys. Res.-Atmos., 105, 22147–22166, https://doi.org/10.1029/2000JD900287, 2000.
Goodrick, S. L., Achtemeier, G. L., Larkin, N. K., Liu, Y., and Strand, T. M.: Modelling smoke transport from wildland fires: a review, Int. J. Wildland Fire, 22, 83–94, https://doi.org/10.1071/WF11116, 2013.
Gorham, E.: Northern peatlands: role in the carbon cycle and probable responses to climatic warming, Ecol. Appl., 1, 182–195, https://doi.org/10.2307/1941811, 1991.
Granier, C., Bessagnet, B., Bond, T., D'Angiola, A., van Der Gon, H. D., Frost, G. J., Heil, A., Kaiser, J. W., Kinne, S., and Klimont, Z.: Evolution of anthropogenic and biomass burning emissions of air pollutants at global and regional scales during the 1980–2010 period, Climatic Change, 109, 163–190, https://doi.org/10.1007/s10584-011-0154-1, 2011.
Grell, G., Freitas, S. R., Stuefer, M., and Fast, J.: Inclusion of biomass burning in WRF-Chem: impact of wildfires on weather forecasts, Atmos. Chem. Phys., 11, 5289–5303, https://doi.org/10.5194/acp-11-5289-2011, 2011.
Grell, G. A., Peckham, S. E., Schmitz, R., McKeen, S. A., Frost, G., Skamarock, W. C., and Eder, B.: Fully coupled “online” chemistry within the WRF model, Atmos. Environ., 39, 6957–6975, https://doi.org/10.1016/j.atmosenv.2005.04.027, 2005.
Grillakis, M. G.: Increase in severe and extreme soil moisture droughts for Europe under climate change, Sci. Total Environ., 660, 1245–1255, https://doi.org/10.1016/j.scitotenv.2019.01.001, 2019.
Guan, S., Wong, D. C., Gao, Y., Zhang, T., and Pouliot, G.: Impact of wildfire on particulate matter in the southeastern United States in November 2016, Sci. Total Envirom., 724, 138354, https://doi.org/10.1016/j.scitotenv.2020.138354, 2020.
Guenther, A., Karl, T., Harley, P., Wiedinmyer, C., Palmer, P. I., and Geron, C.: Estimates of global terrestrial isoprene emissions using MEGAN (Model of Emissions of Gases and Aerosols from Nature), Atmos. Chem. Phys., 6, 3181–3210, https://doi.org/10.5194/acp-6-3181-2006, 2006.
Hao, W. M. and Babbitt, R. E.: Smoke production from residual combustion. Final Report 98-1-9-01, Joint Fire Science Program, 25 pp., available at: http://www.firescience.gov/JFSP_advanced_search.cfm (last access: 13 January 2022), 2007.
He, C., Miljevic, B., Crilley, L. R., Surawski, N. C., Bartsch, J., Salimi, F., Uhde, E., Schnelle-Kreis, J., Orasche, J., and Ristovski, Z.: Characterisation of the impact of open biomass burning on urban air quality in Brisbane, Australia, Environ. Int., 91, 230–242, https://doi.org/10.1016/j.envint.2016.02.030, 2016.
Hille, M. G. and Stephens, S. L.: Mixed conifer forest duff consumption during prescribed fires: tree crown impacts, Forest Sci., 51, 417–424, https://doi.org/10.1093/forestscience/51.5.417, 2005.
Hodzic, A., Madronich, S., Bohn, B., Massie, S., Menut, L., and Wiedinmyer, C.: Wildfire particulate matter in Europe during summer 2003: meso-scale modeling of smoke emissions, transport and radiative effects, Atmos. Chem. Phys., 7, 4043–4064, https://doi.org/10.5194/acp-7-4043-2007, 2007.
Hoelzemann, J. J.: Global Wildland Fire Emission Model (GWEM): Evaluating the use of global area burnt satellite data, J. Geophys. Res., 109, D14S04, https://doi.org/10.1029/2003JD003666, 2004.
Hu, Y., Fernandez-Anez, N., Smith, T. E., and Rein, G.: Review of emissions from smouldering peat fires and their contribution to regional haze episodes, International J. Wildland Fire, 27, 293–312, https://doi.org/10.1071/WF17084, 2018.
Huang, K., Xia, J., Wang, Y., Ahlström, A., Chen, J., Cook, R. B., Cui, E., Fang, Y., Fisher, J. B., and Huntzinger, D. N.: Enhanced peak growth of global vegetation and its key mechanisms, Nat. Ecol. Evol., 2, 1897–1905, https://doi.org/10.1038/s41559-018-0714-0, 2018.
Iacono, M. J., Delamere, J. S., Mlawer, E. J., Shephard, M. W., Clough, S. A., and Collins, W. D.: Radiative forcing by long-lived greenhouse gases: Calculations with the AER radiative transfer models, J. Geophys. Res.-Atmos., 113, D13103, https://doi.org/10.1029/2008JD009944, 2008.
Jaffe, D., Chand, D., Hafner, W., Westerling, A., and Spracklen, D.: Influence of fires on O3 concentrations in the western US, Environ. Sci. Technol., 42, 5885–5891, https://doi.org/10.1021/es800084k, 2008.
Jaffe, D. A. and Wigder, N. L.: Ozone production from wildfires: A critical review, Atmos. Environ., 51, 1–10, https://doi.org/10.1016/j.atmosenv.2011.11.063, 2012.
Jen, C. N., Hatch, L. E., Selimovic, V., Yokelson, R. J., Weber, R., Fernandez, A. E., Kreisberg, N. M., Barsanti, K. C., and Goldstein, A. H.: Speciated and total emission factors of particulate organics from burning western US wildland fuels and their dependence on combustion efficiency, Atmos. Chem. Phys., 19, 1013–1026, https://doi.org/10.5194/acp-19-1013-2019, 2019.
Jiang, W., Leroy, S. A., Ogle, N., Chu, G., Wang, L., and Liu, J.: Natural and anthropogenic forest fires recorded in the Holocene pollen record from a Jinchuan peat bog, northeastern China, Palaeogeogr. Palaeoclim., 261, 47–57, https://doi.org/10.1016/j.palaeo.2008.01.007, 2008.
Jiang, Y., Yang, X.-Q., Liu, X., Qian, Y., Zhang, K., Wang, M., Li, F., Wang, Y., and Lu, Z.: Impacts of wildfire aerosols on global energy budget and climate: The role of climate feedbacks, J. Climate, 33, 3351–3366, https://doi.org/10.1175/JCLI-D-19-0572.1, 2020.
Johnson, K. A. and Schmerfeld, J.: The united states'national wildlife refuge system: a natural laboratory for studying peatland carbon storage, ecosystem services, and impacts of management, 15th international peat congress 2016, available at: https://peatlands.org/assets/uploads/2019/06/ipc16p696-700a253johnson.schmerfeld.pdf (last access: 5 November 2021), 2016.
Jolly, W. M., Cochrane, M. A., Freeborn, P. H., Holden, Z. A., Brown, T. J., Williamson, G. J., and Bowman, D. M.: Climate-induced variations in global wildfire danger from 1979 to 2013, Nat. Commun., 6, 7537, https://doi.org/10.1038/ncomms8537, 2015.
Kaiser, J., Flemming, J., Schultz, M., Suttie, M., and Wooster, M.: The MACC Global Fire Assimilation System: First Emission Products (GFASvO), ECMWF, available at: https://www.ecmwf.int/sites/default/files/elibrary/2009/10373-macc-global-fire-assimilation-system-first-emission-products-gfasv0.pdf (last access: 10 January 2022), 2009.
Kaiser, J. W., Heil, A., Andreae, M. O., Benedetti, A., Chubarova, N., Jones, L., Morcrette, J.-J., Razinger, M., Schultz, M. G., Suttie, M., and van der Werf, G. R.: Biomass burning emissions estimated with a global fire assimilation system based on observed fire radiative power, Biogeosciences, 9, 527–554, https://doi.org/10.5194/bg-9-527-2012, 2012.
Karhu, K., Auffret, M. D., Dungait, J. A., Hopkins, D. W., Prosser, J. I., Singh, B. K., Subke, J.-A., Wookey, P. A., Ågren, G. I., and Sebastia, M.-T.: Temperature sensitivity of soil respiration rates enhanced by microbial community response, Nature, 513, 81–84, https://doi.org/10.1038/nature13604, 2014.
Keetch, J. J. and Byram, G. M.: A drought index for forest fire control, Res. Pap. SE-38. Asheville, NC, U.S. Department of Agriculture, Forest Service, Southeastern Forest Experiment Station, 35 pp., available at: https://www.fs.usda.gov/treesearch/pubs/40 (last access: 10 January 2022), 1968.
Kiely, L., Spracklen, D. V., Wiedinmyer, C., Conibear, L., Reddington, C. L., Archer-Nicholls, S., Lowe, D., Arnold, S. R., Knote, C., Khan, M. F., Latif, M. T., Kuwata, M., Budisulistiorini, S. H., and Syaufina, L.: New estimate of particulate emissions from Indonesian peat fires in 2015, Atmos. Chem. Phys., 19, 11105–11121, https://doi.org/10.5194/acp-19-11105-2019, 2019.
Kiely, L., Spracklen, D. V., Wiedinmyer, C., Conibear, L. A., Reddington, C. L., Arnold, S. R., Knote, C., Khan, M. F., Latif, M. T., and Syaufina, L.: Air quality and health impacts of vegetation and peat fires in Equatorial Asia during 2004–2015, Environ. Res. Lett., 15, 094054, https://doi.org/10.1088/1748-9326/ab9a6c, 2020.
Konrad, C. E. and Knox, P.: The Southeastern Drought and wildfire of 2016, available at: http://www.sercc.com/NIDISDroughtAssessmentFINAL.pdf (last access: 29 October 2020), 2017.
Kunzli, N., Avol, E., Wu, J., Gauderman, W. J., Rappaport, E., Millstein, J., Bennion, J., McConnell, R., Gilliland, F. D., and Berhane, K.: Health effects of the 2003 Southern California wildfires on children, Am. J. Resp. Crit. Care, 174, 1221–1228, https://doi.org/10.1164/rccm.200604-519OC, 2006.
Lawal, S., Lennard, C., and Hewitson, B.: Response of southern African vegetation to climate change at 1.5 and 2.0∘ global warming above the pre-industrial level, Climate Services, 16, 100134, https://doi.org/10.1016/j.cliser.2019.100134, 2019.
Li, W., Li, L., Fu, R., Deng, Y., and Wang, H.: Changes to the North Atlantic subtropical high and its role in the intensification of summer rainfall variability in the southeastern United States, J. Climate, 24, 1499–1506, https://doi.org/10.1175/2010JCLI3829.1, 2011.
Li, X. and Rappenglueck, B.: A study of model nighttime ozone bias in air quality modeling, Atmos. Environ., 195, 210–228, https://doi.org/10.1016/j.atmosenv.2018.09.046, 2018.
Li, Y., Tong, D. Q., Ngan, F., Cohen, M. D., Stein, A. F., Kondragunta, S., Zhang, X., Ichoku, C., Hyer, E. J., and Kahn, R. A.: Ensemble PM2.5 forecasting during the 2018 camp fire event using the HYSPLIT transport and dispersion model, J. Geophys. Res.-Atmos., 125, e2020JD032768, https://doi.org/10.1029/2020JD032768, 2020.
Liu, J., Lin, P., Laskin, A., Laskin, J., Kathmann, S. M., Wise, M., Caylor, R., Imholt, F., Selimovic, V., and Shilling, J. E.: Optical properties and aging of light-absorbing secondary organic aerosol, Atmos. Chem. Phys., 16, 12815–12827, https://doi.org/10.5194/acp-16-12815-2016, 2016.
Liu, T., Mickley, L. J., Marlier, M. E., DeFries, R. S., Khan, M. F., Latif, M. T., and Karambelas, A.: Diagnosing spatial biases and uncertainties in global fire emissions inventories: Indonesia as regional case study, Remote Sens. Environ., 237, 111557, https://doi.org/10.1016/j.rse.2019.111557, 2020.
Liu, Y., Goodrick, S., and Heilman, W.: Wildland fire emissions, carbon, and climate: Wildfire–climate interactions, Forest Ecol. Manage., 317, 80–96, https://doi.org/10.1016/j.foreco.2013.02.020, 2014.
Liu, Y., Kochanski, A., Baker, K. R., Mell, W., Linn, R., Paugam, R., Mandel, J., Fournier, A., Jenkins, M. A., and Goodrick, S.: Fire behaviour and smoke modelling: model improvement and measurement needs for next-generation smoke research and forecasting systems, Int. J. Wildland Fire, 28, 570–588, 2019.
Liu, Y.-Q., Goodrick, S., and Achtemeier, G.: The Weather Conditions for Desired Smoke Plumes at a FASMEE Burn Site, Atmosphere, 9, 259, https://doi.org/10.3390/atmos9070259, 2018.
Longo, M., KNOx, R. G., Levine, N. M., Alves, L. F., Bonal, D., Camargo, P. B., Fitzjarrald, D. R., Hayek, M. N., Restrepo-Coupe, N., and Saleska, S. R.: Ecosystem heterogeneity and diversity mitigate Amazon forest resilience to frequent extreme droughts, New Phytol., 219, 914–931, https://doi.org/10.1111/nph.15185, 2018.
Lu, X., Zhang, L., Yue, X., Zhang, J., Jaffe, D. A., Stohl, A., Zhao, Y., and Shao, J.: Wildfire influences on the variability and trend of summer surface ozone in the mountainous western United States, Atmos. Chem. Phys., 16, 14687–14702, https://doi.org/10.5194/acp-16-14687-2016, 2016.
Lu, Z. and Sokolik, I. N.: Examining the Impact of Smoke on Frontal Clouds and Precipitation During the 2002 Yakutsk Wildfires Using the WRF-Chem-SMOKE Model and Satellite Data, J. Geophys. Res.-Atmos., 122, 12765–712785, https://doi.org/10.1002/2017JD027001, 2017.
Madronich, S.: Photodissociation in the atmosphere: 1. Actinic flux and the effects of ground reflections and clouds, J. Geophys. Res.-Atmos., 92, 9740–9752, https://doi.org/10.1029/JD092iD08p09740, 1987.
Mallia, D., Lin, J., Urbanski, S., Ehleringer, J., and Nehrkorn, T.: Impacts of upwind wildfire emissions on CO, CO2, and PM2.5 concentrations in Salt Lake City, Utah, J. Geophys. Res.-Atmos., 120, 147–166, https://doi.org/10.1002/2014JD022472, 2015.
Mar, K. A., Ojha, N., Pozzer, A., and Butler, T. M.: Ozone air quality simulations with WRF-Chem (v3.5.1) over Europe: model evaluation and chemical mechanism comparison, Geosci. Model Dev., 9, 3699–3728, https://doi.org/10.5194/gmd-9-3699-2016, 2016.
Masih, I., Maskey, S., Mussá, F. E. F., and Trambauer, P.: A review of droughts on the African continent: a geospatial and long-term perspective, Hydrol. Earth Syst. Sci., 18, 3635–3649, https://doi.org/10.5194/hess-18-3635-2014, 2014.
Mass, C. F. and Ovens, D.: The Northern California wildfires of 8–9 October 2017: The role of a major downslope wind event, B. Am. Meteorol. Soc., 100, 235–256, https://doi.org/10.1175/BAMS-D-18-0037.1, 2019.
Matz, C. J., Egyed, M., Xi, G., Racine, J., Pavlovic, R., Rittmaster, R., Henderson, S. B., and Stieb, D. M: Health impact analysis of PM2.5 from wildfire smoke in Canada (2013–2015, 2017–2018), Sci. Total Environ., 725, 138506, https://doi.org/10.1016/j.scitotenv.2020.138506, 2020.
Mazdiyasni, O. and AghaKouchak, A.: Substantial increase in concurrent droughts and heatwaves in the United States, P. Natl. Acad. Sci. USA, 112, 11484–11489, https://doi.org/10.1073/pnas.1422945112, 2015.
McDowell, I., Pierce, T., Pouliot, G., Eder, B., Foley, K., Gilliam, R., and Wilkins, J.: PM2.5 concentrations observed and modeled for the 2016 southern Appalachian wildfire event, 16th Annual CMAS Conference, available at: https://cfpub.epa.gov/si/si_public_record_report.cfm?dirEntryId=_338093&Lab=NERL, 2017.
McKee, D. (Ed.): Tropospheric ozone: human health and agricultural impacts, ISBN: 9780873714754, Lewis Publishers, Boca Raton, 333 pp., 1994.
McMahon, C. K., Wade, D. D., and Tsoukalas, S. N.: Combustion characteristics and emissions from burning organic soils, in: 73rd Annual Meeting of the Air Pollution Control Association, Montreal, Quebec, 22–27 June 1980, 2–16, 1980.
McMeeking, G. R., Kreidenweis, S. M., Baker, S., Carrico, C. M., Chow, J. C., Collett, J. L., Hao, W. M., Holden, A. S., Kirchstetter, T. W., Malm, W. C., Moosmüller, H., Sullivan, A. P., and Wold, C. E.: Emissions of trace gases and aerosols during the open combustion of biomass in the laboratory, J. Geophys. Res., 114, D19210, https://doi.org/10.1029/2009JD011836, 2009.
Milner, A. M., Baird, A. J., Green, S. M., Swindles, G. T., Young, D. M., Sanderson, N. K., Timmins, M. S., and Gałka, M.: A regime shift from erosion to carbon accumulation in a temperate northern peatland, J. Ecology, 109, 125–138, https://doi.org/10.1111/1365-2745.13453, 2020.
Mlawer, E. J., Taubman, S. J., Brown, P. D., Iacono, M. J., and Clough, S. A.: Radiative transfer for inhomogeneous atmospheres: RRTM, a validated correlated-k model for the longwave, J. Geophys. Res.-Atmos., 102, 16663–16682, https://doi.org/10.1029/97JD00237, 1997.
Munoz-Alpizar, R., Pavlovic, R., Moran, M. D., Chen, J., Gravel, S., Henderson, S. B., Menard, S., Racine, J., Duhamel, A., Gilbert, S., Beaulieu, P.A., Landry, H., Davignon, D., Cousineau, S., and Bouchet, V.: Multi-year (2013–2016) PM2.5 wildfire pollution exposure over North America as determined from operational air quality forecasts, Atmosphere, 8, 179, https://doi.org/10.3390/atmos8090179, 2017
Navarro, K. M., Cisneros, R., O'Neill, S. M., Schweizer, D., Larkin, N. K., and Balmes, J. R.: Air-quality impacts and intake fraction of PM2.5 during the 2013 Rim Megafire, Environ. Sci. Technol., 50, 11965–11973, https://doi.org/10.1021/acs.est.6b02252, 2016.
NCAR: FINN v1.5 fire emission inventory, available at: https://bai.acom.ucar.edu/Data/fire/, last access: 16 January 2021a.
NCAR: MOZART-4 results, available at: https://www.acom.ucar.edu/wrf-chem/mozart.shtml, last access: 16 January 2021b.
Noble, C. A., Vanderpool, R. W., Peters, T. M., McElroy, F. F., Gemmill, D. B., and Wiener, R. W.: Federal reference and equivalent methods for measuring fine particulate matter, Aerosol Sci. Technol., 34, 457–464, https://doi.org/10.1080/02786820121582, 2001.
Ottmar, R., and Andreu, A.: Litter and duff bulk densities in the Southern United States, Seattle, WA: Fire and Environmental Applications team, USDA Forest Service, Joint Fire Science Program Project, 04-02, available at: https://www.firescience.gov/projects/04-2-1-49/project/04-2-1-49_final_report.pdf (last access: 5 November 2021), 2007.
Ottmar, R. D.: Wildland fire emissions, carbon, and climate: modeling fuel consumption, Forest Ecol. Managem., 317, 41–50, https://doi.org/10.1016/j.foreco.2013.06.010, 2014.
Ovenden, L.: Peat accumulation in northern wetlands, Quaternary Res., 33, 377–386, https://doi.org/10.1016/0033-5894(90)90063-Q, 1990.
Page, S. E., Siegert, F., Rieley, J. O., Boehm, H.-D. V., Jaya, A., and Limin, S.: The amount of carbon released from peat and forest fires in Indonesia during 1997, Nature, 420, 61–65, https://doi.org/10.1038/nature01131, 2002.
Pan, X., Ichoku, C., Chin, M., Bian, H., Darmenov, A., Colarco, P., Ellison, L., Kucsera, T., da Silva, A., Wang, J., Oda, T., and Cui, G.: Six global biomass burning emission datasets: intercomparison and application in one global aerosol model, Atmos. Chem. Phys., 20, 969–994, https://doi.org/10.5194/acp-20-969-2020, 2020.
Park Williams, A., Cook, B. I., Smerdon, J. E., Bishop, D. A., Seager, R., and Mankin, J. S.: The 2016 southeastern US drought: An extreme departure from centennial wetting and cooling, J. Geophys. Res.-Atmos., 122, 10888–810905, https://doi.org/10.1002/2017JD027523, 2017.
Peckham, S., Grell, G., McKeen, S., Schmitz, R., Salzmann, M., Freitas, S., Fast, J., Gustafson, W., Ghan, S., and Zaveri, R.: WRF-Chem Version 3.9. 1.1 User's Guide, 2018.
Pfister, G. G., Avise, J., Wiedinmyer, C., Edwards, D. P., Emmons, L. K., Diskin, G. D., Podolske, J., and Wisthaler, A.: CO source contribution analysis for California during ARCTAS-CARB, Atmos. Chem. Phys., 11, 7515–7532, https://doi.org/10.5194/acp-11-7515-2011, 2011a.
Pfister, G. G., Parrish, D. D., Worden, H., Emmons, L. K., Edwards, D. P., Wiedinmyer, C., Diskin, G. S., Huey, G., Oltmans, S. J., Thouret, V., Weinheimer, A., and Wisthaler, A.: Characterizing summertime chemical boundary conditions for airmasses entering the US West Coast, Atmos. Chem. Phys., 11, 1769–1790, https://doi.org/10.5194/acp-11-1769-2011, 2011b.
Pouliot, G., Gilliam, R., Eder, B., McDowell, I., Wilkins, J., and Pierce, T.: Evaluating the Wildfire Emission estimates in an Air Quality Simulation of the 2016 Southeastern United States Wildfires, International Emissions Inventory Conference, 2017.
Poulter, B., Christensen Jr., N. L., and Halpin, P. N.: Carbon emissions from a temperate peat fire and its relevance to interannual variability of trace atmospheric greenhouse gases, J. Geophys. Res.-Atmos., 111, D06301, https://doi.org/10.1029/2005JD006455, 2006.
Powers, J. G., Klemp, J. B., Skamarock, W. C., Davis, C. A., Dudhia, J., Gill, D. O., Coen, J. L., Gochis, D. J., Ahmadov, R., and Peckham, S. E.: The weather research and forecasting model: Overview, system efforts, and future directions, B. Am. Meteorol. Soc., 98, 1717–1737, https://doi.org/10.1175/BAMS-D-15-00308.1, 2017.
Prichard, S. J., Andreu, A. G., Ottmar, R. D., and Eberhardt, E.: Fuel Characteristic Classification System (FCCS) field sampling and fuelbed development guide, Gen. Tech. Rep. PNW-GTR-972, Portland, OR, US Department of Agriculture, Forest Service, Pacific Northwest Research Station, 77 pp., 2019.
Qian, S., Fu, Y., and Pan, F.: Climate change tendency and grassland vegetation response during the growth season in Three-River Source Region, Sci. China Earth Sci., 53, 1506–1512, https://doi.org/10.1007/s11430-010-4064-2, 2010.
Raaflaub, L. and Valeo, C.: Hydrological properties of duff, Water Resour. Res., 45, W05502, https://doi.org/10.1029/2008WR007396, 2009.
Randerson, J., Chen, Y., Werf, G., Rogers, B., and Morton, D.: Global burned area and biomass burning emissions from small fires, J. Geophys. Res.-Biogeo., 117, W05502 https://doi.org/10.1029/2012JG002128, 2012.
Rappold, A. G., Stone, S. L., Cascio, W. E., Neas, L. M., Kilaru, V. J., Carraway, M. S., Szykman, J. J., Ising, A., Cleve, W. E., Meredith, J. T., Vaughan-Batten, H., Deyneka, L., and Devlin, R. B.: Peat bog wildfire smoke exposure in rural North Carolina is associated with cardiopulmonary emergency department visits assessed through syndromic surveillance, Environ. Health Perspect., 119, 1415–1420, https://doi.org/10.1289/ehp.1003206, 2011.
Reddington, C. L., Morgan, W. T., Darbyshire, E., Brito, J., Coe, H., Artaxo, P., Scott, C. E., Marsham, J., and Spracklen, D. V.: Biomass burning aerosol over the Amazon: analysis of aircraft, surface and satellite observations using a global aerosol model, Atmos. Chem. Phys., 19, 9125–9152, https://doi.org/10.5194/acp-19-9125-2019, 2019.
Reddy, A. D., Hawbaker, T. J., Wurster, F., Zhu, Z., Ward, S., Newcomb, D., and Murray, R.: Quantifying soil carbon loss and uncertainty from a peatland wildfire using multi-temporal LiDAR, Remote Sens. Environ., 170, 306–316, https://doi.org/10.1016/j.rse.2015.09.017, 2015.
Reid, C. E., Brauer, M., Johnston, F. H., Jerrett, M., Balmes, J. R., and Elliott, C. T.: Critical review of health impacts of wildfire smoke exposure, Environ. Health Perspect., 124, 1334–1343, https://doi.org/10.1289/ehp.1409277, 2016.
Rein, G. and Belcher, C.: Smouldering fires and natural fuels, Fire phenomena and the Earth system: an interdisciplinary guide to fire science, edited by: Belcher, C. M., John Wiley & Sons, Oxford, 15–33, https://doi.org/10.1002/9781118529539.ch2, 2013.
Roulston, C., Paton-Walsh, C., Smith, T., Guérette, É. A., Evers, S., Yule, C. M., Rein, G., and Van der Werf, G.: Fine particle emissions from tropical peat fires decrease rapidly with time since ignition, J. Geophys. Res.-Atmos., 123, 5607–5617, https://doi.org/10.1029/2017JD027827, 2018.
Sakulyanontvittaya, T., Duhl, T., Wiedinmyer, C., Helmig, D., Matsunaga, S., Potosnak, M., Milford, J., and Guenther, A.: Monoterpene and sesquiterpene emission estimates for the United States, Environ. Sci. Technol., 42, 1623–1629, https://doi.org/10.1021/es702274e, 2008.
San Jose, R., Pérez, J., González, R., Pecci, J., and Palacios, M.: Improving air quality modelling systems by using on-line wild land fire forecasting tools coupled into WRF/Chem simulations over Europe, Urban Clim., 22, 2–18, https://doi.org/10.1016/j.uclim.2016.09.001, 2017.
Sandu, A., Daescu, D. N., and Carmichael, G. R.: Direct and adjoint sensitivity analysis of chemical kinetic systems with KPP: Part I – theory and software tools, Atmos. Environ., 37, 5083–5096, https://doi.org/10.1016/j.atmosenv.2003.08.019, 2003.
Sandu, A. and Sander, R.: Technical note: Simulating chemical systems in Fortran90 and Matlab with the Kinetic PreProcessor KPP-2.1, Atmos. Chem. Phys., 6, 187–195, https://doi.org/10.5194/acp-6-187-2006, 2006.
Seinfeld, J. H. and Pandis, S. N.: Atmospheric chemistry and physics: from air pollution to climate change, 3rd Edn., John Wiley & Sons, Hoboken, New Jersey, ISBN: 978-1-119-22117-3, 1152 pp., 2016.
Selimovic, V., Yokelson, R. J., Warneke, C., Roberts, J. M., de Gouw, J., Reardon, J., and Griffith, D. W. T.: Aerosol optical properties and trace gas emissions by PAX and OP-FTIR for laboratory-simulated western US wildfires during FIREX, Atmos. Chem. Phys., 18, 2929–2948, https://doi.org/10.5194/acp-18-2929-2018, 2018.
Selimovic, V., Yokelson, R. J., McMeeking, G. R., and Coefield, S.: Aerosol mass and optical properties, smoke influence on O3, and high NO3 production rates in a western US city impacted by wildfires, J. Geophys. Res.-Atmos., 125, e2020JD032791, https://doi.org/10.1029/2020JD032791, 2020.
Shaposhnikov, D., Revich, B., Bellander, T., Bedada, G. B., Bottai, M., Kharkova, T., Kvasha, E., Lezina, E., Lind, T., and Semutnikova, E.: Mortality related to air pollution with the Moscow heat wave and wildfire of 2010, Epidemiology, 25, 359, https://doi.org/10.1097/EDE.0000000000000090, 2014.
Singh, H., Cai, C., Kaduwela, A., Weinheimer, A., and Wisthaler, A.: Interactions of fire emissions and urban pollution over California: Ozone formation and air quality simulations, Atmos. Environ., 56, 45–51, https://doi.org/10.1016/j.atmosenv.2012.03.046, 2012.
Southern Appalachian Man and the Biosphere:The Southern Appalachian assessment summary report, US Department of Agriculture Washington, DC, available at: https://digital.library.unt.edu/ark:/67531/metadc689958/ (last access: 5 November 2021), 1996.
Stauffer, D. R. and Seaman, N. L.: Use of four-dimensional data assimilation in a limited-area mesoscale model. Part I: Experiments with synoptic-scale data, Mon. Weather Rev., 118, 1250–1277, https://doi.org/10.1175/1520-0493(1990)118<1250:UOFDDA>2.0.CO;2, 1990.
Stocks, B. J., Lynham, T., Lawson, B., Alexander, M., Wagner, C. V., McAlpine, R., and Dube, D.: Canadian forest fire danger rating system: an overview, Forestry Chronicle, 65, 258–265, 1989.
Tansey, K., Beston, J., Hoscilo, A., Page, S., and Paredes Hernández, C.: Relationship between MODIS fire hot spot count and burned area in a degraded tropical peat swamp forest in Central Kalimantan, Indonesia, J. Geophys. Res.-Atmos., 113, D23112, https://doi.org/10.1029/2008JD010717, 2008.
Thompson, G., Field, P. R., Rasmussen, R. M., and Hall, W. D.: Explicit forecasts of winter precipitation using an improved bulk microphysics scheme. Part II: Implementation of a new snow parameterization, Mon. Weather Rev., 136, 5095–5115, https://doi.org/10.1175/2008MWR2387.1, 2008.
Tinling, M. A., West, J. J., Cascio, W. E., Kilaru, V., and Rappold, A. G: Repeating cardiopulmonary health effects in rural North Carolina population during a second large peat wildfire, Environ. Health, 15, 12, https://doi.org/10.1186/s12940-016-0093-4, 2016.
Tosca, M., Randerson, J., Zender, C., Nelson, D., Diner, D., and Logan, J.: Dynamics of fire plumes and smoke clouds associated with peat and deforestation fires in Indonesia, J. Geophys. Res.-Atmos., 116, D08207, https://doi.org/10.1029/2010JD015148, 2011.
Tosca, M. G., Randerson, J. T., and Zender, C. S.: Global impact of smoke aerosols from landscape fires on climate and the Hadley circulation, Atmos. Chem. Phys., 13, 5227–5241, https://doi.org/10.5194/acp-13-5227-2013, 2013.
Turetsky, M. R., Benscoter, B., Page, S., Rein, G., Van Der Werf, G. R., and Watts, A.: Global vulnerability of peatlands to fire and carbon loss, Nat. Geosci., 8, 11–14, https://doi.org/10.1038/ngeo2325, 2015.
Urbanski, S.: Wildland fire emissions, carbon, and climate: Emission factors, Forest Ecol. Manage., 317, 51–60, https://doi.org/10.1016/j.foreco.2013.05.045, 2014.
USEPA: Profile of version 1 of the 2014 national emissions inventory, available at: https://www.epa.gov/sites/production/files/2017-04/documents/2014neiv1_profile_final_april182017.pdf (last access: 5 November 2021), 2017.
USEPA: EPA's 2014 National Air Toxics Assessment (Technical Support Document), U.S. Environmental Protection Agency, Research Triangle Park, North Carolina, available at: https://www.epa.gov/national-air-toxics-assessment/2014-nata-technical-support-document (last access: 5 November 2021), 2018a.
USEPA: Preparation of Emissions Inventories for the Version 7.1 2014 Emissions Modeling Platform for the National Air Toxics Assessment (Technical Support Document), U.S., Environmental Protection Agency, Research Triangle Park, North Carolina, available at: https://www.epa.gov/air-emissions-modeling/2014-version-71-platform (last access: 5 November 2021), 2018b.
USEPA: Air Data: Air Quality Data Collected at Outdoor Monitors Across the US, available at: https://www.epa.gov/outdoor-air-quality-data, last access: 22 October 2020.
van der Werf, G. R., Randerson, J. T., Giglio, L., van Leeuwen, T. T., Chen, Y., Rogers, B. M., Mu, M., van Marle, M. J. E., Morton, D. C., Collatz, G. J., Yokelson, R. J., and Kasibhatla, P. S.: Global fire emissions estimates during 1997–2016, Earth Syst. Sci. Data, 9, 697–720, https://doi.org/10.5194/essd-9-697-2017, 2017.
Verma, V., Fang, T., Guo, H., King, L., Bates, J. T., Peltier, R. E., Edgerton, E., Russell, A. G., and Weber, R. J.: Reactive oxygen species associated with water-soluble PM2.5 in the southeastern United States: spatiotemporal trends and source apportionment, Atmos. Chem. Phys., 14, 12915–12930, https://doi.org/10.5194/acp-14-12915-2014, 2014.
Waldrop, T. A. and Goodrick, S.L.: Introduction to prescribed fires in Southern ecosystems, Science Update SRS-054, Asheville, NC, US Department of Agriculture Forest Service, Southern Research Station, p. 80 , p. 54, 2012.
Wang, K., Zhang, Y., Yahya, K., Wu, S.-Y., and Grell, G.: Implementation and initial application of new chemistry-aerosol options in WRF/Chem for simulating secondary organic aerosols and aerosol indirect effects for regional air quality, Atmos. Environ., 115, 716–732, https://doi.org/10.1016/j.atmosenv.2014.12.007, 2015.
Ward, D. S., Kloster, S., Mahowald, N. M., Rogers, B. M., Randerson, J. T., and Hess, P. G.: The changing radiative forcing of fires: global model estimates for past, present and future, Atmos. Chem. Phys., 12, 10857–10886, https://doi.org/10.5194/acp-12-10857-2012, 2012.
Watts, A. C.: Organic soil combustion in cypress swamps: moisture effects and landscape implications for carbon release, Forest Ecol. Manage., 294, 178–187, https://doi.org/10.1016/j.foreco.2012.07.032, 2013.
Watts, A. C. and Kobziar, L. N.: Smoldering Combustion in Organic Soils: Peat and Muck Fires in the Southeastern US, SFE Research Synthesis, 1–5, available at: https://www.firescience.gov/projects/11-3-1-22/project/11-3-1-22_SFE_Synthesis_Smoldering_2012-9.pdf (last access: 5 November 2021), 2012.
Wieder, R. K., Vitt, D. H., and Benscoter, B. W.: Peatlands and the Boreal Forest, in: Boreal Peatland Ecosystems, vol. 188, edited by: Wieder, R. K. and Vitt, D. H., Springer Berlin Heidelberg, 1–8, https://doi.org/10.1007/978-3-540-31913-9_1, 2006.
Wiedinmyer, C., Quayle, B., Geron, C., Belote, A., McKenzie, D., Zhang, X., O'Neill, S., and Wynne, K. K.: Estimating emissions from fires in North America for air quality modeling, Atmos. Environ., 40, 3419–3432, https://doi.org/10.1016/j.atmosenv.2006.02.010, 2006.
Wiedinmyer, C., Akagi, S. K., Yokelson, R. J., Emmons, L. K., Al-Saadi, J. A., Orlando, J. J., and Soja, A. J.: The Fire INventory from NCAR (FINN): a high resolution global model to estimate the emissions from open burning, Geosci. Model Dev., 4, 625–641, https://doi.org/10.5194/gmd-4-625-2011, 2011.
Wilbur, R. B. and Christensen, N. L.: Effects of fire on nutrient availability in a North Carolina coastal plain pocosin, Am. Midland Natural., 110, 54, https://doi.org/10.2307/2425213, 1983.
Wilkins, J. L., Pouliot, G., Foley, K., Appel, W., and Pierce, T.: The impact of US wildland fires on ozone and particulate matter: a comparison of measurements and CMAQ model predictions from 2008 to 2012, Int. J. Wildland Fire, 27, 684–698, https://doi.org/10.1071/WF18053, 2018.
Yang, A., Janssen, N. A., Brunekreef, B., Cassee, F. R., Hoek, G., and Gehring, U.: Children's respiratory health and oxidative potential of PM2.5: the PIAMA birth cohort study, Occupat. Environ. Med., 73, 154–160, https://doi.org/10.1136/oemed-2015-103175, 2016.
Yang, G., Di, X.-Y., Guo, Q.-X., Shu, Z., Zeng, T., Yu, H.-Z., and Wang, C.: The impact of climate change on forest fire danger rating in China's boreal forest, J. Forest. Res., 22, 249–257, https://doi.org/10.1007/s11676-011-0158-8, 2011.
Yokelson, R. J., Burling, I. R., Gilman, J. B., Warneke, C., Stockwell, C. E., de Gouw, J., Akagi, S. K., Urbanski, S. P., Veres, P., Roberts, J. M., Kuster, W. C., Reardon, J., Griffith, D. W. T., Johnson, T. J., Hosseini, S., Miller, J. W., Cocker III, D. R., Jung, H., and Weise, D. R.: Coupling field and laboratory measurements to estimate the emission factors of identified and unidentified trace gases for prescribed fires, Atmos. Chem. Phys., 13, 89–116, https://doi.org/10.5194/acp-13-89-2013, 2013.
Yu, J.-Y., Kao, H.-Y., and Lee, T.: Subtropics-related interannual sea surface temperature variability in the central equatorial Pacific, J. Climate, 23, 2869–2884, https://doi.org/10.1175/2010JCLI3171.1, 2010.
Zhang, A., Wang, Y., Zhang, Y., Weber, R. J., Song, Y., Ke, Z., and Zou, Y.: Modeling the global radiative effect of brown carbon: a potentially larger heating source in the tropical free troposphere than black carbon, Atmos. Chem. Phys., 20, 1901–1920, https://doi.org/10.5194/acp-20-1901-2020, 2020.
Zhang, L., Wang, T., Zhang, Q., Zheng, J., Xu, Z., and Lv, M.: Potential sources of nitrous acid (HONO) and their impacts on ozone: A WRF-Chem study in a polluted subtropical region, J. Geophys. Res.-Atmos., 121, 3645–3662, https://doi.org/10.1002/2015JD024468, 2016.
Zhang, Y. and Wang, Y.: Climate-driven ground-level ozone extreme in the fall over the Southeast United States, P. Natl. Acad. Sci. USA, 113, 10025–10030, https://doi.org/10.1073/pnas.1602563113, 2016.
Zhao, F., Liu, Y., Goodrick, S., Hornsby, B., and Schardt, J.: The contribution of duff consumption to fire emissions and air pollution of the Rough Ridge Fire, Int. J. Wildland Fire, 28, 993–1004, https://doi.org/10.1071/WF18205, 2019.
Zhu, Z. and Evans, D. L.: US forest types and predicted percent forest cover from AVHRR data, Photogramm. Eng. Rem. S., 60, 525–531, 1994.
Zou, Y., O'Neill, S. M., Larkin, N. K., Alvarado, E. C., Solomon, R., Mass, C., Liu, Y., Odman, M. T., and Shen, H.: Machine Learning-Based Integration of High-Resolution Wildfire Smoke Simulations and Observations for Regional Health Impact Assessment, Int. J. Environ. Res. Publ. Hea., 16, 2137, https://doi.org/10.3390/ijerph16122137, 2019.
Zou, Y., Wang, Y., Qian, Y., Tian, H., Yang, J., and Alvarado, E.: Using CESM-RESFire to understand climate–fire–ecosystem interactions and the implications for decadal climate variability, Atmos. Chem. Phys., 20, 995–1020, https://doi.org/10.5194/acp-20-995-2020, 2020.