the Creative Commons Attribution 4.0 License.
the Creative Commons Attribution 4.0 License.
 | 05 May 2022
Influence of convection on the upper-tropospheric O3 and NOx budget in southeastern China
Xin Zhang
Ronald van der A
Henk Eskes
Jos van Geffen
Yunyao Li
Xiang Kuang
Jeff L. Lapierre
Kui Chen
Zhongxiu Zhen
Jianlin Hu
Chuan He
Jinghua Chen
Rulin Shi
Jun Zhang
Xingrong Ye
Hao Chen
Thunderstorms can significantly influence the air composition via strong updraft and lightning nitrogen oxides (LNOx). In this study, the ozonesondes and TROPOMI (TROPOspheric Monitoring Instrument) nitrogen dioxide (NO2) observations for two cases are combined with a model to investigate the effects of typical strong convection on vertical redistribution of air pollutants in Nanjing, southeastern China. The ozonesonde observations show higher O3 and water vapor mixing ratios in the upper troposphere (UT) after convection, indicating the strong updraft transporting lower-level air masses into the UT and the possible downward O3-rich air near the top of UT over the convective period. During the whole convection life cycle, the UT O3 production is driven by the chemistry (5–10 times the magnitude of dynamic contribution) and reduced by the LNOx (−40 %). Sensitivity tests demonstrate that neglecting LNOx in standard TROPOMI NO2 products causes overestimated air mass factors over fresh lightning regions and the opposite for outflow and aged lightning areas. Therefore, a new high-resolution retrieval algorithm is applied to estimate the LNOx production efficiency. Our work shows the demand for high-resolution modeling and satellite observations on LNOx emissions of both active and dissipated convection, especially small-scale storms.
- Article
(12197 KB) - Full-text XML
-
Supplement
(3197 KB) - BibTeX
- EndNote


Convection can transport the surface pollutants and moisture from the planetary boundary layer to the upper troposphere (UT) in a short time, where the gaseous pollutants have a longer lifetime due to the slower reaction rates, except for photolysis, in the colder environment (Dickerson et al., 1987). As trace gases remain for more than 1 week in the UT, they are distributed by the upper-level winds around the globe (Ridley et al., 2004). Meanwhile, the vertical profiles of trace gases are reshaped by the updraft and downdraft on timescales of hours (Huntrieser et al., 2016; Barth et al., 2019). On a global scale, the chemical reactions of transported ozone (O3) and its precursors can increase the amount of UT O3 (Lawrence et al., 2003; Murray, 2016).
Nitrogen oxides (NOx), volatile organic compounds (VOCs), and hydrogen oxide radicals (HOx) are the three main O3 precursors which can be uplifted or produced by thunderstorms (Bozem et al., 2017). Lightning-produced nitrogen oxides (LNOx) are the dominant natural source of UT NOx, contributing as much as 35 %–45 % of global free-tropospheric ozone (Allen et al., 2010; Liaskos et al., 2015). Several lightning parameterizations have been developed for chemistry transport and climate models to evaluate the relationship between LNOx and other trace gases (Murray et al., 2012; Gordillo-Vázquez et al., 2019; Luhar et al., 2021). Therefore, the precise estimation of LNOx is crucial for the global O3 trend and feedback between lightning and climate change (Finney et al., 2016; Chen et al., 2021). Globally, the LNOx is estimated as 2–8 Tg N yr−1, which is substantially less well quantified than the flash rate (Schumann and Huntrieser, 2007).
The large uncertainty in LNOx estimation might be reduced by using cloud-resolving chemistry models in combination with satellite and aircraft observations. It is beneficial to take advantage of sonde and satellite observations for exploring the convection effects, especially for the estimation of the LNOx production efficiency (PE). Recently, many studies have used different satellites to quantify the LNOx PEs (Beirle et al., 2009; Pickering et al., 2016; Zhang et al., 2020). Two main methods have been proposed to distinguish LNOx from the NO2 background pollution: (1) subtracting the weighted temporal average NO2 of areas with few flashes before the satellite passing time (Pickering et al., 2016; Bucsela et al., 2019; Allen et al., 2019; Lapierre et al., 2020) and (2) directly using customized lightning air mass factors (AMFs) for each convection event (Beirle et al., 2009; Zhang et al., 2020). Recently, Allen et al. (2021) proved the potential of deriving LNOx PEs by the geostationary lightning instruments (e.g., Lightning Mapping Imager, LMI; Yang et al., 2017; Geostationary Lightning Mapper, GLM; Rudlosky et al., 2019) and NO2 observations such as Tropospheric Emissions: Monitoring of Pollution (TEMPO; Chance et al., 2019).
Furthermore, aircraft observations and chemical models indicate that the transport from the stratosphere to the troposphere can also increase the UT O3 besides the chemical production from LNOx (Pan et al., 2014). As revealed in the Deep Convective Clouds and Chemistry (DC3) 2012 studies and mesoscale convective system simulations, the compensation of subsidence and differential advection beneath the convective core can lead to the anvil wrapping effects (Huntrieser et al., 2016; Phoenix et al., 2020). The different mechanisms of stratosphere–troposphere exchange and the effects on the tropospheric chemistry have been discussed in Holton et al. (1995) and Stohl (2003).
At present, most aircraft observations and model simulations of convection effects focus on the tropics or the United States (Vaughan et al., 2008; Barth et al., 2019). Little is known about the role of convection in southeastern China (Murray, 2016; Guo et al., 2017), where thunderstorms and lightning have increased significantly because of urbanization during recent decades (Yang and Li, 2014; Pérez-Invernón et al., 2021). This is likely due to the increasing aerosol concentration, which can invigorate storms in a moist and convectively unstable environment (Koren et al., 2008; Rosenfeld et al., 2008; Tao et al., 2012). In this study, we combine ground observations and model simulations to investigate the origin of higher UT O3 and water vapor mixing ratio (Qv) after convection, and we try to distinguish the contributions of physical processes, chemical reactions, and LNOx. For the first time, the TROPOspheric Monitoring Instrument (TROPOMI; Veefkind et al., 2012) NO2 observations are used to identify LNOx PEs in southeastern China. Section 2 describes the datasets used with a brief introduction of the cloud-resolved chemistry model and the LNOx retrieval method. Section 3 evaluates the model simulations, and the physical and chemical effects of convection are analyzed in Sects. 4 and 5. We apply new a priori NO2 profiles into the retrieval algorithm to explore the sensitivity of AMFs to LNOx in Sect. 6. Conclusions are summarized in Sect. 7.
2.1 Ozonesonde data
Five ozonesondes were launched from the Nanjing National Reference Climatological Station (31.93∘ N, 118.90∘ E) on 25 July 2019 and 1 September 2020; both days experienced strong convection. Both pre-convection and during-convection/post-convection campaigns were designed to investigate the convection effects. The convection and ozonesonde trajectories are illustrated in Fig. 1a and b.
Three Institute of Atmospheric Physics (IAP) ozonesondes were launched near the air mass convection that developed on 25 July 2019. The IAP ozonesonde uses an electrochemical concentration cell (ECC). The complete parameters and performance are described in Zhang et al. (2014). The average bias is less than 0.3 mPa from the surface up to 2.5 km, close to zero below 9 km, and less than 0.5 mPa between 9 and 18 km. The first IAP ozonesonde was launched at 05:35 UTC on a sunny day (23 July), and the other two were at 05:10 UTC (pre-convection) and 06:35 UTC (post-convection) on 25 July. Because of water leakage, the pre-convection one lost signal just a few seconds after the release, and instead the ozonesonde launched on 23 July is chosen. Although the time interval is 2 d, the largest relative difference of forecast O3 profiles above 10 km is usually smaller than 25 % (Fig. S2); therefore the daily variation cannot explain the observed difference of more than 65 %.
The two Vaisala ECC ozonesondes were launched successfully at 23:45 UTC on 31 August (pre-convection) and 06:10 UTC on 1 September (during-convection), following the standard manual to ensure the precision is better than 5 % and the accuracy is within ± (5–10) % below 30 km (Smit et al., 2007). The captured squall line was developing from the convergence of cold air and typhoon Maysak's outer region circulation. Note that the during-convection ozonesonde entered directly into the cloud, providing a unique opportunity of exploring the ozone affected by the convective clouds.
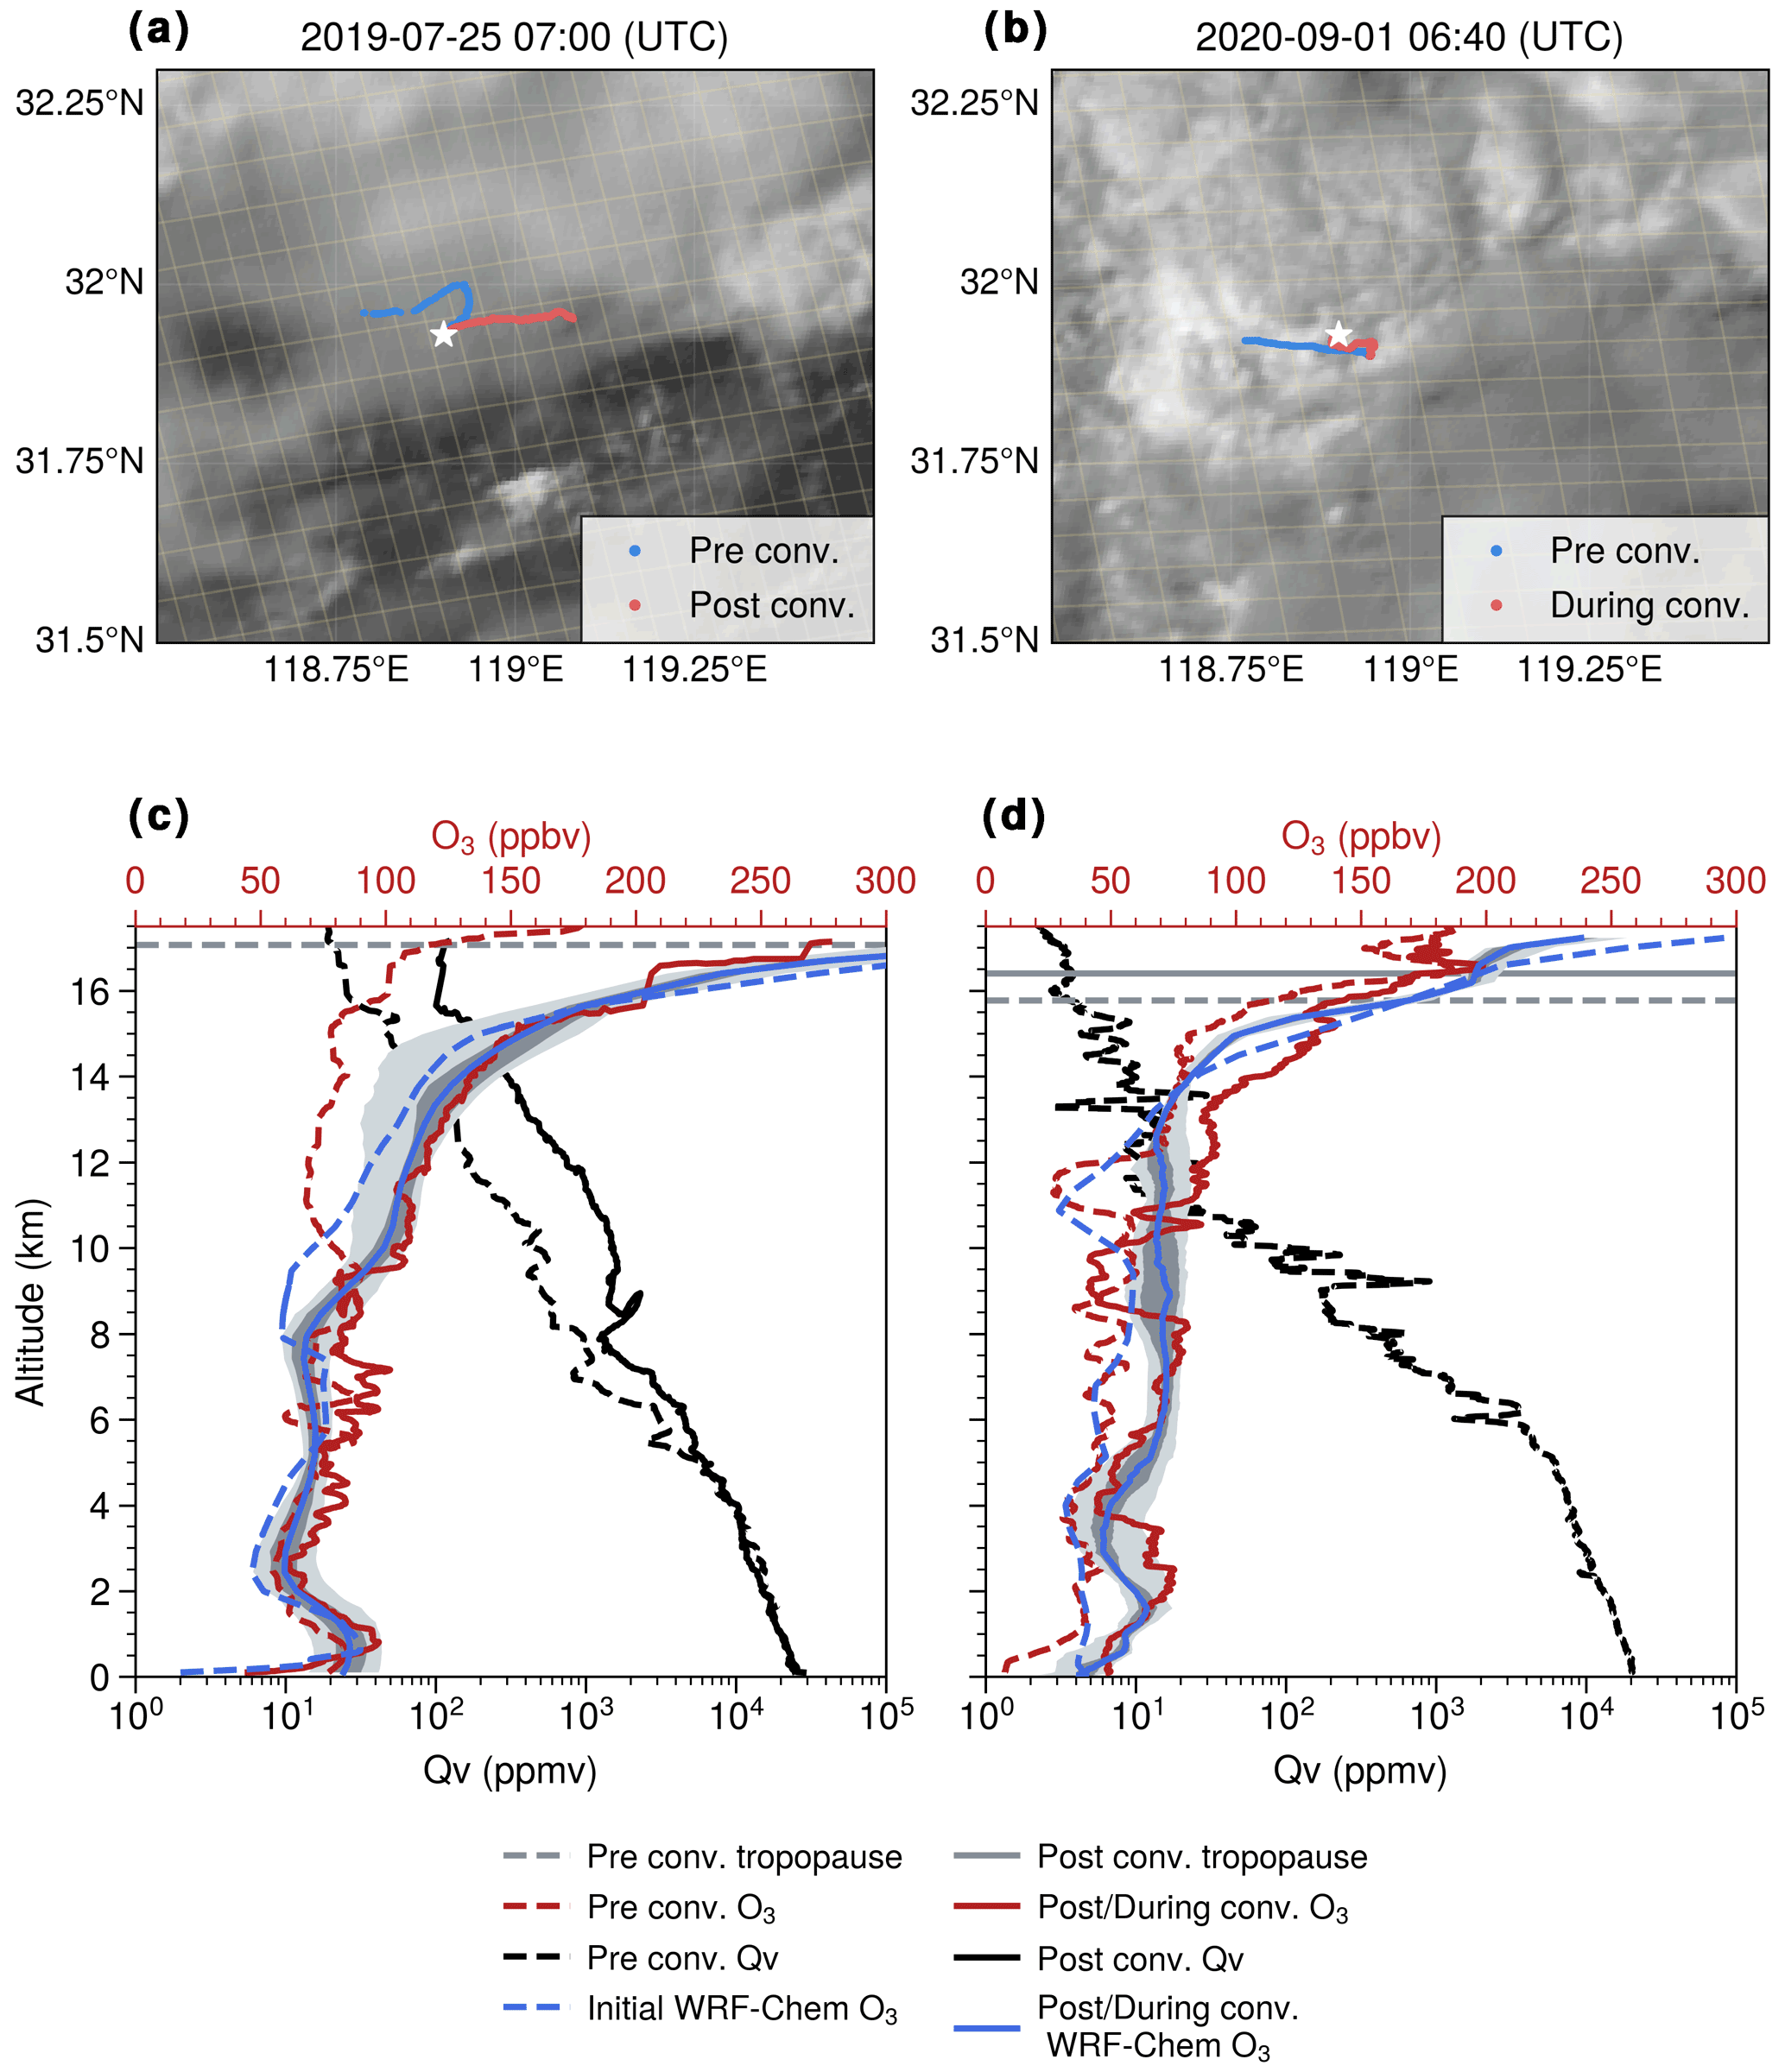
Figure 1(a, b) The convection detected by the FY-4A Advanced Geostationary Radiation Imager (AGRI) visible channel (0.65 µm) field at the time when the post-convection/during-convection ozonesondes reached around 10 km. The pre-convection ozonesonde trajectories are colored blue, while the others are in red. The white star symbol stands for the observation station, and the thin yellow lines are the TROPOMI swath pixels. Panels (c) and (d) are the observed O3 (red) and Qv (black) profiles in the pre-convection (dashed) and post-convection/during-convection (solid) periods. The initial (dashed) and simulated post-convection or during-convection (solid) O3 profiles are in blue. The dark gray shading is the 50 % confidence interval, while the light one is the 90 % confidence interval. The gray lines are the lapse rate tropopauses.
2.2 Lightning data
Three lightning datasets were used in this study: the China National Lightning Detection Network (CNLDN; Yang et al., 2015), the Earth Networks Total Lightning Network (ENTLN; Marchand et al., 2019), and the World Wide Lightning Location Network (WWLLN; Rodger et al., 2006). The detection efficiency (DE) of cloud-to-ground (CG) flashes is about 90 % for the CNLDN data in Jiangsu Province (Li et al., 2017a), while ENTLN and WWLLN detect both intra-cloud (IC) and CG flashes with a specific detection frequency (1 Hz–12 MHz for ENTLN and 3–30 kHz for WWLLN). In the ENTLN data, groups of pulses are classified as a flash if they are within 700 ms and 10 km. Both strokes and lightning flashes composed of one or more strokes are included in the preprocessed data obtained from the ENTLN. The detailed processing algorithm of the WWLLN is given by Rodger et al. (2004). The WWLLN strokes and pulses are combined with ENTLN into one dataset (ENGLN) within 10 km and 0.7 s as mentioned in Virts and Goodman (2020). To increase the lightning data coverage in our study, the CG flashes of ENGLN and CNLDN datasets are combined using spatial and temporal clustering criteria of 10 km and 0.5 s (Zhao et al., 2020). Merging these three datasets should provide a sufficiently high CG flash detection efficiency for this analysis. Because the IC DE of all these lightning data is low in China, we conservatively use the merged CG data with a constant IC CG ratio of 3:1 based on Wu et al. (2016) and Bandholnopparat et al. (2020). IC data will become more accurate if more Chinese total lightning networks, such as Beijing Lightning Network (BLNET; Srivastava et al., 2017), are available to be compared with lightning imaging sensors (Rudlosky and Shea, 2013; Poelman and Schulz, 2020).
2.3 TROPOMI data
On 13 October 2017, TROPOMI on the Sentinel-5 Precursor satellite was launched successfully (Veefkind et al., 2012). For the current study, we used the Royal Netherlands Meteorological Institute (KNMI) standard product v2.1 test as input to our LNOx retrieval algorithm. A spike removal is included in the product to better deal with the detector saturation and blooming effects, which enables more valid data over the bright clouds generated by convection (Ludewig et al., 2020; van Geffen et al., 2022). Each pixel includes a slant column density quality flag (no2_scd_flag = 0, see Appendix A) that can be used to get the data without known retrieval errors (Allen et al., 2021; van Geffen et al., 2022).
The official NO2 columns are retrieved using the near-ultraviolet and visible (UV-VIS, 405–465 nm) spectrometer backscattered solar radiation measurements on TROPOMI (van Geffen et al., 2015). The retrieval consists of three main procedures for each measured Level-1b spectrum.
-
Total NO2 slant column density (SCD) is determined by the DOAS (differential optical absorption spectroscopy) method.
-
The stratospheric and tropospheric SCDs are separated by data assimilation of slant columns in the tracer model, version 5, tailored for the application of satellite retrievals (TM5-MP; Williams et al., 2017).
-
The stratospheric and tropospheric NO2 vertical column densities (VCDs) are obtained via the air mass factor (AMF) lookup tables (Lorente et al., 2017).
We replaced the tropospheric AMF (AMFtrop) with a new AMF called AMF for LNOx (AMF) to derive the tropospheric LNOx vertical column density (VCD). The concept of AMF is inherited from the AMFtrop derived by a function of several parameters (solar zenith angle, viewing zenith angle, relative azimuth angle, surface albedo, surface pressure, cloud fraction, cloud height, and a priori trace gas profile). Briefly, the numerator is the modeled tropospheric NO2 slant column density (SCD) and the denominator is the modeled VCD (VCD or VCD). In detail, these two AMFs can be calculated as follows:
where psurf is the surface pressure, ptp is the tropopause pressure, pcloud is the cloud optical pressure, fr is the cloud radiance fraction in the NO2 window, wclear and wcloudy are respectively the pressure-dependent scattering weights from the lookup Table (Lorente et al., 2017) for clear and cloudy parts, and NO2(p) is the NO2 vertical profile simulated by WRF-Chem (Weather Research and Forecasting model coupled with chemistry). Moreover, LNOx(p) is the LNOx vertical profile calculated by the differences in the vertical profile between WRF-Chem simulations with and without lightning. All other parameters in the KNMI v2.1 test product, including the total SCD, stratospheric SCD, total VCD, stratospheric VCD, surface albedo, and scattering weights, remain unchanged.
In comparison with this study, Pickering et al. (2016), Allen et al. (2019), Bucsela et al. (2019), and Allen et al. (2021) defined another AMF to convert SCD to the tropospheric NOx vertical column density (VCD). Then, their VCD can be calculated as the VCD subtracted from a tropospheric NOx background. Because our AMF converts the SCD to VCD directly, the additional estimation of background NO2 is not needed for calculating LNOx PE in Sect. 6.2.
2.4 Model simulations
This study uses WRF-Chem version 4.1.4. The initial and boundary conditions of meteorological parameters are provided by the hourly ECMWF atmospheric reanalysis (ERA5) data (Hersbach et al., 2020). Simulations are performed with one‐way nesting with 75 vertical levels and a 50 hPa model top. The domain settings are illustrated in Fig. S1. The microphysical processes are computed with the WRF Single-Moment 6-class scheme (WSM6; Hong and Lim, 2006), while the shortwave and longwave radiation is calculated by the Rapid Radiative Transfer Model for GCMs (general circulation models) scheme (RRTMG; Iacono et al., 2008). The land surface processes are simulated by the Noah scheme (Koren et al., 1999). However, we use different planetary boundary layer (PBL) parameterizations to simulate the convection. Specifically, the 2019 case uses the Yonsei University scheme (YSU; Hong et al., 2006), while the quasi-normal scale elimination (QNSE; Sukoriansky et al., 2005) is applied to the 2020 case.
The chemical initial and boundary conditions are defined using the output from the Whole Atmosphere Community Climate Model (WACCM; https://www.acom.ucar.edu/waccm/, last access: 22 April 2022). The initial O3 profile of the 2020 case is replaced by the O3 profile from the ozonesonde. Anthropogenic emissions are driven by the 2016 Multi-resolution Emission Inventory for China (MEIC) version 1.3 (http://www.meicmodel.org/, last access: 22 April 2022). The Model of Emissions of Gases and Aerosol from Nature (MEGAN; Guenther et al., 2006) is used for biogenic emissions. The chemical mechanism is the Model for Ozone and Related chemical Tracers (MOZART) for gas-phase chemistry and Goddard Chemistry Aerosol Radiation and Transport (GOCART) model for aerosols (Pfister et al., 2011). The photolysis rates are adjusted by the presence of aerosols and clouds using the new TUV (tropospheric ultraviolet and visible) photolysis option with the scaled cloud optical depth (cloud_fraction1.5). Note that the bimodal profile modified from the standard Ott et al. (2010) profile is employed as the vertical distribution of LNO in WRF-Chem (Laughner and Cohen, 2017), while the LNOx parameterization is activated as 500 mol NO per flash (Zhu et al., 2019). The resulting lightning nitrogen monoxide (LNO) and lightning nitrogen dioxide (LNO2) profiles are defined as the difference of vertical profiles between simulations with and without lightning.
To simulate the convection and LNOx realistically, a lightning data assimilation (LDA) technique is applied to WRF-Chem. The details of the LDA technique can be found in Fierro et al. (2012) and Li et al. (2017b) and are briefly illustrated here. The water vapor mass mixing ratio is increased at constant temperature layers in columns where flashes occur:
where Qsat is the water vapor saturation mixing ratio (g kg−1), Qg is the graupel mixing ratio (g kg−1), and X is the flash rate. In our simulations, the layer between 263.15 and 290.15 K is chosen to let the convection root itself in the PBL quickly as the Qv in the lower troposphere is the deeper layer (Marchand and Fuelberg, 2014; Finney et al., 2016; Li et al., 2017b). Parameter settings follow Li et al. (2017b): A=0.94, B=0.2, C=0.001, and D=0.25 and α=2.2. The resampled total lightning flash data are read through the auxiliary input stream of WRF every 10 min. For example, if the beginning time of LDA is 05:00 UTC with a time step of 10 min, all flashes in a specific grid between 05:00 and 05:10 UTC are summed as the contribution during this period. At the next time step, the flashes are classified as the next new group. Therefore, the flash count is the flash rate density (units: flashes per 10 min per dx km per dy km), where dx and dy are the resolutions of model grids in the x and y direction, respectively. This leads to flash rate densities that are the same through all nested domains, as done in Fierro et al. (2012) and Li et al. (2017b), and these are used as the flash counts in WRF-Chem directly following the method employed in CMAQ (Community Multiscale Air Quality; Kang et al., 2019a, b, 2020).
Compared with the radar observations, the simulated initiations of convection are ahead by 60 and 30 min for the 25 July 2019 and 1 September 2020 cases, respectively (Figs. 2 and 3). The lightning assimilations are applied with the same time step forwards. For comparisons below, we choose the matched stages instead of the same time.
The air mass convection on 25 July 2019 was initialized as isolated cells. WRF-Chem reproduces the position and intensity of isolated convections at the initial stage (Fig. 2a and d). At 05:40 UTC, the cells were presented with the northeast–southwest orientation, and the column maximum radar reflectivity (CRF) reached 60 dBZ (Fig. 2b), which is stronger than the simulated convection (CRF = 55 dBZ, Fig. 2e). The vertical cross section of simulated radar reflectivity across the core of cells is compared with the observations (Fig. S3). Although there were much missing data caused by the long distance between convection and radar, the horizontal and vertical structures of isolated cells are roughly shown without artificial interpolation. While the simulated 45 dBZ contour extends to 12 km, the observed one only reaches 10 km because of reduced data quality above 10 km.
The squall line on 1 September 2020 was formed in the north, strengthened, and moved towards the observation site (Fig. 3). The strongest convective stage with a CRF of 60 dBZ was at 05:50 UTC, which is the TROPOMI overpass time (Fig. 3b and e). Although the highest level reached was lower than that of the 2019 case, the reflectivity in the lower troposphere (2–8 km) was larger and broader (Fig. S4). Note that the simulated dissipated cells deviate from the radar observation, and this leads to the region for the ozonesonde comparison moving to the west of the station (Fig. 3c and f).
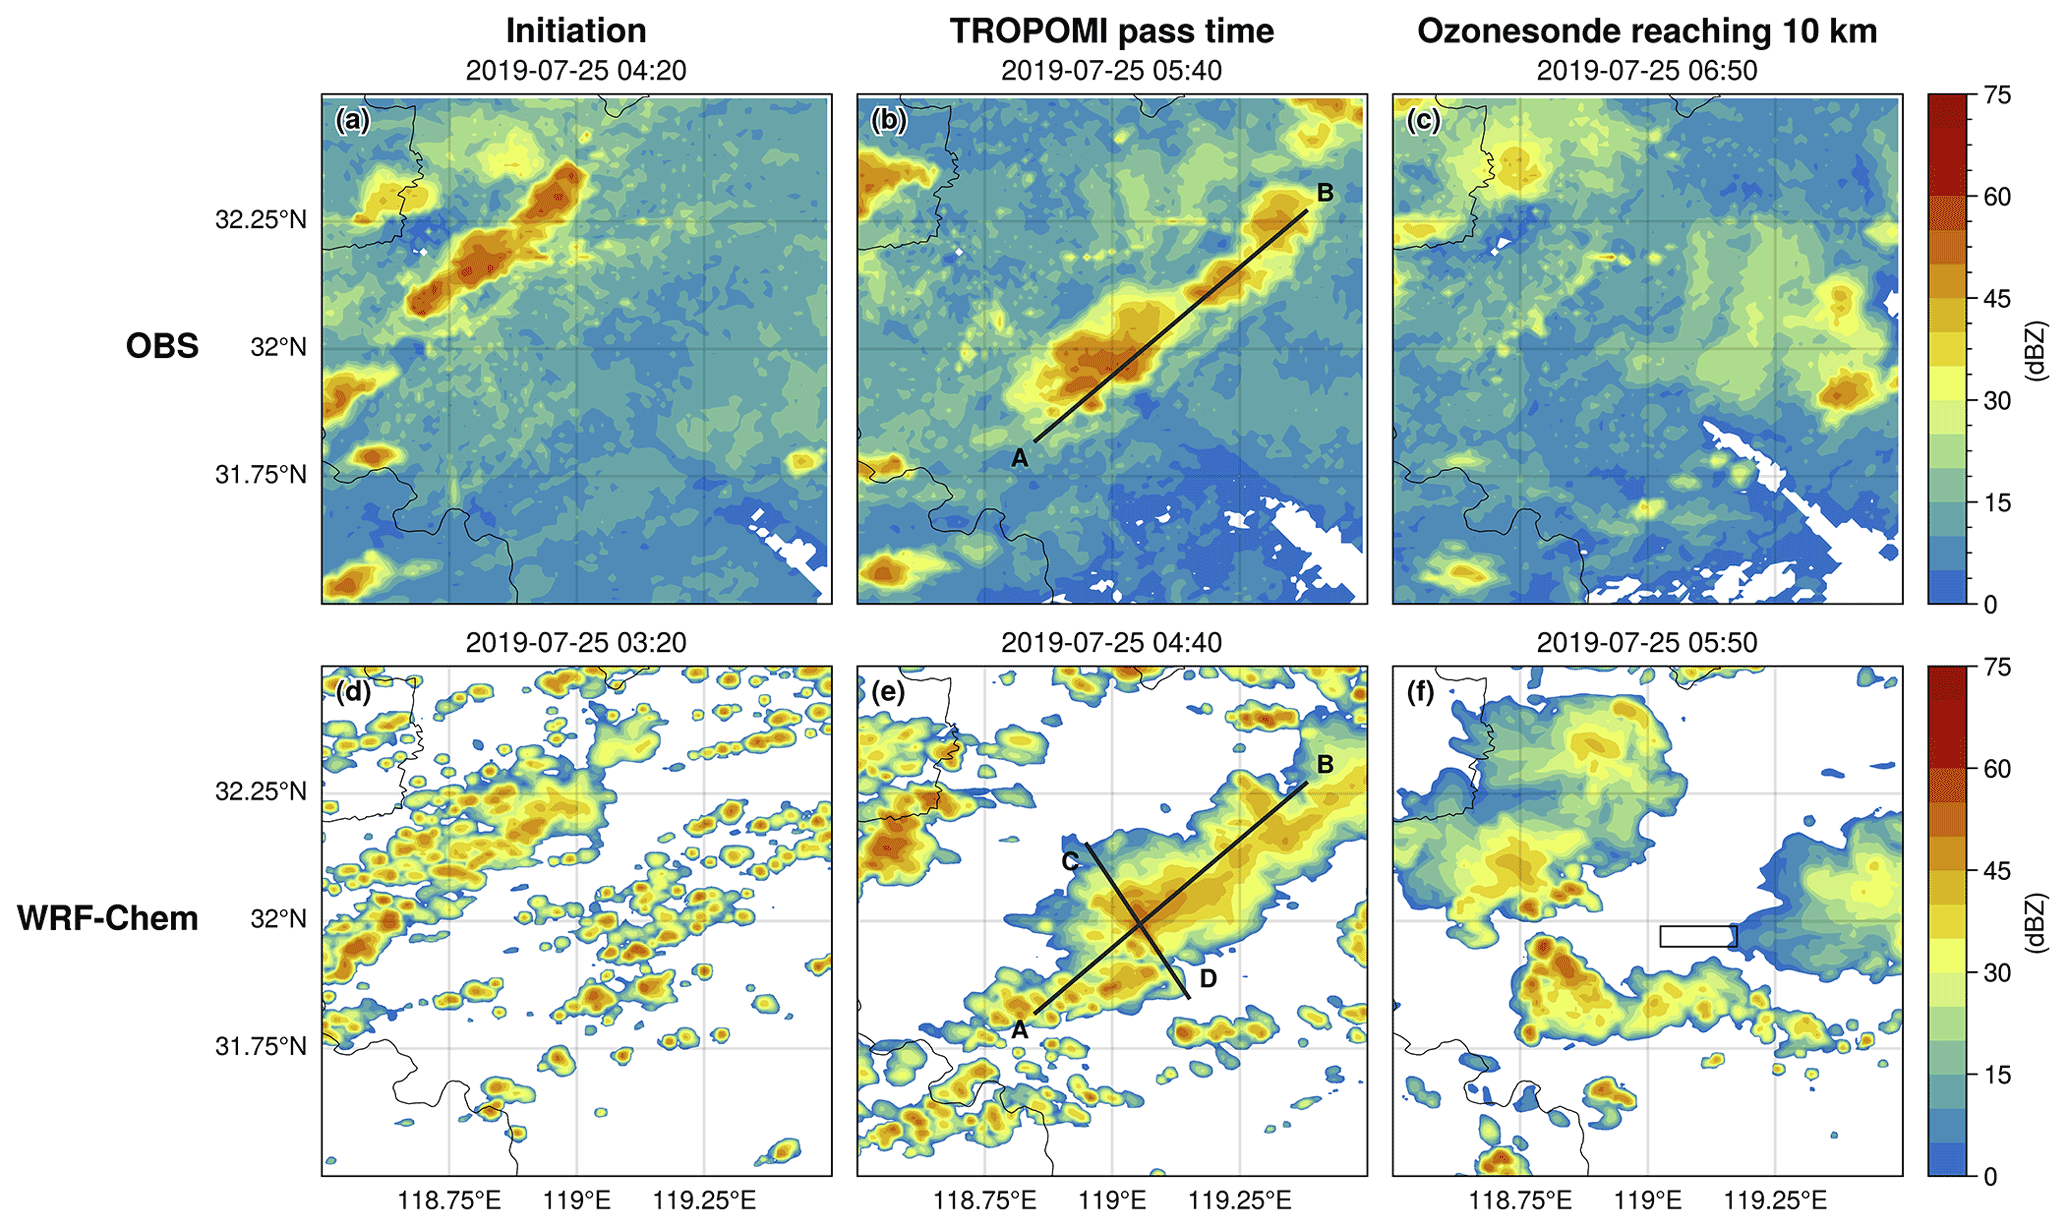
Figure 2Observed radar composite reflectivity at (a) 04:20, (b) 05:40, and (c) 06:50 UTC. (d–e) WRF-Chem simulated composite reflectivity 1 h before the radar observation times. The A–B solid lines in (b) and (e) are cross-section lines for Fig. S3. The C–D solid line in (e) is the cross-section line for Fig. 4b. The black rectangle is the region for the comparison with ozonesonde.
The measured O3 and Qv profiles at different convection stages are shown in Fig. 1c and d. Generally, the observed UT O3 and Qv are higher with convection, while the largest enhancements are between 10 and 16 km. However, the 2020 case showed a larger increase in the lower troposphere (2–8 km, LT). Additionally, a two-valley shape of O3 profile exists in both cases but at different levels: 2 and 8 km for the 2019 air mass and 4 and 10 km for the 2020 squall line. Although the WRF-Chem model tends to underestimate the O3 concentration in the LT and UT for the 2019 and 2020 cases, respectively, it can reproduce the detailed O3 structures and provide the opportunity to analyze the mechanisms of convection.
Three possible sources can explain the enhancements of O3 in the UT: convective transport, chemical production, and O3 directly produced by lightning. Only the first two factors are discussed in detail in Sect. 4 as lightning O3 is beyond the scope of this study and still uncertain, as shown by limited observations and model simulations (Morris et al., 2010; Ripoll et al., 2014).

Figure 3Same as Fig. 2 but for the case on 1 September 2020. The simulation time is 30 min ahead of each radar observation.
To evaluate the higher UT O3 concentration after the convection, the mean vertical profiles of O3 in the atmospheric regions passed by the ozonesondes are illustrated at three stages of convection: initiation, development, and dissipation (Fig. 4a and d). The UT O3 increases continuously during the whole cycle of the 2020 case, but for the 2019 case, it declines at the developing stage because of the uplift of O3-poor air, while later it starts rising again. This phenomenon can be explained by the O3 vertical cross sections at the developing stages (Fig. 4b and e). For the 2019 case, the cells of low O3 concentration reach 16 km by the updraft, and then the high O3 air wrapped behind the convection moves into the region. However, the observed increasing O3 of the 2020 case is mostly from the vertically transported background O3.
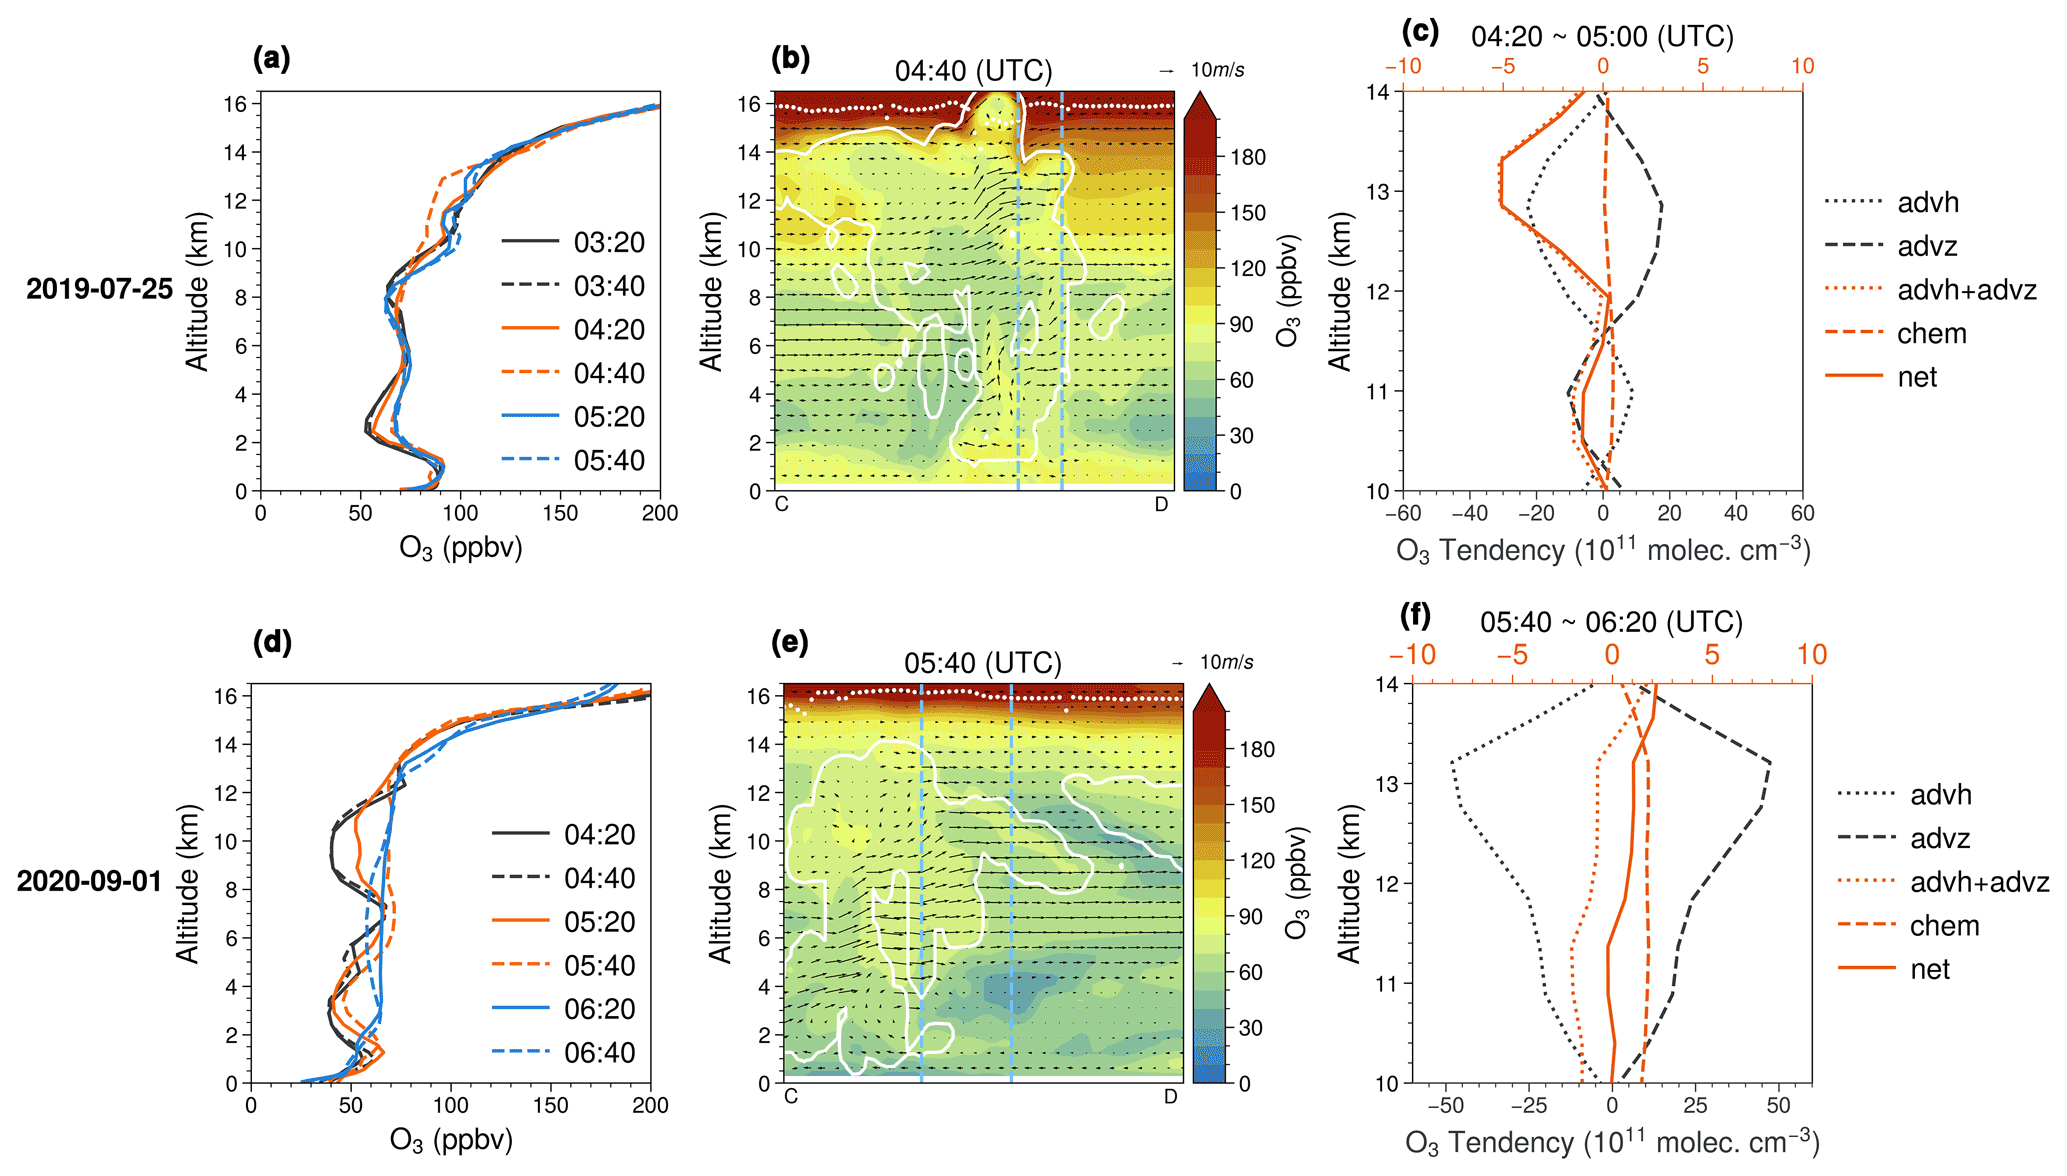
Figure 4(a, d) The mean O3 profiles in the regions passed by the ozonesondes at three stages: initiation (black), development (orange), and dissipation (blue). (b, e) Vertical O3 distribution within the convective periods along the line crossing the convective core (Figs. 2e and 3f). The dashed blue lines stand for the boundaries of regions passed by the ozonesondes, and the lapse rate tropopause is shown as the white dots. The cloud boundaries (the sum of cloud liquid water mixing ratio [qcloud] and ice mixing ratio [qice] ≥ 0.01 g kg−1) are shown with white lines. (c, f) The vertical distributions of the O3 net production rate and tendency due to horizontal advection (advh), vertical advection (advz), and chemistry (chem) during the convective periods.
To determine the processes causing the differences between the two cases, we analyzed the outputs of mean integrated physical rates (IPRs) from 10 to 14 km during the convective period (Fig. 4c and f). Generally, the opposite trend of the horizontal advection (advh) and vertical advection (advz) governs the net decrease in the UT O3 production rate of the 2019 case. Note that the advz contribution is negative between 10 and 11.5 km and positive between 11.5 and 13.8 km. This is due to the uplifted O3-poor air and downward O3-rich air caused by the stronger updraft compared with the 2020 case. As indicated by the higher Qv after convection (Fig. 1c) and tropopause height (Fig. 4b), the updraft of the 2020 case is not strong enough to wrap the stratospheric O3 like the mesoscale convective system (Phoenix et al., 2020). While the dynamic processes play an important role in the O3 production, the positive chemistry contribution cannot be neglected in both cases and leads to the net increase in UT O3 during the convective period of the 2020 case. Specifically, the chemistry increases O3 in both cases, and the magnitude of the effect is 5–10 times that of dynamic effects. This demonstrates the dominant chemistry role in the overall effects of convection.
Furthermore, the IPR outputs including LNO emissions are compared with these excluding LNO to explore the effects of LNOx on O3 (Table 1). The LNOx reduces the net O3 production by 25 % during the convective period and life cycle of the 2019 case. The decreased chemistry contribution is less significant (≤ 1 %) for the 2020 case which has a smaller lightning density near the station. Note that the LNOx can certainly enhance the downwind ozone production on the scale of days (Pickering et al., 1996; DeCaria et al., 2005). Therefore, it is necessary to estimate the LNOx PE accurately (discussed later in Sect. 6.2).
Additionally, the convection was divided into three regions by TROPOMI data: fresh lightning, downwind of fresh lightning, and aged lightning (See Sect. 6.1 and Fig. 8 for details). Firstly, the difference of O3 (ΔO3) profiles is obtained with different LNO PE assumptions (Fig. 5a–c). In contrast with the net loss of ozone (< 4 ppbv) over all height levels in Ott et al. (2007), the ΔO3 is mostly positive (< 1 ppbv) between 2 and 5 km and negative ( ppbv) between 5 and 12 km in our cases. The higher PE (700 mol per flash) slightly reduces the O3 concentration by less than 1 ppbv at all levels compared with the default PE (500 mol per flash), and it even leads to negative ΔO3 between 2 and 5 km downwind of fresh lightning (Fig. 5b). The maximum O3 loss is between 8 and 10 km due to the peak of LNOx (up to 2.6 ppbv) introduced in the model.
Then, the integrated reaction rate (IRR) is applied to determine the chemistry mechanism and the effect of LNO on the O3 variation for two layers in which the ΔO3 is opposite: 800–500 hPa (ΔO3>0) and 500–200 hPa (ΔO3<0). The tropospheric O3 is mainly controlled by five reaction rate terms (Pickering et al., 1990; Bozem et al., 2014):
where ki is the rate coefficient of the reaction between peroxy radicals (RiO2) and NO. The time series of each contribution to O3 production are illustrated in Fig. 5d–i. Overall, the time series of IRR are more variable for the 2019 case due to the stronger activity as clarified in Sect. 4. The total net chemistry production of O3 remains positive for both layers. In detail, the reaction between NO and HO2 always dominates the production, while the oxidation of NO by RO2 is about 40 %–60 % of that production. The dominant loss of O3 is the photolysis (described by the reaction of O(1D) and H2O), while the reaction between O3 and OH is comparable during the convective period. The lowest contribution to O3 loss, O3 + HO2 → OH + 2O2, is reduced during the convection because of the production of LNO which captures the HO2 reacting with O3. Note that although the increase in total IRR induced by LNOx can reach 1.36 × 10⁷ and 2.60 × 10⁶ molec. cm−3 s−1 in the low layer and high layer over these three regions, respectively, the net O3 production actually decreases in the high layers (Fig. 5a–c) due to the combination of dynamic transport and chemical production related to LNOx.
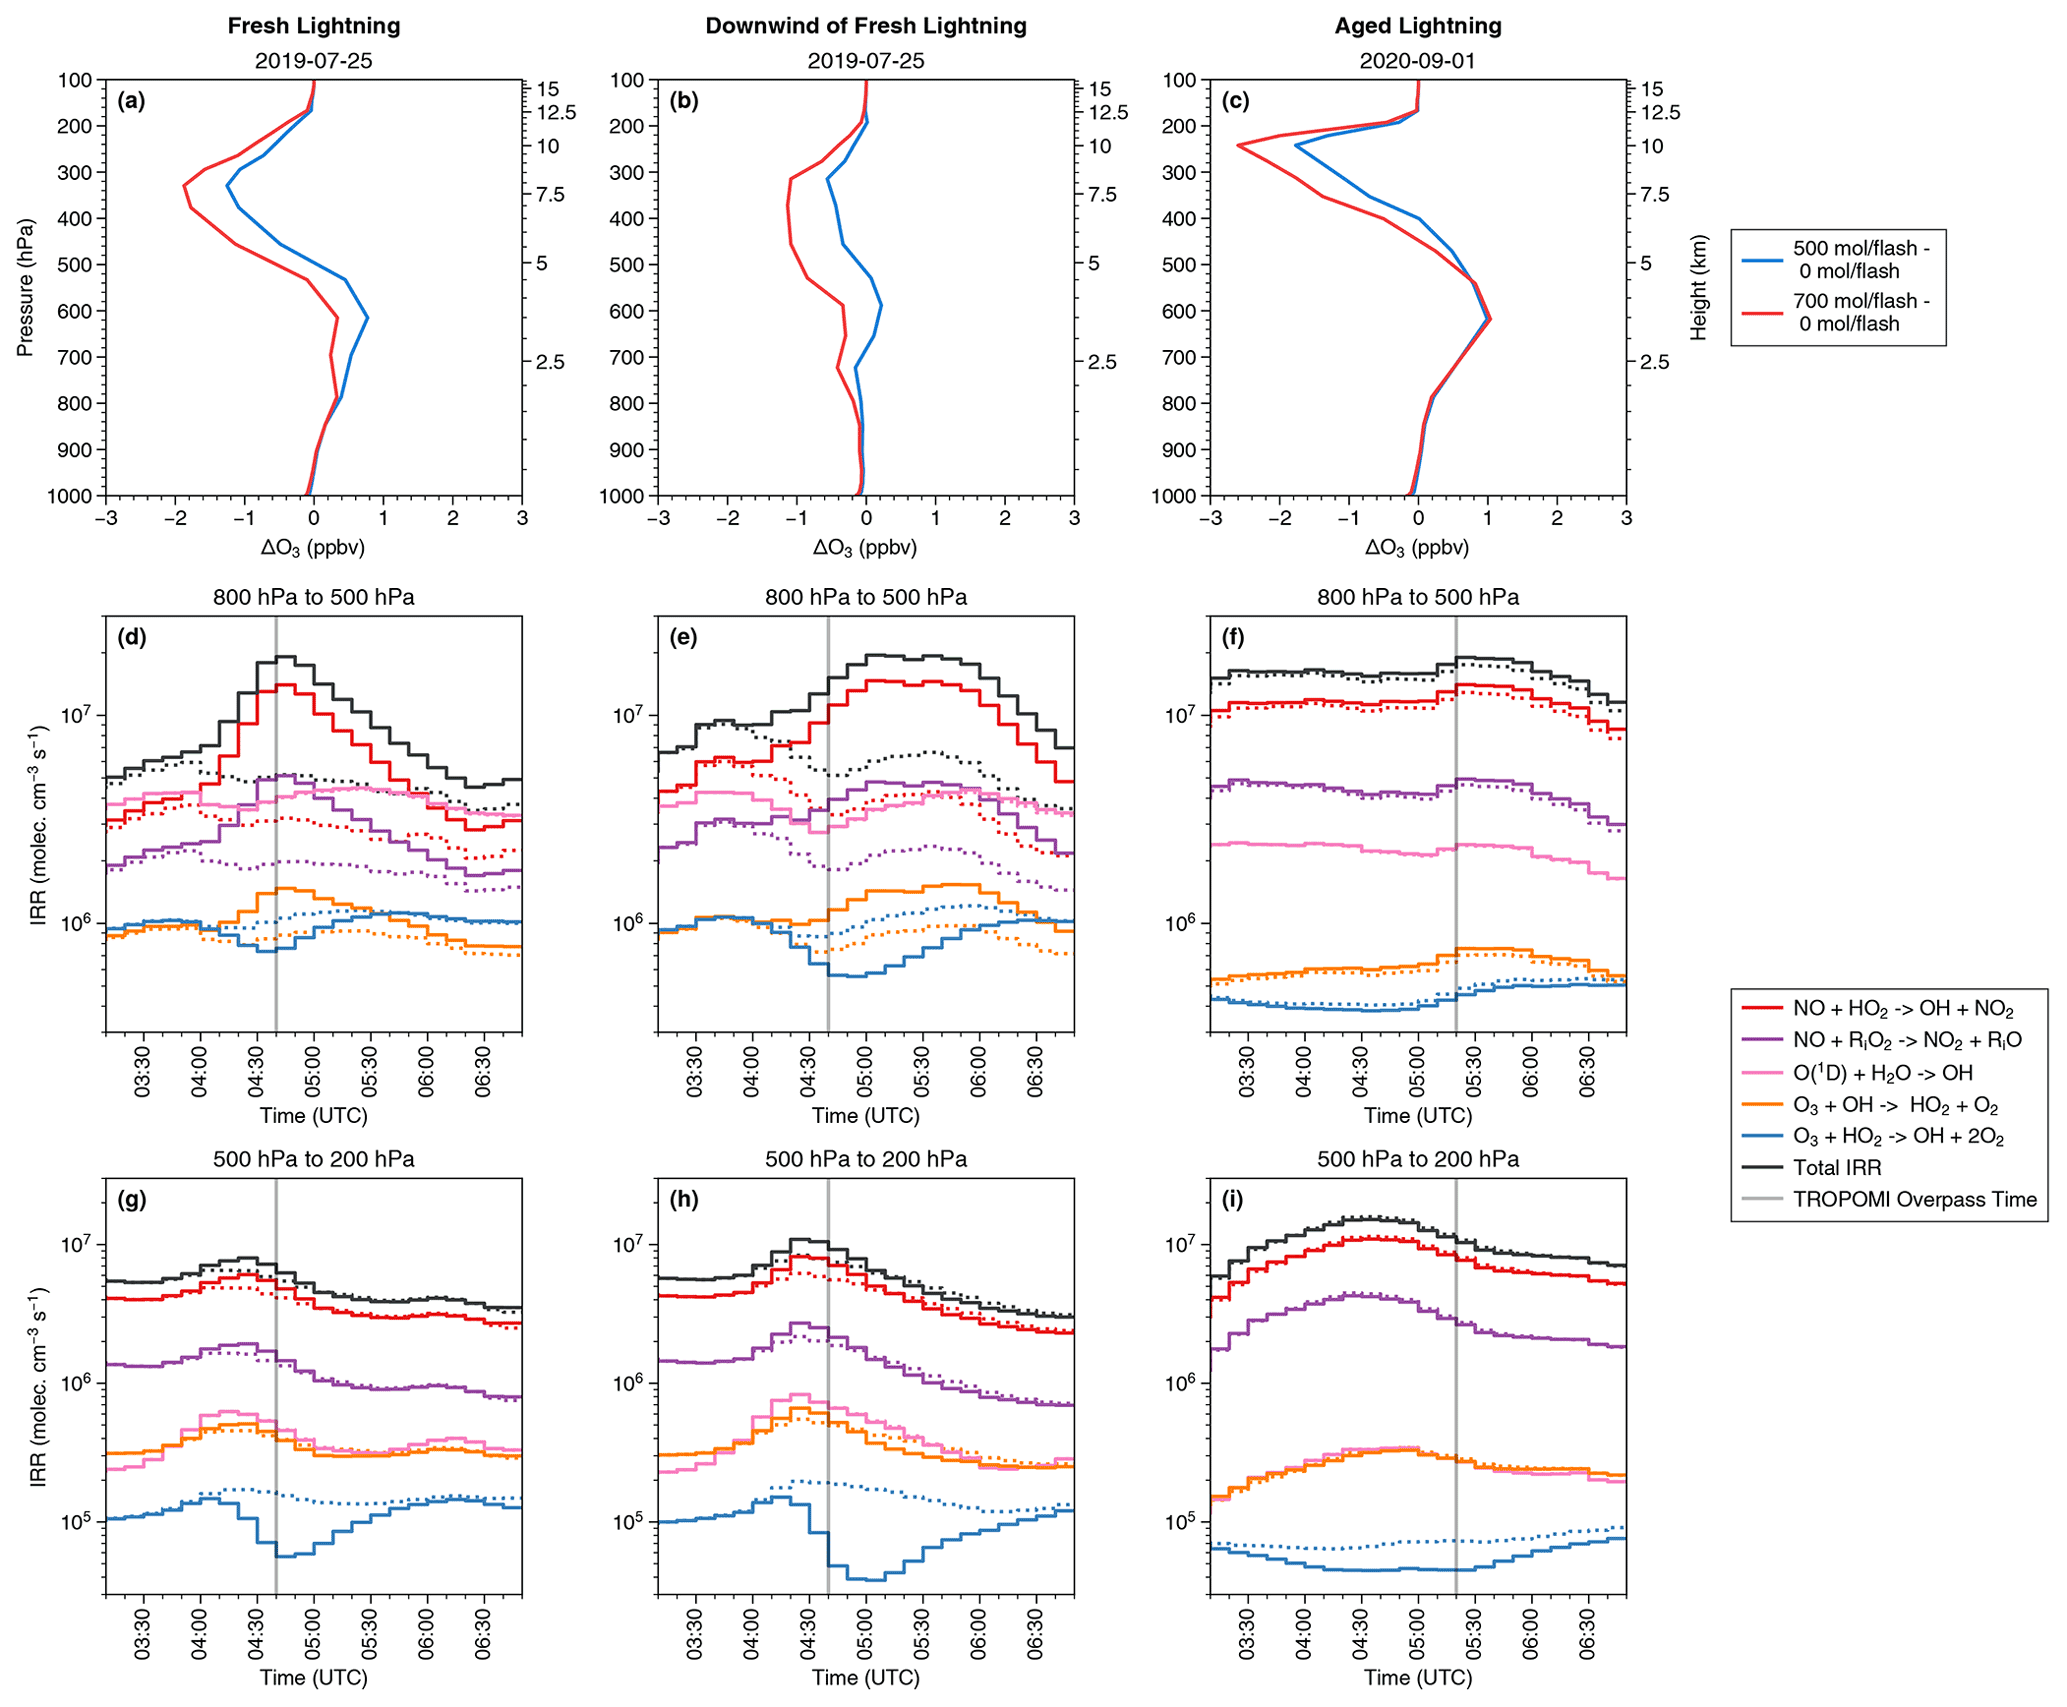
Figure 5(a–c) Changes in O3 profiles due to LNOx at TROPOMI overpass time in three regions (fresh lightning region, downwind of fresh lightning, and aged lightning area) as defined in Fig. 7. (d–f) Time series of the mean integrated reaction rate (IRR) between 800 and 500 hPa. The legend shows detailed species and reactions. The “total IRR” is the O3 loss IRR subtracted from the O3 production IRR (red and purple lines). The solid line shows the IRR with LNO (500 mol per flash), while the dashed line is without LNO. (g–i) Same as (d)–(f) but between 500 and 200 hPa.
6.1 Relation between lightning and TROPOMI products
As the LNOx production estimation from TROPOMI depends upon the SCD, we compare the SCD distributions with the observed lightning flashes (Fig. 6a–d). Although the SCD over the most active pixels is not valid due to the detector saturation and blooming effect, the nearby or outflow regions still have useful data. While the flashes occurred less than 30 min before the TROPOMI overpass time in the 2019 case, the 2020 case had both fresh and aged LNO2 (Fig. 6d).

Figure 6Events on 25 July 2019 (a, c) and 7 September 2020 (b, d). (a, b) The tropospheric NO2 slant column density (SCD, filled color) and cloud optical pressure (line color). These white grid cells stand for missing TROPOMI data (no2_scd_flag ≠ 0), as defined in Appendix A. The solid black border is Jiangsu Province. (c, d) The cloud radiance fraction in the NO2 window and flashes whose color depends on the occurrence time relative to the TROPOMI overpass time.
Specifically, the SCD of the convective pixels (fr ≥ 0.7) is smaller than that in other regions. This is opposite to previous studies of large-scale convective systems with high flash density (Beirle et al., 2009). Four factors could lead to this unexpected result: the cloud top heights, flash counts, flash occurrence time, and background NO2. Either the inadequate flash or weak convection could lead to a smaller SCD over pixels with fr ≈ 1 because TROPOMI can only see the LNO2 above the clouds. In other words, the polluted NO2 below the broken or thinner clouds is partially exposed if fr < 1. The sensitivity tests of the WRF-Chem a priori SCD can help explain this phenomenon clearly (Fig. S5). The pixels of high SCD with low cloud fraction belong to background NO2 pollution (Fig. S5a and e), but the SCD increased by UT LNO2 is still visible compared with the lower SCD without LNO2 (Fig. S5b–d and f–h).
An LNO PE upper limit of 700 mol NO per flash (Ott et al., 2010) is applied to WRF-Chem for investigating the importance of LNOx for the AMFtrop and AMF calculations. The changes in the retrieved AMFs are examined by replacing profiles in three tropospheric layers independently: middle troposphere (MT, 800 to 400 hPa), upper troposphere (UT, 400 to 150 hPa), and troposphere (surface to tropopause). Unless otherwise specified, the changes in AMFs are obtained by increasing LNOx in this section. Figure 7 shows that the AMF changes are mostly controlled by the LNOx in the UT layer where the detection sensitivity is high (Beirle et al., 2009; Laughner and Cohen, 2017) and the LNOx production reaches the peak (Fig. S6). While the AMF decreases by 5 %–40 % for both cases, the changes in AMFtrop (ΔAMFtrop) are regionally specific and can be classified by the lightning activity: fresh lightning (MT ΔAMF %), downwind of fresh lightning (MT ΔAMFtrop>20 %), and aged lightning (UT ΔAMFtrop>20 %). Figure 8a illustrates the relationship between pcloud and fr over these three regions. The clouds are higher than 400 hPa (pcloud<400 hPa), and fr is larger than 0.8 over fresh lightning pixels, but both aged lightning and downwind of fresh lightning areas have clouds lower than 400 hPa. This coincides with the mean cloud pressures in Fig. S6 and explains why UT ΔAMFtrop>20 % exits in Fig. 7bi and biii, indicating the possibility of LNOx estimations over the aged lightning regions (Sect. 6.2).
Table 1Process analysis table for the mean O3 integrated tendencies (10–14 km).
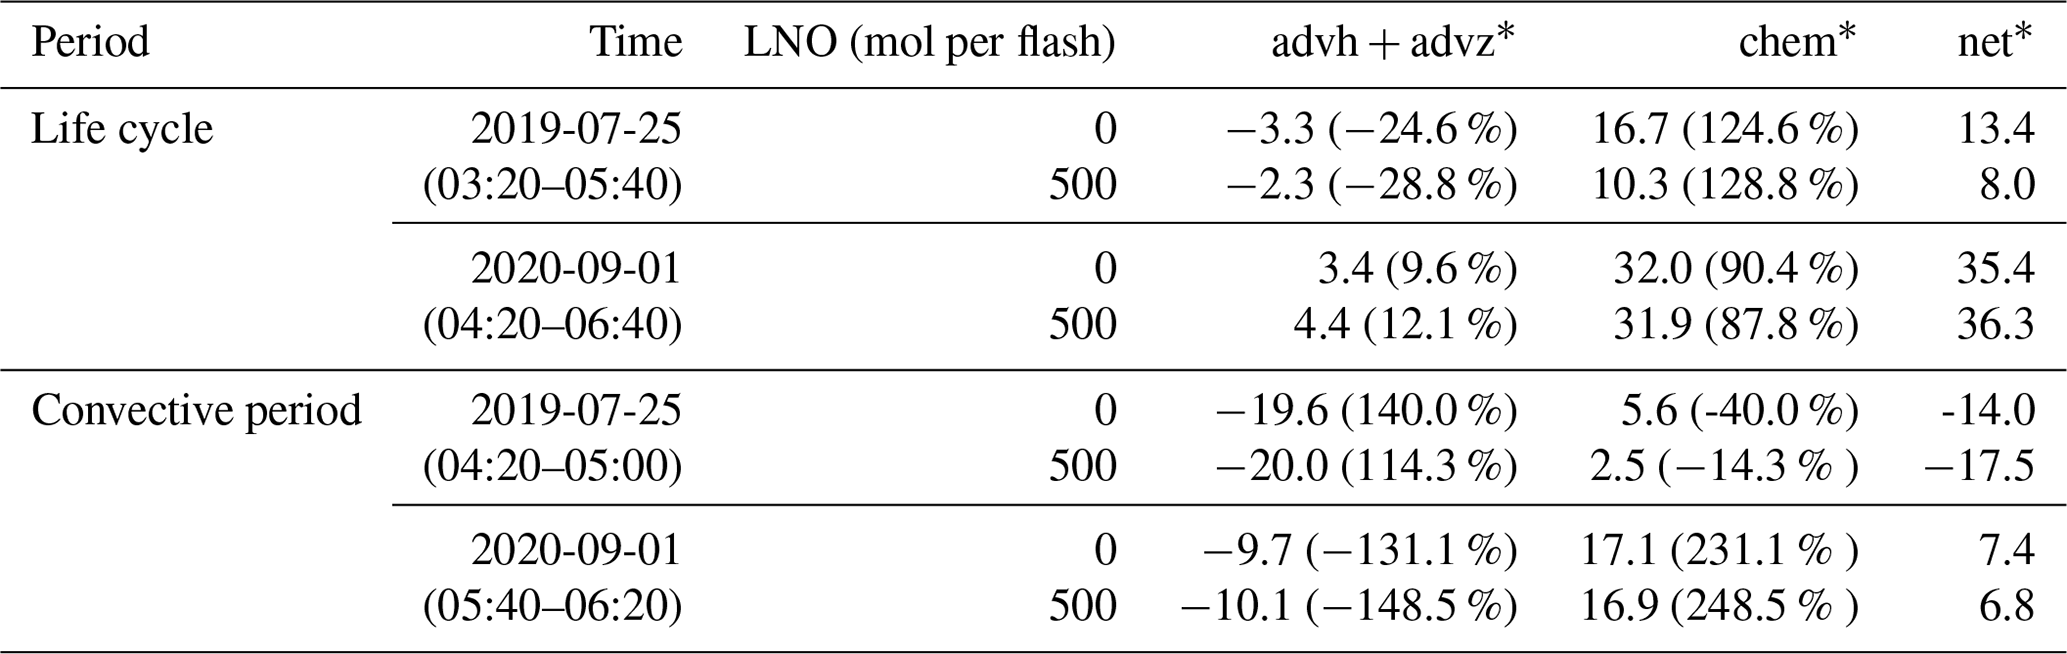
* The unit is 1010 molec. cm−3. The percentage is the proportion of each part in the net O3 change.
As defined in Appendix B, SCD SCD and VCD VCD can be used to determine which parameter controls ΔAMFtrop: enhanced a priori SCD or a priori VCD (Fig. 8b–d). Briefly, the dominant one belongs to the larger ratio. First, if the LNO2 is included in the tropospheric layer of a priori NO2 profiles (Fig. 7ci), the AMFtrop decreases over most fresh lightning pixels because of the increased a priori VCD (Fig. 8b). The situation is opposite for the downwind of the fresh lightning region. There the AMFtrop is larger no matter which layer is chosen (Fig. 7ai–ci) because the LNO2 was convected, reached above the cloud top, and led to the larger a priori SCD (Fig. 8c). Interestingly, for the 2020 case, the AMFtrop of aged lightning pixels increases more than 50 % for the UT layer (Fig. 7biii). It demonstrates the important role of advected UT LNO2 and that the cloud exists as a barrier, causing the difference between a priori SCD and a priori VCD (Fig. 8d). Although the difference is smaller than that of the other two regions due to the LNO2 lifetime, it is still useful for retrieving the LNOx. Moreover, considering the region-specific LNOx effects on AMFs, we need to include the representation of LNO2 in the TROPOMI NO2 retrievals better, especially outflow regions. The comparisons (Fig. S6) between the TROPOMI standard NO2 profiles from TM5-MP and WRF-Chem also illustrate the importance of LNOx, resolved convection transport, and emissions. Aircraft observations of NO and NO2 will be useful to determine the exact roles (Laughner and Cohen, 2017).

Figure 7The percent differences of AMFs by replacing the a priori NO2 profiles at three layers: middle troposphere (left), upper troposphere (middle), and troposphere (right). ΔAMFtrop is the comparison of the AMFtrop with 500 mol NO per flash relative to 0 mol NO per flash. ΔAMF is the comparison of the AMF with 700 mol NO per flash relative to 500 mol NO per flash. Three regions are annotated: fresh lightning (blue), downwind of fresh lightning (red), and aged lightning (black). Because of the quite large AMF values in pixels with little lightning, ΔAMF is shown over pixels where 0 < AMF < 10.

Figure 8(a) The relationship between cloud pressure and cloud radiance fraction for three regions defined in Fig. 7: fresh lightning region, downwind of fresh lightning, and aged lightning area. (b–d) The a priori SCD/SCD and a priori VCD/VCD of pixels in these three regions. The LNOx superscript indicates that the a priori variable is calculated with LNOx (500 mol NO per flash), and the noLNOx superscript is without LNOx.
6.2 Estimations of LNOx
Satellite observations with fresh convection are usually used to estimate the LNOx PE. However, it is difficult to apply the same method to regions with small convection like the 2019 case because of the pixel saturation of TROPOMI and limited coverage of convective area (Fig. 6c). Instead, we focus on dissipated convection, which is the southern part of the 2020 case, while the northern part has multiple missing values regardless of the adequate flashes and high cloud fractions. As shown in Fig. 9b–c, the time differences between flashes and TROPOMI overpass time are longer than 30 min but shorter than 3 h. Since the lifetime of NO2 is ∼ 3 h in or near the field of convection (Nault et al., 2016) and ranges from 2 to 12 h depending on the convective location, these pixels can still be used for the LNOx estimation. Equation (5) is applied to determine the mean LNOx PE (mol per flash):
where p stands for pixels affected by LNOx, Vi (mol m−2) is the LNOx vertical column densities (VCD SCD AMF) over pixel i with an area called Ai (m2), N is the total number of flashes contributing to VCD, and the exponential component considers the lifetime of NOx for each flash (Fj). Specifically, t0 is the time of TROPOMI overpass, tj is the time of the lightning flash, and τ represents the NOx 3 h lifetime near convection.
As the dissipated convection produced enough lightning and the UT winds within the storm were blowing from west-northwest to east-southeast (Fig. 9a), the pattern of VCD can still be clearly identified (dashed rectangle in Fig. 9). Fortunately, there is a low VCD strip separating the northern and southern convection. With the careful selection, the LNOx PE is estimated as 60 mol NOx per flash. Although there are a few lightning flashes related to the VCD outside of the region selection, it only affects the LNOx PE by ≈ 2 mol, which is within the uncertainty discussed below.
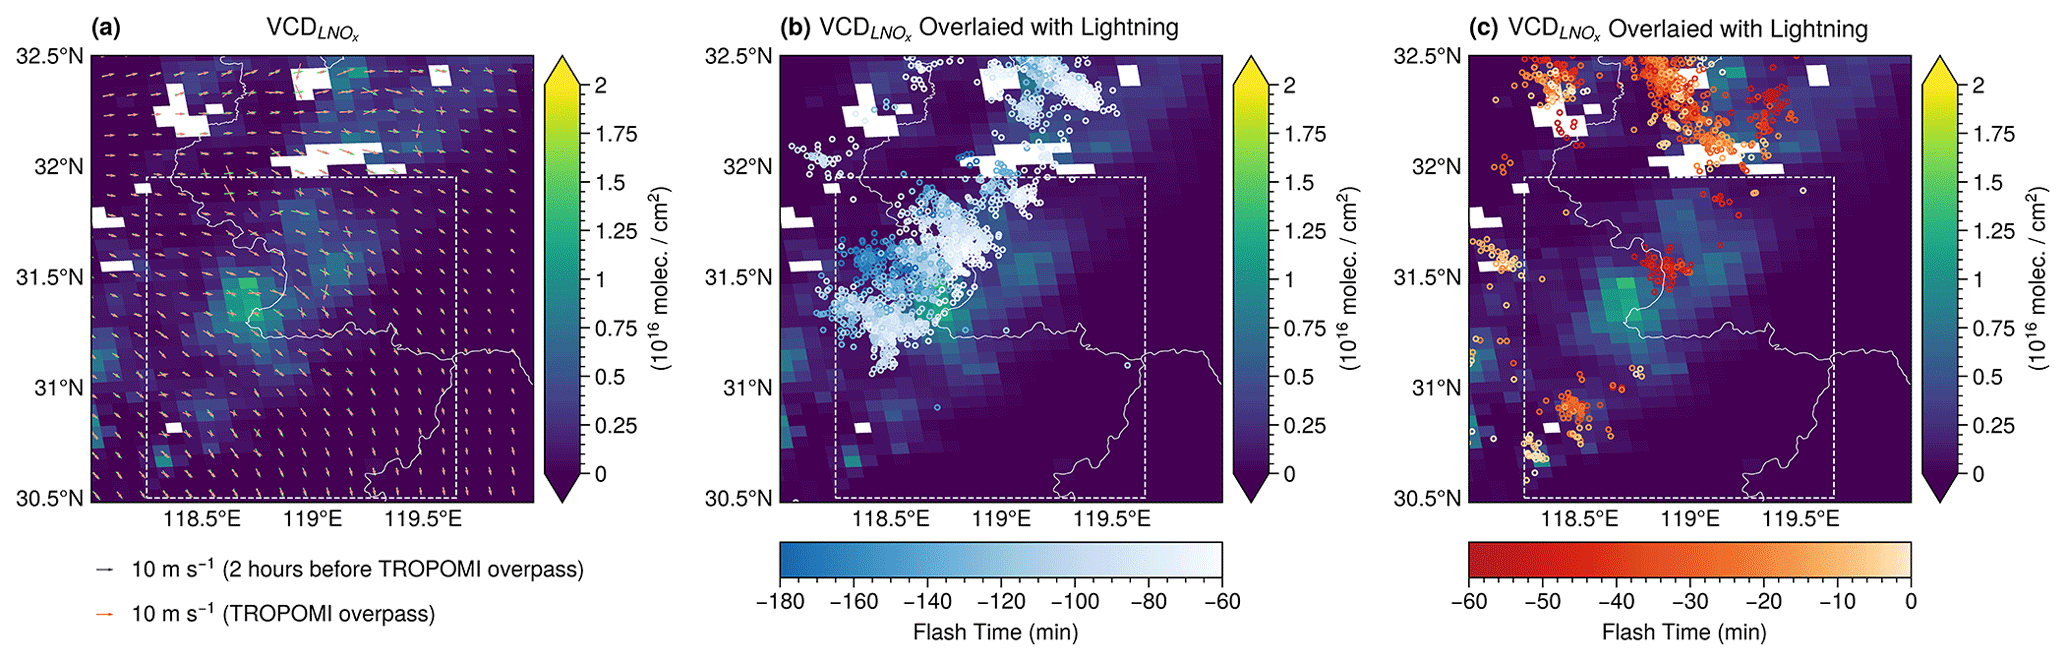
Figure 9The background is the distribution of LNOx vertical column densities (VCD). The white rectangles are manually selected regions for the LNOx PE estimation. The overlaid wind arrows in (a) are the 500 hPa horizontal wind simulated by WRF-Chem. The lightning dots in (b) and (c) are the flashes whose color depends on the occurrence time relative to the TROPOMI overpass time.
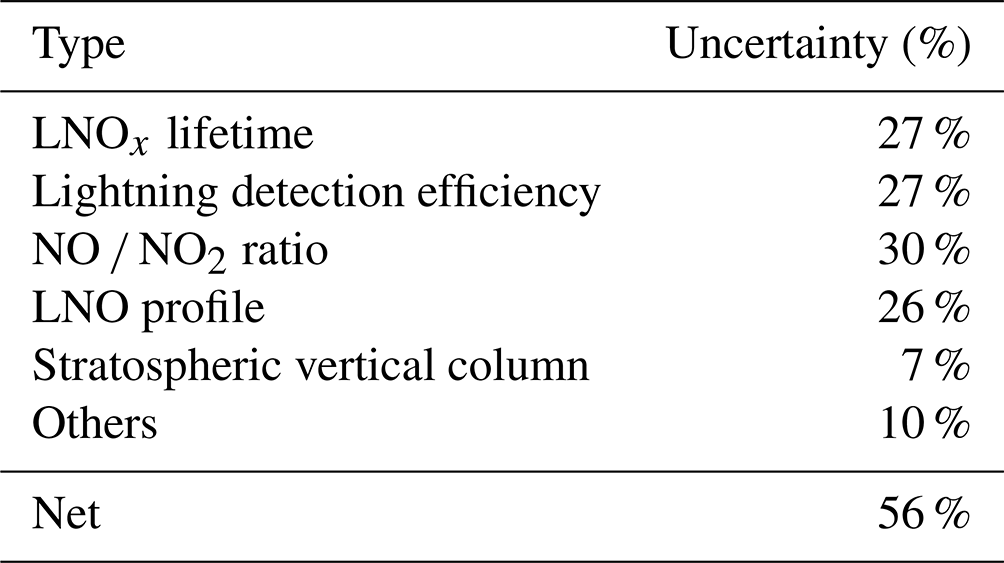
Following Allen et al. (2019) and Zhang et al. (2020), the uncertainty of LNOx is determined by the LNOx lifetime, lightning DE, NO / NO2 ratio, LNO profile, and other sources (summarized in Table 2). The lifetime (τ) of NO2 is replaced by 2 and 6 h to evaluate the uncertainty as 27 %, while another uncertainty is also 27 %, which is related to lightning DE by changing the ratio of IC to CG to 2:1 and 4:1. The uncertainty caused by modeled NO / NO2 ratios is assumed to be 30 % based on Allen et al. (2019), and the uncertainty related to the LNO profile is 26 % by using the a priori NO2 profile with 330 and 700 mol NO per flash. The uncertainty associated with the stratospheric vertical column is considered as 7 % by applying a bias of ± 1014 molec. cm−2 (van Geffen et al., 2022). The uncertainty caused by other possible error sources including systematic errors in slant columns, optical cloud pressure, and NO2 redistributed by convection is difficult to quantify and is assumed to be 10 % following Allen et al. (2021). Assuming no correlation between errors, the total uncertainty (56 %) is estimated as the square root of the sum of the squares of all individual uncertainties. As a result, the LNOx PE is 60 ± 33 mol NOx per flash. It is less than that of our previous work (90 ± 50 mol NOx per flash) over the continental United States (Zhang et al., 2020) and at the lower end of 120 ± 65 mol NOx per flash obtained in Allen et al. (2021). Thus, more studies over China are necessary for the estimation of region-dependent LNOx PEs.
Table 2Uncertainties for the estimation of LNOx production efficiency.
Both the 2019 and 2020 cases saw enhanced UT O3 concentrations according to the ozonesonde observations. As revealed by the WRF-Chem model, the dynamic contribution of O3 variation in the 2019 case was generated by mixing with the UT O3-rich air due to strong updraft, while it was caused by vertical advection of high background O3 in the 2020 case. The detailed analysis of integrated physical rates shows that the dynamic processes dominate the UT O3 decrease during the convective stage of both cases. However, in the convection life cycle, the contribution of chemistry reactions to the UT O3 production is 5–10 times that of dynamics. Moreover, the UT O3 enhancement of the 2019 case decreases by 40 % if the lightning nitrogen oxides (LNOx) are included in the model, indicating the importance of the LNOx. Utilizing the outputs of integrated reaction rates improves our understanding of the chemical reactions and effects of lightning nitrogen oxides (LNOx) on O3. While the reaction of NO and HO2 dominates the production of O3, the O3 loss processes are suppressed because the LNOx reacts with the HO2 which is the reactant in the production.
The WRF-Chem results are incorporated into the retrieval algorithm to explore how LNOx affects the official TROPOMI products and prove that TROPOMI is useful for LNOx studies over small-scale convection regions. The sensitivity tests imply that air mass factors of tropospheric NO2 are smaller for fresh lightning regions and the opposite for the aged lightning pixels or downwind of fresh lightning. The air mass factors of tropospheric LNOx always decrease with increased LNOx. Since the LNOx affects the variation in tropospheric NO2 in the outflow regions, better consideration of LNOx is essential for studies of the tropical and mid-latitude regions in summer.
Because the saturation of TROPOMI pixels and blooming effects lead to the failure of detecting LNOx over active convection, we focus on the dissipation regions where aged LNOx still exists. The production efficiency is estimated to be 60 ± 33 mol LNOx per flash, which is less than but still within the range of previous studies. Although the current results are limited, the technique can be implemented worldwide to region-specific LNOx retrievals. To quantify and refine the LNOx production estimates, TROPOMI data over both active and dissipated convection could provide valuable information.
The no2_scd_flag is introduced to make the usage of the NO2 slant column density (SCD) data easier by gathering information from a few variables into one flag (Table A1). This flag can thus be used for filtering, though with care as it probably does not cover all possible situation. Here “δ” refers to the SCD error (in mol m−2), and “pqf” stands for processing quality flag.

In Fig. 8b–d, the contribution of LNOx to ΔAMFtrop is divided into two parts: SCD SCD and VCD VCD, where the LNOx superscript indicates that the a priori variable is calculated with LNOx (500 mol NO per flash), and the noLNOx superscript is without LNOx. The two contributions are derived by taking the logarithms of Eqs. (B1) and (B2) and then subtracting them in Eq. (B3). Here, several abbreviations are defined to simplify the symbols: S is SCD, V is VCD, subscript 1 is with LNOx, and 0 is without LNOx.
Therefore, if is larger than (the solid line is higher than the dashed line in Fig. 8b–d), then AMF1 is larger than AMF0. In other words, these two variables determine how a priori LNOx affects the retrieval of NO2.
Data used are obtained from https://www.acom.ucar.edu/waccm/download.shtml (Gettelman et al., 2019) (WACCM), http://meicmodel.org/ (Tsinghua University, 2022) (MEIC), and https://www.acom.ucar.edu/wrf-chem/download.shtml (Guenther et al., 2012) (MEGAN). The relevant data and analysis code are hosted at https://github.com/zxdawn/Xin_ACP_2021_Convection_Effect (Zhang, 2021a, b). The modified WRF-Chem source code is available to the public at https://github.com/zxdawn/WRF-Chem-LDA-LFR (Zhang, 2021c). The retrieval algorithm is available at https://github.com/zxdawn/S5P-WRFChem (Zhang, 2021d).
The supplement related to this article is available online at: https://doi.org/10.5194/acp-22-5925-2022-supplement.
YY directed the research, and YY, XZ, and RvdA designed the research with feedback from the other co-authors. XZ, RvdA, HE, and JvG developed the retrieval algorithm. XZ modified lightning assimilation code written by YL. JLL provided guidance and supporting data on the ENTLN data. XZ, KC, XK, ZZ, JH, CH, JZ, XY, and HC participated in the field campaigns. XZ performed simulations and analysis with the help of YY, RvdA, XK, JC, CH, and RS. XZ, YY, RvdA, and JLL interpreted the data and discussed the results. XZ drafted the manuscript with comments from the co-authors. RvdA, YY, and JLL edited the manuscript.
The contact author has declared that neither they nor their co-authors have any competing interests.
Publisher’s note: Copernicus Publications remains neutral with regard to jurisdictional claims in published maps and institutional affiliations.
We thank the Earth Networks Company for providing the Earth Networks Total Lightning Network (ENTLN) datasets. We acknowledge the use of the computational resources provided by the National Supercomputer Centre in Guangzhou (NSCC-GZ). We appreciate the discussions with Ryan M. Stauffer for ozonesonde measurements and Mary Barth for the WRF-Chem lightning NOx module. Finally, we thank all contributors of the Python packages used in this paper, especially ProPlot and Satpy (Davis, 2021; Raspaud et al., 2018, 2021).
This research has been supported by the National Natural Science Foundation of China (grant nos. 91644224 and 42075067) and the Postgraduate Research & Practice Innovation Program of Jiangsu Province (grant no. KYCX20_0922).
This paper was edited by Michel Van Roozendael and reviewed by three anonymous referees.
Allen, D. J., Pickering, K. E., Duncan, B. N., and Damon, M.: Impact of Lightning NO Emissions on North American Photochemistry as Determined Using the Global Modeling Initiative (GMI) Model, J. Geophys. Res.-Atmos., 115, 4711, https://doi.org/10.1029/2010jd014062, 2010. a
Allen, D. J., Pickering, K. E., Bucsela, E., Krotkov, N., and Holzworth, R.: Lightning NOx Production in the Tropics as Determined Using OMI NO2 Retrievals and WWLLN Stroke Data, J. Geophys. Res.-Atmos., 124, 13498–13518, https://doi.org/10.1029/2018JD029824, 2019. a, b, c, d
Allen, D. J., Pickering, K. E., Bucsela, E., Geffen, J. V., Lapierre, J., Koshak, W., and Eskes, H.: Observations of Lightning NOx Production from TROPOMI Case Studies over the United States, J. Geophys. Res.-Atmos., 126, e2020JD034174, https://doi.org/10.1029/2020JD034174, 2021. a, b, c, d, e
Bandholnopparat, K., Sato, M., Adachi, T., Ushio, T., and Takahashi, Y.: Estimation of the IC to CG Ratio Using JEM-GLIMS and Ground-Based Lightning Network Data, J. Geophys. Res.-Atmos., 125, e2019JD032195, https://doi.org/10.1029/2019jd032195, 2020. a
Barth, M. C., Rutledge, S. A., Brune, W. H., and Cantrell, C. A.: Introduction to the Deep Convective Clouds and Chemistry (DC3) 2012 Studies, J. Geophys. Res.-Atmos., 124, 8095–8103, https://doi.org/10.1029/2019jd030944, 2019. a, b
Beirle, S., Salzmann, M., Lawrence, M. G., and Wagner, T.: Sensitivity of Satellite Observations for Freshly Produced Lightning NOx, Atmos. Chem. Phys., 9, 1077–1094, https://doi.org/10.5194/acp-9-1077-2009, 2009. a, b, c, d
Bozem, H., Fischer, H., Gurk, C., Schiller, C. L., Parchatka, U., Koenigstedt, R., Stickler, A., Martinez, M., Harder, H., Kubistin, D., Williams, J., Eerdekens, G., and Lelieveld, J.: Influence of Corona Discharge on the Ozone Budget in the Tropical Free Troposphere: A Case Study of Deep Convection during GABRIEL, Atmos. Chem. Phys., 14, 8917–8931, https://doi.org/10.5194/acp-14-8917-2014, 2014. a
Bozem, H., Pozzer, A., Harder, H., Martinez, M., Williams, J., Lelieveld, J., and Fischer, H.: The Influence of Deep Convection on HCHO and H2O2 in the Upper Troposphere over Europe, Atmos. Chem. Phys., 17, 11835–11848, https://doi.org/10.5194/acp-17-11835-2017, 2017. a
Bucsela, E., Pickering, K. E., Allen, D., Holzworth, R., and Krotkov, N.: Midlatitude Lightning NOx Production Efficiency Inferred from OMI and WWLLN Data, J. Geophys. Res.-Atmos., 124, 13475–13497, https://doi.org/10.1029/2019jd030561, 2019. a, b
Chance, K., Liu, X., Miller, C. C., González Abad, G., Huang, G., Nowlan, C., Souri, A., Suleiman, R., Sun, K., Wang, H., Zhu, L., Zoogman, P., Al-Saadi, J., Antuña-Marrero, J. C., Carr, J., Chatfield, R., Chin, M., Cohen, R., Edwards, D., Fishman, J., Flittner, D., Geddes, J., Grutter, M., Herman, J. R., Jacob, D. J., Janz, S., Joiner, J., Kim, J., Krotkov, N. A., Lefer, B., Martin, R. V., Mayol-Bracero, O. L., Naeger, A., Newchurch, M., Pfister, G. G., Pickering, K., Pierce, R. B., Rivera Cárdenas, C., Saiz-Lopez, A., Simpson, W., Spinei, E., Spurr, R. J. D., Szykman, J. J., Torres, O., and Wang, J.: TEMPO Green Paper: Chemistry, Physics, and Meteorology Experiments with the Tropospheric Emissions: Monitoring of Pollution Instrument, in: Sensors, Systems, and Next-Generation Satellites XXIII, edited by: Neeck, S. P., Kimura, T., and Martimort, P., p. 10, SPIE, Strasbourg, France, https://doi.org/10.1117/12.2534883, 2019. a
Chen, Y., Romps, D. M., Seeley, J. T., Veraverbeke, S., Riley, W. J., Mekonnen, Z. A., and Randerson, J. T.: Future Increases in Arctic Lightning and Fire Risk for Permafrost Carbon, Nat. Clim. Change, 11, 404–410, https://doi.org/10.1038/s41558-021-01011-y, 2021. a
Davis, L. L. B.: ProPlot, Zenodo, https://doi.org/10.5281/ZENODO.3873878, 2021. a
DeCaria, A. J., Pickering, K. E., Stenchikov, G. L., and Ott, L. E.: Lightning-Generated NOx and Its Impact on Tropospheric Ozone Production: A Three-Dimensional Modeling Study of a Stratosphere-Troposphere Experiment: Radiation, Aerosols and Ozone (STERAO-A) Thunderstorm, J. Geophys. Res.-Atmos., 110, D14, https://doi.org/10.1029/2004JD005556, 2005. a
Dickerson, R. R., Huffman, G. J., Luke, W. T., Nunnermacker, L. J., Pickering, K. E., Leslie, A. C., Lindsey, C. G., Slinn, W. G., Kelly, T. J., Daum, P. H., Delany, A. C., Greenberg, J. P., Zimmerman, P. R., Boatman, J. F., Ray, J. D., and Stedman, D. H.: Thunderstorms: An Important Mechanism in the Transport of Air Pollutants, Science, 235, 460–465, https://doi.org/10.1126/science.235.4787.460, 1987. a
Fierro, A. O., Mansell, E. R., Ziegler, C. L., and MacGorman, D. R.: Application of a Lightning Data Assimilation Technique in the WRF-ARW Model at Cloud-Resolving Scales for the Tornado Outbreak of 24 May 2011, Mon. Weather Rev., 140, 2609–2627, https://doi.org/10.1175/MWR-D-11-00299.1, 2012. a, b
Finney, D. L., Doherty, R. M., Wild, O., and Abraham, N. L.: The Impact of Lightning on Tropospheric Ozone Chemistry Using a New Global Lightning Parametrisation, Atmos. Chem. Phys., 16, 7507–7522, https://doi.org/10.5194/acp-16-7507-2016, 2016. a, b
Gettelman, A., Mills, M. J., Kinnison, D. E., Garcia, R. R., Smith, A. K., Marsh, D. R., Tilmes, S., Vitt, F., Bardeen, C. G., McInerny, J., Liu, H.-L., Solomon, S. C., Polvani, L. M., Emmons, L. K., Lamarque, J.-F., Richter, J. H., Glanville, A. S., Bacmeister, J. T., Phillips, A. S., Neale, R. B., Simpson, I. R., DuVivier, A. K., Hodzic, A., and Randel, W. J.: The whole atmosphere community climate model version 6 (WACCM6), J. Geophys. Res.-Atmos., 124, 12380–12403, https://doi.org/10.1029/2019JD030943, 2019 (data available at: https://www.acom.ucar.edu/waccm/download.shtml). a
Gordillo-Vázquez, F. J., Pérez-Invernón, F. J., Huntrieser, H., and Smith, A. K.: Comparison of Six Lightning Parameterizations in CAM5 and the Impact on Global Atmospheric Chemistry, Earth Space Sci., 6, 2317–2346, https://doi.org/10.1029/2019ea000873, 2019. a
Guenther, A., Karl, T., Harley, P., Wiedinmyer, C., Palmer, P. I., and Geron, C.: Estimates of Global Terrestrial Isoprene Emissions Using MEGAN (Model of Emissions of Gases and Aerosols from Nature), Atmos. Chem. Phys., 6, 3181–3210, https://doi.org/10.5194/acp-6-3181-2006, 2006. a
Guenther, A. B., Jiang, X., Heald, C. L., Sakulyanontvittaya, T., Duhl, T., Emmons, L. K., and Wang, X.: The Model of Emissions of Gases and Aerosols from Nature version 2.1 (MEGAN2.1): an extended and updated framework for modeling biogenic emissions, Geosci. Model Dev., 5, 1471–1492, https://doi.org/10.5194/gmd-5-1471-2012, 2012 (data available at: https://www.acom.ucar.edu/wrf-chem/download.shtml). a
Guo, F., Ju, X., Bao, M., Lu, G., Liu, Z., Li, Y., and Mu, Y.: Relationship between Lightning Activity and Tropospheric Nitrogen Dioxide and the Estimation of Lightning-Produced Nitrogen Oxides over China, Adv. Atmos. Sci., 34, 235–245, https://doi.org/10.1007/s00376-016-6087-x, 2017. a
Hersbach, H., Bell, B., Berrisford, P., Hirahara, S., Horányi, A., Muñoz-Sabater, J., Nicolas, J., Peubey, C., Radu, R., Schepers, D., Simmons, A., Soci, C., Abdalla, S., Abellan, X., Balsamo, G., Bechtold, P., Biavati, G., Bidlot, J., Bonavita, M., Chiara, G., Dahlgren, P., Dee, D., Diamantakis, M., Dragani, R., Flemming, J., Forbes, R., Fuentes, M., Geer, A., Haimberger, L., Healy, S., Hogan, R. J., Hólm, E., Janisková, M., Keeley, S., Laloyaux, P., Lopez, P., Lupu, C., Radnoti, G., Rosnay, P., Rozum, I., Vamborg, F., Villaume, S., and Thépaut, J.-N.: The ERA5 Global Reanalysis, Q. J. Roy. Meteorol. Soc., 146, 1999–2049, https://doi.org/10.1002/qj.3803, 2020. a
Holton, J. R., Haynes, P. H., McIntyre, M. E., Douglass, A. R., Rood, R. B., and Pfister, L.: Stratosphere-Troposphere Exchange, Rev. Geophys., 33, 403, https://doi.org/10.1029/95RG02097, 1995. a
Hong, S. and Lim, J.: The WRF Single-Moment 6-Class Microphysics Scheme (WSM6), Asia-Pac. J. Atmospheric Sci., 42, 129–151, 2006. a
Hong, S.-Y., Noh, Y., and Dudhia, J.: A New Vertical Diffusion Package with an Explicit Treatment of Entrainment Processes, Mon. Weather Rev., 134, 2318–2341, https://doi.org/10.1175/MWR3199.1, 2006. a
Huntrieser, H., Lichtenstern, M., Scheibe, M., Aufmhoff, H., Schlager, H., Pucik, T., Minikin, A., Weinzierl, B., Heimerl, K., Fütterer, D., Rappenglück, B., Ackermann, L., Pickering, K. E., Cummings, K. A., Biggerstaff, M. I., Betten, D. P., Honomichl, S., and Barth, M. C.: On the Origin of Pronounced O3 Gradients in the Thunderstorm Outflow Region during DC3, J. Geophys. Res.-Atmos., 121, 6600–6637, https://doi.org/10.1002/2015JD024279, 2016. a, b
Iacono, M. J., Delamere, J. S., Mlawer, E. J., Shephard, M. W., Clough, S. A., and Collins, W. D.: Radiative Forcing by Long-Lived Greenhouse Gases: Calculations with the AER Radiative Transfer Models, J. Geophys. Res.-Atmos., 113, D13, https://doi.org/10.1029/2008JD009944, 2008. a
Kang, D., Foley, K. M., Mathur, R., Roselle, S. J., Pickering, K. E., and Allen, D. J.: Simulating Lightning NO Production in CMAQv5.2: Performance Evaluations, Geosci. Model Dev., 12, 4409–4424, https://doi.org/10.5194/gmd-12-4409-2019, 2019a. a
Kang, D., Pickering, K. E., Allen, D. J., Foley, K. M., Wong, D. C., Mathur, R., and Roselle, S. J.: Simulating Lightning NO Production in CMAQv5.2: Evolution of Scientific Updates, Geosci. Model Dev., 12, 3071–3083, https://doi.org/10.5194/gmd-12-3071-2019, 2019b. a
Kang, D., Mathur, R., Pouliot, G. A., Gilliam, R. C., and Wong, D. C.: Significant Ground-Level Ozone Attributed to Lightning-Induced Nitrogen Oxides during Summertime over the Mountain West States, npj Clim. Atmos. Sci., 3, 1–7, https://doi.org/10.1038/s41612-020-0108-2, 2020. a
Koren, I., Martins, J. V., Remer, L. A., and Afargan, H.: Smoke Invigoration Versus Inhibition of Clouds over the Amazon, Science, 321, 946–949, https://doi.org/10.1126/science.1159185, 2008. a
Koren, V., Schaake, J., Mitchell, K., Duan, Q.-Y., Chen, F., and Baker, J. M.: A Parameterization of Snowpack and Frozen Ground Intended for NCEP Weather and Climate Models, J. Geophys. Res.-Atmos., 104, 19569–19585, https://doi.org/10.1029/1999JD900232, 1999. a
Lapierre, J. L., Laughner, J. L., Geddes, J. A., Koshak, W., Cohen, R. C., and Pusede, S. E.: Observing U.S. Regional Variability in Lightning NO2 Production Rates, J. Geophys. Res.-Atmos., 125, e2019JD031362, https://doi.org/10.1029/2019JD031362, 2020. a
Laughner, J. L. and Cohen, R. C.: Quantification of the Effect of Modeled Lightning NO2 on UV – Visible Air Mass Factors, Atmos. Meas. Tech., 10, 4403–4419, https://doi.org/10.5194/amt-10-4403-2017, 2017. a, b, c
Lawrence, M. G., Kuhlmann, R., Salzmann, M., and Rasch, P. J.: The Balance of Effects of Deep Convective Mixing on Tropospheric Ozone, Geophys. Res. Lett., 30, 18, https://doi.org/10.1029/2003GL017644, 2003. a
Li, F., Wu, L., and Li, Y.: Lightning Data Analysis of the CMA Network in China, Atmos. Meas. Tech. Discuss. [preprint], https://doi.org/10.5194/amt-2016-380, 2017a. a
Li, Y., Pickering, K. E., Allen, D. J., Barth, M. C., Bela, M. M., Cummings, K. A., Carey, L. D., Mecikalski, R. M., Fierro, A. O., Campos, T. L., Weinheimer, A. J., Diskin, G. S., and Biggerstaff, M. I.: Evaluation of Deep Convective Transport in Storms from Different Convective Regimes during the DC3 Field Campaign Using WRF-Chem with Lightning Data Assimilation, J. Geophys. Res.-Atmos., 122, 7140–7163, https://doi.org/10.1002/2017JD026461, 2017b. a, b, c, d
Liaskos, C. E., Allen, D. J., and Pickering, K. E.: Sensitivity of Tropical Tropospheric Composition to Lightning NOx Production as Determined by Replay Simulations with GEOS-5, J. Geophys. Res.-Atmos., 120, 8512–8534, https://doi.org/10.1002/2014JD022987, 2015. a
Lorente, A., Folkert Boersma, K., Yu, H., Dörner, S., Hilboll, A., Richter, A., Liu, M., Lamsal, L. N., Barkley, M., Smedt, I., van Roozendael, M., Wang, Y., Wagner, T., Beirle, S., Lin, J.-T., Krotkov, N., Stammes, P., Wang, P., Eskes, H. J., and Krol, M.: Structural Uncertainty in Air Mass Factor Calculation for NO2 and HCHO Satellite Retrievals, Atmos. Meas. Tech., 10, 759–782, https://doi.org/10.5194/amt-10-759-2017, 2017. a, b
Ludewig, A., Kleipool, Q., Bartstra, R., Landzaat, R., Leloux, J., Loots, E., Meijering, P., van der Plas, E., Rozemeijer, N., Vonk, F., and Veefkind, P.: In-Flight Calibration Results of the TROPOMI Payload on Board the Sentinel-5 Precursor Satellite, Atmos. Meas. Tech., 13, 3561–3580, https://doi.org/10.5194/amt-13-3561-2020, 2020. a
Luhar, A. K., Galbally, I. E., Woodhouse, M. T., and Abraham, N. L.: Assessing and Improving Cloud-Height-Based Parameterisations of Global Lightning Flash Rate, and Their Impact on Lightning-Produced NOx and Tropospheric Composition in a Chemistry – Climate Model, Atmos. Chem. Phys., 21, 7053–7082, https://doi.org/10.5194/acp-21-7053-2021, 2021. a
Marchand, M., Hilburn, K., and Miller, S. D.: Geostationary Lightning Mapper and Earth Networks Lightning Detection Over the Contiguous United States and Dependence on Flash Characteristics, J. Geophys. Res.-Atmos., 124, 11552–11567, https://doi.org/10.1029/2019JD031039, 2019. a
Marchand, M. R. and Fuelberg, H. E.: Assimilation of Lightning Data Using a Nudging Method Involving Low-Level Warming, Mon. Weather Rev., 142, 4850–4871, https://doi.org/10.1175/MWR-D-14-00076.1, 2014. a
Morris, G. A., Thompson, A. M., Pickering, K. E., Chen, S., Bucsela, E. J., and Kucera, P. A.: Observations of Ozone Production in a Dissipating Tropical Convective Cell during TC4, Atmos. Chem. Phys., 10, 11189–11208, https://doi.org/10.5194/acp-10-11189-2010, 2010. a
Murray, L. T.: Lightning NOx and Impacts on Air Quality, Curr. Pollution. Rep., 2, 134–134, https://doi.org/10.1007/s40726-016-0038-0, 2016. a, b
Murray, L. T., Jacob, D. J., Logan, J. A., Hudman, R. C., and Koshak, W. J.: Optimized Regional and Interannual Variability of Lightning in a Global Chemical Transport Model Constrained by LIS/OTD Satellite Data, J. Geophys. Res.-Atmos., 117, D20, https://doi.org/10.1029/2012JD017934, 2012. a
Nault, B. A., Garland, C., Wooldridge, P. J., Brune, W. H., Campuzano-Jost, P., Crounse, J. D., Day, D. A., Dibb, J., Hall, S. R., Huey, L. G., Jimenez, J. L., Liu, X., Mao, J., Mikoviny, T., Peischl, J., Pollack, I. B., Ren, X., Ryerson, T. B., Scheuer, E., Ullmann, K., Wennberg, P. O., Wisthaler, A., Zhang, L., and Cohen, R. C.: Observational Constraints on the Oxidation of NOx in the Upper Troposphere, J. Phys. Chem. A, 120, 1468–1478, https://doi.org/10.1021/acs.jpca.5b07824, 2016. a
Ott, L. E., Pickering, K. E., Stenchikov, G. L., Huntrieser, H., and Schumann, U.: Effects of Lightning NOx Production during the 21 July European Lightning Nitrogen Oxides Project Storm Studied with a Three-Dimensional Cloud-Scale Chemical Transport Model, J. Geophys. Res.-Atmos., 112, D5, https://doi.org/10.1029/2006JD007365, 2007. a
Ott, L. E., Pickering, K. E., Stenchikov, G. L., Allen, D. J., DeCaria, A. J., Ridley, B., Lin, R.-F., Lang, S., and Tao, W.-K.: Production of Lightning NOx and Its Vertical Distribution Calculated from Three-Dimensional Cloud-Scale Chemical Transport Model Simulations, J. Geophys. Res.-Atmos., 115, 4711, https://doi.org/10.1029/2009JD011880, 2010. a, b
Pan, L. L., Homeyer, C. R., Honomichl, S., Ridley, B. A., Weisman, M., Barth, M. C., Hair, J. W., Fenn, M. A., Butler, C., Diskin, G. S., Crawford, J. H., Ryerson, T. B., Pollack, I., Peischl, J., and Huntrieser, H.: Thunderstorms Enhance Tropospheric Ozone by Wrapping and Shedding Stratospheric Air, Geophys. Res. Lett., 41, 7785–7790, https://doi.org/10.1002/2014GL061921, 2014. a
Pérez-Invernón, F. J., Huntrieser, H., Gordillo-Vázquez, F. J., and Soler, S.: Influence of the COVID-19 Lockdown on Lightning Activity in the Po Valley, Atmos. Res., 263, 105808, https://doi.org/10.1016/j.atmosres.2021.105808, 2021. a
Pfister, G. G., Avise, J., Wiedinmyer, C., Edwards, D. P., Emmons, L. K., Diskin, G. D., Podolske, J., and Wisthaler, A.: CO Source Contribution Analysis for California during ARCTAS-CARB, Atmos. Chem. Phys., 11, 7515–7532, https://doi.org/10.5194/acp-11-7515-2011, 2011. a
Phoenix, D. B., Homeyer, C. R., Barth, M. C., and Trier, S. B.: Mechanisms Responsible for Stratosphere-to-Troposphere Transport Around a Mesoscale Convective System Anvil, J. Geophys. Res.-Atmos., 125, e2019JD032016, https://doi.org/10.1029/2019JD032016, 2020. a, b
Pickering, K. E., Thompson, A. M., Dickerson, R. R., Luke, W. T., McNamara, D. P., Greenberg, J. P., and Zimmerman, P. R.: Model Calculations of Tropospheric Ozone Production Potential Following Observed Convective Events, J. Geophys. Res., 95, 14049, https://doi.org/10.1029/JD095iD09p14049, 1990. a
Pickering, K. E., Thompson, A. M., Wang, Y., Tao, W.-K., McNamara, D. P., Kirchhoff, V. W. J. H., Heikes, B. G., Sachse, G. W., Bradshaw, J. D., Gregory, G. L., and Blake, D. R.: Convective Transport of Biomass Burning Emissions over Brazil during TRACE A, J. Geophys. Res., 101, 23993–24012, https://doi.org/10.1029/96JD00346, 1996. a
Pickering, K. E., Bucsela, E., Allen, D., Ring, A., Holzworth, R., and Krotkov, N.: Estimates of Lightning NOx Production Based on OMI NO2 Observations over the Gulf of Mexico, J. Geophys. Res.-Atmos., 121, 8668–8691, https://doi.org/10.1002/2015JD024179, 2016. a, b, c
Poelman, D. R. and Schulz, W.: Comparing Lightning Observations of the Ground-Based European Lightning Location System EUCLID and the Space-Based Lightning Imaging Sensor (LIS) on the International Space Station (ISS), Atmos. Meas. Tech., 13, 2965–2977, https://doi.org/10.5194/amt-13-2965-2020, 2020. a
Raspaud, M., Hoese, D., Dybbroe, A., Lahtinen, P., Devasthale, A., Itkin, M., Hamann, U., Rasmussen, L. Ø., Nielsen, E. S., Leppelt, T., Maul, A., Kliche, C., and Thorsteinsson, H.: PyTroll: An Open-Source, Community-Driven Python Framework to Process Earth Observation Satellite Data, Bull. Am. Meteorol. Soc., 99, 1329–1336, https://doi.org/10.1175/bams-d-17-0277.1, 2018. a
Raspaud, M., Hoese, D., Lahtinen, P., Finkensieper, S., Holl, G., Dybbroe, A., Proud, S., Meraner, A., Zhang, X., Joro, S., Roberts, W., Rasmussen, L. Ø., Joleenf, Méndez, J. H. B., Zhu, Y., Daruwala, R., Strandgren, BENR0, Jasmin, T., Barnie, T., Sigurðsson, E., R.K.Garcia, Leppelt, T., ColinDuff, Egede, U., LTMeyer, Itkin, M., Goodson, R., Radar, Satellite and Nowcasting Division, and Jkotro: Pytroll/Satpy: Version 0.25.1, Zenodo, https://doi.org/10.5281/ZENODO.4422120, 2021. a
Ridley, B., Atlas, E., Selkirk, H., Pfister, L., Montzka, D., Walega, J., Donnelly, S., Stroud, V., Richard, E., Kelly, K., Tuck, A., Thompson, T., Reeves, J., Baumgardner, D., Rawlins, W. T., Mahoney, M., Herman, R., Friedl, R., Moore, F., Ray, E., and Elkins, J.: Convective Transport of Reactive Constituents to the Tropical and Mid-Latitude Tropopause Region: I. Observations, Atmos. Environ., 38, 1259–1274, https://doi.org/10.1016/j.atmosenv.2003.11.038, 2004. a
Ripoll, J.-F., Zinn, J., Jeffery, C. A., and Colestock, P. L.: On the Dynamics of Hot Air Plasmas Related to Lightning Discharges: 1. Gas Dynamics, J. Geophys. Res.-Atmos., 119, 9196–9217, https://doi.org/10.1002/2013JD020067, 2014. a
Rodger, C. J., Brundell, J. B., Dowden, R. L., and Thomson, N. R.: Location Accuracy of Long Distance VLF Lightning Locationnetwork, Ann. Geophys., 22, 747–758, https://doi.org/10.5194/angeo-22-747-2004, 2004. a
Rodger, C. J., Werner, S., Brundell, J. B., Lay, E. H., Thomson, N. R., Holzworth, R. H., and Dowden, R. L.: Detection Efficiency of the VLF World-Wide Lightning Location Network (WWLLN): Initial Case Study, Ann. Geophys., 24, 3197–3214, https://doi.org/10.5194/angeo-24-3197-2006, 2006. a
Rosenfeld, D., Lohmann, U., Raga, G. B., O'Dowd, C. D., Kulmala, M., Fuzzi, S., Reissell, A., and Andreae, M. O.: Flood or Drought: How Do Aerosols Affect Precipitation?, Science, 321, 1309–1313, https://doi.org/10.1126/science.1160606, 2008. a
Rudlosky, S. D. and Shea, D. T.: Evaluating WWLLN Performance Relative to TRMM/LIS, Geophys. Res. Lett., 40, 2344–2348, https://doi.org/10.1002/grl.50428, 2013. a
Rudlosky, S. D., Goodman, S. J., Virts, K. S., and Bruning, E. C.: Initial Geostationary Lightning Mapper Observations, Geophys. Res. Lett., 46, 1097–1104, https://doi.org/10.1029/2018GL081052, 2019. a
Schumann, U. and Huntrieser, H.: The Global Lightning-Induced Nitrogen Oxides Source, Atmos. Chem. Phys., 7, 3823–3907, https://doi.org/10.5194/acp-7-3823-2007, 2007. a
Smit, H. G. J., Straeter, W., Johnson, B. J., Oltmans, S. J., Davies, J., Tarasick, D. W., Hoegger, B., Stubi, R., Schmidlin, F. J., Northam, T., Thompson, A. M., Witte, J. C., Boyd, I., and Posny, F.: Assessment of the Performance of ECC-ozonesondes under Quasi-Flight Conditions in the Environmental Simulation Chamber: Insights from the Juelich Ozone Sonde Intercomparison Experiment (JOSIE), J. Geophys. Res.-Atmos., 112, D19, https://doi.org/10.1029/2006JD007308, 2007. a
Srivastava, A., Tian, Y., Qie, X., Wang, D., Sun, Z., Yuan, S., Wang, Y., Chen, Z., Xu, W., Zhang, H., Jiang, R., and Su, D.: Performance Assessment of Beijing Lightning Network (BLNET) and Comparison with Other Lightning Location Networks across Beijing, Atmos. Res., 197, 76–83, https://doi.org/10.1016/j.atmosres.2017.06.026, 2017. a
Stohl, A.: Stratosphere-Troposphere Exchange: A Review, and What We Have Learned from STACCATO, J. Geophys. Res.-Atmos., 108, D12, https://doi.org/10.1029/2002JD002490, 2003. a
Sukoriansky, S., Galperin, B., and Perov, V.: Application of a New Spectral Theory of Stably Stratified Turbulence to the Atmospheric Boundary Layer over Sea Ice, Bound. Lay. Meteorol., 117, 231–257, https://doi.org/10.1007/s10546-004-6848-4, 2005. a
Tao, W.-K., Chen, J.-P., Li, Z., Wang, C., and Zhang, C.: Impact of Aerosols on Convective Clouds and Precipitation, Rev. Geophys., 50, 2, https://doi.org/10.1029/2011RG000369, 2012. a
van Geffen, J., Eskes, H., Compernolle, S., Pinardi, G., Verhoelst, T., Lambert, J.-C., Sneep, M., ter Linden, M., Ludewig, A., Boersma, K. F., and Veefkind, J. P.: Sentinel-5P TROPOMI NO2 Retrieval: Impact of Version v2.2 Improvements and Comparisons with OMI and Ground-Based Data, Atmos. Meas. Tech., 15, 2037–2060, https://doi.org/10.5194/amt-15-2037-2022, 2022. a, b, c
van Geffen, J. H. G. M., Boersma, K. F., van Roozendael, M., Hendrick, F., Mahieu, E., Smedt, I., Sneep, M., and Veefkind, J. P.: Improved Spectral Fitting of Nitrogen Dioxide from OMI in the 405–465 Nm Window, Atmos. Meas. Tech., 8, 1685–1699, https://doi.org/10.5194/amt-8-1685-2015, 2015. a
Vaughan, G., Schiller, C., MacKenzie, A. R., Bower, K., Peter, T., Schlager, H., Harris, N. R. P., and May, P. T.: SCOUT-O3/ACTIVE: High-altitude Aircraft Measurements around Deep Tropical Convection, Bull. Am. Meteorol. Soc., 89, 647–662, https://doi.org/10.1175/BAMS-89-5-647, 2008. a
Veefkind, J. P., Aben, I., McMullan, K., Förster, H., Vries, J., Otter, G., Claas, J., Eskes, H. J., Haan, J. F., Kleipool, Q., van Weele, M., Hasekamp, O., Hoogeveen, R., Landgraf, J., Snel, R., Tol, P., Ingmann, P., Voors, R., Kruizinga, B., Vink, R., Visser, H., and Levelt, P. F.: TROPOMI on the ESA Sentinel-5 Precursor: A GMES Mission for Global Observations of the Atmospheric Composition for Climate, Air Quality and Ozone Layer Applications, Remote Sens. Environ., 120, 70–83, https://doi.org/10.1016/j.rse.2011.09.027, 2012. a, b
Virts, K. S. and Goodman, S. J.: Prolific Lightning and Thunderstorm Initiation over the Lake Victoria Basin in East Africa, Mon. Weather Rev., 148, 1971–1985, https://doi.org/10.1175/MWR-D-19-0260.1, 2020. a
Williams, J. E., Boersma, K. F., Le Sager, P., and Verstraeten, W. W.: The High-Resolution Version of TM5-MP for Optimized Satellite Retrievals: Description and Validation, Geosci. Model Dev., 10, 721–750, https://doi.org/10.5194/gmd-10-721-2017, 2017. a
Wu, F., Cui, X., Zhang, D.-L., Liu, D., and Zheng, D.: SAFIR-3000 Lightning Statistics over the Beijing Metropolitan Region during 2005–07, J. Appl. Meteorol. Climatol., 55, 2613–2633, https://doi.org/10.1175/jamc-d-16-0030.1, 2016. a
Yang, J., Zhang, Z., Wei, C., Lu, F., and Guo, Q.: Introducing the New Generation of Chinese Geostationary Weather Satellites, Fengyun-4, Bull. Am. Meteorol. Soc., 98, 1637–1658, https://doi.org/10.1175/BAMS-D-16-0065.1, 2017. a
Yang, X. and Li, Z.: Increases in Thunderstorm Activity and Relationships with Air Pollution in Southeast China, J. Geophys. Res.-Atmos., 119, 1835–1844, https://doi.org/10.1002/2013JD021224, 2014. a
Yang, X., Sun, J., and Li, W.: An Analysis of Cloud-to-Ground Lightning in China during 2010–13, Weather Forecast., 30, 1537–1550, https://doi.org/10.1175/WAF-D-14-00132.1, 2015. a
Zhang, J., Xuan, Y., Yan, X., Liu, M., Tian, H., Xia, X., Pang, L., and Zheng, X.: Development and Preliminary Evaluation of a Double-Cell Ozonesonde, Adv. Atmos. Sci., 31, 938–947, https://doi.org/10.1007/s00376-013-3104-1, 2014. a
Zhang, X.: Zxdawn/Xin_ACP_2021_Convection_Effect: Version 1.1, Zenodo, https://doi.org/10.5281/ZENODO.4945560, 2021a. a
Zhang, X.: Xin_ACP_2021_Convection_Effect_data, https://doi.org/10.5281/ZENODO.5154798, 2021b. a
Zhang, X.: WRF-Chem-LDA-LFR, Zenodo, https://doi.org/10.5281/ZENODO.4682331, 2021c. a
Zhang, X.: S5P-WRFChem, Zenodo, https://doi.org/10.5281/ZENODO.4682636, 2021d. a
Zhang, X., Yin, Y., van der A, R., Lapierre, J. L., Chen, Q., Kuang, X., Yan, S., Chen, J., He, C., and Shi, R.: Estimates of Lightning NOx Production Based on High-Resolution OMI NO2 Retrievals over the Continental US, Atmos. Meas. Tech., 13, 1709–1734, https://doi.org/10.5194/amt-13-1709-2020, 2020. a, b, c, d
Zhao, P., Li, Z., Xiao, H., Wu, F., Zheng, Y., Cribb, M. C., Jin, X., and Zhou, Y.: Distinct Aerosol Effects on Cloud-to-Ground Lightning in the Plateau and Basin Regions of Sichuan, Southwest China, Atmos. Chem. Phys., 20, 13379–13397, https://doi.org/10.5194/acp-20-13379-2020, 2020. a
Zhu, Q., Laughner, J. L., and Cohen, R. C.: Lightning NO2 Simulation over the Contiguous US and Its Effects on Satellite NO2 Retrievals, Atmos. Chem. Phys., 19, 13067–13078, https://doi.org/10.5194/acp-19-13067-2019, 2019. a
- Abstract
- Introduction
- Datasets
- Model evaluation
- Convection impacts
- Impact of lightning NOx on the O3 profile
- TROPOMI products over the convection
- Conclusions
- Appendix A: Flag definitions used in this study
- Appendix B: Contributions to ΔAMFtrop
- Code and data availability
- Author contributions
- Competing interests
- Disclaimer
- Acknowledgements
- Financial support
- Review statement
- References
- Supplement