the Creative Commons Attribution 4.0 License.
the Creative Commons Attribution 4.0 License.
 | 04 May 2022
Chemically speciated mass size distribution, particle density, shape and origin of non-refractory PM1 measured at a rural background site in central Europe
Petra Pokorná
Naděžda Zíková
Petr Vodička
Radek Lhotka
Saliou Mbengue
Adéla Holubová Šmejkalová
Véronique Riffault
Jakub Ondráček
Jaroslav Schwarz
Vladimír Ždímal
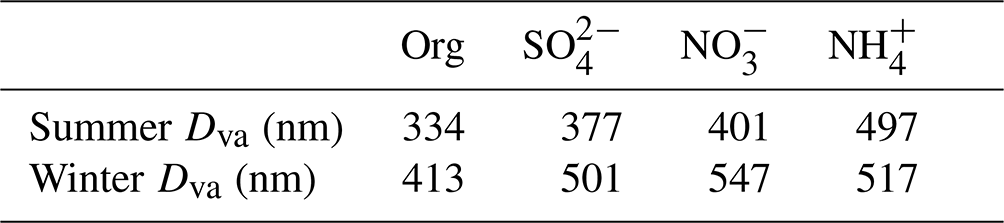
Seasonal variability of non-refractory PM1 (NR-PM1) was studied at a rural background site (National Atmospheric Observatory Košetice – NAOK) in the Czech Republic to investigate the effect of regional and long-range atmospheric transport in central Europe. NR-PM1 measurements were performed by compact time-of-flight aerosol mass spectrometry (C-ToF-AMS), and the chemically speciated mass size distributions, density, shape, and origin were discussed. Average PM1 concentrations, calculated as the sum of the NR-PM1 and the equivalent black carbon (eBC) concentrations measured by an aethalometer (AE), were 8.58 ± 3.70 µg m−3 in summer and 10.08 ± 8.04 µg m−3 in winter. Organics were dominant during both campaigns (summer/winter: 4.97 ± 2.924.55 ± 4.40 µg m−3), followed by SOin summer (1.68 ± 0.81/1.36 ± 1.38 µg m−3) and NO in winter (0.67 ± 0.38/2.03 ± 1.71 µg m−3). The accumulation mode dominated the average mass size distribution during both seasons, with larger particles of all species measured in winter (mode diameters: Org: 334413 nm, NO: 377/501 nm, SO: 400547 nm, and NH: 489515 nm) indicating regional and long-range transport. However, since the winter aerosols were less oxidized than the summer aerosols (comparing fragments f44 and f43), the importance of local sources in the cold part of the year was still enough to be considered. Although aged continental air masses from the south-east (SE) were rare in summer (7 %), they were related to the highest concentrations of PM1, eBC, and all NR-PM1 species, especially SO and NH. In winter, slow continental air masses from the south-west (SW) (44 %) were linked to inversion conditions over central Europe and were associated with the highest concentrations among all NR-PM1 species as well as PM1 and eBC. Average PM1 material density (ρm) corresponded to higher inorganic contents in both seasons (summer: ∼ 1.30 g cm−3 and winter: ∼ 1.40 g cm−3). During episodes of higher mass concentrations ρm ranged from 1.30–1.40 g cm−3 in summer and from 1.30–1.50 g cm−3 in winter. The dynamic shape factors (χ) decreased slightly with particle mobility diameter (Dm) in both seasons. This study provides insights into the seasonal effects and air mass variability on aerosol particles, focusing on episodes of high mass and number concentrations measured at a central European rural background site.
- Article
(17308 KB) - Full-text XML
- BibTeX
- EndNote


Studies on airborne particulate matter (PM) are needed to better understand its temporal and spatial variations, atmospheric processing, long-term trends, adverse health effects and environmental consequences, and pollution sources (Putaud et al., 2004; Tørseth et al., 2012; Belis et al., 2013; EEA, 2019). Therefore, detailed analysis of the physicochemical properties of aerosol particles is crucial to understand their processes and lifetime in the atmosphere. Aerosol particles can be characterized by many different properties such as number concentration, mass concentration, particle size, mass, volume, density, shape, etc. Particle density and shape are important physical properties of atmospheric particles and along with chemical composition are linked to particle emission sources and atmospheric physical and chemical ageing processes.
A network of measurement sites as the Aerosol, Clouds, and Trace Gases Research Infrastructure Network (ACTRIS, https://www.actris.eu/, last access: 26 February 2022) enables the study of long-term variability of aerosol particle properties in the European environment. However, a prevalent coarse time and size resolution of the measurements still limits our knowledge on the physicochemical properties of aerosol particles (Putaud et al., 2004, 2010; Cavalli et al., 2016). Nowadays, online methods with high temporal resolutions (30 min and less) are available, as aerosol mass spectrometers (AMSs) utilized can quantitatively measure chemical composition as well as the chemically resolved size distributions of submicron non-refractory PM (NR-PM1) (Jayne et al., 2000; Jimenez et al., 2003a). Although measuring the seasonal variability of NR-PM1 is becoming more common (Bressi et al., 2021), systematic studies considering chemically speciated mass size distributions are still rare. The available studies have also focused on new particle formation and growth, temporal variations, and the origin and sources of particles, including results presented from urban (Drewnick et al., 2004; Dall'Osto et al., 2009; Hersey et al., 2011; Freutel et al., 2013; Salimi et al., 2015; Kubelová et al., 2015), forestry (Allan et al., 2006), mid-altitude (Freney et al., 2011), and rural (Poulain et al., 2011; Milic et al., 2017) background environments.
Measurements at rural background sites representative of wider areas are important to study the influence of regional and long-range transport as well as the long-term trends in PM characteristics. In the Czech Republic, the NationalAtmospheric Observatory Košetice (NAOK), officially classified as a central European rural background site, participates in the European Monitoring and Evaluation Programme (EMEP), Aerosol, Clouds, and Trace Gases Research Infrastructure Network (ACTRIS), and Global Atmosphere Watch (GAW) network. This site has been characterized in terms of the local PM2.5 chemical composition and seasonal variability (Schwarz et al., 2016), the PM1 isotopic composition (Vodička et al., 2019), and the PAHs bound to PM1 (Křůmal and Mikuška, 2020). Studies conducted at NAOK have also characterized the long-term trends of atmospheric carbonaceous aerosols (Mbengue et al., 2018, 2020) and PM2.5 elemental compositions and sources (Pokorná et al., 2018). The particle number size distribution (PNSD) and influence of in-cloud and below-cloud scavenging have been investigated with long-term measurements by Zíková and Ždímal (2013, 2016). However, detailed work focused on the seasonal variability in PM chemical composition data with high temporal and spatial resolutions is still lacking at this site. In this paper, we assess NR-PM1 based on the chemically speciated mass size distribution, particle density, shape and origin during intensive campaigns in summer and winter. The focus of this study was to characterize individual episodes of high mass and number concentrations determined based on highly time-resolved measurement linked to different air mass types, thereby offering insights into the physicochemical properties and sources of aerosol particles arriving at a rural background site.
2.1 Instrumentation
Two intensive sampling campaigns were carried out in July 2019 (1–31 July) and in January–February 2020 (16 January–10 February) at NAOK. During the campaigns, several physical and chemical atmospheric aerosol properties were measured together with complete meteorological data collected from a professional meteorological station (WMO station 11628).
The size-resolved NR-PM1 chemical composition (the sum of organics, sulfate, nitrate, ammonium, and chloride) was measured by a compact time-of-flight aerosol mass spectrometer (C-ToF-AMS, Aerodyne, USA, Drewnick et al., 2005) with a 5 min temporal resolution. The instrument was connected to an inlet consisting of a PM2.5 sampling head (16.7 L min−1) and a Nafion dryer (Perma Pure MD-110-24P-4). Isokinetic subsampling was used to split the flow into the AMS (0.1 L min−1) from the main flow. The AMS size and flow as well as ionization efficiency (IE) calibrations in the brute-force single-particle mode (BFSP, Drewnick et al., 2005, monodisperse 350 nm ammonium nitrate aerosol particles) were performed in the beginning of, during, and after each campaign. The resulting IE was the average IE from all calibrations. Additionally, the measurements were performed with a HEPA filter applied to the inlet to account for zero-value measurements and to adjust the fragmentation table (Allan et al., 2004).
Additionally, 12 h PM1 filter samples were collected by a sequential Leckel Low Volume Sampler (LVS-3, Sven Leckel Ingenieurbüro, Germany) for subsequent chemical analyses of cations, anions, and monosaccharide anhydrides (levoglucosan, mannosan, and galactosan) using ion chromatography (Dionex ICS-5000+ system, Sunnyvale, CA, USA). More details about the methods can be found in Kozáková et al. (2019).
The particle number concentration (PNC) and particle number size distribution (PNSD) were measured every 5 min by a mobility particle size spectrometer (MPSS, IFT TROPOS, Germany, with CPC 3772, TSI, USA) in the size range of 10–800 nm (a detailed description of the measurement setup can be found in Zíková and Ždímal, 2013). The cumulative particle number concentrations over seven size ranges (10–25, 25–50, 50–80, 80–150, 150–300, 300–800, and 10–800 nm) were subsequently calculated from the PNSD. Additionally, the 1 h PM2.5 mass concentrations were measured using a beta gauge (MP101M, Environement SA, France).
The concentrations of equivalent black carbon (eBC) were estimated using a seven-wavelength aethalometer (AE, model AE33, Magee Scientific, Berkeley, CA, USA) sampling through a PM10 sampling head (Leckel GmbH) with a 1 min temporal resolution. Additionally, 4 h PM2.5 online organic and elemental carbon (OCEC) concentrations (Sunset Laboratory Inc., USA) were measured following the shortened EUSAAR2 protocol (Cavalli et al., 2010).
2.2 Data analysis
The standard data processing procedure of AMS data (i.e. calibration, baseline subtraction, and air beam correction) was carried out by running the Squirrel v1.62 programme in Igor Pro data analysis software (WaveMetrics, Inc.).
The statistical data treatment was performed using R version 3.6.1 (R Core Team, 2019) with the ggplot2 (Wickham, 2016) and Openair (Carslaw and Ropkins, 2012) packages.
2.2.1 Collection efficiency determination
To determine the collection efficiency (CE; Drewnick et al., 2005) in the AMS, PM1 filter sampling with subsequent ion chromatography (IC) analysis was conducted in parallel with the AMS measurements. A comparison between the sulfate concentrations measured by AMS and by IC revealed the better suitability of the CE corrections for summer (CE = 0.40; y = 0.99x, R2= 0.95) as well as for winter (CE = 0.33; y = 1.00x, R2= 0.81) in comparison to the composition-dependent CE correction (CDCE; Middlebrook et al., 2012) shown in Fig. A1. Therefore, CE correction was applied to the AMS data for both seasons to maintain consistency in the data corrections. Similarly, using the same methodology, seasonal CE corrections (summer CE of 0.29 and winter CE of 0.35) were also successfully applied to AMS data measured at a suburban site in Prague (Kubelová et al., 2015).
2.2.2 Particle density and shape factor estimation
The effective density (ρeff) and material density (ρm) was estimated along with the dynamic shape factor inferred from the two densities..
DeCarlo et al. (2004) gives three different possible definitions of the effective density estimation: (i) from mobility and mass measurements, (ii) as a fitted parameter, and (iii) from mobility and aerodynamic measurements. Here we proceed from the latter definition with the AMS data representing the mass size distributions based on the vacuum aerodynamic diameter (Dva) in the approximate size range of 50 to 800 nm, and MPSS data based on mobility diameter (Dm) representing the dN dlog Dp in the size range from 11.3 to 987 nm. In the MPSS data, the Dm values were recalculated to vacuum aerodynamic diameters with the assumption of spherical particles as in DeCarlo et al. (2004):
where Dm is the mobility diameter, Dva is the vacuum aerodynamic diameter, ρ0 is the water density, and ρ is the total density of particles. The position of the main mode of mass distribution (analysis preformed with increment of 0.05 g cm−3, uncertainty of the sizing of MPSS – within 3 %, see Wiedensohler et al. (2017), and AMS – within 8 %, see Takegawa et al., 2005) was compared between the AMS and MPSS data to estimate the aerosol effective density (ρeff).
The mass concentrations of NR-PM1 species and eBC were converted to the estimated size-dependent material density (ρm) based on the following equation from Salcedo et al. (2006).
The densities were assumed to be approximately 1.75 g cm−3 for ammonium nitrate, ammonium sulfate, and ammonium bisulfate (Lide, 1991); 1.52 g cm−3 for ammonium chloride (Lide, 1991); 1.20 g cm−3 for organics (Turpin and Lim, 2001); and 1.77 g cm−3 for black carbon (Park et al., 2004).
From the two densities, the Jayne shape factor (S) proposed by Jayne et al. (2000) was inferred, and the dynamic shape factor (χ) assuming near the free molecular regime limit (Jimenez et al., 2003b, c; DeCarlo et al., 2004) was estimated.
2.2.3 Trajectory analysis
For both campaigns, 96 h backwards trajectories were calculated using the Hybrid Single-Particle Lagrangian Integrated Trajectory (HYSPLIT) model (Rolph et al., 2017) with a 500 m a.g.l. (above ground level) starting position and Global Data Assimilation System (GDAS) Archive Information at a resolution of 1∘ × 1∘ as input data. The calculations were initialized every 6 h for the cluster analysis. For the episodes of high mass concentrations (Sect. 2.2.4), the trajectory ensemble option with calculation initialized every hour and a total duration of 72 h was utilized. The trajectories were further clustered using Hysplit4 software based on the total spatial variance.
From HYSPLIT, the planetary boundary layer height data were extracted using the vmixing programme (https://www.ready.noaa.gov/HYSPLIT_vmixing.php, last access: 10 June 2020). For the planetary boundary layer height calculations, the 0.25∘ × 0.25∘ Global Forecast System (GFS) dataset was used as input data to obtain a 3 h temporal resolution.
2.2.4 Episodes of high mass concentrations
To determine episodes of high mass concentrations, a two-step approach was utilized: (i) the mass size distributions of nitrate, sulfate, and organics were depicted in a colour-coded 3-D plot and (ii) episodes of high mass concentrations were chosen based on a set of criteria: high mass size distribution of at least one main NR-PM1 species corresponding to the season – summer/winter ( µg m−3, µg m−3, Org≥ 6 /2 µg m−3); monomodal mass size distribution of all main NR-PM1 species; minimum of 1.5 h for the duration of the episodes. A total of 10 summer (S1–10) and 13 winter (W1–13) high mass concentration episodes were selected. Additionally, due to the long duration of episode W6 and bimodal mass size distribution of Org, the episode was split into two sections: W6a (67 h) and W6b (25.5 h). The episodes were studied in detail from the organic fragments, mass size distribution, particle density (material density – ρm and effective density – ρeff), and dynamic shape factor perspectives.
3.1 Campaign overview
The campaigns were characterized by prevailing westerly winds with average wind speeds of 3.2 ± 1.5 m s−1 in summer and 4.4 ± 3.1 m s−1 in winter (Fig. A2), average temperatures of 18.5 ± 4.7 ∘C in summer and 1.4 ± 3.9 ∘C in winter, and negligible precipitation. The average PM2.5 was 10.9 ± 5.9 µg m−3 in summer and 11.8 ± 9.9 µg m−3 in winter (2019 average annual PM2.5 concentration: 10.1 µg m−3, CHMI, 2019a).
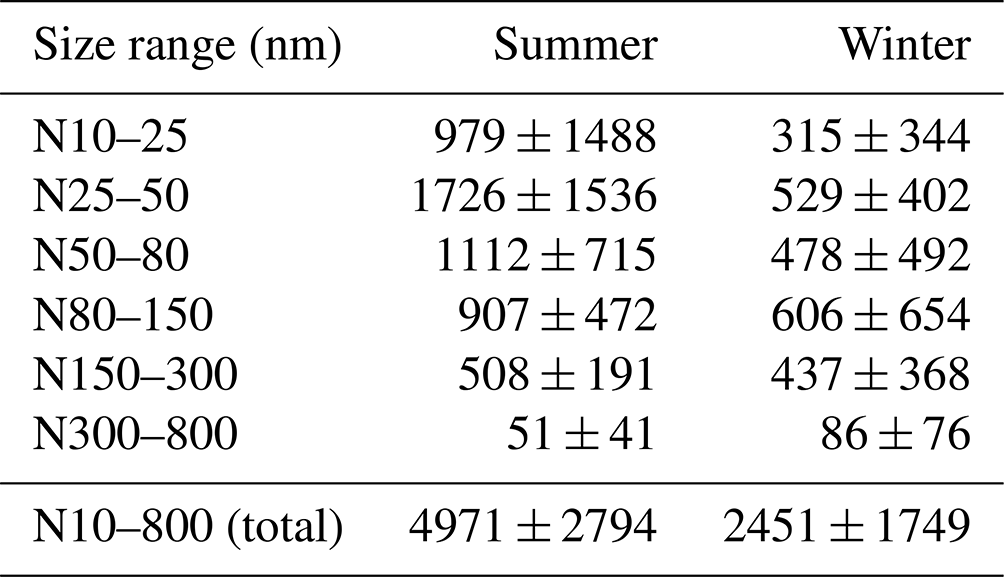
Based on the PNSD, in summer, particles in the size range of 25–80 nm (N25–50 and N50–80) were predominant, whereas in winter, N80–150 were dominant (Table 1). Particles in the size range of 25–80 nm, referred to as the Aitken mode, are typical for rural background stations and originate from the ageing of particles generated during new particle formation (NPF) events (Costabile et al., 2009). Based on a 5-year study (2013–2017) evaluating PNSDs at NAOK, June and July were classified as the months with the highest NPF event frequencies (38 % and 36 % of days, respectively, Holubová Šmejkalová et al., 2021). The prevailing accumulation-mode particles in winter were presented in Schwarz et al., 2016, as well as in Zíková and Ždímal (2013). The average PNCs recorded during the two studied seasons were lower than the annual mean total concentration (6.6 × 103 cm−3, Zíková and Ždímal, 2013).
Table 1Average cumulative particle number concentrations (cm−3) measured by MPSS during the summer and winter campaigns.
3.2 Volume closure analysis with PNSD
For the closure analysis, the total mass concentrations measured by AMS (the sums of the organic, sulfate, nitrate, ammonium, and chloride concentrations) were complemented by the eBC mass concentrations. The average PM1 concentrations for the summer and winter campaigns were 8.58 ± 3.70 µg m−3 (filter-based 12 h PM1 10.10 ± 6.44 µg m−3) and 10.08 ± 8.04 µg m−3 (filter-based 12 h PM1 11.05 ± 7.22 µg m−3), respectively. Since the PNSD (10 to 800 nm mobility diameter) was measured continuously in parallel with the eBC and NR-PM1 mass, volume closure of the 10 min averages was performed converting the NR-PM1+ eBC mass concentrations into volume concentrations using the composition-dependent density. Over the summer campaign, the NR-PM1+ eBC volume concentrations agreed well with the MPSS volume concentrations (Fig. 1).

3.3 Concentration and origin of NR-PM1
The CE-corrected mass concentrations of NR-PM1 species, calculated as functions of time during the two campaigns, are shown in Fig. A3 and the seasonal average concentrations are presented in Table 2. Organics were dominant during both campaigns, followed by SO in summer and NO in winter. The PM1 IC results confirmed higher mean SO concentrations in summer (SO1.63 ± 0.84 µg m−3 and NO 0.23 ± 0.18 µg m−3). However, the mean NO concentrations were slightly lower than the SO concentrations in winter (NO 0.72 ± 0.52 µg m−3 and SO0.78 ± 0.58 µg m−3). The difference between the NO concentrations in NR-PM1 and PM1 for both seasons could be explained by the loss of ammonium nitrate from the filter due to its dissociation into its gaseous precursors. Good agreement was obtained between the summer average NR-PM and PM (0.80 ± 0.37 µg m−3 vs. 0.70 ± 0.36 µg m−3) in comparison to those obtained in winter (1.11 ± 0.99 µg m−3 vs. 0.46 ± 0.35 µg m−3). The seasonal variability in nitrate, which displayed higher concentrations in winter, was related to the thermal instability of ammonium nitrate (Seinfeld and Pandis, 2006). A higher share of Cl− along with eBC on PM1 in winter (3 % and 9 %, respectively) indicates the influence of coal combustion used for domestic heating (CHMI, 2019b).
Overall, the average SO concentration obtained in this study was lower than that measured at the Melpitz rural background site (2.44 µg m−3 in summer and 1.66 µg m−3 in winter, Poulain et al., 2011) and lower than the values presented in previous studies by Schwarz et al. (2016) conducted at NAOK (PM2.5 IC 2.30 µg m−3 in summer and 3.86 µg m−3 in winter) and by Kubelová et al. (2015) conducted at a Prague urban background site (2.0 µg m−3 in summer and 4.4 µg m−3 in winter). The average summer NO concentration was comparable to those measured in Melpitz (0.66 µg m−3), NAOK (PM2.5 IC 0.55 µg m−3), and Prague (0.80 µg m−3); however, the winter average concentration was lower than those reported in all three studies (Melpitz: 3.62 µg m−3, NAOK: 2.83 µg m−3, Prague: 5.40 µg m−3). The average organic concentration was lower in summer but higher in winter compared to the values recorded in Melpitz (6.89 and 2.08 µg m−3, respectively). The comparison of organic mass (OM) by AMS and OC using an OCEC field analyser is shown in Fig. A4. Turpin and Lim (2001) recommended an OM OC ratio of 2.1 for non-urban (aged) particles and of 1.6 for urban particles. In this study, the average OM OC ratio was 2.06 (±0.68) in summer and 1.51 (±0.36) in winter. An average OM1 and OC2.5 of 2.1 ± 1.4 was determined at the Hohenpeissenberg rural site in spring, referring to continental OA (Hock et al., 2008). The higher summer OM OC ratio could be explained by the presence of more oxidized organic compounds, as the products of photochemical reactions increase the average organic molecular weight per carbon weight (Turpin and Lim, 2001). This result is consistent with the increasing OC EC ratio observed during summer, when photochemical activity leads to larger secondary organic carbon formation (Mbengue et al., 2018, 2020). Another explanation could be the increased boundary layer height, which enables mixing from higher altitudes and therefore the entrainment of aged, and thus more oxidized, aerosols from long-range transport (Querol et al., 1998). On the other hand, the winter season is characterized by fresh emissions of hydrocarbons due to the lowered boundary layer height in winter, which does not support the transport of oxidized pollutants within the mixing layer (Schwarz et al., 2008).
Table 2Basic statistics of the NR-PM1 and eBC concentrations (median, mean, standard deviation (SD), and average share of species in the total concentration) measured during summer and winter. The values were calculated from 5 min resolution CE-corrected data.
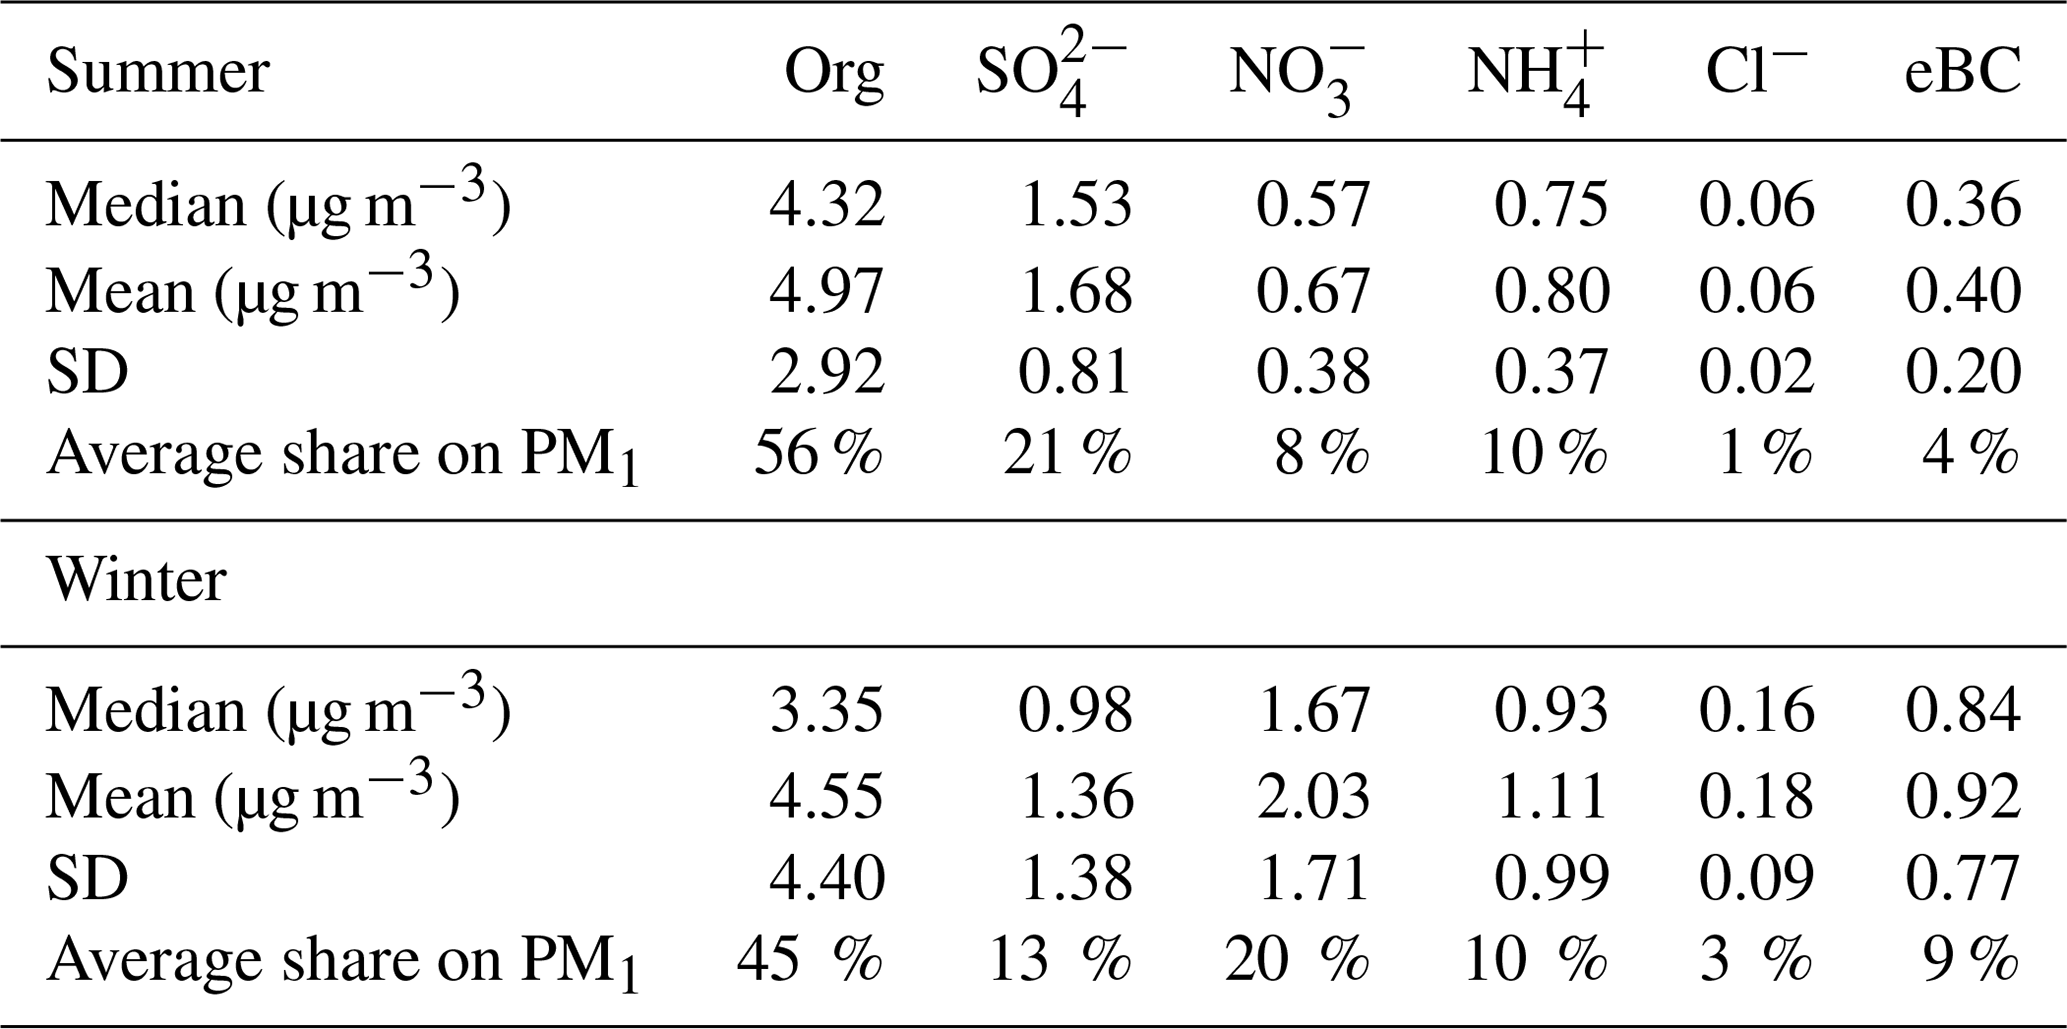
Fig. 2 shows the variations in the particle number and volume and in the sulfate, nitrate, and organic size distributions as function of time. In summer, several NPF episodes were recorded (Zíková and Ždímal, 2013; Holubová Šmejkalová et al., 2021); however, accumulation-mode particles were prominent in volume and species mass size distributions.
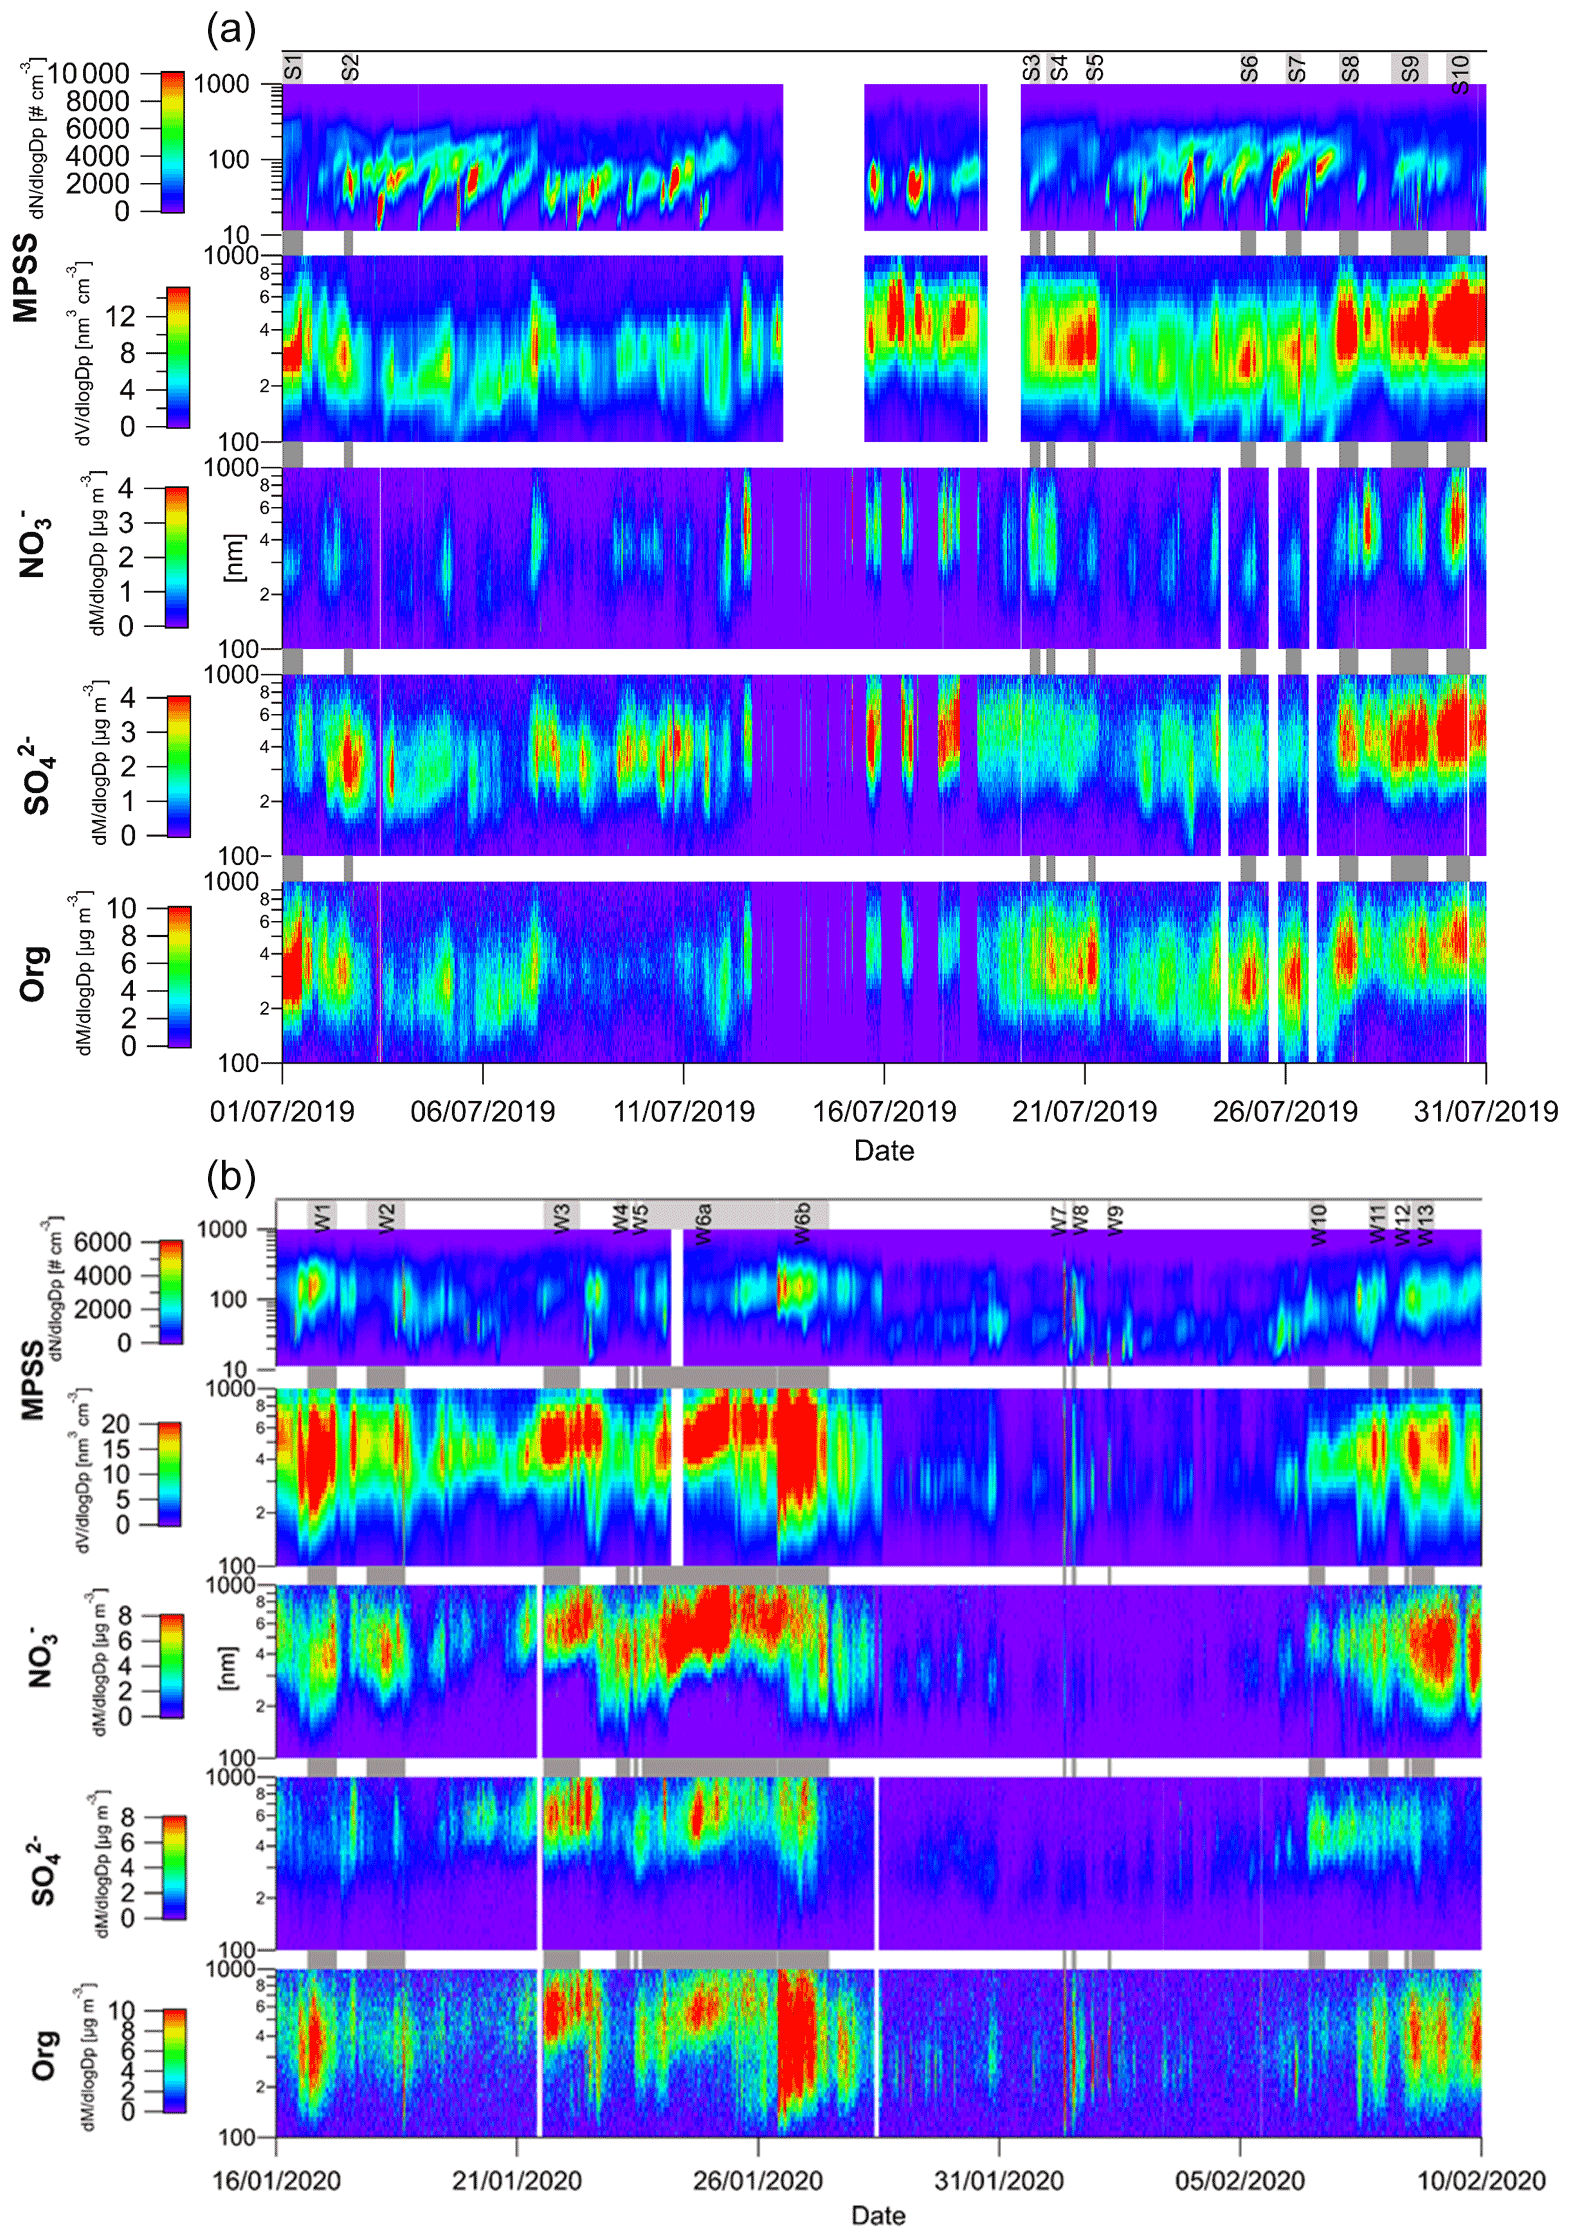
Figure 2Time series of particle number and volume concentrations obtained by MPSS (Dva recalculated from mobility diameter) and mass size distributions of nitrate, sulfate, and organics obtained by AMS in summer (a) and in winter (b) with marked episodes of higher mass concentrations.
The accumulation mode of SO does not show a large amount of variation, indicating a regional origin. In contrast, NO shows diurnal variations in mass concentrations corresponding to the local photochemical formation of this species (Fig. 3). In winter, the accumulation mode dominated all distributions and was linked to regional and/or long-range transport (see Sect. 3.4).

Figure 3Mean diurnal trends (time in UTC) of the NR-PM1 species (95 % confidence interval) in summer (a) and winter (b).
To determine the origin of NR-PM1 species, back trajectories describing their air mass origins were clustered using the HYSPLIT model into six and five clusters in summer and winter, respectively (Fig. 4), and linked to the PM1, N10–800, organic, nitrate, sulfate, ammonium, and eBC concentrations. A seasonal difference was observed in the air mass back trajectories, with continental air masses prevailing in summer and marine air masses prevailing in winter.
In summer, cluster nos. 1, 2, and 3 (fresh marine air masses from the NW, 56 %) and cluster no. 4 (continental air masses from the NW, 27 %) were most frequent. Although aged continental air masses from the SE probably related to stable anticyclonic conditions (cluster no. 6) were rare (7 %), they were connected with the highest concentrations of PM1, eBC, and all NR-PM1 species (Fig. 4). The highest particle number concentrations (N10–800) were linked to fresh marine air masses (cluster nos. 1, 2, and 3). There was statistically significant difference among all clusters at the 0.05 level (Kruskal–Wallis test).
In winter, slow continental air masses from the SW cluster no. 1 (44 %) prevailed. The air masses remaining over central Europe, likely under inversion conditions, were associated with the highest concentrations of PM1, eBC, and all NR-PM1 species. The high pollution loads over central Europe agree well with the high average mass concentrations of secondary species during periods in which air masses are advected from central Europe to Paris (Freney et al., 2011; Crippa et al., 2013; Freutel et al., 2013; Freney et al., 2014). N10–800 was mainly linked to marine cluster nos. 1 and 5. There was statistically significant difference among all clusters at the 0.05 level.
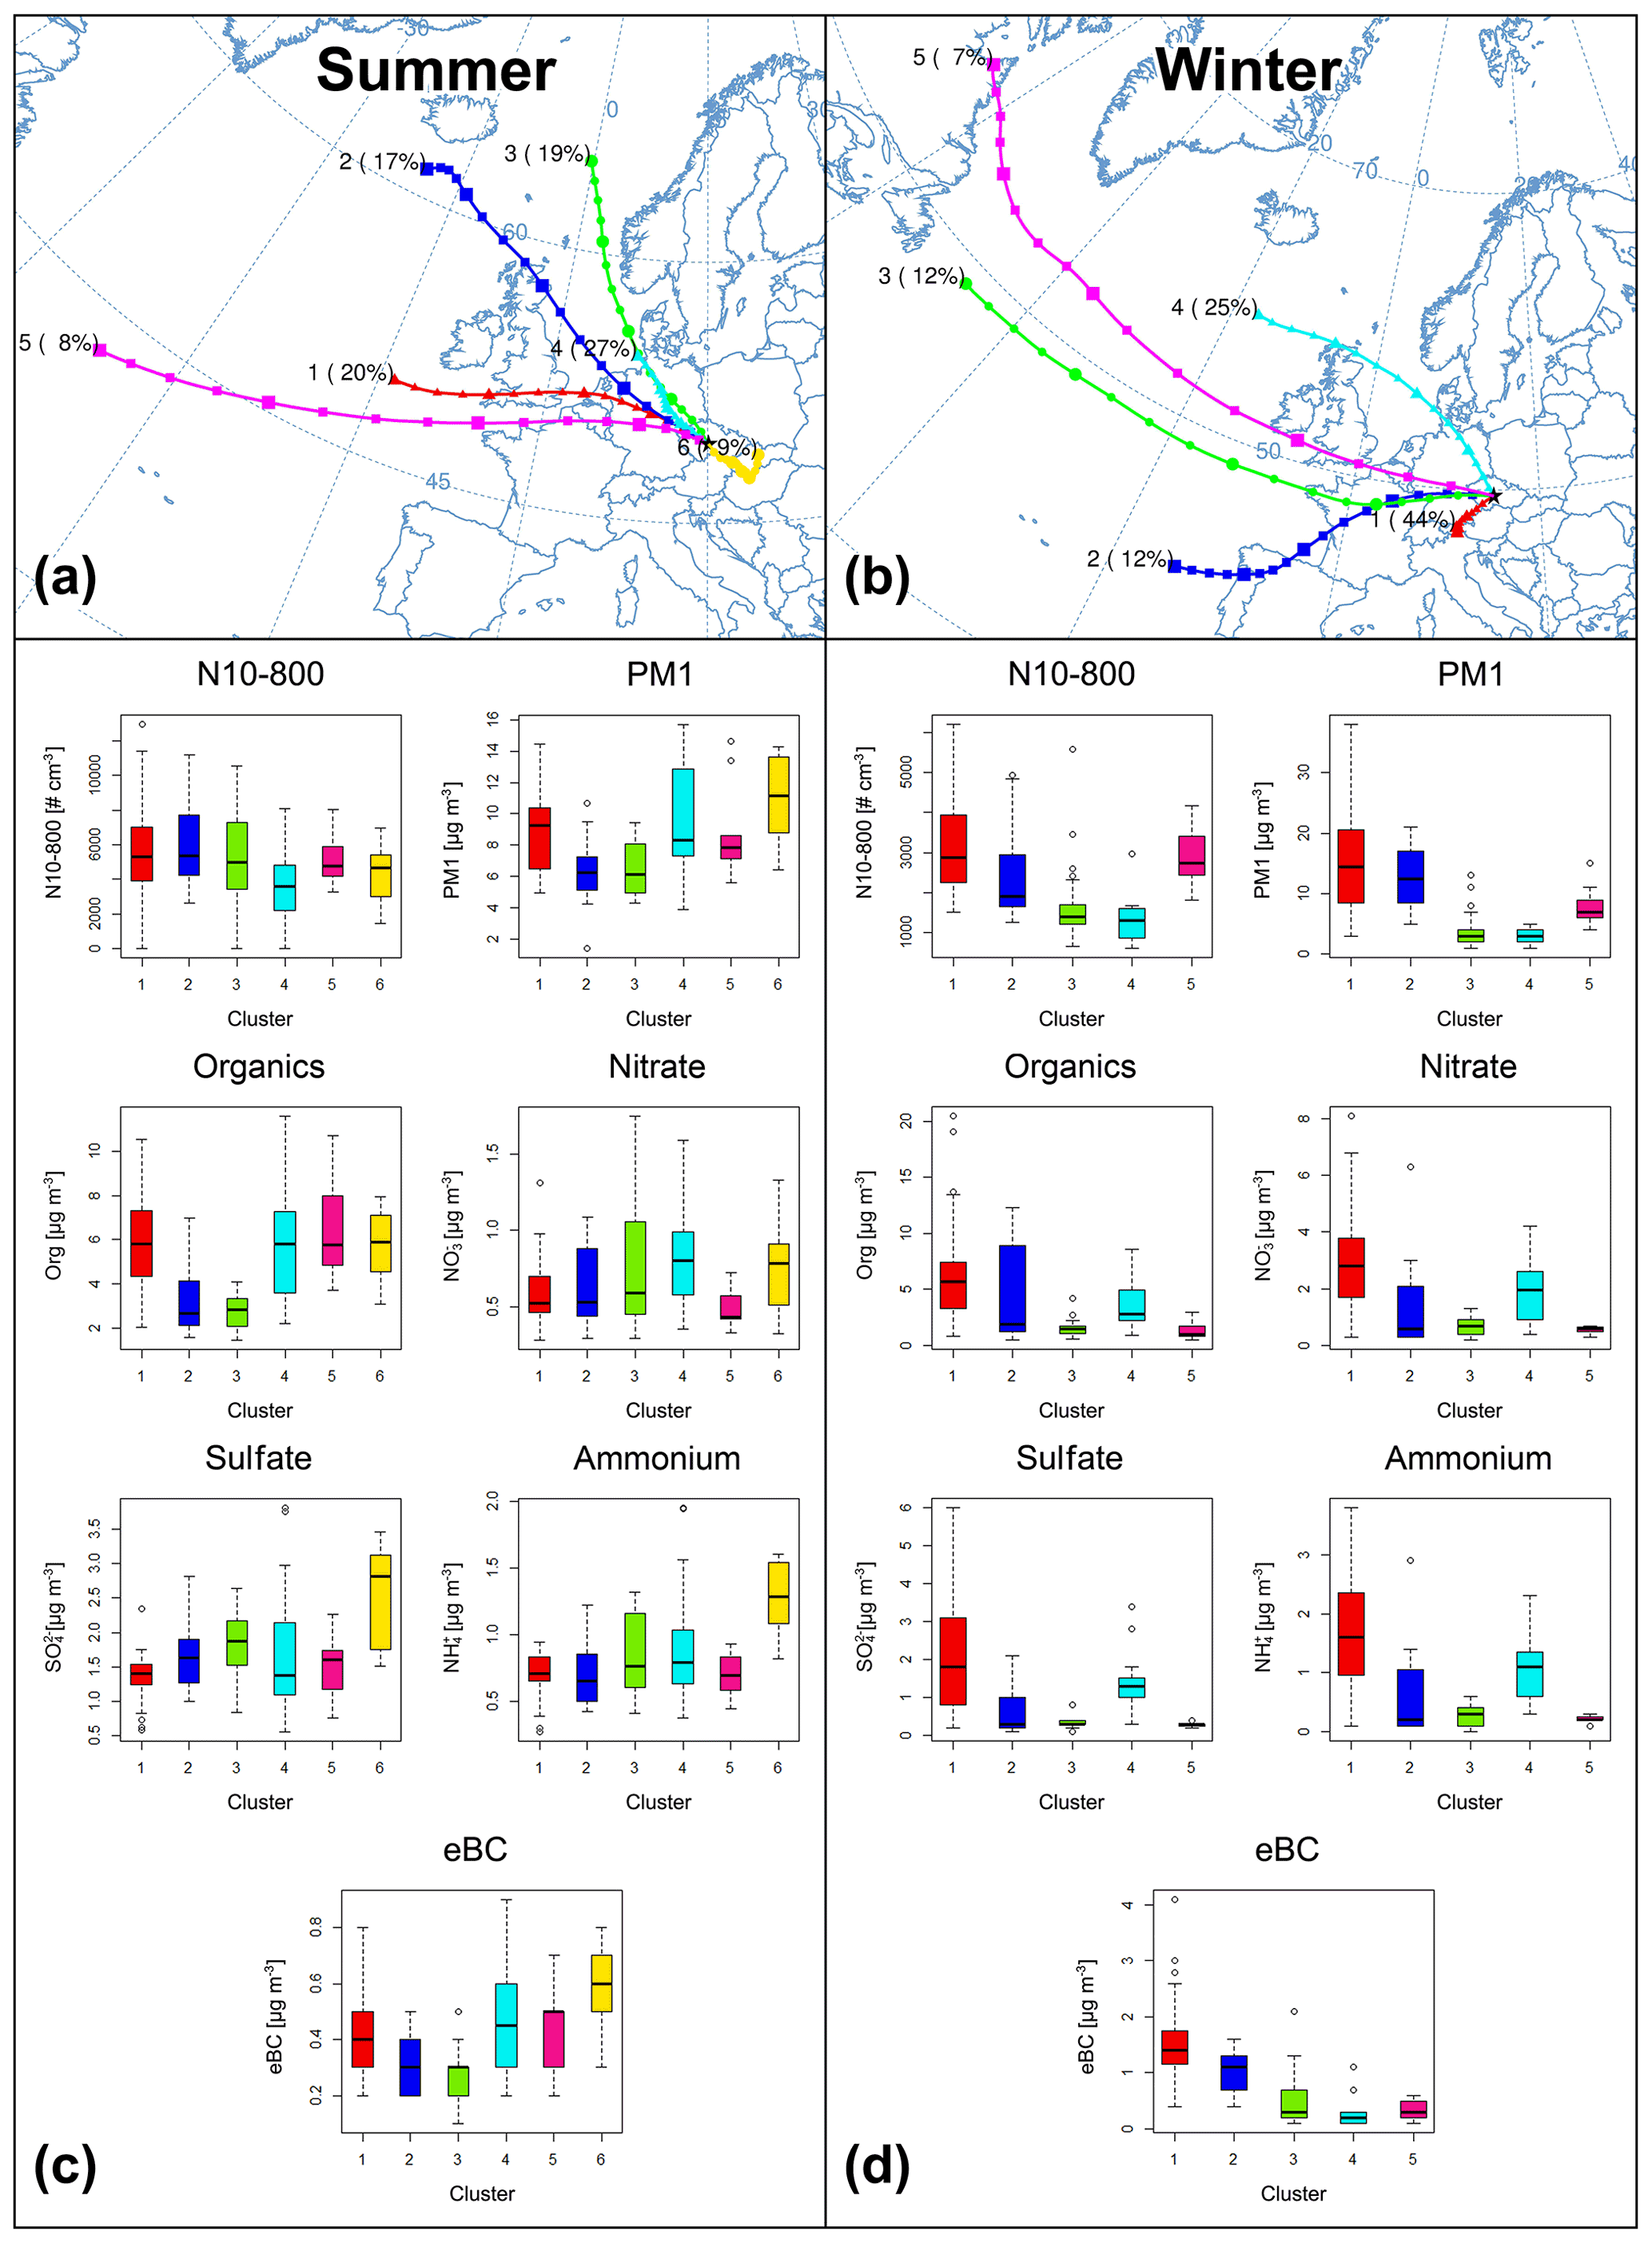
Figure 4Geographical locations of the means of the clusters observed in summer (a) and winter (b) along with boxplots of the PM1, N10–800, organic, nitrate, sulfate, ammonium, and eBC concentrations in individual clusters measured during the summer (c) and winter (d) campaigns. The boxes are colour coded as the clusters, the black horizontal line is the median, the boxes border the 25th and 75th percentiles, and the whiskers represent 1.5 × IQR.
Based on the mass size distributions of the species (Fig. 2), 10 summer (S1–10), and 13 winter (W1–13) high mass concentration episodes were selected (Table A1). The organic mass dominated in summer; however, distinct episodes of high SO concentrations (S2, S8, S9, S10) linked to continental air masses from the NW and S–SE were also recorded (Fig. A4). In winter, episodes of dominant SO (W10) and NO (W1, W2, W4, W5, W6) concentrations were observed. W10 was influenced by marine air masses reaching NAOK over the UK, Benelux, and Germany. The episodes of high NO concentrations were mainly linked to continental air masses (from the NW–SW, Fig. A6) from northern France, Benelux, central Germany, and northern Italy. These regions were traced as hotspots of high particulate nitrate concentrations related to intense agricultural activities under anticyclonic conditions in late winter and early spring (Waked et al., 2014; Petit et al., 2017, 2019; Favez et al., 2021).
In summer, the highest Org concentrations (14.58 µg m−3) together with the lowest SO and NH (1.24 and 0.91 µg m−3) concentrations were observed during the S1 night–morning episode linked to western continental air masses (Table A1 and Fig. A3). S10 represents the night–morning–early afternoon episode of the highest concentrations of SO, NO and NH (6.14, 3.37, and 2.98 µg m−3, respectively) resulting from mixed continental air masses (NW–S) that were potentially influenced by emissions from coal power plants situated in North Bohemia.
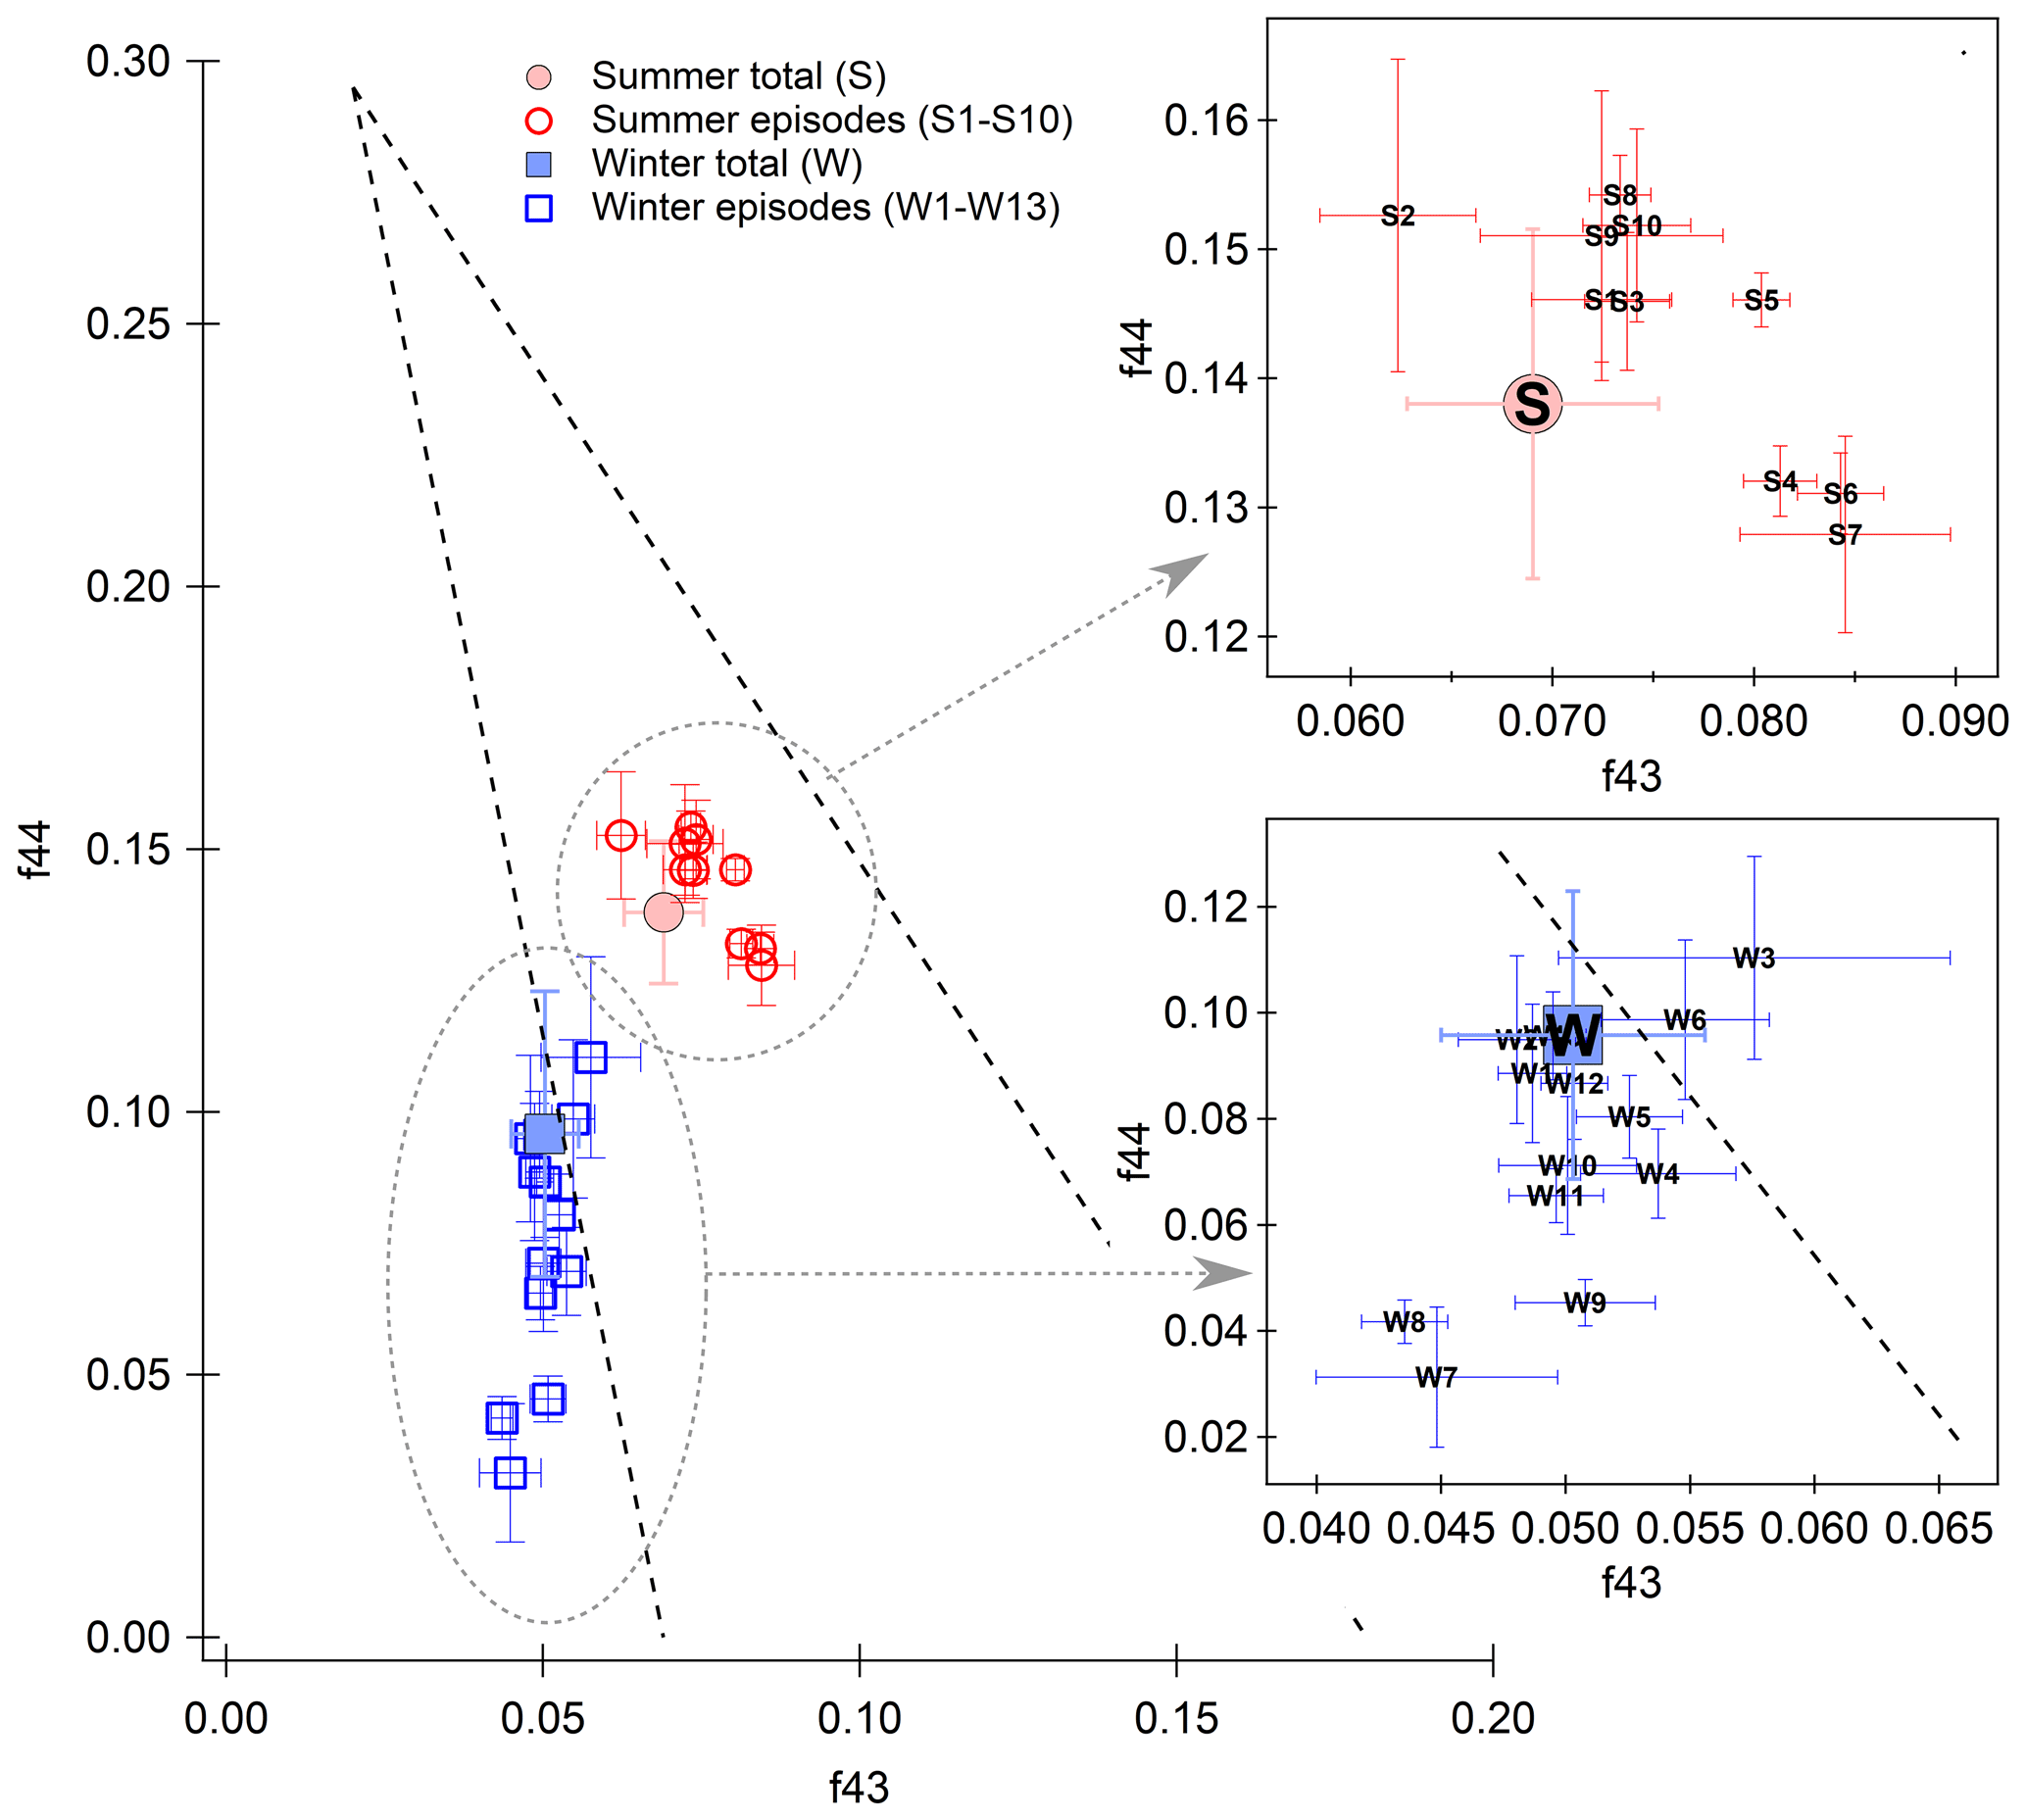
Figure 5Comparison of organic fragments f44 and f43 for the whole summer and winter campaigns (full markers) and for specific episodes (empty markers). Bars represent the standard deviation and the triangular space area typical for ambient OOAs (Ng et al., 2010).
The highest concentrations of Org (15.63 µg m−3) as well as low concentrations of SO, NO and NH (0.74, 0.93 and 0.96 µg m−3, respectively) measured in winter during W7 were influenced by maritime air masses crossing France and Germany before reaching the NAOK (Fig. A6). Nevertheless, a 1 d inversion preceded this episode (Fig. A3), characterized by less oxidized OA (Figs. 5, A7). In contrast, the highest winter SO and NH concentrations (7.13 and 7.90 µg m−3, respectively) measured in the W3 episode and the highest NO concentrations (10.66 µg m−3) measured in the W6a episode were characterized by slightly below-freezing temperatures (average temperature −2.4 ∘C ± 1.3 ∘C), which probably arose due to inversion conditions in central Europe. The conditions prevailing during the W6a episode, in combination with ammonia due to the agricultural activities including the spreading of fertilizers, probably induce increases of particulate nitrate and ammonium concentrations similarly as reported by Favez et al. (2021) for northern France.
Organic fragments f44 and f43 (ratios of organics in 44 and 43 to total organics) can serve as a proxy of aerosol oxidation and its ageing, respectively (Ng et al., 2010). In simplified form, more oxidized aerosols have higher f44 and lower f43, while less oxidized and more volatile aerosols have the opposite f44 vs. f43 relationship. These oxidation properties of organic aerosols are well defined by the triangular region defined by Ng et al. (2010). This triangular area is shown in Fig. 5 together with the evolution of f44 and f43 fragments during both campaigns.
In general, it shows that winter aerosols were less oxidized than summer aerosols. This results along with the organics diurnal trends of late evening maxima (Fig. 3) pointing to the importance of local sources during the cold part of the year. The importance of local fossil fuel combustion for residential heating as a source of fresh OA/hydrogen-like OA in winter is presented in a study by Chen et al. (2021). In summer, the oxidation rate of organic aerosols within the episodes does not differ greatly, and most of the episodes revealed more oxidized organic aerosols (MO-OOAs) or less volatile organic aerosols (LV-OOAs) (e.g. Jimenez et al., 2009; Crippa et al., 2013). Within the summer campaign, the most oxidized aerosols were detected during the afternoon episode S2 (Fig. 5), at which time the highest global radiation was also measured (Table A1). In contrast, S4, S6, and S7 represent nighttime and early morning episodes, and S5 represents a nighttime and morning episode, and thus less oxidized aerosols (Fig. 5). In winter, the difference between the episodes is more obvious, mainly due to the higher variability in the local sources that influence the receptor site. The W7, W8, and W9 (Fig. 5) episodes are exceptions; these episodes were linked to clean fresh marine air masses that cause prevailing influence of local, fresh, and less oxidized aerosol (Fig. A6).
The organic fragment f60 was used as a biomass-burning (BB) marker. If ambient aerosols are characterized by an f60 higher than 0.003, they are considered to be influenced by BB emissions (Cubison et al., 2011). During both campaigns, the average f60 was 0.003, in contrast to the presence of levoglucosan in the PM1 samples during both seasons (summer average of 0.02 ± 0.02 µg m−3 and winter average of 0.18 ± 0.20 µg m−3). Levoglucosan concentrations point to BB influence, which was similarly discussed in previous studies conducted at NAOK by Schwarz et al. (2016) and Mbengue et al. (2020). Additionally, a comparison of fragments f44 and f60 enabled us to assess the presence of fresh or aged organic aerosols emitted by BB (e.g. Milic et al., 2017), revealing that aged organic aerosols from BB influenced the site during both seasons, especially in winter (Fig. A7). The comparison of organic fragments f44 and f60 determined at the rural and urban background sites shows a difference in the ageing of BB emissions with the presence of fresh organic aerosols at the urban site and aged organic aerosols at the rural site in winter (Fig. A8).
3.4 Size distribution of NR-PM1
The average mass size distributions of the main NR-PM1 species (except chloride) during the entire summer and winter campaign are presented in Table 3. To determine the mode diameters and the widths of the size distributions, the mass distributions were fitted with log-normal modes using the Igor MultiPeak package as follows:
where M is the amplitude, x0 is the peak position in nm, and width denotes the peak width. For each season, the mean spectra were fitted separately with one peak, and fitting was also performed for episodes S1–10 and W1–13.
The accumulation mode dominated the average mass size distributions during both campaigns, with larger particles of all species observed in winter (Table 3). Shifts towards larger SO, NO and NH particles in winter compared to summer were also observed in a previous study by Schwarz et al. (2012) that determined urban aerosol chemical compositions and size distributions using a seven-stage impactor with an upstream diffusional aerosol drier. The SO particles were significantly larger than the NO particles during both measurement campaigns except for those collected during two episodes (W7 and W9) with regional transport (Table A1). An accumulation mode of SO with regional origin was even detected during a Mexico City metropolitan area field study by Salcedo et al. (2006). Dall'Osto et al. (2009) also observed two nitrate particle types at an urban background site, both of which were internally mixed with sulfate, ammonium, and carbon: the locally produced particles were smaller than 300 nm, while the regional particles peaked at 600 nm. In a study by Schwarz et al. (2012) at an urban site in Prague, two types of SO particles were determined. SO particles in sea-influenced aerosol samples showed maxima between 210 and 330 nm (condensation growth) for both seasons, and SO particles in continental-influenced samples showed maxima between 500 and 890 nm in winter and between 330 and 500 nm in summer (droplet-phase growth). NO particles with maxima between 330 and ∼ 500 nm were observed under maritime and continental air masses during both seasons. Freutel et al. (2013) observed a single mode of NR-PM1 species of approximately 300 nm under marine air masses as well as a shift of the accumulation mode to a larger size (approximately 400 nm) during a summer campaign in the Paris region due to aerosol particle ageing of continental air masses from central Europe. During a summer measurement campaign in New York, the average mass distributions of NO, SOand NH were monomodal, with mode diameters of 440, 450, and 400 nm, respectively, and the average Org mass distribution was bimodal, with mode diameters of 80 and 360 nm (Drewnick et al., 2004). A study by Freney et al. (2011) conducted during three seasons at the Puy-de-Dôme research station presented a major accumulation mode of NR-PM1 species peaking at 600 nm, indicating aged aerosol particles.
Table 3Mode diameter of mass distributions of species measured by AMS (Dp corresponds to the vacuum aerodynamic diameter (Dva)) for the summer and winter campaigns.
In summer, the smallest mode diameters of Org (279 nm) and NO (253 nm) were observed during the S7 episode, while for SO and NH (325 and 335 nm, respectively), they were influenced by continental air masses of regional origin during the S2 episode (from the N–NE–E, Fig. A5). In contrast, the largest mode diameters (Org: 466 nm, NO: 491 mm, SO: 494 nm, and NH: 478 nm) were recorded during the S10 episode by continental long-range transport from the W–NW (Fig. A5). The smallest mode diameters of all species (Org: 295 nm, NO: 240 nm, SO: 242 nm, and NH: 365 nm) in winter (W8) were linked to fresh marine air masses, and the largest winter diameters (Org: 563 nm, NO: 609 nm, SO: 636 nm, and NH: 607 nm, W3) were linked to the regional and long-range transport of air masses of continental origin and were likely influenced by inversion conditions (Fig. A6). The ageing of aerosol particles is often connected with particle growth similarly as with oxidation of organic mass. Comparison of fragment f44 and mode diameter fully confirmed the ideas (Fig. 6). In both seasons, the correlation of the linear fit between Org size and f44 was significant (p value < 0.001). However, the data presented here do not allow us to extend this size range due to both instrumental (C-ToF-AMS particle size range is approximately from 50–800 nm) and data characterization reasons, as we did not observe a major mode of organics at sizes below 200 nm.
In general, however, Fig. 6 suggests that the larger the particles with the organic contribution, the more oxidized they are due to its longer residence time in the atmosphere. The milder slope of the line for the summer dataset (Fig. 6) indicates that oxidation is still occurring on the particles but appears to be approaching an oxidation limit with growing particle size. In the case of winter, the steeper slope of the line and lower f44 values for smaller particles suggest that the change of oxidation state with particle size is relatively more intense than in summer (Fig. 6). However, even so, under the given winter conditions (e.g. lower photochemical oxidation in winter than in summer), the degree of oxidation of organic aerosols does not reach the same level as in summer.
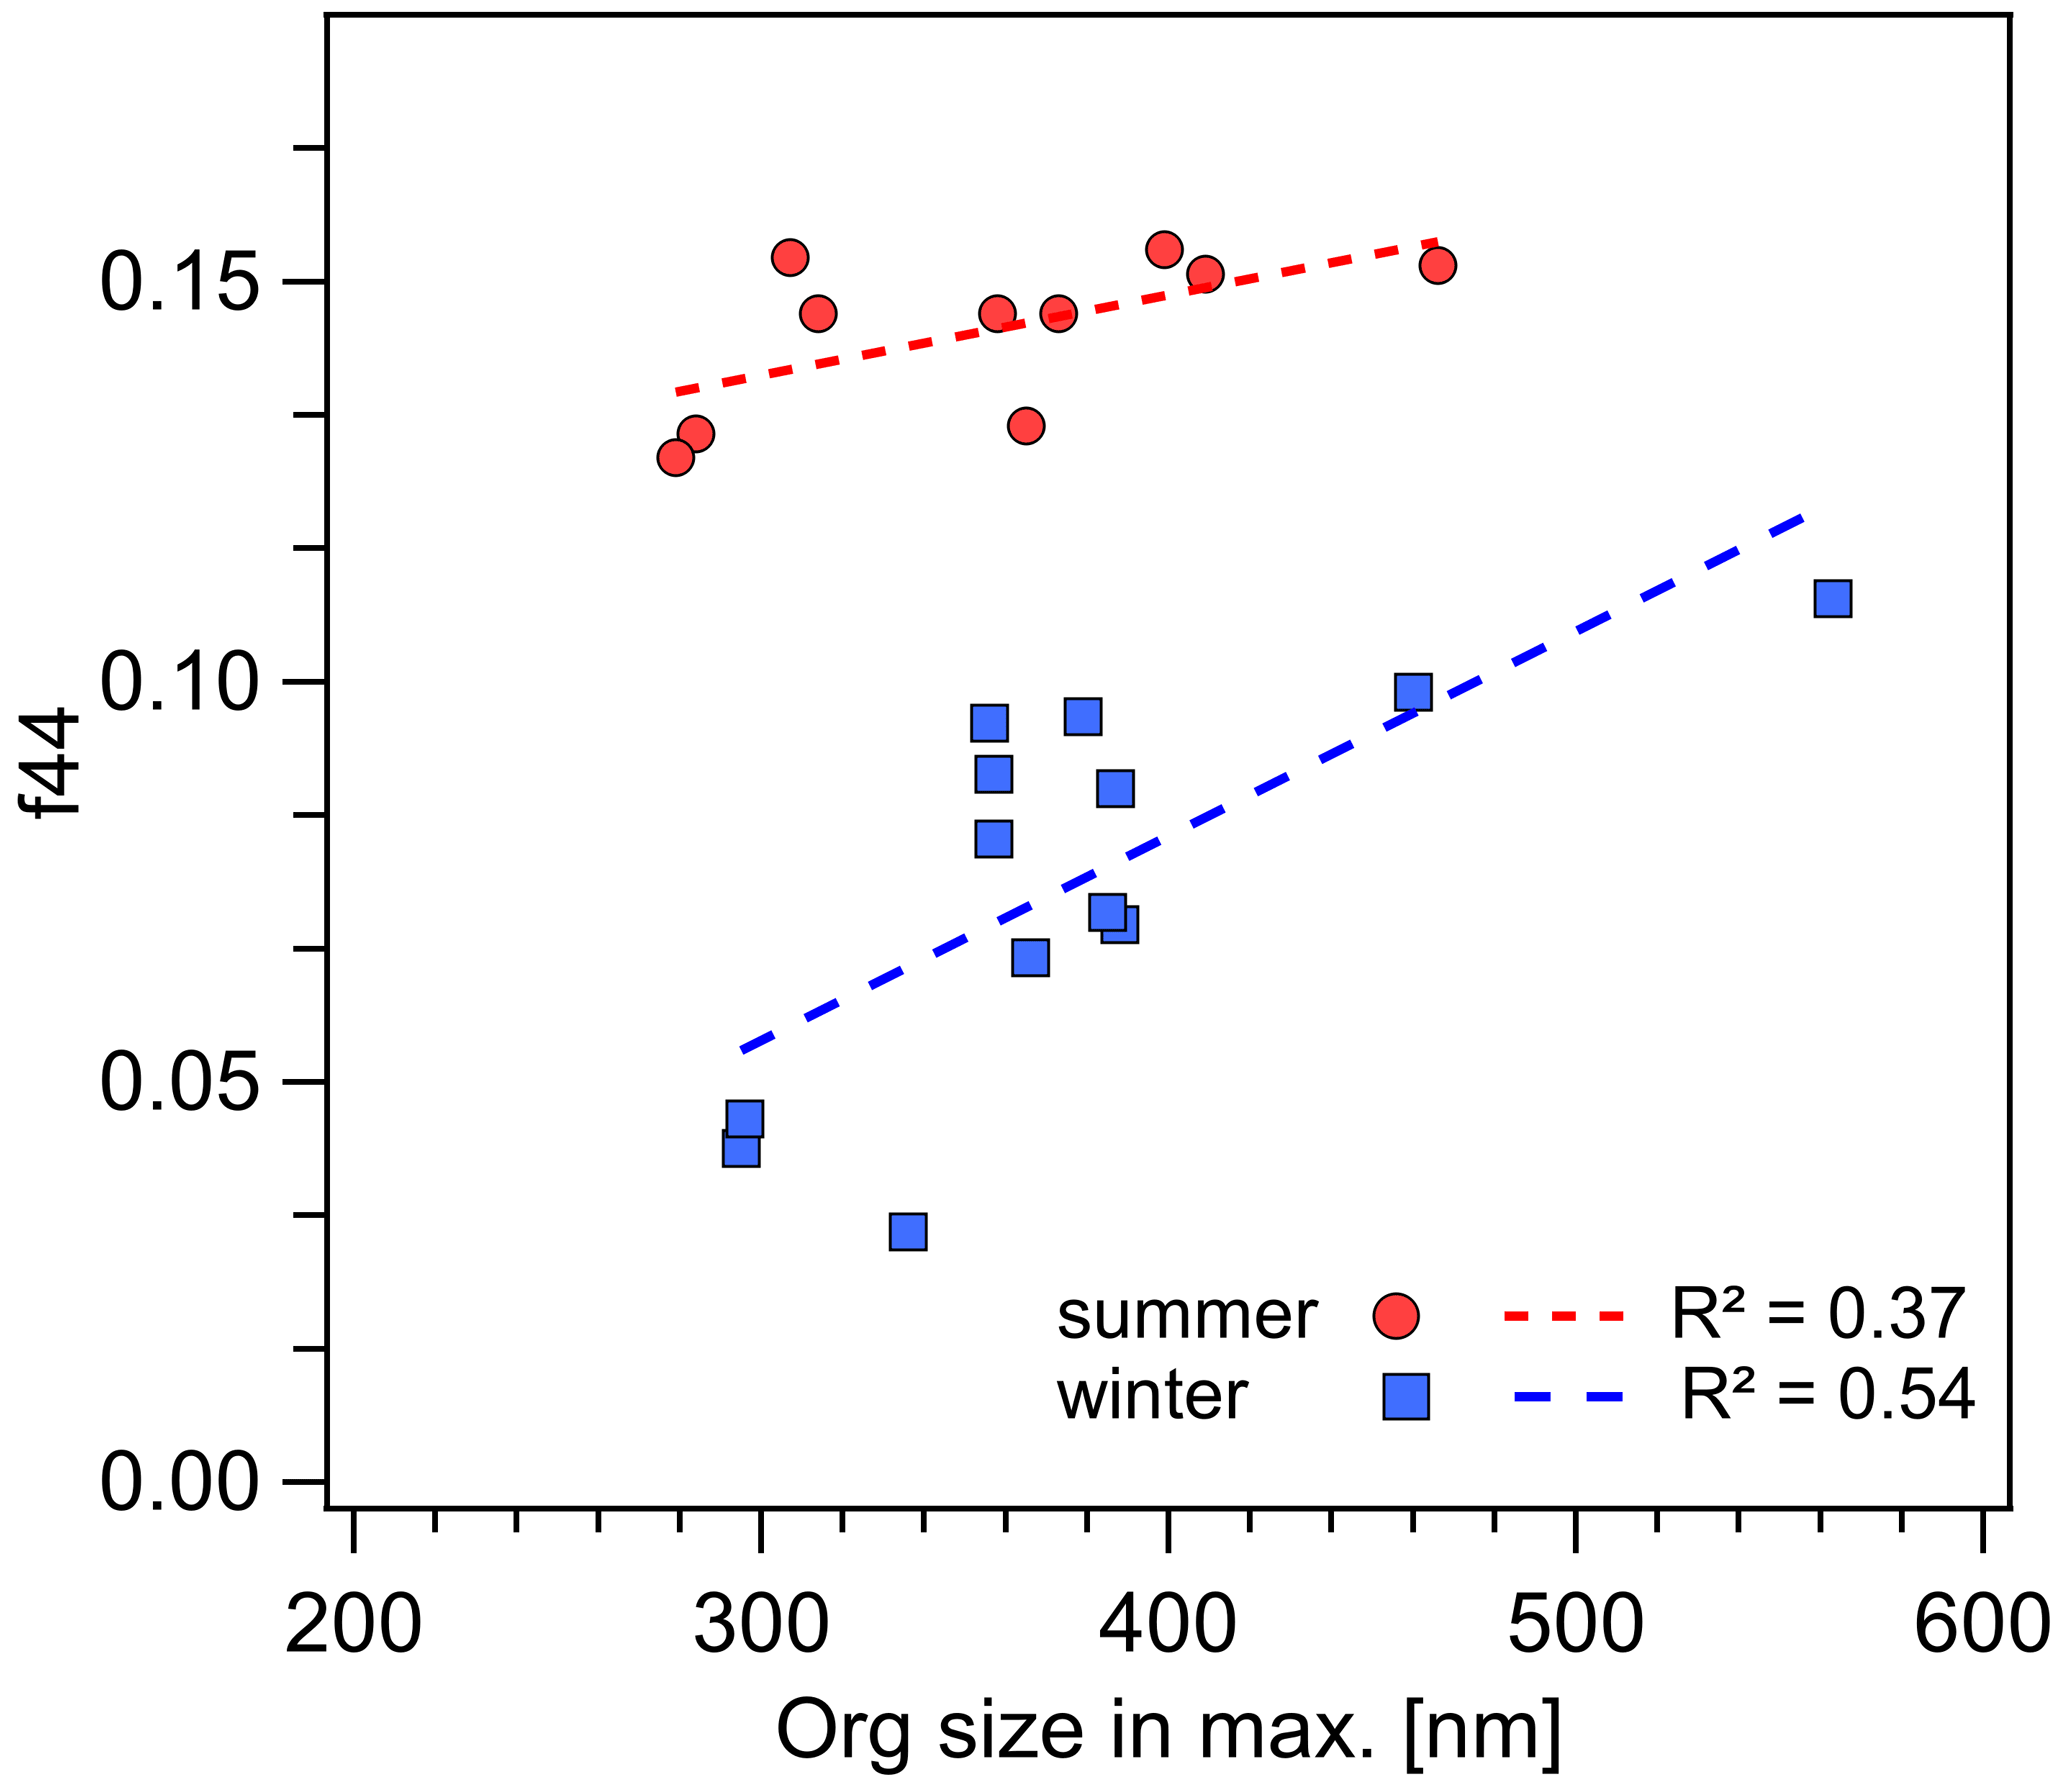
Figure 6Relationship between the organic fragment f44 and the size of the organic fraction during episodes of high NR-PM1 species mass concentrations in both seasons.
3.5 Particle density and shape factor
The particle density and shape factors were calculated for each episode of high mass concentrations.
The densities (ρeff) calculated based on the particle mass size distributions using Eq. (1) corresponding to the episodes discussed in Sect. 3.4 (size distribution of NR-PM1) and summarized in Table A1 ranged from 1.40–1.60 g cm−3 in summer and from 1.30–1.75 g cm−3 in winter (Table 4, Figs. A9 and A10). The densities calculated using Eq. (2) ranged from 1.30 to 1.40 g cm−3 in summer (with a seasonal average of 1.34 ± 0.28 g cm−3) and from 1.30 to 1.50 g cm−3 in winter (with a seasonal average of 1.44 ± 0.16 g cm−3) (Table 4). The average summer density (ρm) did not show a diurnal trend compared to the winter density (Fig. 7), followed by a diurnal trend (inverse dependence) observed for organics (Fig. 3). The summer diurnal variation in the concentrations of organics was flatter than that in winter and was not sufficient to significantly affect the diurnal density trend. In summer, we observed the most significant diurnal trend for nitrate, yet the absolute concentrations of nitrate were low, and therefore this variation did not significantly affect the summer diurnal density trend.

Figure 7Diurnal trends of average ρm calculated based on Eq. (2) in the main text from Salcedo et al. (2006) in summer (a) and winter (b).
In summer, where there was a higher ratio of ammonium sulfate, the density increased. In winter, the density was influenced by the inorganic content (ammonium nitrate and sulfate). In both seasons, the density increased with a decrease in the organic ratio. This relation evidently arises from the parameters in Eq. (2) (Fig. 8). The largest uncertainty in the PM density calculations performed using Eq. (2) is linked to the density of organics, which was set to 1.2 g cm−3. The density applied for the organic fraction refers to the urban and urban background stations (Turpin and Lim, 2001), and the organics' density of a rural background site is expected to be higher than that of an urban site due to organic aerosol ageing. However, a density of 1.2 g cm−3 was also utilized in a study conducted by Freney et al. (2011) at a mid-altitude Puy-de-Dôme site and in a study conducted by Poulain et al. (2020) at a rural background site in Melpitz. To be able to compare our results with above mentioned studies, we also used density of 1.2 g cm−3 for organics in Eq. (2). Therefore, as the mass fraction of organics in the aerosols increased, the density calculated using Eq. (2) converged to a value of 1.2 g cm−3 (Fig. 8). The use of higher density value for Org in Eq. (2) (e.g. 1.3 and 1.4 g cm−3) affects the overall density value; thus, ρm is more in agreement with ρeff. Increasing value of the Org density in Eq. (2) also flattens the diurnal trend in winter, but it still holds significant diurnal variations (Fig. A11).
Values of Jayne shape factor (S) and the inferred dynamic shape factor (χ) for summer and winter episodes of high mass concentrations are presented in the Table 4. In summer, the dynamic shape factor was almost constant (1.02–1.09) and shape of the particle nearly spherical as a sphere χ= 1 (Hinds, 1999). In winter dynamic shape factor ranged from 0.96 to 1.15, implying particles of nearly spherical shape and/or as compact agglomerates (DeCarlo et al., 2004; Zelenyuk et al., 2006). There was a slight decrease in dynamic shape factor (χ) with particle size (Fig. 9, statistically significant at the 0.05 level for winter). In comparison with the laboratory studies, the dynamic shape factor increased with particle mobility diameter or remained constant (Jimenez et al., 2003b, c; Slowik et al., 2004; Park et al., 2004; Zelenyuk et al., 2006). Additionally, in the study by Zelenyuk et al. (2006), the produced organic particles were found to be nearly spherical and the data suggested that an addition of organics to ammonium sulfate particles lowers their dynamic shape factor.
Table 4Particle densities (g cm−3) and shape factors calculated during episodes of high mass concentrations using AMS data in summer (a) and winter (b).
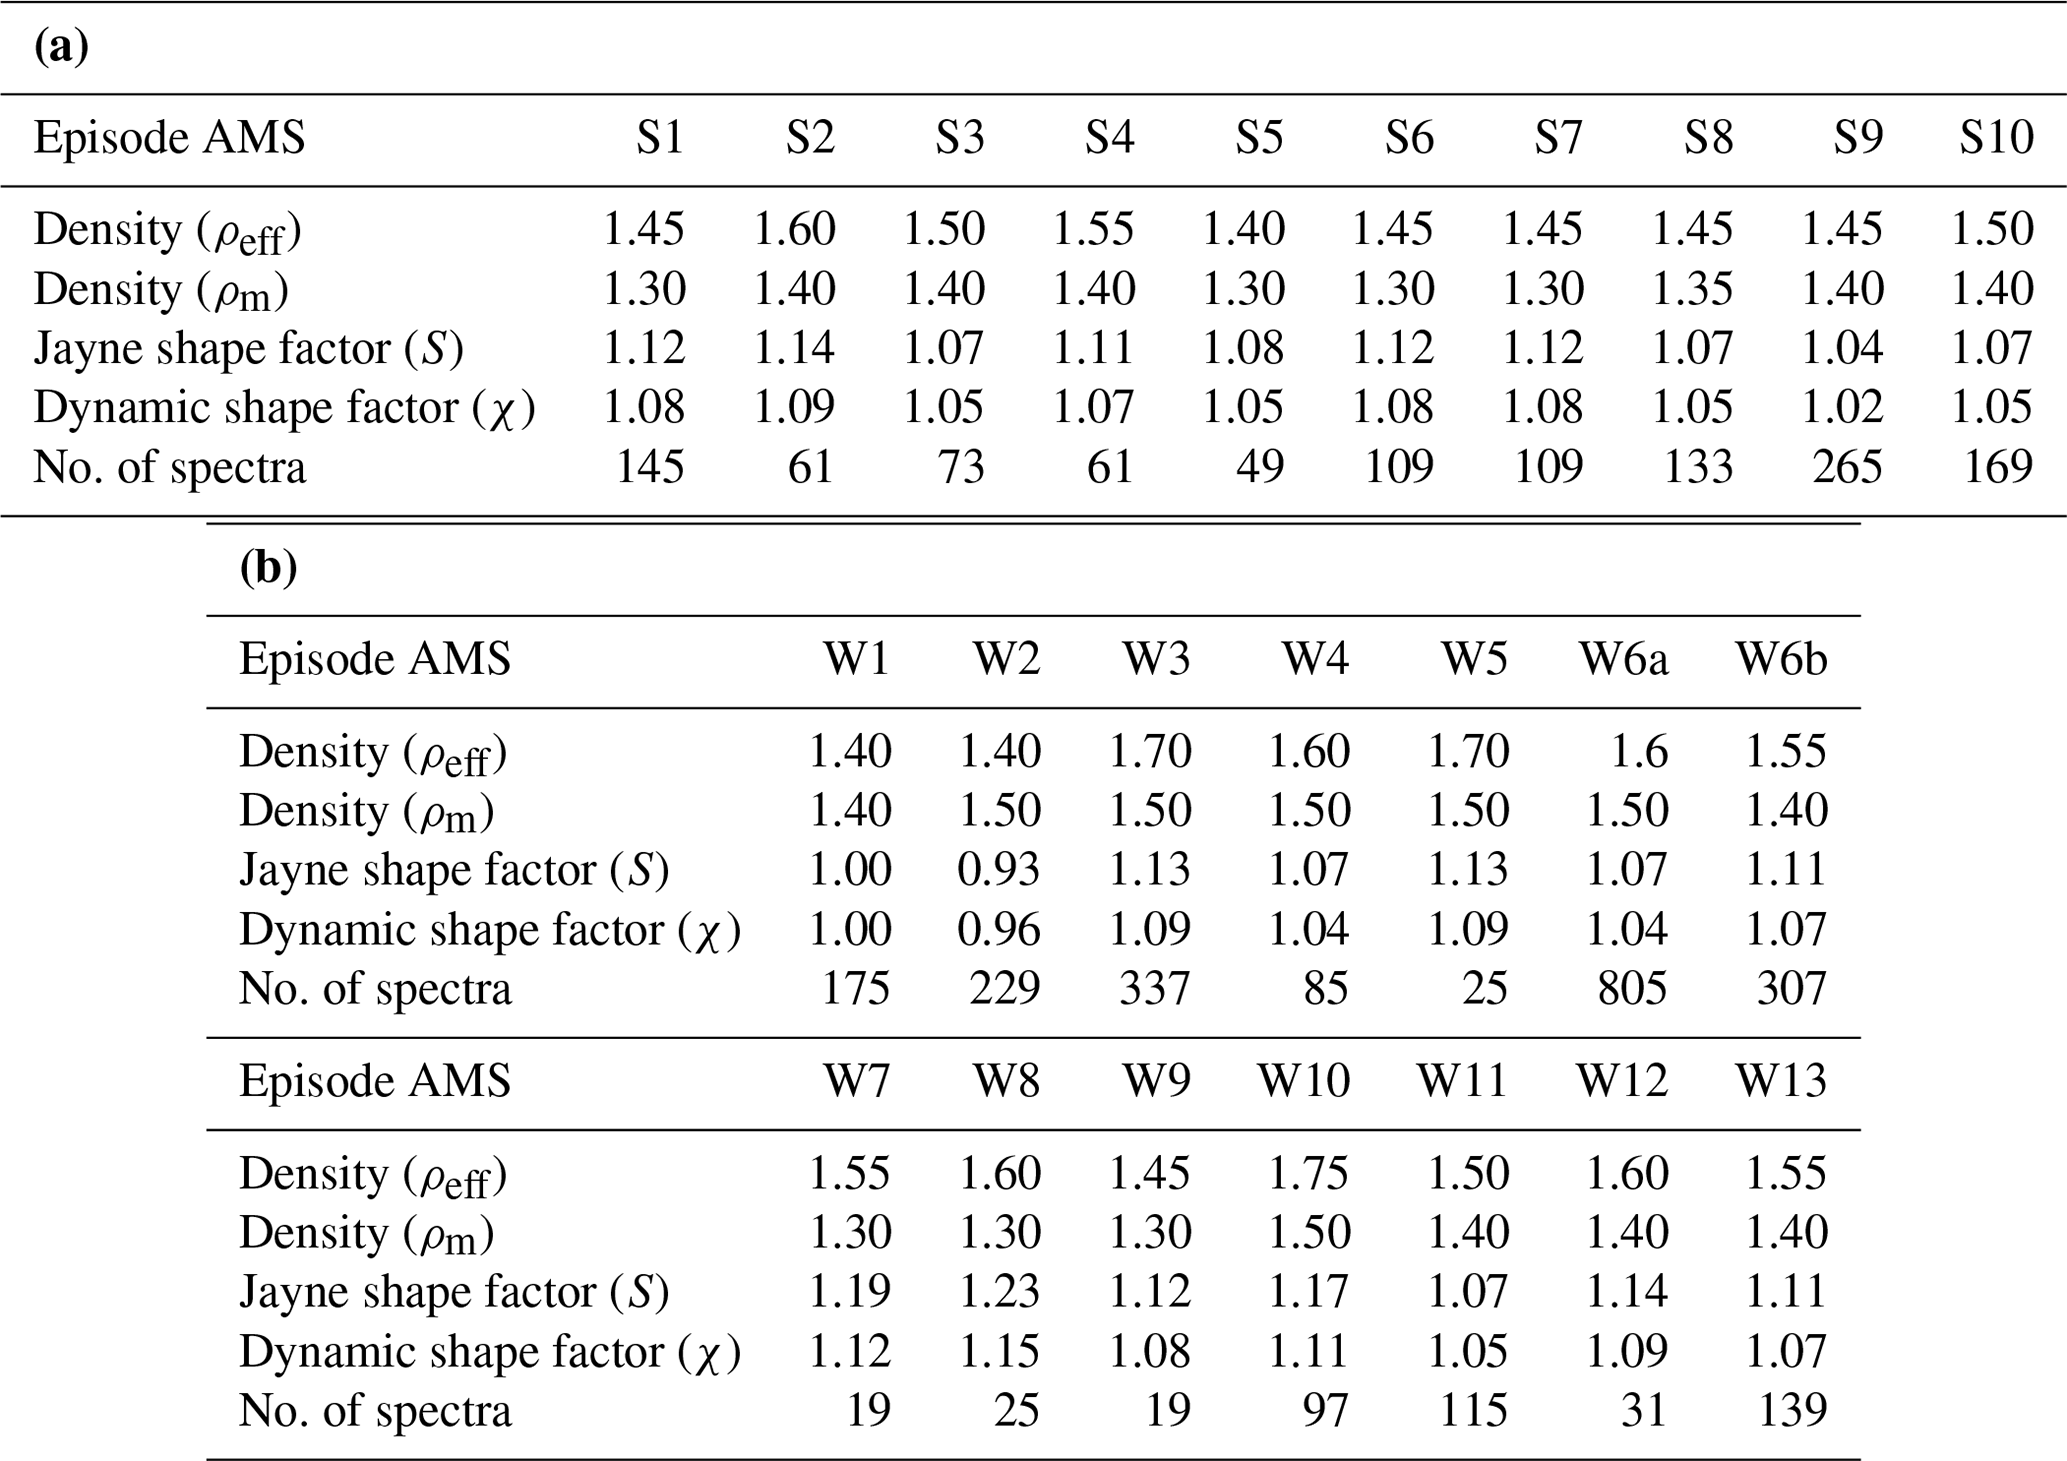

Figure 8The relationship between density (ρm), calculated according to Eq. (2), and mass fractions of the main NR-PM1 species. Idealized extrapolation of organics' densities is added to the summer figure for ρ= 1.2 g cm−3 at 100 % Org and ρ= 1.77 g cm−3 for 0 % organics.
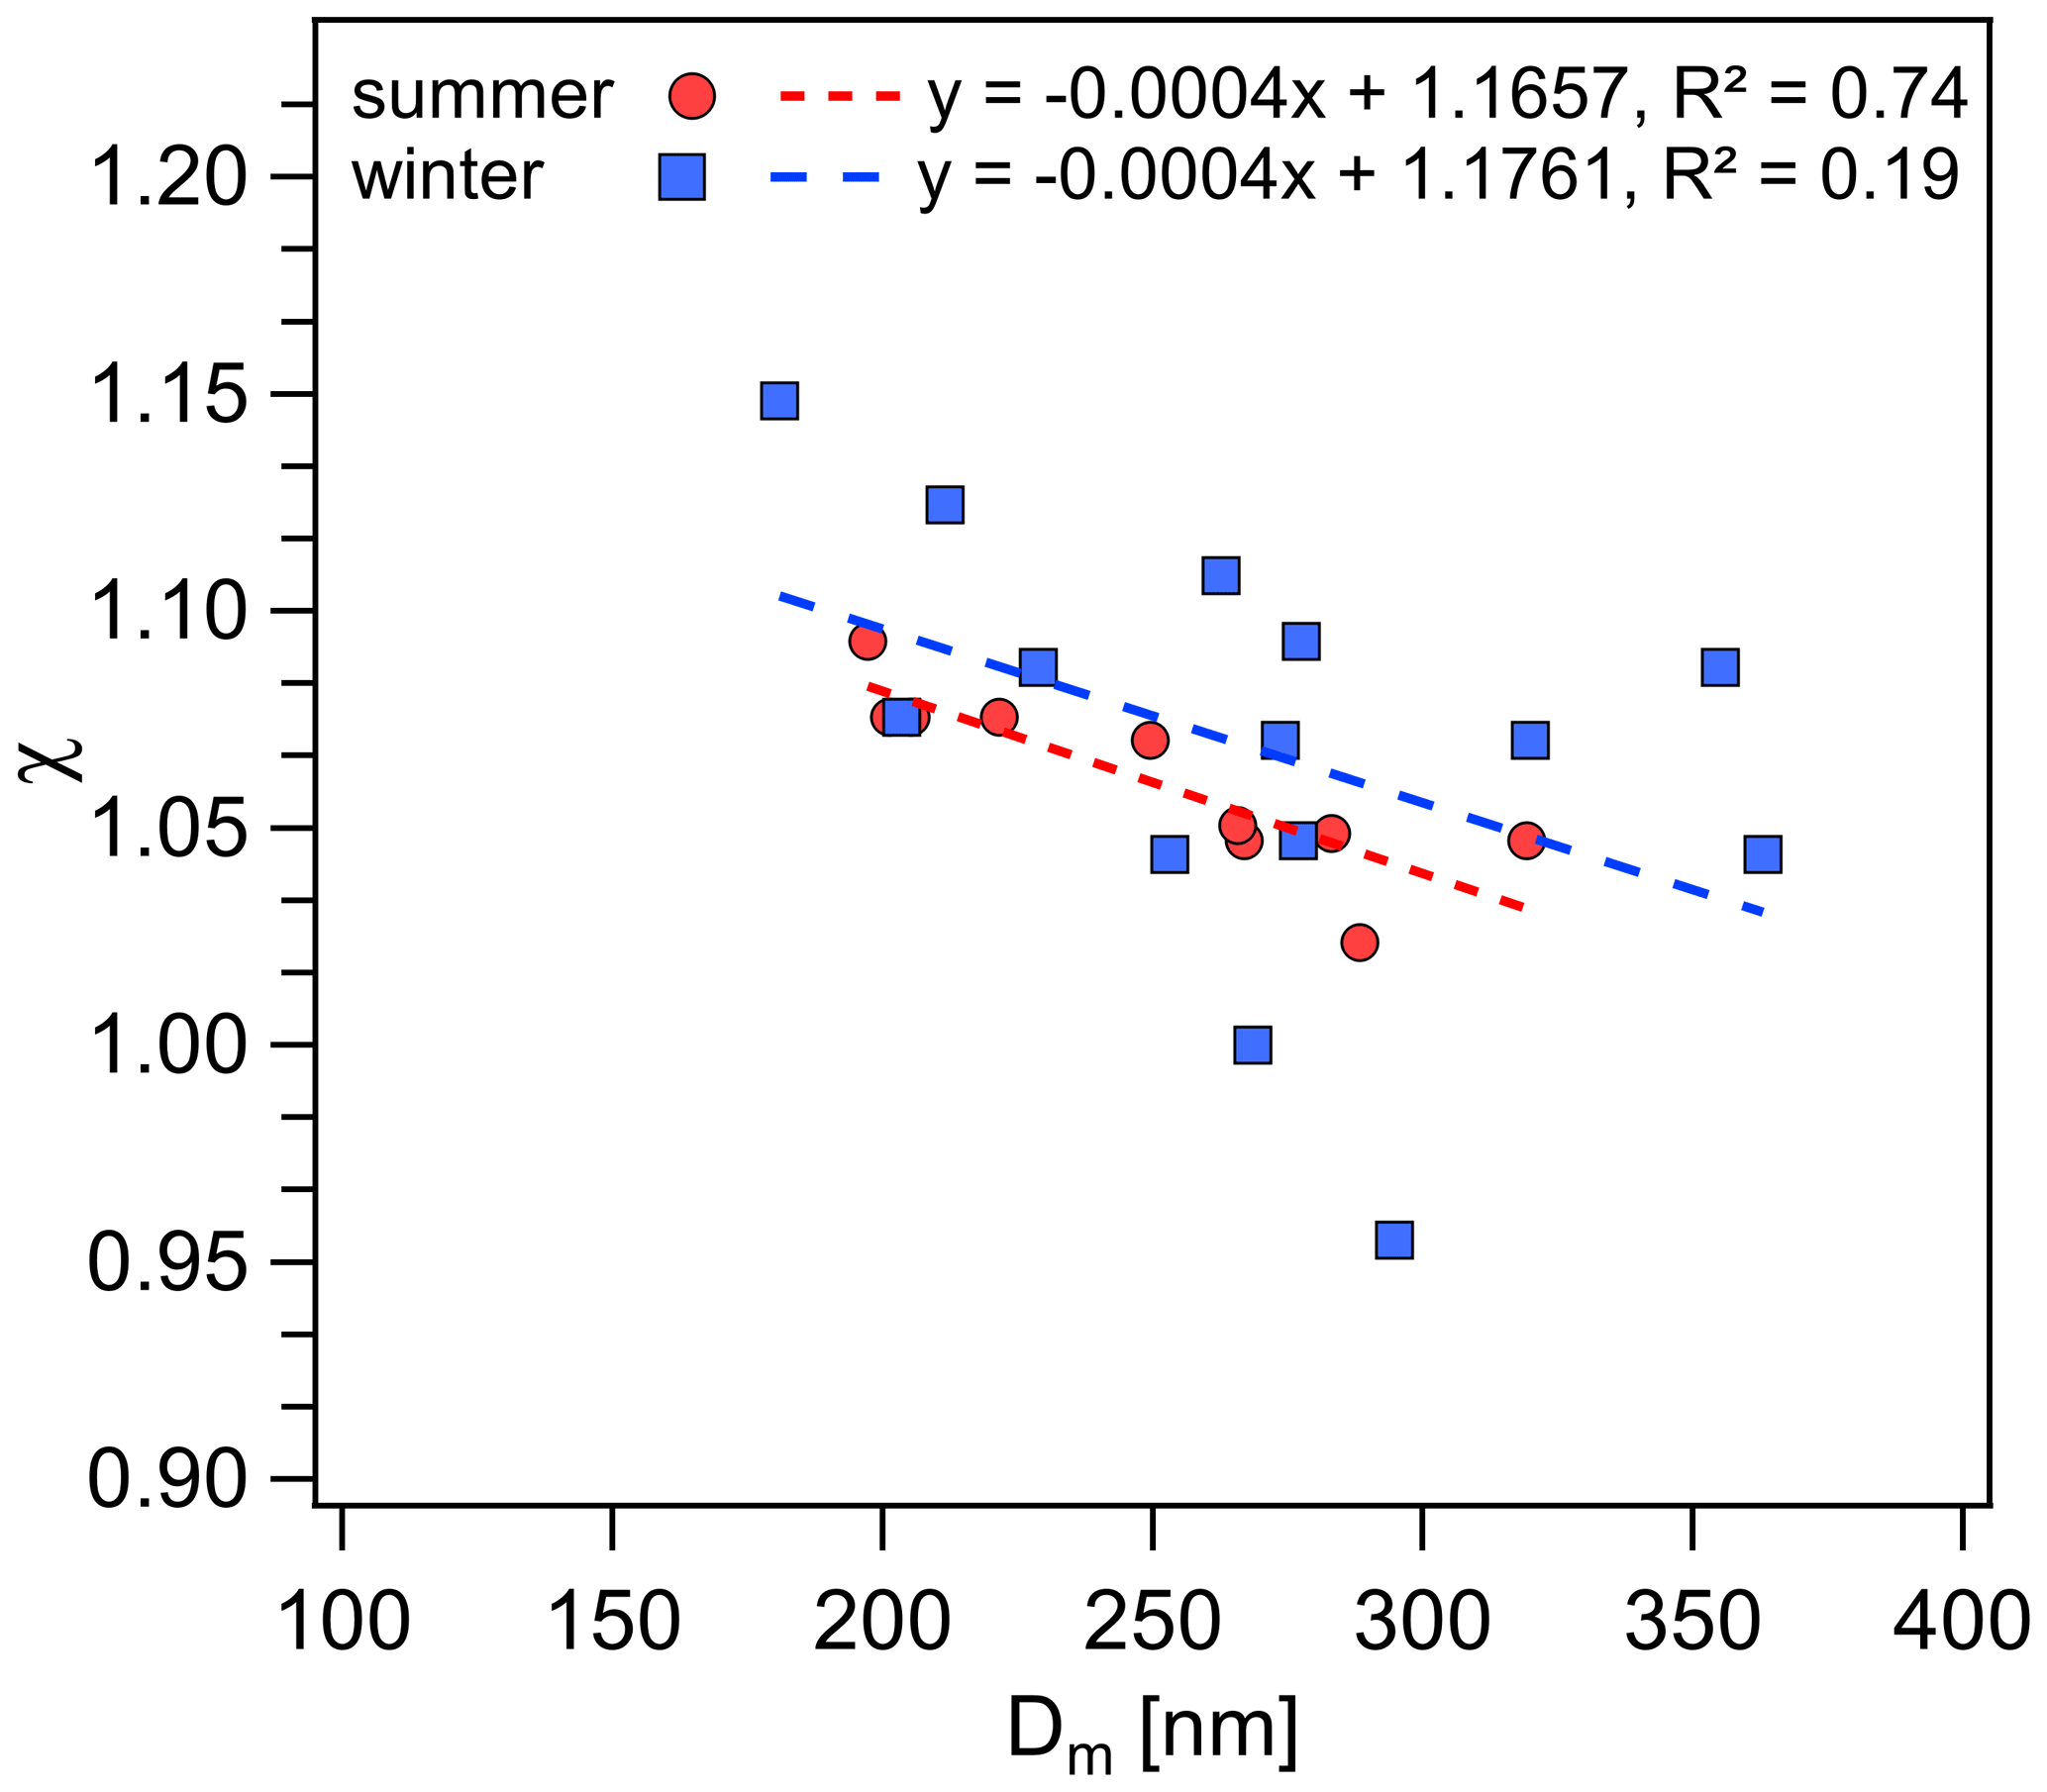
Figure 9Calculated variation of the mobility diameter (Dm) as a function of the dynamic shape factor (χ) for the summer and winter episodes of high mass concentrations.
3.6 Episodes of high particle number concentrations
The particle densities and shape factors were also calculated for episodes of high particle number concentrations determined by positive matrix factorization (PMF) application to PNSDs (see more in Sect. A1). PMF application to PNSDs enables us to retrieve episodes of one factor, and therefore of same origin reflected as well in the particle density and shape. The PMF model was run until the most physically meaningful results (factor profiles – log-normal distribution Fig. A12 and origin Fig. A13) and the best diagnostics were obtained (Table A2).
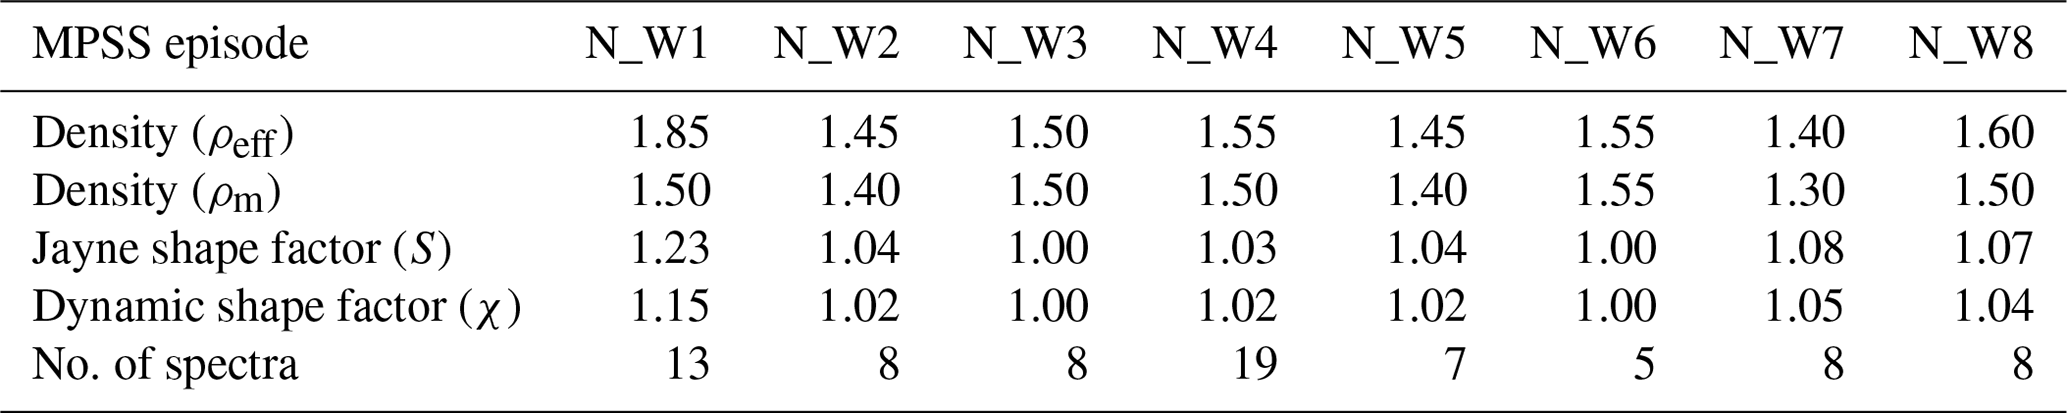
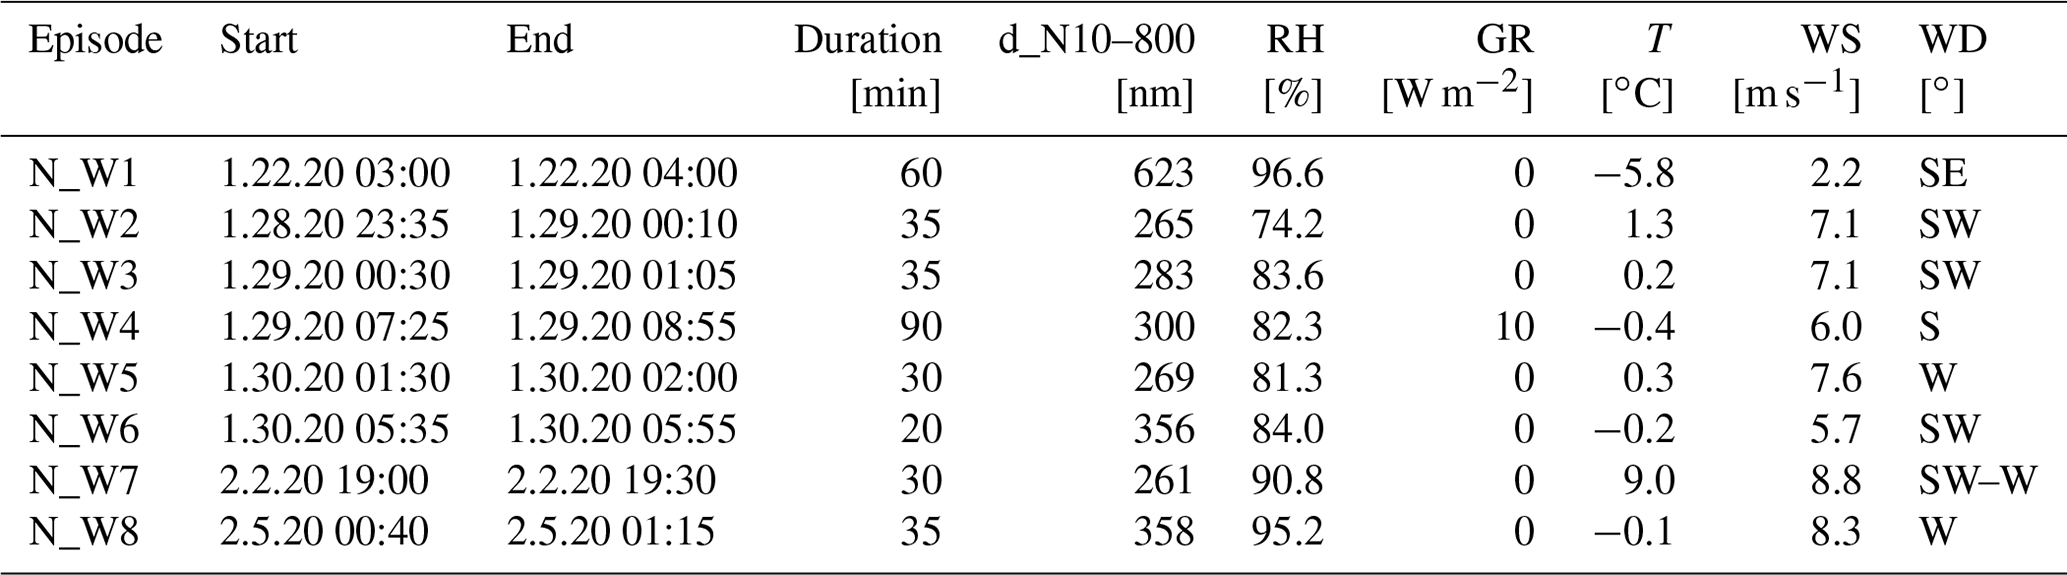
One high-particle-contribution episode occurred in summer, and eight short episodes occurred in winter (N_W1, factor 3 of 5 and N_W2–N_W8, factor 1 of 5; the durations ranged from 25 to 90 min, Table A3). No NR-PM1 data were available for effective density (ρeff) calculations during the summer period (3 July from 09:20 to 10:05). There was only one partial overlap of episodes N_W1 and W3. The densities (ρeff) calculated using Eq. (1) ranged from 1.40 and 1.85 g cm−3 and material densities (ρm) based on Eq. (2) ranged from 1.30 to 1.55 g cm−3. The densities for episodes of high particle number and mass concentrations were similar in range as well as the mass median mobility diameters in the range of 261–623 and 290–604 nm, respectively. During N_W1, accumulation-mode particles dominated (F3, mode diameter of main mode ∼ 334 nm, Fig. A12, local origin, Fig. A13) with an effective density of 1.85 g cm−3 (Table 5). A density of 2.0 g cm−3 relates to aged biomass-burning particles (Moffet et al., 2008). The remaining episodes (N_W2–N_W8) were linked mainly to particles of the Aitken mode (F1, mode diameter ∼ 32 nm, Fig. A12, rather regional origin, Fig. A13) with effective densities ranging from 1.40 to 1.60 g cm−3 (Table 5). Rissler et al. (2014) observed the dominance of particles with effective density ∼ 1.4 g cm−3 at a rural background site (Vavihill, Sweden) during the winter months, and Qiao et al. (2018) reported a decrease in particle effective densities ranging from 1.43 to 1.55 g cm−3 at rural sites (Changping, China) with increasing particle sizes. The dynamic shape factor was almost constant (1.00–1.05) and shape of the particle spherical, except the episode N_W1 (1.15) with particles of nearly spherical shape and/or as compact agglomerates.
Table 5Particle effective densities (g cm−3) and shape factors calculated during episodes of high particle contributions to N10–800 using MPSS data.
This study is the first of its kind in the Czech Republic to evaluate NR-PM1 based on its chemically speciated mass size distribution, density, shape, and origin at a rural background site. Seasonal effects and air mass variability on aerosol particles, in particular episodes of high mass and number concentrations, were investigated using highly time-resolved measurements conducted at the NationalAtmospheric Observatory Košetice (NAOK) during intensive campaigns in summer 2019 and winter 2020.
The average NR-PM1+eBC concentrations were 8.58 ± 3.70 µg m−3 in summer and 10.08 ± 8.04 µg m−3 in winter, with organics dominating during both seasons, followed by SO in summer and NO in winter. The accumulation mode dominated the average mass size distributions in both seasons, with the larger particles of all species in winter as a result of aerosol ageing. Therefore, larger particles in accumulation mode are also often connected with long-range transport. Organics showed the smallest modal diameter from all NR-PM1 chemical species, which suggests its condensation on pre-existing particles.
The performed cluster analysis revealed rare occurrences of summer continental air masses from the SE (7 %) associated with the highest concentrations of PM1, eBC, and all NR-PM1 species. Meanwhile, predominant slow winter continental air masses from the SW (44 %) were associated with inversion conditions over central Europe associated with the highest concentrations of PM1, eBC, and all NR-PM1 species.
Analysis of the diurnal trend of average ρm showed a diurnal trend for winter that was opposite to the diurnal trend of organics, reflecting the change in aerosol composition toward local chemical formation of NO during the night and probably also the change in total aerosol organics' density during the day and night. The studied relationships between ρm (with different input of Org density), ρeff, and mass fractions of the main NR-PM1 species suggest that the application of the density usually used in urban environments for organics (1.2 g cm−3) is inappropriate for rural aerosol particles due to the ageing of organic aerosols and should be probably used with a higher value around 1.3–1.4 g cm−3.
Considering the seasonal differences in the χ of the episodes with high mass concentrations, the χ was almost constant in summer, indicating almost spherical mainly organic particles, compared to winter, indicating almost spherical shape and/or compact agglomerates with a slight statistically significant decrease in χ with particle size. This could be caused by larger influence of irregular BC and/or EC core in winter, continuously coated by both organic and inorganic compounds making the larger particles more and more spherical. On the other hand, χ was almost constant in the episode of high number concentrations and the shape of the particles was spherical with no decreasing trend in χ with particle size.
By examining individual episodes of high mass and number concentrations, we show that the seasonal differences in the physicochemical properties of aerosol particles were caused by the diversity of sources and were related to the different air masses and meteorological conditions during summer and winter season. We also confirmed the relation between particle size and age reflected both in its oxidation state and shape factor. The results of these specific properties (density, shape, and oxidation state of particles) have general validity and thus transcend the regional character of this study.
PMF (US EPA, version PMF 5.0) was applied to the seasonal 5 min PNSDs in the range of 10 to 800 nm to estimate the number and profile of the PNSD factors and their contributions to the receptor. Application of PMF on PNSD is commonly adopted in source apportionment studies since by investigating particles in various size ranges, it is possible to more clearly identify and apportion contributions from those sources that contributed more to the particle number than to the particle mass (e.g. Beddows et al., 2015; Masiol et al., 2016; Sowlat et al., 2016; Leoni et al., 2018; Pokorná et al., 2020; Zíková et al., 2020). Episodes in which the factor contributions to the total particle number concentrations were higher than 80 % were chosen for the subsequent particle density calculations.
The input data were prepared by merging three consecutive bins to reduce the noise in the raw data, decrease the number of variables, and reduce the number of zeroes in the raw data (Leoni et al., 2018). The uncertainties were calculated according to Vu et al. (2015). The total variables were calculated by summing all the bins (N10–800). PMF was conducted using different uncertainty input matrices and different C3 (Vu et al., 2015) to obtain the Qtrue closest to Qexpected; different modelling uncertainties and different numbers of factors were also applied. A C3 of 0.8 was chosen.
The PMF model was run several times until the most physically meaningful results (factor profiles, contributions to N10–800, and origin) and the best diagnostics were obtained. The four measurements (9.7, 11.5, 557.2, and 733.6 nm; midpoint of the merged three consecutive size bins) were set as weak along with the total variable (N10–800). The model was run with different factor numbers (3–8). The most stable solution was found when six factors in summer and five factors in winter were considered (Fig. A12). With all runs converged, the scaled residuals were normally distributed, and any unmapped factors were detected with bootstrap error estimations. No swaps were observed with the displacement error analysis, indicating that the solution was stable (Table A2). The non-normalized PNSD (N cm−3) was analysed using the model.
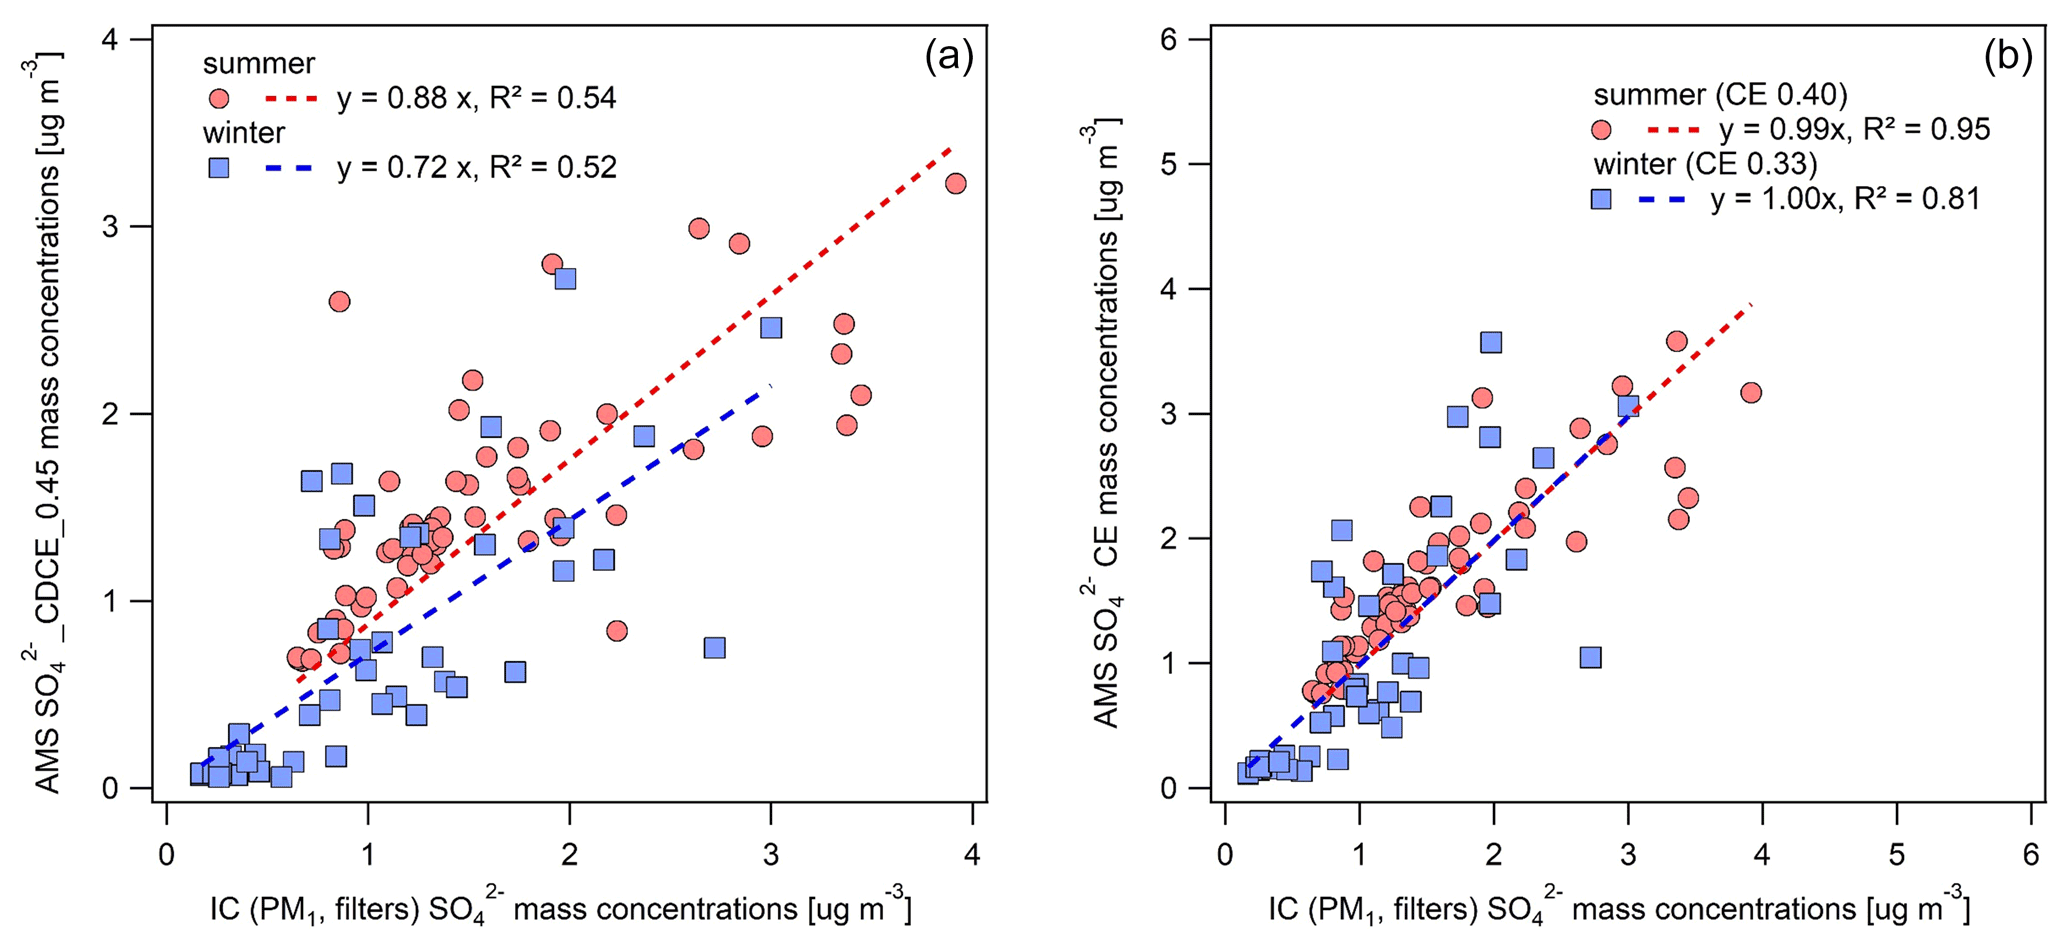
Figure A1Comparison of sulfate concentrations measured by AMS and retrieved from PM1 filter analysis by IC with applied CDCE correction (a) and constant CE correction (b) for both measurement seasons.

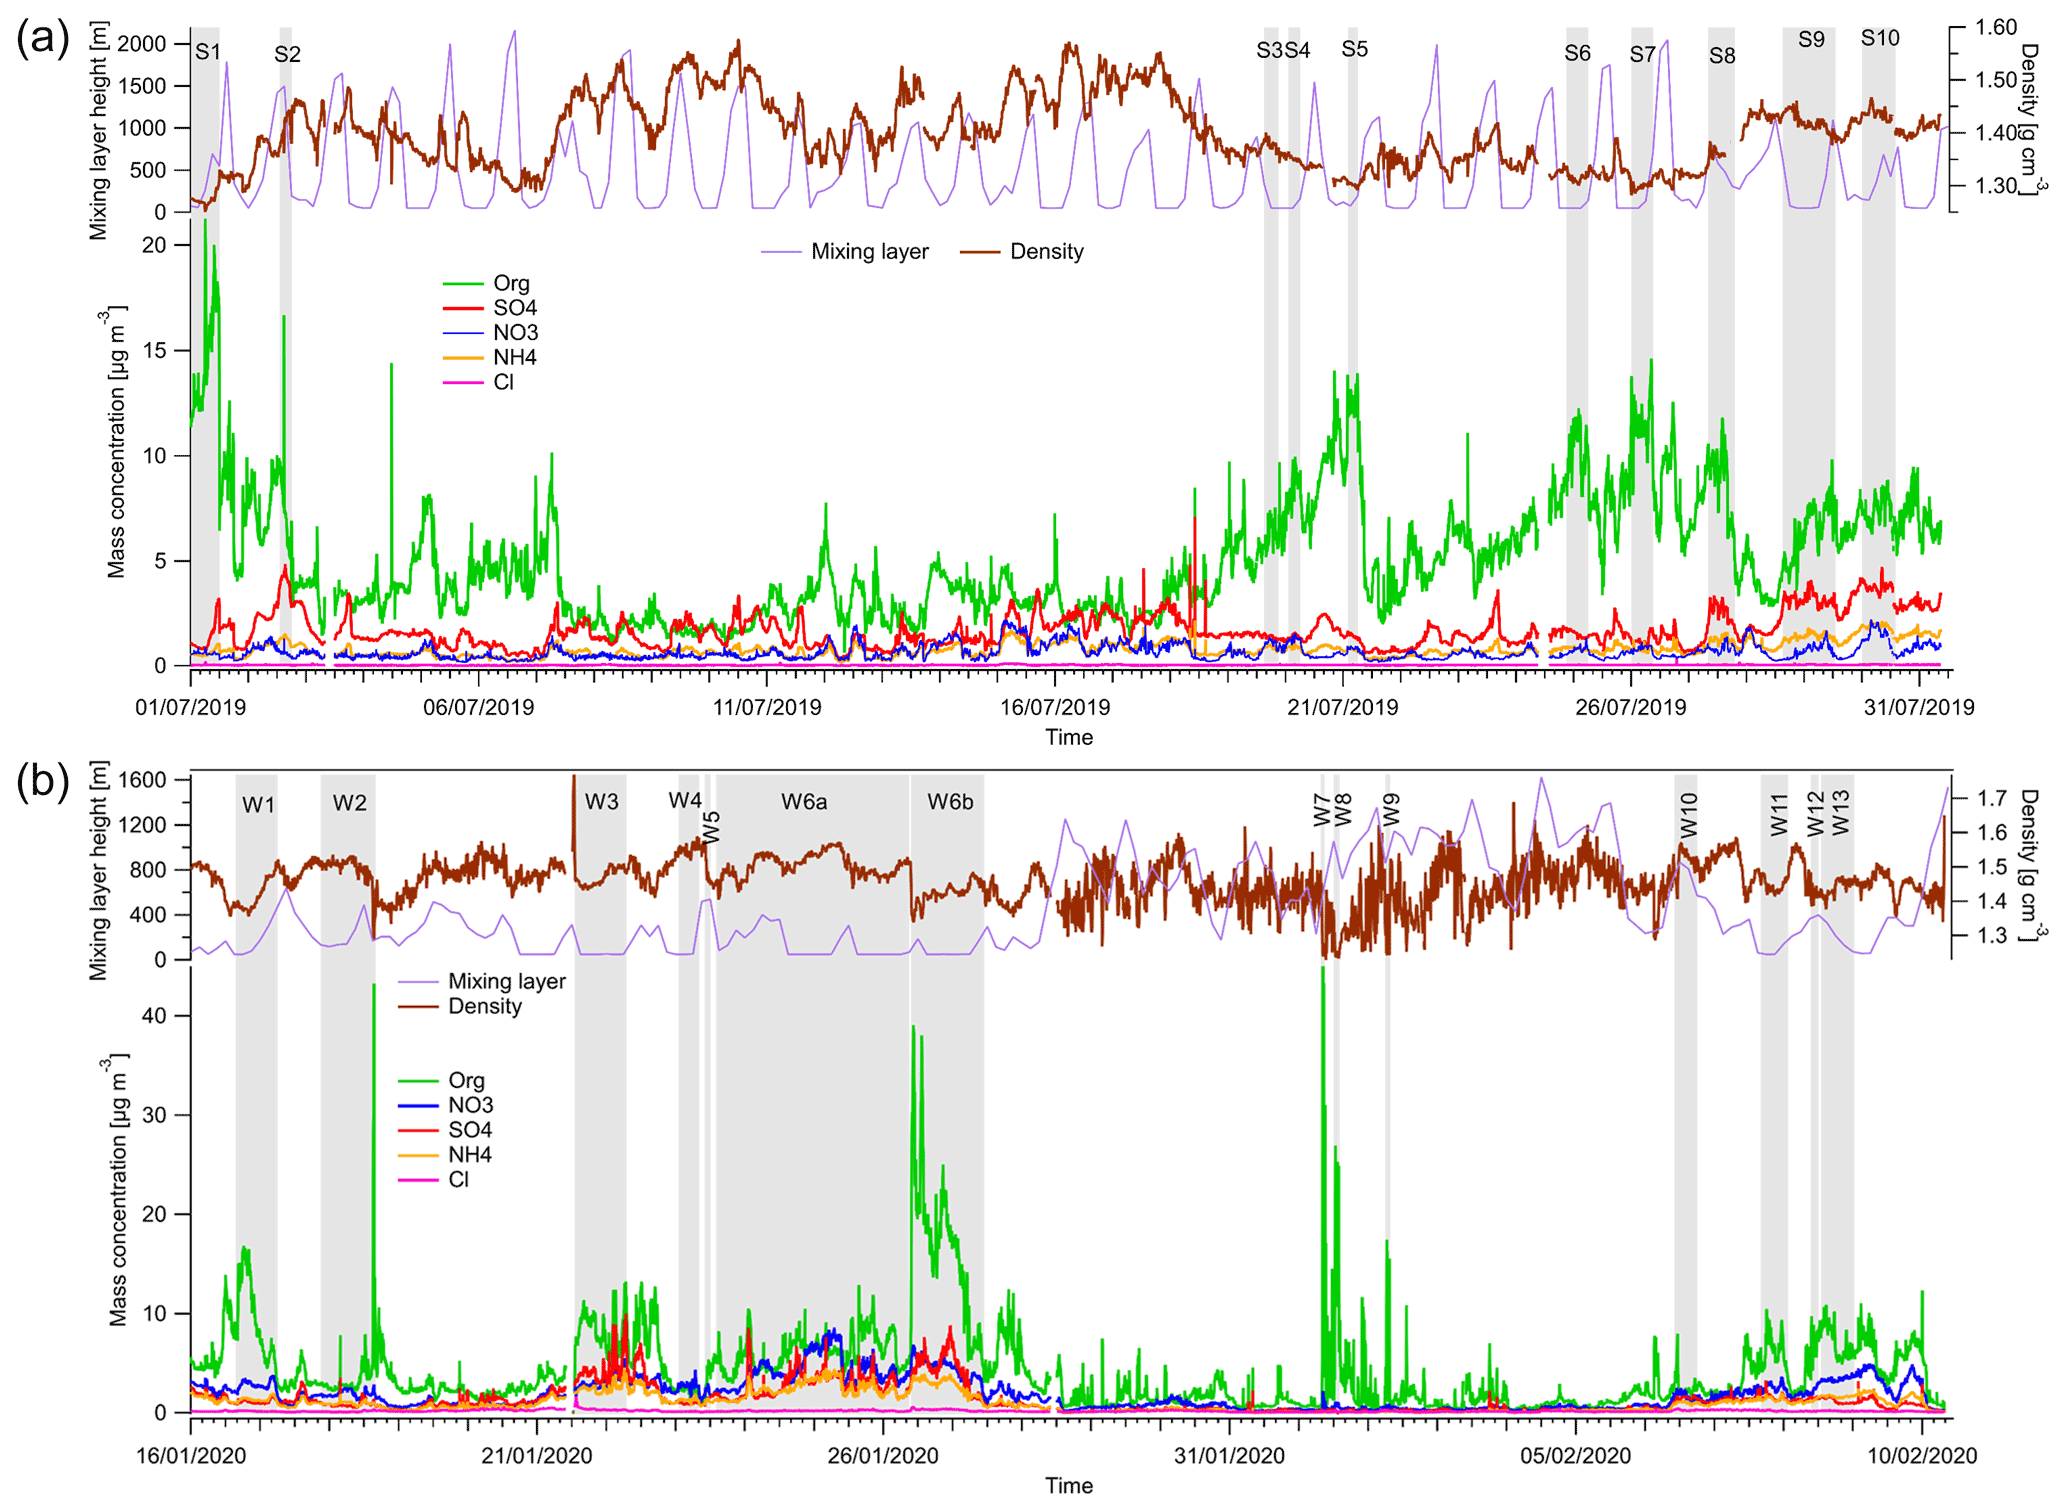
Figure A3Mass concentration of Org, NO, SO, and NH measured by AMS with applied constant CE correction for summer (a) and winter (b) campaigns with marked episodes of higher mass concentrations, mixing layer height, and particle effective density calculated using Eq. (2) in the main text from Salcedo et al. (2006).

Figure A4Comparison of organic mass concentration measured online by AMS (Org CE corrected) and by the OCEC analyser in summer and winter.
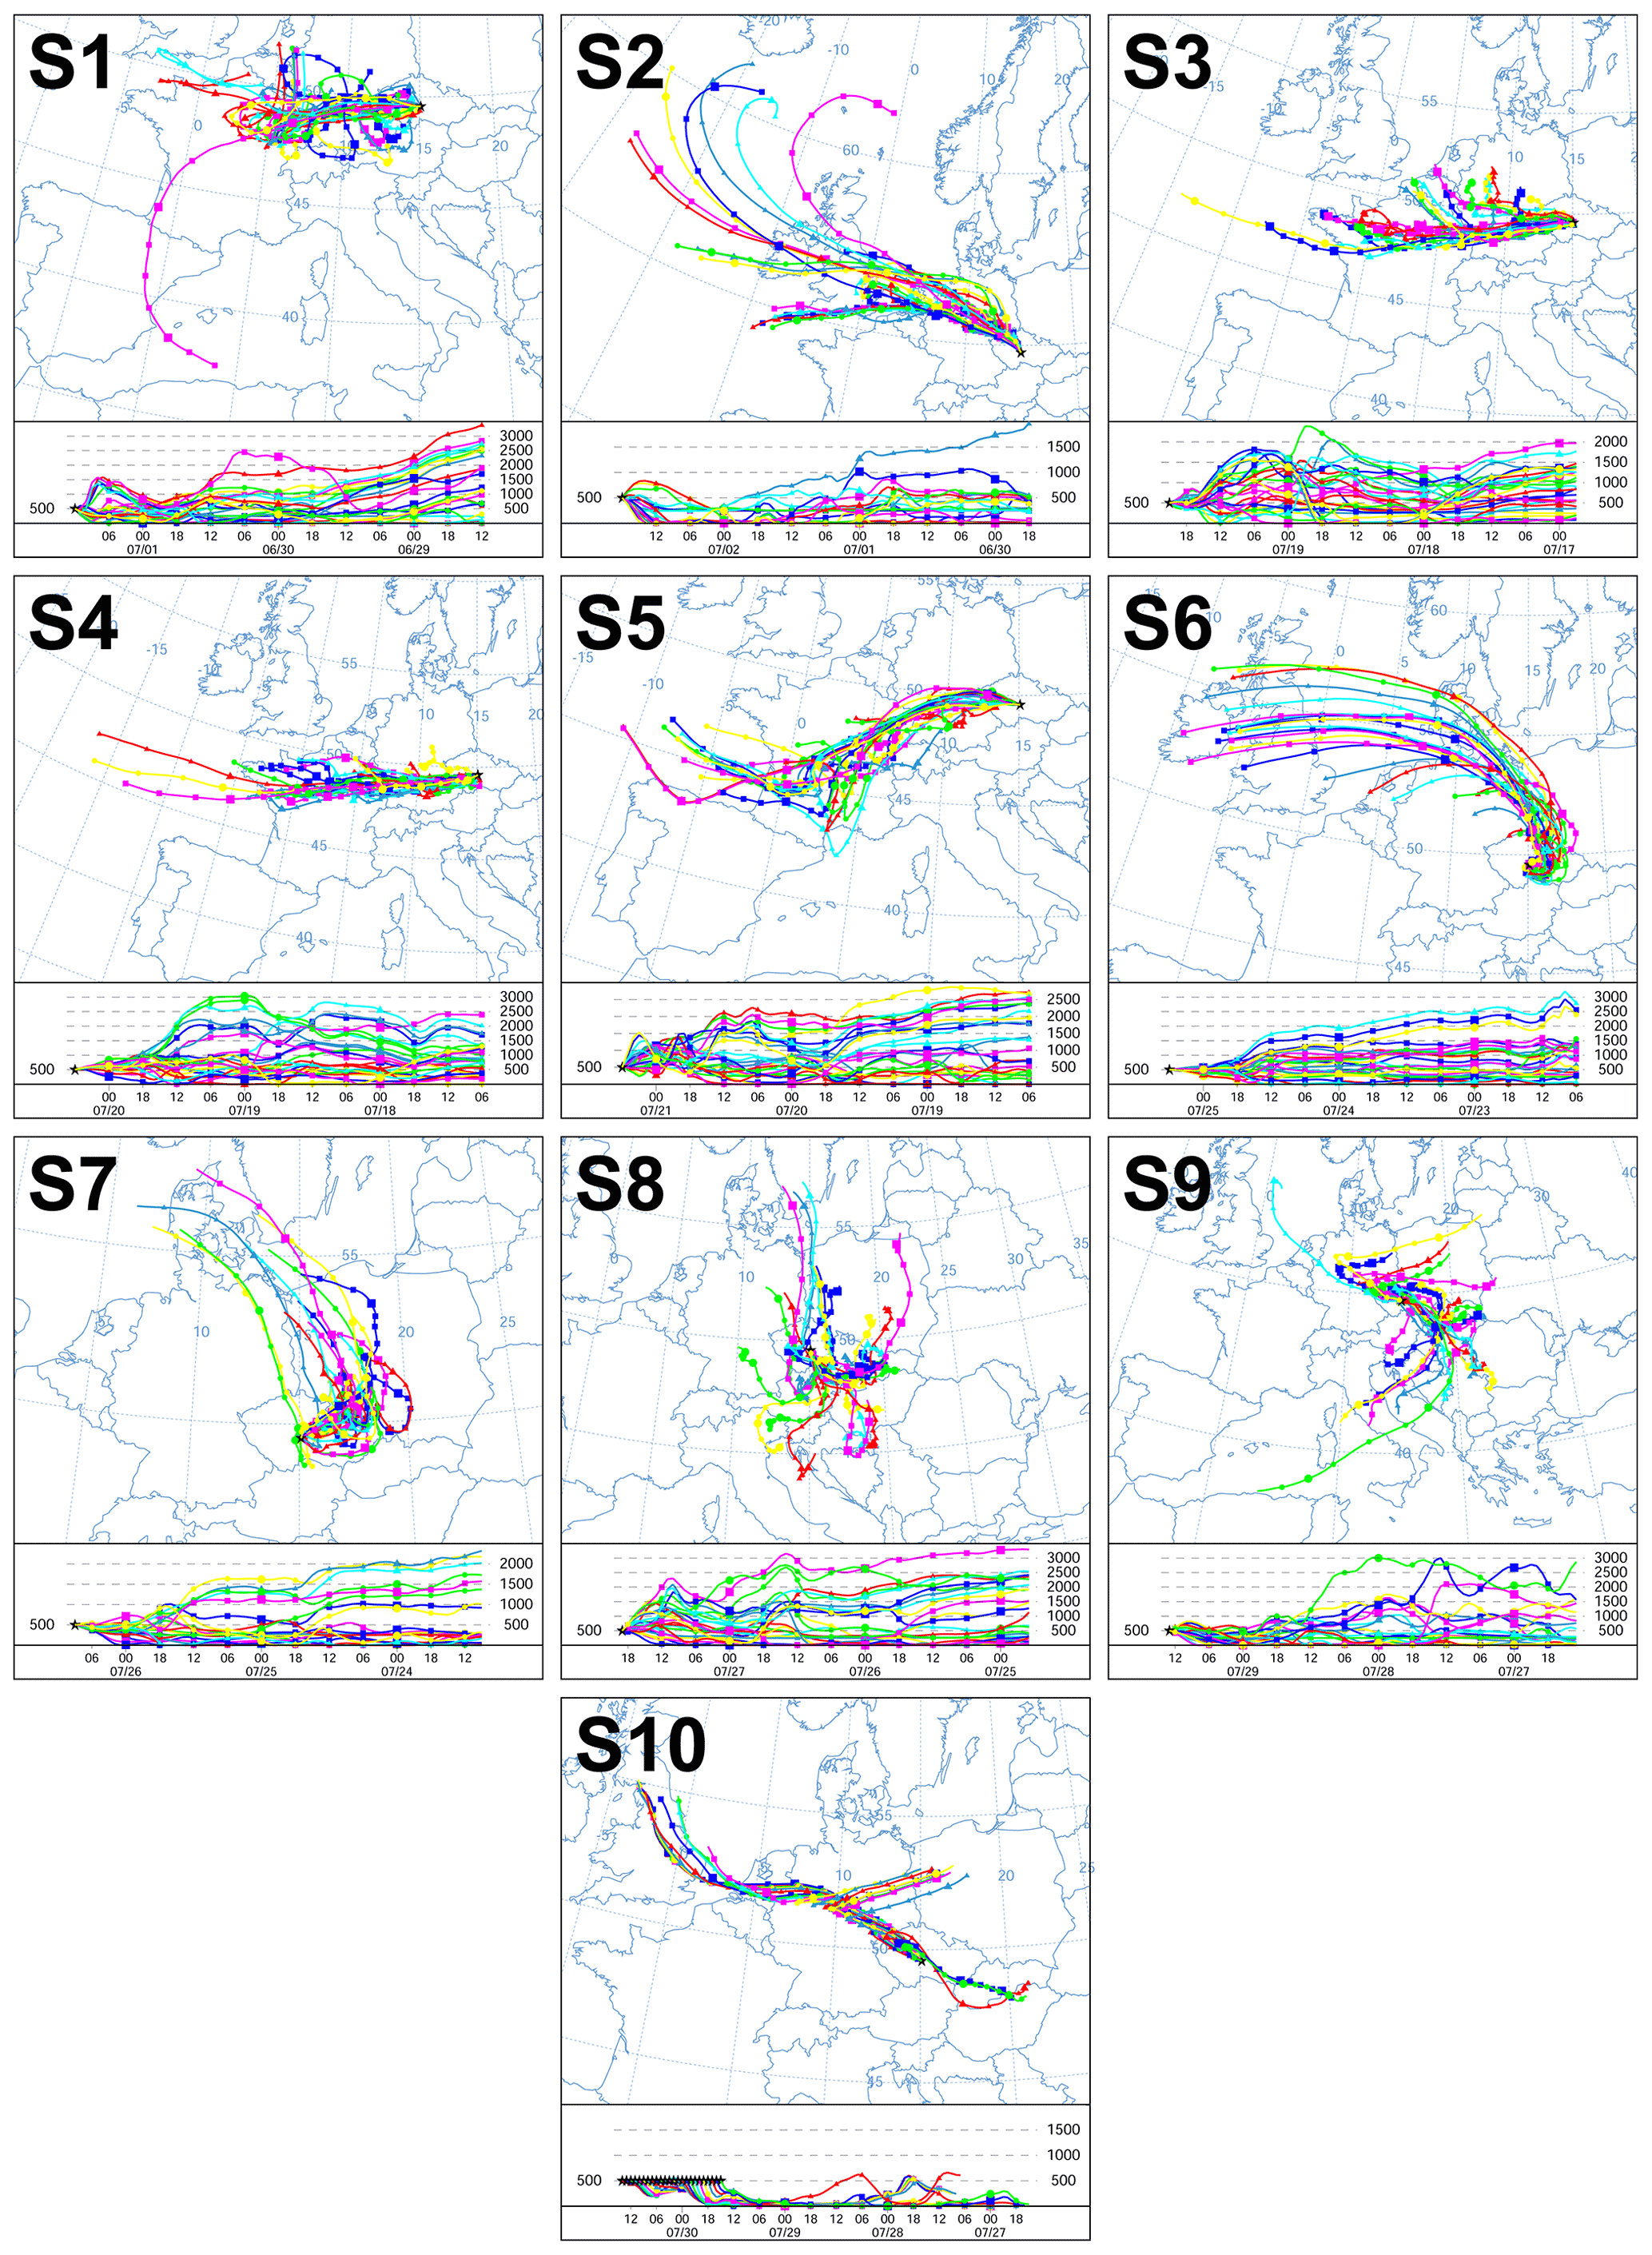
Figure A5Backward air mass trajectories calculated by HYSPLIT for corresponding summer episodes (S1–S10) of high concentration of species size distributions.
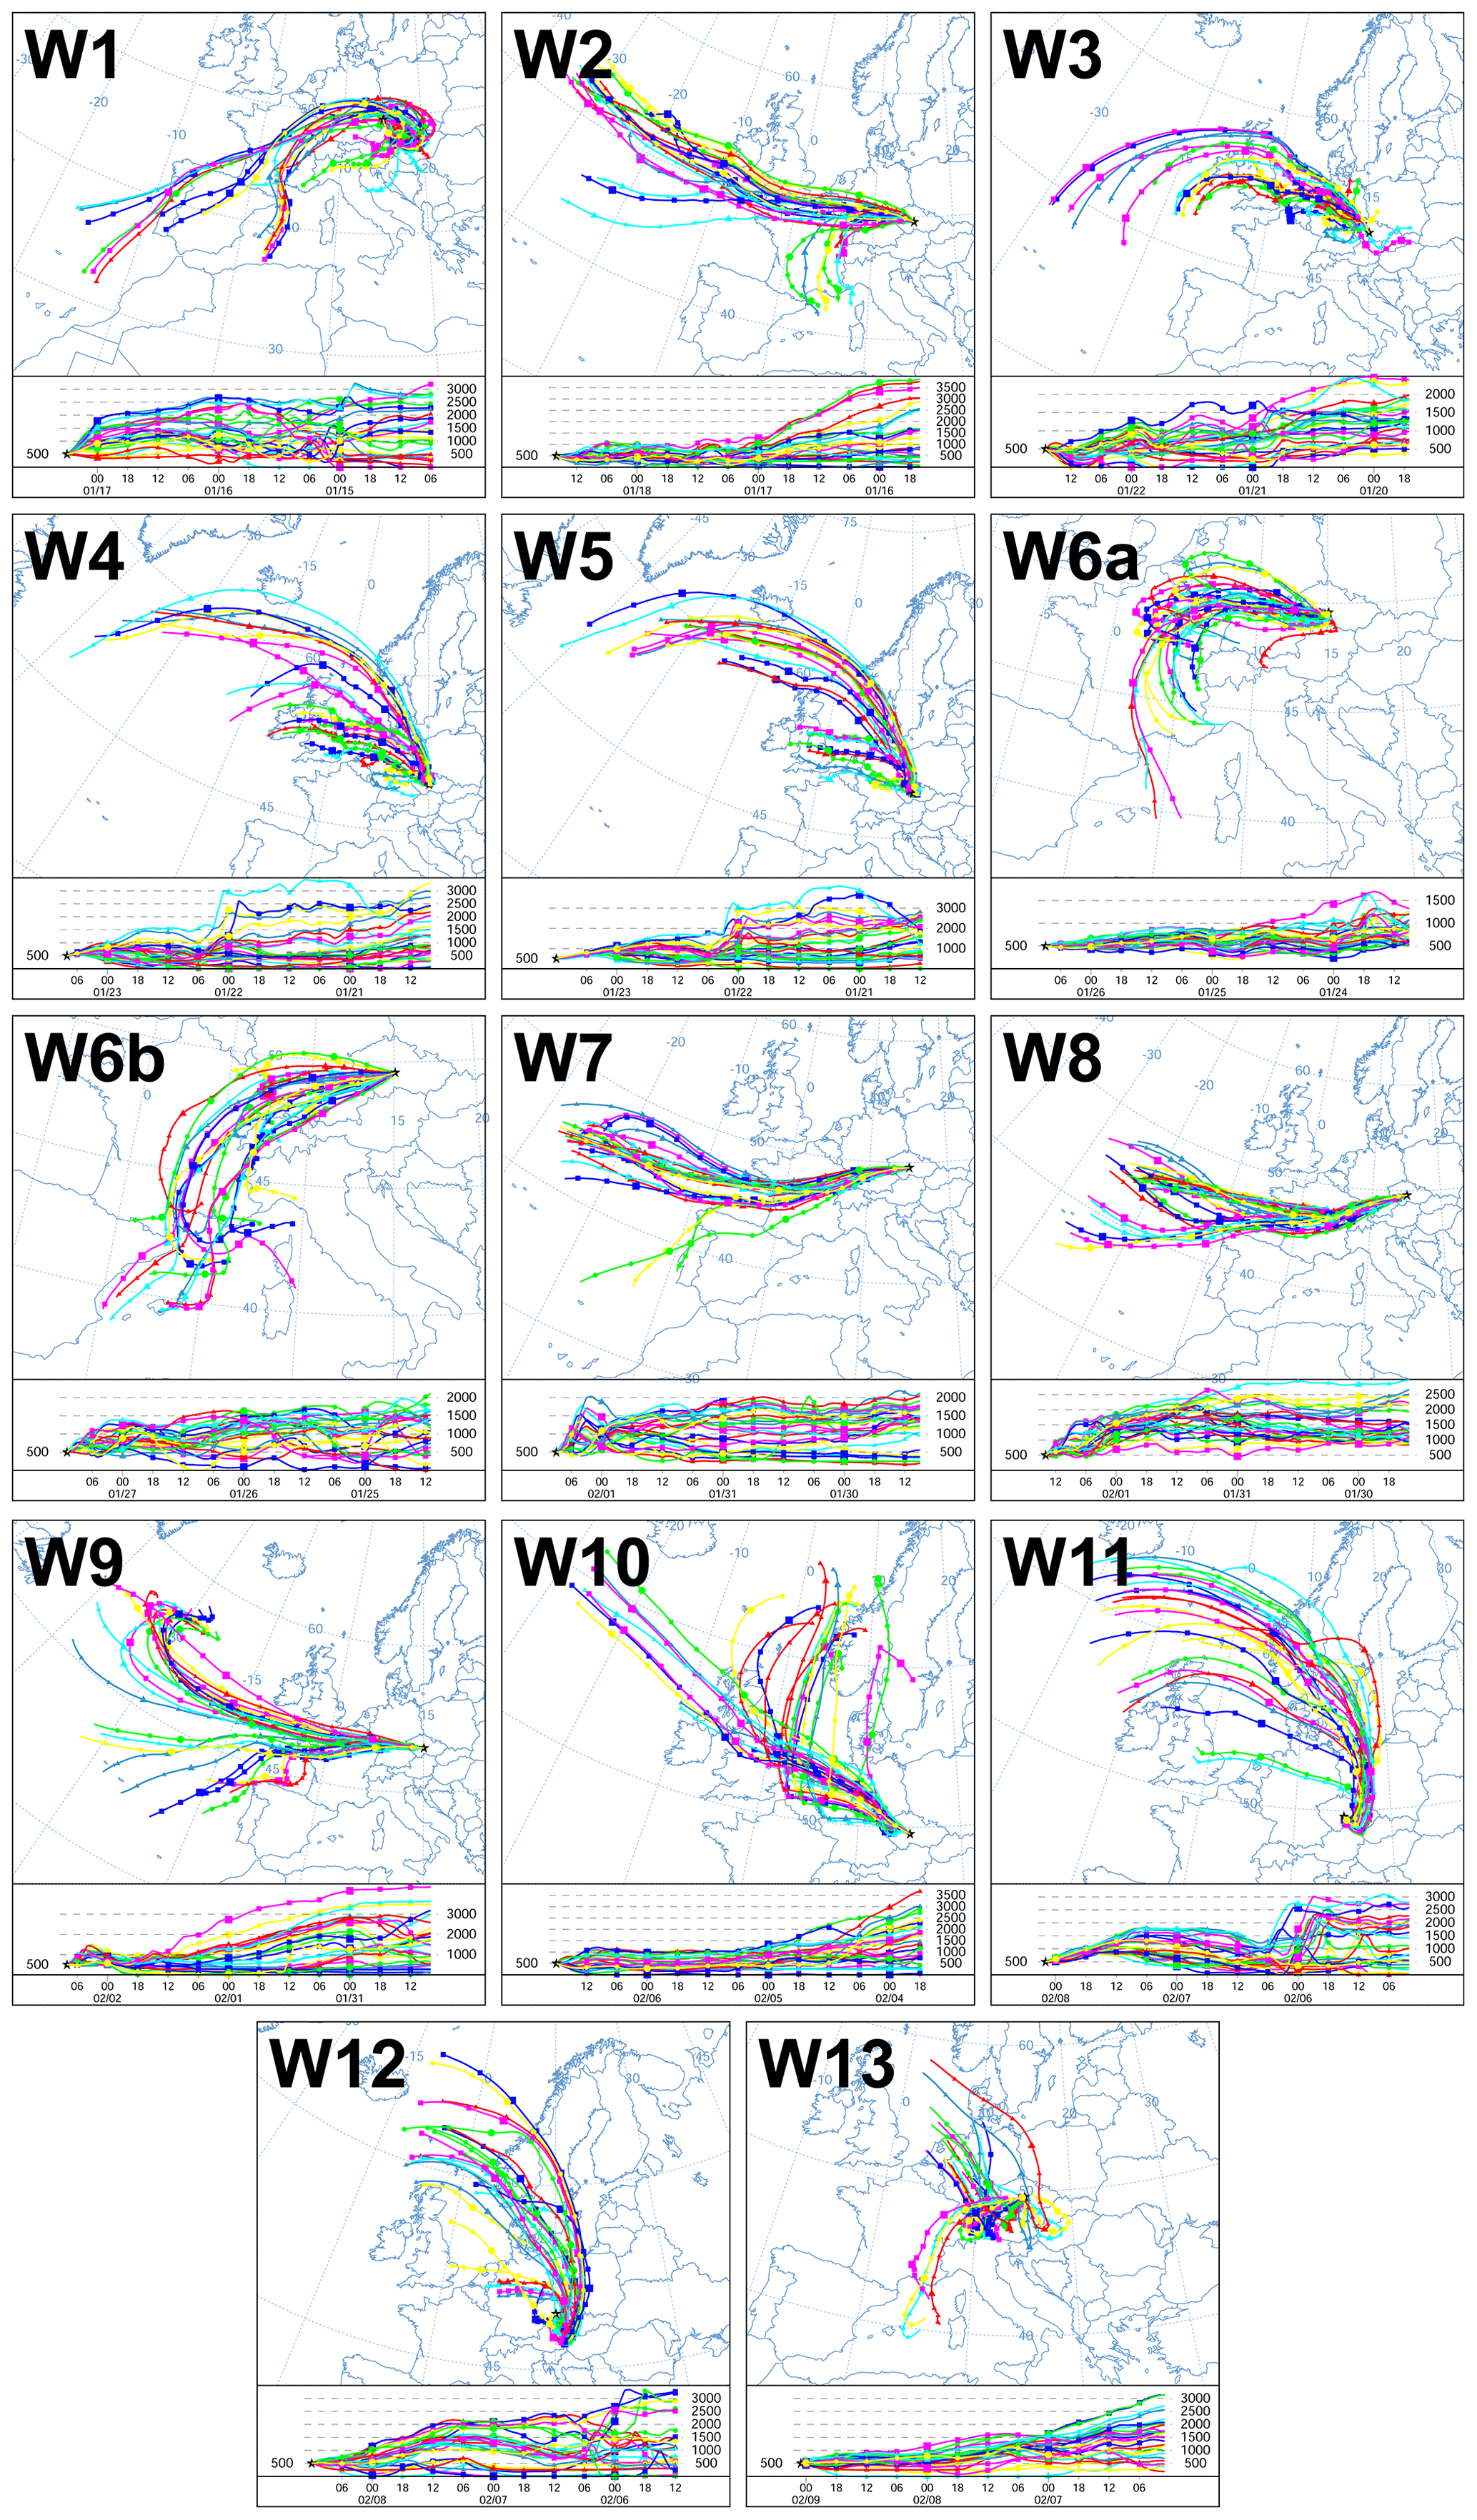
Figure A6Backward air mass trajectories calculated by HYSPLIT for corresponding winter episodes (W1–W13) of high concentration of species size distributions.

Figure A7Comparison of organic fragments f44 and f60 for the whole campaigns (full markers) and for the specific episodes (empty markers). Bars represent standard deviation and the triangular space area of biomass-burning (BB) influence, and the dashed line shows a limit for a negligible fresh BB influence (Cubison et al., 2011).
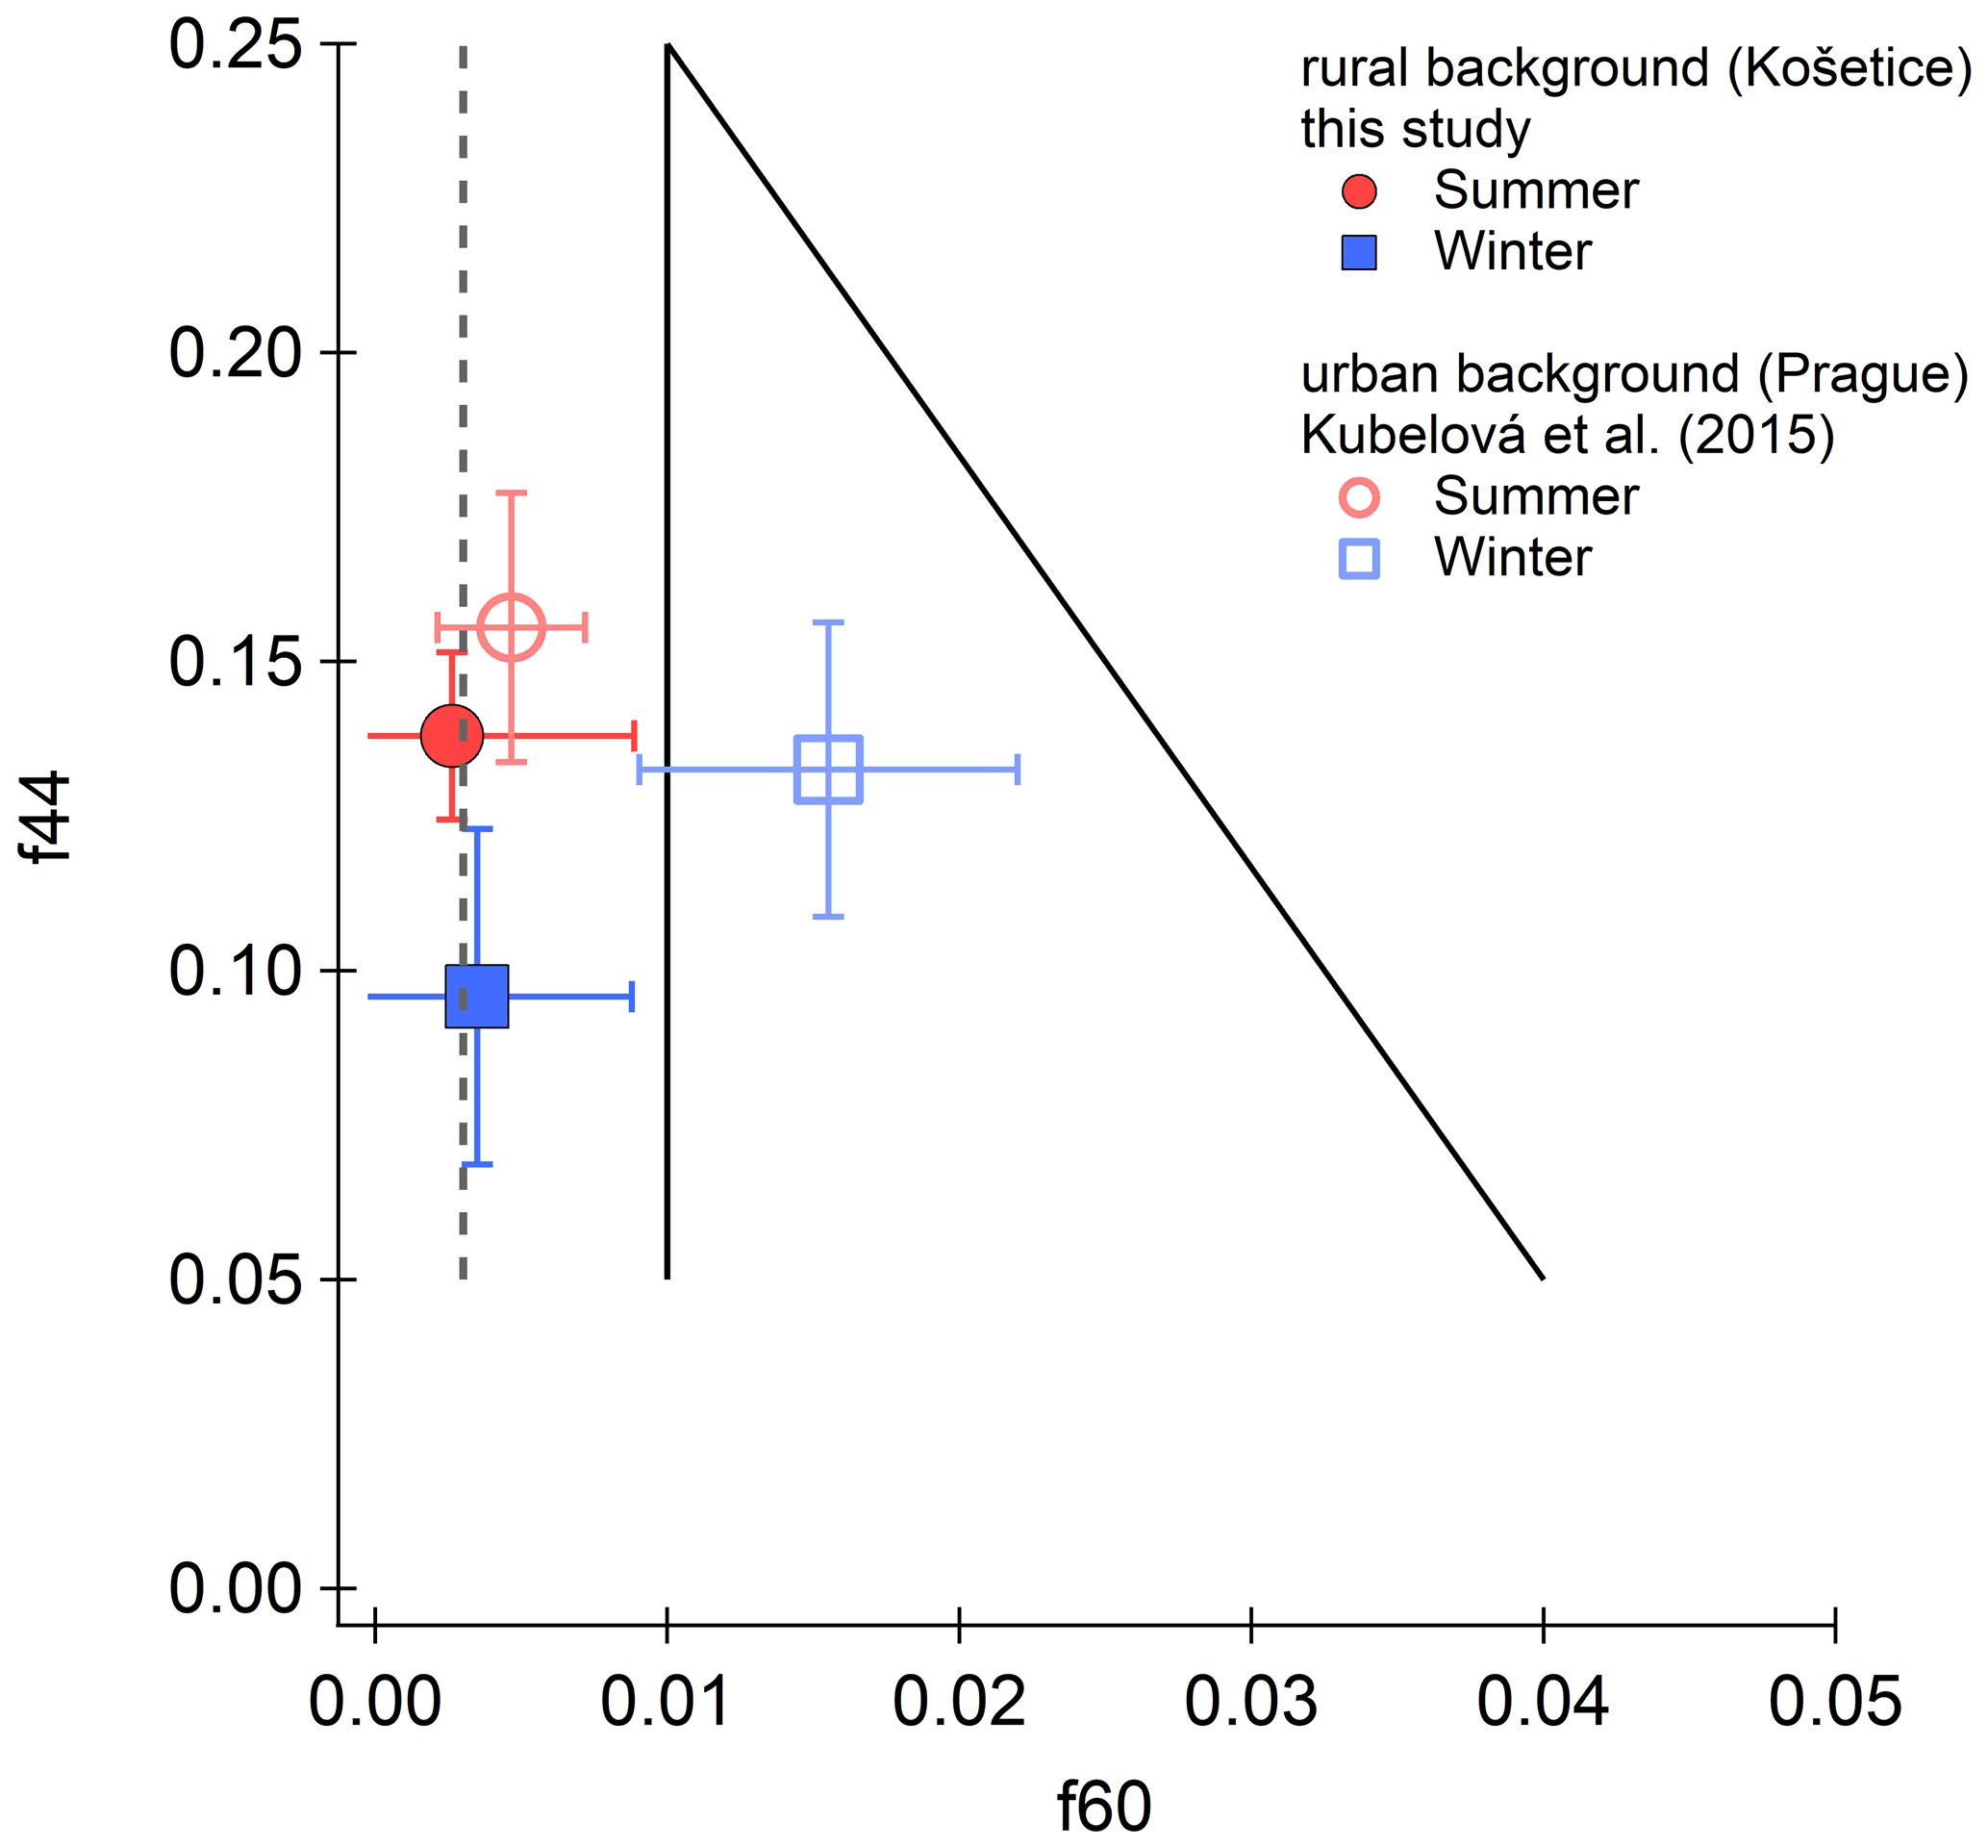
Figure A8Comparison of organic fragments f44 and f60 determined at a rural background site (NAOK) and urban background site (Prague, study by Kubelová et al., 2015) during summer and winter seasons.
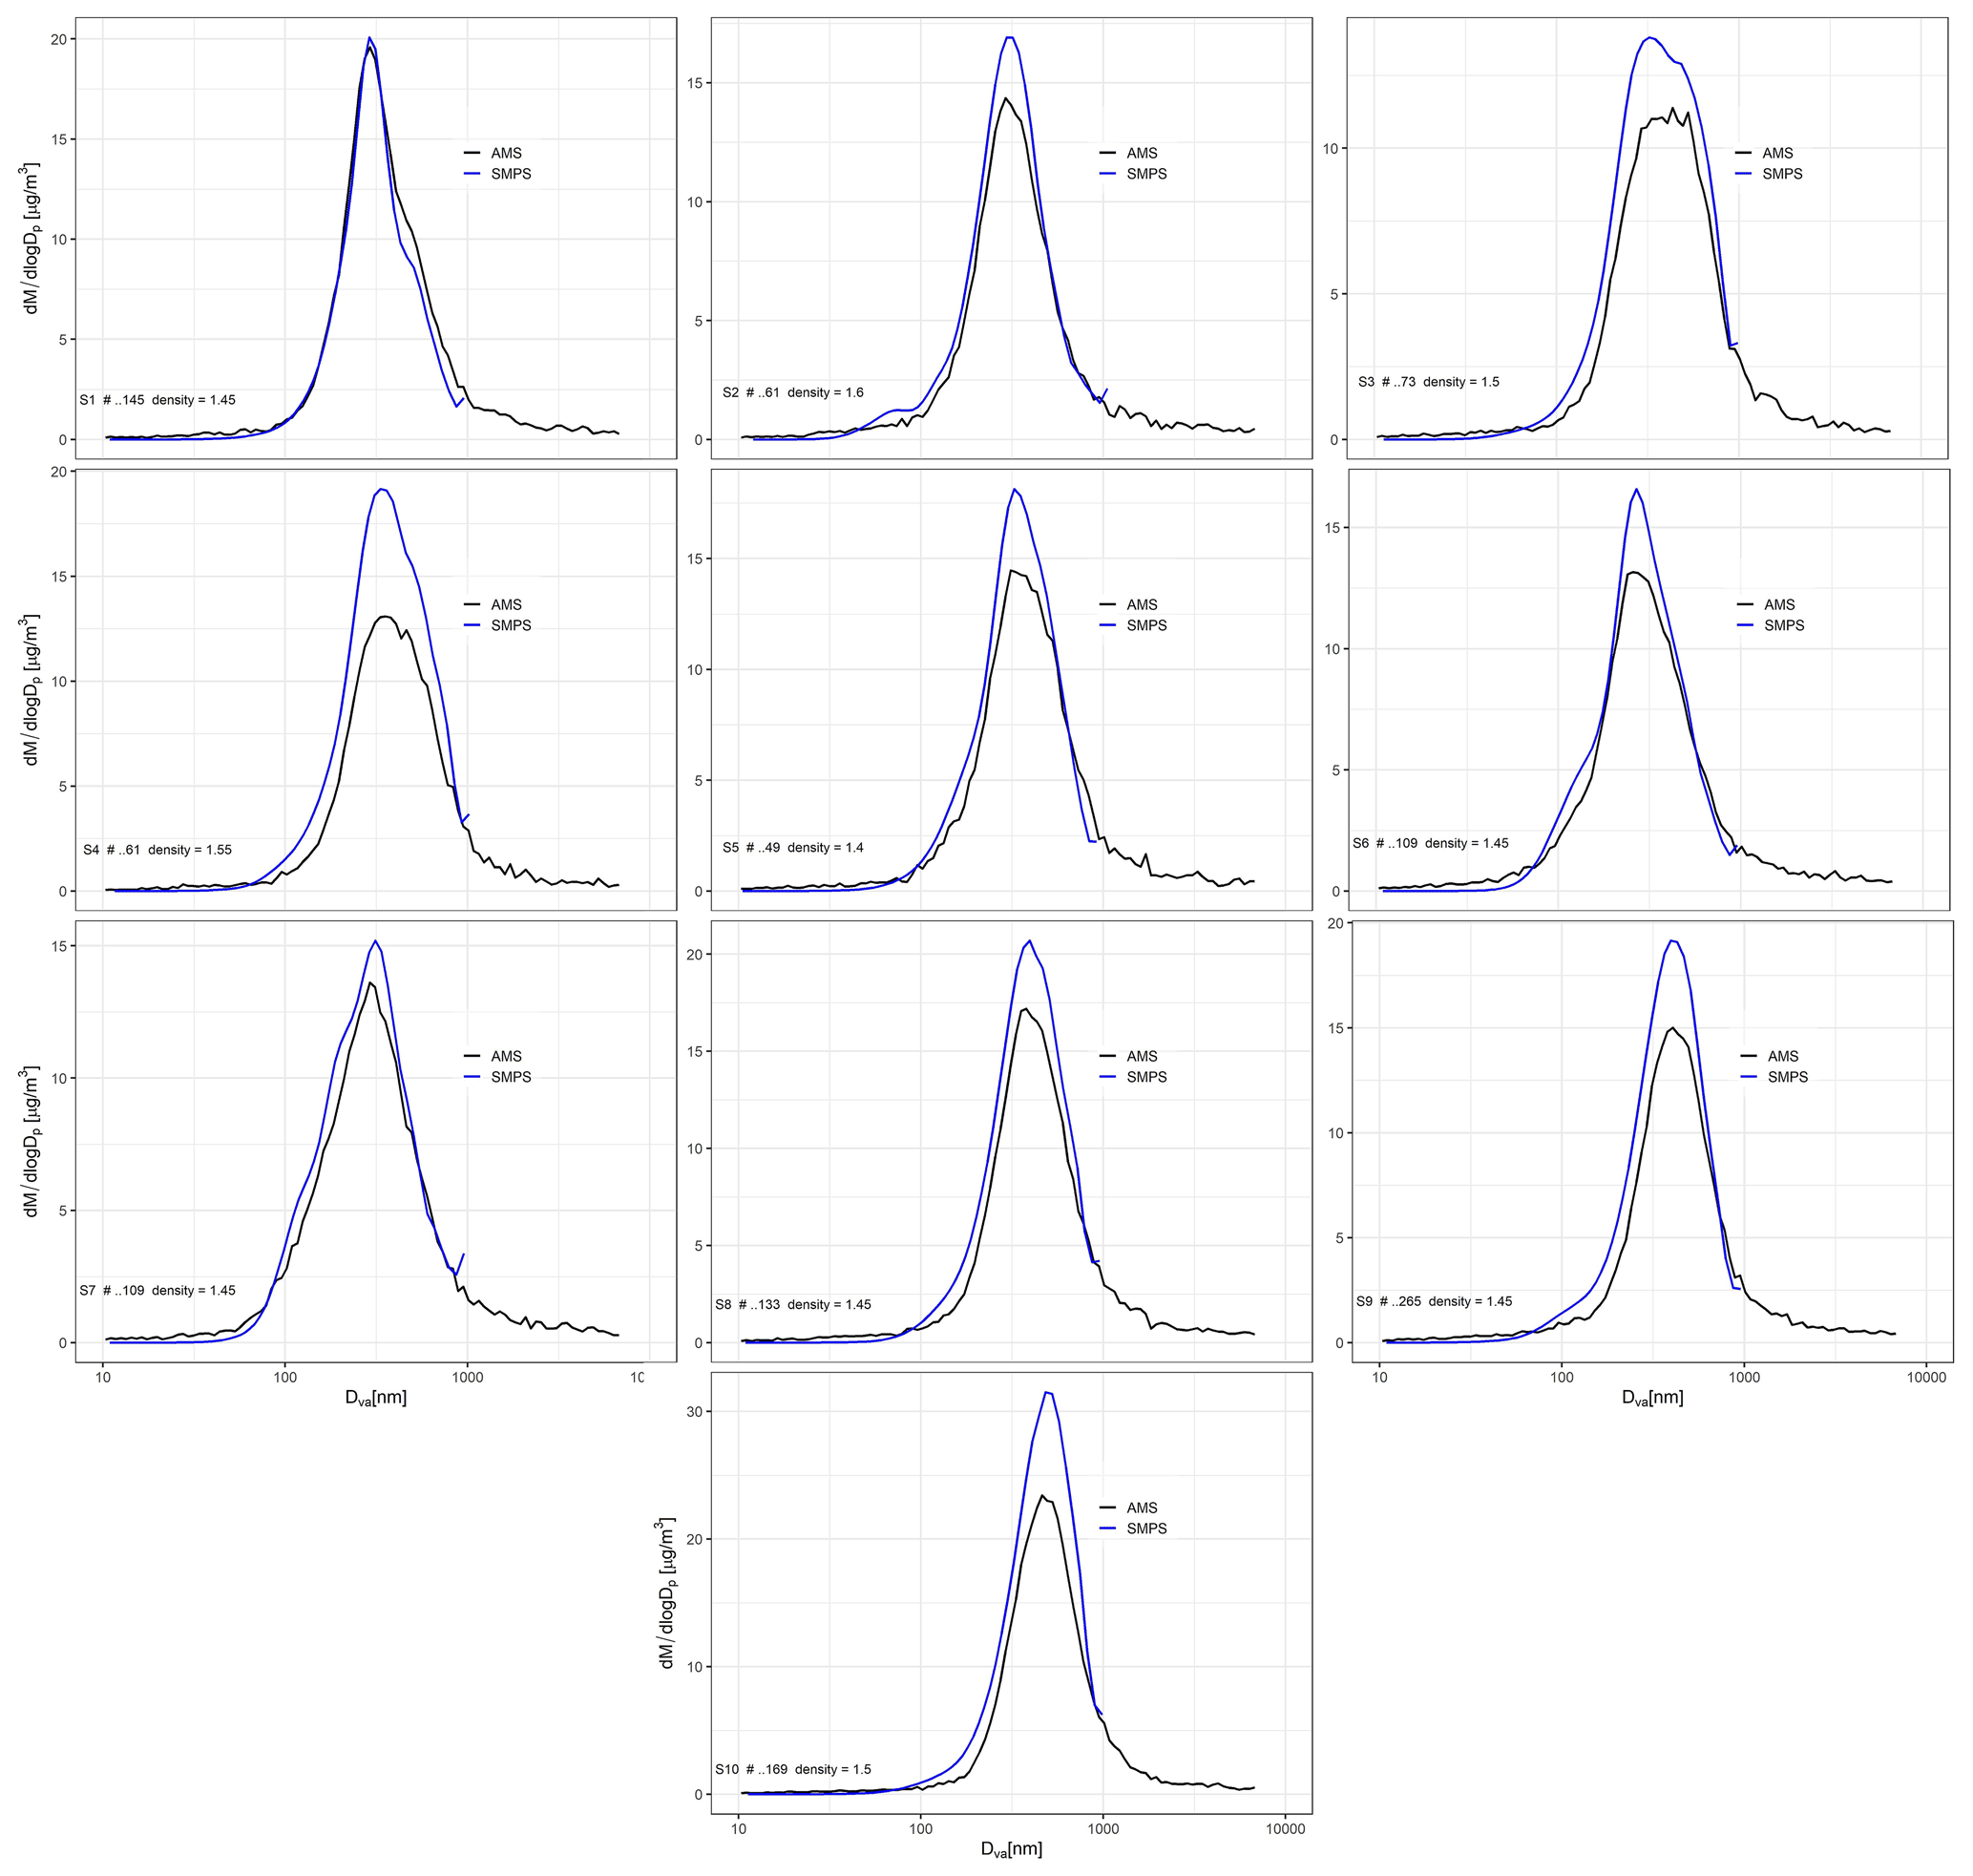
Figure A9Fit of AMS and MPSS mass size distribution spectra of summer episodes (S1–S10) for density calculation.
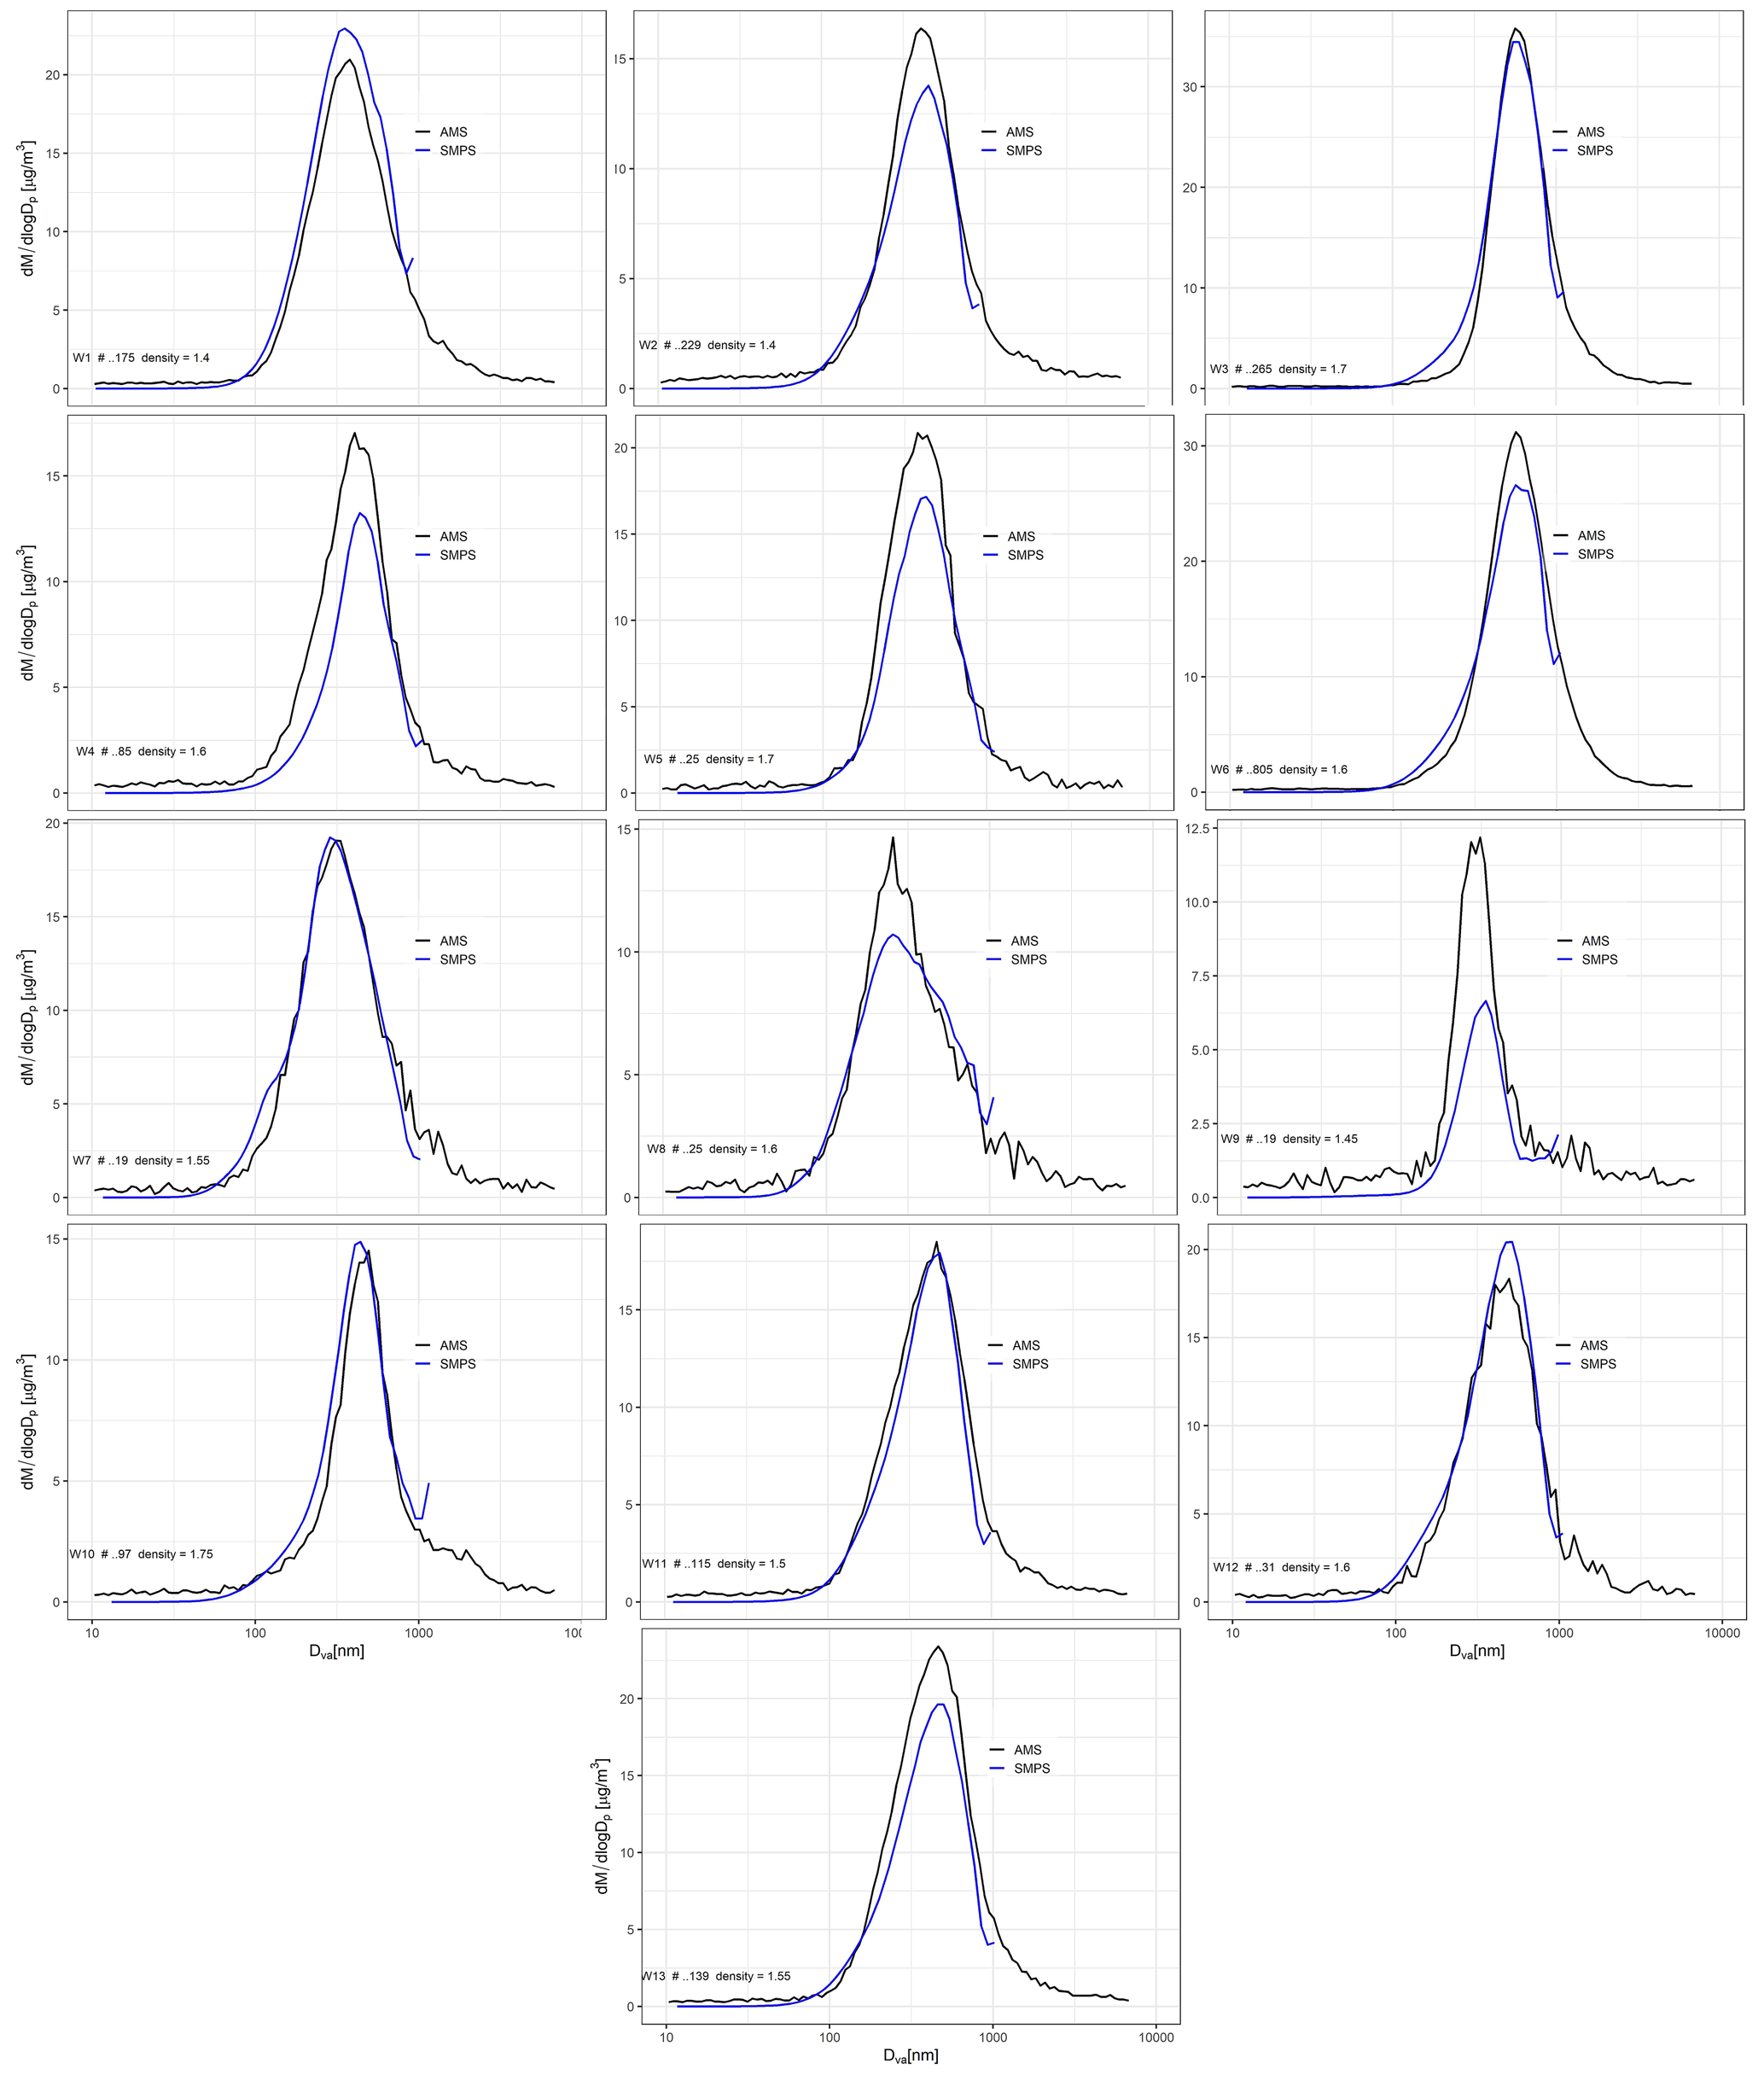
Figure A10Fit of AMS and MPSS mass size distribution spectra of winter episodes (W1–W13) for density calculation.
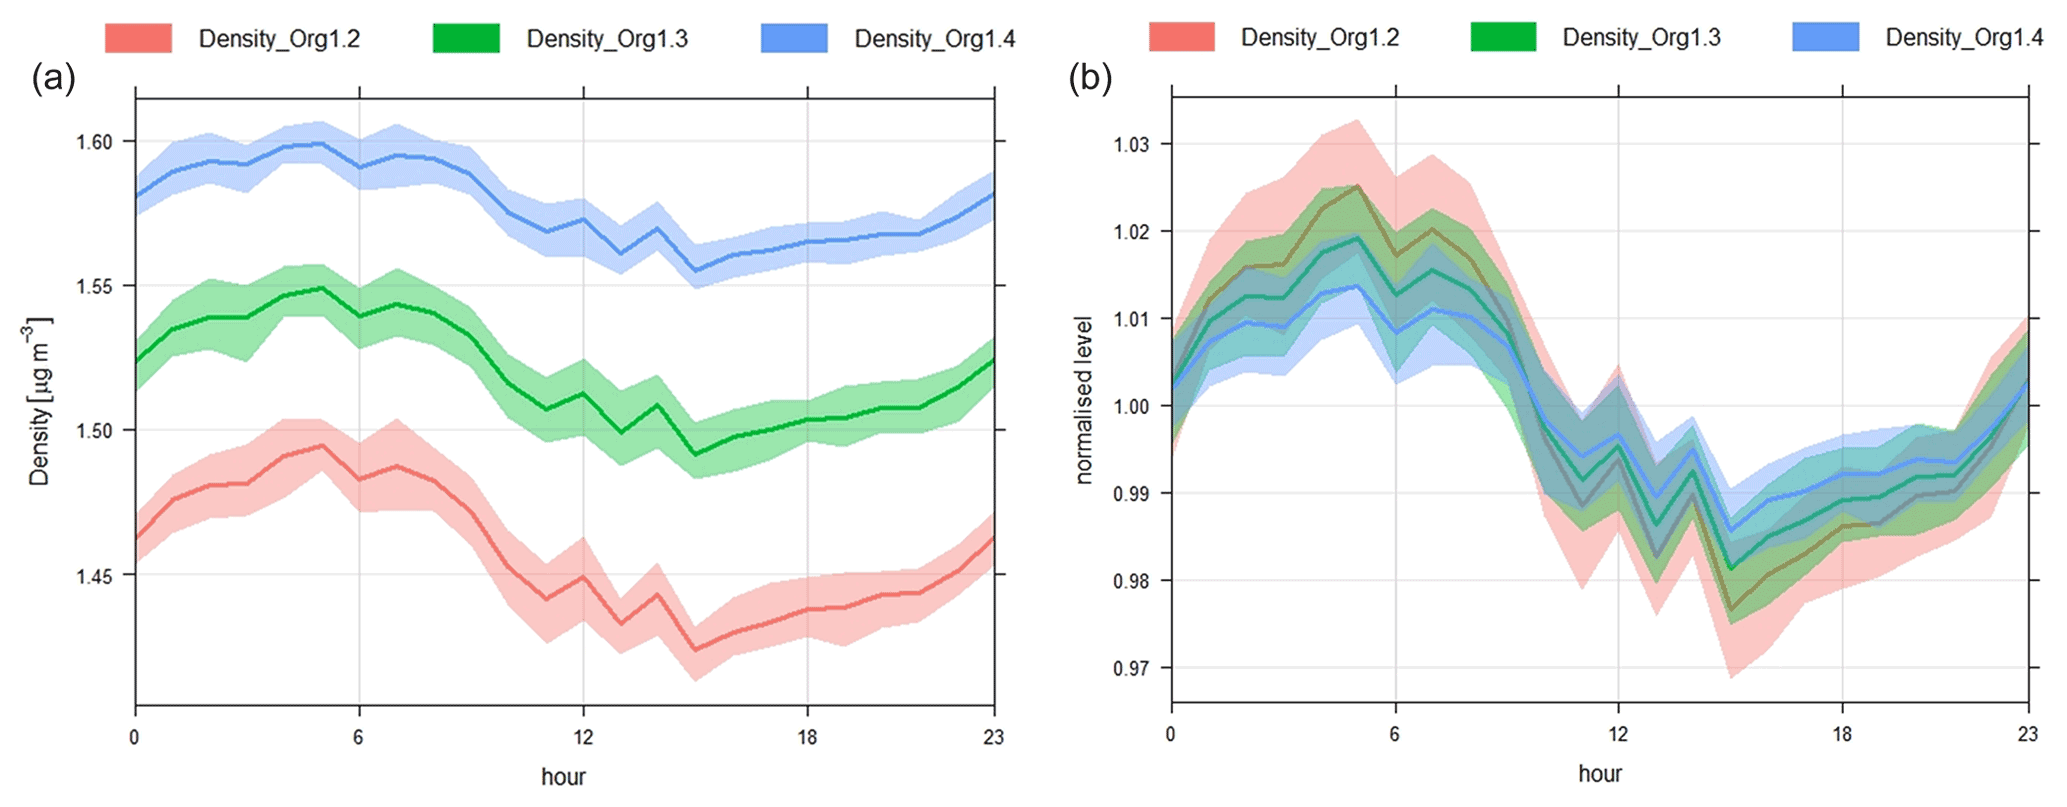
Figure A11Diurnal trends of average ρm calculated based on Eq. (2) in winter for different organic densities (1.2, 1.3, and 1.4 g cm−3) in absolute (left) and normalized (right) values.
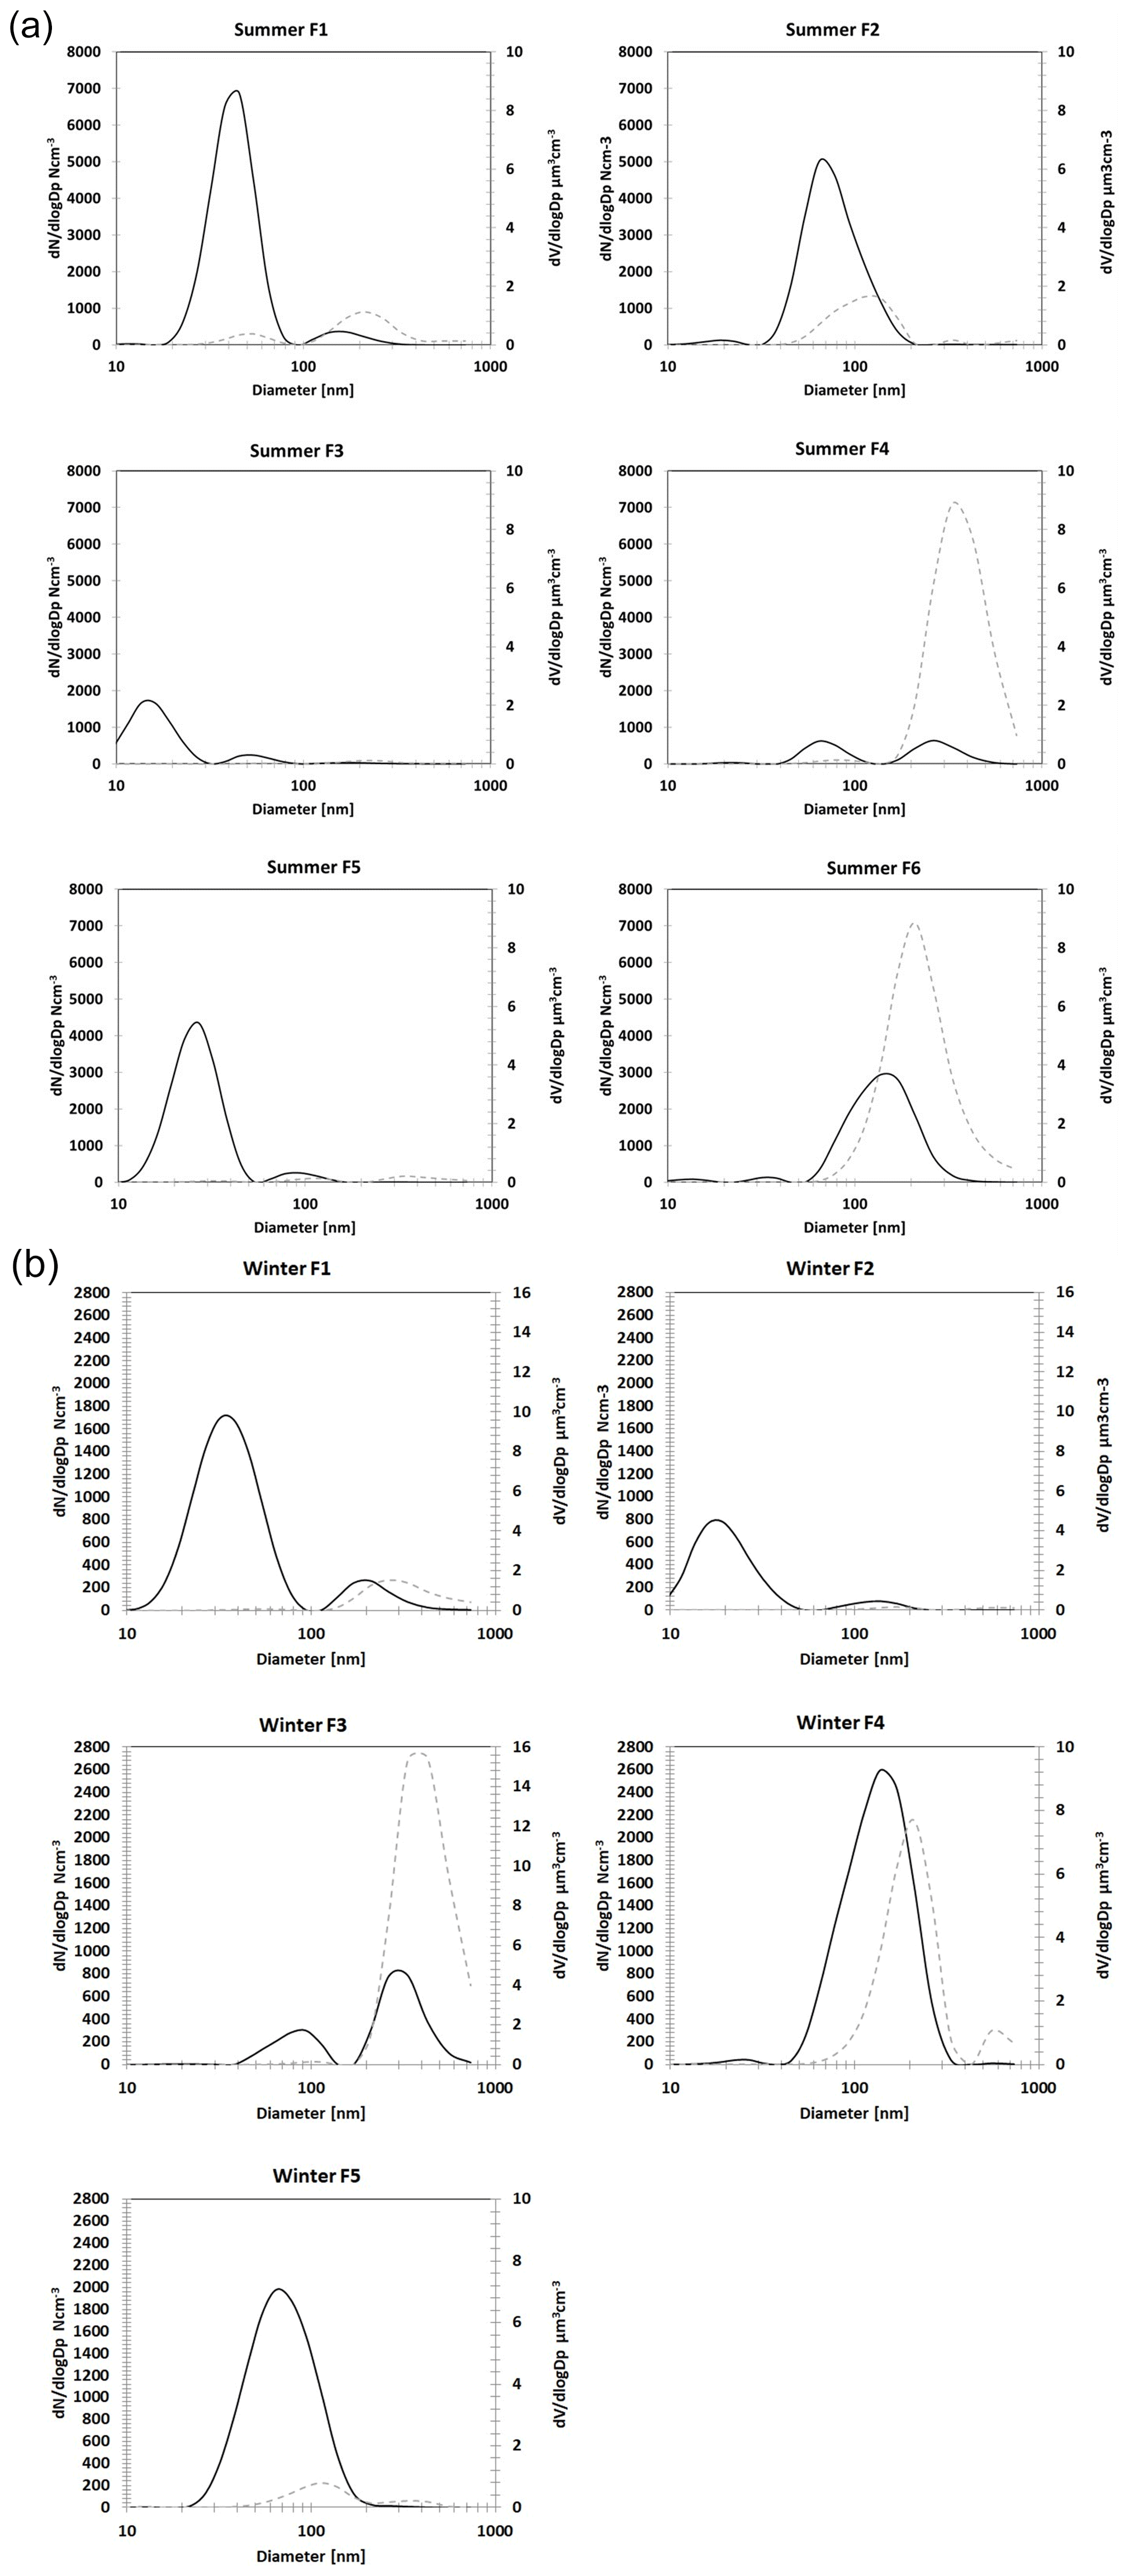
Figure A12PNSD factor profiles for summer (a) and winter (b) campaign. NSD (black line, y axis on the left), volume size distribution (dashed grey line, y axis on the right). The volume size distribution was recalculated from the NSD assuming spherical particles.
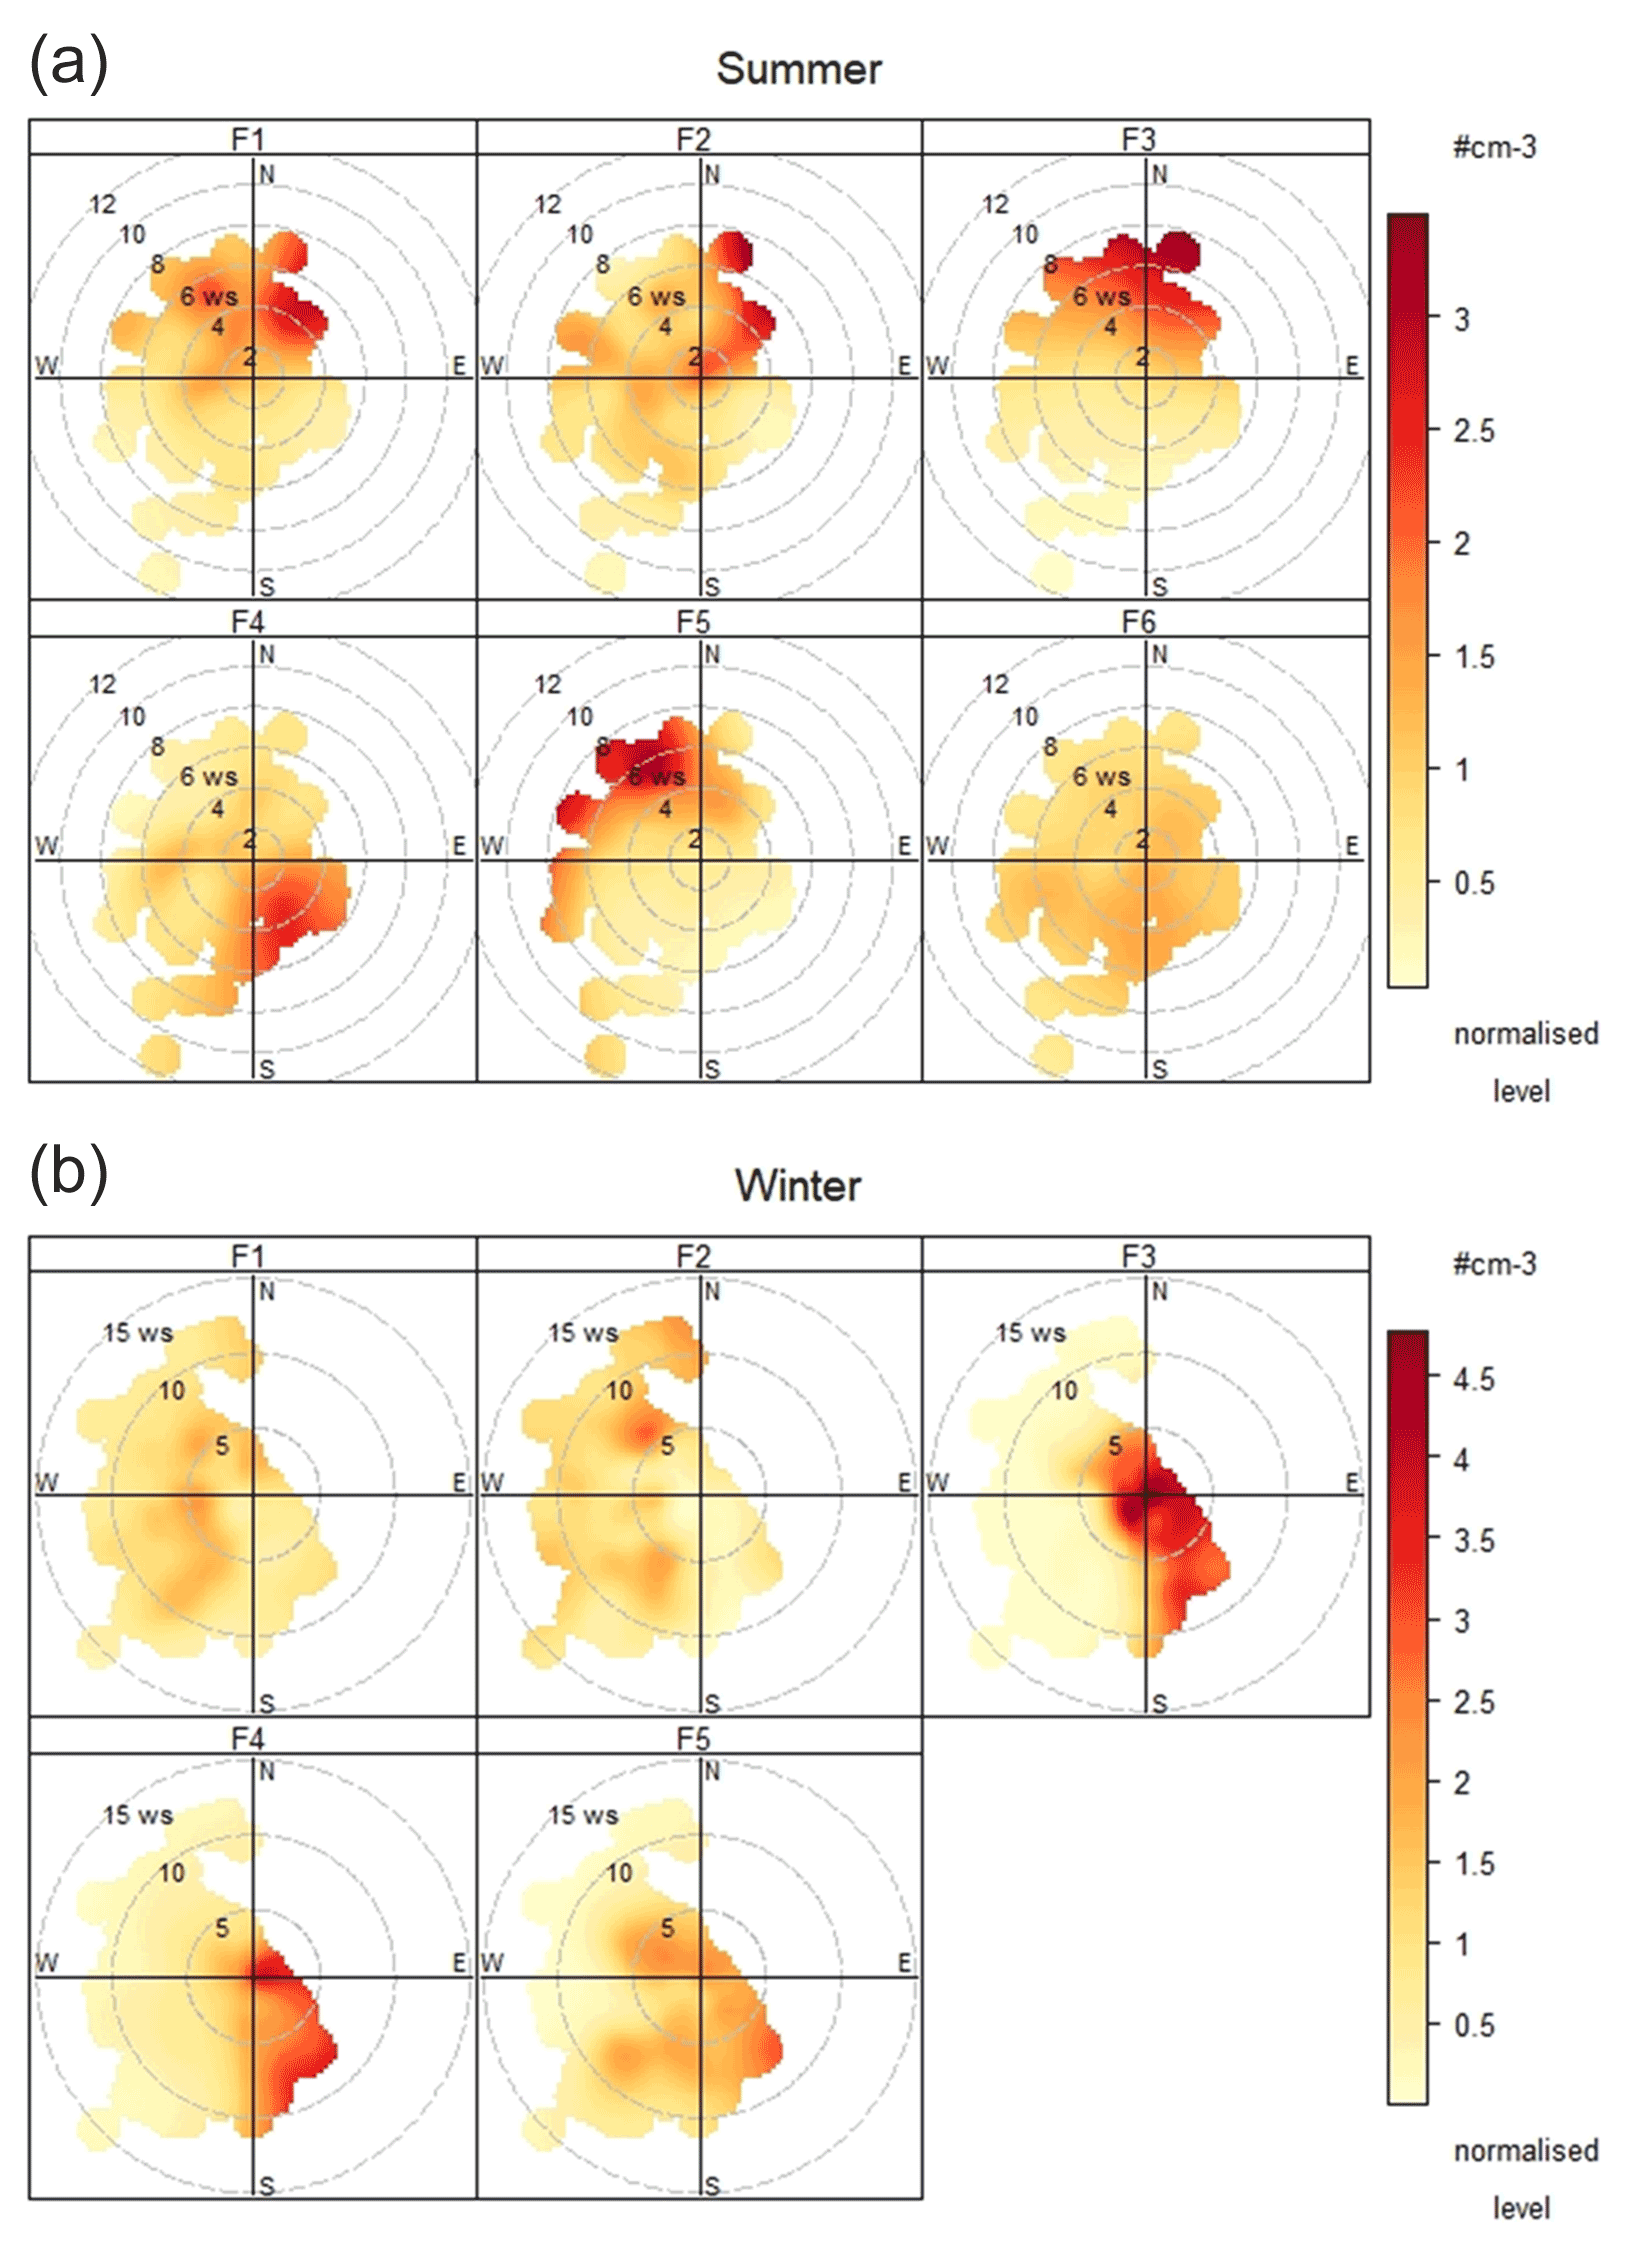
Figure A13Polar plot with factors concentrations (1 h vector-averaged WS and WD) for summer (a) and winter (b).
Table A1Overview table presenting mass (M) and median diameter (d) of NR-PM1 species calculated by fitting log-normal function to the AMS size distributions for the selected episodes in summer (S1–S10) and winter (W1–13) along with meteorology recorded during the episodes (relative humidity – RH, global radiation – GR, temperature – T, wind speed – WS, and wind direction – WD).


Table A3Overview table presenting median diameter (d) of N10–800 calculated by fitting a log-normal function to the MPSS size distributions for the selected episodes (N_W1–N_W8) along with meteorology recorded during the episodes (relative humidity – RH, global radiation – GR, temperature – T, wind speed – WS, and wind direction – WD).
All relevant data for this paper are archived at the ICPF of the CAS (Institute of Chemical Process Fundamentals of the Czech Academy of Sciences) and are available upon request from the corresponding author (Petra Pokorná).
PP, JS, and VŽ conceived the research. PP, RL, PV, SM, AHŠ, and JO conducted the atmospheric aerosol measurements during both intensive campaigns. PP, NZ, RL, PV, VR, and JS analysed and interpreted the data. PP prepared the manuscript with contributions from all co-authors.
The contact author has declared that neither they nor their co-authors have any competing interests.
Publisher’s note: Copernicus Publications remains neutral with regard to jurisdictional claims in published maps and institutional affiliations.
We would like to thank Daniel Vondrák for the graphical editing. We also thank American Journal Experts and Laurence Windell for the English proofreading of the manuscript. The authors gratefully acknowledge the NOAA Air Resources Laboratory (ARL) for the provision of the HYSPLIT transport and dispersion model and/or READY website (http://www.ready.noaa.gov, last access: 10 June 2020) used in this publication. We greatly thank the two anonymous reviewers for their effort to critically review the manuscript and for providing constructive comments.
This work was supported by the GACR under grant P209/19/06110Y and by the MEYS of the Czech Republic under grant ACTRIS-CZ LM2018122 and ACTRIS-CZ RI (CZ.02.1.01/0.0/0.0/16_013/0001315) as well as by COST Action CA16109 COLOSSAL within STSM.
This paper was edited by Rupert Holzinger and reviewed by two anonymous referees.
Allan, J. D., Delia, A. E., Coe, H., Bower, K. N., Alfarra, M. R., Jimenez, J. L., Middlebrook, A. M., Drewnick, F., Onasch, T. B., Canagaratna, M. R., Jayne, J. T., and Worsnop, D. R.: A generalised method for the extraction of chemically resolved mass spectra from Aerodyne aerosol mass spectrometer data, J. Aerosol Sci., 35, 909–922, https://doi.org/10.1016/j.jaerosci.2004.02.007, 2004.
Allan, J. D., Alfarra, M. R., Bower, K. N., Coe, H., Jayne, J. T., Worsnop, D. R., Aalto, P. P., Kulmala, M., Hyötyläinen, T., Cavalli, F., and Laaksonen, A.: Size and composition measurements of background aerosol and new particle growth in a Finnish forest during QUEST 2 using an Aerodyne Aerosol Mass Spectrometer, Atmos. Chem. Phys., 6, 315–327, https://doi.org/10.5194/acp-6-315-2006, 2006.
Beddows, D. C. S., Harrison, R. M., Green, D. C., and Fuller, G. W.: Receptor modelling of both particle composition and size distribution from a background site in London, UK, Atmos. Chem. Phys., 15, 10107–10125, https://doi.org/10.5194/acp-15-10107-2015, 2015.
Belis, C. A., Karagulian, F., Larsen, B. R., and Hopke, P. K.: Critical review and metaanalysis of ambient particulate matter source apportionment using receptor models in Europe, Atmos. Environ., 69, 94–108, https://doi.org/10.1016/j.atmosenv.2012.11.009, 2013.
Bressi, M., Cavalli, F., Putaud, J. P., Fröhlich, R., Petit, J.-E., Aas, W., Äijälä, A., Alastuey, A., Allan, J. D., Aurela, M., Berico, M., Bougiatioti, A., Bukowiecki, N., Canonaco, F., Crenn, V., Dusanter, S., Ehn, M., Elsasser, M., Flentje, H., Graf, P., Green, D. C., Heikkinen, L., Hermann, H., Holzinger, R., Hueglin, C., Keernik, H., Kiendler-Scharr, A., Kubelova, L., Lunder, C., Maasikmets, M., Malaguti, A., Mihalopoulos, N., Nicolas, J. B., O'Dowd, C., Ovadnevaite, J., Petralia, E., Poulain, L., Priestman, M., Riffault, V., Ripoll, A., Schlag, P., Schwarz, J., Sciare, J., Slowik, J., Sosedova, Y., Stavroulasm, I., Teinemaa, E., Via, M., Williams, P. I., Wiedensohler., A., Young, D. E., Zhang, E., Favez, O., Minguillon, M. C., and Prevot, A. S. H.: A European aerosol phenomenology – 7: High-time resolution chemical characteristics of submicron particulate matter across Europe, Atmos. Environ., 10, 100108, https://doi.org/10.1016/j.aeaoa.2021.100108, 2021.
Carslaw, D. C. and Ropkins, K.: Openair – an R package for air quality data analysis, Environ. Modell. Softw., 27–28, 52–61, https://doi.org/10.1016/j.envsoft.2011.09.008, 2012.
Cavalli, F., Viana, M., Yttri, K. E., Genberg, J., and Putaud, J.-P.: Toward a standardised thermal-optical protocol for measuring atmospheric organic and elemental carbon: the EUSAAR protocol, Atmos. Meas. Tech., 3, 79–89, https://doi.org/10.5194/amt-3-79-2010, 2010.
Cavallia, F., Alastue, A., Areskoug, H., Ceburnis, D., Čech, J., Genber, J., Harrison, R. M., Jaffrezo, J. L., Kiss, G., Laj, P., Mihalopoulos, N., Perez, N., Quincey, P., Schwarz, J., Sellegri, K., Spindler, G., Swietlicki, E., Theodosi, C., and Putaud, J. P.: A European aerosol phenomenology – 4: Harmonized concentrations of carbonaceous aerosol at 10 regional background sites across Europe, Atmos. Environ., 144, 133–145, https://doi.org/10.1016/j.atmosenv.2016.07.050, 2016.
Chen, G., Canonaco, F., Tobler, A., Aas, W., Alastuey, A., Allan, J., Atabakhsh, S., Aurela, M., Baltensperger, U., Bougiatioti, A., De Brito, J. F., Ceburnis, D., Chazeau, B., Chebaicheb, H., Daellenbach, K. R., Ehn, M., El Haddad, I., Eleftheriadis, K., Favez, O., Flentje, H., Font, A., Fossum, K., Freney, E., Gini, M., Green, D. C., Heikkinen, L., Herrmann, H., Kalogridis, A.-C., Keernik, H., Lhotka, R., Lin, C., Lunder, C., Maasikmets, M., Manousakas, M.I., Marchand, N., Marin, C., Marmureanu, L., Mihalopoulos, N., Močnik, G., Nȩcki, J., O'Dowd, C., Ovadnevaite, J., Peter, T., Petit, J.E., Pikridas, M., Platt, S. M., Pokorná, P., Poulain, L., Priestman, M., Riffault, V., Rinaldi, M., Różański, K.., Schwarz, J., Sciare, J., Simon, L., Skiba, A., Slowik, J. G., Sosedova, Y., Stavroulas, I., Styszko, K., Teinemaa, E., Timonen, H., Tremper, A., Vasilescu, J., Via, M., Vodička, P., Wiedensohler, A., Zografou, O., Minguillón, M. C., and Prévôt, A. S. H.: European Aerosol Phenomenology – 8: Harmonised Source Apportionment of Organic Aerosol using 22 Yearlong ACSM/AMS Datasets, https://arxiv.org/abs/2201.00579# (last access: 28 April 2022), 2021.
Costabile, F., Birmili, W., Klose, S., Tuch, T., Wehner, B., Wiedensohler, A., Franck, U., König, K., and Sonntag, A.: Spatio-temporal variability and principal components of the particle number size distribution in an urban atmosphere, Atmos. Chem. Phys., 9, 3163–3195, https://doi.org/10.5194/acp-9-3163-2009, 2009.
CHMI: Tabular Survey 2019, Czech Hydrometeorological Institute (CHMI), http://portal.chmi.cz/files/portal/docs/uoco/isko/tab_roc/2019_enh/index_GB.html (last access: 4 June 2021), 2019a.
CHMI: Annual report 2019, Czech Hydrometeorological Institute (CHMI), https://www.chmi.cz/files/portal/docs/uoco/isko/grafroc/19groc/gr19cz/19_rocenka_UKO_web_tisk_up1.pdf (last access: 4 June 2021), 2019b.
Cubison, M. J., Ortega, A. M., Hayes, P. L., Farmer, D. K., Day, D., Lechner, M. J., Brune, W. H., Apel, E., Diskin, G. S., Fisher, J. A., Fuelberg, H. E., Hecobian, A., Knapp, D. J., Mikoviny, T., Riemer, D., Sachse, G. W., Sessions, W., Weber, R. J., Weinheimer, A. J., Wisthaler, A., and Jimenez, J. L.: Effects of aging on organic aerosol from open biomass burning smoke in aircraft and laboratory studies, Atmos. Chem. Phys., 11, 12049–12064, https://doi.org/10.5194/acp-11-12049-2011, 2011.
Crippa, M., DeCarlo, P. F., Slowik, J. G., Mohr, C., Heringa, M. F., Chirico, R., Poulain, L., Freutel, F., Sciare, J., Cozic, J., Di Marco, C. F., Elsasser, M., Nicolas, J. B., Marchand, N., Abidi, E., Wiedensohler, A., Drewnick, F., Schneider, J., Borrmann, S., Nemitz, E., Zimmermann, R., Jaffrezo, J.-L., Prévôt, A. S. H., and Baltensperger, U.: Wintertime aerosol chemical composition and source apportionment of the organic fraction in the metropolitan area of Paris, Atmos. Chem. Phys., 13, 961–981, https://doi.org/10.5194/acp-13-961-2013, 2013.
Dall'Osto, M., Harrison, R. M., Coe, H., Williams, P. I., and Allan, J. D.: Real time chemical characterization of local and regional nitrate aerosols, Atmos. Chem. Phys., 9, 3709–3720, https://doi.org/10.5194/acp-9-3709-2009, 2009.
DeCarlo, P. F., Slowik, J. G., Worsnop, D. R., Davidovits, P., and Jimenez, J. L.: Particle Morphology and Density Characterization by Combined Mobility and Aerodynamic Diameter Measurements. Part 1: Theory, Aerosol Sci. Tech., 38, 1185–1205, https://doi.org/10.1080/027868290903907, 2004.
Drewnick, F., Jayne, J. T., Canargaratna, M., Worsnop, D. R., and Demerjian, K. L.: Measurement of ambient aerosol composition during the PMTACS-NY 2001 Using and Aersosol Mass Spectrometer. Part II: Chemically speciated mass distribution, Aerosol Sci. Tech., 38, 104–117, https://doi.org/10.1080/02786820390229534, 2004.
Drewnick, F., Hings, S. S., DeCarlo, P., Jayne, J. T., Gonin, M., Fuhrer, K., Weimer, S., JImenez, J. L., Demerjian, K. L., Borrmann, S., and Worsnop, R.: A new Time-of-Flight Aerosol Mass Spectrometer (TOF-AMS) – Instrument description and first field deployment, Aerosol Sci. Tech., 39, 637–658, https://doi.org/10.1080/02786820500182040, 2005.
EEA: Air Quality in Europe – 2019 Report, European Environment Agency Report No. 10/2019, https://www.eea.europa.eu/publications/air-quality-in-europe-2019 (last access: 4 June 2021), 2019.
Favez, O., Weber, S., Petit, J-E., Alleman, L. Y., Albinet, A., Riffault, V., Chazeau, B., Amodeo, T., Salameh, D., Zhang, Y., Srivastava, S. et al.: Overview of the French Operational Network for In Situ Observation of PM Chemical Composition and Sources in Urban Environments (CARA Program), Atmosphere, 12, 207, https://doi.org/10.3390/atmos12020207, 2021.
Freney, E. J., Sellegri, K., Canonaco, F., Boulon, J., Hervo, M., Weigel, R., Pichon, J. M., Colomb, A., Prévôt, A. S. H., and Laj, P.: Seasonal variations in aerosol particle composition at the puy-de-Dôme research station in France, Atmos. Chem. Phys., 11, 13047–13059, https://doi.org/10.5194/acp-11-13047-2011, 2011.
Freney, E. J., Sellegri, K., Canonaco, F., Colomb, A., Borbon, A., Michoud, V., Doussin, J.-F., Crumeyrolle, S., Amarouche, N., Pichon, J.-M., Bourianne, T., Gomes, L., Prevot, A. S. H., Beekmann, M., and Schwarzenböeck, A.: Characterizing the impact of urban emissions on regional aerosol particles: airborne measurements during the MEGAPOLI experiment, Atmos. Chem. Phys., 14, 1397–1412, https://doi.org/10.5194/acp-14-1397-2014, 2014.
Freutel, F., Schneider, J., Drewnick, F., von der Weiden-Reinmüller, S.-L., Crippa, M., Prévôt, A. S. H., Baltensperger, U., Poulain, L., Wiedensohler, A., Sciare, J., Sarda-Estève, R., Burkhart, J. F., Eckhardt, S., Stohl, A., Gros, V., Colomb, A., Michoud, V., Doussin, J. F., Borbon, A., Haeffelin, M., Morille, Y., Beekmann, M., and Borrmann, S.: Aerosol particle measurements at three stationary sites in the megacity of Paris during summer 2009: meteorology and air mass origin dominate aerosol particle composition and size distribution, Atmos. Chem. Phys., 13, 933–959, https://doi.org/10.5194/acp-13-933-2013, 2013.
Hersey, S. P., Craven, J. S., Schilling, K. A., Metcalf, A. R., Sorooshian, A., Chan, M. N., Flagan, R. C., and Seinfeld, J. H.: The Pasadena Aerosol Characterization Observatory (PACO): chemical and physical analysis of the Western Los Angeles basin aerosol, Atmos. Chem. Phys., 11, 7417–7443, https://doi.org/10.5194/acp-11-7417-2011, 2011.
Hinds, W. C.: Aerosol Technology, 2nd ed., John Wiley & Sons, New York, ISBN 978-0-471-19410-1, 1999.
Holubová Šmejkalová, A., Zíková, N., Ždímal, V., Plachá, H., and Bitter, M.: Atmospheric aerosol growth rates at different background station types, Environ. Sci. Poll. Res., 28, 13352–13364, https://doi.org/10.1007/s11356-020-11424-5, 2021.
Hock, N., Schneider, J., Borrmann, S., Römpp, A., Moortgat, G., Franze, T., Schauer, C., Pöschl, U., Plass-Dülmer, C., and Berresheim, H.: Rural continental aerosol properties and processes observed during the Hohenpeissenberg Aerosol Characterization Experiment (HAZE2002), Atmos. Chem. Phys., 8, 603–623, https://doi.org/10.5194/acp-8-603-2008, 2008.
Jayne, J. T., Leard, D. C., Zhang, X., Davidovits, P., Smith, K. A., Kolb, C. E., and Worsnop, D. R.: Development of an Aerosol Mass Spectrometer for Size and Composition Analysis of Submicron Particles, Aerosol Sci. Tech., 33, 49–70, https://doi.org/10.1080/027868200410840, 2000.
Jimenez, J. L., Jayne, J. T., Shi, Q., Kolb, C. E., Worsnop, D. R., Yourshaw, I., Seinfeld, J. H., Flagan, R. C., Zhang, X., Smith, K. A., Morris, J., and Davidovits, P.: Ambient aerosol sampling using the Aerodyne Aerosol Mass Spectrometer, J. Geophys. Res., 108, 8425, https://doi.org/10.1029/2001JD001213, 2003a.
Jimenez, J. L., Bahreini, R., Cocker III, D. R., Zhuang, H., Varutbangkul, V., Flagan, R. C., Seinfeld, J. H., O'Dowd, C. D., and Hoffman, T.: New Particle Formation from Photooxidation of Diiodomethane (CH2I2), J. Geophys. Res.-Atmos., 108, 4318, https://doi.org/10.1029/2002JD002452, 2003b.
Jimenez. J. L., Bahreini, R., Cocker III, D. R., Zhuang, H., Varutbangkul, V., Flagan, R. C., Seinfeld, J. H., O'Dowd, C. D., and Hoffman, T.: Correction to “New Particle Formation from Photooxidation of Diiodomethane (CH2I2)”, J. Geophys. Res.-Atmos., 108, 4733, https://doi.org/10.1029/2003JD004249, 2003c.
Jimenez, J. L., Canagaratna, M. R., Donahue, N. M., Prevot, A. S. H., Zhang, Q., Kroll, J. H., DeCarlo, P. F., Allan, J. D., Coe, H., Ng, N. L., Aiken, A. C., Docherty, K. D., Ulbrich, I. M., Grieshop, A. P., Robinson, A. L., Duplissy, J., Smith, J. D., Wilson, K. R., Lanz, V. A., Hueglin, C., Sun, Y. L., Tian, J., Laaksonen, A., Raatikainen, T., Rautiainen, J., Vaattovaara, P., Ehn, M., Kulmala, M., Tomlinson, J. M., Collins, D. R., Cubison, M. J., Dunlea, E. J., Hauffman, J. A., Onasch, T. B., Alfarra, M. R., Williams, P. I., Bower, K., Kondo, Y., Scheider, J., Drewnick, F., Borrmann, S., Wimer, S., Demerjian, K., Salcedo, D., Cottrell, L., Griffin, R., Takami, A., MiYoshi, T., Hatakeyama, S., Shimono, A., Sun, J. Y., Zhang, Y. M., Dzepina, K., Kimmel, J. R., Sueper, D., Jayne, J. T., Herndon, S. C., Trimborn, A. M., Williams, L. R., Wood, E. C., Middlebrook, A. M., Kolb, C. E., Baltensperger, U., and Worsnop, D. R.: Evolution of Organic Aerosols in the Atmosphere, Science, 326, 1525–1529, https://doi.org/10.1126/science.1180353, 2009.
Kozáková, J., Pokorná, P., Vodička, P., Ondráčková, L., Ondráček, J., Křůmal, K., Mikuška, P., Hovorka, J., Moravec, P., and Schwarz, J.: Influence of regional air pollution transport at a European air pollution hotspot, Environ Sci. Pollut. R., 26, 1675–1692, https://doi.org/10.1007/s11356-018-3670-y, 2019.
Kubelová, L., Vodička, P., Schwarz, J., Cusack, M., Makeš, O., Ondráček, J., and Ždímal, V.: A study of summer and winter high time-resolved submicron aerosol composition measured at a suburban site in Prague, Atmos. Environ., 118, 45–57, https://doi.org/10.1016/j.atmosenv.2015.07.030, 2015.
Křůmal, K. and Mikuška, P.: Mass concentrations and lung cancer risk assessment of PAHs bound to PM1 aerosol in six industrial, urban and rural areas in the Czech Republic, Central Europe, Atmos. Pollut. Res., 11, 401–408, https://doi.org/10.1016/j.apr.2019.11.012, 2020.
Leoni, C., Pokorná, P., Hovorka, J., Masiol, M., Topinka, J., Zhao, Y., Křůmal, K., Cliff, S., Mikuška, P., and Hopke, P. K.: Source apportionment of aerosol particles at a European air pollution hot spot using particle number size distributions and chemical composition, Environ. Pollut., 234, 145–154, https://doi.org/10.1016/j.envpol.2017.10.097, 2018.
Lide, D. R.: CRC Handbook of Chemistry and Physics, CRC Press Inc, USA, ISBN 978-0-849-30472-9, 1991.
Masiol, M., Vu, T. V., Beddows D. C. S., and Harrison, R. M.: Source apportionment of wide range particle size spectra and black carbon collected at the airport of Venice (Italy), Atmos. Environ., 139, 56–74, 2016.
Mbengue, S., Fusek, M., Schwarz, J., Vodička, P., Holubová Šmejkalová, A., and Holoubek, I.: Four years of highly time resolved measurements of elemental and organic carbon at a rural background site in Central Europe, Atmos. Environ., 182, 335–346, https://doi.org/10.1016/j.atmosenv.2018.03.056, 2018.
Mbengue, S., Serfozo, N., Schwarz, J., Ziková, N., Holubová Šmejkalová, A., and Holoubek, I.: Characterization of Equivalent Black Carbon at a regional background site in Central Europe: Variability and source apportionment, Environ. Pollut., 260, 113771, https://doi.org/10.1016/j.envpol.2019.113771, 2020.
Middlebrook, A. M., Bahreini, R., Jimenez, J. L., and Canagaratna, M. R.: Evaluation of Composition-Dependent Collection Efficiencies for the Aerodyne Aerosol Mass Spectrometer using Field Data, Aerosol Sci. Techn., 46, 258–271, https://doi.org/10.1080/02786826.2011.620041, 2012.
Milic, A., Mallet, M. D., Cravigan, L. T., Alroe, J., Ristovski, Z. D., Selleck, P., Lawson, S. J., Ward, J., Desservettaz, M. J., Paton-Walsh, C., Williams, L. R., Keywood, M. D., and Miljevic, B.: Biomass burning and biogenic aerosols in northern Australia during the SAFIRED campaign, Atmos. Chem. Phys., 17, 3945–3961, https://doi.org/10.5194/acp-17-3945-2017, 2017.
Moffet, R. C., Qin, X. Y., Rebotier, T., Furutani, H., and Prather, K. A.: Chemically segregated optical and microphysical properties of ambient aerosols measured in a single-particle mass spectrometer, J. Geophys. Res.-Atmos., 113, D12213, https://doi.org/10.1029/2007JD009393, 2008.
Ng, N. L., Canagaratna, M. R., Zhang, Q., Jimenez, J. L., Tian, J., Ulbrich, I. M., Kroll, J. H., Docherty, K. S., Chhabra, P. S., Bahreini, R., Murphy, S. M., Seinfeld, J. H., Hildebrandt, L., Donahue, N. M., DeCarlo, P. F., Lanz, V. A., Prévôt, A. S. H., Dinar, E., Rudich, Y., and Worsnop, D. R.: Organic aerosol components observed in Northern Hemispheric datasets from Aerosol Mass Spectrometry, Atmos. Chem. Phys., 10, 4625–4641, https://doi.org/10.5194/acp-10-4625-2010, 2010.
Park, K., Kittelson, D. B., Zachariah, M. R., and McMurry, P. H.: Measurement of Inherent Material Density of Nanoparticle Agglomerates, J. Nanopart. Res., 6, 267–272, https://doi.org/10.1080/02786820903401427, 2004.
Petit, J.-E., Amodeo, T., Meleux, F., Bessagnet, B., Menut, L., Grenier, D., Pellan, Y., Ockler, A., Rocq, B., Gros, V., Sciare, J., and Favez, O.: Characterising an intense PM pollution episode in March 2015 in France from multi-site approach and near real time data, Atmos. Environ., 155, 68–84, https://doi.org/10.1016/j.atmosenv.2017.02.012, 2017.
Petit, J.-E., Pallarès, C., Favez, O., Alleman, L. Y., Bonnaire, N., and Rivière, E.: Sources and Geographical Origins of PM10 in Metz (France) Using Oxalate as a Marker of Secondary Organic Aerosols by Positive Matrix Factorization Analysis, Atmosphere, 10, 370, https://doi.org/10.3390/atmos10070370, 2019.
Pokorná, P., Schwarz, J., Krejci, R., Swietlicki, E., Havránek, V., and Ždímal, V.: Comparison of PM2.5 chemical composition and sources at a rural background site in Central Europe between the years 1993/1994/1995 and 2009/2010: Effect of legislative regulations and economic transformation on the air quality, Environ. Pollut., 241, 841–851, https://doi.org/10.1016/j.envpol.2018.06.015, 2018.
Pokorná, P., Leoni, C., Schwarz, J., Ondráček, J., Ondráčková, L., Vodička, P., Zíková, N., Moravec, P., Bendl, J., Klán, M., Hovorka, J., Zhao, Y., Cliff, S. S., Ždímal, V., and Hopke, P. K.: Spatial-temporal variability of aerosol sources based on chemical composition and particle number size distributions in an urban settlement influenced by metallurgical industry, Environ. Sci. Pollut. R., 27, 38631–38643, 2020.
Poulain, L., Spindler, G., Birmili, W., Plass-Dülmer, C., Wiedensohler, A., and Herrmann, H.: Seasonal and diurnal variations of particulate nitrate and organic matter at the IfT research station Melpitz, Atmos. Chem. Phys., 11, 12579–12599, https://doi.org/10.5194/acp-11-12579-2011, 2011.
Poulain, L., Spindler, G., Grüner, A., Tuch, T., Stieger, B., van Pinxteren, D., Petit, J.-E., Favez, O., Herrmann, H., and Wiedensohler, A.: Multi-year ACSM measurements at the central European research station Melpitz (Germany) – Part 1: Instrument robustness, quality assurance, and impact of upper size cutoff diameter, Atmos. Meas. Tech., 13, 4973–4994, https://doi.org/10.5194/amt-13-4973-2020, 2020.
Putaud, J. P., Raes, F., Van Dingenen, R., Brüggemann, E., Facchini, M., Decesari, S., Fuzzi, S., Gehrig, R., Hüglin, C., Laj, P., Lorbeer, G., Maenhaut, W., Mihalopoulos, N., Müller, K., Querol, X., Rodriguez, S., Schneider, J., Spindler, G., ten Brink, H., Tørseth, K., and Wiedensohler, A.: A European aerosol phenomenology – 2: chemical characteristics of particulate matter at kerbside, urban, rural and background sites in Europe, Atmos. Environ., 38, 2579–2595, https://doi.org/10.1016/j.atmosenv.2004.01.041, 2004.
Putaud, J. P., Van Dingenen, R., Alastuey, A., Bauer, H., Birmili, W., Cyrys, J., Flentje, H., Fuzzi, S., Gehrig, R., Hansson, H. C., Harrison, R. M., Herrmann, H., Hitzenberger, R., Hüglin, C., Jones, A .M., Kasper-Giebl, A., Kiss, G., Kousa, A., Kuhlbusch, T. A. J., Löschau, G., Maenhaut, W., Molnar, A., Moreno, T., Pekkanen, J., Perrino, C., Pitz, M., Puxbaum, H., Querol, X., Rodriguez, S., Salma, I., Schwarz, J., Smolik, J., Schneider, J., Spindler, G., ten Brink, H., Tursic, J., Viana, M., Wiedensohler, A., and Raes, F.: A European aerosol phenomenology – 3: physical and chemical characteristics of particulate matter from 60 rural, urban, and kerbside sites across Europe, Atmos. Environ. 44, 1308–1320, https://doi.org/10.1016/j.atmosenv.2009.12.011, 2010.
Qiao, K., Wu, Z., Pei, X., Liu, Q., Shang, D., Zheng, J., Du, Z., Zhu, W., Wu, Y., Lou, S., Guo, S., Chan, C. K., Kant Pathak, R., Hallquist, M., and Hu, M.: Size-resolved effective density of submicron particles during summertime in the rural atmosphere of Beijing, China, J. Environ. Sci., 73, 69–77, https://doi.org/10.1016/j.jes.2018.01.012, 2018.
Querol, X., Alastuey, A., Puicercus, J. A., Mantilla, E., Ruiz, C. R., Lopez-Soler, A., Plana, F., and Juan, R.: Seasonal evolution of suspended particles around a large coal-fired power station: chemical characterization, Atmos. Environ., 32, 719–731, https://doi.org/10.1016/S1352-2310(97)00340-3, 1998.
R Core Team: R: A Language and Environment for Statistical Computing, https://cran.microsoft.com/snapshot/2014-09-08/web/packages/dplR/vignettes/xdate-dplR.pdf (last access: 10 June 2020), 2019.
Rissler, J., Nordin, E. Z., Eriksson, A. C., Nilsson, P. T., Frosch, M., Sporre, M. K., Wierzbicka, A., Svenningsson, B., Löndahl, J., Messing, M. E., Sjogren, S., Hemmingsen, J. G., Loft, S., Pagels, J. H., and Swietlicki, E.: Effective Density and Mixing State of Aerosol Particles in a Near-Traffic Urban Environment, Environ. Sci. Technol., 48, 6300–6308, https://doi.org/10.1021/es5000353, 2014.
Rolph, G., Stein, A., and Stunder, B.: Real-time environmental applications and display sYstem: READY, Environ. Modell. Softw., 95, 210–228, https://doi.org/10.1016/j.envsoft.2017.06.025, 2017.
Salcedo, D., Onasch, T. B., Dzepina, K., Canagaratna, M. R., Zhang, Q., Huffman, J. A., DeCarlo, P. F., Jayne, J. T., Mortimer, P., Worsnop, D. R., Kolb, C. E., Johnson, K. S., Zuberi, B., Marr, L. C., Volkamer, R., Molina, L. T., Molina, M. J., Cardenas, B., Bernabé, R. M., Márquez, C., Gaffney, J. S., Marley, N. A., Laskin, A., Shutthanandan, V., Xie, Y., Brune, W., Lesher, R., Shirley, T., and Jimenez, J. L.: Characterization of ambient aerosols in Mexico City during the MCMA-2003 campaign with Aerosol Mass Spectrometry: results from the CENICA Supersite, Atmos. Chem. Phys., 6, 925–946, https://doi.org/10.5194/acp-6-925-2006, 2006.
Salimi, F., Crilley, L. R., Stevanovic, S., Ristovski, Z., Mazaheri, M., He, C., Johnson, G., Ayoko, G., and Morawska, L.: Insights into the growth of newly formed particles in a subtropical urban environment, Atmos. Chem. Phys., 15, 13475–13485, https://doi.org/10.5194/acp-15-13475-2015, 2015.
Schwarz, J., Chi, X., Maenhaut, W., Civis, M., Hovorka, J., and Smolík, J.: Elemental and organic carbon in atmospheric aerosols at downtown and suburban sites in Prague, Atmos. Res., 90, 287–302, https://doi.org/10.1016/j.atmosres.2008.05.006, 2008.
Schwarz, J., Štefancová, L., Maenhaut, W., Smolík, J., and Ždímal, V.: Mass and chemically speciated size distribution of Prague aerosol using an aerosol dryer – The influence of air mass origin, Sci. Total Environ., 437, 348–362, https://doi.org/10.1016/j.scitotenv.2012.07.050, 2012.
Schwarz, J., Cusack, M., Karban, J., Chalupníčková, E., Havránek, V., Smolk., J., and Ždímal., V.: PM2.5 chemical composition at a rural background site in Central Europe, including correlation and air mass back trajectory analysis, Atmos. Res., 176–177, 108–20, https://doi.org/10.1016/j.atmosres.2016.02.017, 2016.
Seinfeld, J. H. and Pandis, S. N.: Atmospheric Chemistry and Physics, John Wiley & Sons, New York, ISBN 978-1-118-94740-1, 2006.
Slowik, J. G., Stainken, K., Davidovits, P., Williams, L. R., Jayne, J. T., Kolb, C. E., Worsnop, D. R., Rudich, Y., DeCarlo, P. F., and Jimenez, J. L.: Particle Morphology and Density Characterization by Combined Mobility and Aerodynamic Diameter Measurements. Part 2: Application to Combustion-Generated Soot Aerosols as a Function of Fuel Equivalence Ratio, Aerosol Sci. Tech., 38, 1206–1222, https://doi.org/10.1080/027868290903916, 2004.
Sowlat, M. H., Hasheminassab, S., and Sioutas, C.: Source apportionment of ambient particle number concentrations in central Los Angeles using positive matrix factorization (PMF), Atmos. Chem. Phys., 16, 4849–4866, https://doi.org/10.5194/acp-16-4849-2016, 2016.
Takegawa, N., Miyazaki, Y., Kondo, Y., Komazaki, Y., Miyakawa, T., Jimenez, J. L., Jayne, J. T., Worsnop, D. R., Allan, J. D., and Weber, R. J.: Characterization of an Aerodyne Aerosol Mass Spectrometer (AMS): Intercomparison with Other Aerosol Instruments, Aerosol Sci. Tech., 39, 760–770, https://doi.org/10.1080/02786820500243404, 2005.
Tørseth, K., Aas, W., Breivik, K., Fjæraa, A. M., Fiebig, M., Hjellbrekke, A. G., Lund Myhre, C., Solberg, S., and Yttri, K. E.: Introduction to the European Monitoring and Evaluation Programme (EMEP) and observed atmospheric composition change during 1972–2009, Atmos. Chem. Phys., 12, 5447–5481, https://doi.org/10.5194/acp-12-5447-2012, 2012.
Turpin, B. J. and Lim, H.-J.: Species contributions to PM2.5 mass concentrations: revisiting common assumptions for estimating organic mass, Aerosol Sci. Tech., 35, 302–610, https://doi.org/10.1080/02786820119445, 2001.
Vodička, P., Kawamura, K., Schwarz, J., Kunwar, B., and Ždímal, V.: Seasonal study of stable carbon and nitrogen isotopic composition in fine aerosols at a Central European rural background station, Atmos. Chem. Phys., 19, 3463–3479, https://doi.org/10.5194/acp-19-3463-2019, 2019.
Vu, T. V., Delgado-Saborit, J. M., and Harrison, R. M.: Review: particle number size distributions from seven major sources and implications for source apportionment studies, Atmos. Environ., 122, 114–132, https://doi.org/10.1016/j.atmosenv.2015.09.027, 2015.
Waked, A., Favez, O., Alleman, L. Y., Piot, C., Petit, J.-E., Delaunay, T., Verlinden, E., Golly, B., Besombes, J.-L., Jaffrezo, J.-L., and Leoz-Garziandia, E.: Source apportionment of PM10 in a north-western Europe regional urban background site (Lens, France) using positive matrix factorization and including primary biogenic emissions, Atmos. Chem. Phys., 14, 3325–3346, https://doi.org/10.5194/acp-14-3325-2014, 2014.
Wickham, H.: ggplot2: Elegant Graphics for Data Analysis, Springer-Verlag, New York, ISBN 978-3-319-24277-4, 2016.
Wiedensohler, A., Wiesner, A., Weinhold, K., Birmili, W., Hermann, H., Merkel, M., Müller, T., Pfeifer, S., Schmidt, A., Tuch, T., Velarde, F., Quincey, P., Seeger, S., and Nowak, A.: Mobility particle size spectrometers: Calibration procedures and measurement uncertainties, Aerosol Sci. Tech., 52, 146–164, https://doi.org/10.1080/02786826.2017.1387229, 2017.
Zelenyuk, A., Cai, Y., and Imre, D.: From Agglomerates of Spheres to Irregularly Shaped Particles: Determination of Dynamic Shape Factors from Measurements of Mobility and Vacuum Aerodynamic Diameters, Aerosol Sci. Tech., 40, 197–217, https://doi.org/10.1080/02786820500529406, 2006.
Zíková, N. and Ždímal, V.: Long-Term Measurement of Aerosol Number Size Distributions at Rural Background Station Košetice, Aerosol Air Qual. Res., 13, 1464–1474, https://doi.org/10.4209/aaqr.2013.02.0056, 2013.
Zíková, N. and Ždímal, V.: Precipitation scavenging of aerosol particles at a rural site in the Czech Republic, Tellus B, 68, 27343, https://doi.org/10.3402/tellusb.v68.27343, 2016.
Zíková, N., Pokorná, P., Makeš, O., Sedlák, P., Pešice, P., and Ždímal, V.: Activation of atmospheric aerosol in fog and low clouds, Atmos. Environ., 230, 117490, 1–11, 2020.